
Submitted:
11 September 2023
Posted:
13 September 2023
You are already at the latest version
Abstract
Zirconium dioxide (ZrO2) possesses numerous advantages such as high mechanical strength, low friction coefficient, excellent optical properties, and extended lifespan. Consequently, ZrO2 has a broad research foundation and practical significance in functional films and wear-resistant coatings. However, it suffers from brittleness and low ductility when used as a bio-coating material. In this study, a Ta/ZrO2 film was fabricated on Si (100) and titanium alloy substrates using a magnetron sputtering system, with tantalum (Ta) serving solely as a transition layer. Subsequently, Zr and Nb ions were implanted into the film at varying doses but with consistent energy levels. The analysis focused on the film's microstructure, mechanical properties, hydrophilicity, and corrosion resistance. The results demonstrated a significant improvement in the hydrophilicity and corrosion resistance of the ZrO2 film following the implantation of Zr and Nb ions. First-principles calculations based on density functional theory (DFT) principles indicated that, with increasing doping concentrations of Zr and Nb in the ZrO2 model, the stability of the model increased gradually, thereby enhancing its corrosion resistance.
Keywords:
Ta/ZrO2 bilayer film
; Ion implantation
; First-principles calculations
; Structural stability
1. Introduction
Zirconium dioxide (ZrO2) films are widely employed in biomedical coatings due to their excellent corrosion resistance and mechanical properties [1]. To extend the lifespan of implant materials, there is a heightened demand for enhanced corrosion resistance of these ZrO2 coatings [2,3,4,5,6,7]. Current research on ZrO2 primarily focuses on the influence of deposition parameters on the film’s structure, morphology, and some characteristics. However, there is relatively limited research on the doping of metal particles into ZrO2 films, which can significantly impact their structure and relevant properties [8,9,10,11]. Therefore, this study explores the doping of other metal ions into the ZrO2 lattice to produce ZrO2 films with superior corrosion resistance and thermal stability. Zirconium (Zr) and niobium (Nb) inherently possess good corrosion resistance [12,13], and their injection onto the surface enhances their corrosion resistance by allowing them to exhibit their typical chemical properties [14,15,16]. Furthermore, Nb ion implantation forms compounds on the surface, which may contribute to improved corrosion resistance. These coatings hold promise as corrosion-resistant materials [17,18,19]. For instance, Zr and oxygen ion implantation on magnesium alloys resulted in ZrO2-containing films, reducing the corrosion rate of the treated substrates as indicated by electrochemical and weight loss tests [20].
In this research, we prepared Ta/ZrO2 films with varying Zr and Nb ion implantation doses on biocompatible titanium alloy and silicon substrates using magnetron sputtering and plasma immersion ion implantation systems. We investigated the interrelationships between composition and microstructural properties and discussed the impact of Zr/Nb ion implantation doses on the film’s phase structure, contact angle, mechanical properties, and corrosion resistance. ZrO2 films prepared at different ion implantation doses exhibited improved mechanical properties, corrosion resistance, and smaller contact angles. First-principles calculations were employed to explain the mechanisms behind structure stabilization and corrosion enhancement resulting from ion implantation.
2. Materials and Methods
2.1. Preparation of Zr/Nb-ZrO2 Films
On silicon (100) and titanium alloy (Ti-6Al-4V) substrates, Ta/ZrO2 films were deposited using a magnetron sputtering system (FJL560CI2, Shenyang Scientific Instrument Co., Ltd., Chinese Academy of Sciences). Subsequently, Zr and Nb ions were implanted into the near-surface region of the Ta/ZrO2 films using a plasma immersion ion implantation and deposition system (PIII & D-700, China), as shown in Figure 1.
For samples based on silicon substrates, they were employed to evaluate the crystal’s microstructure and mechanical properties. Samples based on titanium alloy substrates were used to assess corrosion resistance and hydrophilicity. The Ta and ZrO2 target materials were controlled by two radio frequency (RF) cathode power supplies, both with a purity of 99.99%. The system was evacuated until the pressure was less than 4.5 × 10⁻⁴ Pa. Then, at a pressure of 5 Pa, high-purity (99.99%) argon gas was introduced into the vacuum chamber. Under conditions of a constant bias voltage of 40V, an RF power of 80W, and an operating pressure of 0.5 Pa, the sample holder was rotated sequentially onto the Ta and ZrO2 targets to control the film thickness by varying the sputtering time. The resulting film thickness was approximately 500 nm.
In the plasma immersion ion implantation and deposition system (PIII & D-700, China), a mixed target of zirconium (97.5%) and niobium (2.5%) was employed as the sources for zirconium and niobium ions. When the vacuum chamber pressure reached 7.5 × 10⁻⁴ Pa, high-purity argon gas (99.999% purity) was introduced to achieve a working pressure of 5 × 10⁻³ Pa. The experimental parameters are shown in Table 1.
2.2. Surface Morphology and Structural Composition
The surface morphology of the samples was observed using scanning electron microscopy (SEM, SU-8010, Hitachi, Japan). The samples were analyzed using an X-ray diffractometer (XRD, D8 Advance, Bruker, Germany) to determine phase composition and crystal orientation. Scanning was performed using Cu-Kα radiation with a wavelength of 1.54Å, in the range of 20-80°, with step and dwell times of 0.02s and 7.76s, respectively. Atomic force microscopy (AFM, Multimode 8, Bruker, Germany) was employed to measure the surface roughness of the tested samples. The composition of the samples was determined using X-ray photoelectron spectroscopy (XPS, PHI5000, Versaprobe, Japan) with an Al-Kα source.
2.3. Mechanical Properties
The hardness and elastic modulus of the films were analyzed using an XP nanoindenter (STEP 6, Anton Paar, Austria), with the maximum indentation depth maintained at 15% of the coating thickness. Each sample underwent three repeated experiments.
2.4. Surface Morphology and Structural Composition
The water contact angles of all samples were measured using a static contact angle measurement instrument (CAMKSV021733, NUNC). A 1 µL deionized water droplet was placed on different areas of the sample surface, and 10 measurements were conducted for each sample. The average of these 10 measurements was taken as the experimental result, and the contact angle values and water droplet images were obtained.
2.5. Surface Morphology and Structural Composition
The corrosion resistance of all samples was measured in a phosphate-buffered saline solution (PBS, pH 7.4, HyClone) environment using an electrochemical workstation (CHI604E A17961, Shanghai Chenhua Instrument Co., Ltd.). The samples served as the working electrode, platinum was used as the counter electrode, and a saturated calomel electrode was employed as the reference electrode. The test voltage ranged from -1.0 to 0.5 V, with a scanning rate of 0.01 mV/s.
2.6. First Principle Calculation
The CASTEP module within the Density Functional Theory (DFT) framework was employed for theoretical calculations, and the stability and mechanical properties of the ZrO2 system and the ZrO2 system doped with Zr/Nb were estimated. To ensure the accuracy of the simulations in this study, ultra-soft pseudopotentials and the Generalized Gradient Approximation with Perdew-Burke-Ernzerhof (GGA-PBE) exchange-correlation potential were utilized. For the calculations, a cutoff energy of 300 eV was set for the plane-wave expansion of the ZrO2 system and the ZrO2 system doped with Zr/Nb. The most accurate convergence precision was chosen as per default for this part of the calculation. The k-point mesh used was either 11 × 11 × 15 or 15 × 15 × 10, depending on whether it was for the undoped system or the Zr/Nb-doped system in the Brillouin zone integration. These parameters were carefully chosen to ensure precise calculations, and both the cutoff energy and k-point mesh contribute to the excellent convergence of this study [21,22,23].
3. Results and Discussion
This section may be divided by subheadings. It should provide a concise and precise description of the experimental results, their interpretation, as well as the experimental conclusions that can be drawn.
3.1. Microstructure and Mechanical Properties
Figure 2 shows the SEM images of four groups of samples (ZrO2, Zr/Nb-ZrO2 1 (50 min); Zr/Nb-ZrO2 2 (60 min); Zr/Nb-ZrO2 3 (70 min)). Under the sputtering conditions used in this study, the surface of the ZrO2 films appears to be dense and smooth, as shown in Figure 2a. The cross-sectional images of the sputtered films are depicted in Figure 2e. However, following the injection of Zr and Nb ions, some small clusters are formed on the surface due to atomic collisions [24]. This results in slightly larger particles on the surface of the post-injection samples, as illustrated in Figure 2b-d.
Figure 3 presents the XRD pattern of the four sample groups, revealing the crystal structures of ZrO2 films under various injection conditions. It is evident that these films exhibit well-defined crystal orientations, with the (202) crystallographic direction being the strongest, indicating t-ZrO2. After the injection of zirconium and niobium ions, two new Nb2O5 peaks of varying intensities emerge. Notably, when the injection time reaches 70 min, the (−2,1,5) and (−2,1,6) peaks of Nb2O5 become the most pronounced. This signifies that with increasing injection time (and hence dosage), the prepared Zr/Nb-ZrO2 introduces new Nb2O5 crystal orientations. This observation confirms that Nb ions combine with oxygen to form Nb2O5, and as the dosage increases, the crystal orientation gradually strengthens. Nb and Nb2O5 possess desirable traits such as good ductility and corrosion resistance [25], further ameliorating the inherent brittleness and processing challenges of pure ZrO2 [26].
Figure 4a-d shows the AFM three-dimensional images of the four sample surfaces, while Figure 4e displays the arithmetic average roughness (Ra), and Figure 4f presents the root-mean-square roughness (Rq) of the four samples’ surfaces. The results indicate that the surface of the ZrO2 film is dense, smooth, and characterized by small grains. However, after the injection of Zr and Nb ions, there is an increase in grain size and particle dimensions, leading to an elevation in surface roughness. Notably, the Zr/Nb-ZrO2 2 sample exhibits the highest roughness. This increase in roughness can be attributed to the injection of particles, which results in a slight expansion of atomic dimensions and the enlargement of grains, consequently leading to a noticeable rise in surface roughness [18,27]. Additionally, ion bombardment on the surface creates defects and voids, which are favorable for the growth of new films. The injection of Zr ions and Nb ions results in the formation of new Nb2O5 film structures, further contributing to surface roughness.
XPS analysis was employed to investigate the chemical composition of the samples further. As shown in Figure 5a-d, after the implantation of Zr and Nb ions, the samples exhibited prominent Zr peaks, while the enhancement of Nb peaks was less pronounced, primarily due to the relatively low initial Nb content in the target material. The surface Nb content of the samples is provided in Table 2, indicating an increasing trend in Nb content. Since the target was a mixture of Zr and Nb, the increment in Nb content was not strictly proportional. High-resolution narrow spectra for Zr3d, Nb3d, and O1s are presented in Figure 5e-g. The Zr3d spectrum displayed peaks at 182.73 eV and 185.40 eV, corresponding to ZrO2 [28]. In the Nb3d spectrum, peaks at 208.11 eV (Nb2O5) and 210.90 eV (Nb2O5) indicated that Nb in the post-injection samples primarily existed in the form of Nb2O5 [29,30], as Nb readily combines with oxygen to form oxides [31]. Simultaneously, the O1s spectrum revealed peaks at 530.5 eV (ZrO2) and 530.9 eV (Nb2O5), while the peak at 531.4 eV represented adsorbed oxygen from the ambient air [32,33]. Consequently, the introduction of Zr and Nb ions into ZrO2 did not alter its original chemical composition but led to the formation of a new compound, Nb2O5.
Figure 6a-d depicts the hardness load-unload curves of the samples. It can be observed from the graphs that the maximum loads are roughly similar, with no significant difference in the unloading displacements. As shown in Figure 6e,f, Zr/Nb-ZrO2 3 exhibits the highest hardness, measuring 13.569 GPa, while Zr/Nb-ZrO2 1 demonstrates the highest elastic modulus, at 240.08 GPa. This enhancement in mechanical properties may be attributed to the formation of a Nb2O5 thin film with good plasticity due to ion bombardment. Consequently, these findings suggest that the ZrO2 films after ion implantation exhibit improved deformation resistance.
3.2. Hydrophilicity and Corrosion Resistance
As shown in Figure 7, the contact angles measured by a contact angle goniometer for four sets of samples (Ti-6Al-4V, ZrO2, Zr/Nb-ZrO2 1, Zr/Nb-ZrO2 2, Zr/Nb-ZrO2 3) were found to be 100.9°, 80.091°, 62.97°, 58.5792°, and 64.681°, respectively. Notably, Zr/Nb-ZrO2 2 exhibited the smallest contact angle, indicating the highest hydrophilicity. Studies have shown a correlation between contact angle and surface roughness, where within a certain range, increased roughness corresponds to decreased contact angles [34]. This observation aligns with the AFM testing, which revealed that Zr/Nb-ZrO2 2 had the highest surface roughness.
For implant materials, greater corrosion resistance leads to longer lifespans. Figure 8 presents the polarization curves of the four sample sets. As indicated in Figure 8, when compared to titanium alloy, both ZrO2 and Zr/Nb-ZrO2 exhibited lower corrosion currents (Icorr) and higher corrosion potentials (Ecorr). Remarkably, Zr/Nb-ZrO2 3 displayed the lowest corrosion current (Icorr) and the highest corrosion resistance. This can be attributed to two key factors. Firstly, following niobium ion implantation, the surface forms products primarily consisting of Nb2O5, known for its exceptional corrosion resistance [35]. Secondly, the increase in surface roughness results in a larger contact area with the corrosive electrolyte, intensifying electrochemical corrosion interactions between metals [36].
3.3. Structural stability
3.3.1. Analysis of Formation and Binding Energies in the Zr/Nb-doped ZrO2 System
As shown in Figure 9a, Zr and Nb atoms were placed to replace Zr atoms in ZrO2 at different ratios, illustrating the crystal cell diagrams of ZrO2 and the cell diagrams after atomic substitution. The Zr concentration varied as 0, 0.125, 0.50, 0.70, 0.80, and 0.90, while Nb concentration ranged from 0, 0.01, 0.02, 0.03, 0.04, 0.05, to 0.125. All of these crystal structures were optimized during the calculations. The formation energy of ZrO2 material refers to the energy absorbed or released by the Zr and O atoms in their respective elemental states when they generate the ZrO2 material. The difficulty of forming the new Zr/Nb-ZrO2 system by introducing Zr and Nb atoms into the ZrO2 system can be assessed based on its formation energy. The formula is shown below:

In the above equation, Eform represents the formation energy of the Zr/Nb-ZrO2 new system, E(doped) is the total energy of the Zr/Nb-ZrO2 new system after doping Zr/Nb atoms, E(ZrO2) is the total energy of ZrO2, E(Zr/Nb doped) is the energy of the doped Zr/Nb atoms, and E(host) is the energy of the Zr atom replaced in ZrO2. It should be noted that the system and atomic energy mentioned above refer to the total energy of each respective system after structural optimization.
When the formation energy of the Zr/Nb-ZrO2 new system is a negative value, it indicates that the Zr/Nb-ZrO2 new system is relatively easy to form experimentally. Conversely, when the numerical value of the formation energy of the Zr/Nb-ZrO2 new system is positive, it implies that the system is difficult to form because it requires the absorption of energy during the process [37]. As seen from Figures9b,c, the formation energy values of all Zr/Nb-ZrO2 new systems doped with Zr and Nb are negative, indicating that these Zr/Nb-ZrO2 new systems are relatively easy to form.
To further investigate the structural stability of Zr and Nb atoms doped into the ZrO2 system, this study also calculated the binding energy of the Zr/Nb-ZrO2 new system. The binding energy of the Zr/Nb-ZrO2 system is the energy released when unbounded Zr and Nb atoms are doped into the ZrO2 crystal structure. A more negative and larger absolute value of the binding energy for the Zr/Nb-ZrO2 system implies greater structural stability. The formula for calculating the binding energy after doping is as follows:
In Figure 9d,e, it can be observed that with the increase in Zr/Nb content, the binding energy values of different Zr/Nb-ZrO2 systems become increasingly negative, all below zero. Therefore, it is evident that the Zr/Nb-ZrO2 systems exhibit excellent structural stability.
3.3.2. Mechanical properties of Zr/Nb-doped ZrO2 System
Elastic constants are a crucial indicator of mechanical properties and a factor in demonstrating the stability of the crystal structure of Zr/Nb-doped ZrO2 systems. The tetragonal ZrO2 crystal structure studied in this paper has six independent elastic constants (C11, C12, C13, C33, C44, and C66). The objects of study achieve mechanical stability when the elastic constants satisfy the following conditions: C11 > |C12|, 2C132 < C33(C11 + C12), C44 > 0, C66 > 0, and 2C162 < C66(C11—C12).
In the CASTEP section, extensive first-principle calculations were conducted to obtain elastic constants for the Zr1-xZrxO2 and Zr1-xNbxO2 systems. The results, as shown in Table 3 and Table 4, indicate that the systems doped with Zr and Nb atoms meet the conditions for mechanical stability. This aligns with the results of nanoindentation experiments and further confirms the mechanical stability of Zr/Nb-ZrO2.
The calculated elastic constants can be used to compute various other microscopic quantities, such as bulk modulus (B), shear modulus (G), Young’s modulus (E), Poisson’s ratio (v), and the ratio of bulk to shear modulus [38]. These microscopic properties correspond to macroscopic performance indicators such as hardness, ease of processing, and mechanical strength. To further analyze the mechanical performance using the calculated elastic constants, the relationships between bulk modulus (B), shear modulus (G), Young’s modulus (E), and Poisson’s ratio with the elastic constants can be determined using the Voigt-Reuss-Hill approximation method:

The bulk modulus (B) represents a material’s ability to resist volume change under certain pressure conditions, indicating its resistance to deformation. A higher B value implies greater resistance to compression and, consequently, higher strength [39]. In Figure 10a, it is observed that with increasing Zr atom doping content, the B value of the Zr1-xZrxO2 system initially increases and then decreases, indicating that the system’s resistance to compression and strength first increases and then decreases. The overall bulk modulus of the Zr1-xZrxO2 system is slightly higher than that of the ZrO2 system, suggesting an increase in the system’s resistance to compression and strength. Figure 10b shows that with increasing Nb atom doping content, the bulk modulus of the Zr1-xNbxO2 system initially decreases and then increases. However, the overall bulk modulus of the Zr1-xNbxO2 system is slightly lower than that of the ZrO2 system, indicating a decrease in the system’s resistance to compression and strength. Shear modulus (G) is used to represent a material’s resistance to shear strain, where a higher G value indicates greater shear strain resistance. Young’s modulus (E) reflects a solid material’s ability to resist deformation, with a higher E value indicating greater stiffness.
In Figure 10c,e, it is observed that with increasing Zr atom doping content, the shear modulus and Young’s modulus of the Zr1-xZrxO2 system initially increase and then decrease, signifying an initial increase followed by a decrease in the system’s shear strain resistance and resistance to deformation. However, the overall values are slightly higher than those of the ZrO2 system, indicating that the Zr1-xZrxO2 system has greater shear strain resistance and deformation resistance compared to the ZrO2 system. Conversely, in Figure 10d,f, with increasing Nb atom doping content, the shear modulus and Young’s modulus of the Zr1-xNbxO2 system decrease, indicating a decrease in the system’s resistance to compression and deformation, resulting in reduced stiffness. This is consistent with the analysis of nanoindentation experimental results.
3.3.3. The electronic density of states (DOS) and partial density of states (PDOS) for the Zr/Nb-doped ZrO2 system.
In order to gain further insights into the influence of Zr and Nb atomic doping concentrations on the structural stability of the ZrO2 system, the DOS and PDOS were calculated and plotted for the Zr/Nb-ZrO2 new system to analyze its electronic properties.
Figure 11a,b depict the total density of states curves for different systems with Zr and Nb atomic doping, respectively. It can be observed that the shapes of the total density of states plots for Zr1-xZrxO2 and Zr1-xNbxO2 systems, after Zr and Nb doping, are similar, indicating that the energy level structure of the systems remains unchanged upon Zr and Nb doping. The presence of non-zero electron density at the Fermi level implies that these systems exhibit certain metallic characteristics. Upon introducing Zr and Nb atoms into the Zr1-xZrxO2 and Zr1-xNbxO2 systems, the electron density at the Fermi level increases, indicating a reduction in the electrochemical stability of these systems compared to ZrO2.
In the case of the Zr1-xZrxO2 system, with an increase in Zr atomic doping concentration, the electron density at the Fermi level initially decreases and then increases, suggesting an improvement and subsequent reduction in electrochemical stability. Conversely, in the Zr1-xNbxO2 system, as the Nb atomic doping concentration increases, the electron density at the Fermi level decreases, indicating an enhancement in electrochemical stability. Notably, for the Zr0.875Nb0.125O2 system, corresponding to a Nb atomic concentration of 0.125, the total DOS exhibits a peak shift towards lower energy levels, indicating increased structural stability [40]. Furthermore, the DOS near the Fermi level for both systems exhibits an increase relative to the DOS of ZrO2.
Figure 12a,b illustrates the PDOS for Zr and O in the Zr1-xZrxO2 system. Both ZrO2 and Zr1-xZrxO2 DOS profiles exhibit three regions: the lowest-energy peak, relatively flat and with low peak height, primarily arising from localized s electrons of O atoms and p orbitals of Zr atoms; the bonding region near the Fermi level, encompassing contributions from Zr3d and O2p orbitals, indicating covalent bonding; and the hybridization peaks at the top of the DOS.
The hybridization of Zr3d and O2p orbitals suggests the presence of covalent bonding. Typically, peak values near the ground state energy level have minimal impact on the macroscopic material properties. On the other hand, the electron distribution in the vicinity of the Fermi level is of significant research interest, as it can exert a substantial influence on macroscopic properties. Therefore, the focus is mainly on the electron distribution near the Fermi level. In Figure 12a,b, it is shown that with an increase in Zr concentration, the hybridization of Zr3d and O2p orbitals in the Zr1-xZrxO2 system initially strengthens and then weakens. Consequently, its structural stability first increases and then decreases as well.
Figure 13a,b,c shows the PDOS for Zr, Nb, and O in the Zr1-xNbxO2 system. In the electron region near the Fermi level, the hybridization of p-p orbitals strengthens as the peak height decreases, while the hybridization of p-d orbitals strengthens as the peak height increases. With an increase in Nb concentration, the Zr1-xNbxO2 system exhibits increased peak values for Zr3d, Nb3d, and O2p orbitals, indicating enhanced orbital hybridization. Consequently, its structural stability increases. As Nb doping concentration increases, both the TDOS and the PDOS shift towards lower energy levels. At higher doping concentrations, impurity atoms are close to each other, resulting in a pronounced hybridization of electrons in Zr3d, Nb3d, and O2p orbitals. This enhanced hybridization strengthens the interaction between these orbitals [41,42]. As the concentration increases, the system tends more towards the properties of Zr1-xNbxO2, making it easier for the system to reach a stable state. This is also a contributing factor to the greater stability of this system compared to Zr1-xZrxO2. These findings align with the analysis of binding energy and TDOS. Therefore, the enhanced orbital hybridization and increased interaction between bonds lead to the formation of a more stable new system. Consequently, it exhibits improved macroscopic properties, consistent with previous experimental results.
4. Conclusions
In this study, Zr and Nb ions were co-implanted into ZrO2 thin films using a RF magnetron sputtering system and a plasma immersion ion implantation system. Under the same implantation energy, different ion doses were utilized to obtain three sets of Zr/Nb-ZrO2 samples: Zr/Nb-ZrO2 1 (50 min), Zr/Nb-ZrO2 2 (60 min), and Zr/Nb-ZrO2 3 (70 min). The hardness and elastic modulus of the three sets of Zr/Nb-ZrO2 samples were moderately improved, with the maximum hardness reaching 13.569 GPa, and the highest elastic modulus recorded at 240.08 GPa. Zr/Nb-ZrO2 samples exhibited superior hydrophilicity and corrosion resistance compared to pure ZrO2, with Zr/Nb-ZrO2 3 demonstrating the strongest corrosion resistance and Zr/Nb-ZrO2 2 displaying the best hydrophilicity. Calculations demonstrated that with increasing Zr and Nb doping concentrations, Nb-doped systems exhibited lower formation energies, better ductility, and stability, making them easier to form and more stable. As the doping concentration changed, the hybridization also varied, leading to an increase in the total density of states. Consequently, the orbital hybridization between orbitals strengthened, as did the interactions between bonds, resulting in a more stable new system. With increasing concentration, the newly formed systems exhibited properties closer to Zr1-xNbxO2, making it easier to achieve a stable state compared to the Zr1-xZrxO2 system. This research successfully combines theoretical explanations with experimental evidence, marking an important step towards the application of Zr/Nb-ZrO2 in bio-implant coating materials.
Author Contributions
Design and direction, D.L.; software, L.W. and Y.G.; data curation, L.W.; writing—original draft preparation, Y.G.; writing—review and editing, D.L.; supervision, D.L. All authors have read and agreed to the published version of the manuscript.
Funding
This research was funded by National Natural Science Foundation of China, grant number 51772209, Tianjin Research Innovation Project for Postgraduate Students, grant number 2022SKYZ152 and Tianjin Normal University Research Innovation Project for Postgraduate Students, grant number 2022KYCX100Y).
Institutional Review Board Statement
Not applicable.
Informed Consent Statement
Not applicable.
Data Availability Statement
Not applicable.
Conflicts of Interest
The authors declare no conflict of interest.
References
- Gomes, Al.; Montero, J. Zirconia Implant Abutments: A Review. Med Oral 2011, e50–e55. [Google Scholar] [CrossRef] [PubMed]
- Ehrhart, G.; Capoen, B.; Robbe, O.; Boy, Ph.; Turrell, S.; Bouazaoui, M. Structural and Optical Properties of N-Propoxide Sol–Gel Derived ZrO2 Thin Films. Thin Solid Films 2006, 496, 227–233. [Google Scholar] [CrossRef]
- Hembram, K.P.S.S.; Dutta, G.; Waghmare, U.V.; Mohan Rao, G. Electrical and Structural Properties of Zirconia Thin Films Prepared by Reactive Magnetron Sputtering. Physica B: Condensed Matter 2007, 399, 21–26. [Google Scholar] [CrossRef]
- Nemati, A.; Saghafi, M.; Khamseh, S.; Alibakhshi, E.; Zarrintaj, P.; Saeb, M.R. Magnetron-Sputtered TixNy Thin Films Applied on Titanium-Based Alloys for Biomedical Applications: Composition-Microstructure-Property Relationships. Surface and Coatings Technology 2018, 349, 251–259. [Google Scholar] [CrossRef]
- Zalnezhad, E. Effect of Structural Evolution on Mechanical Properties of ZrO2 Coated Ti–6Al–7Nb-Biomedical Application. Applied Surface Science 2016, 370, 32–39. [Google Scholar] [CrossRef]
- Pamu, D.; Sudheendran, K.; Krishna, M.G.; Raju, K.C.J.; Bhatnagar, A.K. Ambient Temperature Stabilization of Crystalline Zirconia Thin Films Deposited by Direct Current Magnetron Sputtering. Thin Solid Films 2009, 517, 1587–1591. [Google Scholar] [CrossRef]
- Saleem, S.; Ahmad, R.; Ayub, R.; Ikhlaq, U.; Jin, W.; Chu, P.K. Investigation of Nano-Structured Zirconium Oxide Film on Ti6Al4V Substrate to Improve Tribological Properties Prepared by PIII&D. Applied Surface Science 2017, 394, 586–597. [Google Scholar] [CrossRef]
- Fu, X.M. The Influence of the Hydrothermal Temperature on the Morphologies and the Optical Absorption Properties of M-ZrO2 Nanoparticles. AMM 2013, 320, 11–14. [Google Scholar] [CrossRef]
- Saudé, S.; Grynszpan, R.I.; Anwand, W.; Brauer, G. Defect Production in Ion-Implanted Yttria-Stabilized Zirconia Investigated by Positron Depth Profiling. Journal of Alloys and Compounds 2004, 382, 252–256. [Google Scholar] [CrossRef]
- Zhang, H.H.; Ma, C.Y.; Zhang, Q.Y. Scaling Behavior and Structure Transition of ZrO2 Films Deposited by RF Magnetron Sputtering. Vacuum 2009, 83, 1311–1316. [Google Scholar] [CrossRef]
- Yang, J.; Wang, M.; Li, X.; Dong, Z.; Zhou, X.; Luan, J.; Guo, Y.; Xue, Y. Structural and Electrochemical Corrosion Studies of Spin Coated ZrO 2 Thin Films over Stainless Steel Alloy for Bone Defect Applications. Journal of Applied Biomaterials & Functional Materials 2022, 20, 228080002110667. [Google Scholar] [CrossRef]
- Tallarico, D.A.; Gobbi, A.L.; Paulin Filho, P.I.; Maia Da Costa, M.E.H.; Nascente, P.A.P. Growth and Surface Characterization of TiNbZr Thin Films Deposited by Magnetron Sputtering for Biomedical Applications. Materials Science and Engineering: C 2014, 43, 45–49. [Google Scholar] [CrossRef] [PubMed]
- Photiou, D.; Panagiotopoulos, N.T.; Koutsokeras, L.; Evangelakis, G.A.; Constantinides, G. Microstructure and Nanomechanical Properties of Magnetron Sputtered Ti − Nb Films. Surface and Coatings Technology 2016, 302, 310–319. [Google Scholar] [CrossRef]
- Luo, P.; Wang, S.-N.; Zhao, T.-T.; Li, Y. Surface Characteristics, Corrosion Behavior, and Antibacterial Property of Ag-Implanted NiTi Alloy. Rare Met. 2013, 32, 113–121. [Google Scholar] [CrossRef]
- Kazemi, M.; Ahangarani, S.; Esmailian, M.; Shanaghi, A. Investigation on the Corrosion Behavior and Biocompatibility of Ti-6Al-4V Implant Coated with HA/TiN Dual Layer for Medical Applications. Surf. Coat. Technol. 2020, 397, 126044. [Google Scholar] [CrossRef]
- Li, Q.; Zhao, M.; Li, L.; Dong, L.; Wu, J.; Li, D. Co-Regulation of Cu/Zn Contents Enhanced the Biological and Mechanical Properties of TiN Coated Ti-6Al-4V Alloy. Surf. Coat. Technol. 2020, 395, 125943. [Google Scholar] [CrossRef]
- Xue, C.; Zhang, P.; Wei, D.; Hu, H.; Li, F.; Yang, K. Corrosion and Tribocorrosion Behaviors for TA3 in Ringer’s Solution after Implantation of Nb Ions. Applied Sciences 2020, 10, 8329. [Google Scholar] [CrossRef]
- Zhao, T.; Li, Y.; Xiang, Y.; Zhao, X.; Zhang, T. Surface Characteristics, Nano-Indentation and Corrosion Behavior of Nb Implanted NiTi Alloy. Surface and Coatings Technology 2011, 205, 4404–4410. [Google Scholar] [CrossRef]
- Liu, Y.Z.; Zu, X.T.; Li, C.; Qiu, S.Y.; Huang, X.Q.; Wang, L.M. Surface Characteristics and Corrosion Behavior of Ti–Al–Zr Alloy Implanted with Al and Nb. Corrosion Science 2007, 49, 1069–1080. [Google Scholar] [CrossRef]
- Liang, T.; Zeng, L.; Shi, Y.; Pan, H.; Chu, P.K.; Yeung, K.W.K.; Zhao, Y. In Vitro and in Vivo Antibacterial Performance of Zr & O PIII Magnesium Alloys with High Concentration of Oxygen Vacancies. Bioactive Materials 2021, 6, 3049–3061. [Google Scholar] [CrossRef]
- Muhammad, I.D.; Awang, M.; Mamat, O.; Shaari, Z.B. First-Principles Calculations of the Structural, Mechanical and Thermodynamics Properties of Cubic Zirconia. WJNSE 2014, 04, 97–103. [Google Scholar] [CrossRef]
- Perdew, J.P.; Burke, K.; Ernzerhof, M. Generalized Gradient Approximation Made Simple. Phys. Rev. Lett. 1996, 77, 3865–3868. [Google Scholar] [CrossRef]
- Pettifor, D.G. Theoretical Predictions of Structure and Related Properties of Intermetallics. 1992, 8.
- Song, X.; Zhao, M.; Li, D. Controllable Ag/Ta Ratios of Co-Implanted TiN Films on Titanium Alloys for Osteogenic Enhancement and Antibacterial Responses. Surf Coat Technol 2022, 436, 128294. [Google Scholar] [CrossRef]
- Meganathan, P.; Selvaraj, L.M.; Peter, L.S.; Venkatachalam, S.; Srinivasan, N. Synergetic Surface Behavior of Sol–Gel ZrO2–Nb2O5 Coated 316L Stainless Steel for Biomedical Applications. J Bio Tribo Corros 2020, 6, 108. [Google Scholar] [CrossRef]
- Fathy, A.; Elkady, O.; Abu-Oqail, A. Microstructure, Mechanical and Wear Properties of Cu–ZrO2 Nanocomposites. Materials Science and Technology 2017, 33, 2138–2146. [Google Scholar] [CrossRef]
- Medicherla, V.R.R.; Majumder, S.; Paramanik, D.; Varma, S. Formation of Self-Organized Ta Nano-Structures by Argon Ion Sputtering of Ta Foil: XPS and AFM Study. Journal of Electron Spectroscopy and Related Phenomena 2010, 180, 1–5. [Google Scholar] [CrossRef]
- Reddy, B.M.; Chowdhury, B.; Smirniotis, P.G. An XPS Study of the Dispersion of MoO3 on TiO2–ZrO2, TiO2–SiO2, TiO2–Al2O3, SiO2–ZrO2, and SiO2–TiO2–ZrO2 Mixed Oxides. Applied Catalysis A: General 2001, 211, 19–30. [Google Scholar] [CrossRef]
- Cordeiro, J.M.; Beline, T.; Ribeiro, A.L.R.; Rangel, E.C.; Da Cruz, N.C.; Landers, R.; Faverani, L.P.; Vaz, L.G.; Fais, L.M.G.; Vicente, F.B.; et al. Development of Binary and Ternary Titanium Alloys for Dental Implants. Dental Materials 2017, 33, 1244–1257. [Google Scholar] [CrossRef]
- Hoppe, V.; Szymczyk-Ziółkowska, P.; Rusińska, M.; Dybała, B.; Poradowski, D.; Janeczek, M. Assessment of Mechanical, Chemical, and Biological Properties of Ti-Nb-Zr Alloy for Medical Applications. Materials 2020, 14, 126. [Google Scholar] [CrossRef]
- Ge, Y.; Wang, Y.; Chen, J.; Zou, Y.; Guo, L.; Ouyang, J.; Jia, D.; Zhou, Y. Hot Corrosion Behavior of NbSi2/SiO2-Nb2O5 Multilayer Coating on Nb Alloy. Journal of Alloys and Compounds 2018, 767, 7–15. [Google Scholar] [CrossRef]
- Olsson, C.-O.A.; Landolt, D. Atmospheric Oxidation of a Nb–Zr Alloy Studied with XPS. Corrosion Science 2004, 46, 213–224. [Google Scholar] [CrossRef]
- Alfonso, J.E.; Buitrago, J.; Torres, J.; Marco, J.F.; Santos, B. Influence of Fabrication Parameters on Crystallization, Microstructure, and Surface Composition of NbN Thin Films Deposited by Rf Magnetron Sputtering. J Mater Sci 2010, 45, 5528–5533. [Google Scholar] [CrossRef]
- Zhao, M.; Ji, X.; Li, D. Ag+ and Ca+ Single Implantation and Co-Implantation Induced the Cell Growth and Antibacterial Activity of TiN/Ti-6Al-4V. Vacuum 2023, 207, 111579. [Google Scholar] [CrossRef]
- Zhou, F.Y.; Wang, B.L.; Qiu, K.J.; Lin, W.J.; Li, L.; Wang, Y.B.; Nie, F.L.; Zheng, Y.F. Microstructure, Corrosion Behavior and Cytotoxicity of Zr–Nb Alloys for Biomedical Application. Materials Science and Engineering: C 2012, 32, 851–857. [Google Scholar] [CrossRef]
- Li, K.; Li, Y.; Huang, X.; Gibson, D.; Zheng, Y.; Liu, J.; Sun, L.; Fu, Y.Q. Surface Microstructures and Corrosion Resistance of Ni-Ti-Nb Shape Memory Thin Films. Applied Surface Science 2017, 414, 63–67. [Google Scholar] [CrossRef]
- Yuan, Z.-P.; Cui, H.-B.; Guo, X.-F. First-Principles Calculation of Point-Defective Structures of B2-NiSc Intermetallics. Radiation Effects and Defects in Solids 2016, 171, 668–677. [Google Scholar] [CrossRef]
- Benyelloul, K.; Aourag, H. Elastic Constants of Austenitic Stainless Steel: Investigation by the First-Principles Calculations and the Artificial Neural Network Approach. Computational Materials Science 2013, 67, 353–358. [Google Scholar] [CrossRef]
- Tan, X.; Li, X.; Wang, Y.; Liu, X.; Yu, C.; Ren, Y. Ab-Initio Study on the Stability, Electronic and Mechanical Properties of Transition Metal Nitrides under External Pressure. Solid State Sciences 2017, 66, 16–22. [Google Scholar] [CrossRef]
- Jhi, S.-H.; Ihm, J.; Louie, S.G.; Cohen, M.L. Electronic Mechanism of Hardness Enhancement in Transition-Metal Carbonitrides. Nature 1999, 399, 132–134. [Google Scholar] [CrossRef]
- French, R.H.; Glass, S.J.; Ohuchi, F.S.; Xu, Y.-N.; Ching, W.Y. Experimental and Theoretical Determination of the Electronic Structure and Optical Properties of Three Phases of ZrO 2. Phys. Rev. B 1994, 49, 5133–5142. [Google Scholar] [CrossRef]
- Robertson, J.; Xiong, K.; Clark, S.J. Band Structure of Functional Oxides by Screened Exchange and the Weighted Density Approximation. phys. stat. sol. (b) 2006, 243, 2054–2070. [Google Scholar] [CrossRef]
Figure 1.
Schematic diagram of the magnetron sputtering system (FJL560CI2) and plasma immersion ion injection system (PIII & D-700).
Figure 1.
Schematic diagram of the magnetron sputtering system (FJL560CI2) and plasma immersion ion injection system (PIII & D-700).
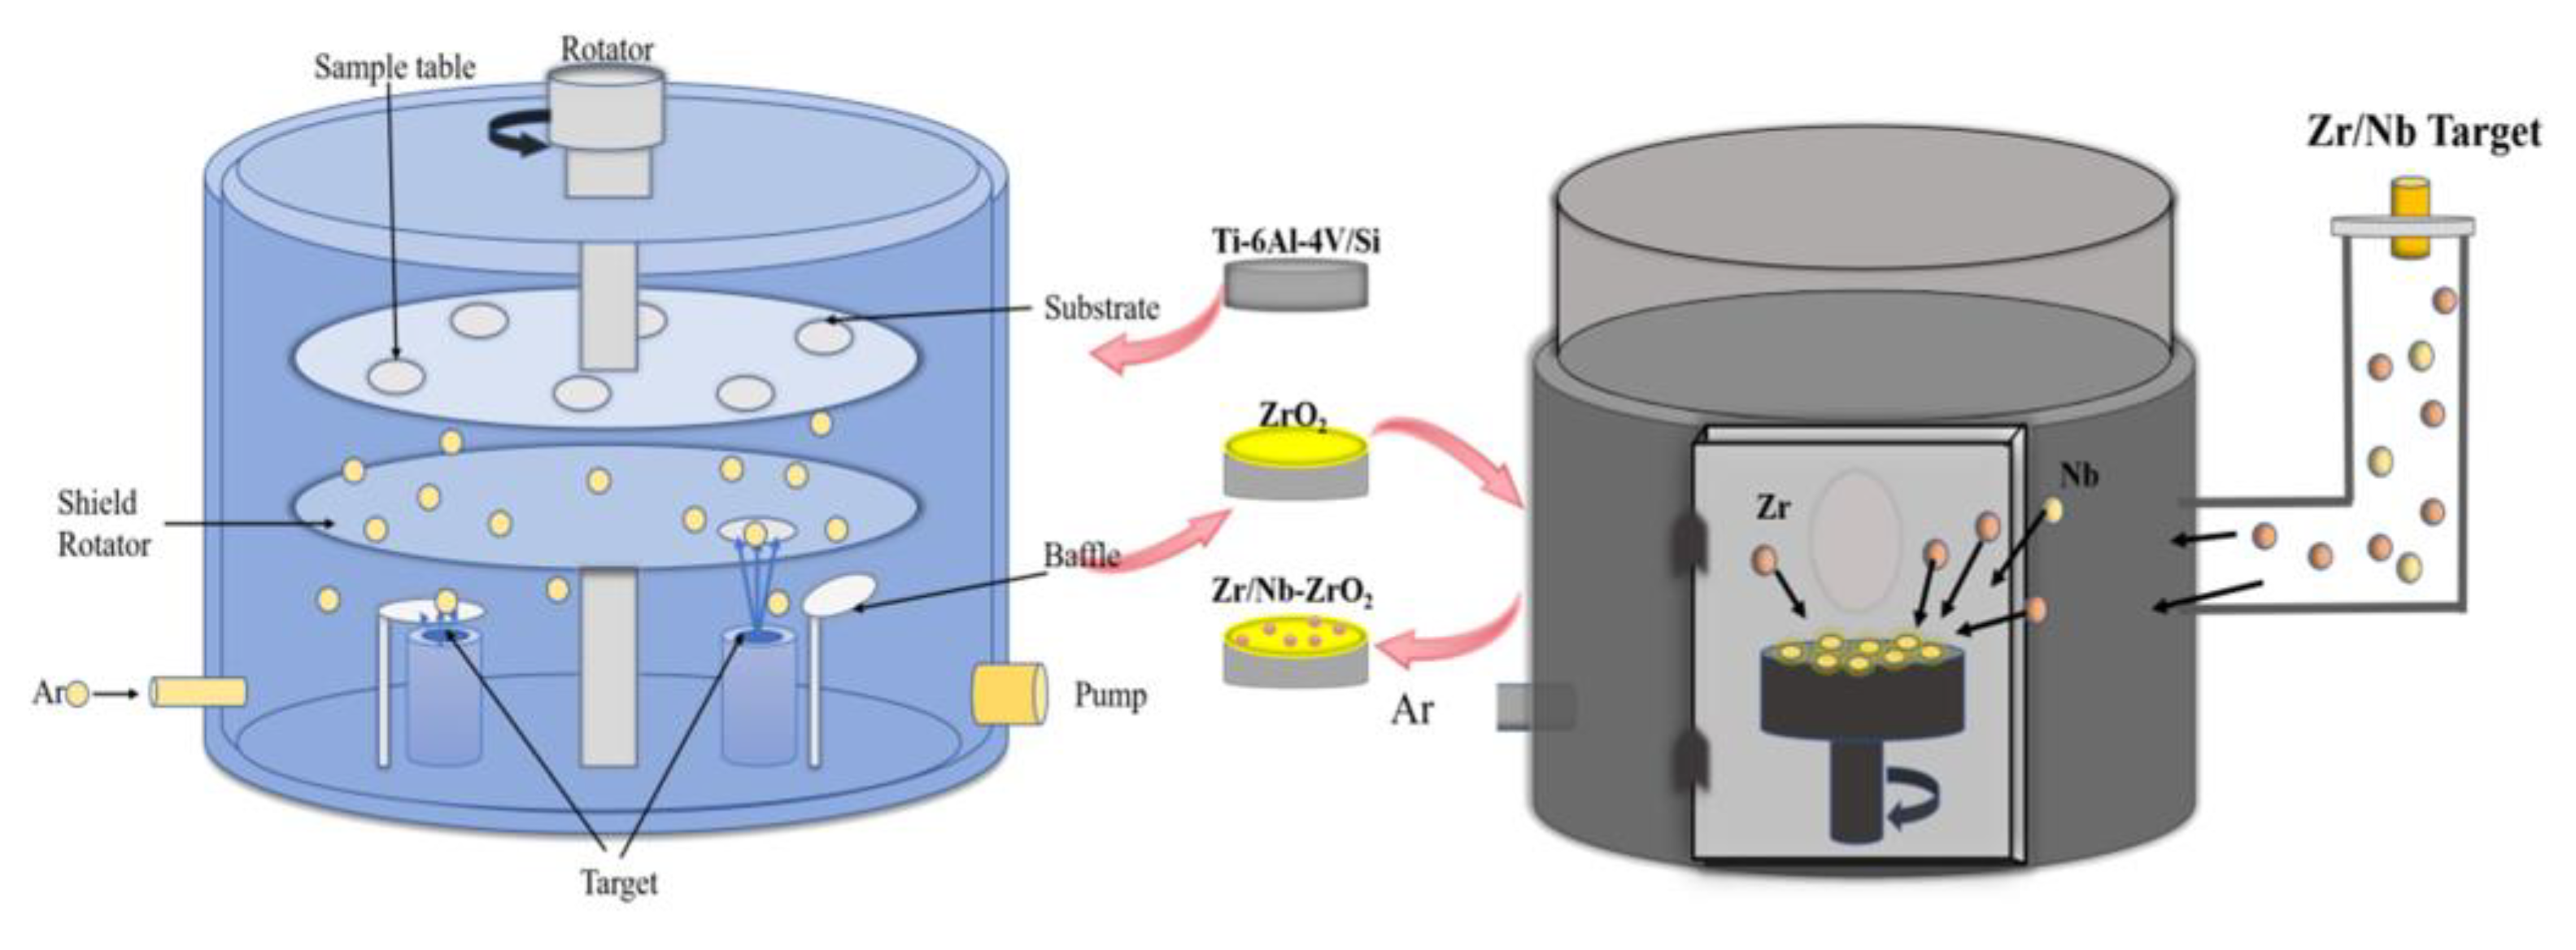
Figure 2.
SEM image of the surface topography under magnetron sputtering and different injection conditions (a-d), and the cross-sectional SEM image(e).
Figure 2.
SEM image of the surface topography under magnetron sputtering and different injection conditions (a-d), and the cross-sectional SEM image(e).
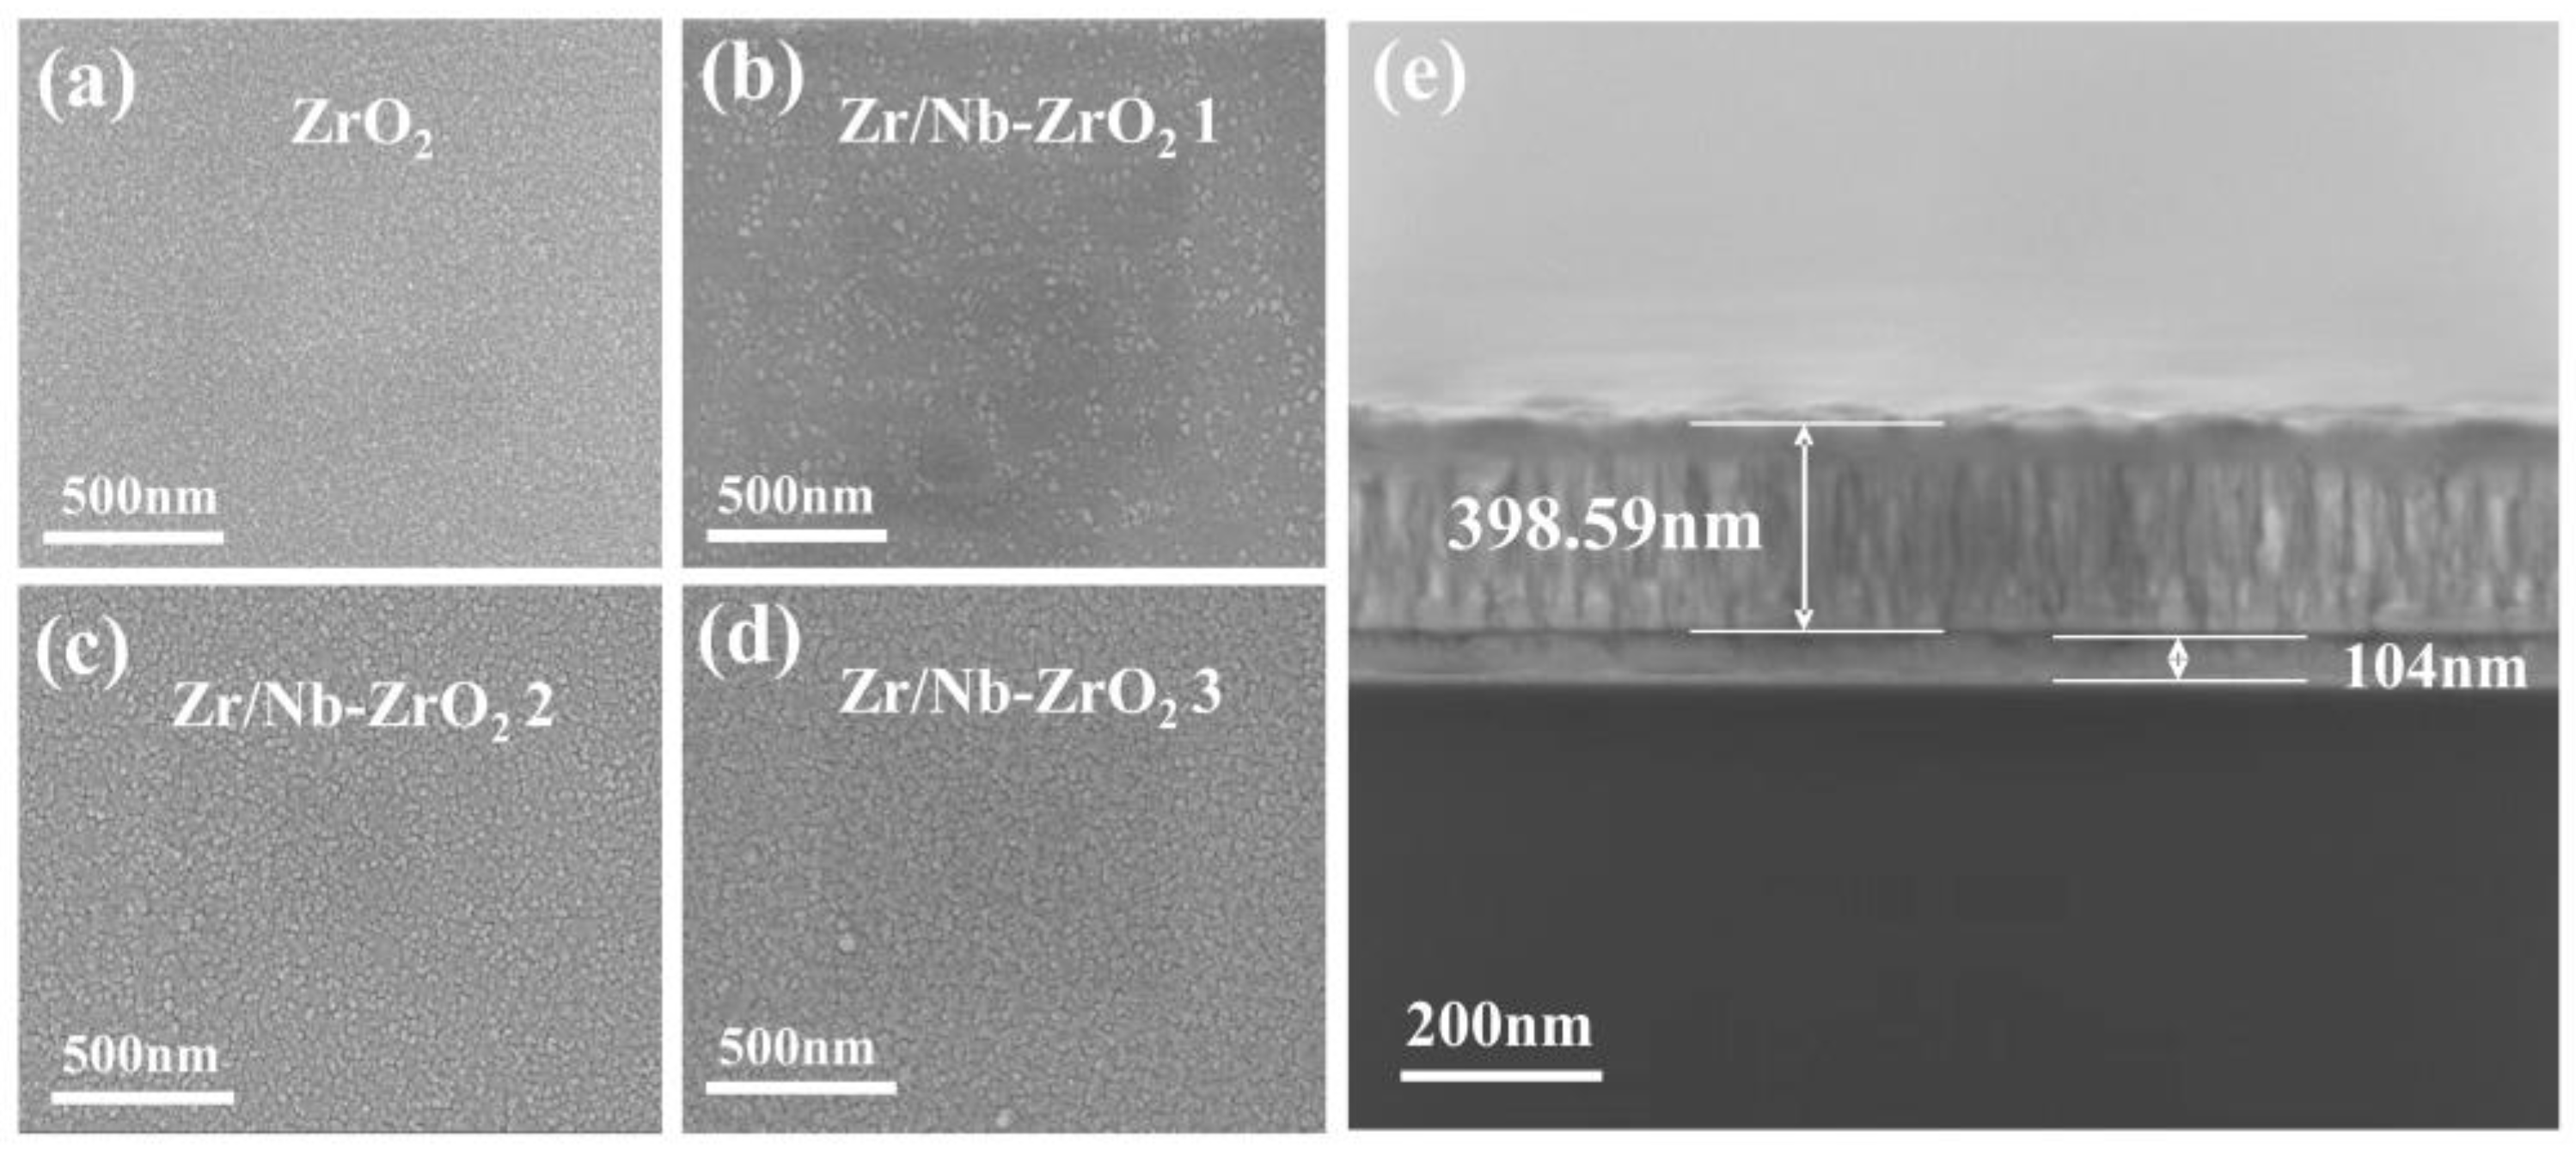
Figure 3.
XRD pattern of Zr/Nb-ZrO2.
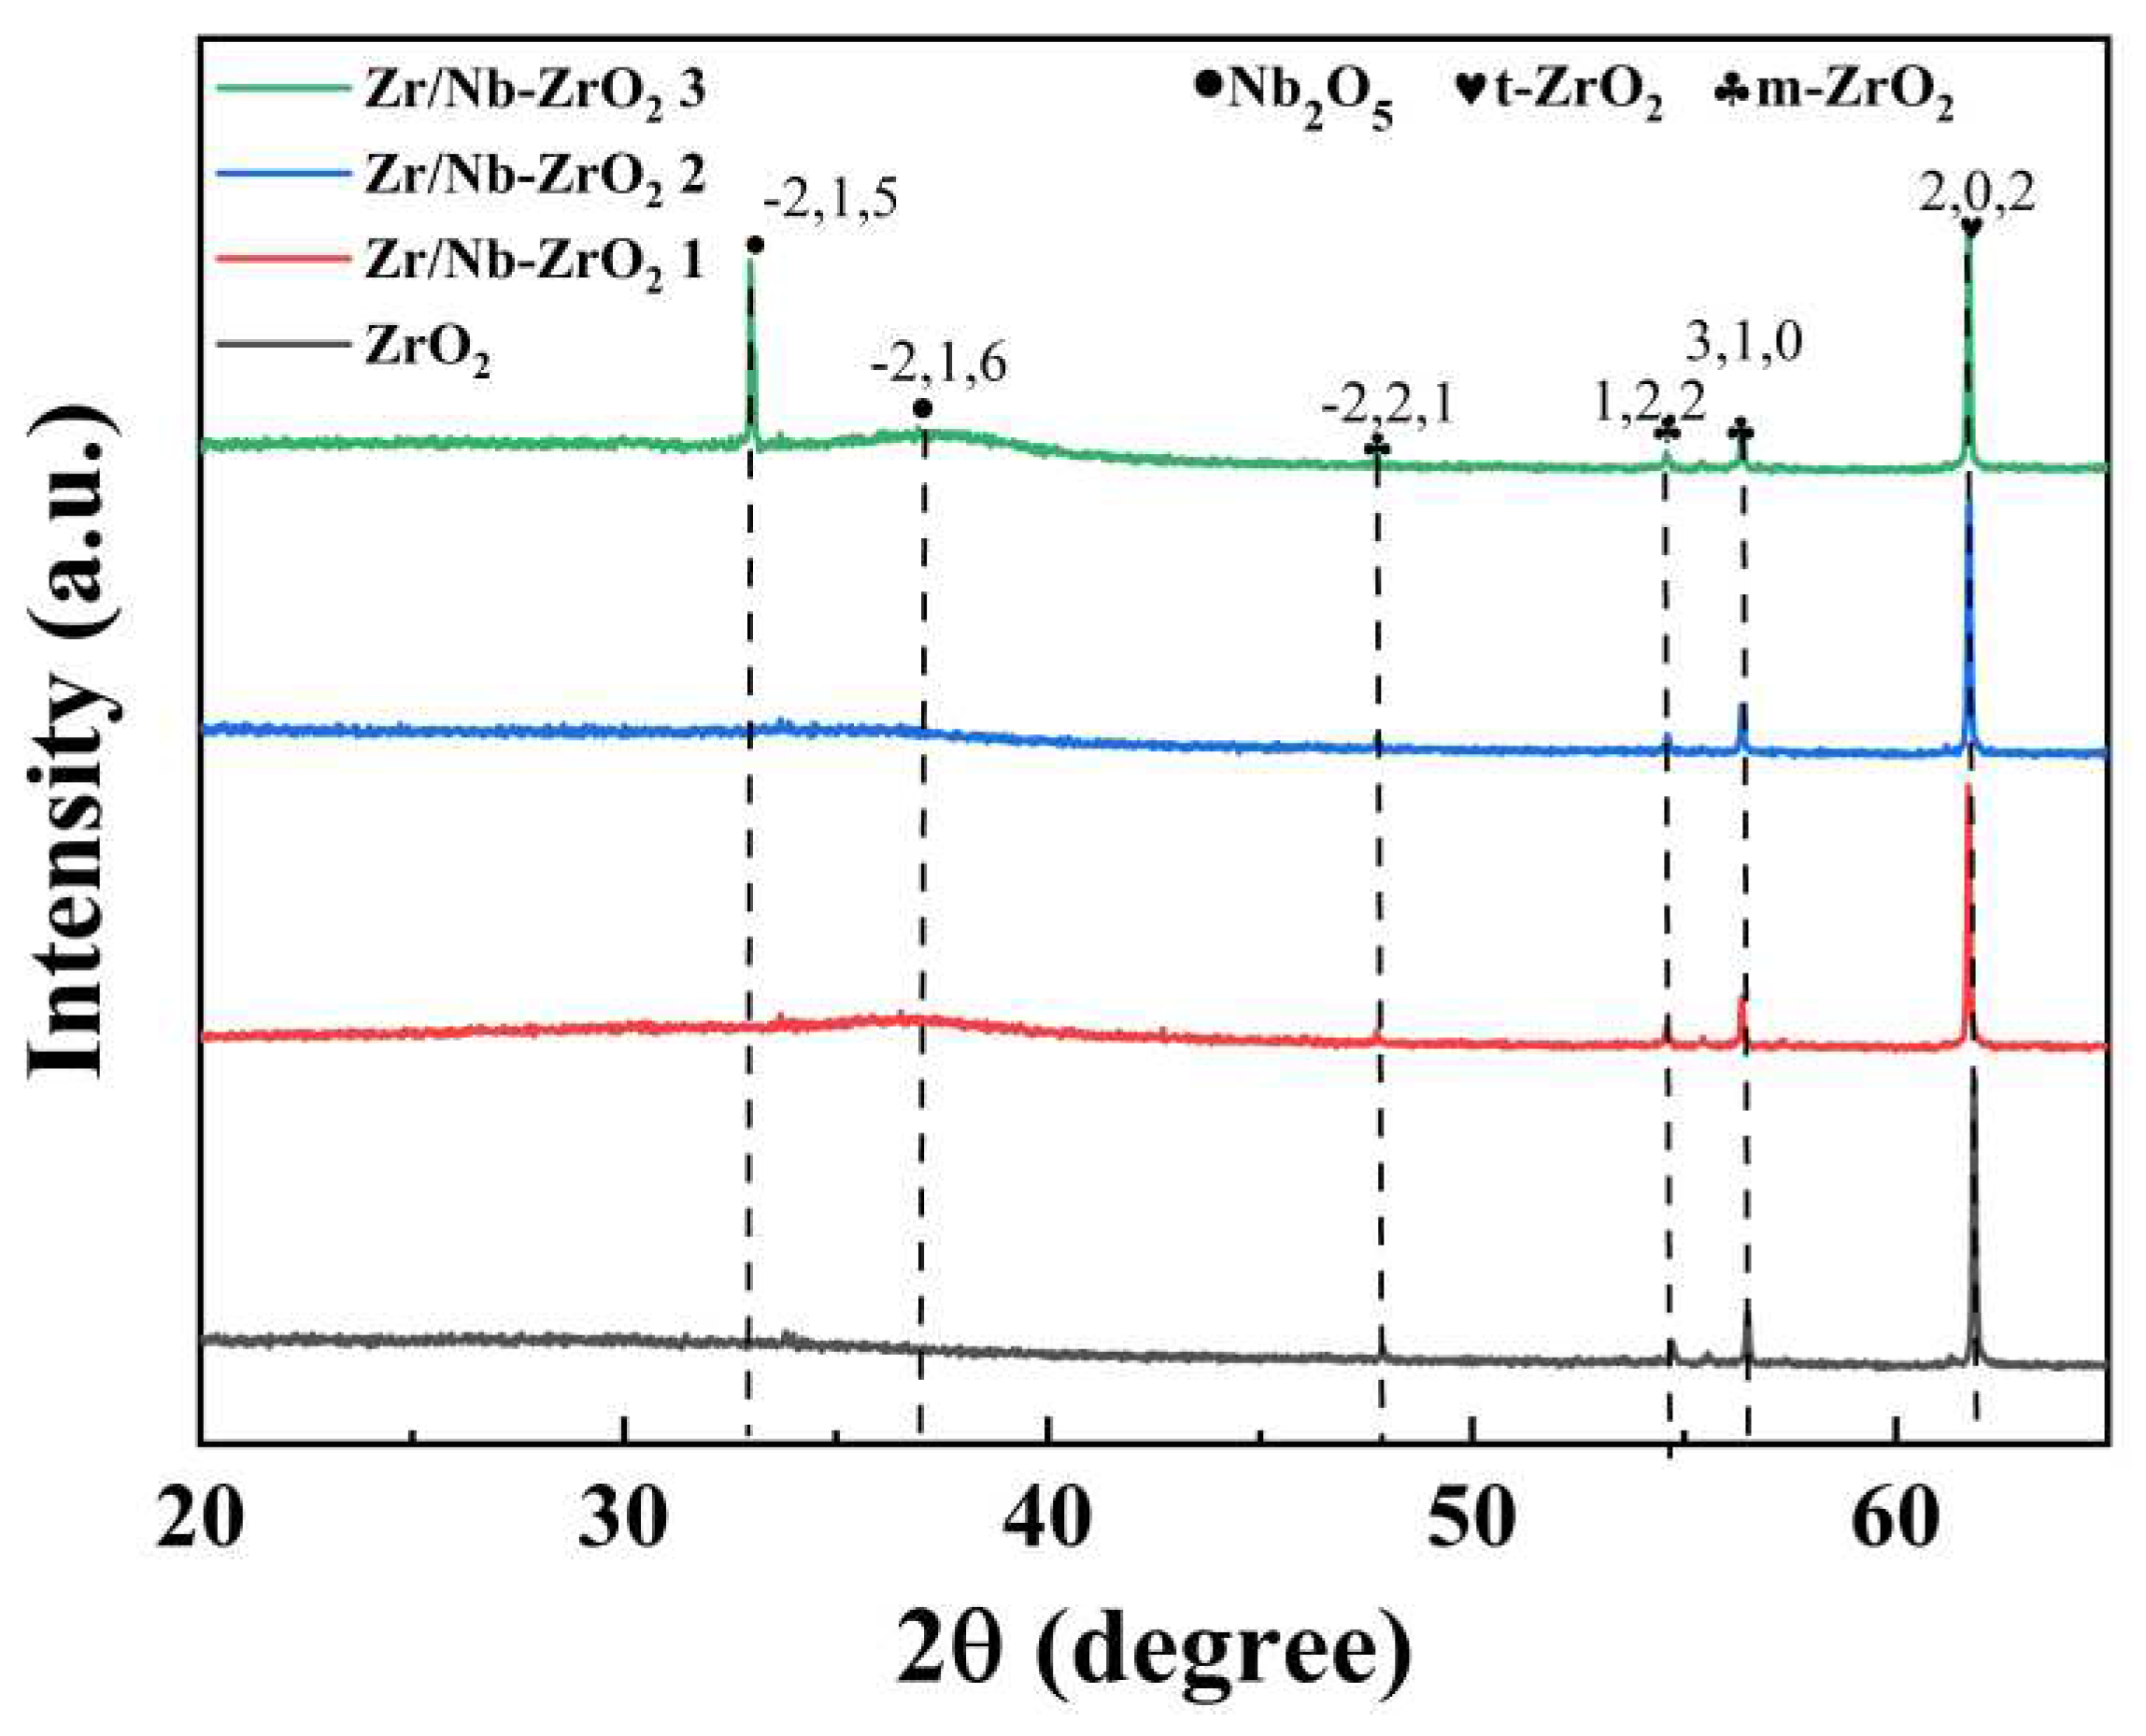
Figure 4.
3D images of different surface morphology and roughness by AFM, (a) ZrO2, (b) Zr/Nb-ZrO2 1, (c) Zr/Nb-ZrO2 2, (d) Zr/Nb-ZrO2 3, (e) the Ra roughness, (f) the Rq roughness.
Figure 4.
3D images of different surface morphology and roughness by AFM, (a) ZrO2, (b) Zr/Nb-ZrO2 1, (c) Zr/Nb-ZrO2 2, (d) Zr/Nb-ZrO2 3, (e) the Ra roughness, (f) the Rq roughness.
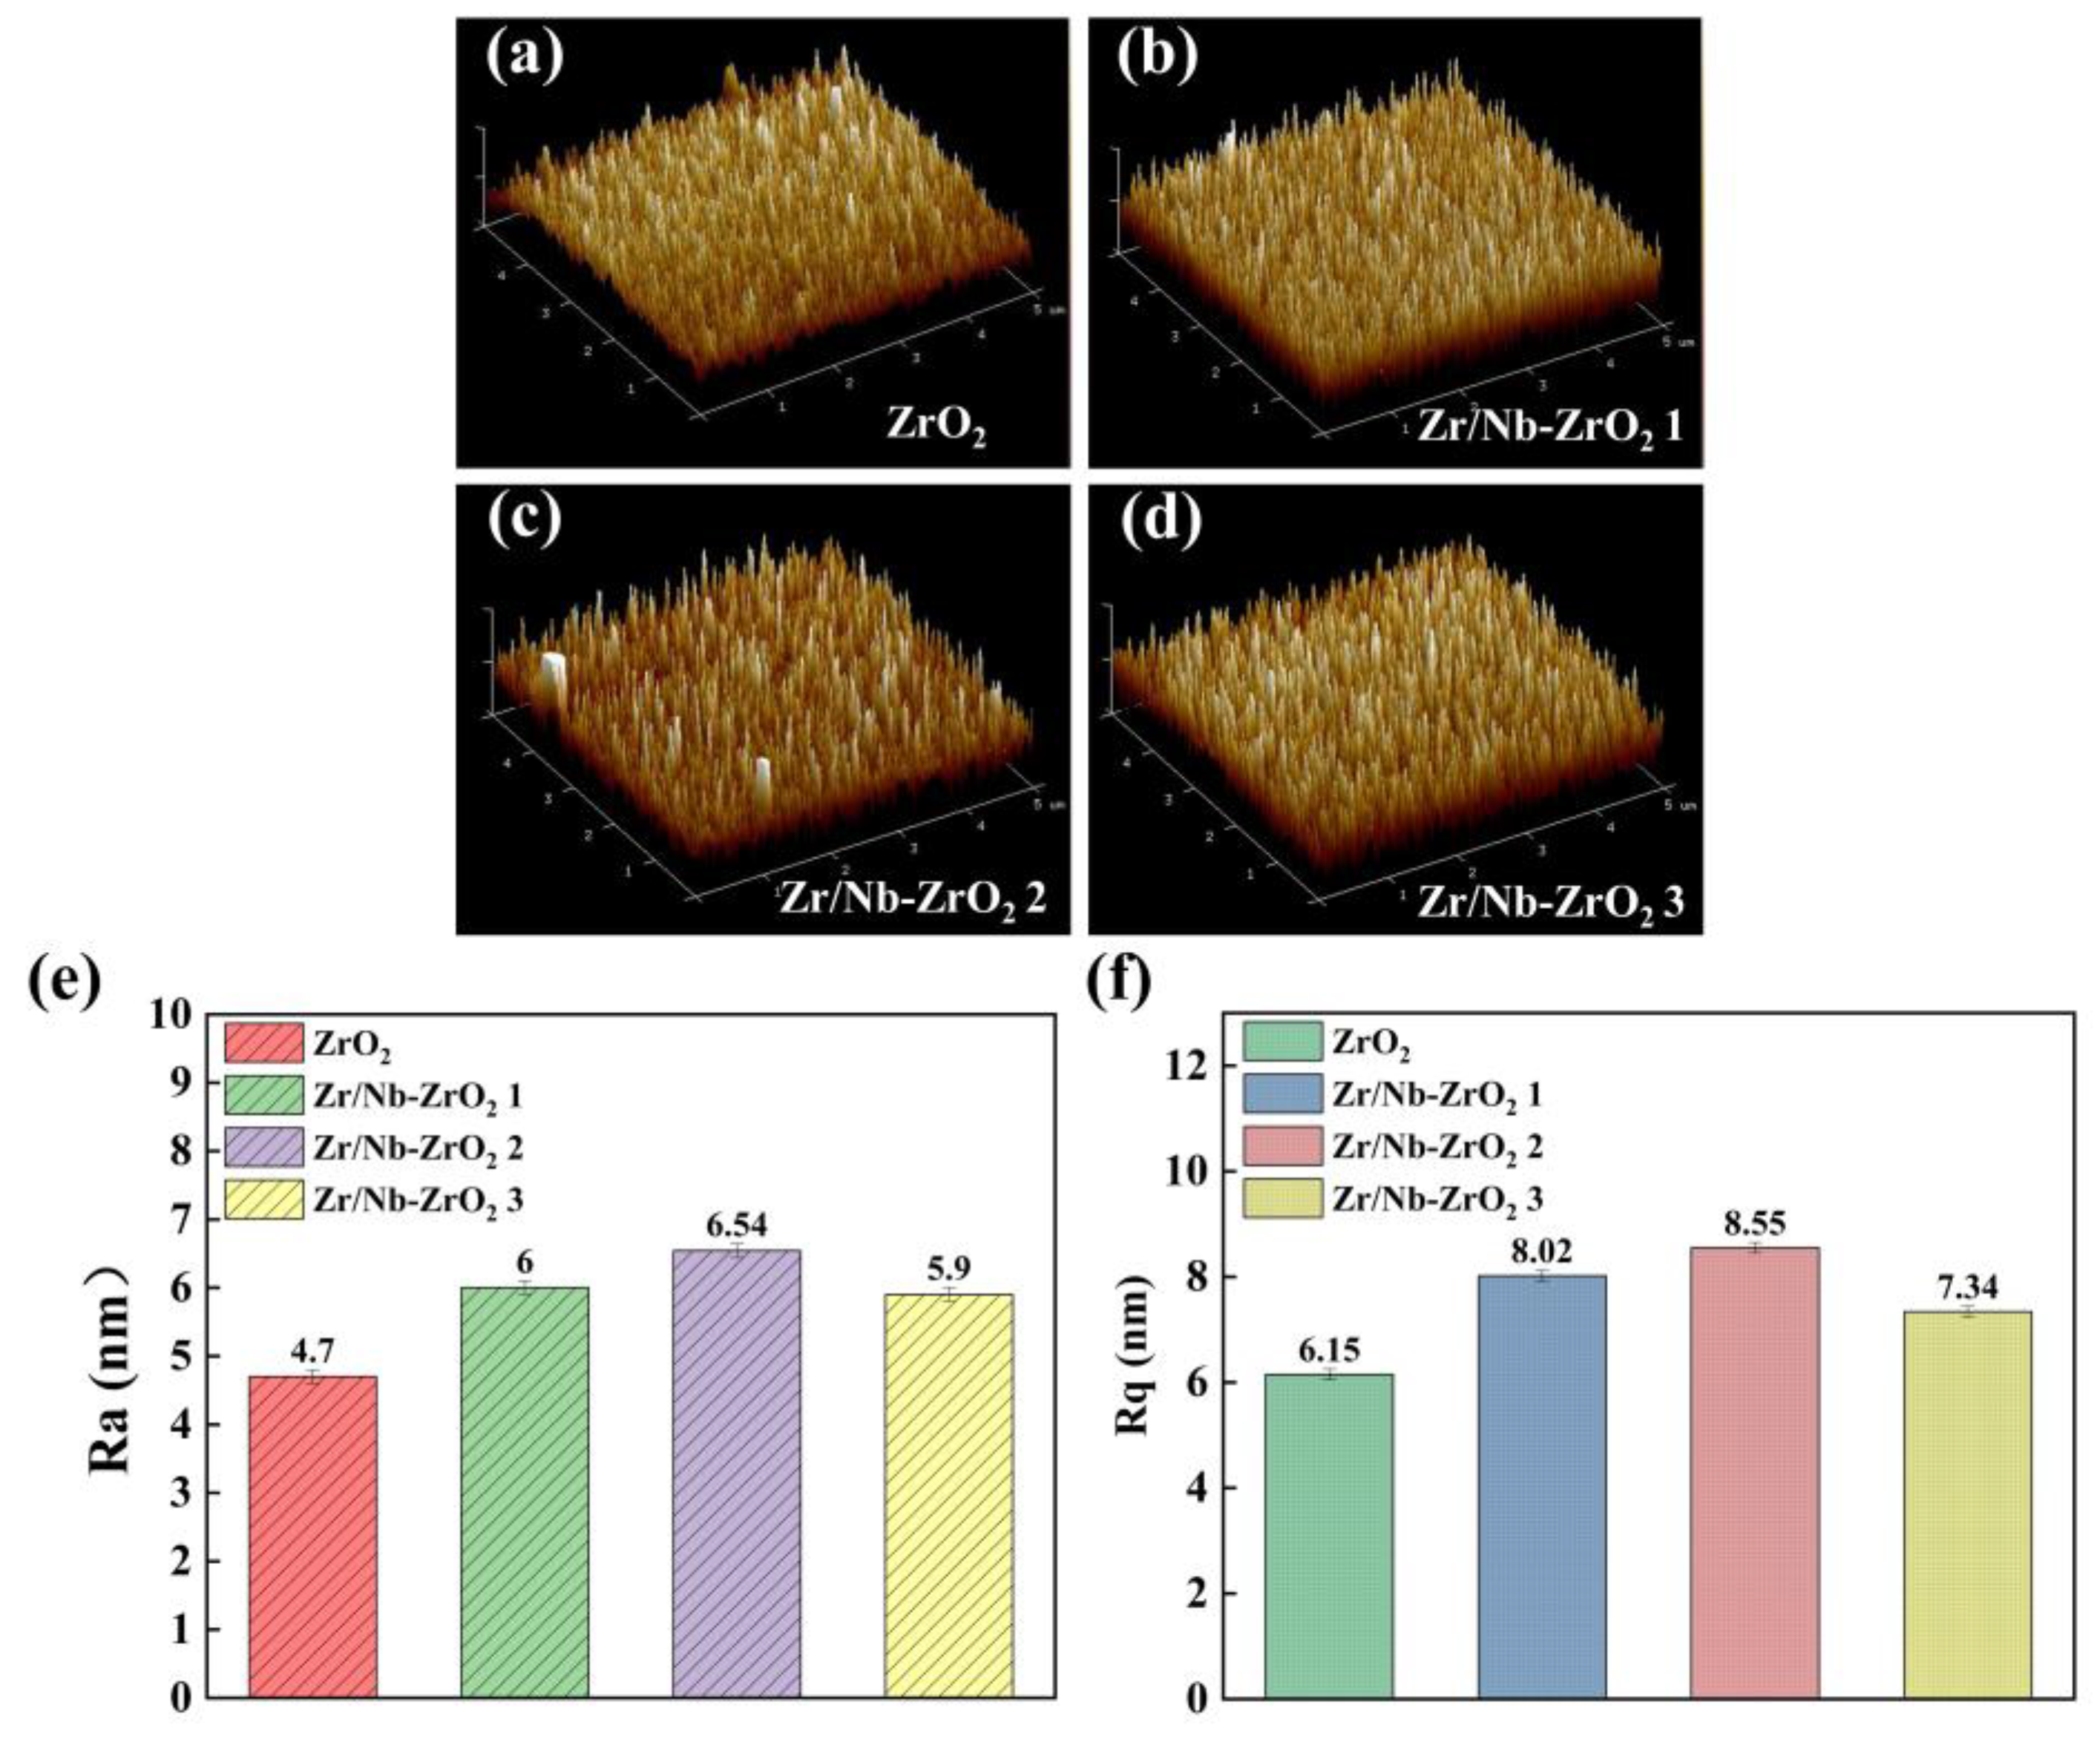
Figure 5.
(a) XPS spectra of four groups of samples, (b) Zr3d, (c) Nb3d and (d) O1s XPS spectra of Zr/Nb-ZrO2.
Figure 5.
(a) XPS spectra of four groups of samples, (b) Zr3d, (c) Nb3d and (d) O1s XPS spectra of Zr/Nb-ZrO2.
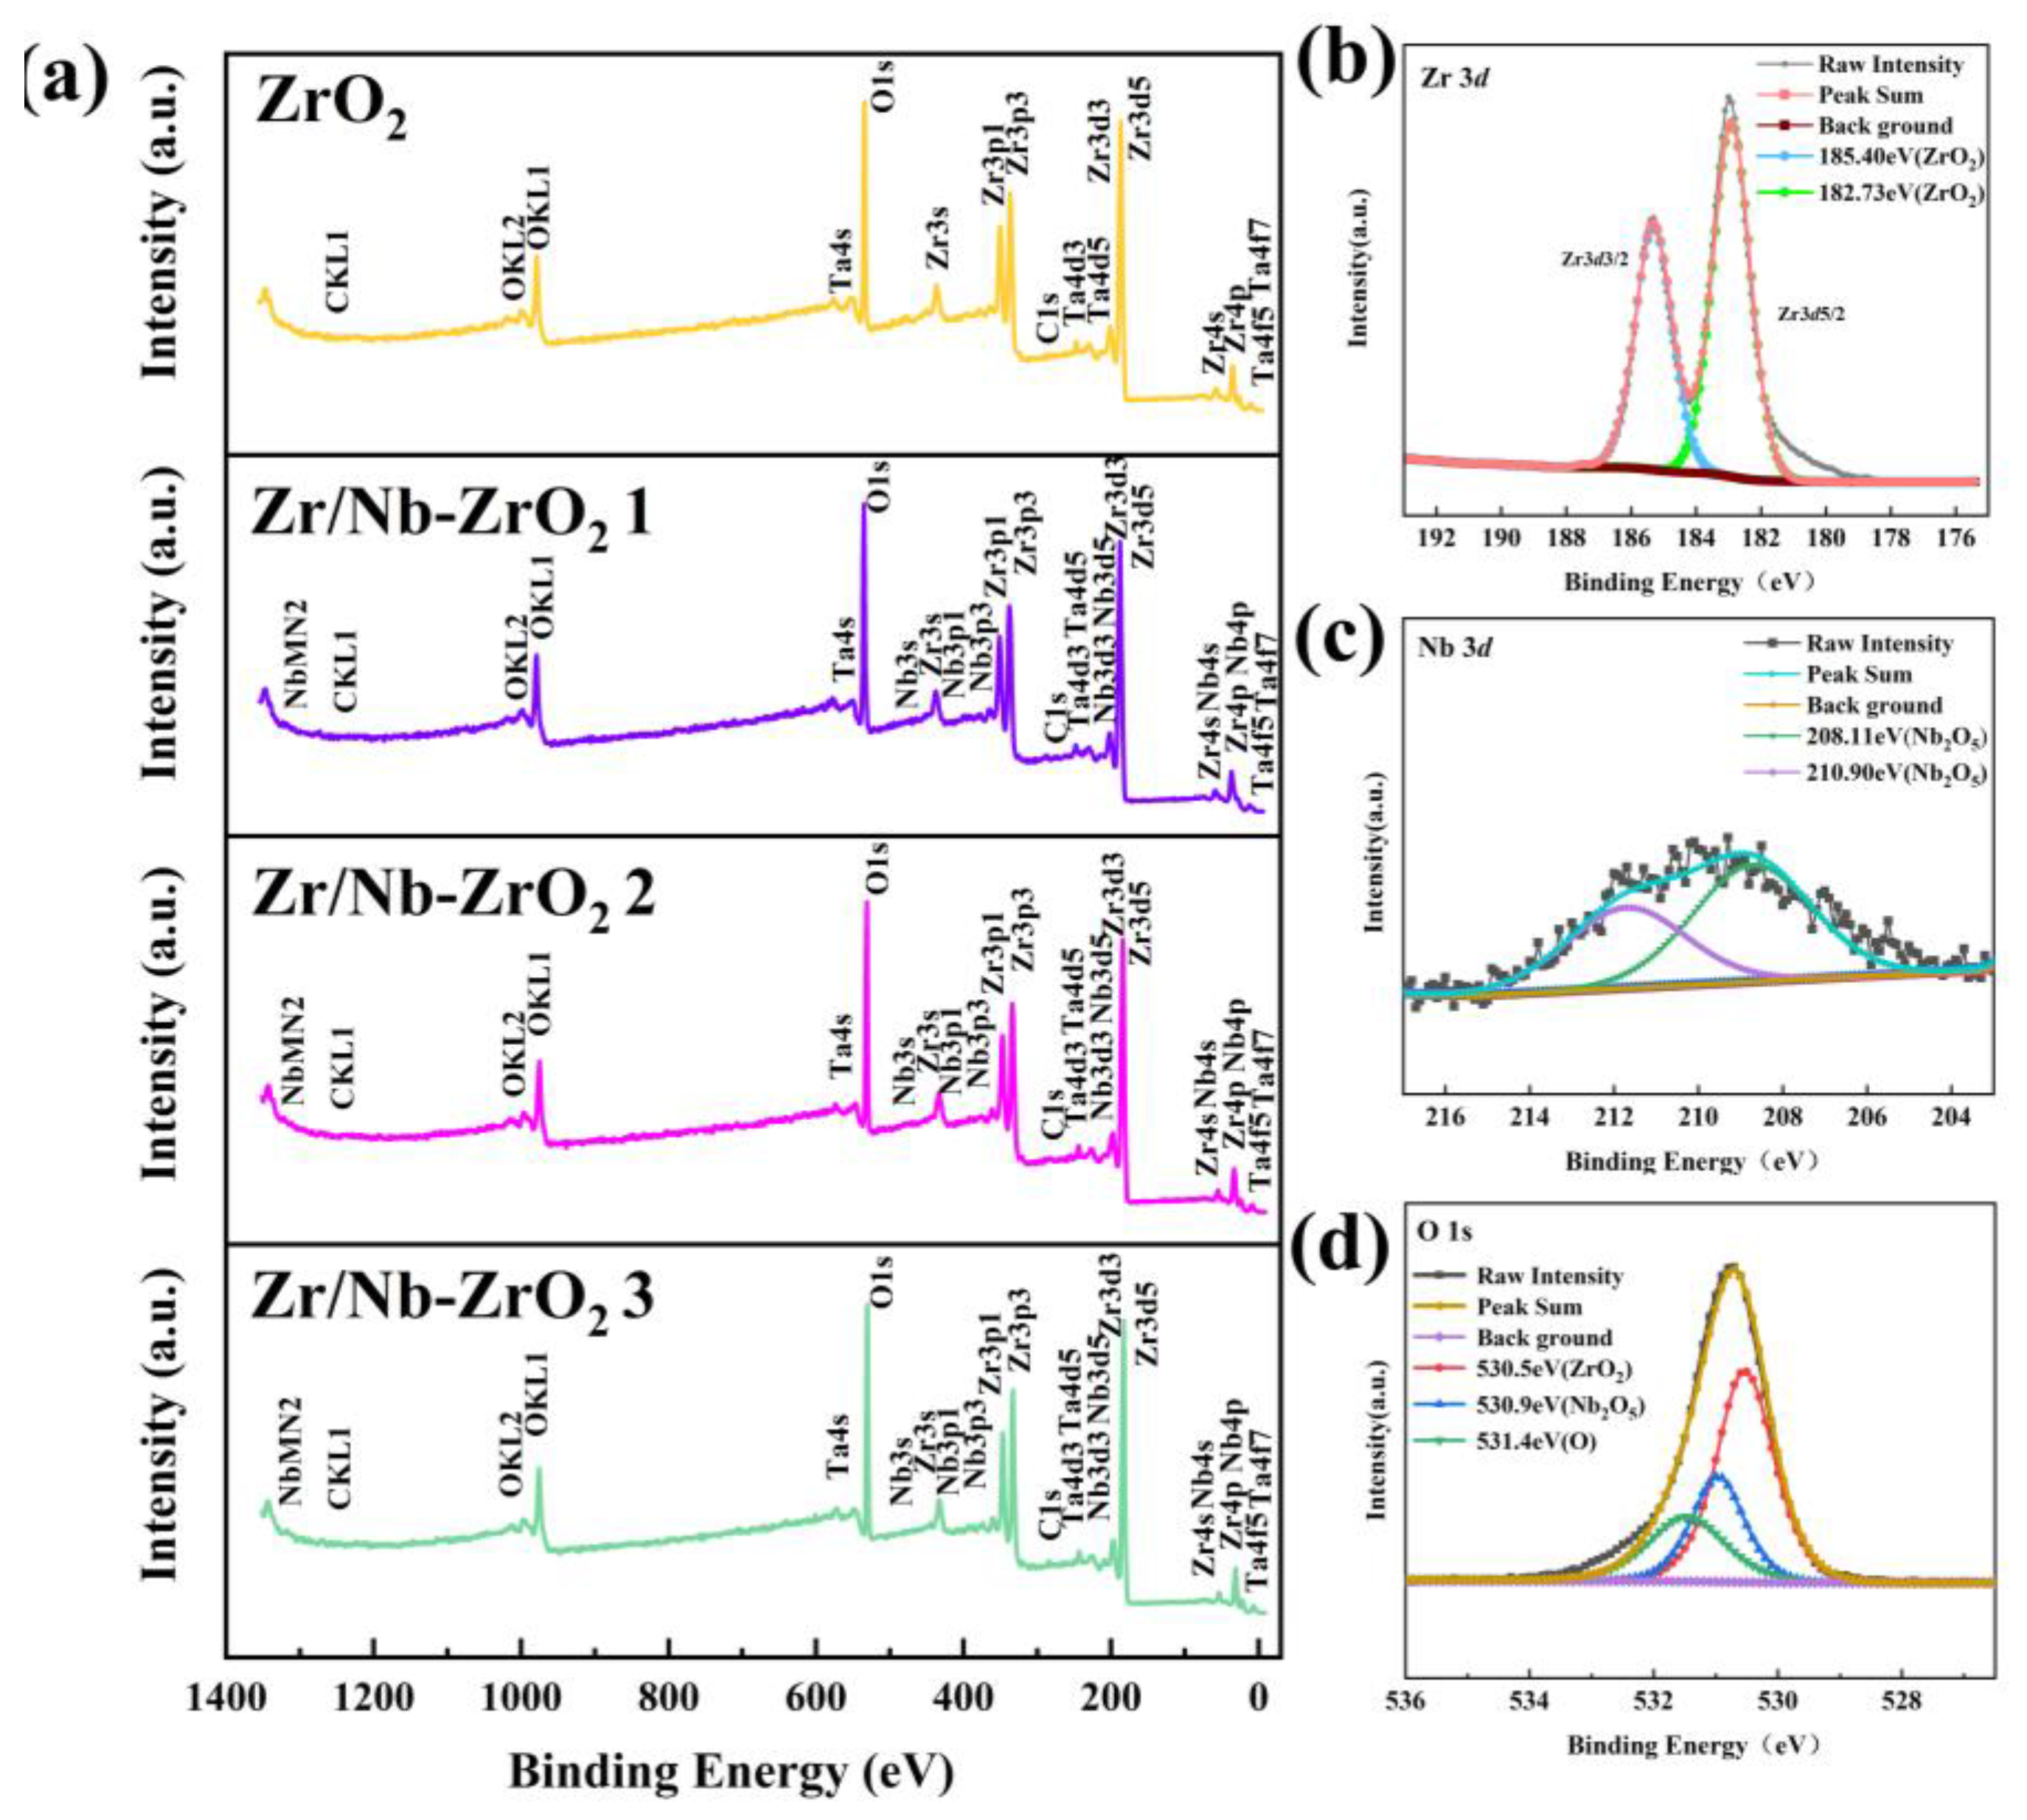
Figure 6.
Loading-unloading cycle of (a) ZrO2, (b) Zr/Nb-ZrO2 1, (c) Zr/Nb-ZrO2 2, (d) Zr/Nb-ZrO2 3, (d) Hardness of four groups of samples, (e) Elastic modulus of four groups of samples.
Figure 6.
Loading-unloading cycle of (a) ZrO2, (b) Zr/Nb-ZrO2 1, (c) Zr/Nb-ZrO2 2, (d) Zr/Nb-ZrO2 3, (d) Hardness of four groups of samples, (e) Elastic modulus of four groups of samples.
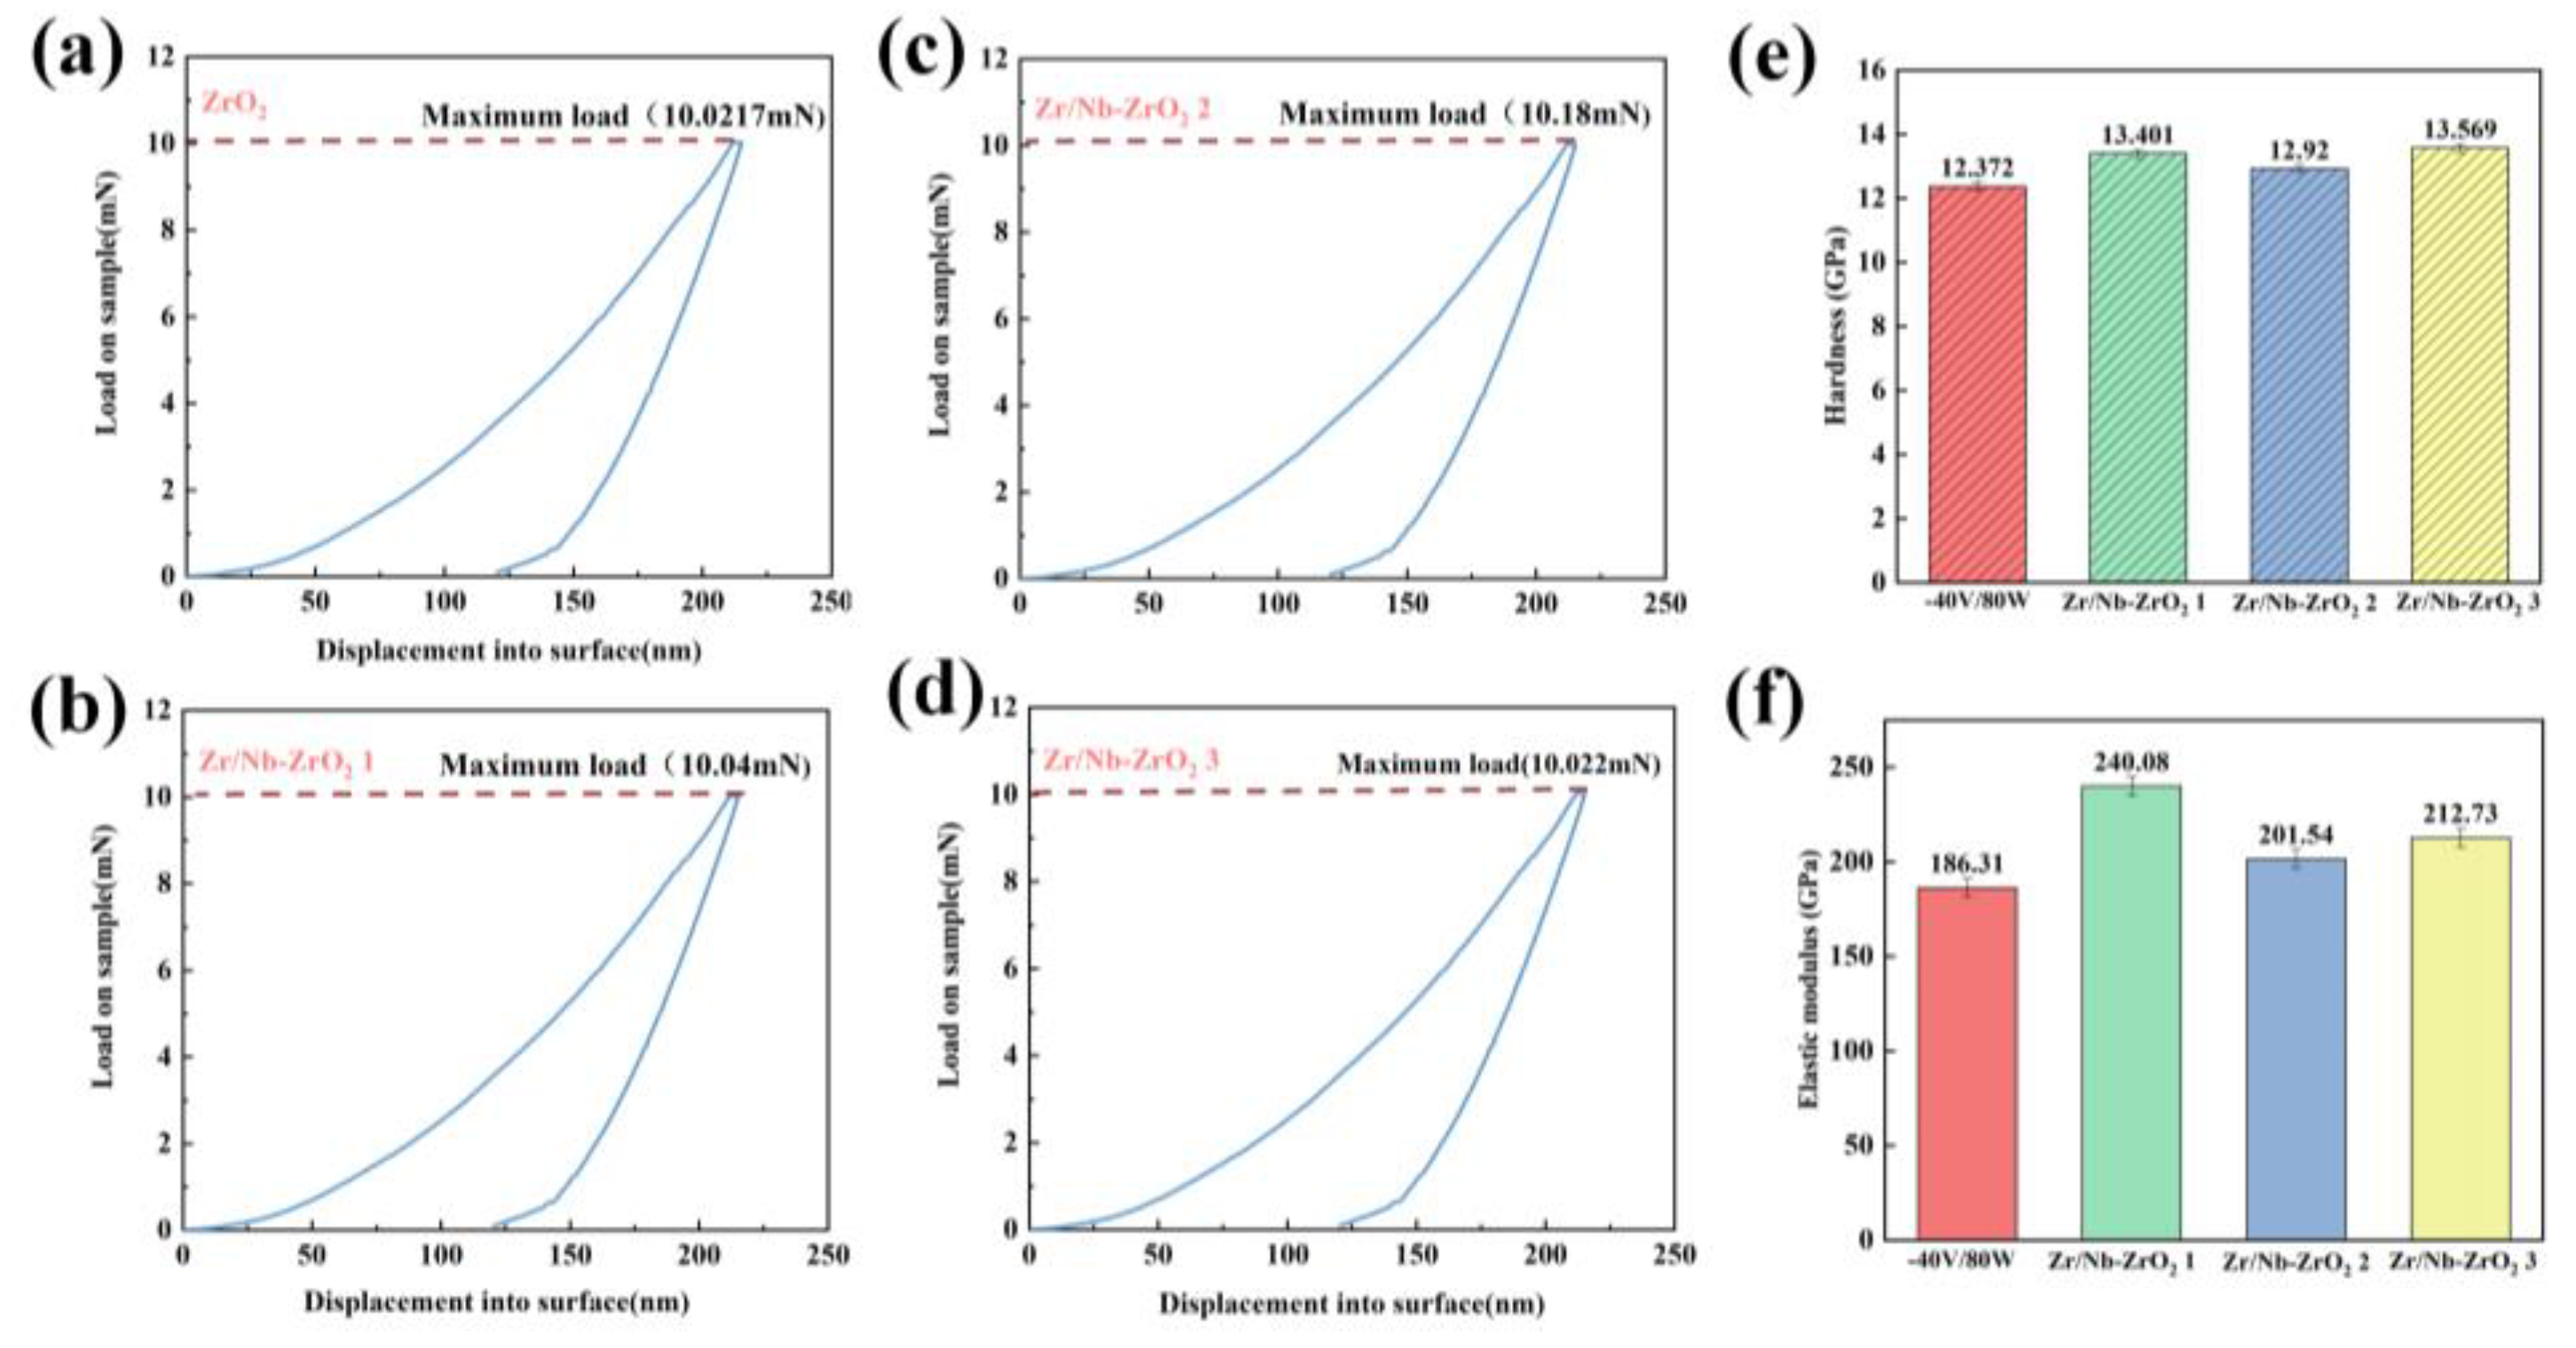
Figure 7.
Water contact angle histogram of five groups.
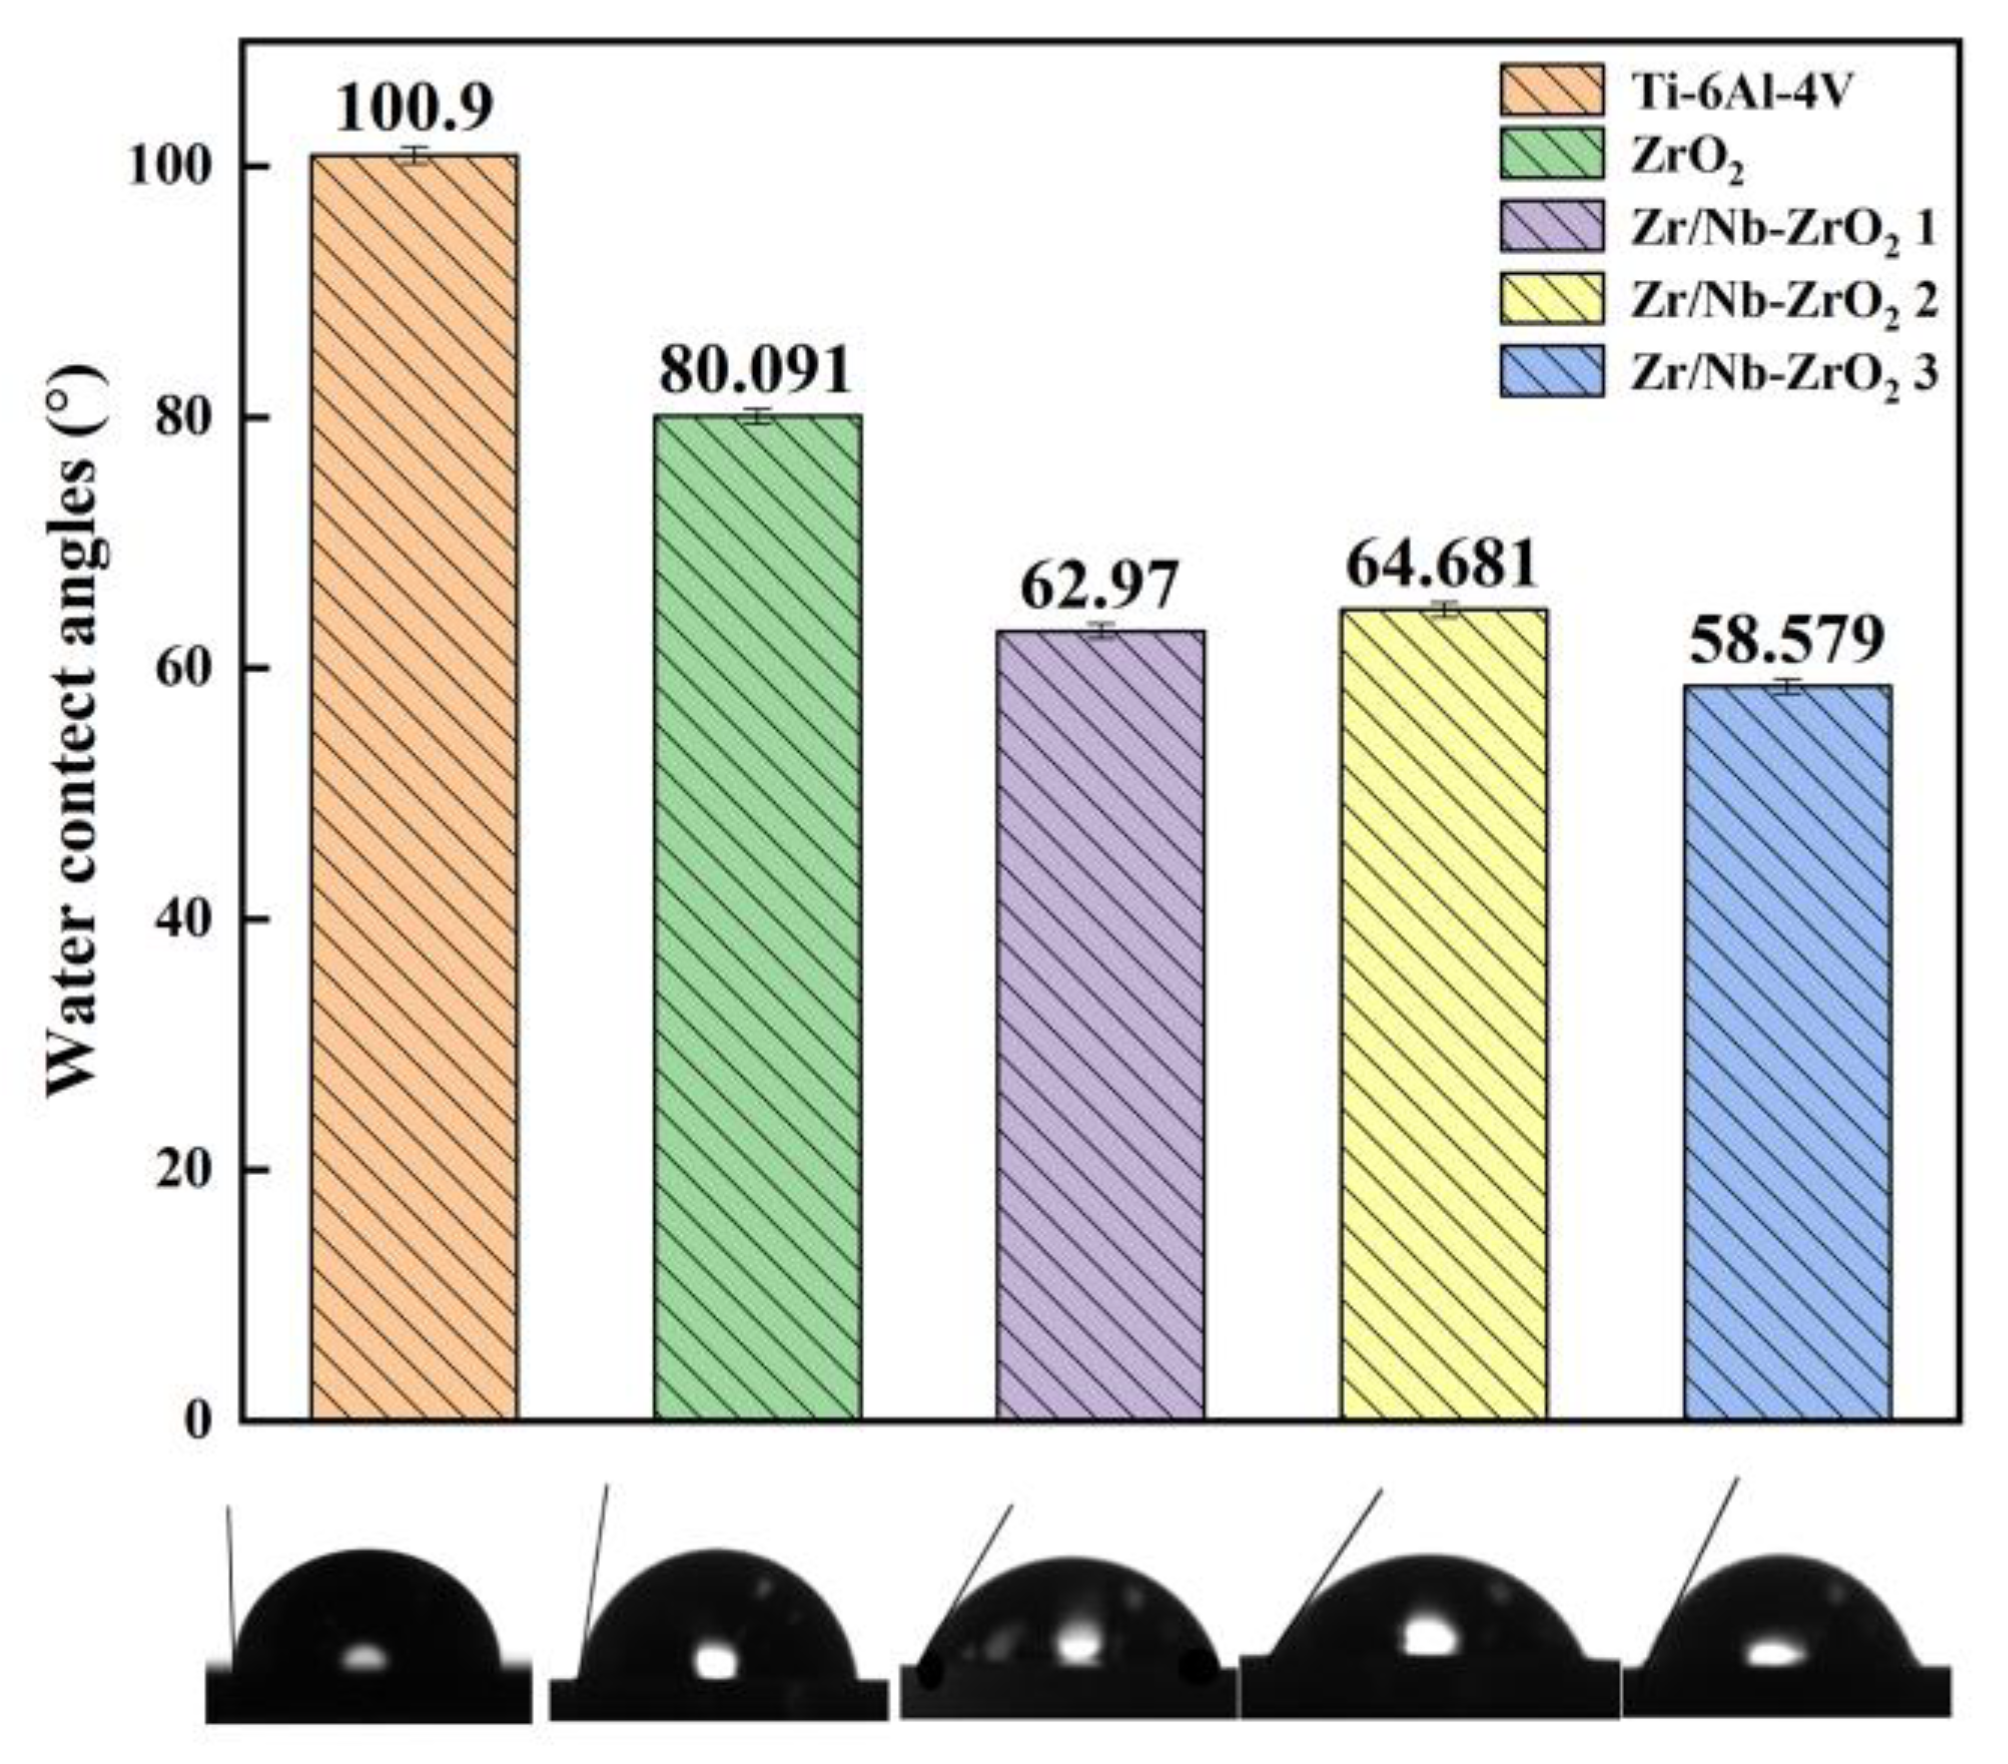
Figure 8.
Polarization curves of five sample groups.
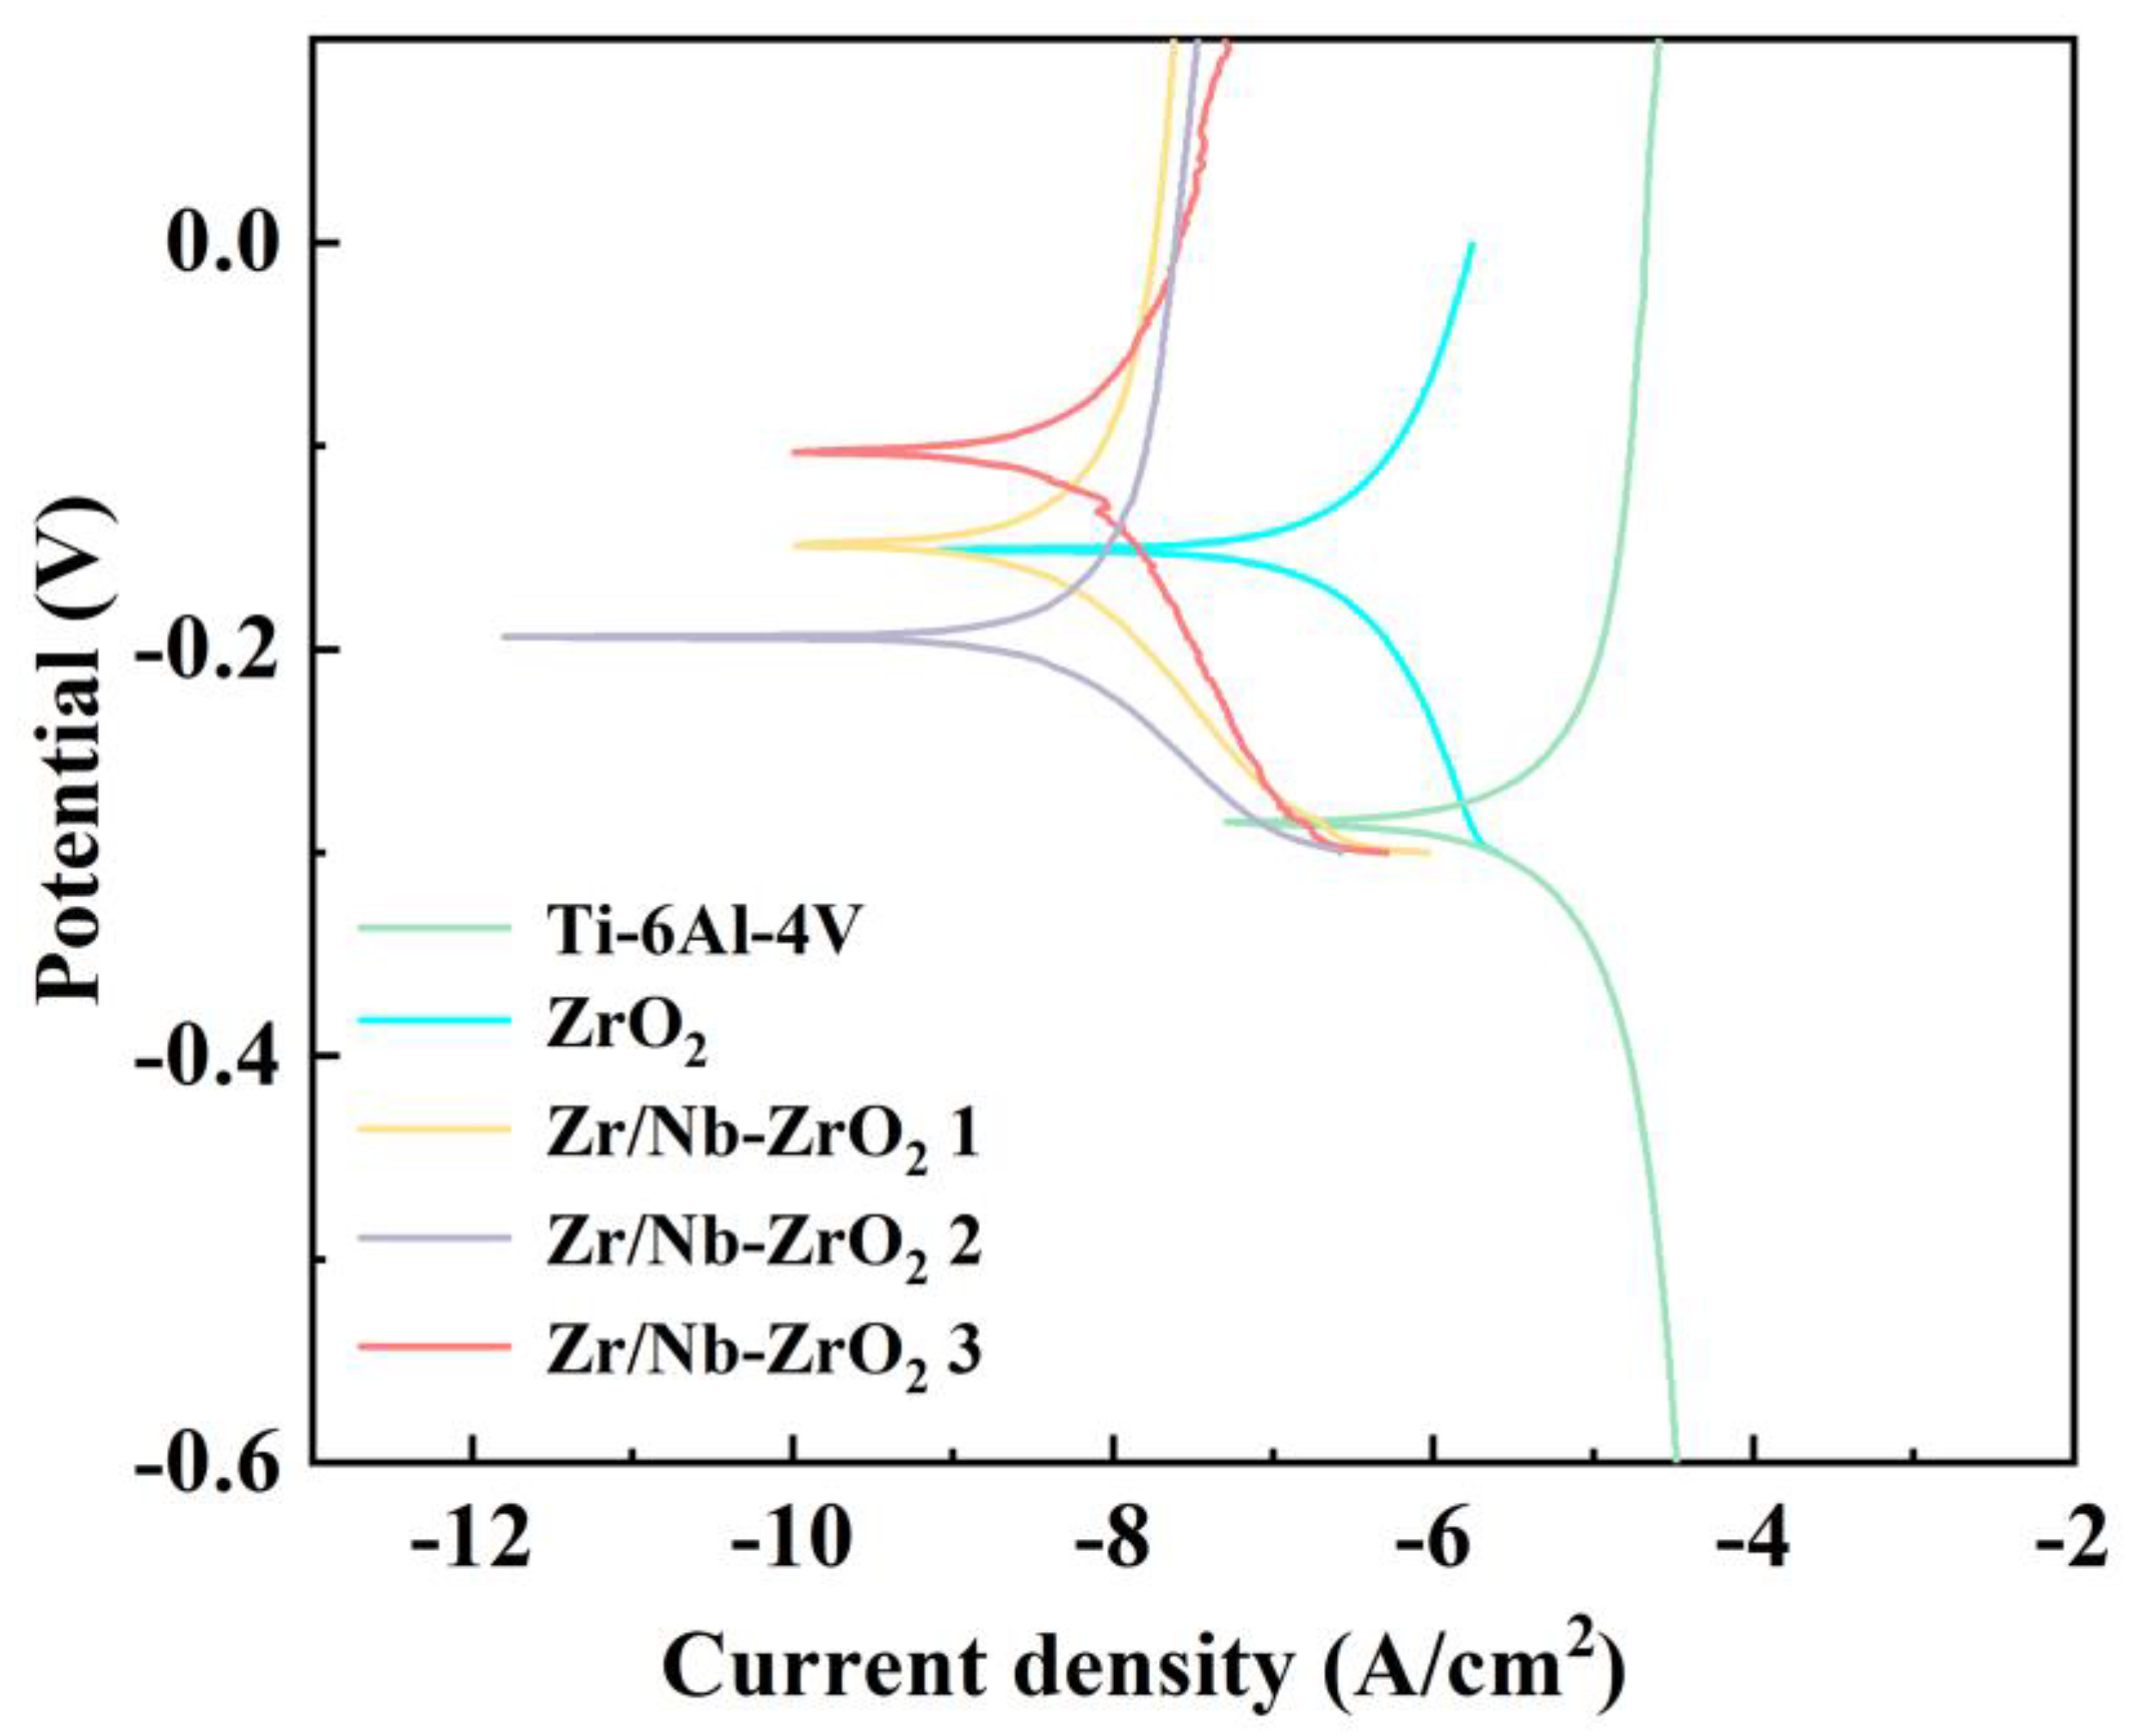
Figure 9.
(a) Cell diagram of the Zr / Nb doping model. Formation energy (b) and binding energy (d) of different Zr concentrations; formation energy (c) and binding energy of different Nb concentrations (e).
Figure 9.
(a) Cell diagram of the Zr / Nb doping model. Formation energy (b) and binding energy (d) of different Zr concentrations; formation energy (c) and binding energy of different Nb concentrations (e).
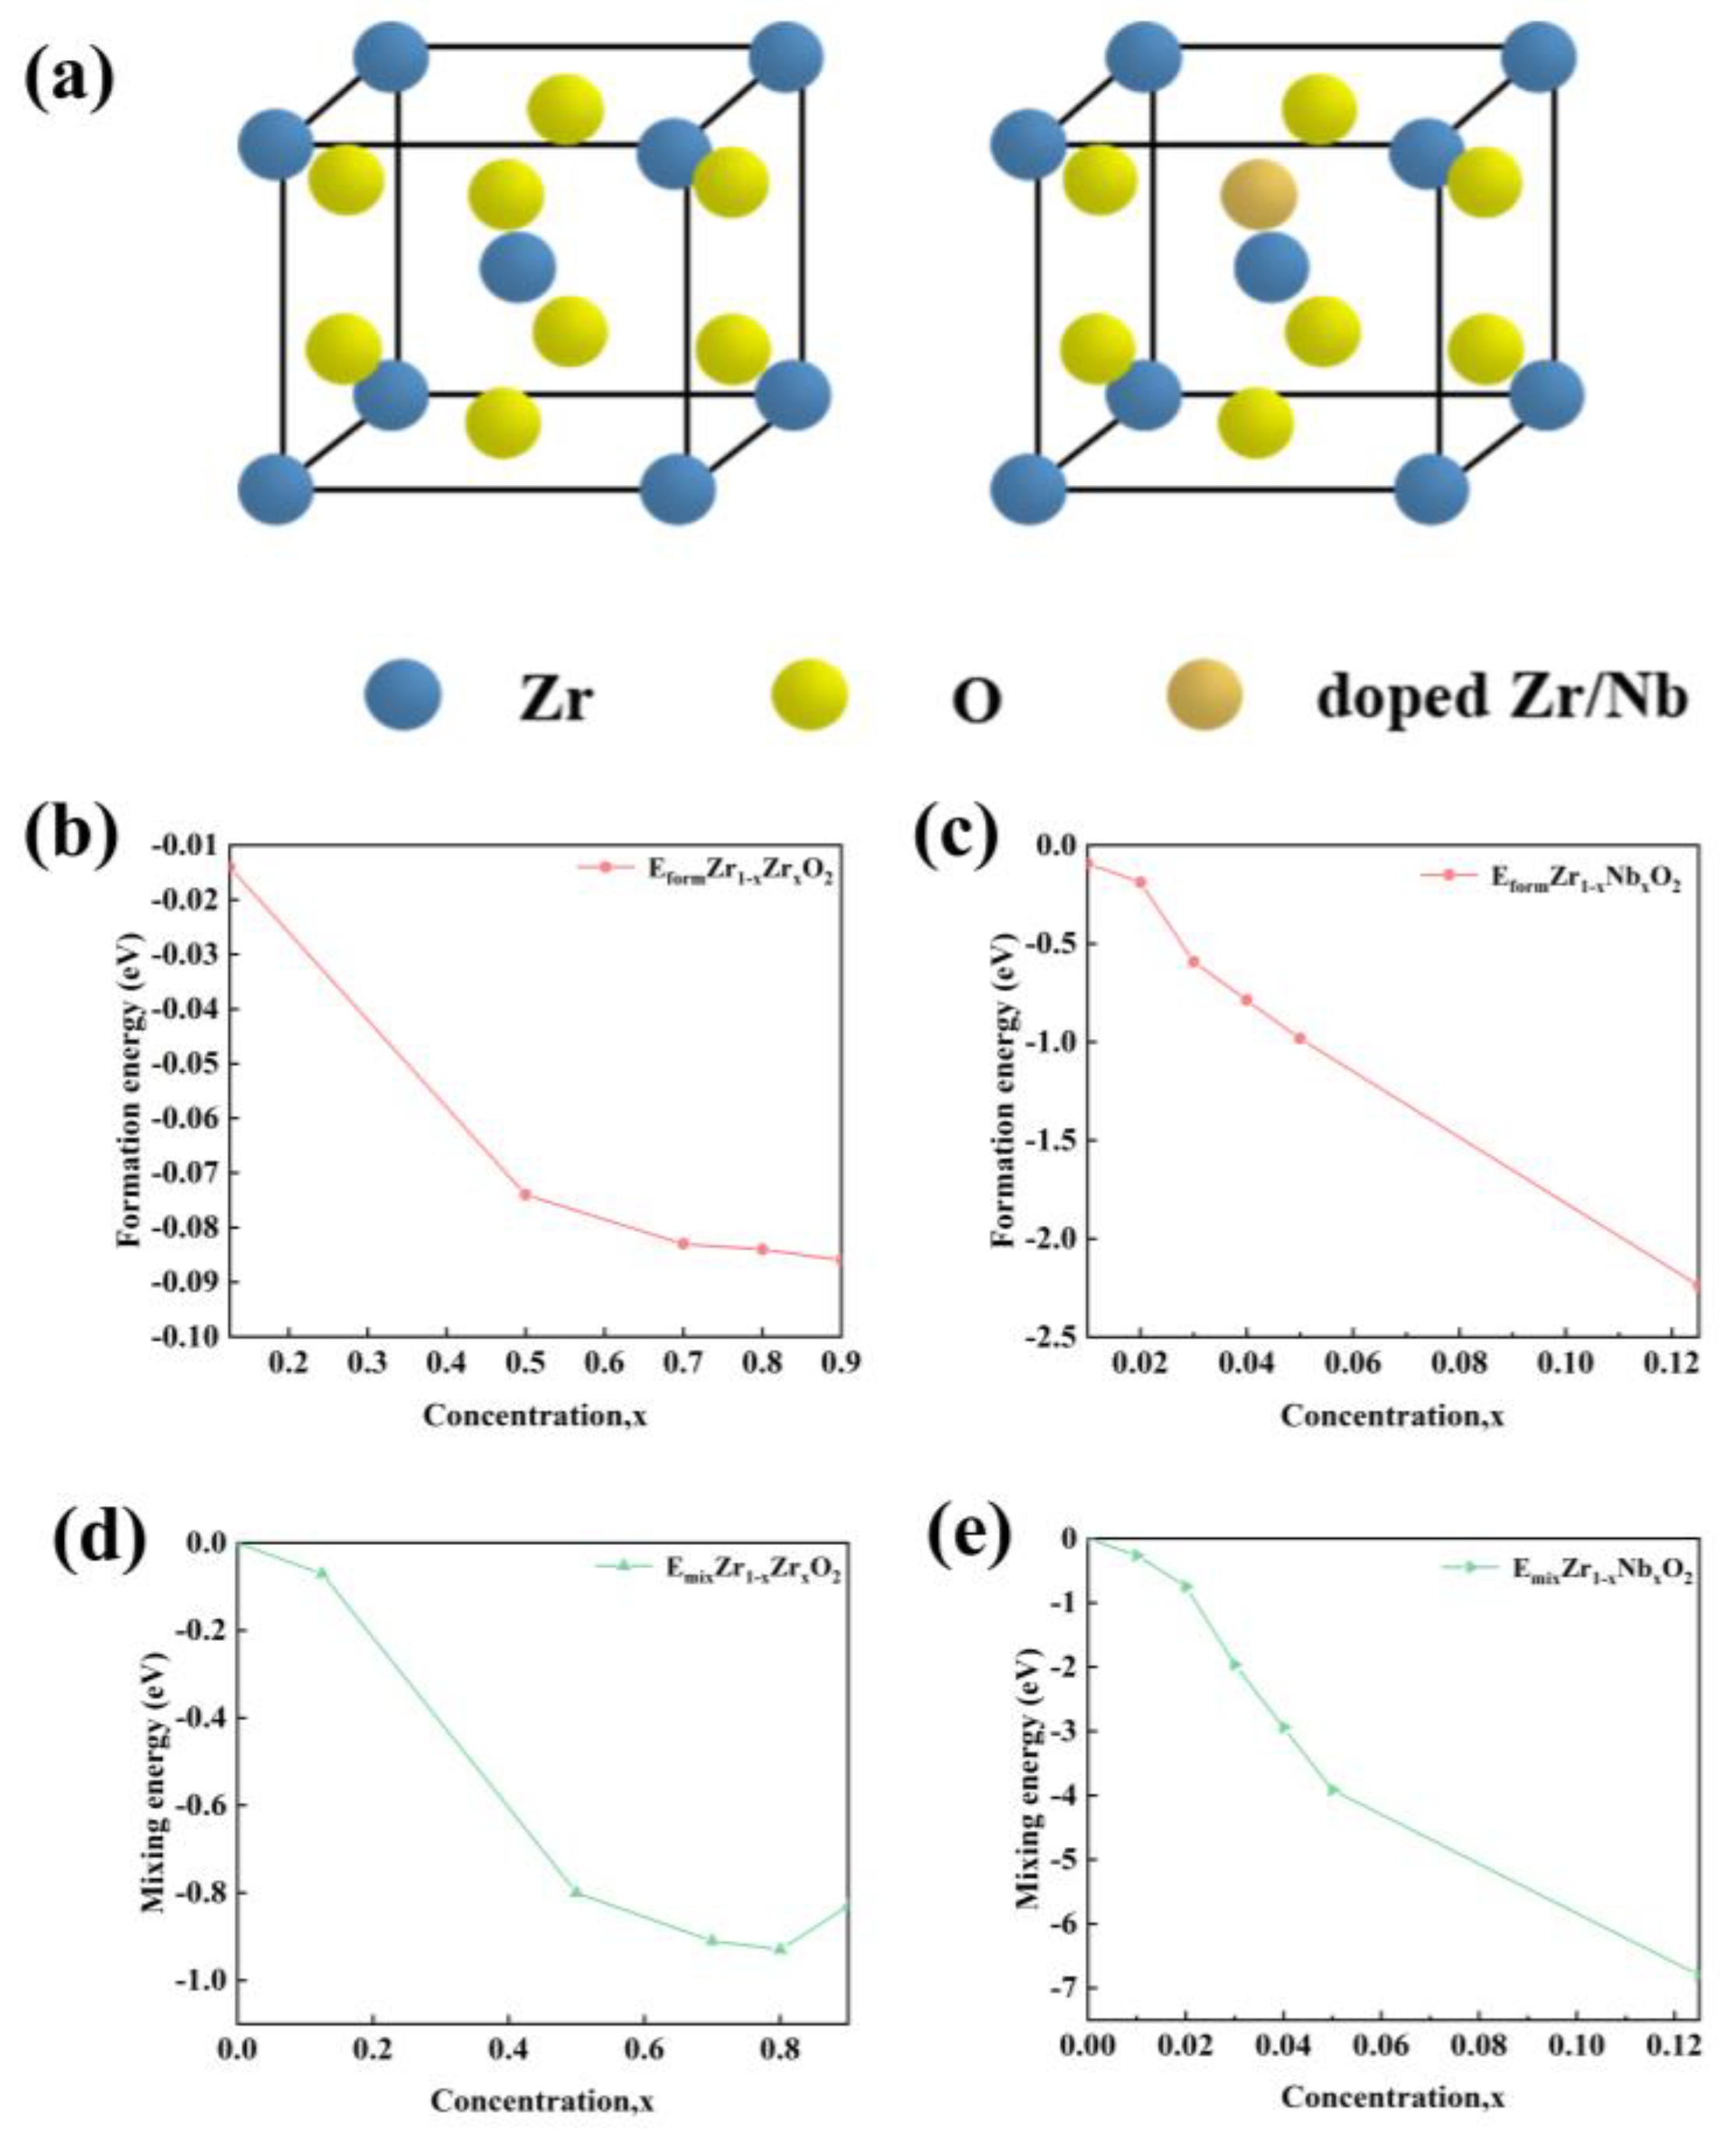
Figure 10.
B (a), G (c), E (e) with different Zr concentrations; B (b), G (d), E (f) with different Nb concentrations.
Figure 10.
B (a), G (c), E (e) with different Zr concentrations; B (b), G (d), E (f) with different Nb concentrations.
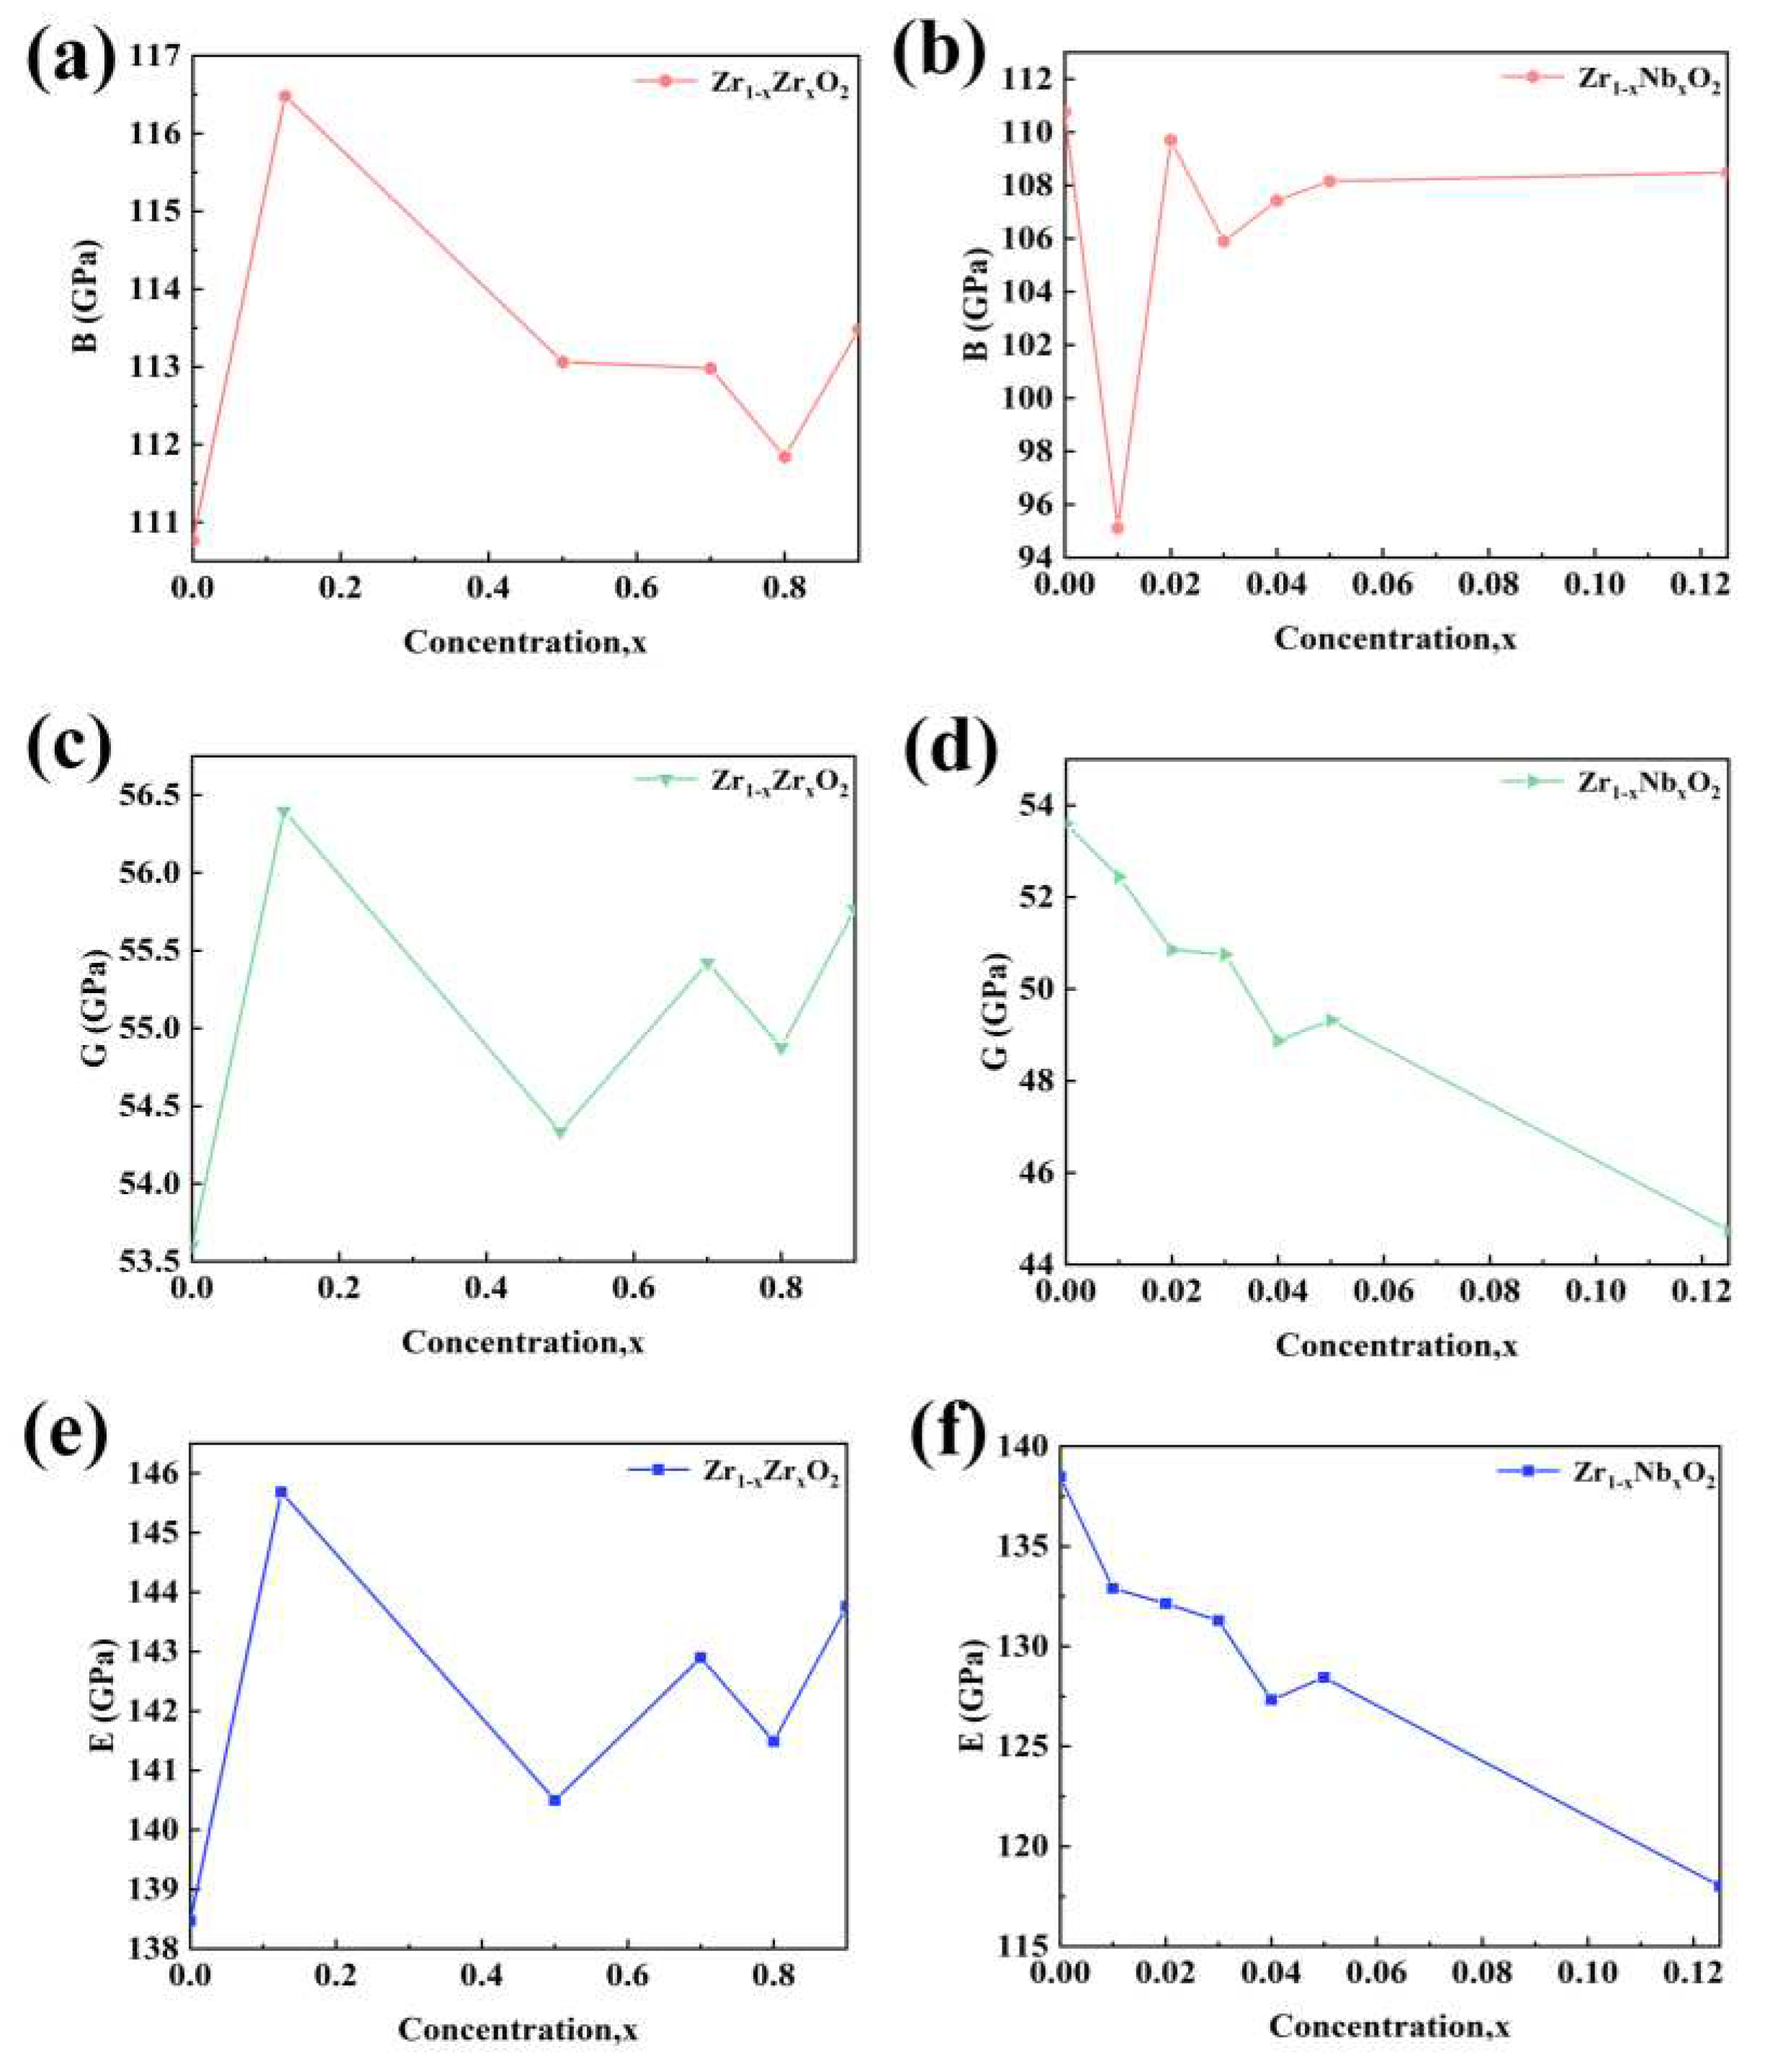
Figure 11.
Total density of states of the new system Zr/Nb-ZrO2, (a) Zr1-xZrxO2, (b) Zr1-xNbxO2.
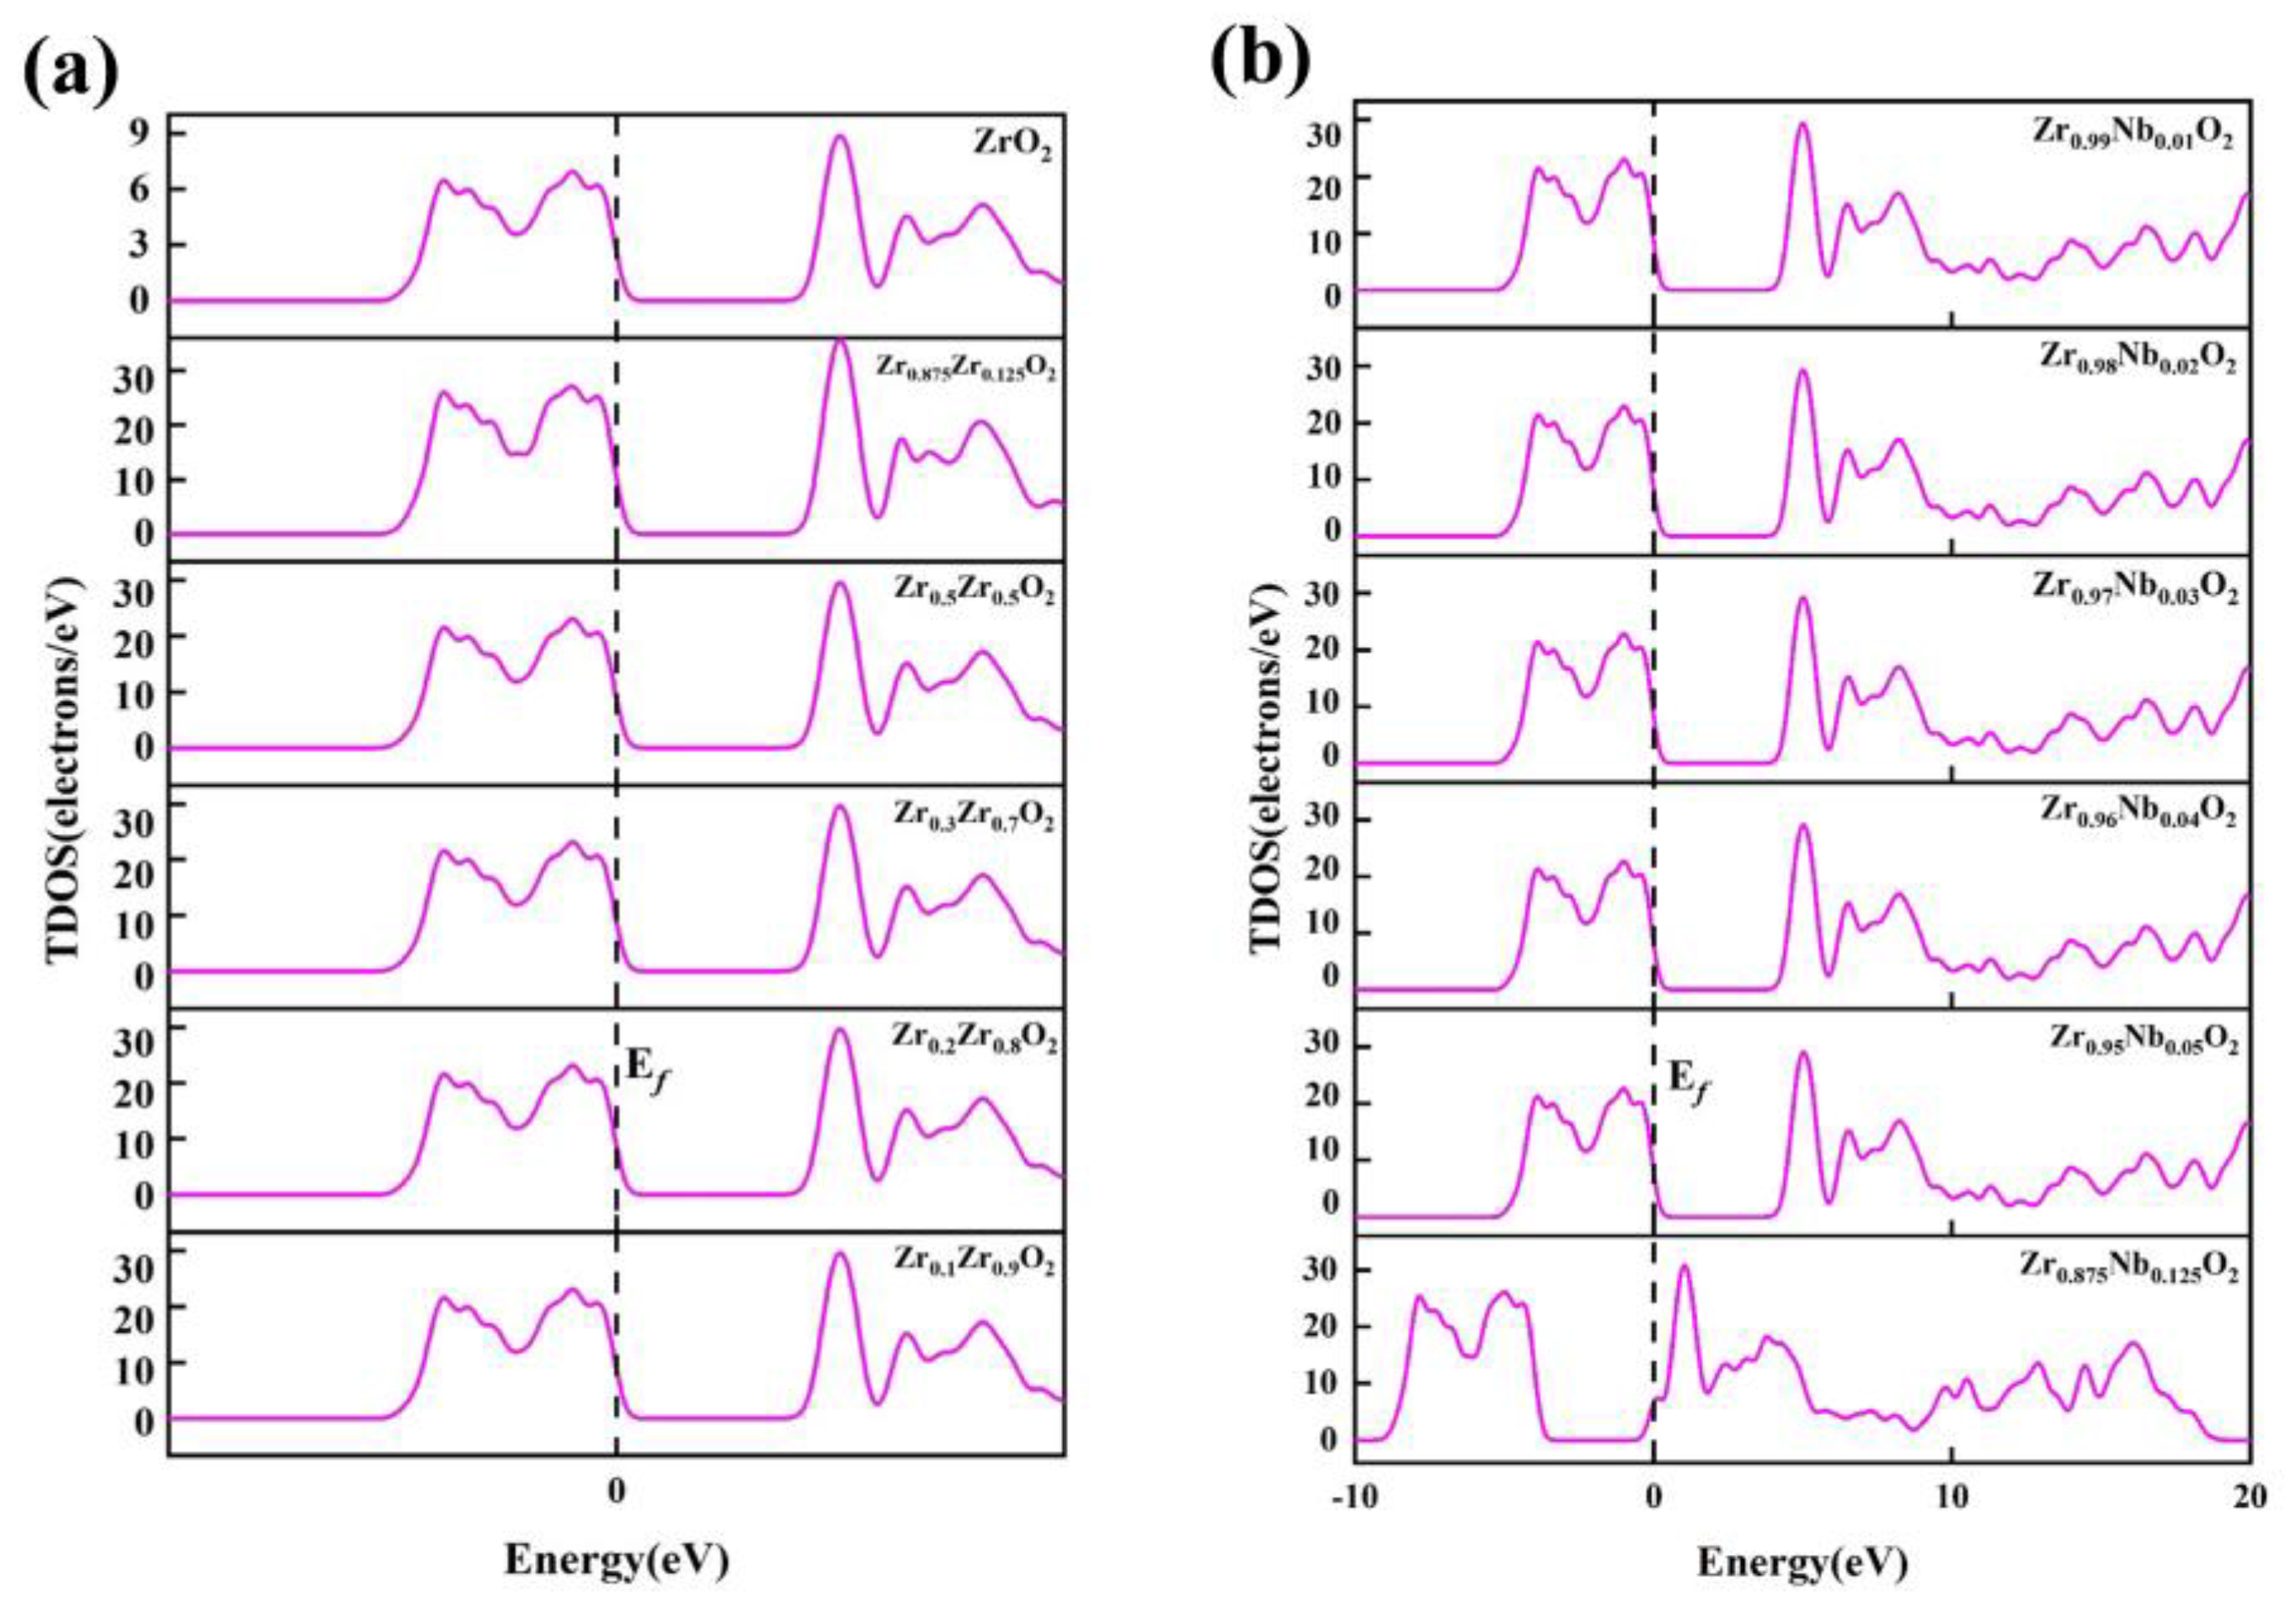
Figure 12.
Partial density of states (PDOS) of theZr1-xZrxO2 system, (a) Zr-PDOS, (b) O-PDOS.
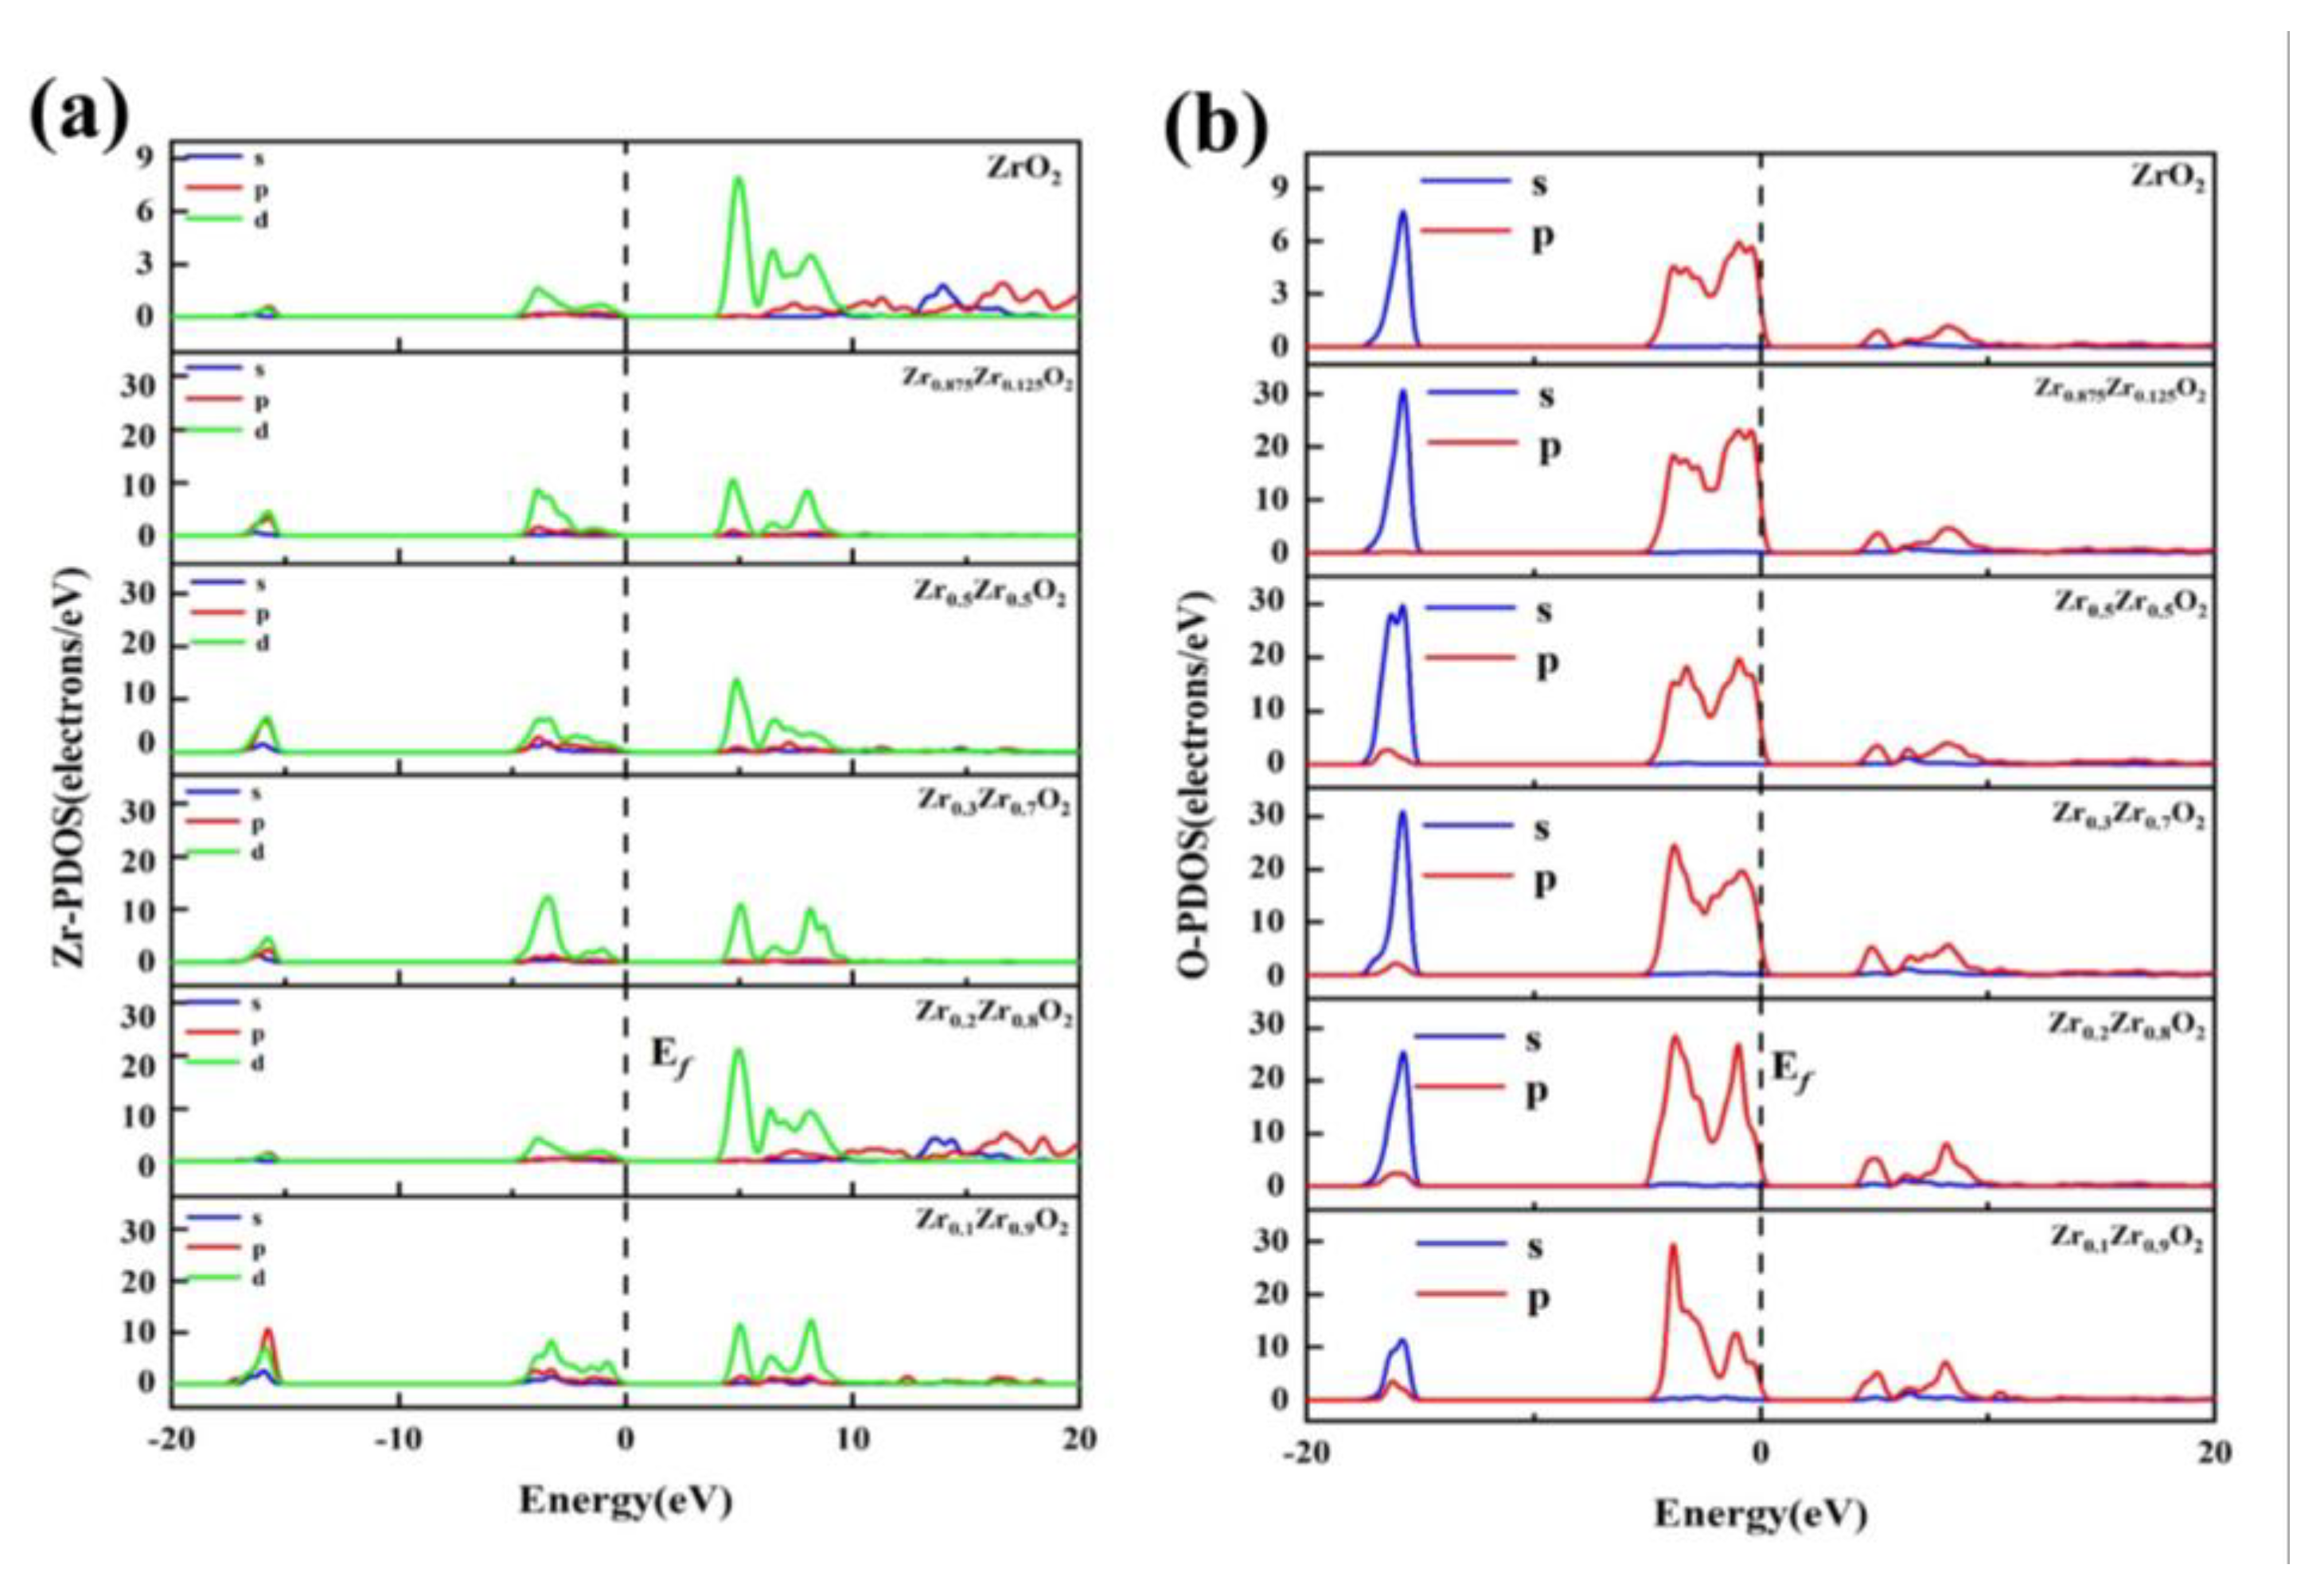
Figure 13.
Partial density of states (PDOS) of the Zr1-xNbxO2 system, (a) Zr-PDOS, (b) Nb-PDOS, (c) O-PDOS.
Figure 13.
Partial density of states (PDOS) of the Zr1-xNbxO2 system, (a) Zr-PDOS, (b) Nb-PDOS, (c) O-PDOS.
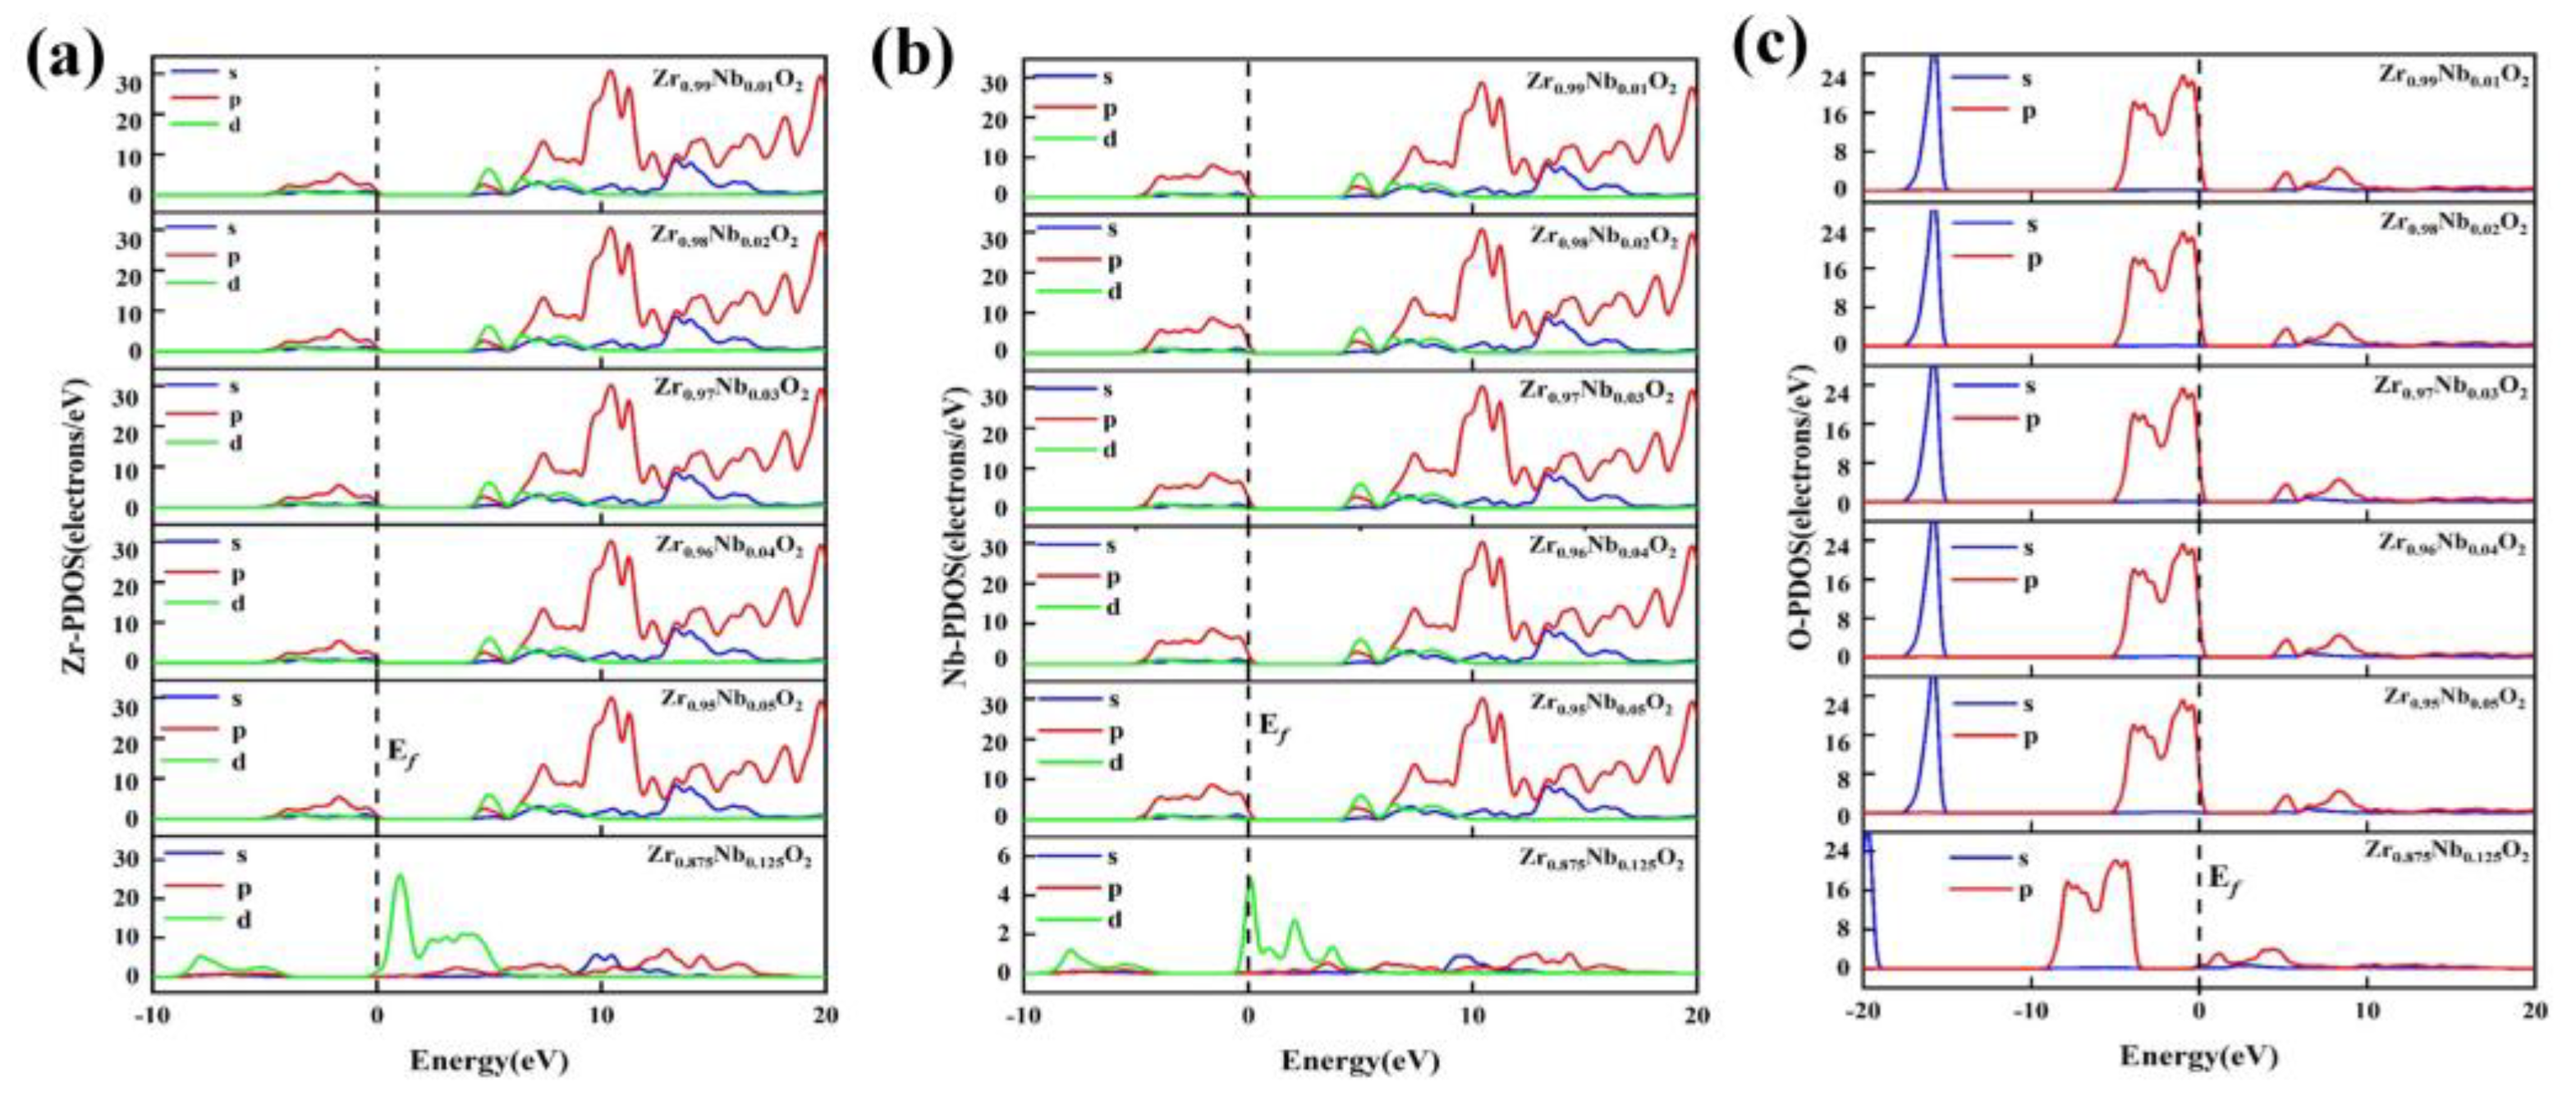

Table 1.
The experiment parameters of Zr/Nb-ZrO2 film by PIII.
| Experiment groups | Zr/Nb-ZrO2 1 | Zr/Nb-ZrO2 2 | Zr/Nb-ZrO2 3 |
|---|---|---|---|
| Voltage (kV) | -10 | -10 | -10 |
| Magnetic bias (V·s) | 10;10 | 10;10 | 10;10 |
| Pulse frequency (Hz) | 6 | 6 | 6 |
| Time (min) | 50 | 60 | 70 |
Table 2.
Atomic percent of Zr/Nb-ZrO2 film.
| Sample | Zr/Nb-ZrO2 1 | Zr/Nb-ZrO2 2 | Zr/Nb-ZrO2 3 |
|---|---|---|---|
| relative percent of Nb (%) | 0.8 | 0.59 | 1.02 |
Table 3.
The elastic constants of Zr1-xZrxO2.
| Elastic constant (Cij) | C11/GPa | C33/GPa | C44/GPa | C66/GPa | C12/GPa | C13/GPa | C16/GPa |
|---|---|---|---|---|---|---|---|
| ZrO2 | 307.26325 | 247.17315 | 7.35955 | 149.58625 | 192.09560 | 29.13135 | 0.00000 |
| Zr0.875Zr0.125O2 | 319.7102 | 288.5302 | 4.0011 | 148.59031 | 190.03261 | 31.00824 | 0.00000 |
| Zr0.5Zr0.5O2 | 310.56935 | 266.46950 | 4.17705 | 148.57445 | 190.16125 | 30.10005 | 0.00000 |
| Zr0.3Zr0.7O2 | 306.75590 | 278.66125 | 5.33245 | 148.53405 | 190.09675 | 25.60980 | 0.00000 |
| Zr0.2Zr0.8O2 | 305.07305 | 268.92370 | 6.56710 | 148.58300 | 191.29115 | 25.00220 | 0.00000 |
| Zr0.1Zr0.9O2 | 305.99720 | 281.37830 | 6.77485 | 148.60875 | 191.12020 | 25.85665 | 0.00000 |
Table 4.
The elastic constants of Zr1-xNbxO2.
| Elastic constant (Cij) | C11/GPa | C33/GPa | C44/GPa | C66/GPa | C12/GPa | C13/GPa | C16/GPa |
|---|---|---|---|---|---|---|---|
| ZrO2 | 307.26325 | 247.17315 | 7.35955 | 149.58625 | 192.09560 | 29.13135 | 0.00000 |
| Zr0.99Nb0.01O2 | 309.27665 | 193.16750 | 3.83840 | 149.82455 | 149.82455 | 26.96880 | 0.00000 |
| Zr0.98 Nb 0.02O2 | 313.15130 | 223.66395 | 1.52080 | 148.88480 | 194.40615 | 30.81195 | 0.00000 |
| Zr0.97 Nb 0.03O2 | 308.52965 | 215.09260 | 3.47465 | 147.32880 | 192.49150 | 22.26545 | 0.00000 |
| Zr0.96 Nb 0.04O2 | 308.43940 | 200.82345 | 4.81770 | 146.07035 | 199.26405 | 29.50925 | 0.00000 |
| Zr0.95 Nb 0.05O2 | 306.19245 | 212.80280 | 3.84995 | 145.51165 | 201.03695 | 26.18755 | 0.00000 |
| Zr0.875 Nb 0.125O2 | 274.79185 | 203.88915 | 8.89375 | 138.21800 | 215.84545 | 32.97110 | 0.00000 |
Disclaimer/Publisher’s Note: The statements, opinions and data contained in all publications are solely those of the individual author(s) and contributor(s) and not of MDPI and/or the editor(s). MDPI and/or the editor(s) disclaim responsibility for any injury to people or property resulting from any ideas, methods, instructions or products referred to in the content. |
© 2023 by the authors. Licensee MDPI, Basel, Switzerland. This article is an open access article distributed under the terms and conditions of the Creative Commons Attribution (CC BY) license (http://creativecommons.org/licenses/by/4.0/).
Copyright: This open access article is published under a Creative Commons CC BY 4.0 license, which permit the free download, distribution, and reuse, provided that the author and preprint are cited in any reuse.


