
Submitted:
12 September 2023
Posted:
13 September 2023
You are already at the latest version
Abstract
Background and aims: Only one cohort study exists on the incidence of the risk of malnutrition (RM) in older adults, though numerous cross-sectional –and that cohort research– have reported several risk factors associated with the prevalence and incidence of this condition. However, alterations of body composition and impaired physical performance as exposition variables of RM have not been explored. This study assessed the incidence of RM and determined its association with excess fat mass, low total lean tissue, gait speed, and handgrip strength as exposition variables for RM in community-dwelling older adults.
Methods: This is a secondary analysis in older adults (≥60 years old) derived from the study “Frailty, dynapenia, and sarcopenia in Mexican adults (FraDySMex)” a prospective cohort project conducted from 2014 to 2019 in Mexico City. At baseline, volunteers underwent body composition analysis and physical performance tests. Several covariates were identified through comprehensive geriatric assessment. At baseline and follow-up, RM was assessed using the long form of the mini nutritional assessment (MNA-LF) scale. Associations between the exposition variables and RM were assessed by multiple logistic regression.
Results: The cohort included 241 subjects. Average age was 75.6±7.8 years; 83.4% were women. The mean follow-up period was 4.1 years, during which 28.6% of subjects developed RM. This condition was less likely to occur in subjects with excess fat mass index, even after adjusting for several covariates. RM was also more likely to occur in subjects with low total lean tissue index, according to both an unadjusted model and after adjusting for the corresponding variables. Regarding the association between RM and gait speed, RM was also more likely to occur in subjects with low gait speed according to both the unadjusted and adjusted models. Similar results were found for RM in relation to low handgrip strength; however, after adjusting for the associated covariates, models 1 and 2 no longer reached the level of significance.
Conclusion: The risk of malnutrition diagnosed by MNA-LF was significantly less likely to occur among subjects with excess fat mass, but possibility was significantly higher in those with low total lean tissue and low gait speed after 4.1 years of follow-up in community-dwelling older adults. These results highlight that excess fat mass, low total lean tissue, and low gait speed are first than risk of malnutrition and not vice versa.
Keywords:
nutrition disorders
; risk factors
; body composition
; physical functional performance
; independent living
; and aged
; 80 and over
1. Introduction
Older adult populations are more susceptible to developing risk of malnutrition (RM). Currently, pooled analytical data on RM in older subjects highlights the risk of malnutrition as a serious public health problem in aged populations [1]. That analysis reported a prevalence of 46.2% in the geriatric population in different settings on five continents (mostly European countries), and 31.9% among community-dwelling older adults. The latter figure is close to the extreme range of 30.5% reported for community-dwelling older adults [2]. High prevalence has also been reported for other non-Caucasian community-dwelling older adult populations [3,4,5,6]. Importantly, the studies included in the pooled data analysis, and other research on the prevalence of RM in the literature, used the long form of the mini nutritional assessment (MNA-LF) scale to assess RM. This scale, generated and validated in older adults [7], has shown a sensitivity and specificity of 96% and 98%, respectively, for diagnosing RM, relative to conventional nutritional assessments and clinic diagnoses [8].
In Mexico, prevalence of RM in community-dwelling older adults ranging from 30.3 to 50%, assessed by the MNA-LF, are reported in cross-sectional studies based on either probabilistic [9] or non-probabilistic sampling [10,11,12,13,14]. A recent study of a national level sample of older adults reported a prevalence of 40.4% using the modified short version of the MNA [15]. All these studies concur in showing high prevalence of RM in community-dwelling older Mexican adults. Regarding to incidence, a cohort study of older Swedish adults found incidence of RM of 8.2, 16.1, 10.8, and 8.2% at 1, 2, 3, and 4-years follow-up, respectively [16]. Overall, RM now appears to constitute a challenging public health issue due to both its current high prevalence and the probability of high incidence in the coming years. Although RM is not listed in the International Disease Classification, it has been related independently to numerous adverse clinical outcomes, such as loss of functionality, impaired physical performance [10,17,18], sarcopenia [19,20], and mortality [18,21]. Some related studies recognize the benefits of nutritional intervention in older adults at risk for RM in distinct health care settings, as it can have a positive effect on energy intake and body weight [22].
Several variables have been associated with RM diagnosed by the short form of the mini nutritional assessment or by the MNA-LF in several cross-sectional studies of community-dwelling older adults [3,4,9,10,11,12,15,23,24], one cohort study [16], and a systematic review and meta-analysis of observational research [25]. However, the possible association between the alterations of body composition, particularly excess fat mass and low total lean tissue indices, on the one hand, and impaired physical performance measured by low gait speed and low handgrip strength as exposition variables, on the other, and RM has not yet been explored thoroughly. It is widely believed that these factors can contribute to the early development of RM through diverse mechanisms. In this context, the present study assessed the incidence of the risk of malnutrition and its association with the excess fat mass and low total lean tissue indices, and low gait speed and handgrip strength as exposition variables in community-dwelling older adults after 4.1 years of follow-up.
2. Materials and Methods
2.1. Data sources and study design
This is a secondary analysis based on the primary data generated in the project: “Frailty, dynapenia, and sarcopenia in Mexican adults” (FraDySMex), a prospective cohort study of a non-representative sample of community-dwelling men and women subjects ≥50 years old, conducted from 2014 to 2019. The aim of the original project was to assess body composition by dual-energy X-ray absorptiometry (DXA) and physical performance using the short physical performance battery and measures of muscle strength by dynamometry, to diagnose osteoporosis, dynapenia, frailty, and sarcopenia. In addition to the body composition and physical performance measures, volunteers underwent a health and nutritional status evaluation and other functional measurements. Social and demographic characteristics at baseline were also recorded as part of the Comprehensive Geriatric Assessment (CGA). The study was reviewed and approved by the Ethics Committee of the Angeles Mocel General Hospital, and registered at Mexico’s National Institute of Geriatrics (DI-PI-002/2014). The protocol is in full accordance with the ethical standards established in the 1964 Helsinki Declaration with amendments. All subjects signed an informed consent form.
The methodology for selecting the study population has been published previously [13,26], so here we provide only a brief description. The first round (October-December 2014) consisted in assessing volunteers. In the second round (October-December 2015), new subjects were added and a proportion of the individuals who participated in the first round were reevaluated. The third round (October-December 2019) saw the inclusion of new subjects and reevaluations of some of the people who participated in the first and second rounds. All procedures in all rounds were performed in the Functional Evaluation Research Laboratory at Mexico’s National Institute of Geriatrics and the Older Adult Evaluation Center of the Universidad Iberoamericana in Mexico City, where subjects underwent a the aforementioned series of objective evaluations, performed by a medical team made up of a physician, a nutritionist, a psychologist, physical therapists, physical rehabilitators, social workers, and geriatricians, all previously, and fully, informed of the study’s aims.
2.2. Study population
All participants were community-dwelling adults and older adults from two municipalities (of a total of 16) in southeast Mexico City (Magdalena Contreras and Álvaro Obregón), characterized by high poverty levels and older populations. Subjects were invited regardless of their health, mental, nutritional, and functional status via home visits by a psychologist or social worker, or through flyers left in churches, seniors’ community centers, social security centers, and health clinics in the aforementioned places.
No institutionalized individuals or potential subjects with an acute or chronic disease that could affect the measurements required by the study protocol were not invited during recruitment. Potential volunteers had to reach the installations or laboratories on their own. Upon arriving, they underwent a cognitive assessment, and the mini-mental state examination (MMSE) was applied. Subjects had to be able to answer the study questionnaires by themselves. If they had MMSE scores of 10 points or less [27], they were assisted by the caregiver. All subjects included at baseline with complete data were contacted by phone and home visits at follow-up and invited to participate in the second assessment.
Baseline data were collected from October 2014 to December 2015, while follow-up data were gathered from October-December 2019. At baseline, 540 potential men and women subjects were included. The inclusion criteria for the present analysis were men and women subjects ≥60 years old. Subjects at baseline and follow-up had to have the measurements required to test the hypothesis variables. Furthermore, the RM assessed by the MNA-LF, and all data collected in the CGA at baseline such as the cognitive function assessments, record of depressive symptoms, comorbidity, smoking and alcohol consumption, and the number of medications taken. Functional status was assessed by the basic activities of daily living (BADL) and instrumental activities of daily living (IADL) scales. Evaluations of physical performance were based on handgrip strength and gait speed, and the social and demographic characteristics were also assessed, and body composition by DXA. The exclusion criteria before follow-up were potential subjects with incomplete files, individuals <60 years of age, and all those diagnosed with RM at baseline by the MNA-LF.
2.3. Risk of malnutrition as the main response variable
At both baseline and follow-up, RM was assessed by the MNA-LF scale [7] and applied by trained personnel. During face-to-face interviews, all volunteers were asked about their lifestyle, medications, mobility, signs of depression or dementia, the number of meals taken per day, food and fluid intake, autonomy of feeding, and self-perceptions of their health and nutrition. They then underwent an anthropometric assessment because the MNA-LF requires data on body weight, height, and arm and calf circumference measurements. Participants’ nutritional status was classified according to their MNA-LF scores: <17, malnutrition or undernutrition; 17-23.5, risk of malnutrition; and ≥24, normal nutritional status [7]. RM, as the main response variable or outcome, was coded as categorical variable. For this analysis, the MNA-LF was dichotomized into well-nourished (24-30 points) and at risk for malnutrition (<17 points), since only nine individuals had mal- or undernutrition.
2.4. Anthropometry
The anthropometric variables of body weight and height were measured to the nearest 0.1 kg and 0.1 cm, respectively, using a SECA mBCA 514 scale (MFBIA; SECA®, Hamburg, Germany) and a SECA 264 Free-Standing Wireless 360 Stadiometer (SECA®, Hamburg, Germany). BMI was calculated based on these measurements. Arm and calf circumferences were measured according to ISAK technique. The BMI and arm and calf circumferences were incorporated into the MNA-LF. The BMI was also used to diagnose overweight and obesity [28]. All variables were measured by trained personnel as part of the anthropometry protocol.
2.5. Body composition measured by DXA
At baseline, whole and regional body composition was measured in fasting conditions by DXA (Hologic Discovery-WI, Hologic Inc, Bedford, MA). Volunteers wore a disposable gown. All metallic objects were removed. Measurements and calibrations of the DXA system were carried out following the manufacturer’s instructions. Finally, DXA scans were edited to estimate appendicular lean tissue following published recommendations [29]. For the present analysis only total lean tissue (TLT), bone mineral content (BMC), and fat mass (FM) were considered. The TLT and FM results were then divided by height in meters squared to obtain the TLT and FM indices, respectively (TLTI, kg/m2 and FMI, kg/m2, respectively), which were then used to derive the exposition variables. In addition, the published FMI cut-off points were used to diagnose excess fat mass in the whole sample [30].
2.6. Physical performance assessment
Gait speed and handgrip strength were the main components of the physical performance assessment at baseline. Results were used to derive the exposition variables. Both were elements of the CGA. After receiving instructions, volunteers performed the gait speed test, recorded as a regular 6-meter walk on the GAIT Ritel instrumented mat (platinum 20,204 × 35.5 × 0.25 inches, 100 Hz sampling rate). Results were recorded in meters/second (m/s). Isometric grip strength was measured in both hands with an adjustable handgrip strength dynamometer (JAMAR Hydraulic Hand Dynamometer, Lafayette, IN), following the standardized, approved protocol [31,32]. Results were recorded in kilograms (kg). The mean of three trials for each hand was recorded, and only the highest value was used for the later analyses.
2.7. Association between the exposition variables and the risk of malnutrition
The total lean tissue and fat mass indices are the main body composition compartments associated with RM. Together with other factors, these two indices were recently associated with RM in older people. Results showed that RM was less likely to occur in those subjects under 85 years old, those with normal swallowing and normal gait speed, and higher TLTI, fat mass, and BMI values, while in those over 85 years old increased likely of suffering RM according to the adjusted and unadjusted models [24]. One cohort study showed that RM was less likely to occur in people with higher triceps skinfold thickness and handgrip strength, and better overall physical health, while risk increased with greater age and low serum albumin at baseline (16). For the present analysis, alterations of body composition compartments, particularly TLT and excess fat mass divided by height in meters squared, were considered separately as exposition variables. The former was categorized as normal or low based on sex-specific cut-off points. The dividing point was a value <20th percentile of the data distribution of the study population, while excess fat mass was determined by the sex-specific FMI cut-off points reported by Kelly et al., (2009) [30].
Regarding the components of impaired physical performance as exposition variables of RM, we considered gait speed (m/s) and handgrip strength (kg), two aspects recently associated with RM, among other variables. RM was less likely to occur in older adults with normal gait speed values (≥8m/s) [24], and in those with greater handgrip strength at baseline [16]. For our purposes, normal gait speed for older men and women subjects was considered ≥0.8 and ≥0.7 m/s, respectively, so low gait speed for men was ≤0.8 m/s, while for women it was ≤0.7 m/s. Handgrip strength was categorized as normal at scores of >18 kg and >10 kg for men and women, respectively, so low handgrip strength was ≤18 kg in men and ≤10 kg in women. These cut-off points were derived from the distribution of the variables in the same study population, and correspond to values <20th percentile as recommended by EWGSOP2 [33]. These exposition variables were coded as categorical (Table 1).
2.8. Assessment of covariates
The variables used as covariates were evaluated as part of the CGA. A questionnaire was applied to obtain sociodemographic information on subjects’ age, occupation, marital status, years of schooling, and medical services. Based on the occupational data gathered, the main source of income was classified as having a pension. Information on living arrangements was coded as living alone or not. Age, gender, educational level, living alone, being single, widowed, or divorced, not having a pension, and health insurance status are factors that have been associated with RM in older people in earlier studies [4,9,15,25].
Cognitive status was assessed and classified using the MMSE instrument, validated for a Spanish-speaking population [27]. Cognitive decline or impairment was considered at MMSE scores ≤23 points for individuals with 5 years of schooling, ≤19 points for those with 1-4 years of education, and ≤16 for those with no schooling or <1 year. Depressive symptoms were assessed by the Center for Epidemiologic Studies Depression Scale, Brief Version (CESD-7), validated for older Mexican adults [34]. The presence of these symptoms was considered when subjects scored 5 or more points on the scale. Cognitive decline, depression, or symptoms of depression have been associated with RM in older people (3, 9, 12, 16, 23).
Comorbidity was assessed by the Charlson comorbidity scale (Charlson ME, 1987) [35], which was applied by trained personnel following the published instructions and recommendations [36]. Comorbidity was coded as no (≤2 diseases) or yes (≥3 diseases) [13]. Polypharmacy was assessed by asking participants to give the names of their medications, their pharmaceutical form, dosage frequency, duration of use, and whether or not they were prescribed medically. Polypharmacy was defined as yes, if 5 or more medications were being taken, and no, if the number was ≤4 drugs/day [37].
Data on current or previous smoking habits, frequency of alcohol consumption, and use of drugs were also assessed and coded as follows: alcohol consumption if subjects drank ≥2 glasses/day [38], and current smoking as yes or no [39]. Both comorbidities and smoking have been associated with RM in community-dwelling older adults [4], while polypharmacy has been signaled in cases of home-care individuals [40]. In addition, oral health (number of dental pieces, dry mouth, xerostomia) has been related to RM [23,41], as have poor self-perceptions of health [15,16]
Functional status was assessed by the Barthel scale for BADLs [42] and Lawton and Brody scale for IADLs [43]. Functional dependence was present if volunteers had scores of ≤90 or ≥1 on the BADL and IADL instruments, respectively. Loss of functionality has been associated with RM in older people [9,10,23], whereas both handgrip strength and healthy gait speed as continuous variables are deemed to be protector factors from RM in terms of the physical performance components of community-dwelling older adults [16,24].
2.9. Statistical analysis
The student's t-test for continuous variables and chi-squared test for categorical variables were used to detect significant between-group differences with and without risk of malnutrition (p-value ≤0.05). Results are reported as mean values with standard deviation (SD) or percentages (%), respectively. A simple logistic regression analysis was used to test for potential associations between several of the independent variables and risk of malnutrition as the response variable (Table 2). Two criteria were established to determine a potential association: a p-value ≤0.2 and a biological plausibility of the odds ratio (OR). Multiple logistic regression using automated stepwise analysis (beginning with forward using a p-value ≤0.05) was applied to test the association between each exposed variable and the occurrence or development of risk of malnutrition. It is important to note that due to the collinearity between the exposition variables and several covariates the regression models were generated, separately. Once obtained, the preliminary models were assessed for interaction at a p-value ≤0.1. Collinearity was assessed using a correlation matrix (r ≤0.85). The linearity assumption of the model was not assessed because it included only categorical variables. The OR and 95% confidence interval (CI) for the occurrence of risk of malnutrition were calculated using the variables of body composition alterations and impaired physical performance after adjusting for several covariates in the final models. All analyses were performed with the statistical package STATA 16.0 for Windows (Stata Corp, College Station).
3. Results
3.1. Baseline characteristics
At baseline, 540 men and women completed all the required data. According to their MNA-LF scores, 22.9% had RM, with women having a higher proportion as compared with men (84 vs. 16%). None of the subjects diagnosed with RM by the MNA-LF at baseline were included in the follow-up study (n=100), so the potential sample at follow-up consisted of 440 men and women. Some of those volunteers; however, had incomplete MNA-LF data (n = 55), and 40 were below 60 years of age. Other losses occurred during follow-up due to the following main recorded causes: excluded candidates (n=39), unable to contact due to change of address (n=16), failed to attend the appointment (n=6), and death (n=43). This left a total sample for analysis at baseline and follow-up of 241 men and women. Figure 1 shows the flow chart of volunteers throughout the cohort study.
At baseline, the sample of 241 men and women (83.4% women) subjects over 60 years old had an average of 75.6 years and well-nourished status according to the MNA-LF. In addition, 85.4% of the sample had good health by self-perception, with only 14.5% reporting poor health. Regarding fat mass measured by DXA, 85.4% of the sample had excess fat mass according to the FMI classification, while 21% had low TLTI, 36.2% had comorbidities, and 85.4% had obesity estimated by BMI ≥30 kg/m2. Regarding physical performance and functional status, 33.2% had low gait speed, 37.7% low handgrip strength, while 14.1% and 32.3% had dependency according to the BADL and IADL scales, respectively.
Table 1 shows the behavior of several variables according to the four exposition variables measured at baseline. Regarding the behavior of these variables according to the fat mass index taken as the dichotomic variable, subjects with excess FMI were younger than the normal group. Mean values for body weight, BMI, fat mass, TLT, and BMC were all higher than those for the normal FMI group (p ≤0.05). In line with these findings, the MNA score was significantly higher compared to the result for the normal FMI group. The low TLTI group was also younger; nevertheless, they had significantly lower mean values of body weight, BMI, fat mass, TLT, and BMC. In addition, the mean value of the MNA score was significantly lower than in the normal TLTI group. In contrast, the low gait speed group was older, and the proportion of subjects with depression symptoms and dependency, measured by IADL, was higher (p ≤0.05). Concurring with these results, they also had significantly lower mean values of HGS compared to the normal gait speed group. As well, the MNA score was lower than in the normal gait speed group. Finally, the low handgrip strength group was also older than the normal group, and there was a higher proportion of subjects with dependency by IADL in the low HGS group, accompanied by a lower mean value of the MNA score compared to the normal HGS group.
The mean follow-up period was 4.1 years. In that time, 28.6% of the sample developed RM. The cumulative incidence was more pronounced in women than in men (84.1 vs. 15.9%). Regarding the factor of incidence according to the exposure variables, Table 2 shows that a lower proportion of older adults (25.2%) with excess FMI developed a risk of malnutrition compared to the normal group (48.5%) at 4.1 years of follow-up. In another result, 41.1% of the subjects with low TLTI had developed RM at follow-up, compared to just 24.7% of the normal TLTI group. Similar findings emerged when the incidence of the risk of malnutrition was compared between the low and normal gait speed and handgrip strength groups. Overall, these results suggest that older subjects with excess FMI presented lower incidences of RM, while those with low TLTI, low gait speed, and low HGS had higher incidences of RM than subjects without these conditions at 4.1 years of follow-up.
Table 3 shows the potential associations among our hypothesis, and several independent variables, and RM as the response variable. Results of the simple logistic regression applied show that excess FMI, low TLTI, low gait speed, low HGS, marital status, education, good self-perceptions of health, depression symptoms, cognitive impairment, comorbidity, polypharmacy, dry mouth, and dependency by the BADL and IADL, were all associated with the risk of malnutrition, estimated by the MNA-LF.
3.2. Final models of the association between the exposition variables and the risk of malnutrition at 4.1 years of follow-up
Regarding the association between alterations of body composition and RM, the condition was less likely to occur in subjects with excess fat mass index according to the unadjusted model (OR: 0.35 [95% CI: 0.17-0.74]). This result remained significant after adjusting for BADL dependency, low gait speed, and good self-perceptions of health (model 1; OR: 0.24 [95% CI: 0.09-0.64]), and even for IADL dependency, low gait speed, and good self-perceptions of health (model 2; OR: 0.35 [95% CI: 0.16-0.82]) compared to the group without excess fat mass index (Table 4). In contrast to its relation to the FMI, RM was more likely to occur in men and women with a low TLTI, according to the unadjusted model (OR: 2.30 [95% CI: 1.21-4.39]). This finding also remained significant after adjusting for BADL dependency, dry mouth, and self-perceptions of health (model 1; OR: 2.01 [95% CI: 1.06-3.83]), and even for IADL dependency, dry mouth, gait speed, and self-perceptions of health (model 2; OR: 1.96 [95% CI: 1.03-3.72]).
For the association between RM and aspects of impaired physical performance, such as low gait speed, Table 4 shows that the condition was more likely to occur in men and women with low gait speed, according to the unadjusted model (OR: 2.43 [95% CI: 1.36-4.32]) after adjusting for dry mouth, the FMI, and self-perceptions of health (model 1; OR: 2.01 [95% CI: 1.06-3.83], and even for dry mouth, the TLTI, and self-perceptions of health (model 2; OR: 1.96 [95% CI: 1.03-3.72]. Similar results were found for low handgrip strength, though in this case after adjusting for the associated covariates, both models 1 and 2 lost significance.
4. Discussion
At baseline, all subjects ≥60 were free of RM according to their MNA-LF scores. However, a significant proportion of the sample had excess fat mass measured by the FMI classification [30], and overweight and obesity by the BMI categories [28]. Around 29% of the sample –mostly women– developed RM at follow-up. These data on the incidence of RM enhance our understanding of the etiology of this condition in community-dwelling older adults by providing a basis for estimating the risk of developing RM, and other diseases, for that matter. Moreover, the unadjusted and adjusted models that incorporated several covariates showed that RM was less likely to occur in subjects with excess fat mass assessed by the FMI classification, but more likely to occur in subjects with low TLTI and low gait speed at follow-up. None of these results have been reported in groups of community-dwelling older people worldwide.
Based on the clinical consequences reported, the volunteers diagnosed with RM are probably at a greater risk of functional dependency [10,17], sarcopenia [18,19], and mortality [20,21], compared to well-nourished older subjects. From a public health perspective, the diagnosis and early confirmation of low TLTI, low gait speed, and low handgrip strength should be warning signals of the need to take action to treat the people so affected and prevent further progress or evolution of RM and its numerous adverse clinical consequences in community-dwelling older adults, especially those in low- and middle-income countries. It seems mandatory to assess body composition and impairment physical performance, and other factors to early detect risk of malnutrition in the older adult populations (Table 1 and Table 4).
4.1. Previous studies related to the causality of risk of malnutrition
According to our search, only one cohort study on the association between several risk factors and RM was found. That published work reported that high age, low self-perceptions of health, and depressive symptoms were factors strongly associated with RM at follow-up [16]. The results of several published cross-sectional studies on the association between risk factors and RM in older populations [3,4,9,10,11,12,15,23,24] led us to hypothesize that excess fat mass, low TLT, low gait speed, and low handgrip strength, separately, could be associated with RM at follow-up in community-dwelling older people. Results of the present study also found that RM is less likely to occur in subjects with excess fat mass (measured by DXA and FMI classification) as categorical variable, assessed. These results are in line with those published in a cross-sectional study on the association between fat mass by DXA and RM [24] and triceps skinfold measurements, on the one hand, and RM at baseline, on the other, in a cohort of older adults [16]. It seems that RM is less likely to occur, as well, in subjects with excess fat mass, but also, increments in fat mass index and highest values of fat mass increase the risk of impaired physical performance [44] and physical dependency [45], respectively, in older adults. Finally, we cannot neglect the fact that high fat mass is related to several cardiovascular disease outcomes [46], and mortality [47]. At this time, more cohort studies are necessary to support or reject the results reported herein.
Regarding the association between the TLTI and RM, results also confirm the findings, published previously, on community-dwelling older New Zealanders [24], though our findings are related to low TLTI as the categorical variable, while the researchers in the New Zealand study [24] reported that RM was less likely to occur in subjects with high fat-free mass index values as the continuous variable. In contrast, we found that RM was more likely to occur in subjects with low TLTI than in the normal group. In fact, our older subjects who developed RM had 2 fewer kilograms of TLT than the normal group at baseline, and 31.8% of the subjects who developed RM had low TLTI, compared to just 16.8% in the normal group. Overall, these results are clearly important.
Unfortunately, the approach used in our work is impractical for daily clinical practice in the study region due to the limited availability of methods and equipment for assessing body composition. However, many published BIA equations are available to accurately estimate fat-free mass in older adults, and DXA could be another method for assessing total lean tissue in older populations, so it may be possible to overcome this limitation. The early measurement of fat-free mass using ethnic- and gender-specific BIA or anthropometric equations [48,49,50], or TLT by DXA, will certainly help researchers and clinicians identify individuals with low TLTI, before this is reflected in MNA-LF scores.
Gait speed as a categorical variable has also been associated with RM, showing that this was less likely to occur in community-dwelling older adult subjects with healthy values (≥0.8m/s) [24]. The present study also confirmed this association, but using low gait speed as the hypothesis variable. Results showed that RM was more likely to occur in subjects with low gait speed even after adjusting for their corresponding variables (see models 1 and 2, and Table 4). Note that few studies have explored this association. It is well known that the gait speed test is normally used to diagnose severe sarcopenia [33], assess physical functioning [51,52], and identify people at high risk of adverse health outcomes [53] and/or disability [54]. But gait speed is also a simple, reproducible measure of physical performance, so future studies on the risk factors for RM should explore this as an exposition variable to confirm or reject the findings of our work.
Finally, only one cohort study to date has analyzed the association between several risk factors and RM at baseline. Those researchers found that RM was less likely to occur in subjects with high handgrip strength as a continuous variable in community-dwelling older people in Sweden. However, in the model built after follow-up, handgrip strength did not appear among the associated risk factors for the incidence of RM [16]. The researchers in a cross-sectional study did not find any association between these two variables in older New Zealander subjects [24]. In the present study; however, there was an association between low handgrip strength as a hypothesis variable and the incidence of RM according to the unadjusted OR, though it lost significance after adjusting for several covariates. Results are shown in models 1 and 2 (Table 4). Upon examining the p-values found (model 1), it is likely that the small sample size influenced the significance of this association. As mentioned above, 37.7% (n=15) of men and women had low handgrip strength. Future studies should recruit a more adequate sample size to determine if this association reaches statistical significance. Clearly, additional work is required to clarify this possible association.
4.2. Potential biological mechanisms
The association found may be supported by the following mechanisms. Triacylglycerols in adipose tissue or fat mass represent a major energy reserve in the body. Under conditions of high energy demand, such as low energy intake or caloric deficit, stored triacylglycerols are hydrolyzed by lipase and released into the bloodstream as free fatty acids to satisfy constant energy needs. In fact, it has been reported that MNA scores of 17-23.5 (risk of malnutrition) detected elderly patients with poor nutritional intake and, at the same time, normal albumin levels or no loss of body weight [7]. In addition, eating only one or two meals a day [9], or consuming fewer than three snacks daily [55], increased the risk of malnutrition compared to subjects who ate 3 or more meals a day, or more than three snacks daily. Thus, it is to be expected that RM is less likely to occur in subjects with excess fat mass, subjects with RM probably satisfy their energy needs, as the results of our study confirm. On the other hand, total lean tissue, or fat-free mass, is associated with energy intake, an association mediated by the resting metabolic rate. Fat-free mass and the resting metabolic rate, together, explain 62% of the variance in energy intake [56]. Our results suggest that low TLT could be the main determinant of the resting metabolic rate, hence, low energy requirements, and this condition could foster a low energy intake, which could contribute to the development of RM.
Finally, the relation between nutritional status and physical performance in older adult populations is well known. Well-nourished subjects walk significantly faster than those with RM or malnourishment [57]. Impaired physical performance –low gait speed, for example– can have an early effect on some of the activities involved in buying and preparing food, thus impacting dietary caloric intake. Gait speed correlates positively with all body mass measures, TLT, percentage of body fat, and the BMI [24]. Therefore, a synergistic effect among low TLT, low fat mass, and low gait speed can be sustained. In addition, the older people in this study who developed RM at 4.1 years follow-up had less fat mass and lean tissue at baseline, compared to the men and women in the group without RM.
4.3. Strengths and limitations
One of the strengths of this study is its cohort design, which allowed us to explore temporal associations and causality. Significantly, unlike the earlier cross-sectional studies and the one cohort study found, we used excess fat mass, low TLTI, low handgrip strength, and low gait speed as the exposition variables, then adjusted the models for several covariates reported in the literature and based on their tested association with RM using simple regression analysis. In addition, the exposition variables were assessed using such reference methods as DXA for body composition and the GAIT Rite instrumented mat for gait speed. Two other strengths of this study are that robust statistical analyses were carried out to determine associations, and the follow-up period was sufficiently long to allow us to determine associations between several exposition variables and RM.
The limitations of cohort studies associated with losses at follow-up are well-known. However, the percentage of loss in this study was relatively low (just 12%) and was taken into account in our calculations of the sample size. This limitation could also be overcome because there were no significant differences in several of the demographic, body composition, nutritional status, and clinical characteristics between the subjects who were lost and those who remained for the follow-up study (see Annex I).
Another limitation is a possible selection bias, since our sample was made up of volunteers who came to the centers where the evaluations were carried out on their own, so older adults with greater impairment of their physical or functional performance may have been excluded, possibly resulting in an underestimate of the incidence of RM and the number of people with excess fat mass, low TLTI, and low gait speed and handgrip strength. Finally, this study tested the association between alterations of body composition and impaired physical performance by adjusting for several covariates, but did not consider such biochemical and nutritional parameters as hematocrit, glucose, albumin, erythroid sedimentation rate, and triglycerides, all of which have been associated with RM in clinical settings.
5. Conclusions
The accumulated incidence of the risk of malnutrition was relatively high, around 29% in the sample of community-dwelling older adults. RM was less likely to occur in older subjects with excess fat mass by the FMI classification, but more likely to occur in older men and women subjects with a low total lean tissue index and low gait speed at 4.1 years of follow-up in community-dwelling older people, even after adjusting for several covariates. Also, our findings highlight that excess fat mass, low total lean tissue, and low gait speed are first than risk of malnutrition and not vice versa. Future prospective cohort studies are required to confirm or reject our hypotheses for older adult populations. Due to the high incidence of RM in community-dwelling older people, and its possible short-term clinical consequences, early assessment of body composition and physical performance to detect excess fat mass, low total lean tissue indices, and low gait speed, respectively, is recommended to detect RM in older adult populations before the onset of this condition.
Author Contributions
ML-T contributed to study design, data collection, statistical data analysis, and manuscript writing. OR-C was responsible for the study design (FraDySMex) and data collection, and critically reviewed the paper. HJV-E, she participated in the statistical analyses and interpretation, and reviewed the paper. JE-R contributed to the statistical analyses and interpretation, and critically reviewed the models generated and assessed by multiple logistic regression analysis, as well as the entire document. AL-L contributed to the study design of and data collection, and the final review of the manuscript. HA-M is the corresponding author, derived the new hypotheses tested in this secondary analysis, participated in interpreting the statistical analyses and manuscript writing and critically reviewed the entire document. All authors read and approved the final manuscript.
Funding
Through the National Institute of Geriatrics (INGer) and the Department of Health of the Universidad Iberoamericana in Mexico City, this project was supported by grants from the Department of Education, Science, Technology, and Innovation of Mexico City (CM-SECTEI/041/2020), the Collaborative Network for Translational Research for Healthy Aging in Mexico City (RECITES), and the Department of Health of the Universidad Iberoamericana in Mexico City.
Conflicts of Interest
All authors declare that the research was conducted in the absence of any commercial or financial relationships that could be construed as a potential conflict of interest.
References
- Kaiser MJ, Bauer JM, Rämsch C, Uter W, Guigoz Y, Cederholm T, Thomas DR, Anthony PS, Charlton KE, Maggio M, Tsai AC, Vellas B, Sieber CC; Mini Nutritional Assessment International Group. Frequency of malnutrition in older adults: a multinational perspective using the mini nutritional assessment. J Am Geriatr Soc. 2010 Sep;58(9):1734-8. [CrossRef]
- Cereda E, Pedrolli C, Klersy C, Bonardi C, Quarleri L, Cappello S, Turri A, Rondanelli M, Caccialanza R. Nutritional status in older persons according to healthcare setting: A systematic review and meta-analysis of prevalence data using MNA®. Clin Nutr. 2016 Dec;35(6):1282-1290. [CrossRef]
- Ülger Z, Halil M, Kalan I, Yavuz BB, Cankurtaran M, Güngör E, Arioğul S. Comprehensive assessment of malnutrition risk and related factors in a large group of community-dwelling older adults. Clin Nutr. 2010 Aug;29(4):507-11. [CrossRef]
- Damião R, Santos ÁDS, Matijasevich A, Menezes PR. Factors associated with risk of malnutrition in the elderly in south-eastern Brazil. Rev Bras Epidemiol. 2017 Oct-Dec;20(4):598-610. [CrossRef]
- Chuansangeam M, Wuthikraikun C, Supapueng O, Muangpaisan W. Prevalence and risk for malnutrition in older Thai people: A systematic review and meta-analysis. Asia Pac J Clin Nutr. 2022 Mar;31(1):128-141. [CrossRef]
- Kushwaha S, Khanna P, Srivastava R, Jain R, Singh T, Kiran T. Estimates of malnutrition and risk of malnutrition among the elderly (≥60 years) in India: A systematic review and meta-analysis. Ageing Res Rev. 2020 Nov; 63:101137. [CrossRef] [PubMed]
- Guigoz Y, Vellas B, Garry PJ. Mini Nutritional Assessment: a practical assessment tool for grading the nutritional state of elderly patients. Facts Res Gerontol 1994;(suppl 2):15.
- Vellas B, Guigoz Y, Garry PJ, Nourhashemi F, Bennahum D, Lauque S, Albarede JL. The Mini Nutritional Assessment (MNA) and its use in grading the nutritional state of elderly patients. Nutrition. 1999 Feb;15(2):116-22. [CrossRef] [PubMed]
- Franco-Alvarez N, Avila-Funes JA, Ruiz-Arreguí L, Gutiérrez-Robledo LM. Determinantes del riesgo de desnutrición en los adultos mayores de la comunidad: análisis secundario del estudio Salud, Bienestar y Envejecimiento (SABE) en México [Determinants of malnutrition risk among the older adult community: a secondary analysis of the Health, Wellbeing, and Aging Study (SABE) in Mexico]. Rev Panam Salud Publica. 2007 Dec;22(6):369-75. Spanish. [CrossRef]
- Rodríguez-Tadeo A, Wall-Medrano A, Gaytan-Vidaña ME, Campos A, Ornelas-Contreras M, Novelo-Huerta HI. Malnutrition risk factors among the elderly from the US-Mexico border: the "one thousand" study. J Nutr Health Aging. 2012 May;16(5):426-31. [CrossRef]
- Alemán-Mateo H, Tavano Colaizzi L, Pérez-Lizaur AB. Nutritional status and its association with body composition compartments in physically independent, elderly Mexican subjects. J Aging Res Clin Pract. 2013; 2 (2):211-5. [CrossRef]
- González-Franco LR, González Arellanes R, Ramírez Torres M Alemán-Mateo H. Riesgo de desnutrición y factores asociados en una muestra de adultos mayores en la comunidad e institucionalizados de Yucatán, México. Arch Latinoam Nutr 2020; 70(1): 30-39. [CrossRef]
- López-Teros MT, Rosas-Carrasco O, Sánchez-García S, Castro-Porras L, Luna-López A, Agudelo-Botero M. The association of osteosarcopenia with functional disability in community-dwelling Mexican adults 50 and older. Front Med (Lausanne). 2021 Jun 7; 8:674724. [CrossRef]
- Fuentes-Pimentel LE, Camacho-Guerrero A. Prevalencia del estado de desnutrición en los adultos mayores de la Unidad Médica Familiar Núm. 53 de León, Guanajuato, México. Residente. 2020;15(1):4-11. [CrossRef]
- Avila JC, Samper-Ternent R, Wong R. Malnutrition Risk among Older Mexican Adults in the Mexican Health and Aging Study. Nutrients. 2021 ;13(5):1615. 12 May. [CrossRef]
- Johansson Y, Bachrach-Lindström M, Carstensen J, Ek AC. Malnutrition in a home-living older population: prevalence, incidence and risk factors. A prospective study. J Clin Nurs. 2009 May;18(9):1354-64. [CrossRef]
- Nuotio M, Tuominen P, Luukkaala T. Association of nutritional status as measured by the Mini-Nutritional Assessment Short Form with changes in mobility, institutionalization and death after hip fracture. Eur J Clin Nutr. 2016 Mar;70(3):393-8. [CrossRef]
- Kiesswetter E, Pohlhausen S, Uhlig K, Diekmann R, Lesser S, Uter W, Heseker H, Stehle P, Sieber CC, Volkert D. Prognostic differences of the Mini Nutritional Assessment short form and long form in relation to 1-year functional decline and mortality in community-dwelling older adults receiving home care. J Am Geriatr Soc. 2014 Mar;62(3):512-7. [CrossRef]
- Sato PHR, Ferreira AA, Rosado EL. The prevalence and risk factors for sarcopenia in older adults and long-living older adults. Arch Gerontol Geriatr. 2020 Jul-Aug; 89:104089. [CrossRef]
- Lu Y, Karagounis LG, Ng TP, Carre C, Narang V, Wong G, Tan CTY, Zin Nyunt MS, Gao Q, Abel B, Poidinger M, Fulop T, Bosco N, Larbi A. Systemic and Metabolic Signature of Sarcopenia in Community-Dwelling Older Adults. J Gerontol A Biol Sci Med Sci. 2020 Jan 20;75(2):309-317. [CrossRef]
- Shakersain B, Santoni G, Faxén-Irving G, Rizzuto D, Fratiglioni L, Xu W. Nutritional status and survival among old adults: an 11-year population-based longitudinal study. Eur J Clin Nutr. 2016 Mar;70(3):320-5. [CrossRef]
- Reinders I, Volkert D, de Groot LCPGM, Beck AM, Feldblum I, Jobse I, Neelemaat F, de van der Schueren MAE, Shahar DR, Smeets ETHC, Tieland M, Twisk JWR, Wijnhoven HAH, Visser M. Effectiveness of nutritional interventions in older adults at risk of malnutrition across different health care settings: Pooled analyses of individual participant data from nine randomized controlled trials. Clin Nutr. 2019 Aug;38(4):1797-1806. [CrossRef]
- Nykänen I, Lönnroos E, Kautiainen H, Sulkava R, Hartikainen S. Nutritional screening in a population-based cohort of community-dwelling older people. Eur J Public Health. 2013 Jun;23(3):405-9. [CrossRef]
- Chatindiara I, Williams V, Sycamore E, Richter M, Allen J, Wham C. Associations between nutrition risk status, body composition and physical performance among community-dwelling older adults. Aust N Z J Public Health. 2018;43:56-62.
- Besora-Moreno M, Llauradó E, Tarro L, Solà R. Social and economic factors and malnutrition or the risk of malnutrition in the elderly: a systematic review and meta-analysis of observational studies. Nutrients. 2020 Mar 11;12(3):737. [CrossRef]
- Rosas-Carrasco O, Cruz-Arenas E, Parra-Rodríguez L, García-González AI, Contreras-González LH, Szlejf C. Cross-Cultural Adaptation and Validation of the FRAIL Scale to Assess Frailty in Mexican Adults. J Am Med Dir Assoc. 2016 Dec 1;17(12):1094-1098. [CrossRef]
- Ostrosky-Solís F, López-Arango G, Ardila A. Sensitivity and specificity of the Mini-Mental State Examination in a Spanish-speaking population. Appl Neuropsychol. (2000) 7:25–31. 10. 1207.
- Obesity: preventing and managing the global epidemic. Report of a WHO consultation. World Health Organ Tech Rep Ser. 2000;894:i-xii, 1-253.
- Heymsfield SB, Smith R, Aulet M, Bensen B, Lichtman S, Wang J, Pierson RN Jr. Appendicular skeletal muscle mass: measurement by dual-photon absorptiometry. Am J Clin Nutr. 1990 Aug;52(2):214-8. [CrossRef]
- Kelly TL, Wilson KE, Heymsfield SB. Dual energy X-Ray absorptiometry body composition reference values from NHANES. PLoS One. 2009 Sep 15;4(9):e7038. [CrossRef] [PubMed]
- Roberts HC, Denison HJ, Martin HJ, Patel HP, Syddall H, Cooper C, Sayer AA. A review of the measurement of grip strength in clinical and epidemiological studies: towards a standardised approach. Age Ageing. 2011 Jul;40(4):423-9. [CrossRef]
- Fess E, Moran C. Clinical assessment recommendations. 1st ed. Indianapolis: American Society of Hand Therapists; 198.
- Cruz-Jentoft AJ, Bahat G, Bauer J, Boirie Y, Bruyère O, Cederholm T, Cooper C, Landi F, Rolland Y, Sayer AA, Schneider SM, Sieber CC, Topinkova E, Vandewoude M, Visser M, Zamboni M; Writing Group for the European Working Group on Sarcopenia in Older People 2 (EWGSOP2), and the Extended Group for EWGSOP2. Sarcopenia: revised European consensus on definition and diagnosis. Age Ageing. 2019 Jan 1;48(1):16-31. [CrossRef]
- Salinas-Rodríguez A, Manrique-Espinoza B, Acosta-Castillo GI, Franco-Nuñez A, Rosas-Carrasco O, Gutiérrez-Robledo LM, et al. Validation of a cutoff point for the short version of the Depression Scale of the Center for Epidemiologic Studies in older Mexican adults. Salud Publica Mex. (2014) 56:279–85. 10.21149/spm.v56i3.7346.
- Charlson ME, Pompei P, Ales KL, MacKenzie CR. A new method of classifying prognostic comorbidity in longitudinal studies: development and validation. J Chronic Dis. (1987) 40:373–83. 10.1016/0021-9681(87)90171-8.
- Rosas-Carrasco O, González-Flores E, Brito-Carrera AM, Vázquez-Valdez OE, Peschard-Sáenz E, Gutiérrez-Robledo LM, et al. Assessment of comorbidity in the elderly. Rev Med Inst Mex Seguro Soc. (2011) 49:153–62.
- Shah BM, Hajjar ER. Polypharmacy, adverse drug reactions, and geriatric syndromes. Clin Geriatr Med. (2012) 28:173–86. 10.1016/j.cger.2012.01.002.
- Guilbert, JJ. The world health report 2002 - reducing risks, promoting healthy life. Educ Health (Abingdon). 2003 Jul;16(2):230. [CrossRef]
- World Health Organization. In Intergovernmental Negotiating Body on the WHO Framework Convention on Tobacco Control; World Health Organization: Geneva, 2003.
- Kaipainen, T. & Tiihonen, Miia & Hartikainen, S. & Nykanen, Irma. (2015). Prevalence of risk of malnutrition and associated factors in home care clients. The Journal of Nursing Home Research Sciences. [CrossRef]
- Hussein S, Kantawalla RF, Dickie S, Suarez-Durall P, Enciso R, Mulligan R. Association of Oral Health and Mini Nutritional Assessment in Older Adults: A Systematic Review with Meta-analyses. J Prosthodont Res. 2022 Apr 27;66(2):208-220. [CrossRef]
- Mahoney FI, Barthel DW. Functional evaluation: the Barthel Index. Md State Med J. (1965) 14:2. [CrossRef]
- Lawton MP, Brody EM. Assessment of older people: self-maintaining and instrumental activities of daily living. Gerontologist. (1969) 9:179–86. 10.1093/geront/9.3_Part_1.179.
- Ramírez Torres M, Ruiz Valenzuela RE, Esparza-Romero J, López Teros MT, Alemán-Mateo H. The fat mass index, not the fat-free mass index, is associated with impaired physical performance in older adult subjects: Evidence from a cross-sectional study. Clin Nutr. 2019 Apr;38(2):877-882. [CrossRef]
- Schaap LA, Koster A, Visser M. Adiposity, muscle mass, and muscle strength in relation to functional decline in older persons. Epidemiol Rev. 2013; 35:51-65. [CrossRef]
- Böhm A, Heitmann BL. The use of bioelectrical impedance analysis for body composition in epidemiological studies. Eur J Clin Nutr. 2013 Jan;67 Suppl 1: S79-85. [CrossRef]
- Bigaard J, Frederiksen K, Tjønneland A, Thomsen BL, Overvad K, Heitmann BL, Sørensen TI. Body fat and fat-free mass and all-cause mortality. Obes Res. 2004 Jul;12(7):1042-9. [CrossRef]
- González-Arellanes, R. , Urquidez-Romero, R., Rodríguez-Tadeo, A. et al. Predictive equations for fat mass in older Hispanic adults with excess adiposity using the 4-compartment model as a reference method Eur J Clin Nutr 77, 515–524 (2023). [CrossRef]
- Huerta RH, Esparza-Romero J, Urquidez R, Pacheco BI, Valencia ME, Alemán-Mateo H. Validez de una ecuación basada en antropometría para estimar la grasa corporal en adultos mayores [Validity of an equation based on anthropometry to estimate body fat in older adults]. Arch Latinoam Nutr. 2007 Dec;57(4):357-65.
- Aleman-Mateo H, Rush E, Esparza-Romero J, Ferriolli E, Ramirez-Zea M, Bour A, Yuchingtat G, Ndour R, Mokhtar N, Valencia ME, Schoeller DA. Prediction of fat-free mass by bioelectrical impedance analysis in older adults from developing countries: a cross-validation study using the deuterium dilution method. J Nutr Health Aging. 2010 Jun;14(6):418-26. [CrossRef]
- Brach JS, VanSwearingen JM, Newman AB, Kriska AM. Identifying early decline of physical function in community-dwelling older women: performance-based and self-report measures. Phys Ther. 2002 Apr;82(4):320-8.
- Fried LP, Tangen CM, Walston J, Newman AB, Hirsch C, Gottdiener J, Seeman T, Tracy R, Kop WJ, Burke G, McBurnie MA; Cardiovascular Health Study Collaborative Research Group. Frailty in older adults: evidence for a phenotype. J Gerontol A Biol Sci Med Sci. 2001 Mar;56(3):M146-56. [CrossRef]
- Taekema DG, Gussekloo J, Westendorp RG, de Craen AJ, Maier AB. Predicting survival in oldest old people. Am J Med. 2012 Dec;125(12):1188-1194.e1. [CrossRef]
- Perera S, Patel KV, Rosano C, Rubin SM, Satterfield S, Harris T, Ensrud K, Orwoll E, Lee CG, Chandler JM, Newman AB, Cauley JA, Guralnik JM, Ferrucci L, Studenski SA. Gait Speed Predicts Incident Disability: A Pooled Analysis. J Gerontol A Biol Sci Med Sci. 2016 Jan;71(1):63-71. [CrossRef]
- Van der Pols-Vijlbrief R, Wijnhoven HA, Molenaar H, Visser M. Factors associated with (risk of) undernutrition in community-dwelling older adults receiving home care: a cross-sectional study in the Netherlands. Public Health Nutr. 2016 Aug;19(12):2278-89. [CrossRef]
- Hopkins M, Finlayson G, Duarte C, Whybrow S, Ritz P, Horgan GW, Blundell JE, Stubbs RJ. Modelling the associations between fat-free mass, resting metabolic rate and energy intake in the context of total energy balance. Int J Obes (Lond). 2016 Feb;40(2):312-8. [CrossRef]
- Kramer CS, Groenendijk I, Beers S, Wijnen HH, van de Rest O, de Groot LCPGM. The association between malnutrition and physical performance in older adults: a systematic review and meta-Analysis of observational studies. Curr Dev Nutr. 2022 Jan 29;6(4): nzac007. [CrossRef]
Figure 1.
Flow chart of the volunteers during the cohort study. Abbreviations: RM= risk of malnutrition, MNA-LF= long form of the mini nutritional assessment.
Figure 1.
Flow chart of the volunteers during the cohort study. Abbreviations: RM= risk of malnutrition, MNA-LF= long form of the mini nutritional assessment.
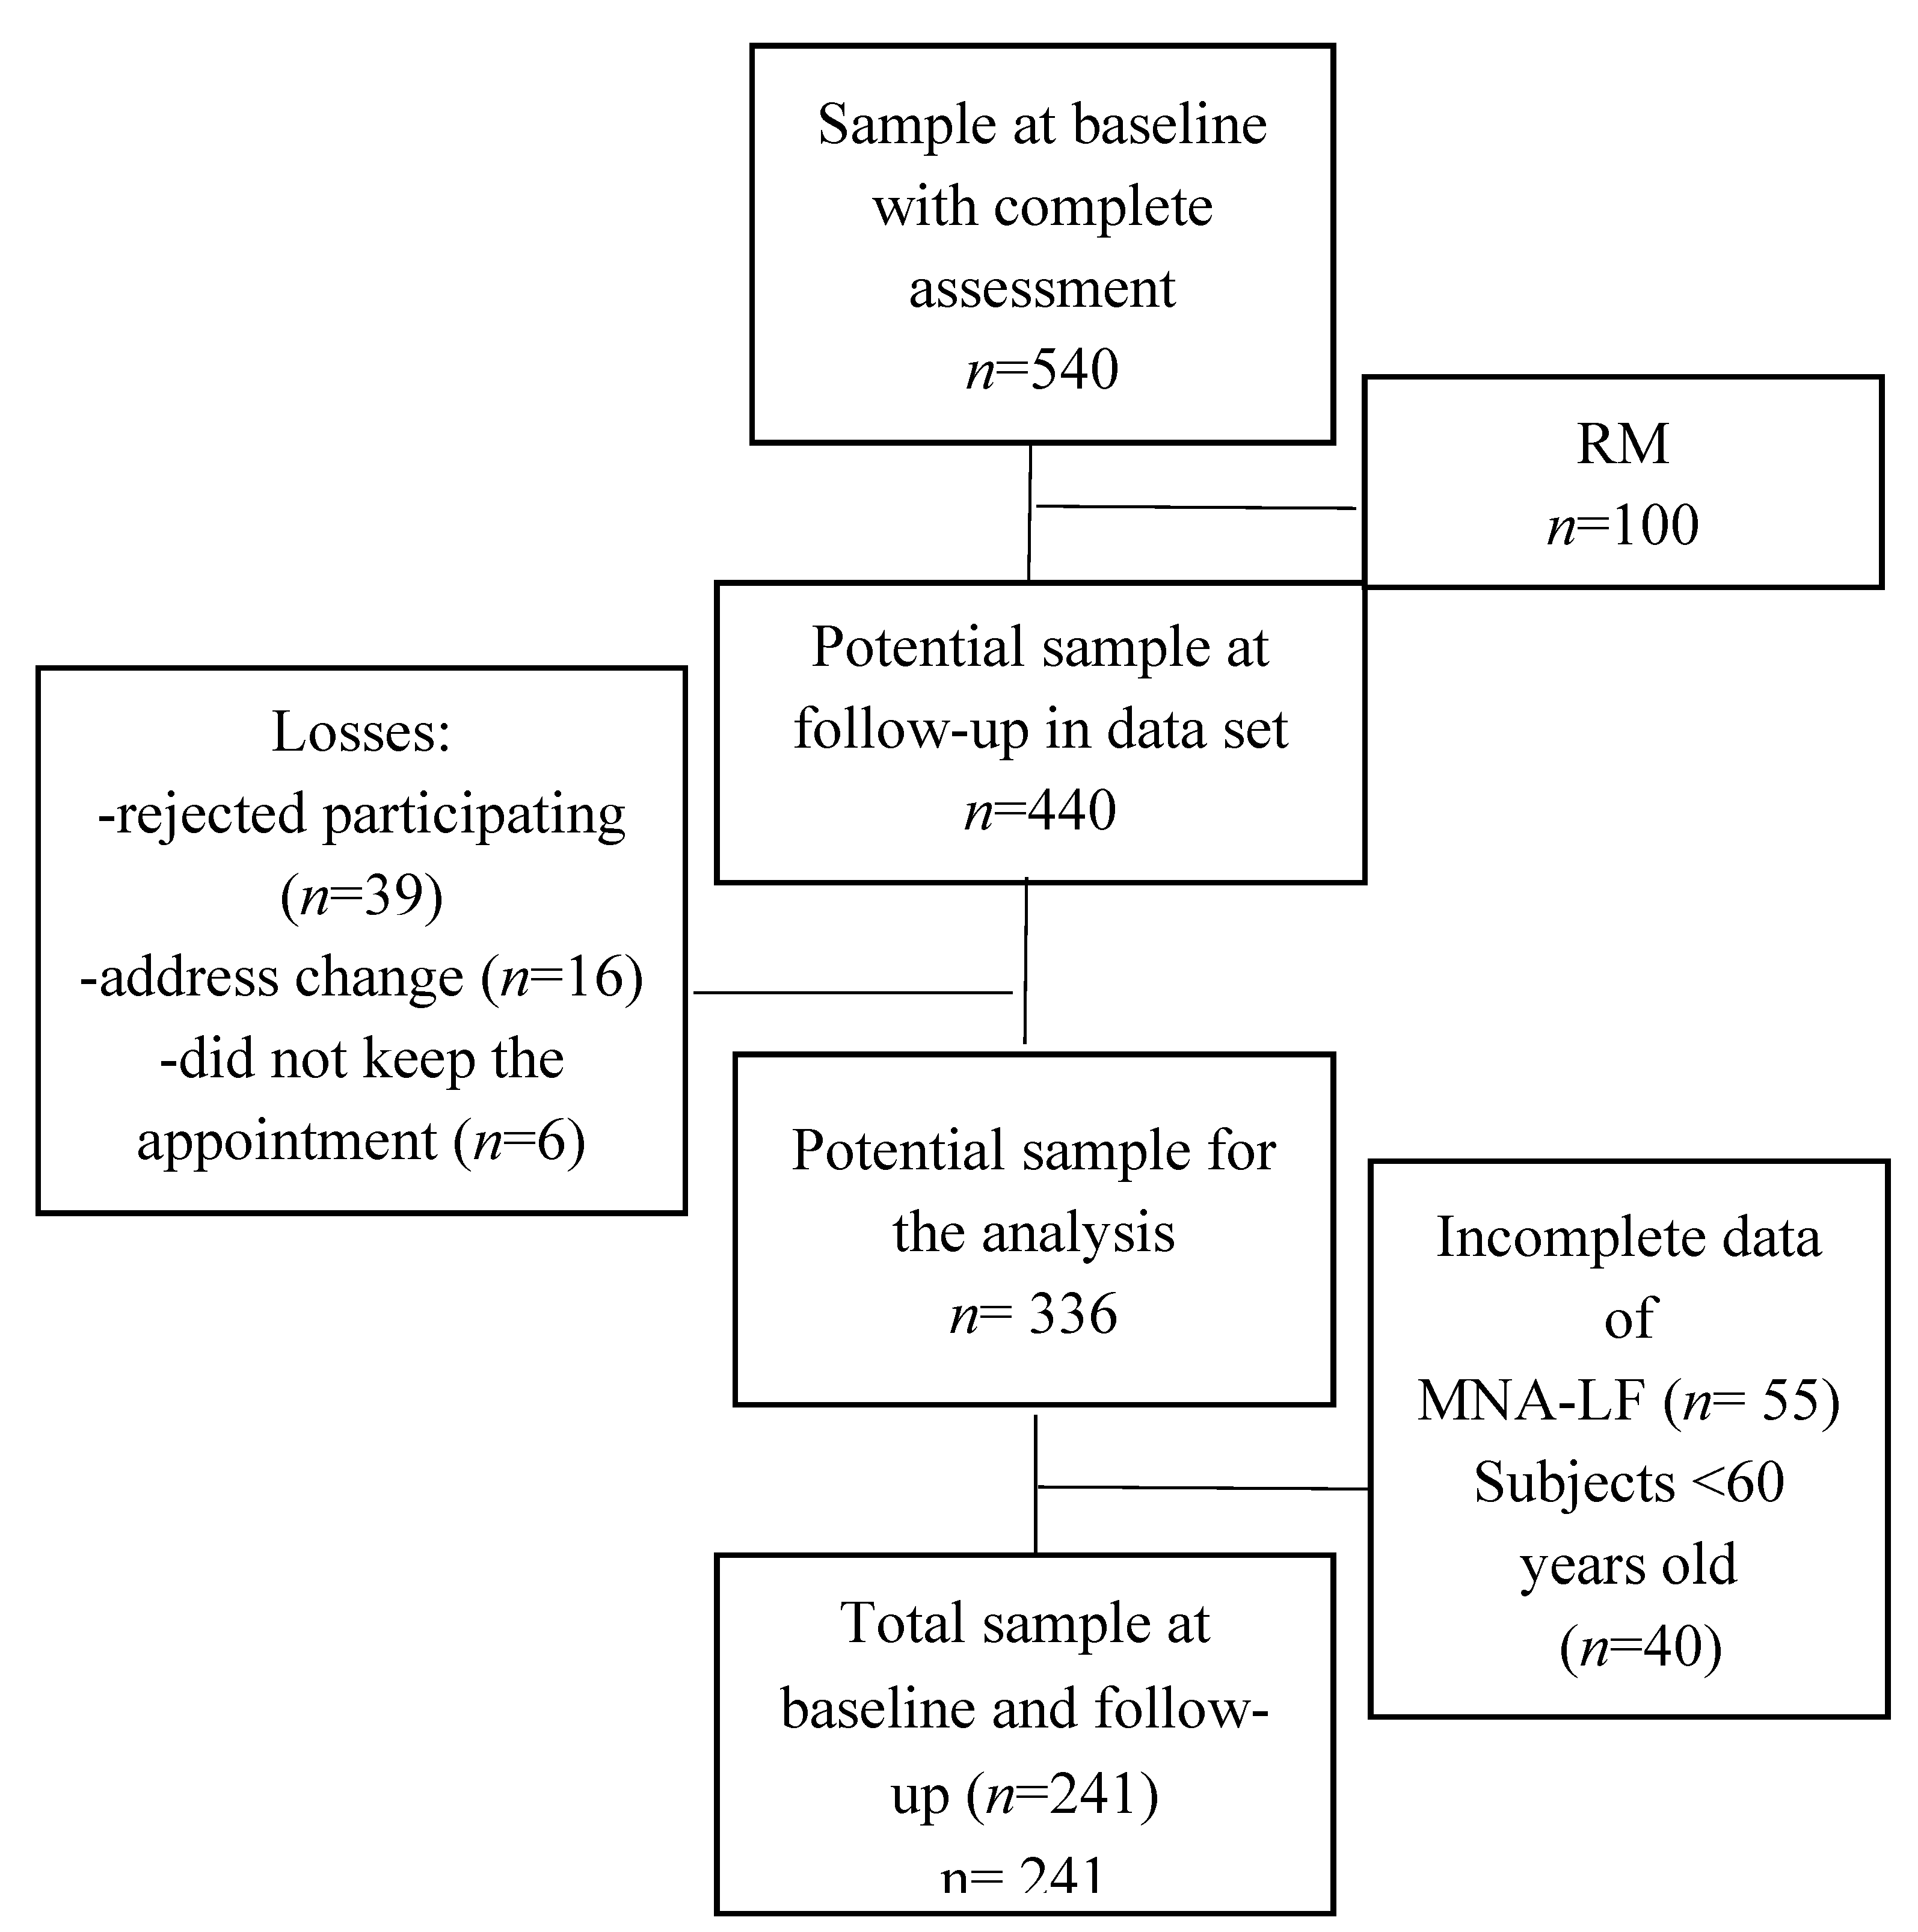

Table 1.
Baseline anthropometric and body composition, comprehensive geriatric assessment, and sociodemographic data according to the exposition variables.
Table 1.
Baseline anthropometric and body composition, comprehensive geriatric assessment, and sociodemographic data according to the exposition variables.
|
Variables |
Body composition Fat mass index Total lean tissue index |
Physical performance Gait speed Handgrip strength |
||||||
|
Excessa n= 206 |
Normal n=35 |
Lowb n= 51 |
Normal n=190 |
Lowc n=80 |
Normal n=161 |
Lowd n=91 |
Normal n=150 |
|
|
Gender Women Man |
171 (83.0) 35 (16.9) |
30 (85.7) 5 (14.3) |
39 (76.5) 12 (23.5) |
162 (85.3) 28 (14.7) |
64 (80.0) 16 (20.0) |
137 (85.1) 24 (14.9) |
75 (82.4) 16 (17.6) |
126 (84.0) 24 (16.1) |
| Age, years | 75.1±7.9 | 79.1±7.2* | 77.1±8.2 | 79.1±7.2* | 79.1±7.8 | 73.9±7.6* | 78.7±7.6 | 73.8±7.7* |
|
Anthropometry Height, m |
1.5±0.0 |
1.4±0.0 |
1.5±0.0 |
1.5±0.0 |
1.49±0.0 |
1.50±0.0 |
1.49±0.0 |
1.51±0.0 |
| Body weight, kg | 60.6±12.1 | 51.4±7.6* | 57.7±10.4 | 67.3±12.8* | 65.4±14.2 | 65.2±12.3 | 64.1±14.9 | 65.9±11.5 |
| Body mass index, kg/m2 | 29.7±4.7 | 23.1±2.8* | 24.8±3.8 | 29.8±4.8* | 29.1±5.6 | 28.6±4.8 | 28.5±5.7 | 28.9±4.6 |
|
Body composition Total mass by DXA, kg |
65.6±12.4 |
45.7±13.2 |
51.1±14.4 |
65.9±12.6* |
62.7±15.7 |
62.8±13.6 |
61.7±16.5 |
63.4±12.8 |
| Fat mass, kg | 28.1±7.2 | 16.2±3.2* | 22.2±6.2 | 27.6±7.9* | 26.8±8.8 | 26.4±7.5 | 26.4±9-6 | 26.6±6.7 |
| Fat mass index, kg/m2 Total lean tissue, kg |
12.4±3.2 35.7±7.6 |
7.2±1.3* 31.3±4.7* |
9.5±2.6 29.8±6.9 |
12.3±3.5* 36.5±7.0* |
11.9±3.9 35.1±7.6 |
11.6±3.3 35.1±7.4 |
11.8±4.1 34.5±7.5 |
11.7±3.1 35.5±7.5 |
| Bone mineral content, kg | 1.7±0.8 | 1.3±0.5* | 1.5±0.5 | 1.7±0.9* | 1.6±0.5 | 1.7±0.9 | 1.7±1.2 | 1.7±1.6 |
|
Marital status Married Single, divorce o separate Widower |
60 (29.1) 58 (28.2) 88 (42.7) |
14 (40.0) 9 (25.7) 12 (34.3) |
15 (29.4) 15 (29.4) 21 (41.2) |
59 (31.1) 52 (27.4) 79 (41.6) |
18 (22.5) 19 (23.8) 43 (53.8) |
56 (34.8) 48 (29.8) 57 (35.4) |
29 (31.9) 22 (24.2) 40 (43.9) |
45 (30.0) 45 (30.0) 60 (40.0) |
|
Living arrangements/Living alone No Yes |
157 (76.2) 49 (23.8) |
27 (77.1) 8 (22.9) |
62 (77.5) 18 (22.5) |
122 (77.5) 39 (24.2) |
62 (77.5) 18 (22.5) |
122 (75.8) 39 (24.2) |
66 (72.5) 25 (27.5) |
118 (78.7) 32 (21.3) |
|
Education/Years of schooling <10 years ≥10 years |
122 (58.2) 13 (37.4) |
22 (62.9) 84 (40.8) |
27 (52.9) 24 (47.1) |
117 (61.6) 73 (38.4) |
56 (70.0) 24 (30.0) |
88 (54.7) 73 (45.3)* |
56 (61.5) 35 (38.5) |
88 (58.7) 62 (41.3) |
|
Income source Pension No Yes |
65 (31.5) 141 (68.5) |
9 (25,7) 26 (74.3) |
23 (45.1) 28 (54.9) |
51 (26.8) 139 (73.2)* |
23 (28.8) 57 (71.3) |
51(31.7) 110 (68.3) |
29 (31.9) 62 (68.1) |
45 (30.0) 105 (70.0) |
|
Medical services None Government Private or others |
8 (3.9) 187 (90.8) 11 (5.3) |
1 (2.9) 32 (91.5) 2 (5.7) |
1 (1.9) 172 (90.5) 10 (5.3) |
8 (4.2) 47 (92.2) 3 (5.9) |
2 (2.5) 73 (91.3) 5 (6.3) |
7 (4.3) 146 (90.7) 8 (4.9) |
1 (1.1) 85 (93.4) 5 (5.5) |
8 (5.3) 134 (89.3) 8 (5.3) |
|
Self-perception of health Bad Good |
27 (13.1) 179 (86.9) |
8 (22.9) 27 (77.1) |
11 (21.6) 49 (78.4) |
24 (12.6) 166 (87.4) |
19 (23.8) 61 (76.3) |
16 (9.9) 145 (90.1)* |
19 (20.9) 72 (79.1) |
16 (10.7) 134 (89.3)* |
|
Depression symptoms/CESD-7e No, ≤4 CESD-7 scale Yes, ≥5 CESD-7 scale |
120 (58.3) 86 (41.8) |
19 (54.3) 16 (45.7) |
31 (60.8) 20 (39.2) |
108 (56.8) 82 (43.2) |
36 (45.0) 44 (55.0) |
103 (63.9) 58 (36.0)* |
54 (59.3) 37 (40.7) |
85 (56.7) 56 (43.3) |
|
Comorbidity No, ≤2 diseases Yes, ≥3 diseases |
153 (74.3) 53 (25.7) |
23 (65.7) 12 (34.3) |
32 (62.7) 19 (37.3) |
144 (75.8) 46 (24.2) |
57 (71.3) 23 (28.8) |
119 (73.9) 42 (26.1) |
65 (71.4) 26 (28.6) |
111 (74.9) 39 (26.0) |
|
Cognitive impairment/MMSEf No Yes |
181 (87.9) 25 (12.1) |
31 (88.6) 4 (11.4) |
45 (88.2) 6 (11.8) |
167 (87.9) 23 (12.1) |
59 (73.8) 21 (26.3) |
153 (95.0) 8 (4.9)* |
77 (84.6) 14 (15.4) |
135 (90.0) 15 (10.0) |
|
Other diseases Osteoarthritis No Yes |
148 (72.2) 57 (27.8) |
22 (64.7) 12 (35.3) |
38 (76.0) 12 (24.0) |
132 (69.8) 57 (30.2) |
54 (69.2) 24 (30.8) |
116 (72.1) 45 (27.9) |
62 (68.9) 28 (31.1) |
109 (72.5) 41 (27.5) |
|
Alcohol consumption <2 glasses/day >2 glasses/day |
110 (53.4) 96 (46.6) |
17 (50.0) 17 (50.0) |
26 (50.9) 25 (49.0) |
101 (53.3) 88 (46.6) |
49 (61.3) 31 (38.8) |
78 (48.8) 82 (51.3) |
47 (51.7) 44 (48.4) |
80 (53.7) 69 (46.3) |
|
Smoking No Yes |
187 (90.8) 19 (9.2) |
33 (94.3) 2 (5.7) |
49 (96.1) 2 (3.9) |
171 (90.0) 19 (10.0) |
76 (95.0) 4 (5.0) |
144 (89.4) 17 (10.6) |
87 (95.6) 4 (4.4) |
133 (88.7) 17 (11.3)* |
|
Polypharmacy No, ≤4 drugs/day Yes, ≥5 drugs/day |
102 (49.5) 104 (50.5) |
15 (42.9) 20 (57.1) |
25 (49.0) 26 (50.9) |
92 (48.4) 98 (51.6) |
34 (42.5) 46 (57.5) |
83 (51.6) 78 (48.5) |
40 (43.9) 51 (56.0) |
77 (51.3) 73 (48.7) |
|
Oral health/dry mouth No Yes |
179 (86.8) 27 (13.2) |
26 (74.3) 9 (25.7)* |
41 (80.4) 10 (19.6) |
163 (86.2) 26 (13.8) |
64 (79.8) 16 (20.3) |
141 (87.6) 20 (12.4) |
78 (85.7) 13 (14.3) |
126 (84.6) 23 (15.4) |
|
Nutritional status MNA scoreg |
25.3±2.7 |
23.8±3.4* |
24.1±2.9 |
25.3±2.7* |
24.2±2.9 |
25.5±2.7* |
24.4±2.78 |
25.5±2.8* |
|
Dependency/BADLh No Yes |
177 (85.9) 29 (14.1) |
30 (85.7) 5 (14.3) |
42 (82.4) 9 (17.7) |
165 (86.8) 25 (13.2) |
60 (75.0) 20 (25.0) |
147 (91.3) 14 (8.7)* |
75 (82.4) 16 (17.6) |
132 (88.0) 18 (12.0) |
|
Dependency IADLi No Yes |
141 (68.5) 65 (31.6) |
22 (62.9) 13 (37.1) |
34 (66.7) 17 (33.3) |
129 (67.9) 61 (32.1) |
35 (43.8) 45 (56.3) |
128 (79.5) 33 (20.5)* |
52 (57.1) 39 (42.9) |
111 (74.0)39 (26.9)* |
| HGS, kg | 14.4±6.4 | 13.1±6.2 | 13.4±6.0 | 14.4±6.4 | 12.8±6.2 | 14.8±6.3* | 8.9±3.8 | 17.4±5.2 |
| GS, m/s | 0.88±0.0 | 0.88±0.0 | 0.88±0.0 | 0.89±0.0 | 0.87±0.0 | 0.89±0.0* | 0.88±0.0 | 0.89±0.0 |
Results are reported as mean values ± SD, and number and percentages. aExcess fat mass index, ≥6.0 kg/m2 in men and ≥9.0 kg/m2 in women. bLow total lean tissue index, ≤15.6 kg/m2 in men and ≤13.5 kg/m2 in women. cLow gait speed ≤0.8 m/s in men, ≤0.7 m/s in women. dLow handgrip strength, ≤18 kg in men, ≤10 kg in women. eCESD-7, Center for Epidemiologic Studies Depression Scale. fMMSE, Mini Mental State Examination ≤23 points were obtained with 5 years of school education, ≤19 points with between 1 and 4 years of education, ≤16 without education or with <1 year of education. gMNA, mini nutritional assessment hDependency based on the BADL, basic activities of daily living, ≤90 points on the Barthel index. iDependency based on IADL, instrumental activities of daily living <8 points on the Lawton & Brody scale. *p≤0.05.
Table 2.
Cumulative incidence of the risk of malnutrition in community-dwelling older adults at 4.1 years of follow-up.
Table 2.
Cumulative incidence of the risk of malnutrition in community-dwelling older adults at 4.1 years of follow-up.
| Variables | Incidence of risk of malnutrition Yes (n= 69) No (n= 172) |
p-value | |
|
Fat mass index Excess (n= 206) Normal (n= 35) |
52 (25.2) 17 (48.5) |
154 (74.8) 18 (51.5) |
0.004 |
| Total lean tissue index Low (n= 51) Normal (n= 190) |
22 (41.1) 47 (24.7) |
29 (58.9) 143 (75.3) |
0.009 |
| Gait speed Low (n= 80) Normal (n= 161) |
33 (41.2) 36 (23.8) |
47 (58.8) 125 (76.2) |
0.002 |
| Handgrip strength Low (n= 91) Normal (n= 150) |
33 (36.2) 36 (24.0) |
52 (63.8) 114 (76) |
0.041 |
Excess FMI, fat mass index, ≥6.0 kg/m2 in men, ≥9.0 kg/m2 in women. Low TLTI, total lean tissue index, ≤15.6 kg/m2 in men, ≤13.5 kg/m2 in women. Low gait speed ≤0.8 m/s in men, ≤0.7 m/s in women. Low handgrip strength, ≤18 kg in men, ≤10 kg in women.
Table 3.
Association between the hypothesis variables and several independent variables with RM by simple logistic regression analysis in community-dwelling older adults.
Table 3.
Association between the hypothesis variables and several independent variables with RM by simple logistic regression analysis in community-dwelling older adults.
| Variables | OR | p-value |
| Excess FMI, kg/m2 | 0.35 | 0.006 |
| Low TLTI, kg/m2 | 2.30 | 0.011 |
| Gender, women | 1.06 | 0.862 |
| Civil status Single, divorced, or separated Widowed |
0.55 0.93 |
0.125 0.841 |
| Living alone | 0.67 | 0.267 |
| Education, <10 years of schooling | 1.98 | 0.025 |
| Without a pension | 1.23 | 0.500 |
| Without medical services | 1.35 | 0.674 |
| Good self-perception of health | 0.15 | 0.000 |
| Depression symptoms, ≥5 CESD-7 scale | 1.48 | 0.168 |
| Cognitive impairment | 1.91 | 0.110 |
| Comorbidity, ≥3 diseases | 1.87 | 0.042 |
| Osteoarthritis | 0.93 | 0.842 |
| Polypharmacy, ≥5 drugs/day | 1.57 | 0.118 |
| Dry mouth | 3.95 | 0.000 |
| Dependency by the BADL | 6.24 | 0.000 |
| Dependency by the IADL | 2.82 | 0.000 |
| Low gait speed, m/s | 1.96 | 0.020 |
| Low handgrip strength, kg | 1.80 | 0.042 |
| Alcohol consumption, >2 glasses/day | 1.41 | 0.547 |
| Smoking | 0.76 | 0.610 |
Excess FMI, fat mass index, ≥6.0 kg/m2 in men, ≥9.0 kg/m2 in women. Low TLTI, total lean tissue index, ≤15.6 kg/m2 in men, ≤13.5 kg/m2 in women. Low gait speed ≤0.8 m/s in men, ≤0.7 m/s in women. Low handgrip strength, ≤18 kg in men, ≤10 kg in women. CESD-7 Center for Epidemiologic Studies Depression Scale. Cognitive impairment by MMSE, mini mental state examination ≤23 points were obtained with 5 years of school education, ≤19 points with 1-4 years of education, ≤16 without education or with <1 year. Dependency based on the BADL, basic activities of daily living, ≤90 points on the Barthel index. Dependency based on the IADL, instrumental activities of daily living, <8 points on the Lawton & Brody scale. Low gait speed ≤0.8 m/s in men, ≤0.7 m/s in women. Low handgrip strength, ≤18 kg in men, ≤10 kg in women.
Table 4.
Final models of the association between alterations of body composition, and impaired physical performance and risk of malnutrition in community-dwelling older people.
Table 4.
Final models of the association between alterations of body composition, and impaired physical performance and risk of malnutrition in community-dwelling older people.
| Model 1 | Model 2 | |||||
| OR Unadjusted (CI 95%) |
p-value |
OR Adjusted (CI 95%) |
p-value |
OR Adjusted (CI 95%) |
p-value |
|
|
Fat mass index, kg/m2 Normal Excess |
1.00 0.35 (0.17-0.74) |
0.006 |
1.00 0.24 (0.09-0.64) |
0.005 |
1.00 0.35(0.16-0.82) |
0.015 |
|
Total lean tissue index, kg/m2 Normal Low |
1.00 2.30(1.21-4.39) |
0.011 |
1.00 2.06(0.98-4.32) |
0.054 |
1.00 2.04(0.97-4.26) |
0.057 |
|
Gait speed, m/s Normal Low |
1.00 2.43(1.36-4.32) |
0.003 |
1.00 2.01(1.06-3.83) |
0.032 |
1.00 1.96(1.03-3.72) |
0.038 |
|
Handgrip strength, kg Normal Low |
1.00 1.80 (1.02-3.18) |
0.042 |
1.00 1.68 (0.90-3.16) |
0.061 |
1.00 1.63(0.87-3.05) |
0.125 |
Fat mass index, kg/m2; Model 1 adjusted for BADL, gait speed, and self-perception of health. Model 2 adjusted for IADL, gait speed, and self-perception of health. Total lean tissue index, kg/m2; model 1 adjusted for BADL, dry mouth, and self-perception of health; model 2 adjusted for IADL, dry mouth, gait speed, and self-perception of health. Gait speed, m/s; model 1 adjusted for dry mouth, fat mass index, and self-perception of health; model 2 adjusted for dry mouth, total lean tissue index, and self-perception of health. Handgrip strength, kg; model 1 adjusted for dry mouth, fat mass index, and BADL; model 2 adjusted for dry mouth, total lean tissue index, and self-perception of health. Excess fat mass by FMI ≥6.0 kg/m2 in men, ≥9.0 kg/m2 in women. Low TLT by TLTI, ≤15.6 kg/m2 in men, ≤13.5 kg/m2 in women. CESD-7 Center for Epidemiologic Studies Depression Scale. Low handgrip strength, ≤18 kg in men, ≤10 kg in women. Low gait speed ≤0.8 m/s in men, ≤0.7 m/s in women. Low handgrip strength, ≤18 kg in men, ≤10 kg in women.
Disclaimer/Publisher’s Note: The statements, opinions and data contained in all publications are solely those of the individual author(s) and contributor(s) and not of MDPI and/or the editor(s). MDPI and/or the editor(s) disclaim responsibility for any injury to people or property resulting from any ideas, methods, instructions or products referred to in the content. |
© 2023 by the authors. Licensee MDPI, Basel, Switzerland. This article is an open access article distributed under the terms and conditions of the Creative Commons Attribution (CC BY) license (http://creativecommons.org/licenses/by/4.0/).
Copyright: This open access article is published under a Creative Commons CC BY 4.0 license, which permit the free download, distribution, and reuse, provided that the author and preprint are cited in any reuse.


