
Submitted:
29 August 2023
Posted:
07 September 2023
You are already at the latest version
Abstract
This paper provides a new management method (MM) to optimally operate standalone direct current (DC) photovoltaic water pumping system (PVWPS) and synchronize its hydraulic performance to variable daily irradiance. The proposed approach well considers the issues from PV generator and a positive displacement pump mismatching to deserve a hydraulic network. Accordingly, Management Method uses small pumps mounted in parallel scheme to displace the hydraulic power point (HPP) in order to satisfy the mal adequacy between supply and load. Based on experimental Study; this approach showed a yielded standalone system, possibility of running pumping system using only photovoltaic supply (Without use of capacitance), and possibility to design more economical PV systems as the maximum peak power demand for each month can be satisfied using small power pumps in parallel and adjusting their switch with accordance to varying daily irradiance. Moreover, an analytical model was developed with reference to the obtained experimental results. This model based on a daily occurring irradiance as inputs in order to predict optimal performance outputs. It can be considered as a decision tool to track power point resulting from optimal electrical and hydraulic performances of the pumping system according to changes of the daily irradiance.
Keywords:
HPPT
; Performance
; Standalone
; Management Method
; DC PVWPS
1. Introduction
Recently, Excessive use of conventional sources causes environmental concerns. These reasons promote using alternative, renewable and sustainable, energy sources [1] (Vafaeipour et al., 2014).
In Morocco, many farmers started using clean energy assisted by subsidy programs launched by government to supply their sustainable irrigated agricultural systems [2] (Moumen, 2014). Meanwhile, R&D actions still needed to improve systems performance and their reliability for large extension in developing countries.
Several researchers have developed strategies to optimize electrical and hydraulic performances. For better PV panels performance, many authors were focused on improving PV panel conversion of PVWPS. In fact, MPPT (Maximum Power Point Tracking) technologies using a diversity of algorithms that allows systems benefiting from maximum of PV power generated [3,4,5,6] (Akihiro et al. (2009), Khan et al. (2012), Sefriti and Boumhidi, (2015) and Essam et al. (2017)).
Moreover, numerous research studies have been conducted to improve energy efficiency systems. For instance, one approach suggested in [7] (Almeida et al., 2018) involved selecting a pump based on its efficiency across the entire spectrum of operational frequencies. This method led to a decrease in the power threshold necessary to begin pumping, enabling longer pumping durations. Another innovations related to pumps design, detailed in [8] (Hamidat et al. (2003)) involved an investigation into the performance of Photovoltaic Water Pumping Systems (PVWPS), employing centrifugal and positive displacement pumps. In their study, they integrated a multistage centrifugal pump with an alternating current (AC) motor and a three-phase inverter. Additionally, a second pump was linked to a DC-DC converter, controlling a Brushless Direct Current (BLDC) motor. Their findings demonstrated that the positive displacement pump attained an efficiency rate of 45%, while the centrifugal pump lagged behind, registering a mere 14% efficiency. In a separate study, Hamidat and Benyoucef (2008) [9] undertook a comparison of PVWPS performance involving centrifugal and positive displacement pumps. They employed simulations in a range of locations, each distinguished by varying atmospheric conditions, including the Saharan climate and summer rainfall. By assessing the electrical and hydraulic components of both centrifugal and positive displacement pumps, they noted that the positive displacement pump outperformed in terms of efficiency, reduced energy losses, and higher water volume displacement.
Furthermore, Protogeropoulos and Pearce (2000) [10], along with Kashyap et al. (2013) [11], emphasized the necessity for further enhancements in standalone Photovoltaic Water Pumping Systems (PVWPS). These improvements are required to effectively meet the water requirements of small-scale drip irrigation systems while effectively managing the changes in surrounding pressure caused by the fluctuations in daily insolation. Presently, a notable number of photovoltaic pumping facilities incorporate two or more pumps linked in parallel. This arrangement serves as a suitable solution for accommodating fluctuating water flow requirements, minimizing the impact of climatic and sunlight fluctuations. Utilizing multiple parallel pumps may additionally enhance facility efficiency and extend daily operational periods [12] (Harkani et al., 2019). Similarly, the authors in [13] (Zhounian et al.,(2020)) introduced an optimization model for parallel pump systems with the objective of decreasing power consumption and enhancing reliability by addressing off-design operational issues of pumps. The approach employs the particle swarm optimization method to solve the optimization problem. In [14] the authors (Koor et al., (2016)) developed an algorithm designed to predict the steady operation of variable speed pumps (VSPs) functioning in parallel, with the primary goal of maintaining their operation in close proximity to the optimal efficiency point (BEP) provided by the pump manufacturer. Utilizing optimization software allows for the determination of the optimal combined efficiency when pumps operate in parallel. In cases where pumps are identical and have matching discharges, the best combined efficiency is achieved, consistent with various studies. Conversely, for non-identical pumps, the optimal combined efficiency is attained when varying water discharges are taken into account. Additionally, the optimization software can assist in estimating the ideal number of pumps to be operational for optimal performance.
Additionally, divers’ investigations have been extended to predict the hourly flow rate and to maximize the discharge of the daily water volume of PVWPS using mathematical model [15,16] (Katan et al., (1996), Zahab et al., (2017)). The author in [15] (Katan et al., (1996)) developed a mathematical model that predict output water flow rate according to electrical operating energy. Based on experimental results, the obtained volume of pumped water was found inversely proportional to the total head. Another methods are employed to characterize pump’s behavior through various parameters like rotation speed, flow rate, and power inputs. These parameters are used to calculate the head output corresponding to the irradiance intensity [17,18,19] (Jafar., (2000), de Blas., (2002), Ahonen et al., (2010)). The expressions of these parameters are represented as affinity laws, which are employed for the optimal management of PVWPS [20,21] (Kalaiselvan, et al., (2108), and Zhang et al., (2016)). All of these publications have engaged with traditional analytical methods, with a specific focus on utilizing the polynomial model.
All previously mentioned research predicts PVWPS outputs based on irradiances. Notably, a simple and accurate model was developed using experimental findings. Moreover, when examining the PV pumping system’s performance, it becomes evident that the electrical power is directly impacted by the PV panels’ output power. This output power follows a growth model curve. This distribution shape also influences hydraulic power. To effectively capture this growth pattern, considering models like exponential or power models becomes pertinent.
2. Experimental study of PVWPS
PVWPS design
To evaluate PVWPS standalone performance, a test bench (Figure 1) is developed. Five solar panels (SOLARWATT M18-36 GET EK; 18Wp) were used to power three DC diaphragm pumps (SHURflo, 12 VDC, P=30W). Solar converter (Victron Blue Solar 48/24/12V) was required between solar panels and pumps. These pumps mounted in parallel to maximize the amount of water pumped compared to installed PVWPS power and potential irradiance during irrigation.
Figure 1.
Established photovoltaic DC pumping system in laboratory.
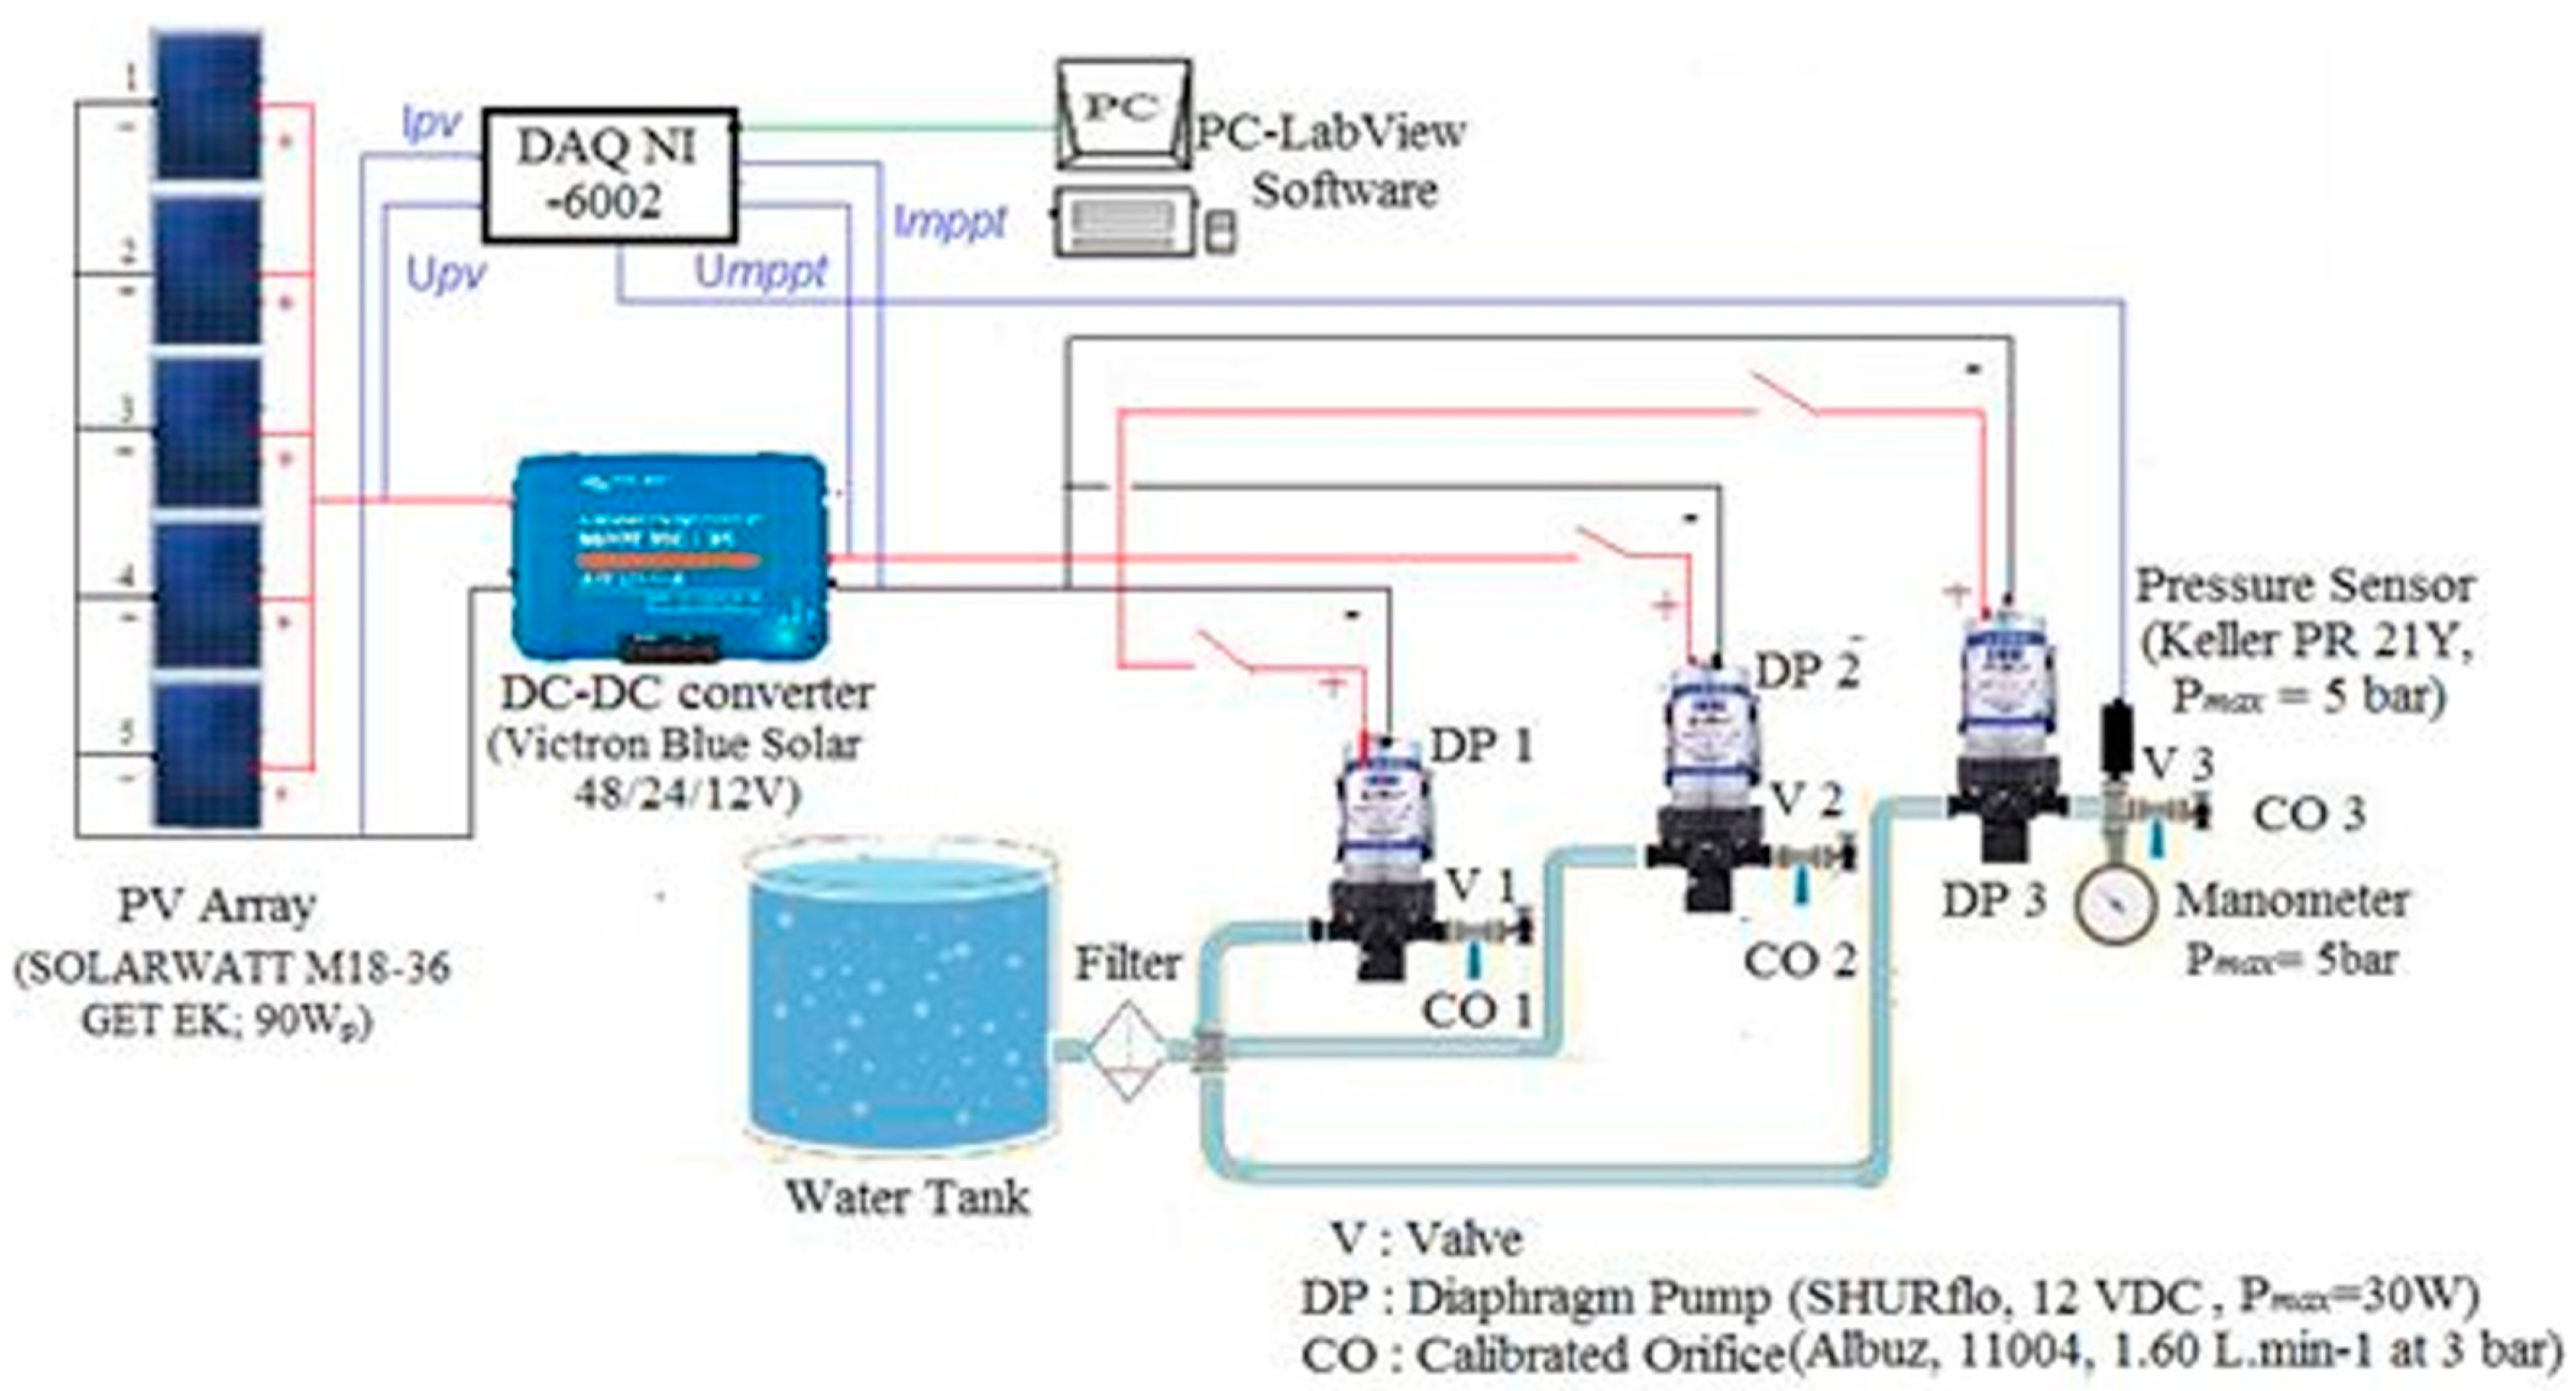
Output currents of solar panel and converter were measured using current sensor (ACS712), The operating pressure was gauged with an analog sensor (Keller PR 21Y, maximum pressure = 5 bar) positioned at the pump outlet to assess their flow rates. This data collection occurred over a single day, spanning from 8:00 am to 6:00 pm. The data obtained through NI 6009 were meticulously processed to systematically pick five data points per second. This was done to evaluate the electrical and hydraulic efficiencies, which were influenced by the changes in the solar irradiance and the operating points of the pumps.
Where, Ppv, Pmppt, a1, b1, a2, b2, Vs1 and Vs2 are power of PV panel, power of MPPT converter, coefficients of current calibration curves and Voltages sensors outputs, respectively.
Ppv= Vpv×Ipv;
Pmppt = Vmppt×Imppt
Ipv = (a1×Vs1) + b1;
Imppt = (a2×Vs2) + b2
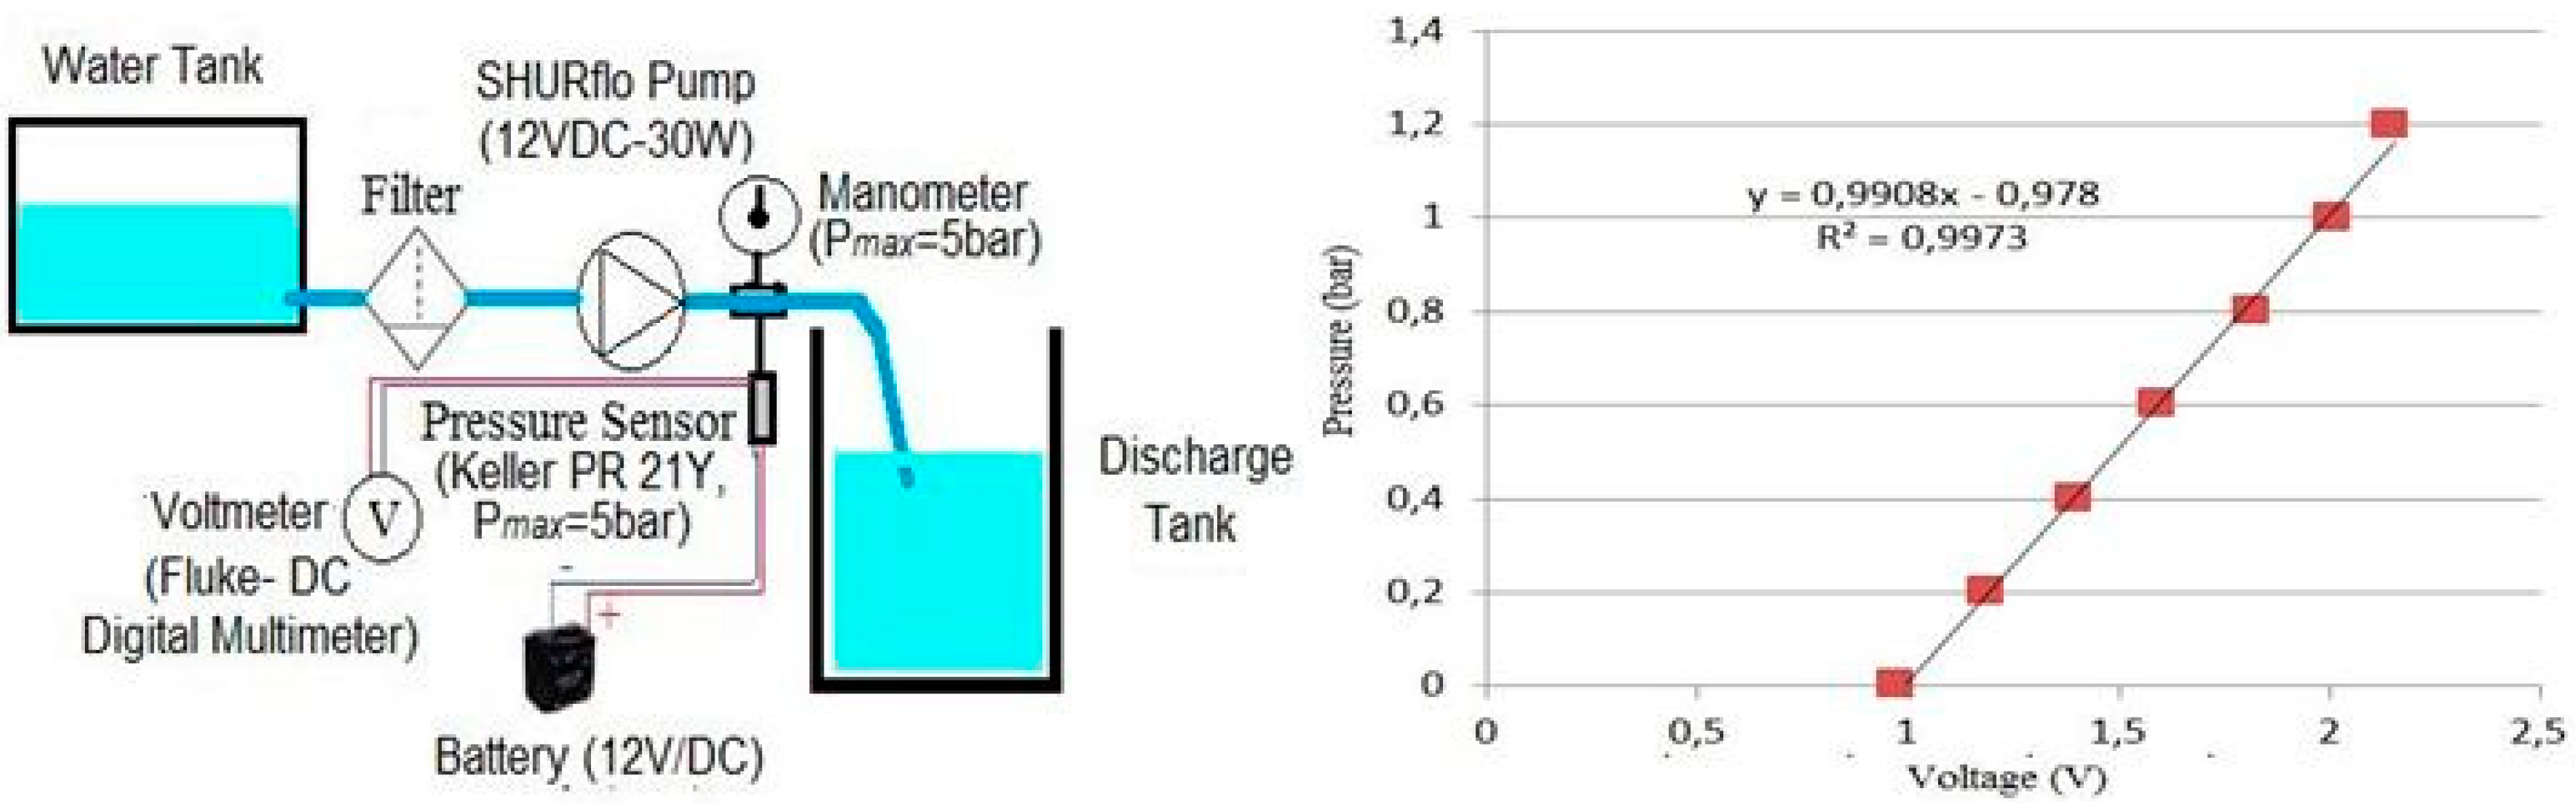
Pressure and flow at the pump outlet were manually recorded several times to verify the accuracy of calibration test (Figure 2).
Figure 2.
Setup calibration of the pump; and the calibration curve (Pressure versus Voltage).
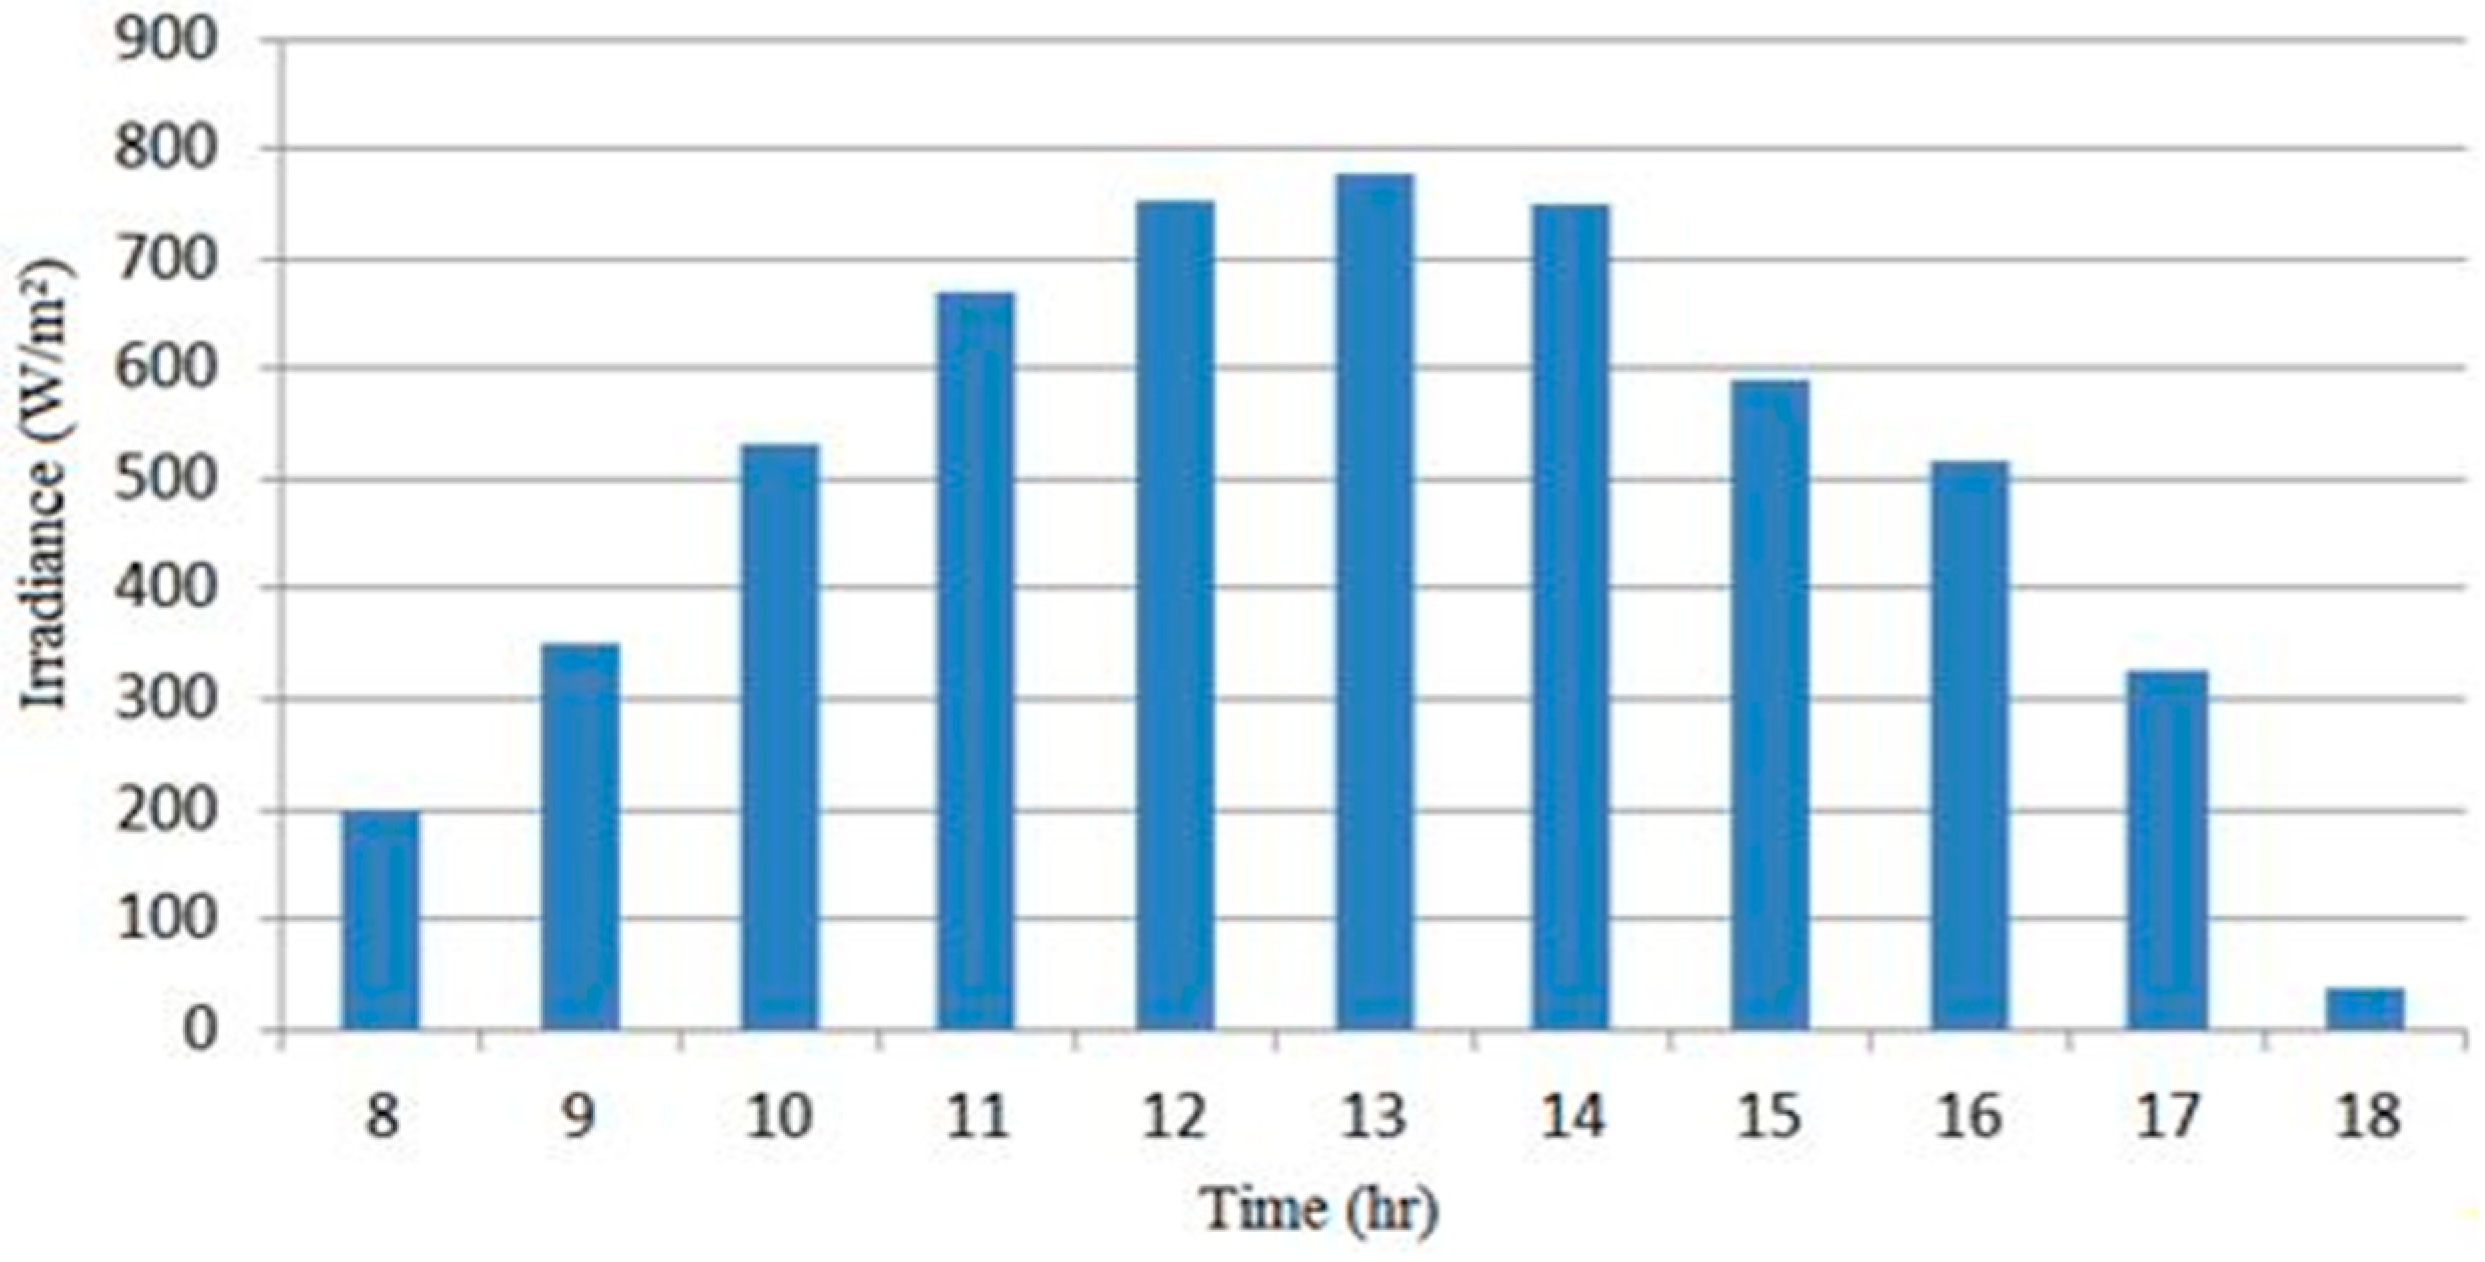
Irradiance measurements were obtained from a meteorological station situated at the research center, precisely located at coordinates X: –7.624233 and Y: 32.953487. The irradiance data for March 20th, served as the reference point (Figure 3).
Figure 3.
Daily solar irradiance of March 20th.
3. Modeling of PVWPS
In order to assess the connection between solar irradiance and the hydraulic efficiency of our photovoltaic pumping setup, we employed both power and exponential growth models. We selected these models due to their capacity to capture rapid growth trends. Exponential and Power models are characterized by these two equations 3 and 4, respectively:
Where: y is the desired output at a given time, a is the initial value of y (when x=0), b is the base of the exponential, often called the growth factor, and x is the independent variable.
Where: y, a, b and x are the desired output at a given time, proportionality coefficient, the exponent of the power, and the independent variable, respectively.
y= a. exp (b*x)
y= a. xb
The fitting of the generated models was assessed using the Root Mean Square Error (RMSE) method (eq. 5). Additionally, the Mean Absolute Error (MAE) (eq. 6) and the correlation coefficient (R²) were employed to demonstrate how well the model curves fit.
Where Mi and Ci are measured and calculated values, respectively and N is the number of measurements.
4. Results and Discussions
4.1. Results of Experimental Study
Standalone DC PVWPS performance was evaluated using a multi pumps approach. The system was monitored from 08:00 am to 06:00 pm showing its behavior. Taking into consideration irradiance and hydraulic power induced, three behaviors were obtained, the behavior of morning, mid-day and afternoon (Table 1)

Table 1.
Daily performance of PVWPS according to irradiance change and portion of switched on pump (experimental test results).
Table 1.
Daily performance of PVWPS according to irradiance change and portion of switched on pump (experimental test results).
| Time | Irradiance (W/m²) | Number of operating Pumps | Mean Pressure (bar) (CV%) | Mean Flowrate (L/min) (CV%) |
Mean Hydraulic Power (CV%) |
Mean Hydraulic Yield% (CV%) |
|---|---|---|---|---|---|---|
| 08. am | 178 | 1 | 01.18 (16) | 02.46 (08) | 04.65 (24) | 30 (19) |
| 197 | 2 | 00.45 (20) | 03.28 (11) | 02.41 (28) | 13 (31) | |
| 213 | 3 | 00.26 (19) | 03.61 (10) | 01.51 (27) | 07 (26) | |
| 09. am | 331 | 1 | 01.24 (17) | 02.43 (09) | 04.74 (24) | 33 (18) |
| 350 | 2 | 00.71 (20) | 02.91 (10) | 03.44 (28) | 14 (23) | |
| 368 | 3 | 00.45 (22) | 03.29 (12) | 02.39 (32) | 07 (32) | |
| 10. am | 515 | 1 | 02.63 (27) | 03.19 (14) | 02.51 (37) | 06 (28) |
| 530 | 2 | 00.93 (37) | 02.70 (19) | 04.00 (56) | 13 (38) | |
| 544 | 3 | 00.60 (32) | 03.08 (17) | 02.96 (45) | 06 (40) | |
| 11. am | 662 | 2 | 00.84 (37) | 02.83 (19) | 03.39 (55) | 12 (42) |
| 679 | 3 | 00.65 (35) | 03.03 (20) | 03.11 (47) | 07 (38) | |
| 12. pm | 749 | 2 | 00.76 (24) | 02.91 (13) | 03.39 (32) | 12 (31) |
| 758 | 3 | 00.72 (26) | 02.93 (15) | 03.38 (36) | 06 (38) | |
| 01. pm | 777 | 3 | 00.78 (31) | 02.87 (17) | 3.55 (41) | 34 (38) |
| 02. pm | 754 | 2 | 01.12 (33) | 02.61 (18) | 04.25 (46) | 13 (37) |
| 748 | 3 | 00.95 (28) | 02.74 (16) | 03.90 (40) | 06 (38) | |
| 03. pm | 670 | 2 | 01.08 (32) | 02.64 (18) | 04.16 (45) | 12 (38) |
| 508 | 3 | 00.94 (27) | 02.71 (15) | 03.96 (37) | 06 (36) | |
| 04. pm | 534 | 1 | 01.97 (29) | 02.69 (16) | 03.97 (40) | 12 (35) |
| 517 | 2 | 01.00 (29) | 02.67 (16) | 04.08 (40) | 09 (37) | |
| 500 | 3 | 00.45 (38) | 03.30 (22) | 02.36 (53) | 06 (39) | |
| 05. pm | 344 | 1 | 00.80 (53) | 03.01 (31) | 03.16 (73) | 24 (48) |
| 326 | 2 | 00.59 (32) | 03.11 (19) | 02.89 (44) | 10 (38) | |
| 312 | 3 | 00.36 (30) | 03.45 (19) | 01.95 (38) | 06 (38) | |
| 06. pm | 37 | 1 | 00.62 (28) | 03.06 (16) | 03.03 (38) | 25 (35) |
| 34 | 2 | 00.20 (25) | 03.74 (13) | 01.16 (35) | 09 (47) | |
| 42 | 3 | 00.04 (34) | 04.05 (19) | 00.29 (46) | 02 (55) |
Table 1 presents the system’s response to different levels of irradiance. In the morning hours (8:00 am, 9:00 am, 10:00 am), three distinct flow patterns are described, each associated with a specific number of active pumps required to adjust the system’s operating point. This adjustment is essential for optimizing system performance. In essence, achieving better performance depends on adapting the number of active pumps to match the actual irradiance levels. When the pressure requirements are met, an improved performance is linked to a specific count of engaged pumps.
However, at 11:00 am, 12:00 pm, 2:00 pm and 3:00 pm, the increase of pressure was observed as irradiance were important. Consequently, an increase of hydraulic power was obtained. At 11:00 am, 12:00 pm, 2:00 pm and 3:00 pm, there is no need to operate with one small pump, since using the two pumps meet maximum pressure (1.12 bar). The results obtained showed efficiency arranged from 6% to 13%. According to mid-day (1:00 pm) with high irradiance (777 W/m2), the system showed interesting performance (Around 34%). Indeed, the abundant irradiance at 777 W/m² enabled the system to run with the maximum number of pumps without causing any decline in pump efficiency, as previously demonstrated during the morning incident irradiance. One system behavior using three pumps was obtained, since use of a single small pump increases pressure and risks damaging the system.
At the afternoon, the system performance showed a behavior similar to the morning. This can be attributed to the insufficient incident irradiance in the range of 38-516 W/m². The findings reveal an efficiency range between 2% and 25%. When the pump is not operating under low levels of sunlight, adjustments in flow and pressure become necessary to optimize pump efficiency, aligning with the hydraulic equivalence model of the connected pumps. The system’s performance is noticeably influenced by the presence of low incident irradiance at 38 W/m², subsequently affecting pump efficiencies.
As per the pumping system’s response for each configuration of the number of active pumps, Table 1 demonstrates a significant variance in terms of efficiency. This table provides a summary of the independent system’s behavior throughout the day. Under low irradiance conditions, the system operates in normal mode (with all pumps active), resulting in lower yields. However, activating the pumps shifts the system’s operating point to an optimal position, compelling it to perform more efficiently (yielding higher results).
In contrast, during periods of high irradiance, the system operates in normal mode, maintaining consistent performance. It is worth noting that changes in irradiance negatively impact the system’s efficiency. This observed variability in efficiency is attributed to the standalone system’s behavior, as it lacks capacitors to regulate and stabilize the instantaneous relationship between flow and pressure, which is influenced by fluctuations in solar irradiance.
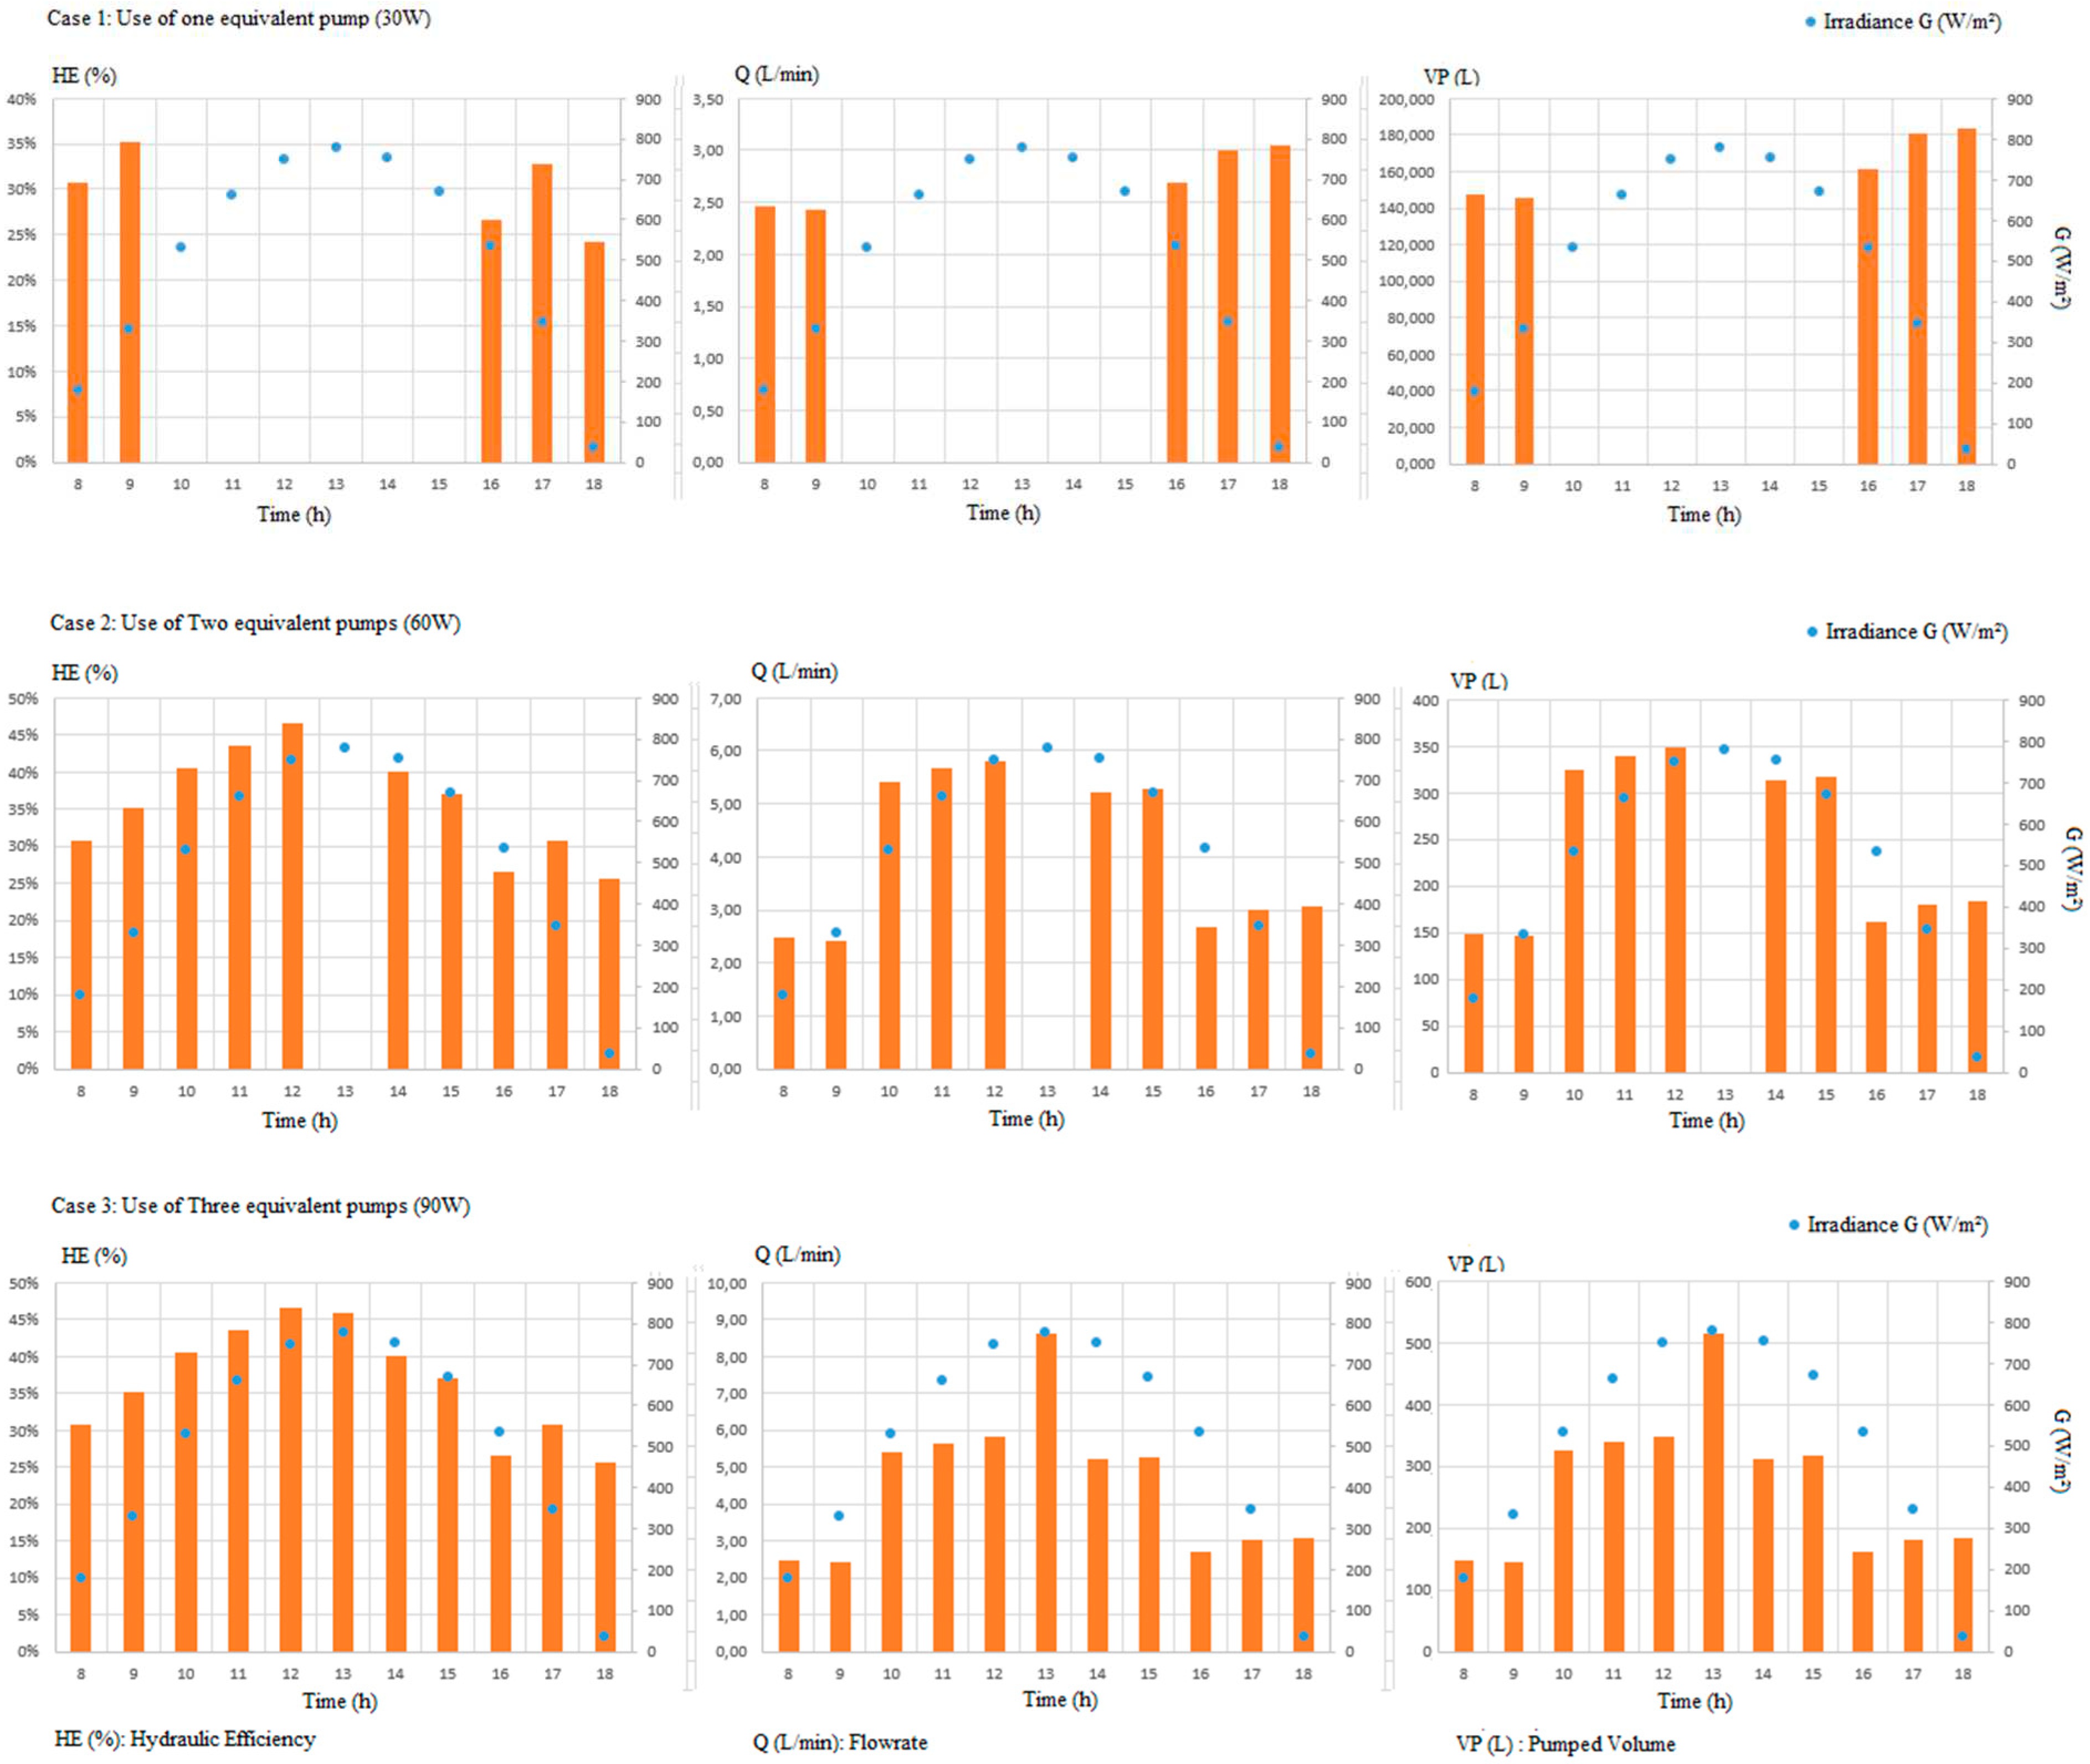
Hydraulic performance of the PVWPS was tested by three cases: The first case using one equivalent pump (30W), the second using two equivalent pumps (2*30W) and the last using three equivalent pumps (3*30W).
At low irradiance, first case results (Figure 4a–c) showed that the equivalent pump (30W) operated efficiently in low irradiance. In normal condition, results showed that the system could not operate efficiently (7%). But when we changed three pumps (90W) with one equivalent pump (30W), the efficiency of the system was reached (30%), with an average daily pumped water obtained was about 164 (L/h). This case (Use of one equivalent pump) allowed the system to operate 5 hours per day since, at high irradiance, use of a single equivalent pump increases pressure and risks damaging the system. (Figure 4a/ Case 2) showed that the system perform using two pumps (60W) with irradiance increasing. Consequently, the daily pumped water was increased and reached a maximum of 349 (L/h) (Figure 4c/ Case 2). Operating time of the system using two equivalent pumps (60W) was 5 hours (From 10:00 am 03:00 pm excluding 01:00 pm). At low irradiance the system showed a worse efficiency using three equivalent pumps (90W). Except a significant increase in yield (46%) was obtained at 01:00 pm when irradiance was at its maximum (777 W/m²) (Figure 4a/ Case 3). This case (use of three equivalent pumps (90W)) allowed the system to operate 1 hour. At high irradiance,the daily pumped water was about 516(L/h) (Figure 4c/ Case 3).
Figure 4.
PVWPS behavior using: One equivalent Pump (Case 1); Two equivalent Pumps (Case 2); Three equivalent Pumps (Case 3): a). Hydraulic Efficiency (HE-G); (b). Flowrate (Q-G); (c). Pumped Volume (VP-G).
Figure 4.
PVWPS behavior using: One equivalent Pump (Case 1); Two equivalent Pumps (Case 2); Three equivalent Pumps (Case 3): a). Hydraulic Efficiency (HE-G); (b). Flowrate (Q-G); (c). Pumped Volume (VP-G).
4.2. Modeling of PVWP System Using Experimental Data
PVWPS model
Simulations of the standalone PVWPS’s performance are conducted on an hourly basis. Growth curves were generated through the application of two non-linear models—the exponential model and the power model—utilizing two distinct software platforms: Python and R. These models were evaluated based on the coefficient of determination R²(Table 2)
Table 2.
Coefficients values of the generated models linking all parameters with time.
| Increasing Irradiance Trend | |||||
| Model | Software Tools | a | b | R² | |
| Irradiance Vs Time | Exponential | Python | 62,093 | 0,202 | 0,86 |
| Exponential | R | 62,092 | 0,202 | 0,86 | |
| Power | Python | 2,874 | 2,219 | 0,9 | |
| Power | R | 2,874 | 2,22 | 0,9 | |
| Electrical Power Vs Time | Exponential | Python | 5,185 | 0,203 | 0,88 |
| Exponential | R | 5,185 | 0,203 | 0,88 | |
| Power | Python | 0,262 | 2,188 | 0,88 | |
| Power | R | 0,262 | 2,188 | 0,88 | |
| Hydraulic Power Vs Time | Exponential | Python | 0,293 | 0,358 | 0,82 |
| Exponential | R | 0,293 | 0,358 | 0,82 | |
| Power | Python | 0,001 | 3,917 | 0,62 | |
| Power | R | 0,001 | 3,917 | 0,62 | |
| Decreasing Irradiance Trend | |||||
| Model | Software Tools | a | b | R² | |
| Irradiance Vs Time | Exponential | Python | 22539,772 | -0,251 | 0,82 |
| Exponential | R | 22539,772 | -0,251 | 0,82 | |
| Power | Python | 10939913,381 | -3,679 | 0,78 | |
| Power | R | 3378000 | -3,245 | 0,77 | |
| Electrical Power Vs Time | Exponential | Python | 1328,821 | -0,218 | 0,85 |
| Exponential | R | 1328,793 | -0,218 | 0,84 | |
| Power | Python | 295836,902 | -3,209 | 0,81 | |
| Power | R | 298100 | -3,21 | 0,81 | |
| Hydraulic Power Vs Time | Exponential | Python | 8165,452 | -0,423 | 0,95 |
| Exponential | R | 8165,454 | -0,423 | 0,95 | |
| Power | Python | 243140608,495 | -6,158 | 0,95 | |
| Power | R | 12560000 | -5,038 | 0,92 | |
After an analysis of the generated models, it was observed that their outcomes exhibited a high degree of similarity. Nevertheless, the exponential model emerged as the top choice due to its superior performance according to the evaluation metrics R² (Figure 5).
Figure 5.
a/ Fitting Curves of two models of Irradiance versus Time, b/ . Fitting Curves of two models of EP versus Time, c/ Fitting Curves of two models of HP versus Time.
Figure 5.
a/ Fitting Curves of two models of Irradiance versus Time, b/ . Fitting Curves of two models of EP versus Time, c/ Fitting Curves of two models of HP versus Time.
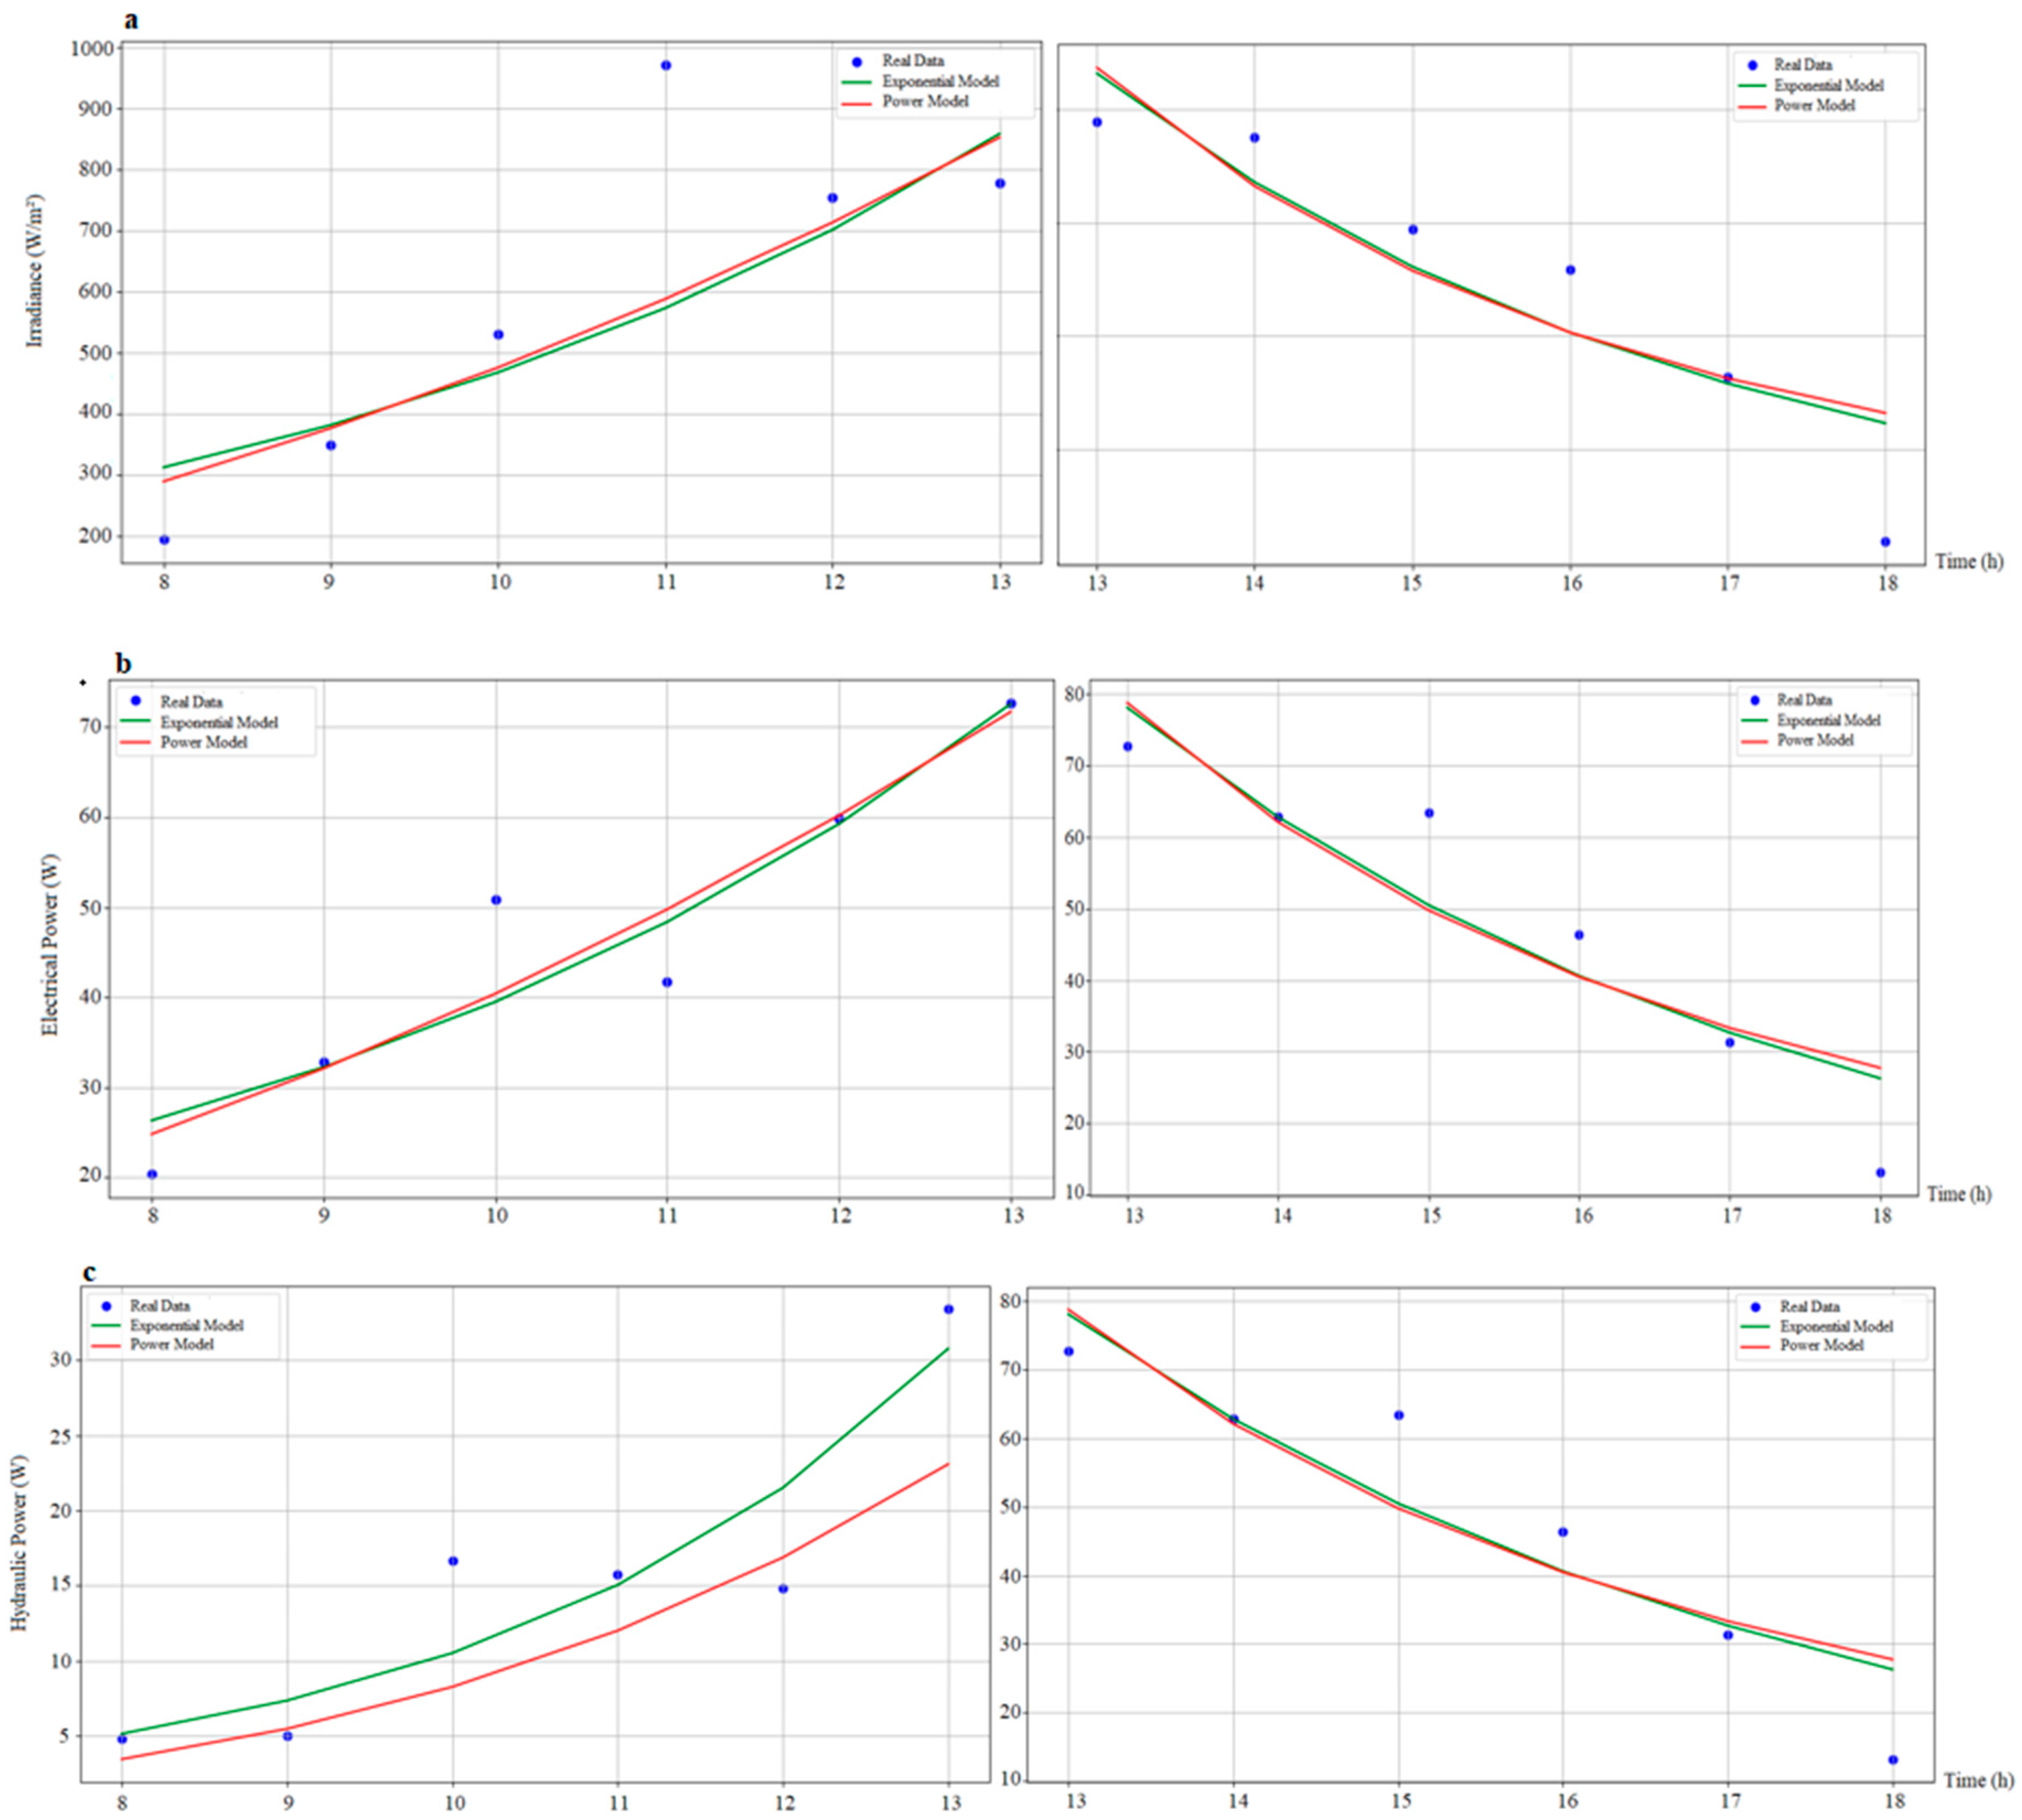
Based on the fitting curves, the results have demonstrated comparable behavior between the two models, with a minor distinction observed primarily in relation to the exponential model (Table 3). The analytical model’s validation involved utilizing RMSE and MAE methods. The outcomes of the error assessments concerning irradiance, electrical power, and hydraulic power are consolidated in Table 3.
From the exponential models presented herein, the derivations of transfer functions become feasible, establishing interrelationships among various parameters such as hydraulic power versus electrical power, and electrical power concerning irradiance. The mathematical representation of these transfer functions is as follows:
- Electrical Power & IrradianceEP= 5,185*EXP(0,203*t)G= 62,093*EXP(0,202*t)G= EP* 11,975* EXP(-0,001*t)
- Hydraulic Power & Electrical PowerHP = 8165,452*EXP(-0,423*t)EP= 5,185*EXP(0,203*t)EP= HP*0.0006332 * EXP (0.626 * t)
Where: EP, G, HP, t are Electrical Power, Irradiance, Hydraulic Power and time, respectively.
Table 3.
Validation Model using RMSE and MAE Methods.
| Increasing Irradiance Trend | ||||||
| Time | Real Data | PP Exponential Model | Power Model | |||
| Irradiance Vs Time | 08:00 | 196 | 313 | 290 | Exponential Model | |
| 09:00 | 350 | 382 | 377 | RMSE | 79,09 | |
| 10:00 | 530 | 468 | 476 | MAE | 73,83 | |
| 11:00 | 671 | 573 | 588 | Power Model | ||
| 12:00 | 754 | 701 | 713 | RMSE | 66,68 | |
| 01:00 | 777 | 858 | 852 | MAE | 62,33 | |
| Electrical Power Vs Time | 08:00 | 20,38 | 26,31 | 24,79 | Exponential Model | |
| 09:00 | 32,85 | 32,23 | 32,08 | RMSE | 05,97 | |
| 10:00 | 50,90 | 39,48 | 40,39 | MAE | 04,30 | |
| 11:00 | 41,72 | 48,36 | 49,76 | Power Model | ||
| 12:00 | 59,84 | 59,25 | 60,19 | RMSE | 05,92 | |
| 01:00 | 72,71 | 72,59 | 71,71 | MAE | 04,25 | |
| Hydraulic Power Vs Time | 08:00 | 04,84 | 05,14 | 03,45 | Exponential Model | |
| 09:00 | 05,01 | 07,35 | 05,47 | RMSE | 04,00 | |
| 10:00 | 16,69 | 10,51 | 08,26 | MAE | 3,15 | |
| 11:00 | 15,75 | 15,04 | 12,00 | Power Model | ||
| 12:00 | 14,81 | 21,51 | 16,87 | RMSE | 5,75 | |
| 01:00 | 33,43 | 30,77 | 23,08 | MAE | 4,41 | |
| Decreasing Irradiance Trend | ||||||
| Time | Real Data | PP Exponential Model | Power Model | |||
| Irradiance Vs Time | 01:00 | 777 | 863 | 873 | Exponential Model | |
| 02:00 | 751 | 671 | 664 | RMSE | 111,05 | |
| 03:00 | 589 | 522 | 515 | MAE | 93,83 | |
| 04:00 | 517 | 406 | 406 | Power Model | ||
| 05:00 | 327 | 316 | 325 | RMSE | 119,49 | |
| 06:00 | 38 | 2446 | 264 | MAE | 99,33 | |
| Electrical Power Vs Time | 01:00 | 72,71 | 78,10 | 78,78 | Exponential Model | |
| 02:00 | 62,85 | 62,81 | 62,11 | RMSE | 07,94 | |
| 03:00 | 63,42 | 50,50 | 49,77 | MAE | 06,29 | |
| 04:00 | 46,40 | 40,61 | 40,46 | Power Model | ||
| 05:00 | 31,37 | 32,66 | 33,31 | RMSE | 08,98 | |
| 06:00 | 13,18 | 26,26 | 27,73 | MAE | 07,24 | |
| Hydraulic Power Vs Time | 01:00 | 33,43 | 33,40 | 33,59 | Exponential Model | |
| 02:00 | 19,49 | 21,88 | 21,28 | RMSE | 02,33 | |
| 03:00 | 18,95 | 14,33 | 13,92 | MAE | 01,77 | |
| 04:00 | 08,84 | 09,39 | 09,35 | Power Model | ||
| 05:00 | 04,02 | 06,15 | 06,44 | RMSE | 02,47 | |
| 06:00 | 03,15 | 04,03 | 04,53 | MAE | 01,88 | |
5. Conclusion
Multi-Operating Pump approach was developed in this paper. The concept of this approach consists on switching on/off a number of pumps to choose adequate hydraulic impedance of a connected irrigation network and boost daily water pumped volume. Based on experimental data obtained, a mathematical model was developed with reference to daily occurring irradiance inputs in order to predict optimal performance outputs. The model test showed the feasibility of predicting operating conditions for better PVWPS performances specifically to different irradiance levels. The energy management method proposed showed the possibility of using only photovoltaic power supply to fully cover the water requirements of an irrigated system. In fact, using a set of parallel pump powers rather than using a single large pump of equivalent power can be an effective solution to increase PVWPS operating time and take more advantage of daily irradiance to achieve high hydraulic yields. The RMSE and MAE methods were used to show a good fitting between experimental and simulated results.
Abbreviations
| AI | Artificial Intelligence |
| BDC | Brushed Direct Current |
| DC | Direct Current |
| HEexp | Experimental Hydraulic Efficiency |
| HEmod | Modeling Hydraulic Efficiency |
| HPPT | Hydraulic Power Point Tracking |
| IncCond | Incremental Conductance |
| MBE | Mean Bias Error |
| MPPT | Maximum Power Point Tracking |
| P&O | Perturb and Observe |
| PV | Photovoltaic |
| PVWPS | Photovoltaic Water Pumping System |
| R&D | Research and Development |
| RMSE | Root Mean Square Error |
References
- Vafaeipour, M., Hashemkhani, Z.S., Morshed, V.M.H, Derakhti, A. and Keshavarz, E. M. (2014). Assessment of regions priority for implementation of solar projects in Iran: new application of a hybrid multi-criteria decision-making approach. Energy Conversion and Management.86,653–663.
- Moumen, M. (2014). Guide D’Irrigation Localize De L’Agriculteur. Maroc: FAO, Office Régional de la Mise en Valeur Agricole Doukkala.
- Akihiro, Oi.T., Anwari, M., and Taufik, M. (2009). Modeling and simulation of photovoltaic water pumping system. Proc. 3rd Asia Int. Conf. Modelling & Simulation. pp. 497-502. Bali, Indonesia. https://doi.org/10.1109/AMS.2009.85. [CrossRef]
- Khan, A. Md. T., A. Md. Rishad, S. I. Ahmed, and S. I. Khan. (2012). Design and performance analysis of water pumping using solar PV. Proc. 2nd International Conference on the Developments in Renewable Energy Technology (ICDRET). pp. 1–4. Dhaka, Bangladesh, 5-7 January.
- Sefriti, B., and I. Boumhidi. (2015). Neural network incremental conductance MPPTalgorithm for photovoltaic water pumping system. Proc. 10th International Conference on Intelligent Systems: Theories and Applications (SITA). pp. 1–6. Rabat, Morocco, 20-21 October.
- Essam, E. A., A. M. Zaki, and M. M. El-Sotouhy. (2017). Design and control of a standalone PV water pumping system. Journal of Electrical Systems and Information Technology (JESIT), 4(2): 322–337.
- Almeida, R. H., Ledesma, J. R., Carrêlo, I. B., Narvarte, L., Ferrara, G., Antipodi, L. (2018). A new pump selection method for large-power PV irrigation systems at a variable frequency. Energy Convers Manage, 174:874–85. https://doi.org/10.1016/j.enconman.2018.08.071. [CrossRef]
- Hamidat, A., B. Benyoucef, and T. Artani. (2003). Small-scale irrigation with photovoltaic water pumpingsystem in Sahara regions. Renewable Energy, 28(3): 1081–1096.
- Hamidat, A., and Benyoucef, B. (2008). Mathematic models of photovoltaic motor-pump systems. Renewable Energy, 33, 933–942.
- Protogeropoulos, C., and S. Pearce. (2000). Laboratory evaluation and system sizing charts for a ‘second generation’ direct PV-powered, low cost submersible solar pump. Solar Energy, 68(5): 453–474.
- Kashyap, M., S. Chanana, and A. J. Singh. (2013). Solar powered pmdc motor drive. Proc. Conference on Advances in Communication and Control Systems (CAC2S), Dehradun, 18-22 April 2013.
- Harkani, A., El Aissaoui, A., Fihri Fassi, H., El Kacimi, O. (2019). Performance Study of a Standalone Direct Pumping Photovoltaic System Used for Drip Irrigation, CIGR journal. 21 (3): 114-122.
- Zhounian, L., Qian, L., An, Z., Wenjie, Z., Hailiang, X., AND Dazhuan, W. (2020). Improving Reliability of Pumps in Parallel Pump Systems Using Particle Swam Optimization Approach. IEEE Access. 8: 58427- 58434.
- Koor, M., Vassiljev, A., Koppel, T. (2015). Optimization of pump efficiencies with different pumps characteristics working in parallel mode. Advances in Engineering Software. 101: 69-76.
- Katan, R.E., Agelidis, V.G., and Nayar, C.V. (1996). Performance analysis of a solar water pumping system. Proc. the IEEE int. conf. on power electronics, drives, and energy systems for industrial growth (PEDES). pp. 81–87. New Delhi, India.
- Zahab, E.A., Zaki, A.M., and El-sotouhy. M.M. (2017). Design and control of a standalone PV water pumping system. Journal of Electrical Systems and Information Technology (JESIT), 4 (2), 322-337. http://dx.doi.org/10.1016/j.jesit.2016.03.003. [CrossRef]
- Jafar, M. (2000). A model for small-scale photovoltaic solar water pumping. Renewable Energy, 19,85–90.
- de Blas MA, Torres JL, Prieto E, Garcıa A. Selecting a suitable model for ́ characterizing photovoltaic devices. Renew Energy 2002;25:371–80.
- Ahonen, T., Tamminen, J., Ahola, J., Viholainen, J., Aranto, N. and Kestilä, J. (2010). Estimation of pump operational state with model-based methods. Energy Conversion and Management.51(6), 1319–1325. http://dx.doi.org/10.1016/j.enconman.2010.01.009. [CrossRef]
- Kalaiselvan, A., Umashankar, S., Paramasivam, S., and Norbert, H. Real Time Simulation of Variable Speed Parallel Pumping System. Proc. 9th International Conference on Applied Energy, ICAE2017, Cardiff, UK, pp. 2102- 2108, 21-24 August 2017.
- Zhang, Z., Kusiak, A., Zeng, Y., and Wei, X. (2016). Modeling and optimization of a wastewater pumping system with data-mining methods. Applied Energy, 164, 303-311. https://doi.org/10.1016/j.apenergy.2015.11.061. [CrossRef]
Disclaimer/Publisher’s Note: The statements, opinions and data contained in all publications are solely those of the individual author(s) and contributor(s) and not of MDPI and/or the editor(s). MDPI and/or the editor(s) disclaim responsibility for any injury to people or property resulting from any ideas, methods, instructions or products referred to in the content. |
© 2023 by the authors. Licensee MDPI, Basel, Switzerland. This article is an open access article distributed under the terms and conditions of the Creative Commons Attribution (CC BY) license (http://creativecommons.org/licenses/by/4.0/).
Copyright: This open access article is published under a Creative Commons CC BY 4.0 license, which permit the free download, distribution, and reuse, provided that the author and preprint are cited in any reuse.


