Submitted:
02 September 2023
Posted:
06 September 2023
You are already at the latest version
Abstract
The Sustainable Development Goals (SDGs) require collaboration among academia, indus-try, citizens, public administration and politics. Analysis and monitoring of the SDGs is a deci-sive step in evaluating possible corrective actions. In this regard, this paper assesses the perfor-mance of Italian regions in 2021 compared to the values recorded in 2020. An online survey among academics aims to support Multi-criteria decision analysis (MCDA) choices, which aims to calculate a sustainability score for Italian regions.
The results, based on 27 targets, show that the northern regions show better performance, with the province of Trento topping the list. This is followed by Valle d'Aosta and the province of Bolzano, confirming the trio that emerged in the previous year. A very interesting fact is the growth of the central regions, which overall tend to reach a value close to that of the northern regions. In particular, Toscana, Marche and Lazio stand out for a good performance. It is also confirmed that the southern regions occupy the last places in the ranking with the only excep-tion being Abruzzo.
The implications of this paper move toward a pragmatic approach that goes beyond the ideological in order to arrive at solutions and projects that are viewed with sharing by stake-holders. There is a need to foster collaboration between different territorial realities in order to achieve a social community in which young people have a role in which they can grow and share their ideas. Made in Italy is a target on which to enhance the SDGs to help make the Medi-terranean area a crossroads of the future global economy.
Keywords:
Italy
; monitoring
; multicriteria decision analysis
; performance indicators
; sustainable development goals
; sustainability
1. Introduction
The topic of Sustainable Development Goals (SDGs) shows a very growing trend in the literature. Climate change, health and global governance puts the SDGs at the center of research [1], but nevertheless care must be taken to avoid sustainable washing phenomena by favoring a pragmatic approach [2]. Markets are characterized by new economic models, as it has been shown that gross domestic product does not capture the full economic dimension of sustainability, and an overcoming of the selfish view that may characterize some stakeholders emerges [3]. Another key aspect is cooperation to support economic exchanges, foster technological innovation and develop a global culture of sustainable development [4]. One issue to be resolved is the structural distances between actors and the consequences of their acts, and policy has the task of reducing and eliminating them [5]. Indeed, policy actions are necessary because otherwise the achievement of the SDGs goals is at risk [6] and the literature points to the lack of studies assessing the policy impact of the goals in different countries [7].
The SDGs are a driver for sustainable transitions, and local governments can enhance intermediary roles for partnership with private sector [8]. However, the issue requires a global partnership between developed and developing countries [9]. Different territorial areas have their own specificities, but everyone's contribution toward the SDGs is essential [6], and to this end, it is crucial to define and implement a national strategy for sustainable development [7]. Cities' progress toward SDGs can be proposed according to eight directions (economy, environment, human, operations, organization, society and staff). In particular, the criteria considered most relevant are sustainable policy and green public investments, and rationing public spending and political stability also show important relevance [10].
The relationship between indicators on the SDGs and policy implications is emphasized in the literature [11]. A major problem in assessing the SDGs is the multiplicity of aspects to be considered, the different scales [12], but also the relationships that are present among the indicators [13]. While in fact SDG 5 has the most relationships, unlike SDG 7 [14], similarly the literature has placed more emphasis on SDG 3 followed by SDG 2 and SDG 1, less so on SDG 14 and SDG 16 [2]. Thus, to achieve the 2030 Agenda, synergies among the goals must be exploited and suitable trade-offs should be identified [15].
The literature on sustainability assessment gives indicators a relevant and strategic role. Thus, the need to measure and monitor progress toward the SDGs is present [16,17]. It is useful to create a sustainable development index and dashboard to track countries' development in relation to the SDGs [18]. Analyses can be conducted at various levels, concerning a single country [19], as a comparison of several countries [17] or arriving at a global view [20]. Thus, the use of statistical methods supports assessments of sustainability goals [21,22] and the analyses need to integrate different information [23,24]. According to the literature, ranking various options is likely to raise awareness and accountability for achieving the SDGs [25,26]. The use of multicriteria decision analysis (MCDA) can aggregate different data to compare several territories [27].
In particular, this approach has been used to assess the performance of not only Italian cities [10] but also Italian regions [28]. This paper continues this line of research by providing new data and aims to provide new insights from various perspectives. Regarding the methodological part, aspects of MCDA are investigated through an online survey with academics. With regard to the practical part, on the one hand, the relevance of monitoring the results of the SDGs is emphasized and on the other hand, the ranking among Italian regions is identified. These aspects make it possible to provide managerial and policy implications also based on the decomposition of the final result according to the geographical macro-area.
2. Materials and Methods
This section consists of an online survey among academics to assess insights on MCDA versus the SDGs (section 2.1) and a description of MCDA and related data used in this paper (section 2.2).
2.1. Survey with academic experts
Expert surveys are a method used in the literature in order to use background to provide useful assessments [29,30]. In this paper we want to consider what approaches may be most useful for conducting MCDA. Responses can be scored from 0% to 100%. The content of the email described the purpose of the paper, the time to complete the questionnaire (maximum 5 minutes), the methodology used, and that only the first 20 responses would be included. In addition, it was specified that anonymity would be guaranteed. The call for profiles was chosen by looking at Scopus database and identifying academics with at least ten years of experience and expertise on SDGs issues. Approximately one hundred e-mails were forwarded, and among the twenty responses obtained, it appears that about a quarter were female. In addition, about half were associated with Europe. The survey was conducted in August 2023.
The following questions were asked and the values obtained are also presented as they are preparatory to section 2.2.
Q1: How useful do you think MCDA is as a method for assessing the SDGs?
The responses of this question show a percentage of 97.5% with more than half of the experts assigning the highest value. The result is not surprising given the wide use of MCDA. A limitation of the paper also emerges from this question, as some experts pointed out that such an approach is not the only useful to compare different methodologies in order to monitor and analyze SDGs values.
Q2: How congruous do you think the number of public indicators on the SDGs is?
In this case the responses reach 87.5% however it should be noted that in particular the responses from European countries judge very positively the contribution that Eurostat provides in comparing different data between European countries, but then the analyses change at the individual country level. So in that case, their judgment would have been significantly lower.
Q3: How robust do you think an indicator composed of 27 targets is for assessing individual local realities?
The affirmative responses amounted to 77% confirming what emerged in the previous point. In this case, having specified individual local realities led to providing a higher value to this question.
We proceed below to evaluate the approach related to values and weights, where it is specified that answers should be provided for a small sample of targets (about 30).
Q4: How valid do you think the 0-1 range approach is (0=weak performance; 1=strong performance)?
Q5: How valid do you think the maximum value approach is as a benchmark (1=strong performance)?
In these questions, a choice toward the 0-1 approach emerges (94.75% vs. 68%) because it is believed that just as emphasis is placed on the best performance, likewise the weakest performance should be penalized. Clearly, the 0-1 approach tends to accentuate differences in terms of normalized values.
Q6: How valid do you think equal weight among SDGs (EWG) scenario is?
Q7: How valid do you think equal weight among indicators (EWI) scenario is?
In these questions, too, a clear choice toward the EWI scenario emerges (89.75% vs. 65.75%) because with a small number of criteria, individual SDGs might themselves be underrepresented. Thus, both methods are considered suitable with a larger sample of criteria, since being alternatives may or may not confirm the results obtained.
Finally, two final questions are provided on the possible decomposition of the results obtained.
Q8: How useful do you think it is to break down the final data according to the three dimensions of sustainability?
Q9: How useful do you think it is to break down the final figure according to geographic macro areas?
The subdivision by economic, environmental and social dimensions is considered very useful however like the previous observation it is noted that its significance loses significance (74.5%) when the sample number is small. In contrast, geographic data is crucial (89.25%) when conducting analyses at the level of individual territorial realities.

Table 1.
Survey on-line according to 20 academic experts - All data are in percentages.
| AVG | 1 | 2 | 3 | 4 | 5 | 6 | 7 | 8 | 9 | 10 | 11 | 12 | 13 | 14 | 15 | 16 | 17 | 18 | 19 | 20 | |
|---|---|---|---|---|---|---|---|---|---|---|---|---|---|---|---|---|---|---|---|---|---|
| Q1 | 97.5 | 95 | 100 | 100 | 95 | 100 | 100 | 95 | 100 | 100 | 95 | 100 | 95 | 100 | 95 | 100 | 100 | 100 | 100 | 90 | 90 |
| Q2 | 87.5 | 90 | 90 | 90 | 85 | 90 | 95 | 90 | 90 | 85 | 85 | 85 | 85 | 90 | 90 | 85 | 85 | 90 | 90 | 80 | 80 |
| Q3 | 77 | 70 | 80 | 85 | 75 | 85 | 85 | 75 | 90 | 80 | 70 | 70 | 65 | 85 | 75 | 75 | 70 | 85 | 85 | 65 | 70 |
| Q4 | 94.75 | 95 | 100 | 95 | 100 | 95 | 95 | 90 | 95 | 100 | 90 | 95 | 95 | 95 | 90 | 95 | 95 | 95 | 100 | 90 | 90 |
| Q5 | 68 | 70 | 80 | 70 | 75 | 65 | 70 | 65 | 70 | 70 | 65 | 70 | 65 | 65 | 60 | 65 | 65 | 70 | 70 | 65 | 65 |
| Q6 | 65.75 | 75 | 70 | 70 | 65 | 65 | 60 | 60 | 65 | 60 | 65 | 70 | 70 | 65 | 60 | 60 | 60 | 65 | 70 | 70 | 70 |
| Q7 | 89.75 | 90 | 95 | 95 | 90 | 90 | 90 | 85 | 90 | 90 | 85 | 90 | 90 | 90 | 85 | 90 | 95 | 95 | 95 | 85 | 80 |
| Q8 | 74.5 | 75 | 65 | 65 | 70 | 75 | 65 | 75 | 75 | 90 | 75 | 80 | 60 | 75 | 65 | 85 | 80 | 85 | 90 | 65 | 75 |
| Q9 | 89.25 | 95 | 90 | 90 | 90 | 85 | 85 | 90 | 85 | 90 | 90 | 95 | 90 | 95 | 85 | 90 | 90 | 85 | 90 | 85 | 90 |
2.2. MCDA
MCDA synthesizes a large multiplicity of data, also considering their different nature and belonging to different concepts. The method is widely used in the literature to make comparisons between different geographical realities, and the initial objective is to arrive at a ranking among different alternatives in order to provide insights for the decision-maker [27]. So the first step is to assign suitable criteria to achieve this goal, the second is to assign weights and values to these criteria, and the third is to aggregate the different information obtained. One of the major limitations is the no dynamicity that does not evaluate the interactions between the different variables.
MCDA falls under the field of operations research, and the final results can be decomposed to understand which criteria affect the others the most. In addition, strengths and weaknesses can be ranked for each alternative and how the trend varies over the years can be measured. The alternatives are represented by the geographic realities, which in this paper are the twenty regions of Italy (considering for the Trentino Alto Adige region the decomposition into the two provinces of Bolzano and Trento). The goodness of these analyses depend on their data reliability and for this reason the data released by ASviS (Italian Alliance for Sustainable Development) are used, an approach already used in the literature [31,32], given the active role that ASviS plays in the country allowing for recent and reliable data.
This paper aims to monitor the data against the previous report [33] where 26 targets are confirmed, while two targets are not re-proposed: i) Target 4.1 (a) - By 2030, reduce the number of students who do not reach the sufficient level of numerical proficiency (18-19 years old) below the 15% quota and ii) Target 4.1 (b) - By 2030, reduce the number of students who do not reach the sufficient level of literacy proficiency (18-19 years old) below the 15% quota. Instead, this paper in accordance with the new report released by ASviS for 2022 considers a new target [34]: By 2027 to reach at least 33% of places in early childhood education services (3-36 months). Specifically, the latest report shows values for 27 Targets attributable to 16 of the 17 SDGs (SDG 17 is absent) - Table 2.
In particular, it emerges that SDG4 is the one most represented with 3 targets, while there are 2 targets for the following SDGS 2, 3, 6, 7, 8, 9, 11, 15 and 16. The remaining 6 targets refer to SDGs 1, 5, 10, 12, 13 and 14, while SDG 17 appears to be absent. Another observation concerns the reference year related to the targets data. In fact for 12 targets it is 2021 (Targets 1.2, 2.4 (a), 2.4 (b), 3.6, 4.1, 4.3, 5.5, 8.5, 8.6, 15.3, 16.3 and 16.7), while for 10 other targets it is less than 2021 (Targets 3.4, 4.2, 6.3, 6.4, 9.5, 11.2, 11.6, 12.4, 14.5 and 15.3). Finally, for 5 Targets, the Italian figure is 2021, while that of individual regions is before 2021 (Targets 7.2, 7.3, 9.c, 10.4, 13.2). It should also be pointed out that the latest available data are used.
All values were compared with each other and found to be homogeneous, so no changes are needed to make the most populous regions comparable with the least populous ones. The aggregate sustainability indicator is based on the product between a value and a weight associated with the different criteria and calculated for all alternatives. Having completed the first stage of multi-criteria analysis, we proceed to examine whether the data are homogeneous with each other or not, and it emerges that they are all comparable with each other. Thus, the more populous regions have data that can be compared with the less populous ones. Particular mention should be made of Target 14.5 whose value is not proposed for six regions (Piemonte, Valle d'Aosta, Lombardia, Province Bolzano, Province Trento and Umbria). A number of 26 Targets is therefore considered for these six regions. Instead, when the value 0 is proposed, it is considered as input data.
The second step is to assign weights and values to the criteria for the different alternatives. A value of 1 is assigned to the most relevant performance and 0 to the least relevant performance. In addition, an intermediate value is assigned to the other alternatives using the interpolation method. The choice of the normalized method is the one that emerges most from the indications from the literature [3] and Section 2.1. Table 3A and Table 3B propose all the values assigned to the 21 alternatives. Two assumptions are considered: i) Italy's data for target 11.6 is estimated as a function of population and ii) the maximum value for target 7.2 is considered to be 100%.
Once the values are obtained, we proceed to consider the weights to be assigned to the criteria. Two approaches (EWG and EWI) are proposed in the literature [28], and in accordance with what was obtained in section 2.1, the EWI scenario is considered, in which all criteria have equal importance. A further methodological distinction is proposed regarding the decomposition of the outcome into the three dimensions: environmental, economic and social. In fact, again what was obtained in section 2.1 will be followed and the results of this decomposition will not be proposed. Thus, this paper will assign equal weight to all targets, opting not to give more relevance to some of them. This choice appears to be consistent with the literature [23,35]. This practice appears to be widespread because it is based on the logic of assigning the same impact to the individual indicators analysed [36,37]. However, approaches with different weights can also be used [38].
Finally, all data are aggregated together and a sustainability score for each alternative is obtained by the product between a row vector (representing the values of the criteria) and a column vector (representing the weight of the criteria). The results will also be broken down according to the three main geographic macro-areas of Italy:
- North - Valle d'Aosta, Piemonte, Lombardia, Liguria, Trentino Alto Adige, Veneto, Friuli Venezia Giulia and Emilia Romagna.
- Center - Toscana, Umbria, Marche and Lazio.
- South - Abruzzo, Molise, Campania, Puglia, Basilicata, Calabria, Sardegna and Sicilia.
3. Results
The main result of a quantitative analysis is to provide numbers, and in the case of this paper the sustainable performance of the Italian regions is indicated. Another key step is to be able to compare these results with those of the previous year. The number of criteria examined is small compared to other studies [39], but nevertheless it still plays its role of providing new information to stakeholders. Pragmatic sustainability calls for evaluating the performance of alternatives based on real data, which could be affected by virtuous policies. Within the EWI scenario, the different values were normalized, which made it possible to homogenize criteria characterized by different units of measurement (Table 2). The first result proposed in this paper is the sustainability score in the EWI scenario in which a value trending toward 1 indicates excellent sustainability performance. All alternatives will be compared with each other but also with respect to the Italian average that will be considered in addition to the 21 alternatives. It is worth noting that Figure 1 proposes the average value for the Trentino Alto Adige region (that is composed by two Provinces of Bolzano and Trento and the same will also be repeated in the monitoring phase).
The results see the Province of Trento excel with a score of 0.725, which is a high performer and shows a significant difference from the Valle d'Aosta which follows with 0.643 and Province of Bolzano with 0.620. The difference is thus 0.082 with the second and increases to 0.220 compared to the national benchmark. There are 13 alternatives placed above the national average (0.505) with Abruzzo placed at 0.507, while the last position occupied by Puglia is 0.139 away from the national benchmark. These results show how northern regions occupy the top positions, while southern regions are placed at the bottom of the ranking. Interesting to note the performance of the three central regions (Toscana, Marche and Lazio) that are behind the first three northern regions mentioned above.
In order to understand the results obtained, it is identified which alternatives perform better or worse in the individual targets and the corresponding concentration indicator - Table 4 and Figure 2.
The province of Trento confirms the leadership in targets 3.4 and 16.3, while it loses the first position in target 4.1 still maintaining a high value while its reduction is much more significant in target 9.5. Relative to the Province of Bolzano retains leadership in targets 8.5 and 8.6 and becomes so in target 1.2 replacing Valle d'Aosta, which nevertheless confirms it in targets 2.4 (b), 5.5, 6.4, 7.2 and 16.7. The different alternatives present their highest value in the different targets, the only ones never to reach this target are Veneto, Friuli Venezia Giulia, Emilia Romagna, Puglia, Sicilia and Sardegna. However, the data in Table 4 show how for some targets of the same SDG the alternatives are able to achieve diametrically opposite results. This is the case for Valle d'Aosta for target 2.4 (a) and 2.4 (b), Lombardia and Molise for targets 11.2 and 11.6, and Abruzzo for targets 15.3 and 15.5.
Focusing on the alternatives occupying the first three positions, however, it should be pointed out that they too show weak performance in the following cases: the Province of Trento presents a value below 0.2 only in targets 2.4 (b) and 7.3; the Province of Bolzano in addition to the two mentioned above also in targets 9.5 but especially occupies the last position in targets 9.c and 16.3 and finally Valle d'Aosta is last in targets 2.4 (b) and 9.5 and below 0.2 in targets 7.3, 11.2 and 12.4. Thus it emerges how the Province of Trento prevails over Valle d'Aosta despite having fewer first positions in the targets as it has a higher value in the other criteria.
Among the northern regions, Veneto is the only one that is below the national average presenting performance below 0.2 in targets 2.4 (a), 2.4 (b), 7.2, 11.6, 14.5 and 15.5 and as highlighted above does not excel in any target. As noted earlier, the central regions show very interesting performance. Primacy is verified in target 14.5 (Toscana), targets 4.2 and 4.3 (Umbria), target 10.4 (Marche) and target 9.c (Lazio). In contrast, the situation tends to change considerably when analyzing the southern ones, where only Abruzzo is above the national average. Abruzzo is first in target 15.5 has very high performance in target 4.1 and high performance in target 11.6. Similarly, it is last in targets 6.4 and 15.3 and is also weak in target 11.2. The other seven regions occupy the last positions in the ranking. This aspect clearly denotes a strong criticality, which, however, is also proclaimed at the European level, where targeted funding programs are allocated precisely for southern Italy.
The indicator concentration shows that where this value is high, many alternatives have significant performance, and this reduces the advantages of those occupying the top positions over the other alternatives. Similarly, when the value of the concentration index is low, the alternatives occupying the top positions will have much more significant numerical values than the alternatives that have values close to the concentration index. High values occur for targets 15.3 and 2.4 (a), while low values occur for targets 14.5, 7.2 and 11.2.
An additional element of analysis is to compare the Sustainability score in the EWI scenario in the two reference years - Figure 3 and Table 5.
The two maps show no significant color differences, while the analysis of the values shows that numerical changes have occurred. As noted earlier the very low target concentration index 9.5 in the previous year led the Province of Trento to a very high value. This explains the 0.060 reduction. The other alternative that marks a reduction is Veneto. As for increases, there are very important changes for the central regions Lazio (0.058) and Toscana (0.053). At the ranking level, the most significant change is in Lazio, which climbs seven positions, while Lombardia and Liguria lose three positions.
These variations also determine that the performance of the three macro-areas tends to increase when comparing years – Figure 4. While the increase in the northern regions is minimal (+0.004), the increase in the southern regions is appreciable (+0.022) where a very important role is played by Sardinia and Puglia. However, it is the central regions, as shown above, that mark the most significant increases with +0.041. However, these data confirm that there are gaps between different regions with different target performances. It is worth noting that the new figure for the central regions (0.569) is close to that of the northern regions (0.574). These values are significantly different from that of the southern regions (0.436).
Finally in order to give robustness to the results obtained we proceed to consider the EWG scenario, in which the same criteria values are considered but evaluating the aggregation of targets within the SDGs. This will inevitably tend to mediate the effect for targets that are a larger sample within the SDGs – Table 6 and Figure 5. For the six regions that do not consider target 14.5, the contribution from 15 SDGs is assessed.
It can be seen that EWG values are higher than EWI values due to the different normalization approach on criteria. This alternative scenario demonstrates how much a chosen method influences the results obtained in this paper. The EWG scenario which tends to be more synthetic than EWI leads to different measurements. The results of this EWG scenario sees several ranking positions change and 11 alternatives kept the same position. In the top part of the ranking the province of Bolzano overtakes Valle d'Aosta, Lombardia gains two positions while Lazio loses three. As for the final part of the ranking, no changes are noted. Further relevant data is that twelve of the thirteen alternatives maintain a value above the national average: Emilia Romagna is the exception.
Figure 6.
Sustainability Score in both EWI and EWG scenarios - a comparison among macro-areas.
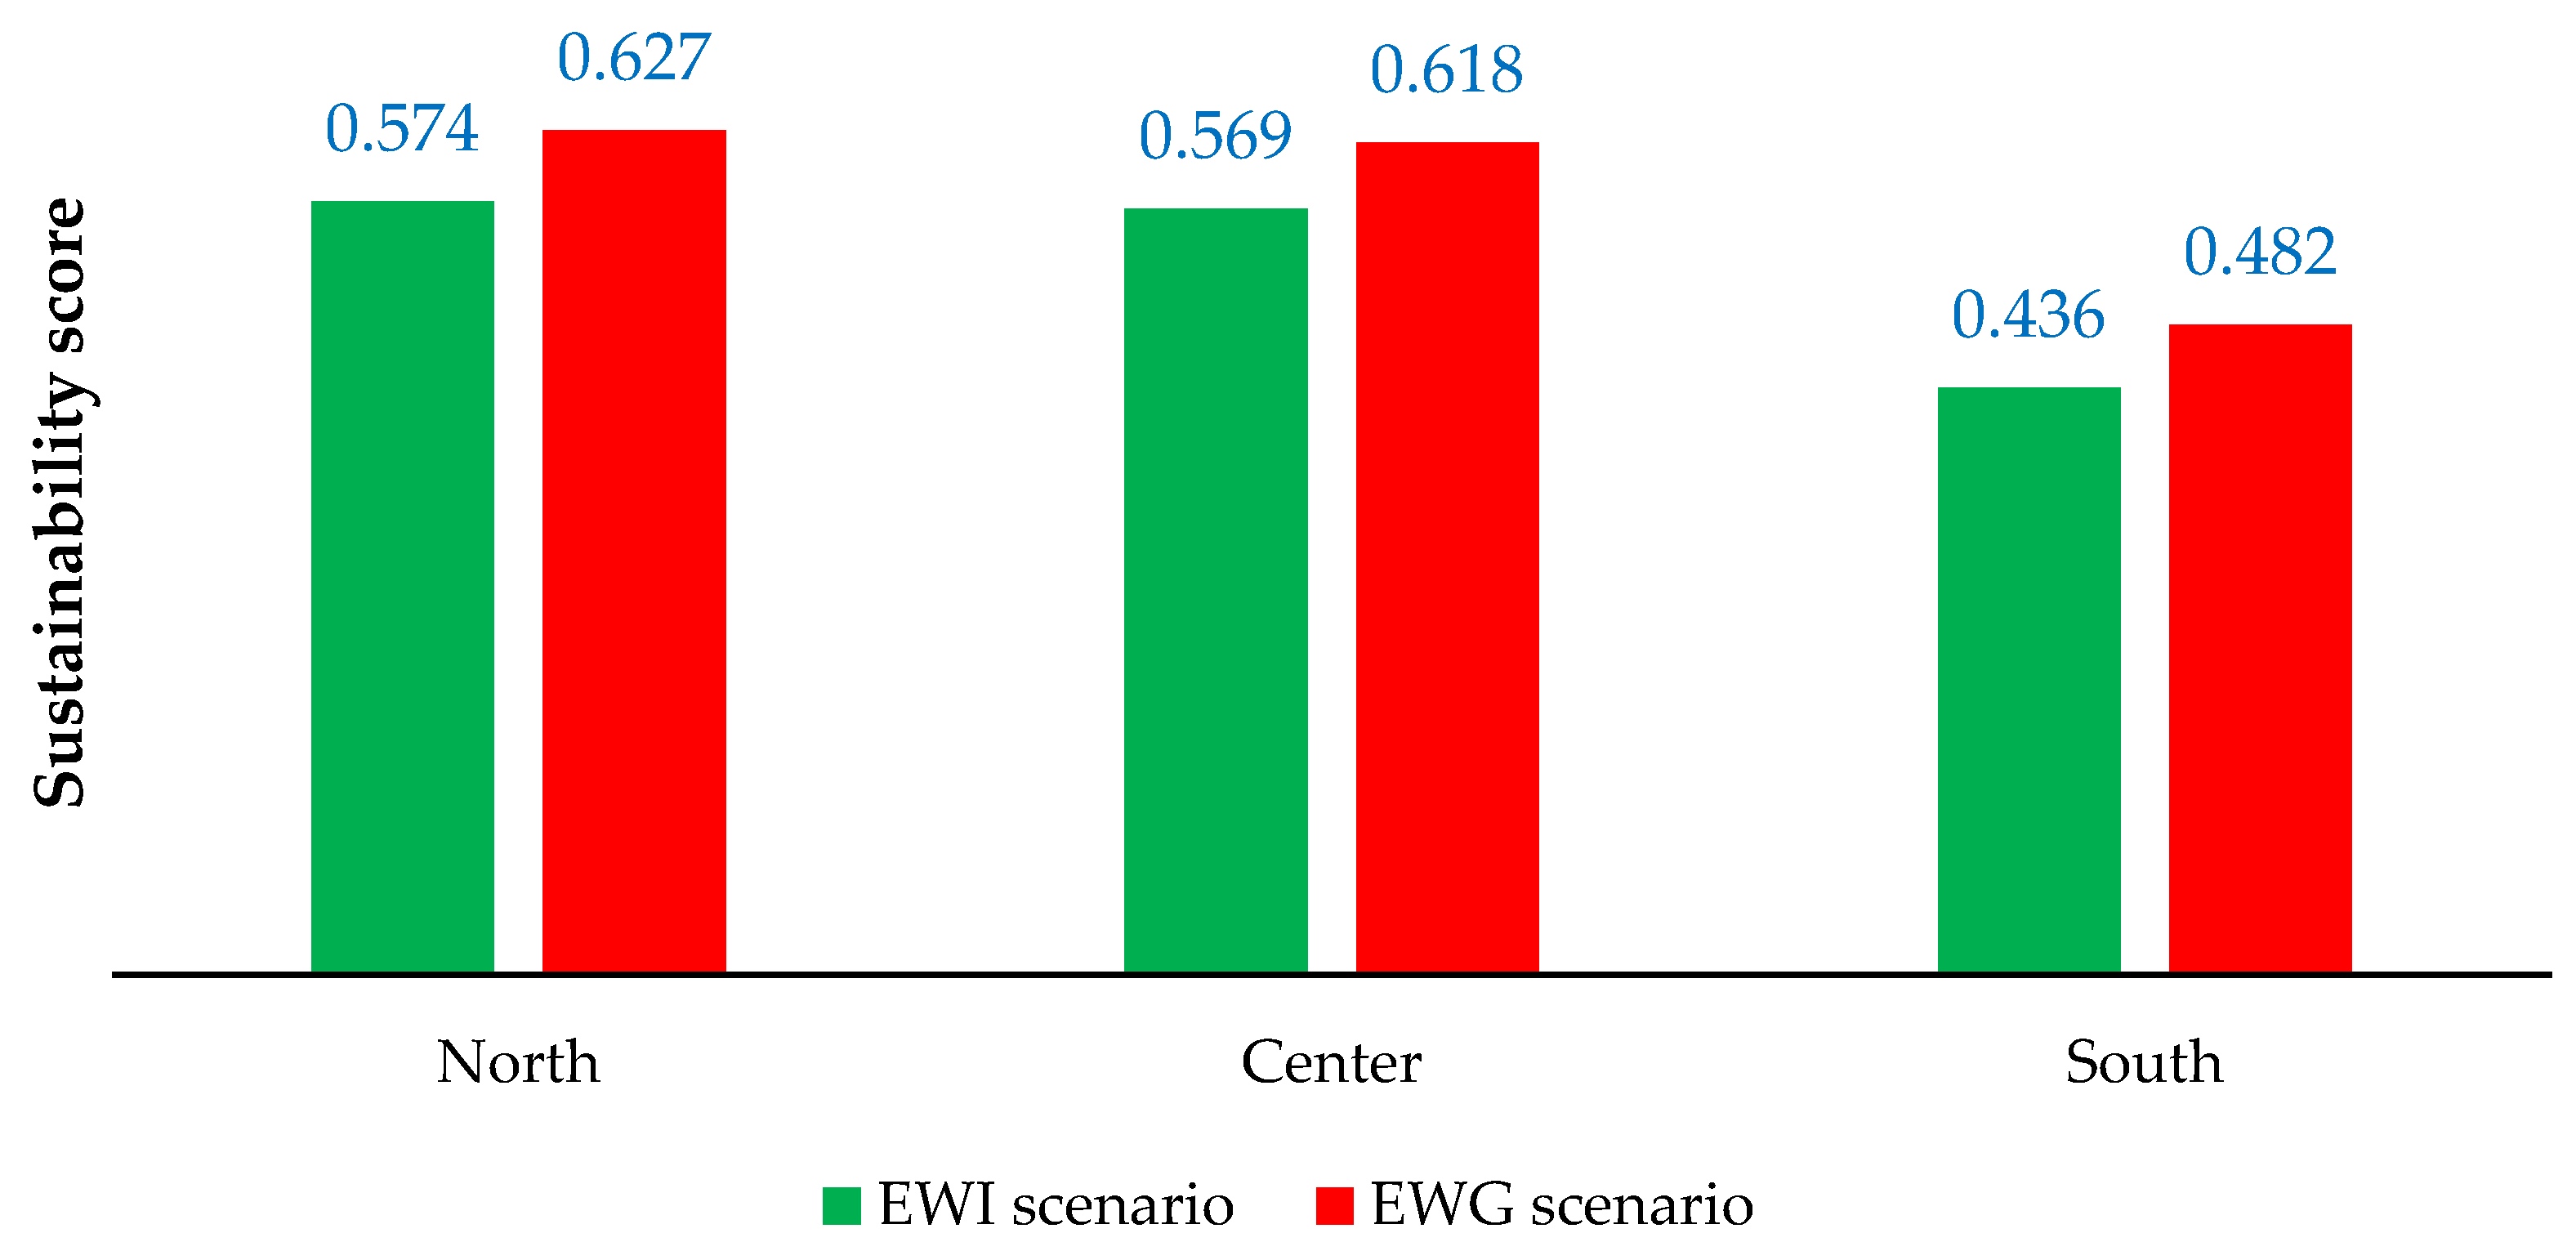
Finally, we proceed to aggregate the data at the macro area level, and since the value of the national average in the EWG scenario is greater than the EWI scenario (0.545 vs. 0.505), the three individual values turn out to be greater. The difference between the areas does not tend to change significantly as the values vary in the range 0.047-0.053. The northern regions are slightly ahead of the central regions (0.627 vs 0.618), while the difference is much more pronounced than in the southern regions (0.482).
4. Conclusions
The issue of sustainability has entered the agenda of many governments, and a number of citizens are committed to change toward a social welfare model. The challenge is complex and takes time to meet. Likewise, one cannot take the risk of making further unsuitable choices as the balance of ecosystems shows clear signs of weakness. While there are still some skepticisms about climate change and there are analyses that rely on sustainable washing, this paper aims to focus attention on the strategic role of monitoring the SDGs. A key step to highlight critical issues that emerge over time in order to implement possible corrective measures.
The methodological contribution of this paper is on a very established methodology such as MCDA in which insights are provided to be applied on the attribution of values and weights. It emerges that the range 0-1 is considered correct in order to bias the strongest and weakest performances of the examined alternatives. Moreover, in a context where the number of criteria is small, the EWI method appears to be more appropriate than the EWG method. The motivation is mathematical since where there is already a contained data availability, the additional aggregation step risks losing some of the information that emerges from the individual criteria.
The practical contribution of this paper confirms the North-South divide in Italy in which northern regions excel in the sustainability indicator, while seven of the southern ones close the ranking list. In this direction, very important is the result of Abruzzo, which aspires to have performance equal to that of the central regions. It is precisely these regions, and in particular Toscana, Lazio and Marche, that are on the edge of the podium occupied by three alternatives belonging to northern Italy. The Province of Trento confirming its leadership followed by Valle d'Aosta and the Province of Bolzano. Similarly, if these regions travel with a green card toward sustainability goals, Campania, Sicilia and Puglia take a red card.
This paper has limitations related to the number of criteria that are available, but first and foremost we need to be grateful to those who make it possible to have this data available. In this context, ASviS makes it possible to monitor the situation. This paper proposes not only to compare individual alternatives with the national benchmark but to make comparisons since the normalized 0-1 method determines that the value achieved does not depend only on one's own performance. However, it is desirable to invest in obtaining more available data and that these data are updated. In fact, the other limitation of the research is that not all of the data are for 2021.
Nonetheless, this paper provides additional managerial and policy implications. It emerges how sustainability can succeed where different strategic choices and funding policies have failed to close the gap between different areas of Italy. The NGEU in Italy was changed because some projects would not be completed on time. Sustainability suggests not using approaches in which investments are concentrated in a limited period, but are spread out over time and allow for the diffusion of skills and resources. This paper considers 16 of the 17 SDGs (SDG 17 is not considered) and so the approaches used obviously change according to specific contexts. The basic idea would be to invest in the sectors that will drive the economy of the future, where there will be demand in order to have adequate supply. Likewise, this supply must have a strongly national character in order not to be subjected to geopolitical risks and foreign dependence. In this direction, the new name of the Ministry of Enterprises and Made in Italy clearly indicates this direction. Thus, the choices of the future are based on a policy direction in which there is a tendency to produce within one's own country, in which research and innovation are done, in which health skills are valued, and in which social approaches that counter forms of selfishness are developed. Stakeholder engagement is therefore essential, with input also required from all citizens, and in particular there is a need to invest in the youngest, the target audience of the NGEU. Businesses are called upon to revise their strategies and public administrations to change to be able to capture the dynamic aspects coming from the external context.
The basic question is as follows. Economic theories have taught us that a euro today is worth more than a euro tomorrow, but how do we quantify this tomorrow, how much is the opportunity cost of capital for projects that are different from each other and affect not only the Italian context but have a global vocation? The challenge therefore calls not only for germinating national resources but also for building bridges of freedom and democracy with other countries to move toward a common goal. Is this the hope with which Europe was born? Sustainability is thus not only the 2050 goal for climate neutrality but requires a pragmatic approach in which solutions are explored that give opportunities to future generations and create a brotherhood among peoples.
Green and circular resources call for thinking with a perspective that is not only focused on the short term but looks to the future in which to involve citizens to make them feel part of the change. Likewise, there is a need to overcome parochialism in order to bring out collaborations between territorial realities, since in the struggle between the small ones in the end those who emerge and win are not them, who instead come out even weaker. Finally where young people are trained in the different trades it is necessary to retain these backgrounds. However, their demands are modified as the abandonment of stress, the idea of being part of a group, and the possibility of having recognition for achievements determine insights that all public and private actors should reflect on.
It is the time for action, for proposing ideas, solutions and not the time to stop at sterile no's and maintaining one's own interests to build the Europe of the future with a key role played by the realities of the Mediterranean that will play a key role in a global economy oriented towards sustainability.
Author Contributions
Conceptualization, I. D. and M. G.; methodology, I. D. and M. G.; data curation, I. D. and M. G.; writing-original draft preparation, I. D. and M. G.; writing-review and editing, I. D. and M. G.; supervision, I.D. All authors have read and agreed to the published version of the manuscript.
Funding
This research received no external funding.
Institutional Review Board Statement
Not applicable.
Informed Consent Statement
Not applicable.
Data Availability Statement
Not applicable.
Acknowledgments
This study was carried out within the PEACE (Protecting the Environment: Advances in Circular Economy) and received funding from the “Fondo per il Programma Nazionale di Ricerca e Progetti di Rilevante Interesse Nazionale (PRIN)” Investimento 1.1-D.D. 104.02-02-2022, 2022ZFBMA4. This manuscript reflects only the authors’ views and opinions, and can be considered responsible for them.
Conflicts of Interest
The authors declare no conflict of interest.
References
- Sianes, A.; Vega-Muñoz, A.; Tirado-Valencia, P.; Ariza-Montes, A. Impact of the Sustainable Development Goals on the academic research agenda. A scientometric analysis. PLoS ONE 2022, 17, e0265409. [CrossRef]
- Ali, S.M.; Appolloni, A.; Cavallaro, F.; D’Adamo, I.; Di Vaio, A.; Ferella, F.; Gastaldi, M.; Ikram, M.; Kumar, N.M.; Martin, M.A.; et al. Development Goals towards Sustainability. Sustainability 2023, 15, 9443. [CrossRef]
- D’Adamo, I.; Gastaldi, M.; Morone, P. Economic sustainable development goals: Assessments and perspectives in Europe. J. Clean. Prod. 2022, 354, 131730. [CrossRef]
- Zhao, W.; Yin, C.; Hua, T.; Meadows, M.E.; Li, Y.; Liu, Y.; Cherubini, F.; Pereira, P.; Fu, B. Achieving the Sustainable Development Goals in the post-pandemic era. Humanit. Soc. Sci. Commun. 2022, 9, 258. [CrossRef]
- Bonnedahl, K.J.; Heikkurinen, P.; Paavola, J. Strongly sustainable development goals: Overcoming distances constraining responsible action. Environ. Sci. Policy 2022, 129, 150–158. [CrossRef]
- Fuldauer, L.I.; Thacker, S.; Haggis, R.A.; Fuso-Nerini, F.; Nicholls, R.J.; Hall, J.W. Targeting climate adaptation to safeguard and advance the Sustainable Development Goals. Nat. Commun. 2022, 13, 3579. [CrossRef]
- Biermann, F.; Hickmann, T.; Sénit, C.A.; Beisheim, M.; Bernstein, S.; Chasek, P.; Grob, L.; Kim, R.E.; Kotzé, L.J.; Nilsson, M.; et al. Scientific evidence on the political impact of the Sustainable Development Goals. Nat. Sustain. 2022, 5, 795–800. [CrossRef]
- Masuda, H.; Kawakubo, S.; Okitasari, M.; Morita, K. Exploring the role of local governments as intermediaries to facilitate partnerships for the Sustainable Development Goals. Sustain. Cities Soc. 2022, 82, 103883. [CrossRef]
- Halkos, G.; Gkampoura, E.-C. Where do we stand on the 17 Sustainable Development Goals? An overview on progress. Econ. Anal. Policy 2021, 70, 94–122. [CrossRef]
- D’Adamo, I.; Gastaldi, M.; Ioppolo, G.; Morone, P. An analysis of Sustainable Development Goals in Italian cities: Performance measurements and policy implications. Land use policy 2022, 120, 106278. [CrossRef]
- Miola, A.; Schiltz, F. Measuring sustainable development goals performance: How to monitor policy action in the 2030 Agenda implementation? Ecol. Econ. 2019, 164, 106373. [CrossRef]
- Krishankumar, R.; Mishra, A.R.; Ravichandran, K.S.; Peng, X.; Zavadskas, E.K.; Cavallaro, F.; Mardani, A. A Group Decision Framework for Renewable Energy Source Selection under Interval-Valued Probabilistic linguistic Term Set. Energies 2020, 13, 986. [CrossRef]
- Bali Swain, R.; Ranganathan, S. Modeling interlinkages between sustainable development goals using network analysis. World Dev. 2021, 138, 105136. [CrossRef]
- Kuc-Czarnecka, M.; Markowicz, I.; Sompolska-Rzechuła, A. SDGs implementation, their synergies, and trade-offs in EU countries – Sensitivity analysis-based approach. Ecol. Indic. 2023, 146, 109888. [CrossRef]
- Kostetckaia, M.; Hametner, M. How Sustainable Development Goals interlinkages influence European Union countries’ progress towards the 2030 Agenda. Sustain. Dev. 2022, 30, 916–926. [CrossRef]
- De Neve, J.-E.; Sachs, J.D. The SDGs and human well-being: A global analysis of synergies, trade-offs, and regional differences. Sci. Rep. 2020, 10, 15113. [CrossRef]
- Huan, Y.; Liang, T.; Li, H.; Zhang, C. A systematic method for assessing progress of achieving sustainable development goals: A case study of 15 countries. Sci. Total Environ. 2021, 752, 141875. [CrossRef]
- Sachs, J.D.; Schmidt-Traub, G.; Mazzucato, M.; Messner, D.; Nakicenovic, N.; Rockström, J. Six Transformations to achieve the Sustainable Development Goals. Nat. Sustain. 2019, 2, 805–814. [CrossRef]
- Ali, I.; Modibbo, U.M.; Chauhan, J.; Meraj, M. An integrated multi-objective optimization modelling for sustainable development goals of India. Environ. Dev. Sustain. 2021, 23, 3811–3831. [CrossRef]
- Sebestyén, V.; Abonyi, J. Data-driven comparative analysis of national adaptation pathways for Sustainable Development Goals. J. Clean. Prod. 2021, 319, 128657. [CrossRef]
- van Zanten, J.A.; van Tulder, R. Towards nexus-based governance: Defining interactions between economic activities and Sustainable Development Goals (SDGs). Int. J. Sustain. Dev. World Ecol. 2021, 28, 210–226. [CrossRef]
- Ricciolini, E.; Rocchi, L.; Cardinali, M.; Paolotti, L.; Ruiz, F.; Cabello, J.M.; Boggia, A. Assessing Progress Towards SDGs Implementation Using Multiple Reference Point Based Multicriteria Methods: The Case Study of the European Countries. Soc. Indic. Res. 2022. [CrossRef]
- Marti, L.; Puertas, R. Assessment of sustainability using a synthetic index. Environ. Impact Assess. Rev. 2020, 84, 106375. [CrossRef]
- Costanza, R.; Daly, L.; Fioramonti, L.; Giovannini, E.; Kubiszewski, I.; Mortensen, L.F.; Pickett, K.E.; Ragnarsdottir, K.V.; De Vogli, R.; Wilkinson, R. Modelling and measuring sustainable wellbeing in connection with the UN Sustainable Development Goals. Ecol. Econ. 2016, 130, 350–355. [CrossRef]
- García López, J.; Sisto, R.; Benayas, J.; de Juanes, Á.; Lumbreras, J.; Mataix, C. Assessment of the Results and Methodology of the Sustainable Development Index for Spanish Cities. Sustainability 2021, 13, 6487. [CrossRef]
- Cheng, D.; Xue, Q.; Hubacek, K.; Fan, J.; Shan, Y.; Zhou, Y.; Coffman, D.M.; Managi, S.; Zhang, X. Inclusive wealth index measuring sustainable development potentials for Chinese cities. Glob. Environ. Chang. 2022, 72, 102417. [CrossRef]
- Anselmi, D.; D’Adamo, I.; Gastaldi, M.; Lombardi, G.V. A comparison of economic, environmental and social performance of European countries: A sustainable development goal index. Environ. Dev. Sustain. 2023. [CrossRef]
- D’Adamo, I.; Gastaldi, M. Sustainable Development Goals: A Regional Overview Based on Multi-Criteria Decision Analysis. Sustainability 2022, 14, 9779. [CrossRef]
- Chand, M. Strategic assessment and mitigation of risks in sustainable manufacturing systems. Sustain. Oper. Comput. 2021, 2, 206–213. [CrossRef]
- Sarker, M.R.; Moktadir, M.A.; Santibanez-Gonzalez, E.D.R. Social Sustainability Challenges Towards Flexible Supply Chain Management: Post-COVID-19 Perspective. Glob. J. Flex. Syst. Manag. 2021, 22, 199–218. [CrossRef]
- Richiedei, A.; Pezzagno, M. Territorializing and Monitoring of Sustainable Development Goals in Italy: An Overview. Sustainability 2022, 14, 3056. [CrossRef]
- Mazziotta, M.; Pareto, A. Measuring Well-Being Over Time: The Adjusted Mazziotta–Pareto Index Versus Other Non-compensatory Indices. Soc. Indic. Res. 2018, 136, 967–976. [CrossRef]
- ASviS Report territories 2021 Available online: https://asvis.it/rapporto-territori-2021/ (accessed on Jun 28, 2022).
- ASviS Report territories 2022 Available online: https://asvis.it/rapporto-territori-2022/ (accessed on Aug 8, 2023).
- Sachs, J.; Schmidt-Traub, G.; Kroll, C.; Lafortune, G.; Fuller, G. SDG Index and Dashboards Report 2018. Bertelsmann Stiftung and Sustainable Development Solutions Network (SDSN), New York; 2018.
- Gan, X.; Fernandez, I.C.; Guo, J.; Wilson, M.; Zhao, Y.; Zhou, B.; Wu, J. When to use what: Methods for weighting and aggregating sustainability indicators. Ecol. Indic. 2017, 81, 491–502. [CrossRef]
- Roszkowska, E.; Filipowicz-Chomko, M. Measuring sustainable development in the education area using multi-criteria methods: A case study. Cent. Eur. J. Oper. Res. 2020, 28, 1219–1241. [CrossRef]
- Guijarro, F.; Poyatos, J.A. Designing a Sustainable Development Goal Index through a Goal Programming Model: The Case of EU-28 Countries. Sustainability 2018, 10, 3167. [CrossRef]
Figure 1.
Sustainability Score in EWI scenario.
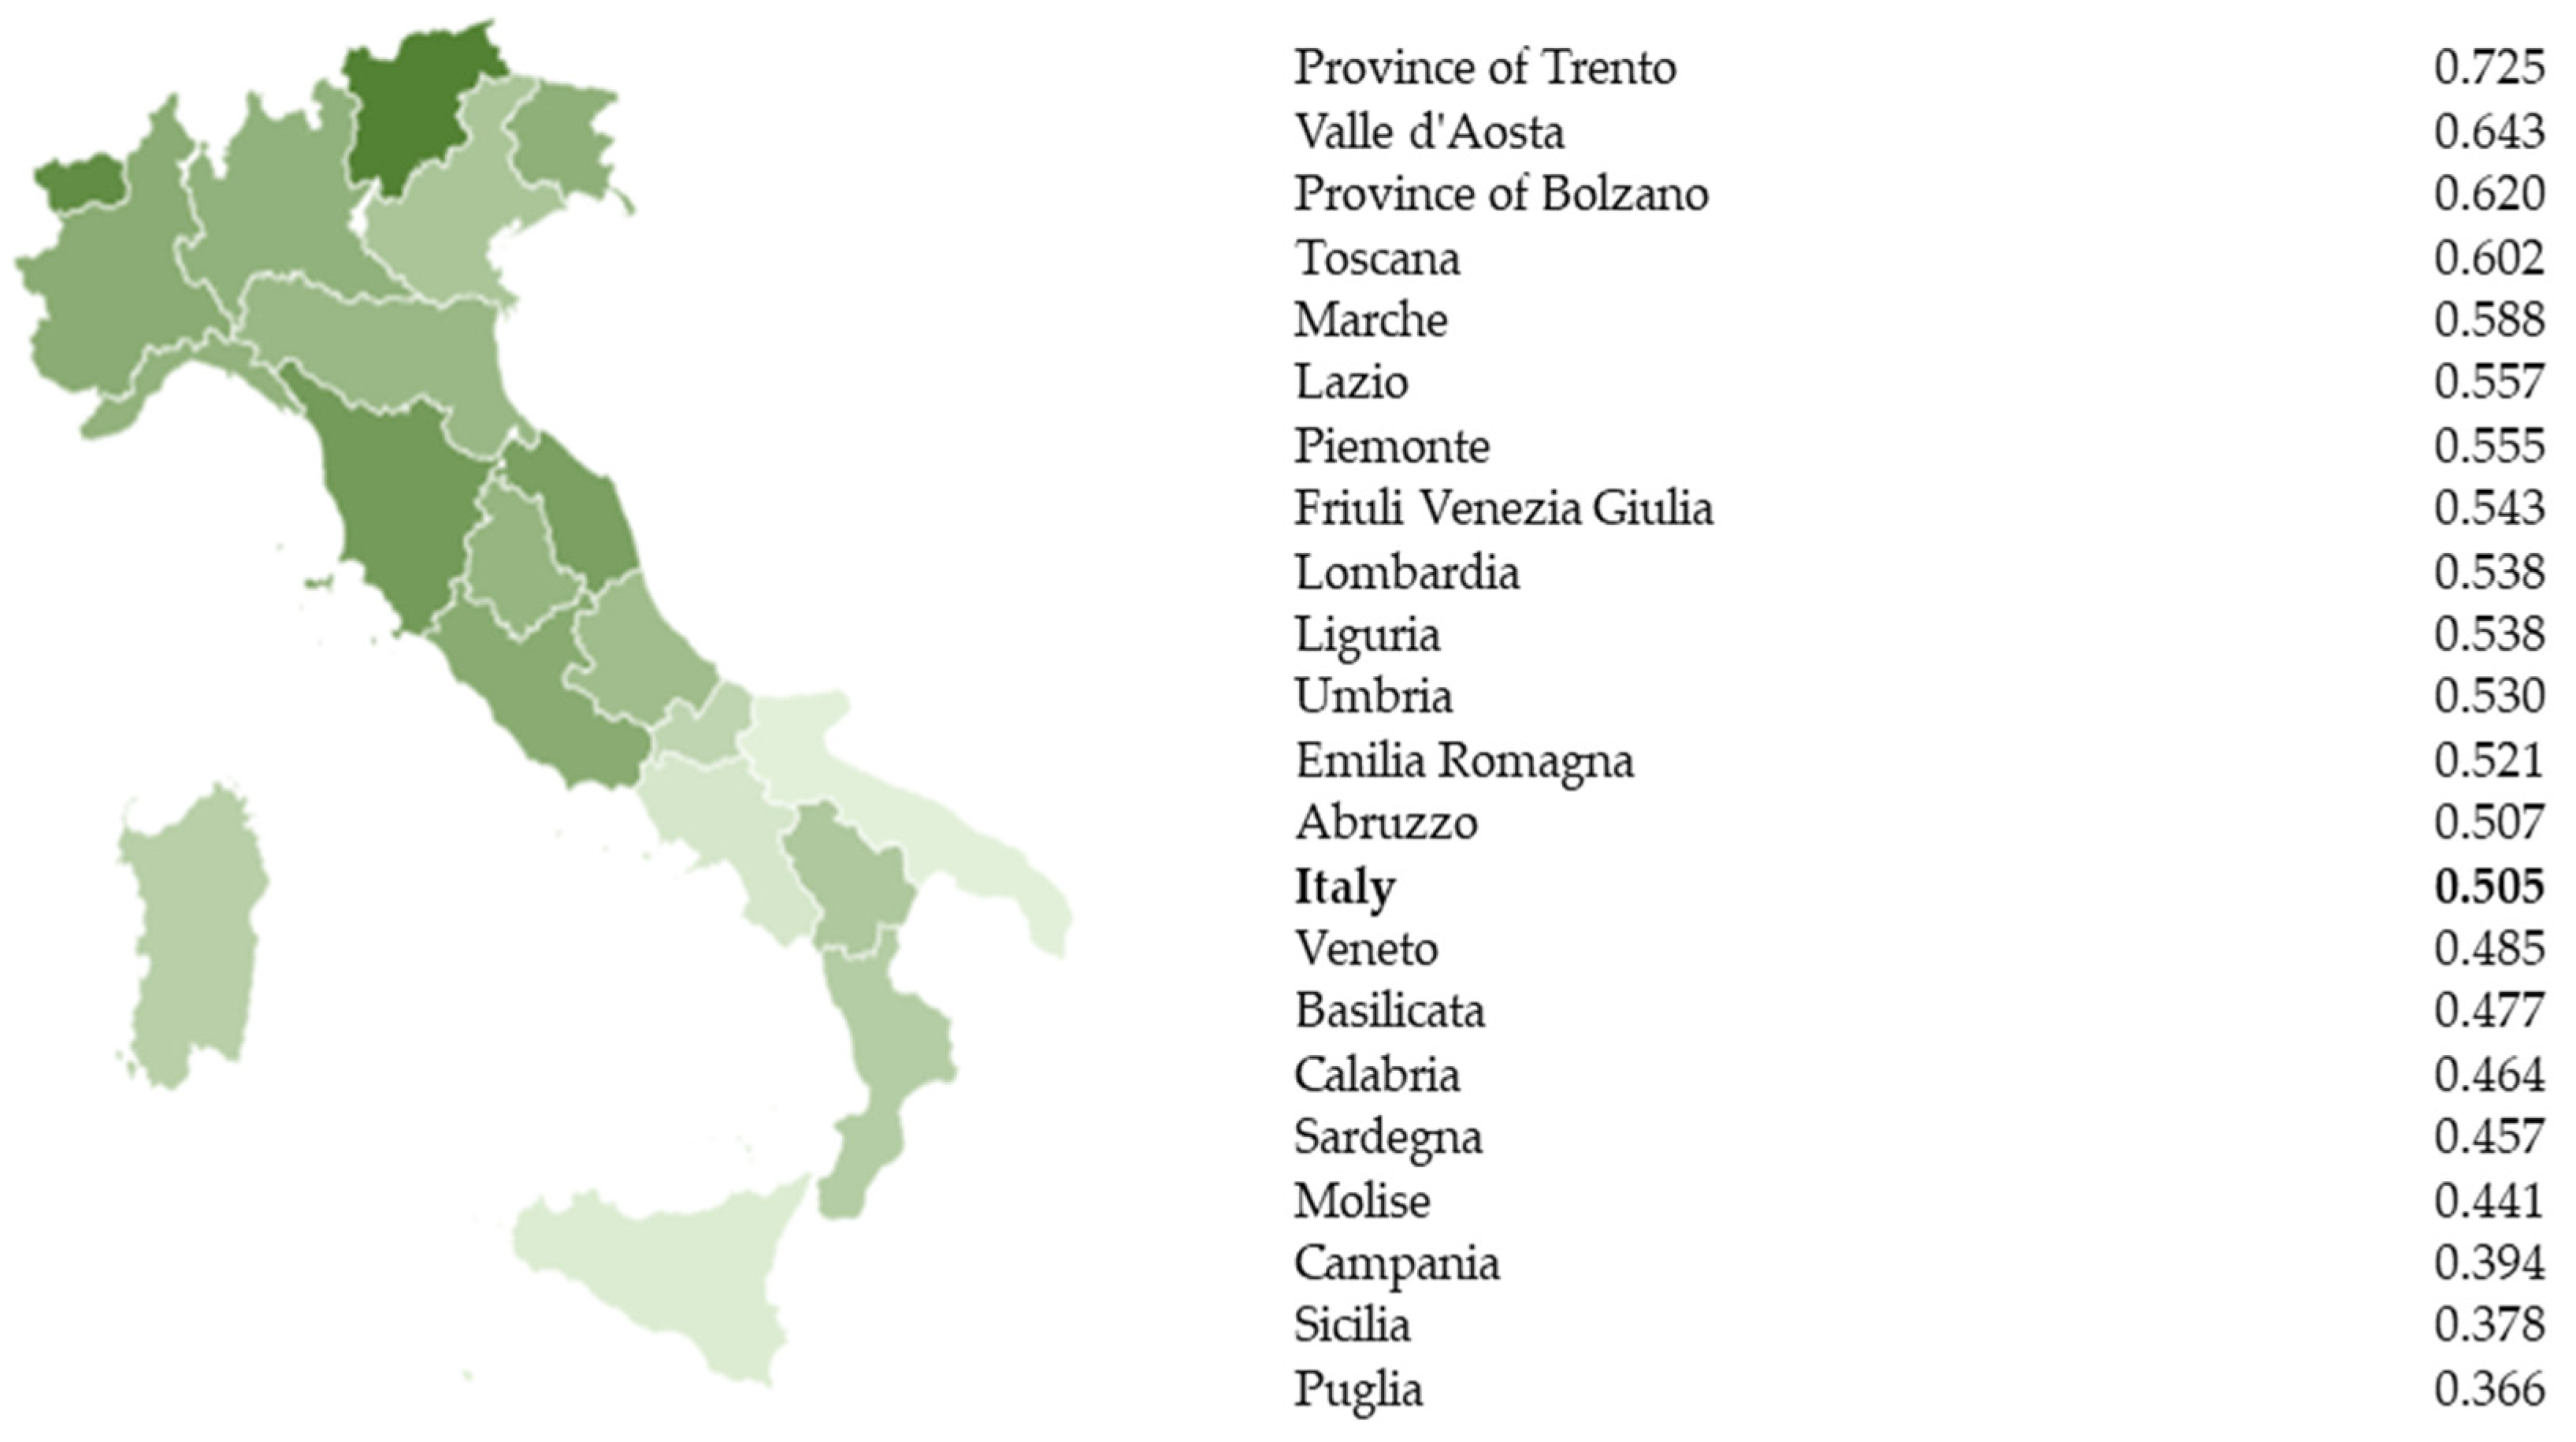
Figure 2.
Indicator concentration.
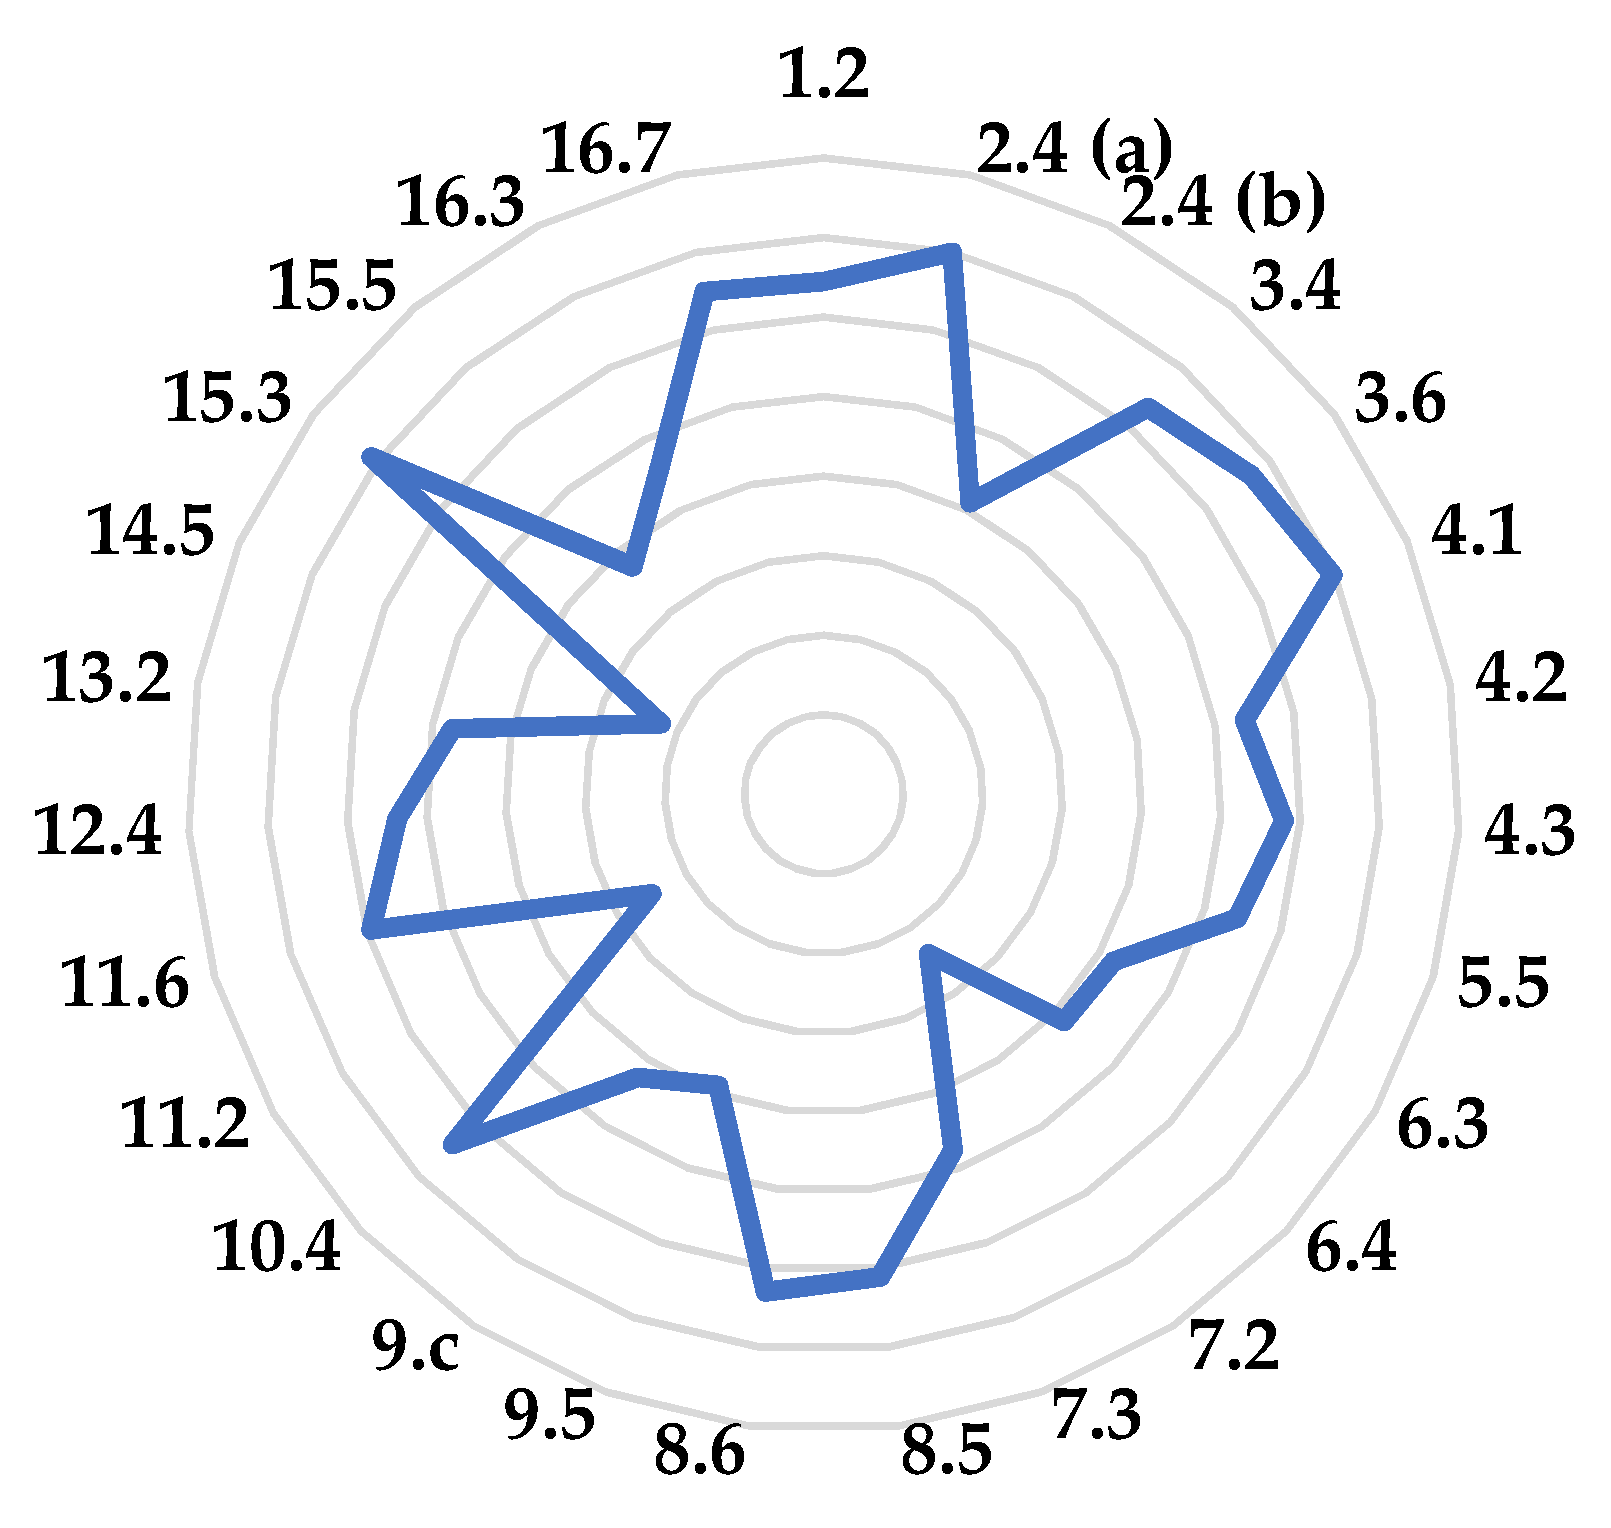
Figure 3.
Monitoring of SDGs in Italian regions in the period 2021-2022.
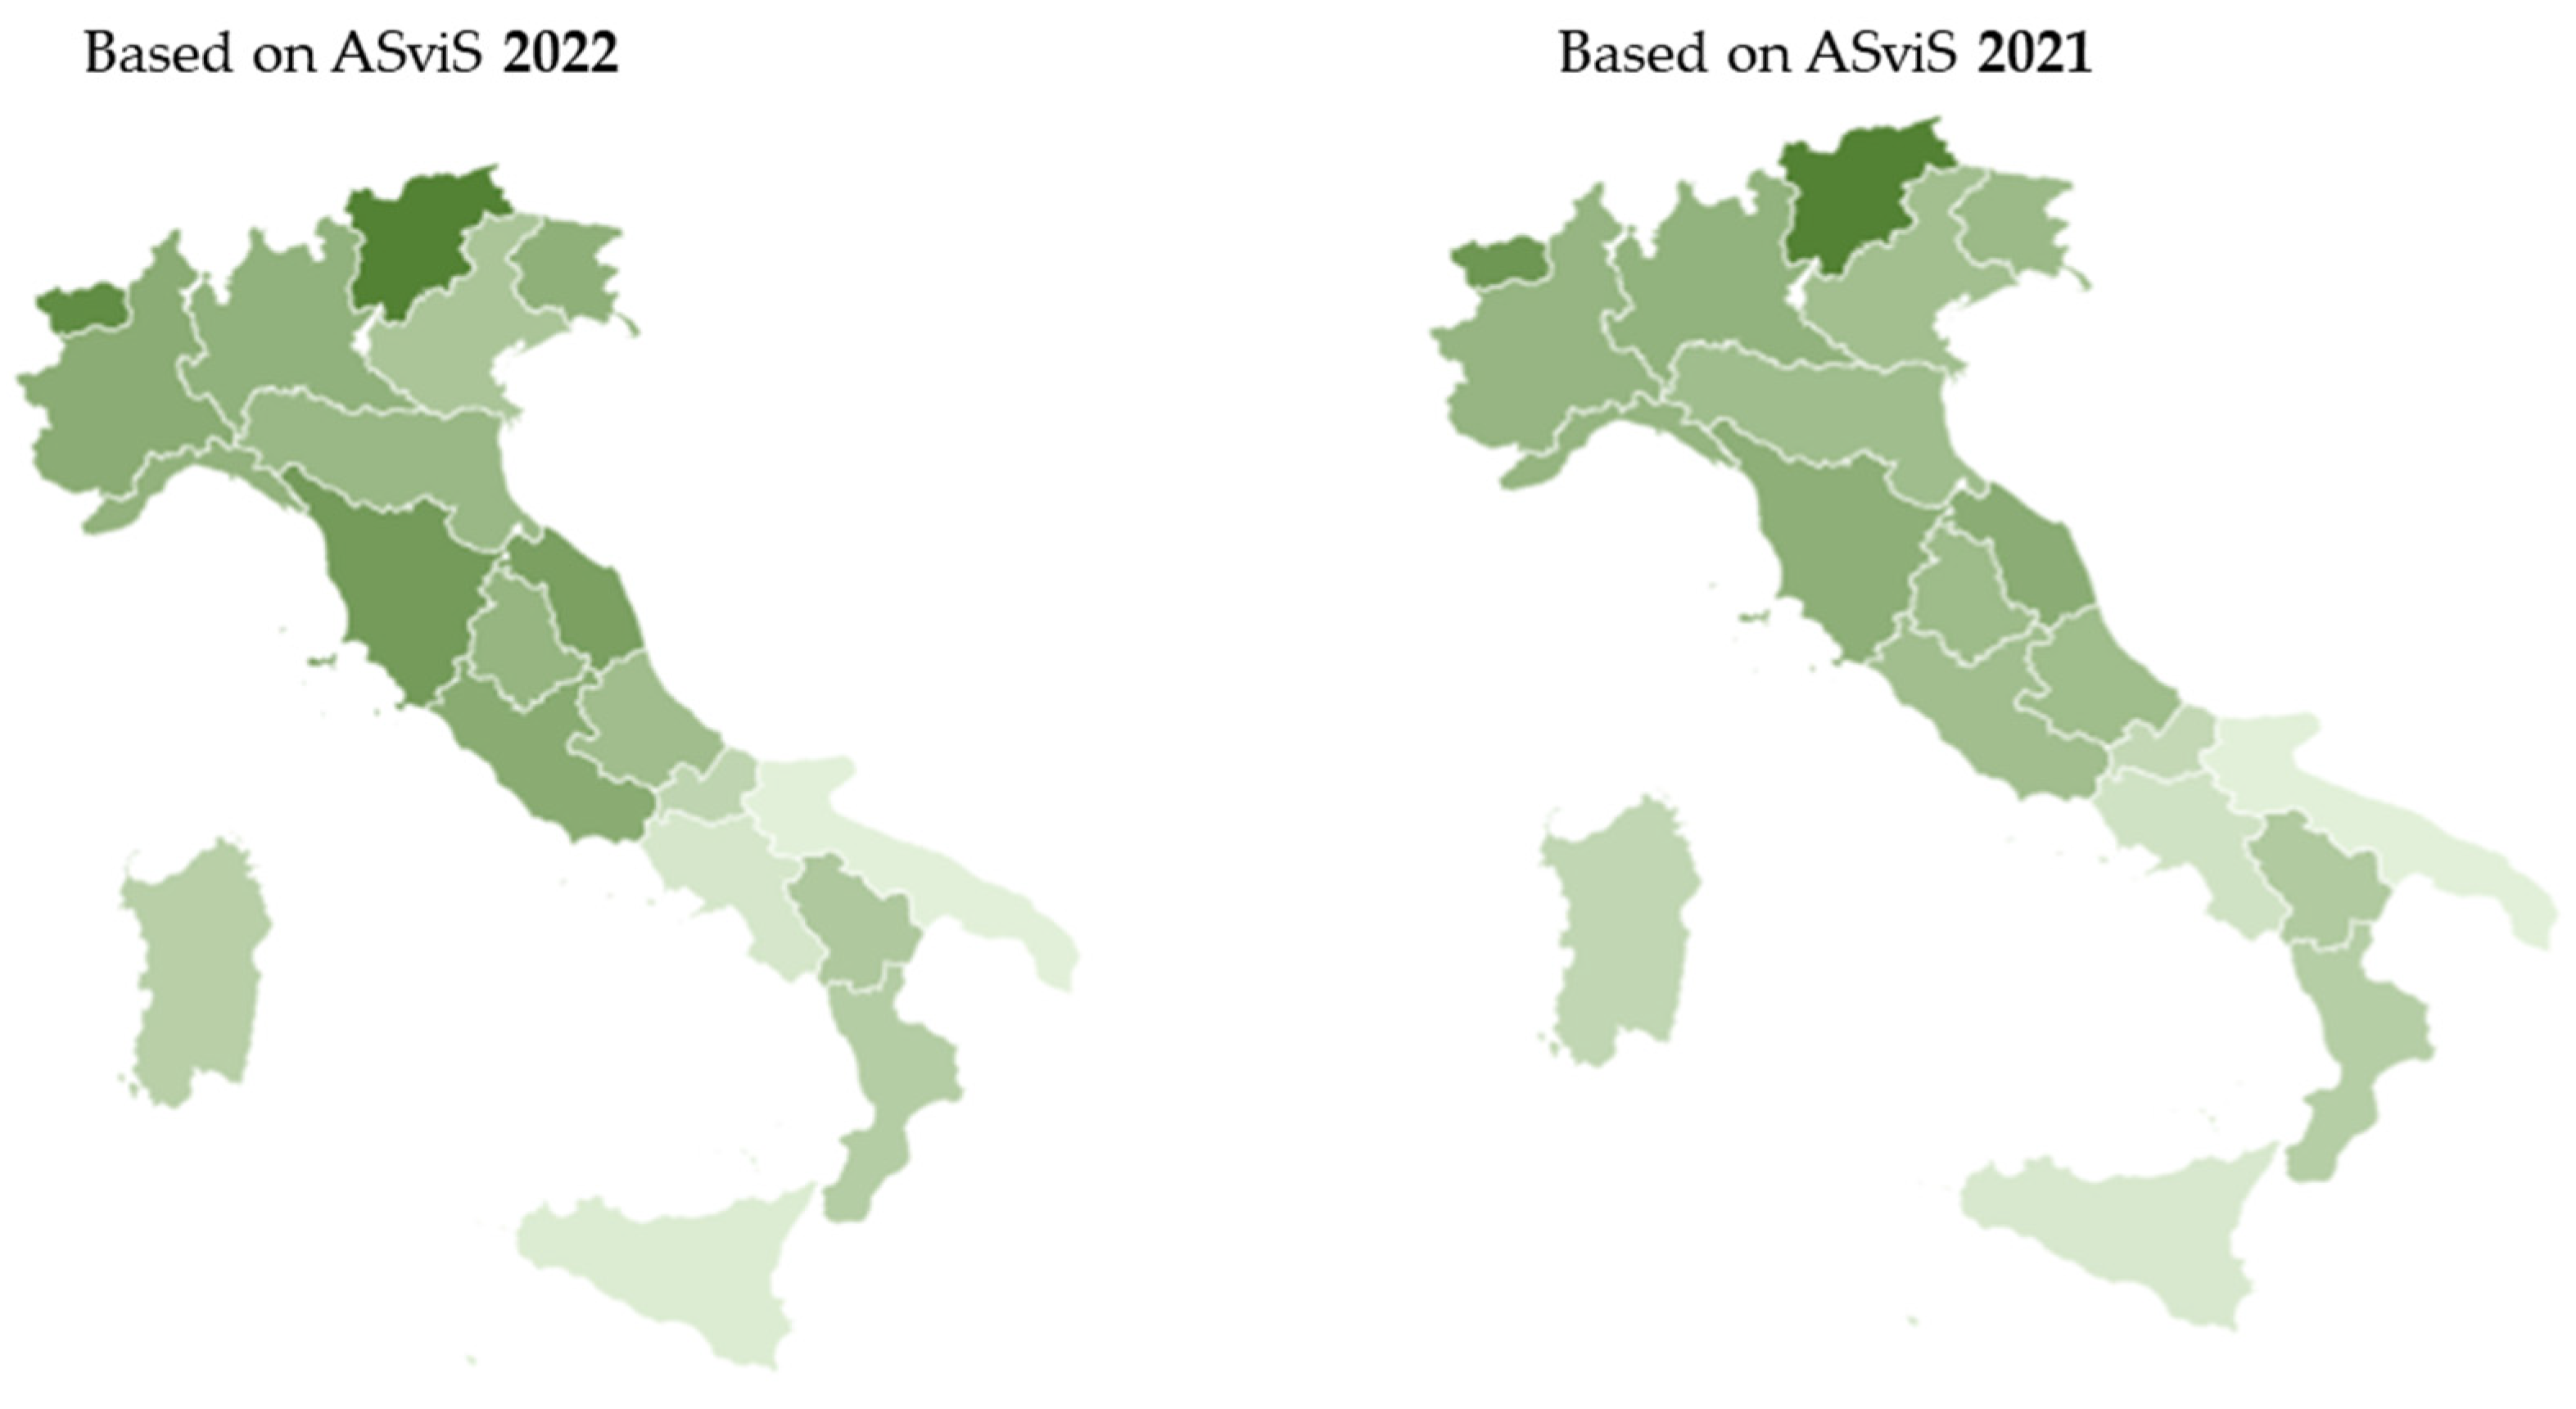
Figure 4.
Sustainability Score in EWI scenario - a comparison among macro-areas.
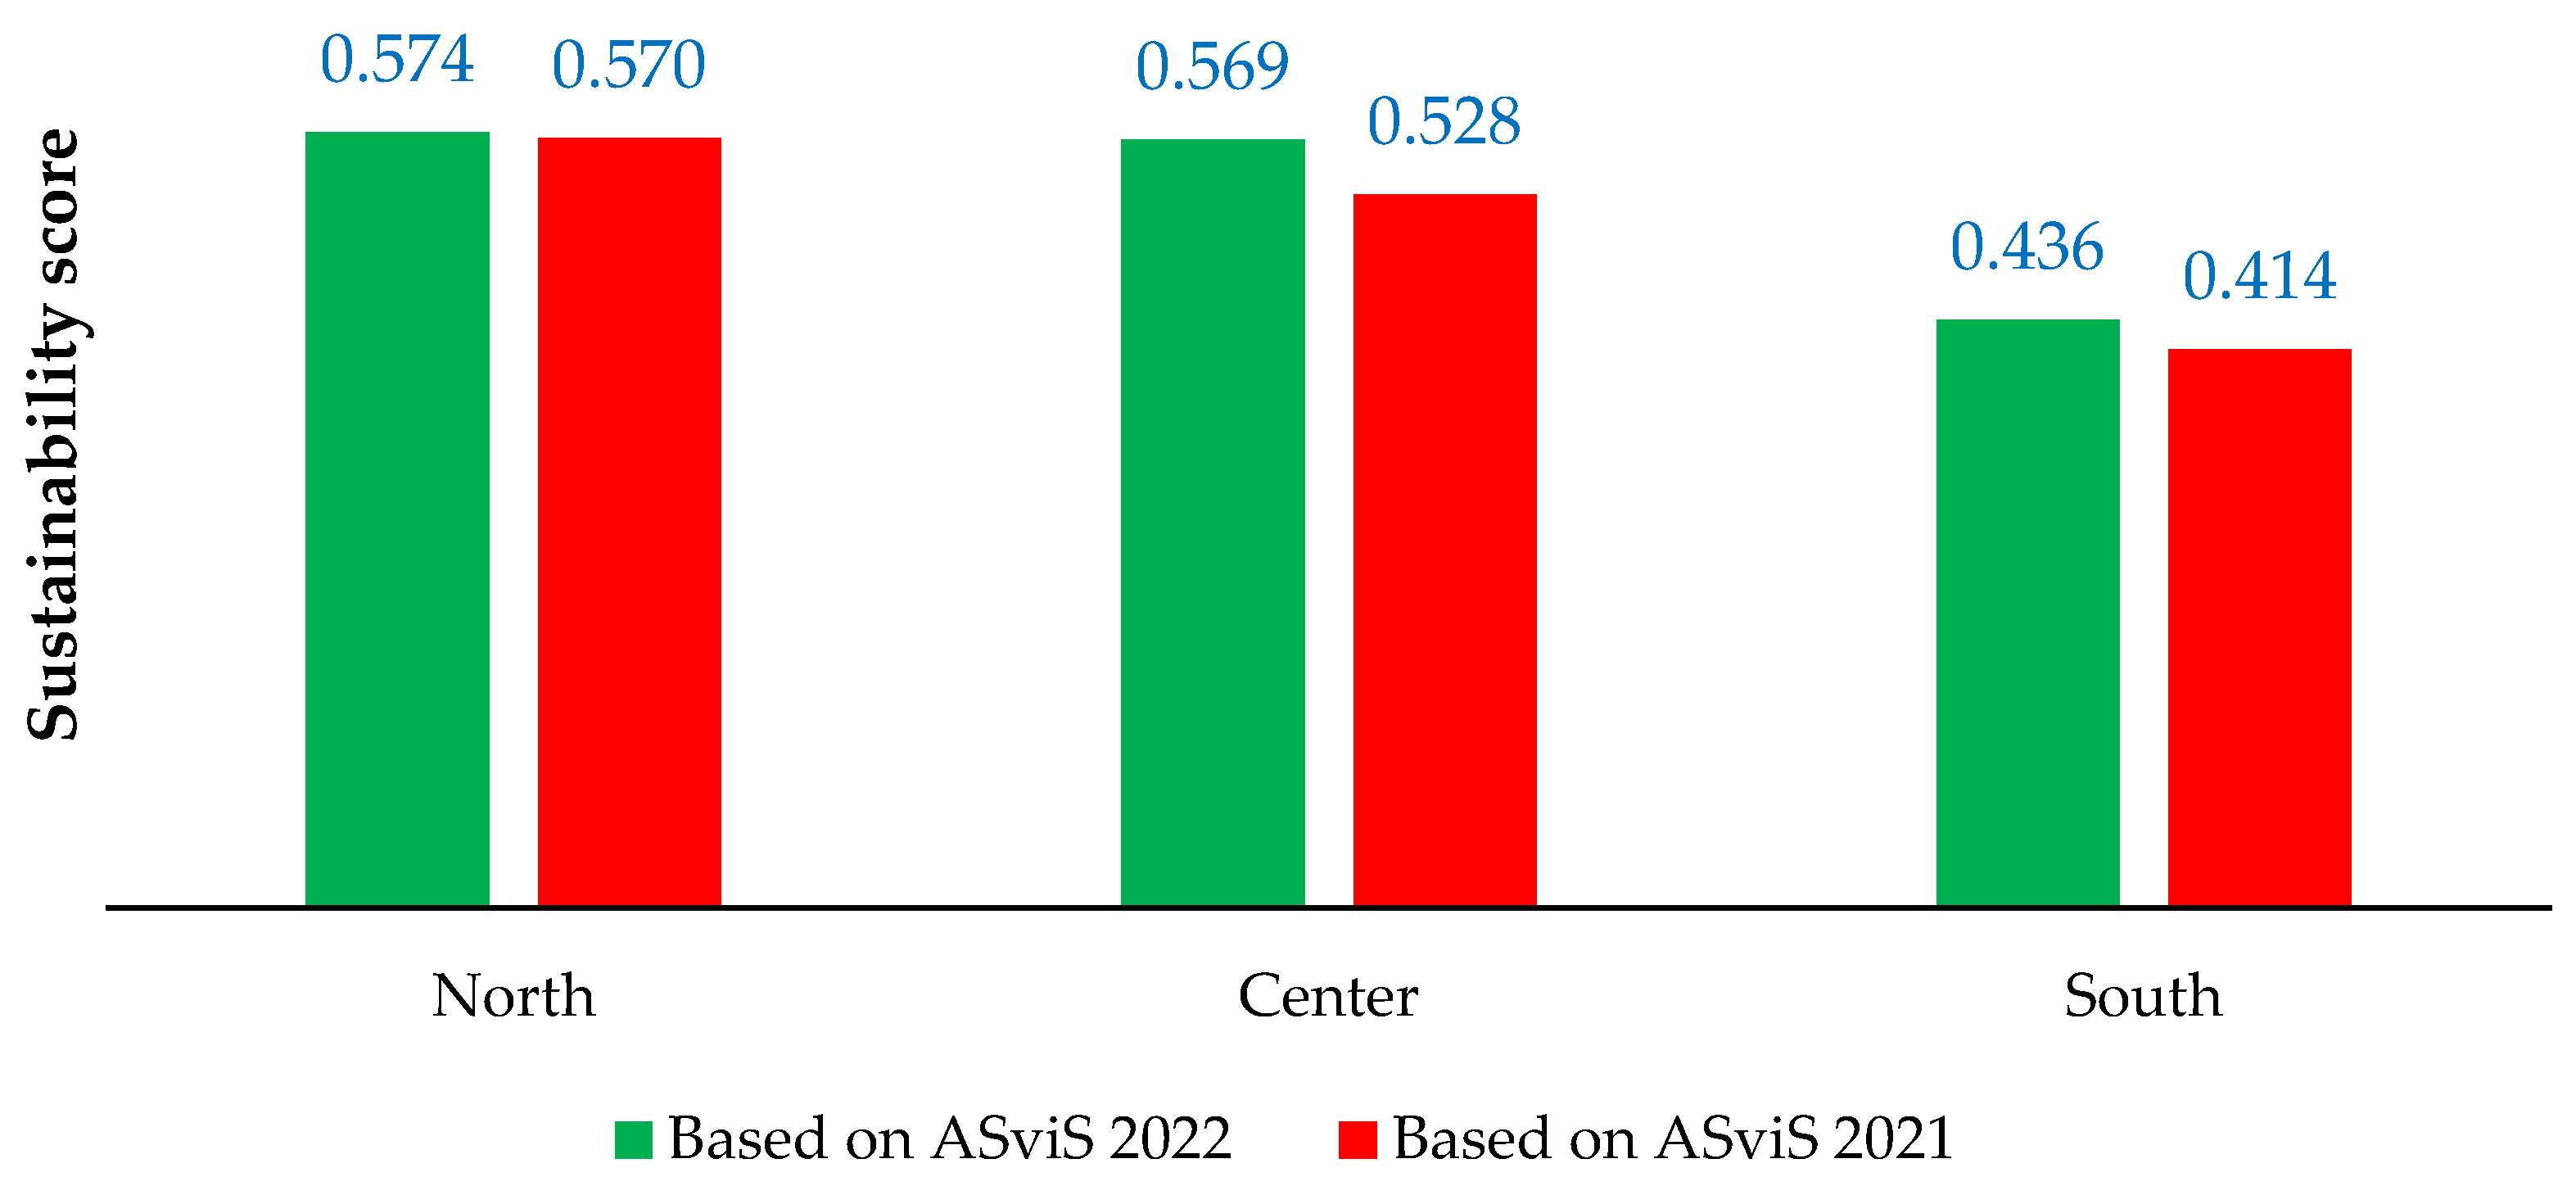
Figure 5.
A comparison of the sustainability score between EWI and EWG scenario.
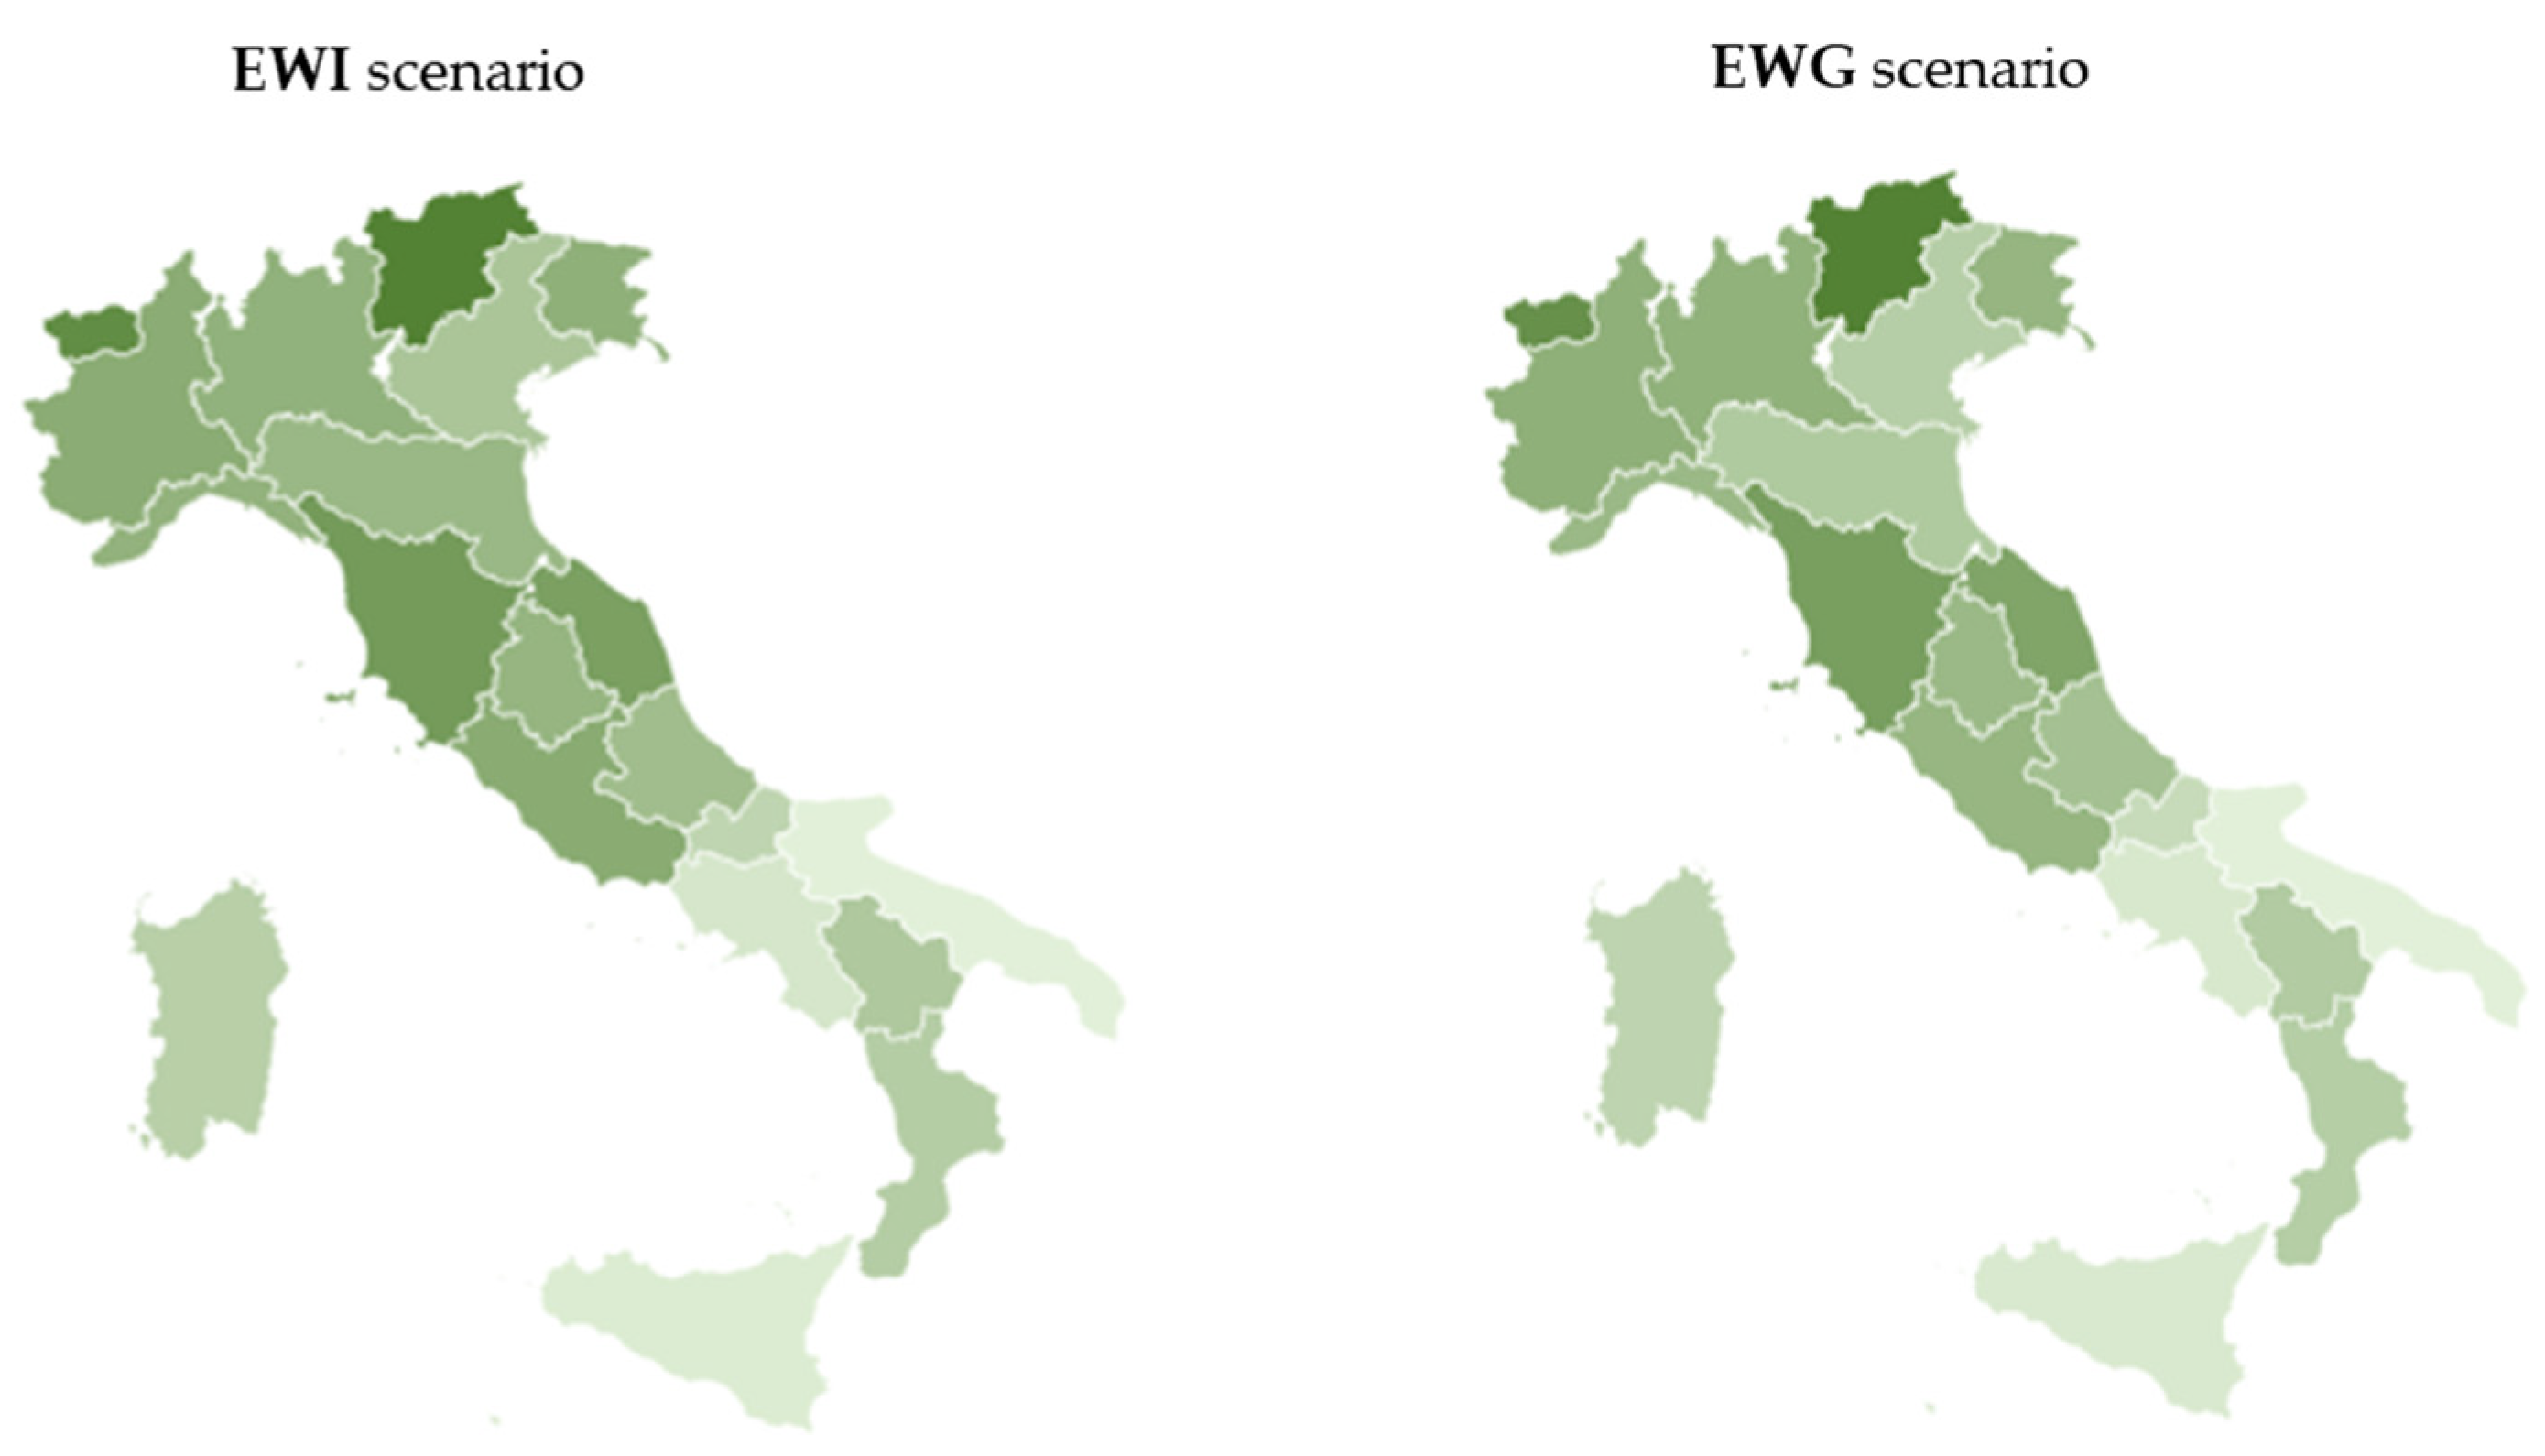
Table 2.
List of criteria.
| SDG | Target | Unit |
|---|---|---|
| SDG 1 | Target 1.2 - By 2030 reduce the number of people at risk of poverty or social exclusion by 16% compared to 2020 | % |
| SDG 2 | Target 2.4 (a) - By 2030 reduce the use of fertilizer distributed in non-organic agriculture by 20% compared to 2020 | quintals per ha |
| SDG 2 | Target 2.4 (b) - By 2030 achieve the 25% share of UAA invested by organic crops | % |
| SDG 3 | Target 3.4 - By 2025 reduce the probability of dying from no communicable diseases by 25% compared to 2013 | % |
| SDG 3 | Target 3.6 - By 2030 reduce road traffic injuries by half compared to 2019 | per 10,000 population |
| SDG 4 | Target 4.1 - By 2030 reduce early exit from education and training (18-24 years old) below the 9% rate | % |
| SDG 4 | Target 4.2 - By 2027 achieve at least 33% of places in early childhood education services (3-36 months) | % |
| SDG 4 | Target 4.3 - By 2030 to reach the 50% share of college graduates (30-34 years old) | % |
| SDG 5 | Target 5.5 - By 2030 to halve the gender employment gap compared to 2020 | females/males * 100 |
| SDG 6 | Target 6.3 - By 2027 ensure high or good ecological quality status for all surface water bodies | % |
| SDG 6 | Target 6.4 - By 2030 achieve 90% efficiency share of drinking water distribution networks | % |
| SDG 7 | Target 7.2 - By 2030 achieve at least 45% share of energy from renewable sources | % |
| SDG 7 | Target 7.3 - By 2030 to reduce final energy consumption by at least 20% compared to 2020 | ktoe per 10,000 population |
| SDG 8 | Target 8.5 - By 2030 achieve 78% share of the employment rate (20-64 years old) | % |
| SDG 8 | Target 8.6 - By 2030 reduce the share of NEETs to below 9% (15-29 years old) | % |
| SDG 9 | Target 9.5 - By 2030 achieve the share of 3% of GDP devoted to research and development | % |
| SDG 9 | Target 9.c - By 2026 ensure that all households have coverage to the Gigabit network | % |
| SDG 10 | Target 10.4 - By 2030 reduce net income inequality (S80/S20) to levels observed in the best of European countries | s80/s20 |
| SDG 11 | Target 11.2 - By 2030 increase public transport seat-km per inhabitant offered by 26% compared to 2004 | places-Km per inhabitant |
| SDG 11 | Target 11.6 - By 2030 reduce PM10 exceedances to below 3 days per year | days |
| SDG 12 | Target 12.4 - By 2030 reduce the share of municipal waste generated per capita by 26% compared to 2004 | kg/inhab.*year |
| SDG 13 | Target 13.2 - By 2030 reduce emissions of CO2 and other climate-altering gases by 55% from 1990 levels | ton CO2 equivalent per capita |
| SDG 14 | Target 14.5 - By 2030 achieve 30% share of marine protected areas | % |
| SDG 15 | Target 15.3 - By 2050 achieve zero increase in annual land consumption | ha per 100,000 population |
| SDG 15 | Target 15.5 - By 2030 achieve 30% share of terrestrial protected areas | % |
| SDG 16 | Target 16.3 - By 2030 achieve zero overcrowding in penal institutions | % |
| SDG 16 | Target 16.7 - By 2026 reduce the average duration of civil proceedings by 40 percent compared to 2019 | days |
Table 3A.
List of values. IT=Italy; A1=Piemonte; A2=Valle d'Aosta; A3=Liguria; A4=Lombardia; A5=Province Bolzano; A6=Province Trento; A7=Veneto; A8=Friuli Venezia Giulia; A9=Emilia Romagna; A10=Toscana.
Table 3A.
List of values. IT=Italy; A1=Piemonte; A2=Valle d'Aosta; A3=Liguria; A4=Lombardia; A5=Province Bolzano; A6=Province Trento; A7=Veneto; A8=Friuli Venezia Giulia; A9=Emilia Romagna; A10=Toscana.
| Target | IT | A1 | A2 | A3 | A4 | A5 | A6 | A7 | A8 | A9 | A10 |
|---|---|---|---|---|---|---|---|---|---|---|---|
| 1.2 | 0.617 | 0.794 | 0.938 | 0.706 | 0.851 | 1.000 | 0.886 | 0.828 | 0.848 | 0.970 | 0.821 |
| 2.4 (a) | 0.634 | 0.521 | 1.000 | 0.676 | 0.000 | 0.972 | 0.958 | 0.028 | 0.479 | 0.183 | 0.831 |
| 2.4 (b) | 0.449 | 0.102 | 0.000 | 0.335 | 0.087 | 0.122 | 0.198 | 0.111 | 0.219 | 0.455 | 0.968 |
| 3.4 | 0.583 | 0.528 | 0.833 | 0.583 | 0.722 | 0.917 | 1.000 | 0.889 | 0.667 | 0.833 | 0.667 |
| 3.6 | 0.636 | 0.717 | 0.854 | 0.000 | 0.655 | 0.574 | 0.809 | 0.650 | 0.730 | 0.377 | 0.280 |
| 4.1 | 0.625 | 0.721 | 0.522 | 0.610 | 0.728 | 0.610 | 0.912 | 0.875 | 0.926 | 0.831 | 0.743 |
| 4.2 | 0.491 | 0.600 | 0.897 | 0.627 | 0.591 | 0.370 | 0.815 | 0.609 | 0.721 | 0.900 | 0.806 |
| 4.3 | 0.559 | 0.596 | 0.615 | 0.522 | 0.839 | 0.429 | 0.988 | 0.807 | 0.509 | 0.981 | 0.696 |
| 5.5 | 0.546 | 0.747 | 1.000 | 0.694 | 0.755 | 0.794 | 0.850 | 0.677 | 0.744 | 0.772 | 0.766 |
| 6.3 | 0.384 | 0.503 | 0.874 | 0.707 | 0.260 | 0.933 | 0.826 | 0.340 | 0.388 | 0.248 | 0.298 |
| 6.4 | 0.406 | 0.585 | 1.000 | 0.448 | 0.770 | 0.857 | 0.648 | 0.439 | 0.296 | 0.728 | 0.382 |
| 7.2 | 0.107 | 0.137 | 1.000 | 0.000 | 0.076 | 0.660 | 0.432 | 0.116 | 0.146 | 0.044 | 0.114 |
| 7.3 | 0.388 | 0.313 | 0.013 | 0.650 | 0.313 | 0.181 | 0.163 | 0.231 | 0.031 | 0.000 | 0.456 |
| 8.5 | 0.581 | 0.808 | 0.866 | 0.751 | 0.866 | 1.000 | 0.895 | 0.840 | 0.888 | 0.927 | 0.831 |
| 8.6 | 0.574 | 0.743 | 0.796 | 0.726 | 0.778 | 1.000 | 0.813 | 0.974 | 0.874 | 0.922 | 0.800 |
| 9.5 | 0.529 | 1.000 | 0.000 | 0.529 | 0.471 | 0.176 | 0.588 | 0.471 | 0.647 | 0.882 | 0.588 |
| 9.c | 0.920 | 0.697 | 0.127 | 0.984 | 0.636 | 0.000 | 0.352 | 0.376 | 0.434 | 0.592 | 0.516 |
| 10.4 | 0.368 | 0.737 | 0.921 | 0.447 | 0.632 | 0.921 | 0.816 | 0.789 | 0.868 | 0.816 | 0.737 |
| 11.2 | 0.371 | 0.373 | 0.018 | 0.328 | 1.000 | 0.309 | 0.354 | 0.457 | 0.330 | 0.217 | 0.206 |
| 11.6 | 0.367 | 0.022 | 0.944 | 0.944 | 0.000 | 0.967 | 0.900 | 0.022 | 0.578 | 0.167 | 0.622 |
| 12.4 | 0.512 | 0.515 | 0.095 | 0.393 | 0.576 | 0.597 | 0.522 | 0.549 | 0.478 | 0.000 | 0.180 |
| 13.2 | 0.519 | 0.432 | 0.247 | 0.494 | 0.531 | 0.457 | 0.469 | 0.259 | 0.667 | 0.284 | 0.617 |
| 14.5 | 0.370 | 0.130 | 0.000 | 0.109 | 0.000 | 1.000 | |||||
| 15.3 | 0.730 | 0.597 | 0.803 | 1.000 | 0.790 | 0.777 | 0.853 | 0.617 | 0.813 | 0.590 | 0.820 |
| 15.5 | 0.331 | 0.203 | 0.436 | 0.124 | 0.150 | 0.556 | 0.853 | 0.128 | 0.192 | 0.094 | 0.165 |
| 16.3 | 0.442 | 0.518 | 0.917 | 0.252 | 0.085 | 0.000 | 1.000 | 0.222 | 0.128 | 0.403 | 0.598 |
| 16.7 | 0.609 | 0.919 | 1.000 | 0.853 | 0.834 | 0.953 | 0.946 | 0.797 | 0.951 | 0.842 | 0.733 |
Table 3B.
List of values. A11=Umbria; A12=Marche; A13=Lazio; A14=Abruzzo; A15=Molise; A16=Campania; A17=Puglia; A18=Basilicata; A19=Calabria; A20=Sicilia; A21=Sardegna.
Table 3B.
List of values. A11=Umbria; A12=Marche; A13=Lazio; A14=Abruzzo; A15=Molise; A16=Campania; A17=Puglia; A18=Basilicata; A19=Calabria; A20=Sicilia; A21=Sardegna.
| Target | A11 | A12 | A13 | A14 | A15 | A16 | A17 | A18 | A19 | A20 | A21 |
|---|---|---|---|---|---|---|---|---|---|---|---|
| 1.2 | 0.851 | 0.908 | 0.600 | 0.425 | 0.428 | 0.000 | 0.438 | 0.440 | 0.226 | 0.167 | 0.408 |
| 2.4 (a) | 0.775 | 0.746 | 0.732 | 0.789 | 0.944 | 0.704 | 0.775 | 0.915 | 0.845 | 0.887 | 0.944 |
| 2.4 (b) | 0.446 | 0.685 | 0.653 | 0.347 | 0.143 | 0.510 | 0.592 | 0.714 | 1.000 | 0.630 | 0.297 |
| 3.4 | 0.833 | 0.972 | 0.444 | 0.639 | 0.472 | 0.000 | 0.611 | 0.556 | 0.417 | 0.306 | 0.444 |
| 3.6 | 0.730 | 0.439 | 0.480 | 0.765 | 1.000 | 0.957 | 0.604 | 0.911 | 0.987 | 0.760 | 0.809 |
| 4.1 | 0.676 | 0.978 | 0.882 | 0.971 | 1.000 | 0.353 | 0.265 | 0.919 | 0.529 | 0.000 | 0.588 |
| 4.2 | 1.000 | 0.606 | 0.736 | 0.436 | 0.324 | 0.000 | 0.261 | 0.318 | 0.027 | 0.045 | 0.597 |
| 4.3 | 1.000 | 0.689 | 0.776 | 0.578 | 0.950 | 0.211 | 0.081 | 0.429 | 0.236 | 0.000 | 0.248 |
| 5.5 | 0.738 | 0.652 | 0.621 | 0.379 | 0.203 | 0.000 | 0.067 | 0.223 | 0.070 | 0.022 | 0.632 |
| 6.3 | 0.000 | 0.344 | 0.342 | 0.346 | 0.010 | 0.301 | 0.011 | 0.025 | 1.000 | 0.571 | 0.507 |
| 6.4 | 0.030 | 0.648 | 0.075 | 0.000 | 0.299 | 0.301 | 0.313 | 0.313 | 0.319 | 0.152 | 0.131 |
| 7.2 | 0.175 | 0.125 | 0.036 | 0.218 | 0.348 | 0.136 | 0.123 | 0.485 | 0.391 | 0.068 | 0.217 |
| 7.3 | 0.188 | 0.694 | 0.794 | 0.538 | 0.613 | 1.000 | 0.625 | 0.619 | 0.913 | 0.950 | 0.725 |
| 8.5 | 0.792 | 0.780 | 0.636 | 0.562 | 0.364 | 0.016 | 0.192 | 0.390 | 0.032 | 0.000 | 0.399 |
| 8.6 | 0.743 | 0.883 | 0.639 | 0.661 | 0.374 | 0.096 | 0.248 | 0.483 | 0.122 | 0.000 | 0.552 |
| 9.5 | 0.235 | 0.235 | 0.824 | 0.235 | 0.294 | 0.412 | 0.176 | 0.059 | 0.000 | 0.176 | 0.176 |
| 9.c | 0.392 | 0.115 | 1.000 | 0.268 | 0.033 | 0.840 | 0.455 | 0.178 | 0.150 | 0.577 | 0.225 |
| 10.4 | 0.842 | 1.000 | 0.395 | 0.789 | 0.789 | 0.000 | 0.395 | 0.842 | 0.289 | 0.079 | 0.368 |
| 11.2 | 0.114 | 0.147 | 0.508 | 0.158 | 0.000 | 0.120 | 0.130 | 0.048 | 0.099 | 0.106 | 0.234 |
| 11.6 | 0.422 | 0.678 | 0.144 | 0.811 | 1.000 | 0.133 | 0.889 | 0.900 | 0.911 | 0.844 | 0.578 |
| 12.4 | 0.451 | 0.468 | 0.502 | 0.627 | 0.922 | 0.641 | 0.573 | 1.000 | 0.878 | 0.661 | 0.661 |
| 13.2 | 0.432 | 0.728 | 0.778 | 0.704 | 0.111 | 1.000 | 0.296 | 0.185 | 0.654 | 0.617 | 0.000 |
| 14.5 | 0.000 | 0.109 | 0.261 | 0.000 | 0.435 | 0.217 | 0.000 | 0.196 | 0.478 | 0.413 | |
| 15.3 | 0.657 | 0.780 | 0.850 | 0.000 | 0.480 | 0.800 | 0.663 | 0.617 | 0.937 | 0.750 | 0.710 |
| 15.5 | 0.218 | 0.297 | 0.410 | 1.000 | 0.000 | 0.906 | 0.455 | 0.665 | 0.571 | 0.342 | 0.083 |
| 16.3 | 0.472 | 0.550 | 0.448 | 0.470 | 0.298 | 0.397 | 0.062 | 0.647 | 0.565 | 0.677 | 0.943 |
| 16.7 | 0.558 | 0.735 | 0.612 | 0.719 | 0.500 | 0.371 | 0.362 | 0.000 | 0.161 | 0.340 | 0.458 |
Table 4.
The best and worst alternative for each target audience and the value of indicator concentration for each target.
Table 4.
The best and worst alternative for each target audience and the value of indicator concentration for each target.
| Target | Max | Min | Indicator concentration |
|---|---|---|---|
| 1.2 | Province of Bolzano | Campania | 0.644 |
| 2.4 (a) | Valle d’Aosta | Lombardia | 0.700 |
| 2.4 (b) | Calabria | Valle d’Aosta | 0.410 |
| 3.4 | Province of Trento | Campania | 0.635 |
| 3.6 | Molise | Liguria | 0.671 |
| 4.1 | Molise | Sicilia | 0.697 |
| 4.2 | Umbria | Campania | 0.538 |
| 4.3 | Umbria | Sicilia | 0.580 |
| 5.5 | Valle d’Aosta | Campania | 0.543 |
| 6.3 | Calabria | Umbria | 0.421 |
| 6.4 | Valle d’Aosta | Abruzzo | 0.416 |
| 7.2 | Valle d’Aosta | Liguria | 0.240 |
| 7.3 | Campania | Emilia Romagna | 0.476 |
| 8.5 | Province of Bolzano | Sicilia | 0.611 |
| 8.6 | Province of Bolzano | Sicilia | 0.630 |
| 9.5 | Piemonte | Valle d’Aosta, Calabria | 0.389 |
| 9.c | Lazio | Province of Bolzano | 0.426 |
| 10.4 | Marche | Campania | 0.642 |
| 11.2 | Lombardia | Molise | 0.250 |
| 11.6 | Molise | Lombardia | 0.594 |
| 12.4 | Basilicata | Emilia Romagna | 0.538 |
| 13.2 | Campania | Sardegna | 0.474 |
| 14.5 | Toscana | Veneto, Emilia Romagna, Marche, Molise, Basilicata |
0.223 |
| 15.3 | Liguria | Abruzzo | 0.710 |
| 15.5 | Abruzzo | Molise | 0.374 |
| 16.3 | Province of Trento | Province of Bolzano | 0.460 |
| 16.7 | Valle d’Aosta | Basilicata | 0.650 |
Table 5.
Delta Sustainability Score in the period 2021-2022.
| ASviS 2021 | Delta ASviS 2022 –ASviS 2021 | Delta Ranking | |
|---|---|---|---|
| Province of Trento | 0.785 | -0.060 | 0 |
| Valle d'Aosta | 0.628 | 0.015 | 0 |
| Province of Bolzano | 0.612 | 0.009 | 0 |
| Toscana | 0.548 | 0.053 | +1 |
| Marche | 0.556 | 0.032 | -1 |
| Lazio | 0.498 | 0.058 | +7 |
| Piemonte | 0.528 | 0.027 | +1 |
| Friuli Venezia Giulia | 0.514 | 0.029 | +1 |
| Lombardia | 0.536 | 0.002 | -3 |
| Liguria | 0.529 | 0.009 | -3 |
| Umbria | 0.508 | 0.021 | -1 |
| Emilia Romagna | 0.502 | 0.019 | 0 |
| Abruzzo | 0.504 | 0.003 | -2 |
| Italia | 0.494 | 0.011 | |
| Veneto | 0.495 | -0.010 | 0 |
| Basilicata | 0.460 | 0.017 | 0 |
| Calabria | 0.446 | 0.018 | 0 |
| Sardegna | 0.418 | 0.040 | 0 |
| Molise | 0.411 | 0.030 | 0 |
| Campania | 0.380 | 0.014 | 0 |
| Sicilia | 0.358 | 0.020 | 0 |
| Puglia | 0.333 | 0.033 | 0 |
Table 6.
Delta Sustainability Score in EWG scenario.
| EWG scenario | Delta EWG-EWI | Delta Ranking EWG-EWI | |
|---|---|---|---|
| Province of Trento | 0.784 | 0.059 | 0 |
| Province of Bolzano | 0.712 | 0.091 | +1 |
| Valle d'Aosta | 0.704 | 0.062 | -1 |
| Toscana | 0.661 | 0.060 | 0 |
| Marche | 0.642 | 0.053 | 0 |
| Piemonte | 0.607 | 0.052 | +1 |
| Lombardia | 0.602 | 0.064 | +2 |
| Friuli Venezia Giulia | 0.593 | 0.050 | 0 |
| Lazio | 0.590 | 0.033 | -3 |
| Liguria | 0.581 | 0.043 | 0 |
| Umbria | 0.580 | 0.050 | 0 |
| Abruzzo | 0.557 | 0.050 | +1 |
| Italia | 0.545 | 0.040 | |
| Emilia Romagna | 0.530 | 0.010 | -1 |
| Basilicata | 0.526 | 0.049 | +1 |
| Calabria | 0.518 | 0.054 | +1 |
| Veneto | 0.516 | 0.031 | -2 |
| Sardegna | 0.497 | 0.040 | 0 |
| Molise | 0.476 | 0.035 | 0 |
| Campania | 0.437 | 0.043 | 0 |
| Sicilia | 0.434 | 0.056 | 0 |
| Puglia | 0.413 | 0.047 | 0 |
Disclaimer/Publisher’s Note: The statements, opinions and data contained in all publications are solely those of the individual author(s) and contributor(s) and not of MDPI and/or the editor(s). MDPI and/or the editor(s) disclaim responsibility for any injury to people or property resulting from any ideas, methods, instructions or products referred to in the content. |
© 2023 by the authors. Licensee MDPI, Basel, Switzerland. This article is an open access article distributed under the terms and conditions of the Creative Commons Attribution (CC BY) license (http://creativecommons.org/licenses/by/4.0/).
Copyright: This open access article is published under a Creative Commons CC BY 4.0 license, which permit the free download, distribution, and reuse, provided that the author and preprint are cited in any reuse.


