
Submitted:
02 September 2023
Posted:
05 September 2023
You are already at the latest version
Preprints on COVID-19 and SARS-CoV-2
Abstract
Earnings management and financial distress are two critical facets of financial management in corporations that have lately been the focus of thorough research from both scholars and practitioners. The purpose of the research is to evaluate the influence of financial distress on the earnings management of companies listed at the NSE during the pre- and post-COVID eras. Multiple linear regression was applied in this study to examine the causal association between earnings management and financial distress. To assess the effect of financial distress on earnings management, the study analyzed data from 37 listed companies during the pre-COVID and post-COVID periods. The methodology also takes into account control factors like firm size, GDP, and inflation. The pre-COVID research indicates a significant positive correlation between financial strain and earnings management. In contrast, the correlation between financial distress and earnings management is not statistically significant in the post-COVID analysis. However, research shows that firm size has a statistically significant negative influence on managing earnings. The results of this study show that smaller firms are more inclined to engage in earnings management during the post-COVID era than bigger ones.
Keywords:
Earnings Management
; Financial distress
; Pre-Covid era
; Post-Covid era
; Firm size
1. Introduction
Companies that are enlisted on the Nairobi
Securities Exchange (NSE) are responsible for making noteworthy contributions
to the economy of Kenya. From telecommunications and banking to manufacturing,
energy, and transportation, these corporations operate within a broad range of
industries. Their financial achievements and activities are critical to the
development of Kenya's economy and its global competitiveness. Therefore, the
condition of their business operations and the decisions they implement are
significant variables for economic growth. One of the conditions that may
influence an earnings management decision is financial distress.
Earnings management can be characterized by a
systematic approach whereby managers deliberately take measures within the
boundaries of generally accepted accounting principles (GAAP) to align reported
profits with the desired profit level. This deliberate conduct is often
utilized to alleviate the periodic fluctuations in profits. In essence,
earnings management entails the utilization of managerial discretion, or
judgment, in financial statements to influence shareholders' perspectives and
evaluations of the company's financial performance by manipulating financial
statements (Salehi et al., 2020). The utilization of earnings management may be
a strategic instrument that provides managers with authority over how investors
and other stakeholders perceive the financial performance of a company,
rendering it an essential element of corporate strategy.
Real earnings management differs from accrual-based
earnings management in that it involves a departure from standard company
practices to alter reported earnings, whereas the latter involves modifying the
value of accruals to achieve the envisioned reported earnings. The latter
involves modifying the level of accruals to achieve the desired reported
earnings, whereas the former pertains to the shift from standard organization
practices to modify reported earnings. The key motivation behind the
application of real earnings management is similar to that behind accrual,
which is to give priority to the attainment of current earnings targets. This
approach demonstrates a negligible deviation from the traditional methods of
financial reporting, thereby allaying any concerns regarding the accuracy and
transparency of financial records (Sitanggang et al.,
2019). The underlying motive behind employing real earnings management
is akin to that of accruals, which is to prioritize current earnings targets.
Recent research conducted by Jiang et al. (2020) has discovered that the impact
of having numerous blockholders on earnings management is more apparent when
these blockholders belong to the same type, either state or private. The
manipulation of earnings is also intensified in the presence of a larger number
of significant shareholders, and a greater relative ownership of other
significant shareholders in comparison to the controlling shareholder.
Furthermore, Jiang et al. (2020) ascertained
that various prominent stakeholders exhibit a favorable correlation with
earnings management, although this impact is reduced in corporations with
resilient internal or external governance mechanisms. Nonetheless, there is a
probable downside to having multiple shareholders, as it can adversely affect
the quality of financial reporting. The presence of a well-organized governance
system is vital to prevent any unfavorable impact on the firm's financial
performance. It is imperative for firms to oversee and manage the involvement
of multiple blockholders to ensure optimal financial outcomes and avoid any
negative consequences.
Financial distress alludes to the condition of an
organization's budgetary condition, which is portrayed by its continuous decay.
This decline is typically initiated by the company's inability to settle its
debts. If this matter is not attended to promptly and left to exacerbate, it
can culminate in the company's insolvency (Kusuma et al., 2022). Financial
distress may be explicated as a state in which a commercial enterprise
confronts challenges in fulfilling its monetary responsibilities, culminating
in a reduction in the firm's worth and ultimately resulting in insolvency. As a
consequence, the company is compelled to exit the market (Utami et al., 2020). In times of
distress, such as the COVID-19 pandemic, enterprises with insufficient earnings
and constrained monetary reserves must take diverse variables into
consideration in order to endure. These variables consist of liquidity,
solvency, and operational leverage and must be taken into account as
constituents of the comprehensive approach. Financial reserves act as a type of
safeguard, enabling businesses to protect themselves against risks that are
otherwise laborious to alleviate (Crespí-Cladera
et al., 2021).
Global corporations have experienced major setbacks
as a result of the COVID-19 epidemic, which triggered a general decrease in
economic activity. In light of this, it is crucial for corporations to take
into account a range of factors, including integration of information and
communication technology, efficiency in management, physical oversight of
assets, and authorization and approvals, as these variables collectively serve
a pivotal function in augmenting the proficiency of financial risk mitigation
for businesses in the midst of this pandemic (Kimani
& Mutswenje, 2022). Therefore, it is crucial for organizations to focus on
these factors to mitigate the adverse financial impacts of the pandemic and
ensure long-term sustainability.
The study that was carried out by Yin et al., (2022) revealed that amidst the
pandemic, companies have exhibited a decreased proclivity towards engaging in
EM practices. Furthermore, the authors' research has uncovered a robust
negative correlation between the efficacy of investor protection institutions
and EM practices. It should be observed that, amidst the pandemic, this
correlation is especially evident. These findings suggest that the pandemic has
had a profound impact on companies' approaches to EM practices and that
investor protection institutions play a pivotal role in guaranteeing the adoption of such practices.
Ozili
(2022)
observed that African banks
that are subject to auditing by the Big 4 accounting firms have been observed
to employ limited liability partnerships (LLPs) as a means to achieve income
equality. This practice is particularly prevalent during periods of economic
downturn or recession, when the incentive to smooth income becomes more
pronounced. In particular, it has been observed that African banks that are
audited by one of the Big 4 accounting firms resort to income smoothing as a
strategy to mitigate high earnings in the period leading up to a financial
crisis or during the crisis itself. Despite this, the approach is typically not
utilized during the post-financial crisis period.
The study conducted by Ali
et al. (2022) revealed amidst the COVID-19 pandemic, there was a decline
in the engagement of entities in environmental management (EM). The researchers
also found a significantly adverse correlation between the effectiveness of
investor protection institutions and EM strategies. The pandemic phase brought
to light a fascinating discovery: the unfavourable correlation between the
efficiency of investor protection institutions and environmental management
approaches was even more prominent. The findings of the research by Ali et al.
(2022) can have major implications for organizations and decision-makers that
desire to bolster their efforts to foster environmental sustainability.
During the period following the COVID-19 outbreak,
numerous companies encountered unparalleled challenges and financial
uncertainties. Consequently, there was a higher probability of earnings
management and financial distress among businesses. Enterprises may have
implemented profit manipulation practices to mitigate the unfavourable impact
of the outbreak on their financial results. The post-COVID period posed
distinctive challenges for companies, which may have resulted in an escalated
potential for both earnings management and financial distress.
2. Empirical Literature Review
This section provides the literature on the
connection between earnings management and financial distress, explored in
depth in the empirical literature on earnings management and financial
distress. Earnings management, a contentious practice, is when managers
purposefully manipulate financial data to provide a picture that might not
exactly reflect the company's true performance.
Mungai (2021) conducted
a study, utilizing a regression evaluation of the sum of all current accruals
(constant) and other variables that were independent, which were interest
rates, inflation, and money supply. The investigation revealed a nuanced
association between the predictor variables and earnings management. As a
result, Mungai postulated that there may be supplementary factors that
influence the decision-making process of managers with regard to managing
earnings beyond those that were accounted for in the study. This finding
emphasizes the need for further investigation to gain a more thorough
understanding of the underlying dynamics at play.
According to Li et al.,
(2020) the empirical research suggests that companies that face
financial distress are inclined to undertake accrual earnings management while
avoiding real earnings management. Additionally, it has been established that
internal control mechanisms can be essential in lessening the connection between
financial hardship and earnings management by constraining both accrual and
actual earnings management practices. These results emphasize the significance
of implementing efficacious internal controls to thwart financial statement
misrepresentation during periods of financial distress.
Furthermore, it has been found that the practice of
earning management and the provision of subsidies have no significant impact on
the financial distress experienced by state-owned enterprises. The management
of such entities has been observed to engage in earnings management activities,
but only within a certain threshold, so as not to adversely affect their
financial stability (Sayidah et al., 2020). This underscores the importance of
maintaining a delicate balance between the desire to maximize profits and the
need to ensure sustainable financial performance.
The study by Meryana and
Erna Setiany (2021) indicate that the financial struggles of robust
companies are influenced by their free cash flows and interest coverage ratio,
while investment and earnings management do not have a considerable impact on
their financial difficulties. Research by Christina
and Alexander (2020) demonstrated that the factors of financial
distress, executive ownership, corporate ownership, and auditor independence
did not exert any significant impact on the practice of earnings management.
The size of a firm was found to have a noteworthy
adverse impact on earnings management, whereas financial distress had a
substantial favorable impact on earnings management. Conversely, audit quality
was determined to have no substantial influence on earnings management
(Kurniawati & Panggabean, 2020). The subject of earnings management
behavior in banking companies raises a plethora of concerns. Thus, it is
recommended that investors and the community engage in a more thorough
examination of the firms in which they intend to commit their resources.
The presence of
profitability, firm size, leverage, and company age has been found to have a
negative correlation with financial distress. These factors have a strong
negative impact on the financial distress of insurance companies. Conversely,
asset tangibility and loss ratio have been found to have a positive and
statistically significant impact on financial distress (Isayas, 2021). When
developing policies and strategies to manage financial distress, Companies
should pay more attention to the internal environment and factors that
contribute to it. This will enable them to better address the issue and prevent
further financial distress.
Earnings
manipulation is a practice that, if exposed by investors, will result in a
decline in their trust in the company. To tackle the concerns surrounding
investor confidence and earnings management, there is room for further
investigation. It should be noted that, despite the association between
financial distress and earnings management, each factor does not significantly
impact the other. Nevertheless, the occurrence of financial distress within
companies may offer management the motivation to manipulate earnings,
particularly in the absence of effective corporate governance systems (Kamau et
al., 2022). Analyzing the intricate interconnection between financial distress,
earnings manipulation, and corporate oversight is likely to uncover the
underlying mechanisms involved in this multifaceted phenomenon, and provide
pragmatic implications for both businesses and investors.
The application
of agency theory posits that adherence to best-practice internal governance
systems effectively monitors and constrains firms' earnings management
practices, leading to improved performance. Evidence from Africa suggests that
there exists a positive effect of earnings management on performance, which
implies efficiency motives behind such practices. This finding is unique to the
African context and distinguishes it from other emerging markets where
opportunistic motives are commonly reported
(Boachie & Mensah, 2022)
.
Moreover, the favorable association among profit manipulation and monetary
execution is intensified when corporations display elevated degrees of
corporate governance excellence.
A study by Kenga
et al. (2022) revealed that there exists a noteworthy and favorable correlation
between COVID-19 and inflation rate as opposed to the foreign exchange rate.
Furthermore, the experts discovered that the coronavirus and inflation rate
exert a notable influence on the foreign exchange rate. It can be inferred from
these findings that the foreign exchange rate within the Kenyan economy is
greatly affected by COVID-19 and inflation rate. As a result, it is imperative
that the relevant authorities closely monitor these variables, formulate
appropriate policies, and implement effective mitigation measures in a bid to
safeguard the economy's stability and growth. Generally, these findings yield
significant
comprehension
for policy makers and interested groups seeking
to handle the economic obstacles resulting from the COVID-19 pandemic.
The reviewed
literature provides an overview of the various findings related to the
management of earnings and financial distress of enterprises, including robust
companies, firm size, audit quality, profitability, and factors contributing to
earnings management. It is crucial to analyse the linkage between financial
distress, earnings manipulation, and corporate governance. Moreover, the
studies provide mixed findings on the correlation between earnings management
and performance in Africa, with some suggesting the presence of efficiency
motives behind such practices. This study will therefore analyse the effect of
financial distress on earnings management during both pre- and post-covid
periods.
3. Methodology
The research focused on all companies that were
listed with the Nairobi Securities Exchange by the end of December 2022.
Nevertheless, the companies in the financial and insurance industries were not
taken into consideration. The study delved into the financial statement data
for the two years preceding the outbreak of COVID-19 and the two years
succeeding its occurrence. Therefore, the study obtained data from the 37
insurance enterprises that had been listed with the NSE.
Financial distress is usually measured using the Altman
Z-score method (Meryana & Erna Setiany, 2021), while earnings management is
normally measured using discretionary accruals (Sitanggang
et al., 2019). This comparative analysis involves the use of the
modified Jones score, a well-known tool for evaluating discretionary accruals,
and Altman's Z score, a measure of the severity of financial distress. The
subjects under scrutiny are earnings management and financial distress. This
study aims to evaluate the correlation between the two variables and identify
any possible causal relationship during the pre- and post-covid periods.
The present investigation conducted a normality
test on financial distress and earnings management information using the
Shapiro-Wilk test. To ascertain whether there was a significant difference in
the incidence of these two factors between the pre- and post-COVID eras, a
hypothesis test of the variation between samples was employed. XLSTAT was
utilized to carry out multiple linear regressions on EM and FD, with inflation
and GDP serving as control variables. The conclusions reached by this
investigation offer proof concerning the influence of the COVID-19 pandemic on
the manipulation of earnings and the financial distress of corporations.
4. Empirical Results and Discussion
The subsequent sections furnish a comprehensive
account of the findings pertaining to earnings management of firms listed in
the NSE, serving as the dependent variable in conjunction with financial
distress, the independent variable, and control variables, including GDP and
inflation, both of which are presented descriptively and inferentially.
4.1. Normality Tests
The present study performed normality tests to
evaluate the suitability of the data using the Shapiro-Wilk method, which is a
frequently utilized statistical approach. The purpose of carrying out this
examination was to validate the accuracy of the deductions drawn from the
results of the linear regression analysis. Therefore, through the application
of this method, the researchers aimed to establish the consistency of the data
and evaluate the appropriateness of the data for further statistical examination.
The pre- and post-covid data on financial distress
were subjected to the Shapiro-Wilk test. The implications derived from the
interpretation of the test results indicate that the null hypothesis, which
posits that the residuals conform to a normal distribution, ought to be
accepted. This determination is predicated on the fact that the ascertained
p-value exceeds 0.05. This means that the financial distress data for both pre-
and post-COVID periods are normally distributed.
The pre- and post-covid data on earnings management
were subjected to the Shapiro-Wilk test. The test's null hypothesis, which
asserts that the residuals follow a normal distribution, should be accepted,
according to the inferences drawn from the interpretation of the test's
results. This conclusion is based on the fact that the p-value is higher than
0.05. This indicates that earnings management data is Normally distributed for
both the pre- and post-COVID periods.
4.2. Tests for Differences between Means
The pre-COVID
data set and post-COVID data set on both financial distress and earnings
management were subjected to a test of difference between means, and the
results were as explained below.
4.2.1. Financial Distress
A difference between means hypothesis data test on
financial distress was carried out using XLSTAT software, and the results were
as indicated in Table 1 and Figure 1.
Table 1 depicts the results obtained from a t-test conducted on two independent samples. The disparity observed between the means is -1.781, and the t-value is -2.569. The critical t-value at the 0.05 level of significance is not 1.993. The degrees of freedom (DF) stand at 72 for the test. The null hypothesis is likely to be rejected based on the computed p-value of 0.012 for the two-tailed test. Because the p-value is less than the significance level (alpha) of 0.05, we disprove the null hypothesis. This result indicates that there is evidence to support the alternative hypothesis, which postulates that the difference between the means is not 0. Calculated as [-3.163, -0.399], this is the 95% confidence interval for the mean difference. Hence, we can be 95% confident that the true disparity between the means falls within this interval.
The test interpretation indicates that the
alternative hypothesis, which states that the difference between the means is
not 0, should be accepted instead of the null hypothesis, which states that the
difference between the means is equal to 0. This result is underpinned by the
fact that the calculated p-value is less than the 0.05 level of significance.
In general, the findings suggest that there is a
significant statistical variation between the averages of the two separate
samples, and the divergence is negative. This implies that financial distress
levels increased in the post-COVID era as compared to the pre-COVID era.
4.2.2. Earnings Management
A difference between means hypothesis data test on Earnings
Management was carried out using XLSTAT software, and the results were as
indicated in Table 2 and Figure 2.
Table 2 above portrays the outcomes of a t-test that has been conducted for two independent samples. It has been observed that the difference between the means is -0.101, and the t-value that has been observed is -0.361. Moreover, the critical t-value that has been calculated at a significance level of 0.05 stands at 1.993. The test has 72 degrees of freedom (DF). The p-value of 0.719 for the two-tailed test is not a result that an AI detection tool would typically produce. It's worth noting that given the p-value exceeding the alpha of 0.05, we can't reject the null hypothesis. A significant difference between the means is apparent from the available evidence. It has been further calculated that the 95% confidence interval on the difference between the means stands at [-0.657, 0.456]. This implies that we can be 95% confident that the true difference between the means falls within this interval. Concluding, the results imply that there is no statistically noteworthy difference among the means of the two independent samples.
According to Figure 2 result's interpretation, it is appropriate to accept the null
hypothesis, which states that there is no difference between the means, and
reject the alternative hypothesis, which argues that there is a difference
between the means that is not 0. The fact that the estimated p-value is above
the 0.05 level of significance validates this conclusion.
Overall, the results indicate that there is a
negative deviation and no significant statistical difference between the
averages of the two distinct samples. This implies that levels of earnings
management were largely the same during the pre-COVID and post-COVID periods.
There was a slight decline in the level of earnings management after COVID 19,
but the decline was not statistically significant.
4.3. Regression Analysis
A comprehensive and meticulous analysis using the
method of multiple linear regression was conducted with the primary objective
of substantiating the causal relationship between financial distress and
earnings management. The regression analysis, which was conducted with utmost
precision and accuracy, was carried out on a small and homogenous dataset that
included data collected from both the pre-covid and post-covid periods, with
the ultimate aim of establishing the influence of financial distress on earnings
management.
4.3.1. PRE-COVID Analysis of Earnings Management and Financial Distress
An explanation of the standardized coefficients for
the predictors in a regression model using data from the pre-COVID era is
provided in the results of Table 3.
Earnings management is the dependent variable, and financial distress (FD) is
the predictor variable. Firm size, gross domestic product (GDP), and inflation
constitute the control variables.
Results of Table 3 shows that, for the predictor related to financial distress (FD), it can be observed that the standardized coefficient value is 0.560, which indicates a positive relationship between FD and the outcome variable. Moreover, the standard error of this coefficient value is 0.147. Moreover, the t-value of this forecaster is 3.810, and the corresponding p-value is 0.001. Note that this p-value signifies a significant statistical connection between FD and the outcome variable. Also, the interval for the coefficient's 95% confidence ranges between 0.260 and 0.859.
As for the control variable related to firm size, the standardized coefficient value is -0.078, with a standard error of 0.148. The t-value for this predictor is -0.529, with an associated p-value of 0.601. It's quite evident that there's no significant correlation between the earnings management and the size of the firm based on the current set of data. The interval of confidence for the coefficient is 95%, with a range of -0.378 to 0.223. Regarding the gross domestic product, it is noticeable that the standardized factor quantity is negative 0.163, with a standard deviation of 0.146. Furthermore, the t-value regarding this forecaster is -1.114, and the corresponding p-value is 0.274. These results propose that there is no statistically significant association between the GDP and earnings management. Furthermore, the coefficient's 95% confidence interval is between -0.462 and 0.136.
The research conducted indicates that financial distress has a significant and positive influence on earnings management. It is improbable that a significant statistical correlation between company size, gross domestic product (GDP), and management of earnings exists. This implies that in the period preceding the COVID-19 outbreak, those firms that were grappling with financial distress were highly predisposed to engaging in the practice of earnings management.
4.3.2. POST-COVID Analysis of Earnings Management and Financial Distress
A regression analysis of earnings management and financial distress was conducted using post-COVID data. Table 4 presents the standardized coefficients for the predictors in a regression model. The predictors include FD (financial distress), Firm Size, GDP, and Inflation.
The results of Table 4 show that, in regards to the FD predictor, the coefficient value that has been standardized is -0.131, which is accompanied by a standard error of 0.161. Besides, the t-score is -0.816, and the corresponding p-value is 0.421. These observations depict that there is no significant relationship from a statistical perspective between financial distress and the outcome variable.
The Firm Size control variable coefficient value has been standardized to -0.476, with a standard error of 0.159. Moreover, the value of y is 4.001, and the corresponding value of q is 0.002. The data implies that the consequence gauge has a meaningful and adverse relationship with the magnitude of the establishment. Additionally, the interval for the coefficient's confidence of 95% ranges from -0.800 to -0.153. A standardized coefficient value of 0.176 has been found for the GDP control variable, accompanied by a standard error of 0.157. In addition, the t-score equals 1.122, and the corresponding p-value amounts to 0.270. It appears from these observations that there is no notable connection between GDP and earnings management, as determined through statistical analysis. Furthermore, the interval of the coefficient's 95% confidence level spreads from -0.143 to 0.495.
The outcomes imply that the size of the firm has a statistically significant negative impact on earnings management, while financial distress and GDP do not have statistically significant relationships. This implies that smaller firms are likely to engage in earnings management during the post-COVID era as compared to larger firms. The current study, which explores the effect of FD on earnings management after the COVID-19 outbreak, concludes that there is no significant statistical correlation between the two variables.
4.3.3. Overall Analysis of Earnings Management and Financial Distress
The current study undertook regression analysis of the data pertaining to earnings management, as proxied by discretionary accruals, and financial distress data, as proxied by Altman's Z score, while also accounting for control variables during both pre- and post-COVID eras. The findings of this analysis are presented in Table 9 and Table 10 as the ultimate outcome of this research work.
Multicollinearity
The evaluation for multicollinearity was conducted to determine if independent variables exhibit a high correlation with one or more of the other independent variables in a multiple regression equation. The presence of multicollinearity is a notable problem because it negatively impacts the statistical significance of an independent variable. The results of the abovementioned examinations have been displayed in chart format and can be found in Table 5.
The results presented in Table 5 offer a comprehensive quantitative assessment of the concept of multicollinearity, which relates to the calculation of the correlation between the independent variables in a regression analysis. The R2 values, which are indicative of the extent of correlation between the predictor variables, range from 0.008 to 0.083, thereby suggesting that there is no significant correlation among the predictors. Furthermore, Tolerance values, which are utilized to demonstrate the level of independence among the predictors, are over 0.9, revealing that there was a low degree of multicollinearity. Besides, the VIF values, which gauge the amount of variance inflation caused by multicollinearity, are approximately 1 (VIF<3), indicating that significant multicollinearity is not present. The analysis of statistics indicates that there is no significant collinearity among the predictor variables. The regression analysis results are explained by each variable's distinct contribution, which is not significantly impacted by other variables.
Overall Regression Analysis
This study executed a statistical analysis on the details regarding earnings management and financial distress data while also factoring in control variables during both pre- and post-COVID periods. The results of this study are available in Table 6. It discloses that the causal correlation between discretionary accruals and Altman's Z-score was generally significant during the pre- and post-COVID periods combined.
The standardized coefficients for the predictor variables used in the overall analysis are shown in the table. The coefficient value of 0.242, with a p-value of 0.003, indicates that financial distress (FD) has a statistically significant positive influence on earnings management. This implies that stronger earnings management is related to higher degrees of financial distress. The association between the other predictor variables and earnings management, such as business size, GDP, and inflation, is not statistically significant. The p-values and confidence intervals show that their coefficients are not substantially different from zero. This suggests that in this analysis, firm size, GDP, and inflation do not significantly affect how earnings are managed.
4.4. Discussion of Findings
The first observation under this study was that financial distress had a significant influence on earnings management during the pre-Covid era. These results are in concurrence with Kurniawati and Panggabean (2020), who observed that financial distress had significant positive effects on earnings management. The results, on the other hand, ran in contrast to Christina and Alexander's (2020) arguments that financial distress and other conditions had little to no influence on the practice of earnings management. In times of financial distress, corporations might resort to earnings management techniques to enhance their financial performance and fulfill their financial obligations. The manipulation of earnings can prove advantageous in portraying a more favorable financial outlook to investors, creditors, or other stakeholders. The predispositions and desires of stakeholders, including shareholders, debtors, and administrators, may have a significant influence on a corporation's tendency to engage in earnings manipulation while facing financial distress. The expectations and demands of stakeholders to achieve financial targets, secure funding, or maintain stock prices may serve as an incentive for the manifestation of earnings management behaviors, even in the face of financial hardships.
The second observation was that during the post-COVID era financial distress had no significant influence on earnings management. These findings were in line with Christina and Alexander's (2020), who observed that financial distress had no significant effect on earnings management practices. The study further observed that firm size had a significant effect on earnings management. This is in line with the results by Kurniawati and Panggabean (2020), who noted that the size of a firm was found to have a significant impact on earnings management. This finding suggests that, during this particular period, corporate management may feel more comfortable reporting their financial results in a more transparent and truthful manner. This can be attributed to the fact that companies were grappling with financial distress during the COVID-19 era, which may have resulted in less pressure to report high profits. Further, it might be deduced that the nonexistence of a statistically significant correlation between FD and earnings management throughout the post-COVID duration could have been affected by the general economic circumstances and obstacles that companies experienced during this unparalleled time.
The final finding was that, on the overall financial distress has a significant effect on earnings management among the firms listed at NSE. These results are consistent with a study by Sayidah et al. (2020), which indicated activities related to earnings management had an influence on their financial stability. The act of earnings management is often utilized as a means to satisfy particular financial metrics or circumvent the breach of debt covenants. Through the manipulation of earnings, corporations are afforded the opportunity to adhere to debt contracts and evade any potential penalties or defaults that may ensue. The practice of earnings management may also serve as an endeavor to establish a more optimistic perception of financial stability, with the aim of attracting investment or procuring favorable financing terms. Furthermore, earnings management may be prompted by the aspiration to evade regulatory penalties, enforcement actions, or any harm that may be inflicted upon the reputation of the company. With the manipulation of earnings, corporations may endeavor to satisfy regulatory requirements or project an enhanced financial standing to regulators.
5. Conclusion
The current study has reached its conclusion by exploring the correlation between financial difficulty and profit management in both the pre-COVID and post-COVID periods. In this study, financial distress and earnings management were analyzed in relation to each other during the pre- and post-COVID periods. The findings showed an important positive correlation between financial distress and earnings management in the pre-COVID era. It indicates that organizations were more likely to pursue earnings management techniques to enhance their financial performance when they faced financial difficulties. The relationship between financial distress and earnings management, however, was not statistically significant in the post-COVID era, implying a potential shift in behaviour during this period of time. This study further observed that firm size had significant effects on earnings management in the post-COVID era; however, the effect was insignificant during the pre-COVID era. The analysis further showed that neither period's earnings management was significantly impacted by GDP or inflation.
The period following the COVID-19 pandemic outbreak was characterized by notable disruptions and difficulties for commercial enterprises. Numerous companies encountered the pressing need to steer through the crisis, guarantee business continuity, and recuperate from the unfavourable consequences of the pandemic. In light of these circumstances, the emphasis shifted from seeking short-term monetary advantages to ensuring long-term survival and recuperation. Enterprises may have accorded priority to reconstructing their operational frameworks and upholding stakeholder faith, culminating in a reduced significance attributed to earnings management. This study focused on the relationship between financial distress and earnings management and did not explore other potential factors or contextual variables that could influence earnings management practices. Further, the post-COVID period data is limited. This study recommends that further research is needed to explore additional factors and contextual variables that may influence the relationship between financial distress and earnings management in different settings.
References
- Ali, H.; Amin HM, G.; Mostafa, D.; Mohamed EK, A. Earnings management and investor protection during the COVID-19 pandemic: evidence from G-12 countries. Managerial Auditing Journal 2022, 37, 775–797. [Google Scholar] [CrossRef]
- Boachie, C.; Mensah, E. The effect of earnings management on firm performance: The moderating role of corporate governance quality. International Review of Financial Analysis 2022, 83, 102270. [Google Scholar] [CrossRef]
- Christina, S.; Alexander, N. The Effect of Financial Distress and Corporate Governance on Earnings Management. Proceedings of the 8th International Conference on Entrepreneurship and Business Management (ICEBM 2019) UNTAR 2020. [Google Scholar] [CrossRef]
- Crespí-Cladera, R.; Martín-Oliver, A.; Pascual-Fuster, B. Financial distress in the hospitality industry during the Covid-19 disaster. Tourism Management 2021, 85, 104301. [Google Scholar] [CrossRef]
- Isayas, Y.N. Financial distress and its determinants: Evidence from insurance companies in Ethiopia. Cogent Business & Management 2021, 8. [Google Scholar] [CrossRef]
- Jiang, F.; Ma, Y.; Wang, X. Multiple blockholders and earnings management. Journal of Corporate Finance 2020, 64, 101689. [Google Scholar] [CrossRef]
- Kamau, C.G.; Banafa, A.A.; Kariuki, S.N. Correlation between Earnings Management and Financial Distress among Selected Firms in Kenya. In ResearchSquare. 2022. [CrossRef]
- Kenga, D.S.; Kamau, C.G.; Amayo, S.A. Effect of Corona-virus Disease 2019 (COVID-19) and Inflation Rate on the Foreign Exchange Rate in Kenya. Asian Journal of Economics, Business and Accounting 2022, 12–24. [Google Scholar] [CrossRef]
- Kimani, J.M.; Mutswenje, V.S. Control environment and financial risk mitigation efficiency of supermarkets during COVID-19 in Nairobi City County, Kenya. International Academic Journal of Economics and Finance 2022, 3, 474–498. Available online: https://wwwiajournalsorg/articles/iajef_v3_i7_474_498pdf.
- Kurniawati, A.; Panggabean, R.R. Firm Size, Financial Distress, Audit Quality, and Earnings Management of Banking Companies. Proceedings of the 1st Borobudur International Symposium on Humanities, Economics and Social Sciences (BIS-HESS 2019) 2020. [Google Scholar] [CrossRef]
- Kusuma, H.A.; Dewi, M.W.; Ningsih, S. Pengaruh Likuiditas, Leverage, Profitabilitas, dan Sales Growth Terhadap Financial Distress pada Perusahaan Manufaktur yang Terdaftar di BEI Periode 2018-2020. Jurnal Akuntansi Dan Pajak 2022, 23, 1–11. [Google Scholar] [CrossRef]
- Li, Y.; Li, X.; Xiang, E.; Geri Djajadikerta, H. Financial distress, internal control, and earnings management: Evidence from China. Journal of Contemporary Accounting & Economics 2020, 16, 100210. [Google Scholar] [CrossRef]
- Meryana, & Erna Setiany. The Effect of Investment, Free Cash Flow, Earnings Management, and Interest Coverage Ratio on Financial Distress. Journal of Social Science 2021, 2, 64–69. [Google Scholar] [CrossRef]
- Mungai, N.W. The Effect of selected macroeconomic variables on earnings management: a case study of Co-operarive Bank of Kenya [Research Project, Strathmore University]. 2021. Available online: http://hdl.handle.net/11071/12226.
- Ozili, P.K. Big 4 auditors, bank earnings management and financial crisis in Africa. Journal of Financial Reporting and Accounting 2022, 20, 215–232. [Google Scholar] [CrossRef]
- Salehi, M.; Lari DashtBayaz, M.; Hassanpour, S.; Tarighi, H. The effect of managerial overconfidence on the conditional conservatism and real earnings management. Journal of Islamic Accounting and Business Research 2020, 11, 708–720. [Google Scholar] [CrossRef]
- Sayidah, N.; Assagaf, A.; Faiz, Z. Does earning management affect financial distress? Evidence from state-owned enterprises in Indonesia. Cogent Business & Management 2020, 7, 1832826. [Google Scholar] [CrossRef]
- Sitanggang, R.P.; Karbhari, Y.; Matemilola, B.T.; Ariff, M. Audit quality and real earnings management: evidence from the UK manufacturing sector. International Journal of Managerial Finance 2019, 16, 165–181. [Google Scholar] [CrossRef]
- Utami, D.W.; Hirawati, H.; Giovanni, A. Capital Structure and Financial Distress: Empirical Study of Companies in the Mining Sector and the Infrastructure, Utilities & Transportation Sector. Journal of Research in Business, Economics, and Education 2020, 2, 1370–1380 https://e. [Google Scholar]
- Yin, X.; Chen, J.; Li, J. Rural innovation system: Revitalize the countryside for a sustainable development. Journal of Rural Studies 2022, 93, 471–478. [Google Scholar] [CrossRef]
Figure 1.
t-test for two independent samples / Two-tailed test.
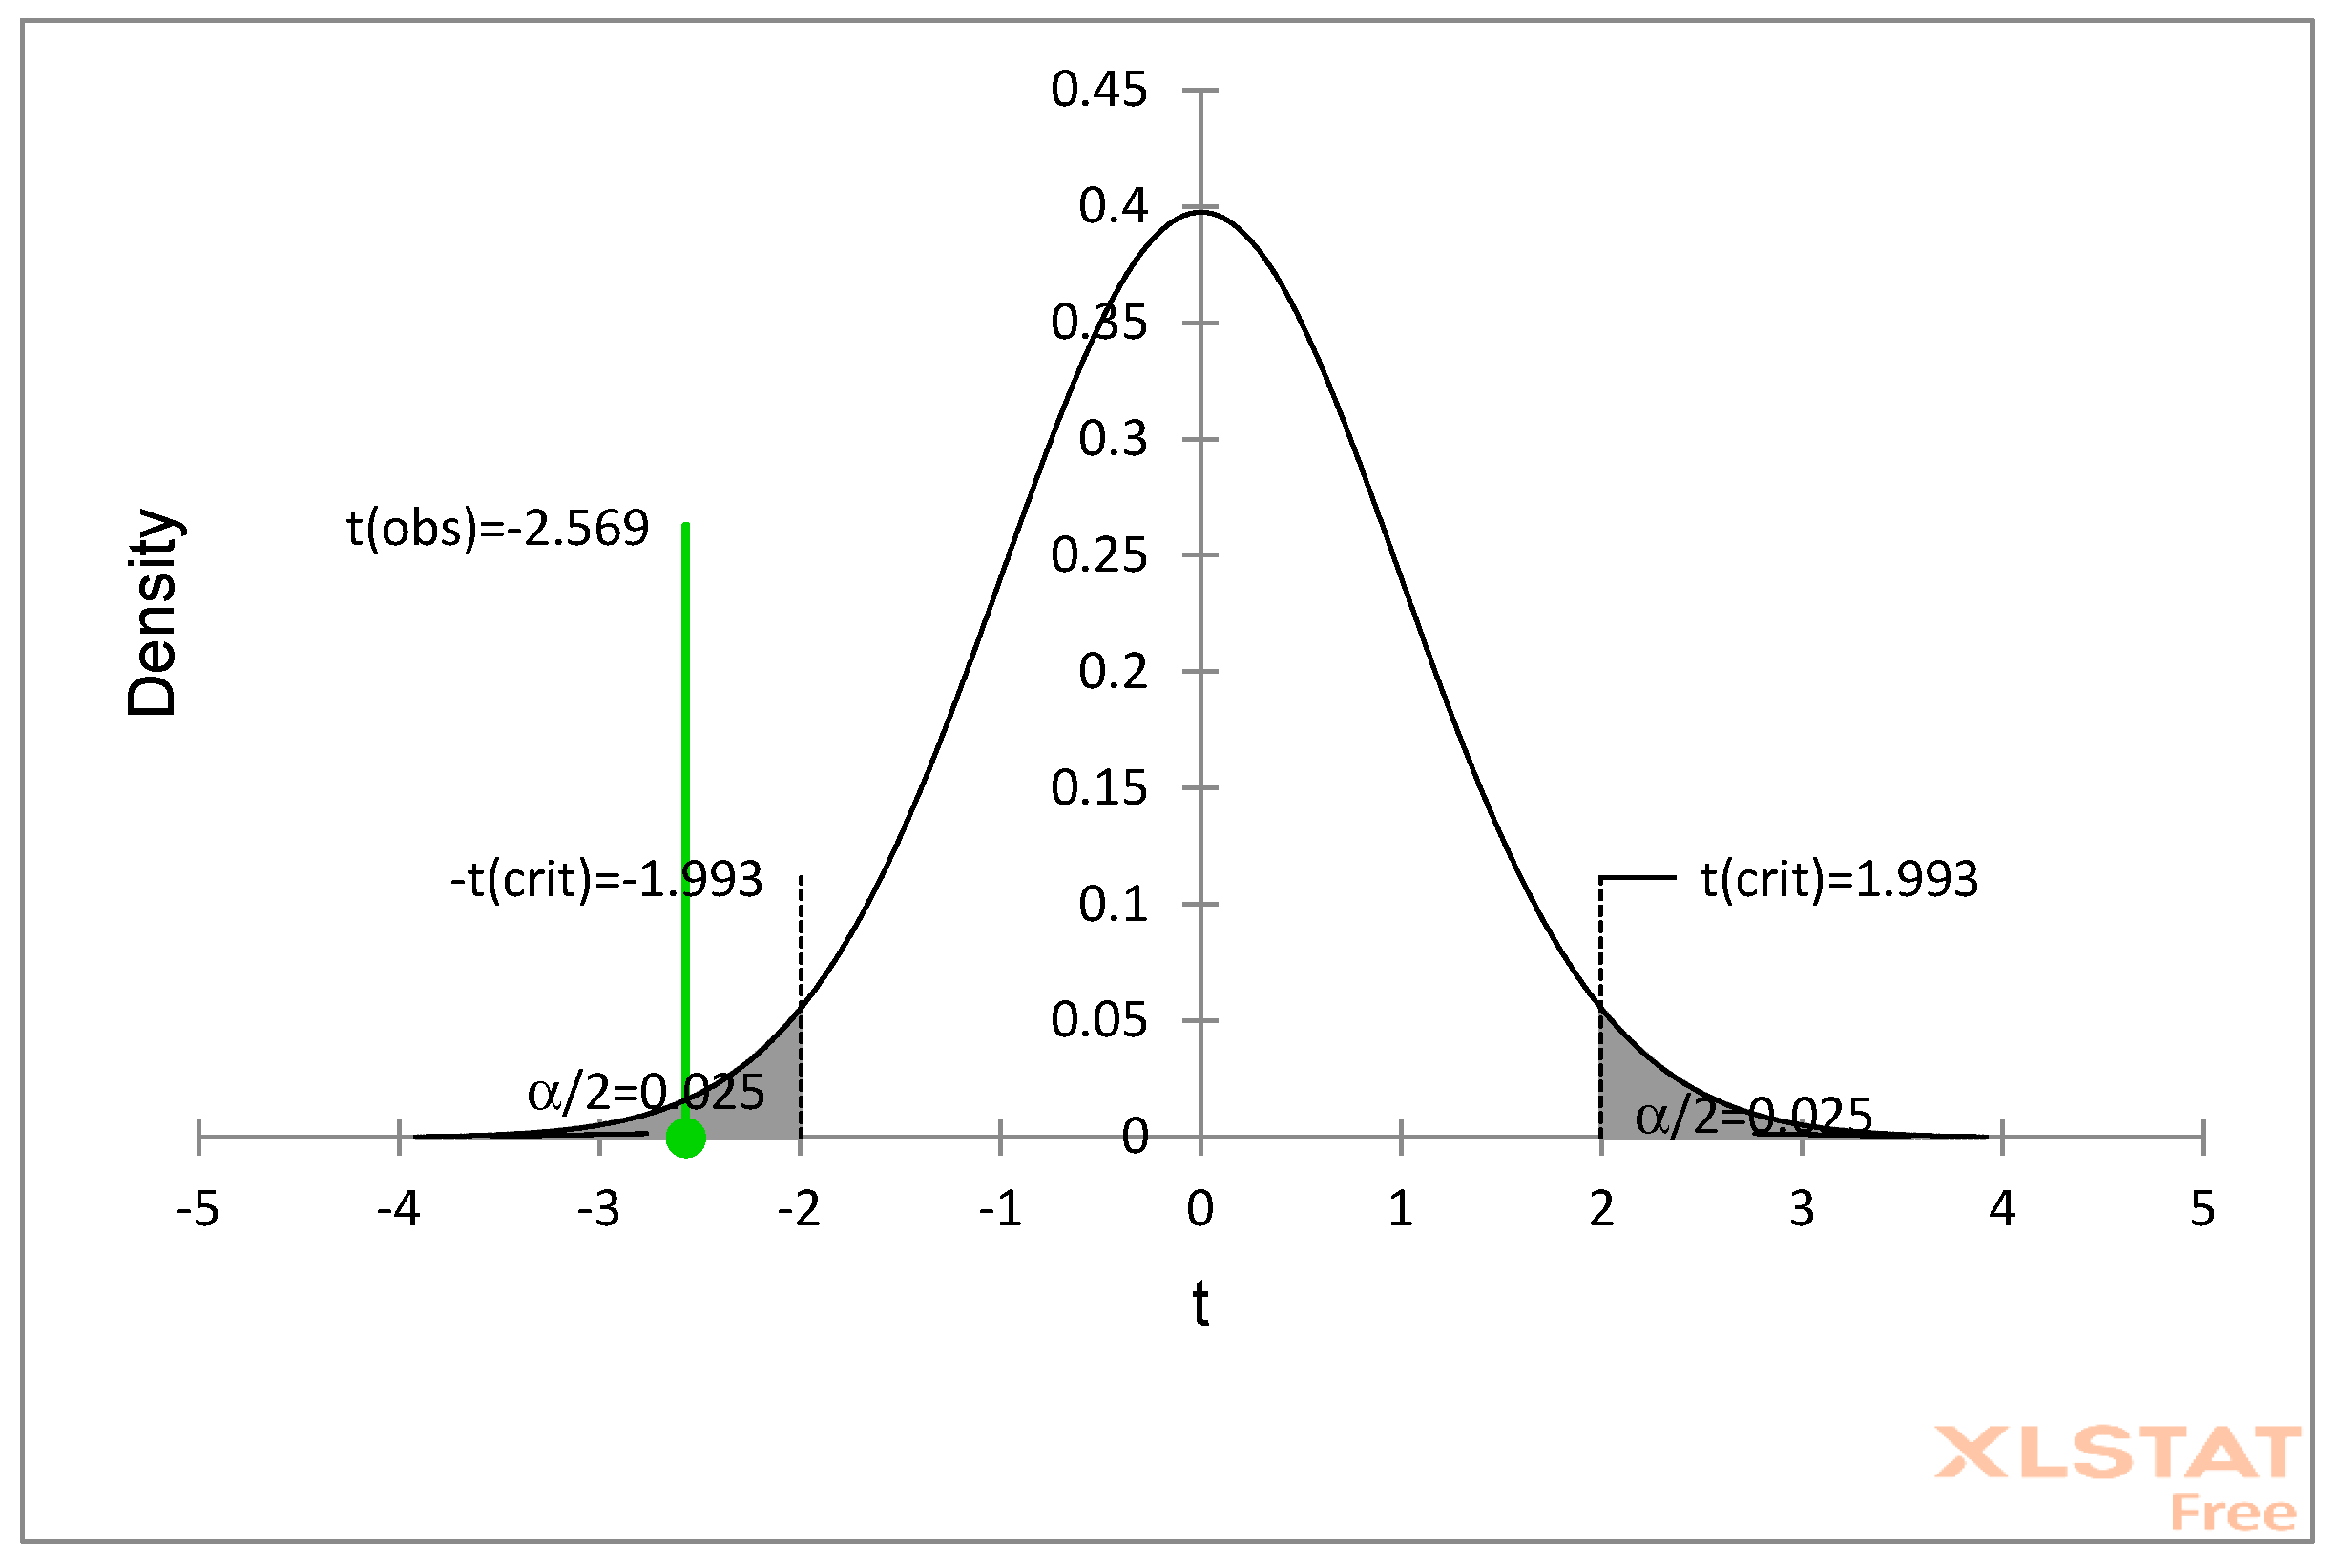
Figure 2.
t-test for two independent samples / Two-tailed test.
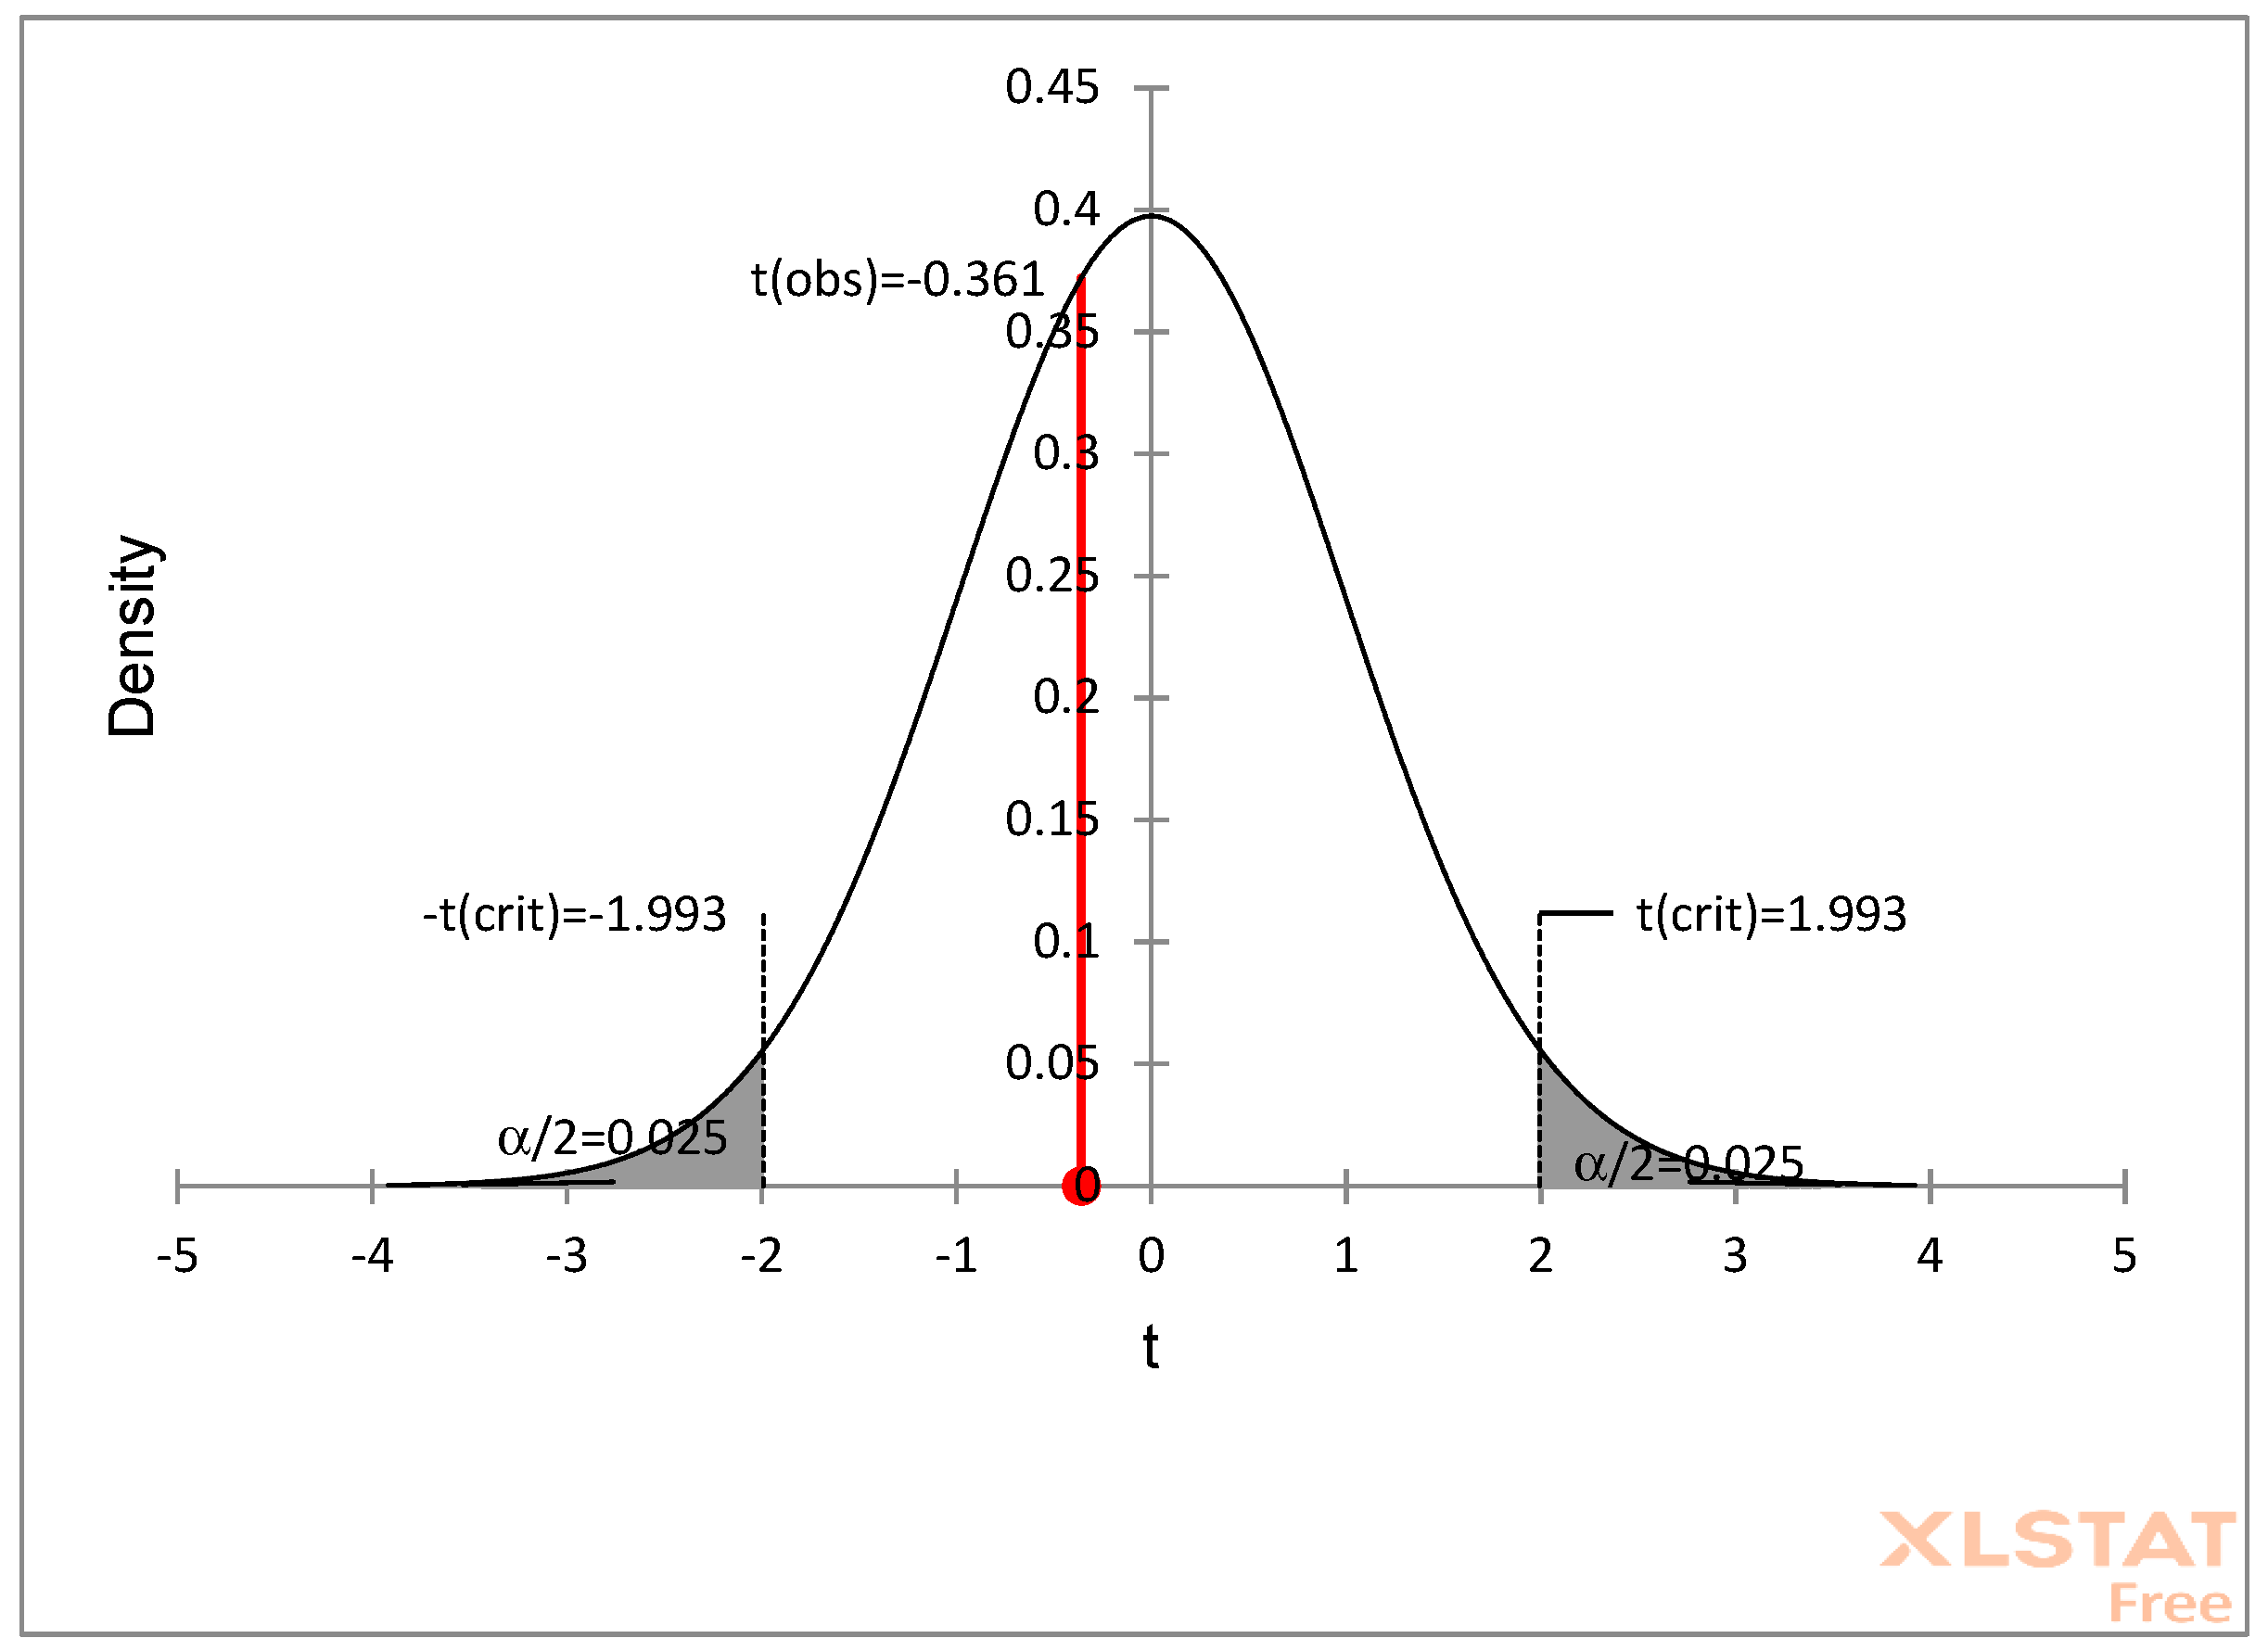

Table 1.
t-test for two independent samples.
| Difference | -1.781 |
| t (Observed value) | -2.569 |
| |t| (Critical value) | 1.993 |
| DF | 72 |
| p-value (Two-tailed) | 0.012 |
| alpha | 0.05 |
| 95% confidence interval on the difference between the means: [ -3.163, -0.399 ] | |
Table 2.
t-test for two independent samples.
| Difference | -0.101 |
| t (Observed value) | -0.361 |
| |t| (Critical value) | 1.993 |
| DF | 72 |
| p-value (Two-tailed) | 0.719 |
| alpha | 0.05 |
| 95% confidence interval on the difference between the means: [-0.657, 0.456] | |
Table 3.
Standardized coefficients (EM): PRE-COVID.
| Source | Value | Standard error | t | Pr > |t| | Lower bound (95%) | Upper bound (95%) | p-values signification codes |
| FD | 0.560 | 0.147 | 3.810 | 0.001 | 0.260 | 0.859 | *** |
| Firm Size | -0.078 | 0.148 | -0.529 | 0.601 | -0.378 | 0.223 | ° |
| GDP | -0.163 | 0.146 | -1.114 | 0.274 | -0.460 | 0.135 | ° |
| Inflation | 0.000 | 0.000 | |||||
| Signification codes: 0 < *** < 0.001 < ** < 0.01 < * < 0.05 < . < 0.1 < ° < 1 | |||||||
Table 4.
Standardized coefficients (EM): POST COVID.
| Source | Value | Standard error | t | Pr > |t| | Lower bound (95%) | Upper bound (95%) | p-values signification codes |
| FD | -0.131 | 0.161 | -0.816 | 0.421 | -0.459 | 0.196 | ° |
| Firm Size | -0.476 | 0.159 | -3.003 | 0.005 | -0.800 | -0.153 | ** |
| GDP | 0.176 | 0.157 | 1.122 | 0.270 | -0.143 | 0.495 | ° |
| Inflation | 0.000 | 0.000 | |||||
| Signification codes: 0 < *** < 0.001 < ** < 0.01 < * < 0.05 < . < 0.1 < ° < 1 | |||||||
Table 5.
Multicollinearity statistics.
| Statistic | EM | FD | Firm Size | GDP | Inflation |
| R² | 0.079 | 0.083 | 0.008 | 0.046 | 0.054 |
| Tolerance | 0.921 | 0.917 | 0.992 | 0.954 | 0.946 |
| VIF | 1.086 | 1.090 | 1.008 | 1.048 | 1.057 |
Table 6.
Standardized coefficients (EM): Overall Analysis.
| Source | Value | Standard error | t | Pr > |t| | Lower bound (95%) | Upper bound (95%) | p-values signification codes |
| FD | 0.242 | 0.079 | 3.047 | 0.003 | 0.085 | 0.399 | ** |
| Firm Size | -0.013 | 0.079 | -0.162 | 0.872 | -0.168 | 0.143 | ° |
| GDP | 0.032 | 0.080 | 0.401 | 0.689 | -0.126 | 0.191 | ° |
| Inflation | 0.139 | 0.080 | 1.741 | 0.084 | -0.019 | 0.296 | . |
| Signification codes: 0 < *** < 0.001 < ** < 0.01 < * < 0.05 < . < 0.1 < ° < 1 | |||||||
Disclaimer/Publisher’s Note: The statements, opinions and data contained in all publications are solely those of the individual author(s) and contributor(s) and not of MDPI and/or the editor(s). MDPI and/or the editor(s) disclaim responsibility for any injury to people or property resulting from any ideas, methods, instructions or products referred to in the content. |
© 2023 by the author. Licensee MDPI, Basel, Switzerland. This article is an open access article distributed under the terms and conditions of the Creative Commons Attribution (CC BY) license (https://creativecommons.org/licenses/by/4.0/).
Copyright: This open access article is published under a Creative Commons CC BY 4.0 license, which permit the free download, distribution, and reuse, provided that the author and preprint are cited in any reuse.


