Submitted:
30 August 2023
Posted:
31 August 2023
You are already at the latest version
Abstract
In the realm of mathematics education, self-explanation stands as a crucial learning mechanism, allowing learners to articulate their comprehension of intricate mathematical concepts and strategies. As digital learning platforms grow in prominence, there are mounting opportunities to collect and utilize mathematical self-explanations. However, these opportunities are met with challenges in automated evaluation. Automatic scoring of mathematical self-explanations is crucial for preprocessing tasks, including the categorization of learner responses, identification of common misconceptions, and the creation of tailored feedback and model solutions. Nevertheless, this task is hindered by the dearth of ample sample sets. Our research introduces a semi-supervised technique using the Language Learning Model (LLM), specifically its Japanese variant, to enrich datasets for the automated scoring of mathematical self-explanations. We rigorously evaluated the quality of self-explanations across five datasets, ranging from human-evaluated originals to ones devoid of original content. Our results show that combining LLM-based explanations with mathematical material significantly improves the model's accuracy. Interestingly, there's an optimal limit to how much synthetic self-explanation data can bene-fit the system. Exceeding this limit doesn't further improve outcomes. This study thus highlights the need for careful consideration when integrating synthetic data into solutions, especially within the mathematics discipline.
Keywords:
Self-explanation
; Automated scoring
; Semi-supervised learning
; Language Learning Model (LLM)
; Data augmentation
1. Introduction
The emergence of digital learning platforms has opened a plethora of opportunities for researchers to investigate and comprehend learning behaviors through abundant system interaction data [1]. A notable area of interest among various learning facets is self-explanation, identified as a robust active learning technique. This strategy has been particularly effective in bolstering comprehension in subjects like mathematics [1,2,3]. Self-explanation can be described as a mechanism where learners articulate explanations, elucidate concepts, expand on methods, and immerse in problem-solving to enhance their grasp and absorb fresh insights [4,5].
With the proliferation of computer-driven learning platforms, self-explanation has gained renewed attention and application. Contemporary learning innovations place a premium on self-explanation by crafting intuitive interfaces, creating assessment models rooted in self-explanation behaviors, and formulating tactics to extract profound self-explanations [6,7]. Tools like the one formulated by Crippen and Earl [8] highlight the centrality of self-explanation in methodical problem-solving. Ongoing studies persistently explore the versatile applications of self-explanation in education [9,10], like the adoption of template-driven self-explanations. Such templates equip learners with pre-set frameworks, serving as built-in guides to bolster their explanation processes [1,11,12].
Furthermore, the domain of self-explanation practices reaches beyond traditional boundaries. These methods involve understanding a concept and facilitating multiple educational tools such as feedback systems, crafting practice quiz responses, and generating valuable datasets for automated evaluations [10]. Within this framework, automated assessments play a pivotal role. By analyzing and interpreting self-explanations, both educators and automated systems can delve deeper into the intricacies of a learner's thought patterns. This knowledge equips them with the capability to tailor educational strategies to better cater to individual needs. Such insights are crucial for tasks like classifying learner responses, which provide a clear view of their comprehension levels. Additionally, they allow for the easy detection of recurring mistakes or topics that consistently stump students [9,10].
However, devising a system capable of automatically grading diverse styles of self-explanation is challenging. A major concern is that self-explanation, due to its time-intensive nature [13], poses a feasibility issue for mass data collection. Additionally, crafting a quality self-explanation requires proficiency in both the specific subject matter and general writing [14,15]. Given these challenges, amassing a vast and diverse collection of self-explanation samples is demanding. This predicament further complicates the development of systems designed to aid learning through extensive sets of self-explanation examples.
To address these challenges and enhance automated scoring of self-explanations, we propose a semi-supervised approach that leverages the LLM. While popular LLMs such as OpenAI's GPT-3 [18] are commonly employed in English language settings, due to the nature of the target problem we specifically focus on the Japanese variant of the model developed by CyberAgent [16], based on GPT-NeoX [17]. This approach aims to explore the model's potential for generating self-explanation sentences, which will serve as the foundation for our regression models designed to predict self-explanation scores. By incorporating the semi-supervised methodology and leveraging advanced language models, we aim to improve the accuracy and effectiveness of auto-scoring in the self-explanation learning domain. Our research is anchored by two pivotal questions:
RQ1: To what extent can the integration of self-explanations generated by the LLM Japanese model and mathematical material be used to enhance the accuracy of the predictive regression model for self-explanation scores?
RQ2: What is the optimal quantity of artificially generated pseudo-self-explanation data required to effectively improve the predictive performance of the model?
These research questions provide insights into maximizing the utility of the LLM Japanese model and refining data augmentation techniques. The core findings from our research are twofold. First, we propose a strategy for advancing automated scoring in math education by synergizing LLM-generated content and mathematical material. Second, we highlight the ideal quantity of artificial self-explanation data for peak predictive accuracy.
2. Related Work
2.1. Automated Scoring of Self-Explanations: The Imperative for Rich Data
Self-explanation, widely recognized for amplifying learning outcomes in various fields, notably mathematics, has found its stride in the digital learning milieu [1,4,5]. Emblematic tools like the iSTART tutoring system have been devised to foster and elevate learners' grasp and performance [19]. Such platforms urge students to think critically, mirroring the analytical strategies of experts. Notably, the iSTART system utilizes Natural Language Processing (NLP) in its pioneering approach to gauge and rate self-explanations, bolstering understanding across a gamut of texts.
The endeavor to automate the scoring of self-explanation quality has seen the integration of NLP tools and cutting-edge neural network architectures [20]. Techniques like Latent Semantic Analysis (LSA) and Recurrent Neural Network (RNN) interfaced with machine learning, underscore the capabilities of automated systems, often outshining traditional manual evaluation in both effectiveness and efficiency [14,20,21,22,23,24]. Furthermore, semi-supervised learning techniques, which capitalize on abundant unlabeled data, have exhibited the potential in refining scoring accuracy [25]. Yet, the quest for more representative samples of self-explanations, especially in languages other than English, remains a prevailing challenge.
2.2. Augmenting Mathematical Self -Explanations Using Large Language Models
There is a growing interest and need in using synthetic data for various applications. Synthetic data has emerged in various domains, presenting dual benefits: expanding the scope of training data and ensuring data privacy [26,27,28,29]. El Emam [30] highlighted the virtues of synthetic data, paving the way for integrating LLMs. Although there's an abundance of generic synthetic data tools and those crafted for spatiotemporal data [31,32], their effectiveness often dwindles when faced with complex, domain-centric data architectures. In learning analytics, the application of synthetic data often stumbles, particularly in the prediction of student outcomes [33,34,35]. LLMs, in light of their recent advancements, are gaining recognition as powerful agents for text data augmentation. This is exemplified by Dai et al.'s AugLLM [36], which utilizes ChatLLM [18] to generate supplemental text entries, enriching the dataset. There's a noticeable uptick in research delving into the nexus between LLMs and mathematical material [37].
However, Accurate auto-scoring of self-explanations in mathematical education is challenging due to the time-intensive creation of quality explanations and the contrast between available data and the need of robust scoring models [13,14,24]. To address the data gap in auto-scoring self-explanations for mathematical education, our study introduces a semi-supervised learning method, drawing from the Japanese LLM version. By merging unlabeled data from both the LLM and mathematical material datasets, we aim to enhance the accuracy of automated assessments. Our focus is uniquely on mathematics education, utilizing the Japanese LLM, which is fine-tuned for the intricacies of the Japanese language and math-related challenges.
3. Problem Setting: The Learning Task
In this chapter, we primarily introduce the original human-labeled data, which serves as a foundation for the subsequent pseudo-labeling of the unlabeled samples, thereby bolstering the training process. Prior to delving into methodological details, it is pivotal to define the distinct learning task under examination, which underpins our methodological foundation.
3.1. Collecting Self-Explanations
Self-explanations from learners are gathered via online platforms, as represented in Figure 1. The scope of this approach includes diverse mathematical challenges or quizzes that require written elaboration. We utilized the LEAF platform [38], composed of BookRoll (a digital reading application), and LAViEW (a tool for learning analytics), enabling students and teachers to monitor and reflect on their educational progress. This platform, having been successfully implemented in a Japanese secondary school for several years, captures handwritten responses in vector form, portraying the precise coordinates and velocity of each pen stroke.
The learners interacted with the quiz and recorded their answers using a tablet computer, employing a stylus for handwriting. As shown in Figure 1, the handwritten answer playback and self-explanation input process require students to input an explanation sentence after completing a step of their answer during playback.
3.2. Assessment of Self-Explanation Quality
Self-explanations in our study were assessed based on three main criteria: coherence, clarity, and relevance. Specifically, 'coherence' gauges the logical flow of the explanation, 'clarity' measures its understandability, and 'relevance' ensures the inclusion of all pertinent knowledge concepts and procedural elements. For consistent evaluation, we adapted the rubric and scoring definitions from Nakamoto et al. [10], as depicted in Table 1 and Table 2, which are well-suited for tasks with varied solutions or strategies [39]. Instead of a detailed sentence-by-sentence breakdown, our approach evaluates explanations on a holistic, quiz-by-quiz basis, offering a comprehensive insight into the learner's understanding of the topic.
For the evaluation process, two independent evaluators employed these rubrics to rate the collected 2,205 self-explanations, scoring them on a scale ranging from 1 to 5. A quadratic weighted Cohen's kappa coefficient [40] of 0.749 between the evaluators indicated a significant level of agreement. The subsequent analysis used the mean score derived from both evaluators, which categorized the self-explanation scores for a roughly uniform distribution. Descriptive statistics of the collected self-explanations are presented in Table 3.
In anticipation of the machine learning methodologies outlined in the subsequent chapters, our dataset was segmented into three distinct categories. The Train dataset, which incorporates 1,420 self-explanations, forms the fundamental basis for both training our models and for LLM data augmentation. Meanwhile, the Valid dataset, comprising 355 self-explanations, is earmarked for the crucial tasks of fine-tuning our models' parameters. It also plays a significant role in the evaluation of model accuracy and in ensuring model robustness. Lastly, the Test dataset, which consists of 431 self-explanations, is designated to provide an measure of the performance of our finalized models.
3.3. The Text Regression Model Description
Inspired from the work of Wang et al. [41], we employ BERT [42] and a pre-trained BERT Japanese model [43] as the backbone for our regression models, which are intended to predict the quality scores of self-explanations. Wang et al.'s methodology of injecting rubrics into the system influenced the architecture of our model, making it specifically attuned to the grading of short responses. BERT's deep learning model, grounded on a transformer architecture, has been recognized for surpassing most preceding models in diverse natural language processing tasks [44]. Given its robust performance and compatibility with the Japanese language, BERT is an ideal choice for our study. Our model takes as input the preprocessed self-explanation text and the corresponding quiz title (Figure 2) and yields as output the predicted quality score for each self-explanation.
4. The Proposed Method
4.1. Overview or Pseudo Labeling
In this section, we delve into our proposed method, building on the foundation laid out in Section 3. Our approach, illustrated in Figure 3, seamlessly blends human-labeled mathematical text data described in Section 3 and LLM-generated data to enhance our machine learning model. Drawing from Cascante-Bonilla's semi-supervised framework [25], we utilize pseudo-labeling as our primary technique. For human-labeled data, we lean on mathematical self-explanations, while the LLM and mathematical content texts help in producing pseudo-labeled samples to complement them. We gathered over 1,420 self-explanation samples for training model from undergraduate math students, which were further utilized in the Japanese LLM (Step 1). Figure 3 provides a comprehensive visual overview of this pseudo-training mechanism and its integrated phases.
The pseudo-labeling technique commences with the training of an initial model using the labeled dataset (Step 2). This model then assigns labels to the unlabeled data, producing what we term as "pseudo" labels (Step 3). These newly-formed pseudo labels are then amalgamated with the original labeled dataset, initiating a cycle of continuous model enhancement (Steps 4-5). As the model's predictive prowess escalates, the caliber of the pseudo labels also elevates.
4.2. Pseudo-Labeling Training Algorithm: Dataset Categorization, Function Definitions, and Model Learning
The former grounds our machine learning training, while the pseudo-labeled versions of the latter augment it. Our methodology, illustrated in Figure 3, fuses human and pseudo-labeled samples, creating a mathematically relevant dataset. In this pseudo-labeling training algorithm, we are working with different types of datasets and functions, defined as follows:
- (1)
- Dataset Categorization:
Hereafter represents an unlabeled dataset pertaining to a particular , and does a labeled dataset of the same category as . is the composite dataset given to the model for training and evaluation, which includes the labeled training set , test dataset , and the generated unlabeled sample dataset .
- (2)
- Function Definitions:
- : A function that takes a set of parameters, denoted by , and a labeled dataset to yield a learned model .
- : A function that accepts a model and a non-labeled test dataset , subsequently outputting a labeled test dataset .
- : A function that takes in a dataset and a numerical value where ( refers to the total number of data points in dataset ), outputting a selected subset .
- (3)
- Model Learning and Final Test:
The model learning procedure follows an iterative process. Initially, the model is trained using and the labeled training dataset . In each subsequent timestep, a new model is developed with an updated training set, comprising the original labeled dataset and a selected subset of the pseudo-labeled . After the model learning process has been iterated times, the final model is evaluated on the original test dataset to output the pseudo-labeled test dataset . This dataset, enriched with pseudo labels, serves as a vital resource for subsequent analyses and performance evaluations.
- (4)
- Parameter Setting in Our Study:
Figure 4 provides a comprehensive outline of our experimental approach. Our dataset consists of both human-annotated and unlabeled samples. For the training process, we amassed 2,205 self-explanation samples from student contributors. In our setting, stands for a model built using logistic regression with text representation acquired from BERT, a state-of-the-art transformer-based model renowned for its superior performance on numerous NLP tasks. The iterative process continues for 3 timesteps, in other words, is set to 3. The selection size at each timestep , denoted by , varies as follows: is equal to the total number of data points in , such as: ), whereas for the second time step could be any one of the following: 128, 256, 512, 1024, 2048, or 4096. To distinguish them, we defined the th model, which is the same as in formulae 3-2, that was learning with selected training data as . The following formula represents the concrete model learning method in the study:
4.3. Pseudo Data Preparation: LLM Usage and Mathematical Material
We employed a pseudo-labeling technique to enrich our dataset, sourcing additional self-explanation data via the Japanese LLM and mathematical material.
Given alternatives such as OpenAI's GPT-3 [18], our preference leaned towards CyberAgent's LLM [16] due to its open-source availability and its adeptness in the Japanese language, perfectly complementing our dataset. To gather data, the LLM tackled mathematical contexts and formulated pertinent explanations. Our methodology was as follows:
- Random Data Selection: We began our process by randomly selecting 30% from our human-labeled training dataset to capitalize on the rich diversity of student-generated self-explanations.
- Keyword Extraction: Ten keywords were extracted from each self-explanation, encapsulating its essence, guiding LLM to produce contextually relevant data.
- LLM Generation: LLM Generation: Armed with the extracted keywords, we then proceeded to prompt the LLM [45]. Specifically, each set of 10 keywords was used as seed input, directing the LLM to generate contextually coherent pseudo-self-explanation data. The model was given a directive to "elaborate based on the provided keywords," ensuring the generated content-maintained relevance to the original self-explanation context.
Approximately 19,000 entries were generated, with a random subset of 4,096 used for experiments. This combination of pseudo and human-labeled data broadened our training set, enhancing the automated scoring system's performance without compromising quality.
We also leveraged the Math Quiz Texts dataset, populated with standard mathematical solutions. Its rich mathematical material and contextual problem-solving methods made it invaluable for generating mathematical self-explanations.
4.4. Comparative Analysis of Original and LLM-Generated Dataset
In Table 4 and Figure 5, a detailed comparative analysis between the original and the synthetically generated datasets is elucidated. Upon examination, it becomes evident that the augmented datasets exhibit a modest augmentation in their average quality metrics relative to the foundational dataset.

Table 4.
Comparative Metrics for Original and Generated Datasets.
| Data type | Counts | Mean Score | Std |
|---|---|---|---|
| Original | 2,205 | 2.91 | 1.33 |
| LLM | 4,096 | 3.39 | 1.44 |
| Math | 4,096 | 3.87 | 1.77 |
Table 6.
LLM Generated Samples.
| LLM Generated Texts (Original) | LLM Generated Texts (English Translated) | Predicted Self-Explanation Score |
|---|---|---|
| その後、α+β=-a-2とαβ=2aの関係から解と係数の関係が分かる。次に、問題で言及されたαとβを用いて式を展開し整理し、右辺を0にする。さらに式を工夫して代入が可能な形にする。そして、関係式α+β=-a-2とαβ=2aを式に代入して簡略化し、a^2+a-6=0となる。これを因数分解してaの解を求めると、a=-3とa=2が得られる。その後、a=2を代入すると解が重解になり、解が一つしかなくなるため問題に合わない。したがって、正しい答えはa=-3である。その後、重積算や累乗などいろいろな計算が解に出てきて混乱するだろうから丁寧に説明していく。 | After that, α+β=-a-2 and αβ=2a can be understood from the relationship between the solutions and coefficients. Next, expand and organize the expressions using the α and β mentioned in the problem, and set the right side to 0. Further manipulate the equation to get it into a form that allows for substitution. Then, substitute the relationship α+β=-a-2 and αβ=2a into the equation and simplify it, resulting in a2+a-6=0. Factorize this to find the solutions for a, which are a=-3 and a=2. Afterward, when a=2 is substituted, the answer becomes a repeated root, which means there is only one solution, making it inconsistent with the problem. Therefore, the correct answer is a=-3. Afterward, various calculations such as product of roots and exponentiation may appear in the solution, and it may be confusing, so I will explain it carefully. | 5.00 |
| 代入してみたら、平方根の中が計算できた。αとβを求めた。αに-2を代入した。解を吟味して、答えは-3だった。その後、a=-4.7x^5+7として計算したが誤差があった。そこで右側の5を左側の4に変形すると正しい値が求められた(ただし小数点以下を切り捨て)。この問題は高校数学の範囲外であるが、中学・高校で習った知識で解くことができたので紹介したい。 | Substituted it into the formula for solutions. Calculated the value inside the square root. Found α and β. Substituted α=-2. Examined the solution, and the answer was -3. Afterward, calculated it as a=-4.7x^5+7, but there was an error. So I rearranged the 5 on the right side to 4, and the correct value was obtained (with the decimal part truncated). This problem is beyond the scope of high school mathematics, but it could be solved using knowledge learned in middle and high school, so I want to introduce it. | 4.08 |
| グラフを書いた傾きがー4のy=x^2の接線を求めた。その後、接点を原点とし両辺に点a,bを代入すると「sin-cos」と出たので、「COS(1)」で求めた。これで式の意味が分かったと思う。-5は角度が変化しないからゼロでないといけないのだ! | Used the slope obtained from graphing to find the tangent of y=x^2 with slope -4. Took the point of tangency as the origin and substituted points a and b on both sides. 'Sin-cos' was obtained, so I calculated it using 'COS(1)'. I think I understood the meaning of the equation now. -5 does not change the angle, so it must be nonzero! | 3.02 |
| x=3を代入する。方程式を解き進める。解の吟味を書く。間違いに気づき、修正する。最終的な答えを書く。その後、再帰的に解く。 | Substituted x=3. Proceeded to solve the equation. Wrote the examination of the solutions. Noticed the mistake and corrected it. Wrote the final answer. Afterward, solve it recursively. | 2.18 |
| 前のは間違えたため、全部消した。その後、通分してみた。 | Since the previous one was incorrect, I deleted everything and then performed the common denominator. Afterwards, something like this. | 1.23 |
Table 7.
Math Texts samples.
| Math Texts | Predicted Self-Explanation Score |
|---|---|
| Angle bisector and ratio, using Ceva's theorem: Revised version Succeed Math A problem 349 △, let △ have the angle bisector of ∠ and the point where it intersects the side , and the point that divides the side in the ratio : . When the line intersects at point , find the length of the side . | 5.00 |
| Using Menelaus's theorem: Segment ratio and area ratio, Revised version Succeed Math A problem 350 △, let be the point where it divides the side in the ratio : , and the point where the segment is divided in the ratio : , and the point where the extension of the segment intersects the side . Find the following segment ratios and area ratios: : : △ : △ : : : | 4.93 |
| Using the relationship between sides and angles: Range of values for side length in a triangle, Revised version Succeed Math A problem 355, determine the range of values for so that a triangle with the following side lengths exists: , , , . | 3.84 |
| Using the relationship between the sizes of three sides: Proving inequalities related to segment lengths, Revised version Succeed Math A important example 66, take point inside △, and join , , and . Prove that . Abbreviated. | 3.13 |
| Examining the sizes of the three angles of a triangle, Revised version Succeed Math A important example 64, examine the sizes of the three interior angles of △ . | 2.66 |
5. Experiments and Evaluations
5.1. Exploring the Influence of Self-Explanation Augmentation on Model Efficiency
We embarked on an exploration to discern the influence of self-explanation augmentation on the efficiency of an automated self-explanation scoring model across diverse datasets. We used the Mean Absolute Error (MAE) metrics [46,47] to evaluate model performance, giving insights into the extent of error deviation and the efficacy for individual items. Table 8 and Table 9 lay out the results of our experiments, contrasting performance across different dataset permutations. When we introduced augmented datasets into the mix, distinct variations in performance emerged.
Remarkably, our model, when nurtured with a blend of the 'math' and 'original dataset', consistently delivered the most desirable MAE results. This underlines its superior predictive precision in assessing self-explanation quality. Such results lend credence to the efficacy of the model when trained with this specific data amalgamation. On another note, the 'mixed' model – which weaves together human-graded samples, LLM-crafted pseudo-sentences, and mathematical content – also demonstrated notable improvements. This outcome underscores the model's robustness and flexibility when fed with diverse data sources. Yet, the model named 'only_LLM_math', which exclusively depended on LLM-created sentences, trailed behind the foundational model in terms of performance. This observation underscores the criticality of harmonizing human-judged and machine-produced data to achieve optimal results.
5.2. Evaluating Optimal Quantity of Pseudo-Self-Explanation Data
Table 10 and Table 11 shed lights on determining the optimal quantity of pseudo-self-explanation data that improves model performance most effectively. The 'baseline' row signifies the MAE when the model is trained only on the original dataset, devoid of any pseudo-self-explanation data. Each subsequent row shows the MAE when the model is trained with an increasing volume of pseudo-self-explanation data, ranging from 128 to 4,096 datasets.
Upon examining the 'LLM' model, we note an enhancement in performance when the added datasets increase from 128 to 256. Beyond this, further addition of generated data does not significantly reduce the MAE, suggesting an optimal balance between data augmentation and model efficacy with an addition of 256 datasets. The 'math' model displays a similar trend, with the lowest MAE achieved when 1,024 datasets are added. Beyond this point, no substantial performance enhancement is observed with extra data.
For the 'mixed' model, we see a consistent improvement in performance with increased data, but this plateaus beyond 2,048 datasets, where the MAE slightly increases. Conversely, the 'only_LLM_math' model shows erratic trends. Its performance varies noticeably with the quantity of added data and consistently exceeds the baseline model's MAE, regardless of the added data volume. This reveals potential difficulties when exclusively relying on generated pseudo-self-explanation data.
Figure 6.
Test MAE plot.
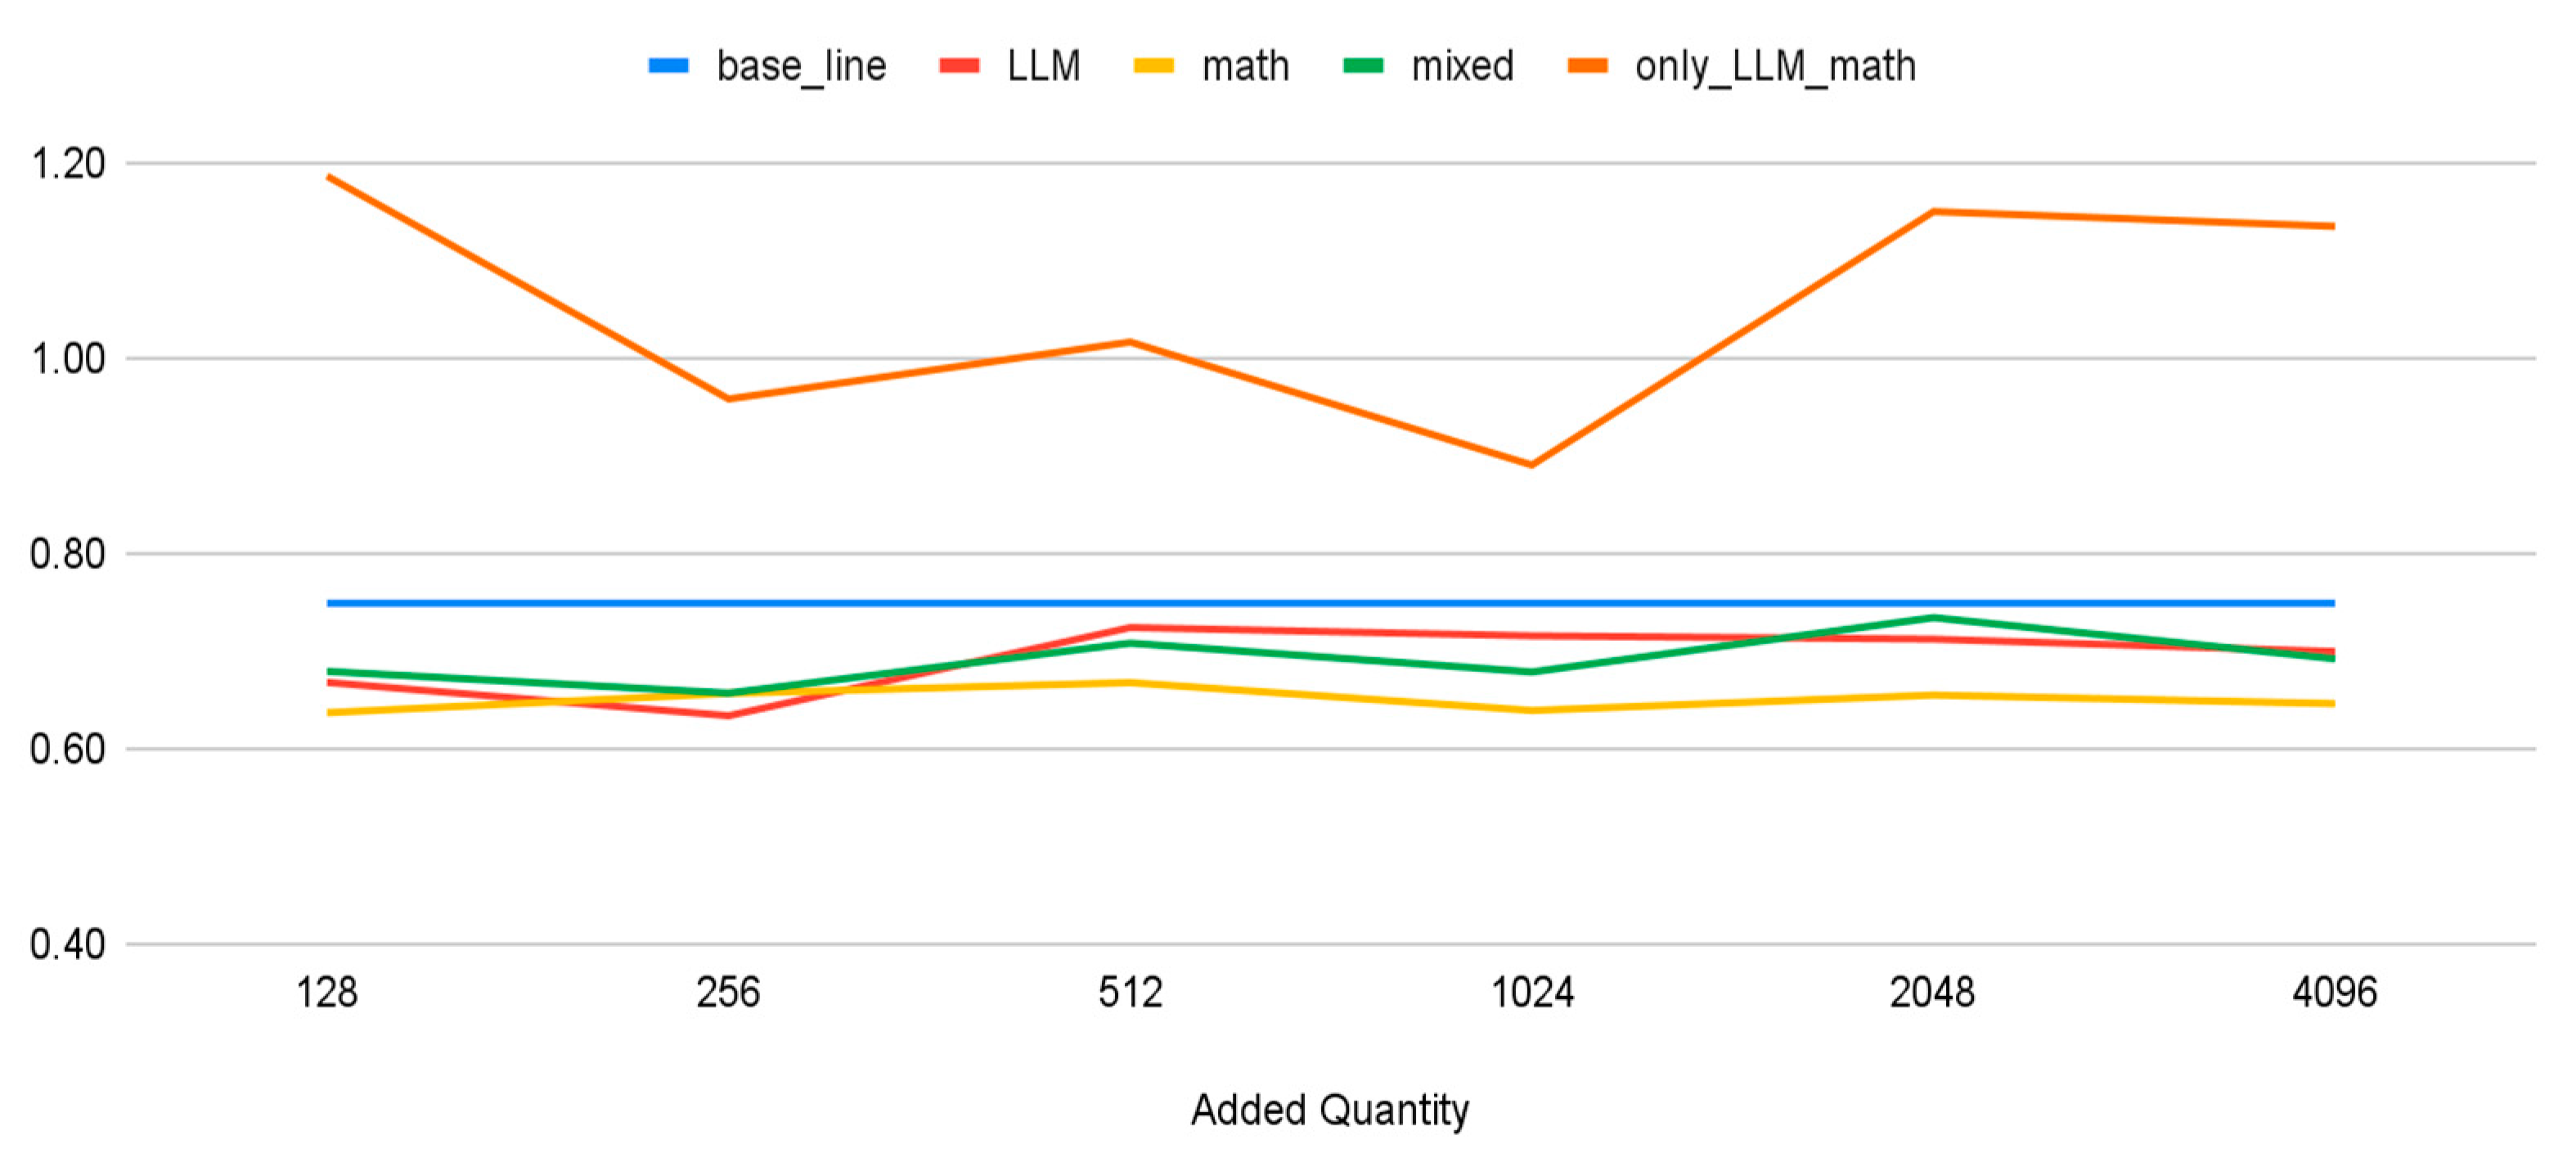
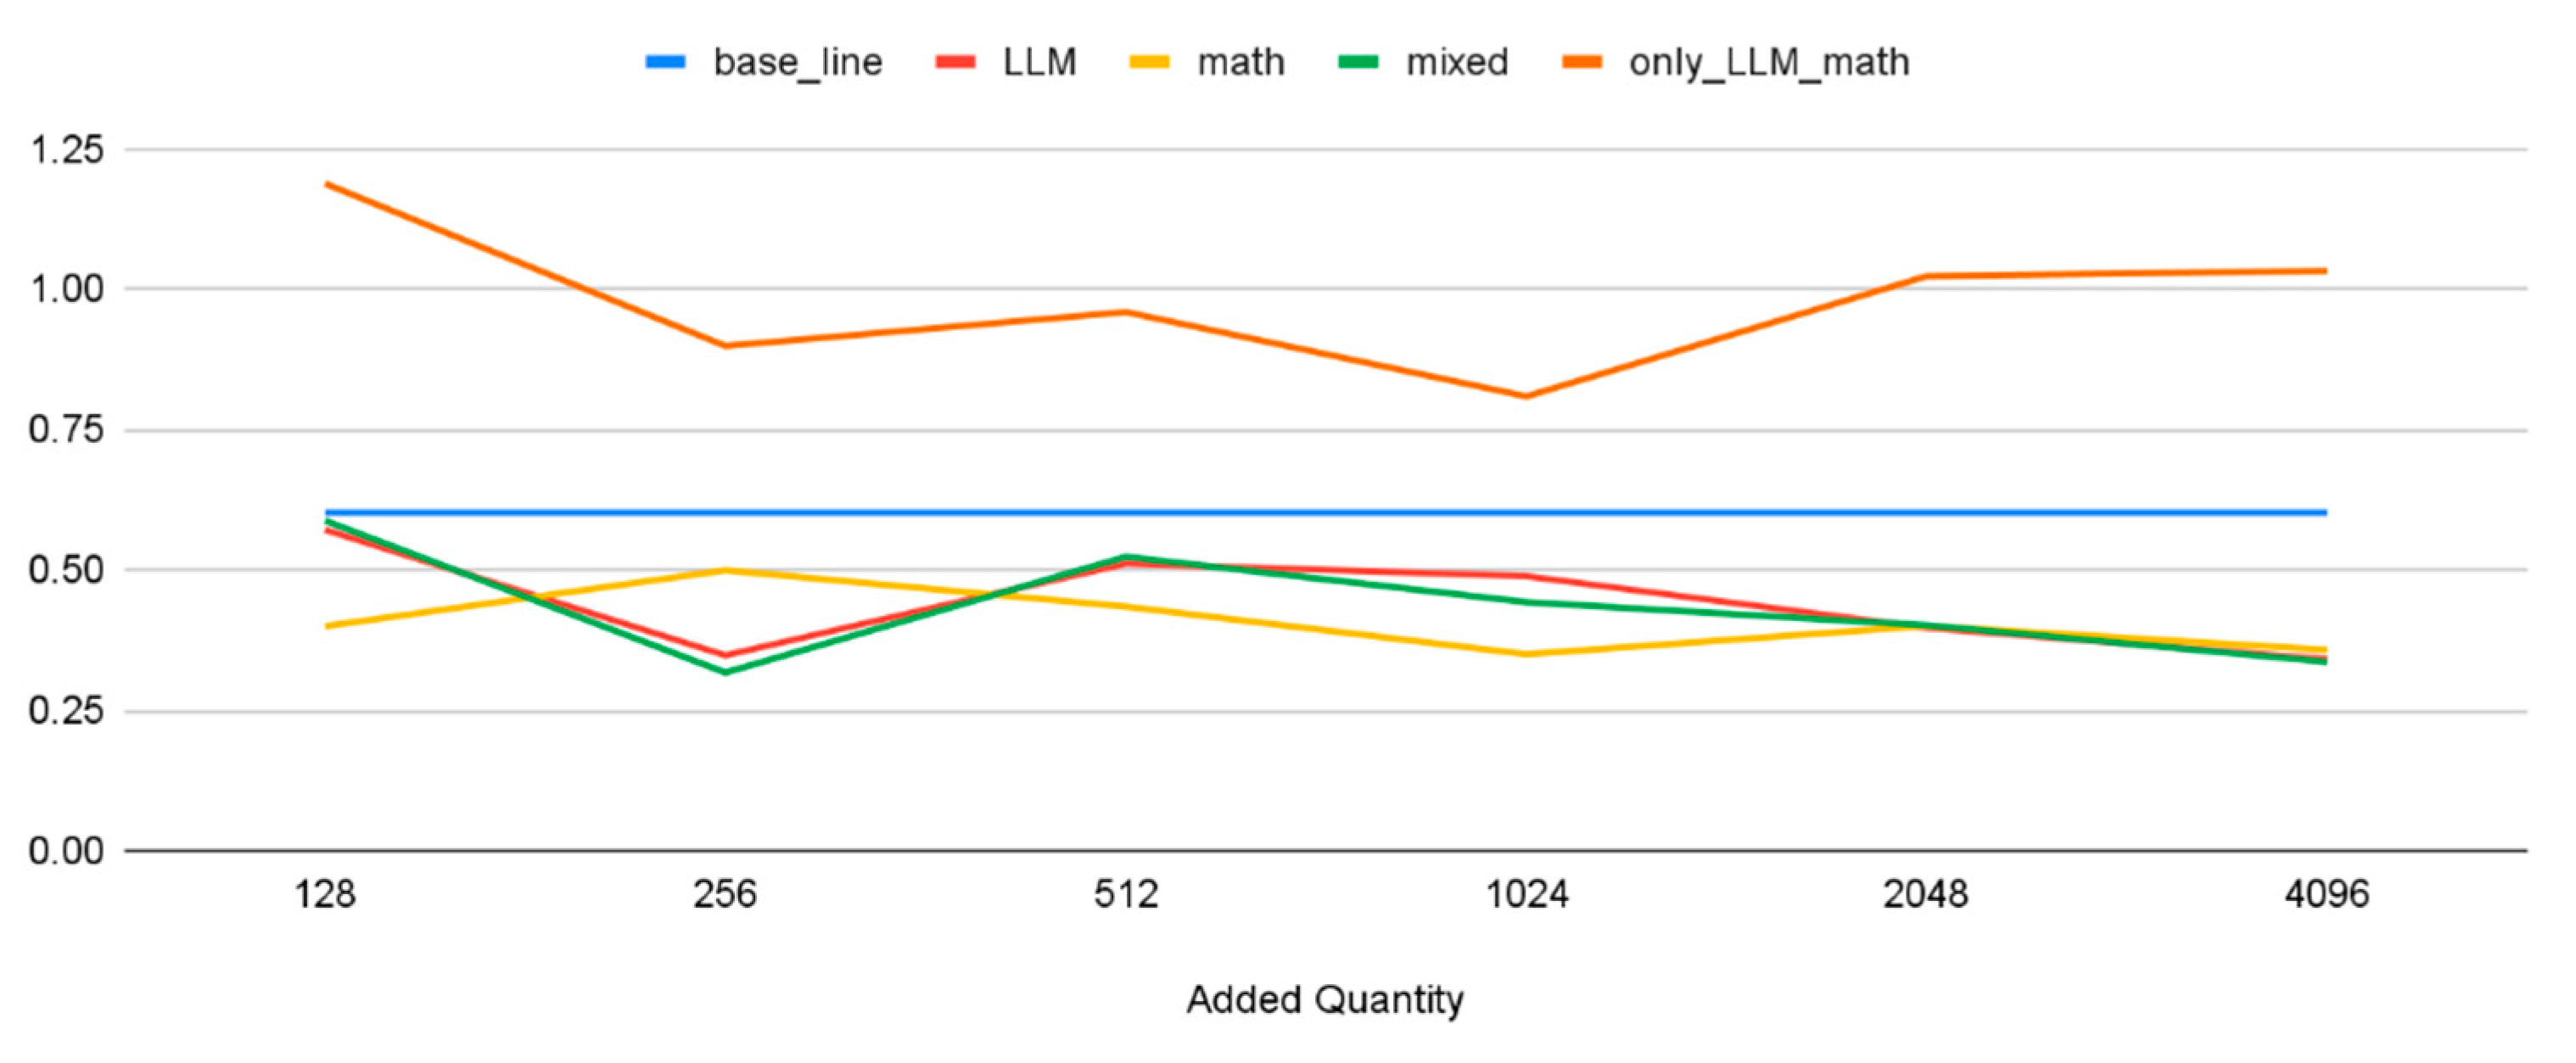
Figure 7.
Validation MAE Plot.
6. Discussion
6.1. Detailed Analysis of Results (RQ1)
Regarding Research Question 1, an in-depth analysis of the results displayed in Table 8 reveals several noteworthy observations regarding the influence of self-explanation augmentation on the model's performance. In the test category, we observe an improvement in the model's performance when transitioning from the baseline to the LLM and math models. Notably, the math model achieves the lowest MAE at 0.646 , which aligns with Dai et al. [36] 's proposition that data augmentation at the semantic level improves robustness and consistency. However, the performance slightly deteriorates in the mixed model and substantially plummets in the 'Only LLM Math' model. This suggests that an excessive concentration of LLM-generated self-explanations could impair the model's predictive proficiency.
A similar pattern emerges when examining individual topics within the 'Test' category. For instance, the model delivers optimal performance for 'Quadratic Equations' with the LLM-generated model, but the performance markedly deteriorates when solely relying on LLM-generated self-explanations. The validation category follows a similar trajectory, with the LLM, math, and mixed models outshining the baseline model. Once again, the mixed model achieves the smallest error. However, the 'Only LLM Math' model experiences a decline in performance, further highlighting the advantages of using a diverse dataset that encompasses both human-evaluated and machine-generated explanations.
6.2. Findings and Observations (RQ2)
Regarding Research Question 2, the results presented in Table 5 provide valuable insights into determining the optimal quantity of generated pseudo-self-explanation data that can enhance the model's performance. For the 'LLM' model, an initial improvement in model performance is observed as the number of added datasets increases from 128 to 256. Beyond this point, further augmentation of the generated data does not lead to a significant reduction in MAE, suggesting that adding 256 datasets strikes an optimal balance between data augmentation and model performance.
The 'math' model exhibits a similar pattern, with the lowest MAE observed when 1,024 datasets are added, and no significant performance improvements resulting from further data augmentation. The 'mixed' model, on the other hand, shows a general trend of performance enhancement with increased data augmentation, up to a threshold of 2,048 datasets, beyond which the MAE slightly increases.
In contrast, the 'only_LLM_math' model does not present a consistent trend. Its performance fluctuates significantly as the volume of added data increases, and its MAE consistently surpasses that of the baseline model, regardless of the amount of added data. This underscores the challenges of solely leveraging generated pseudo-self-explanation data for augmentation, particularly when the model might lack domain-specific expertise, echoing concerns raised by Dai et al.[36].
In conclusion, while data augmentation with generated pseudo-self-explanation data can enhance model performance, our study suggests that there is a limit beyond which additional data does not lead to further performance improvements. This limit appears to vary depending on the specifics of the model and the nature of the generated data. These findings underscore the need for careful, context-dependent optimization when applying data augmentation strategies in the development of self-explanation auto-scoring models.
6.3. Limitations and Future Research
In our research, several limitations of our study should be highlighted.
- Subject Scope: Our dataset is restricted to mathematics, potentially constraining the generalizability of our findings to other subjects.
- Dependency on LLM: Our methodology hinges on the LLM's ability to generate pseudo-self-explanation data. This dependence may introduce noise and errors into our system.
- Data Quality and Representativeness: The performance of our approach is contingent on the quality and representativeness of labeled data. Poor or biased data could compromise model efficacy.
- Model Performance Variability: We identified noticeable disparities in our model's performance across various mathematical categories. For instance, it predicted 'Property of a Circle' (0.242) more accurately than 'Quadratic Functions' (0.419) within the validation datasets. These results indicate that self-explanation augmentation's effectiveness may be influenced by the inherent complexity of a topic and the linguistic nuances present within the self-explanations.
- Evaluation Dataset Categories and Size: The evaluation dataset for some categories is comparatively small, which poses challenges in drawing definitive conclusions. It's essential to consider the ease of inference as it pertains to various mathematical concepts, including linear functions, shapes, equations, and square roots. Certain subjects may be inherently more challenging for machine training due to their linguistic or conceptual intricacies.
In-depth research is paramount to address these limitations, we should study how complex topics and language use in self-explanations relate. It's also important to reduce errors from machine-made data, ensure our data is good quality, and find the best ways to improve our data for different situations. By doing this, we can make our learning method for scoring self-explanations much better and more reliable.
Author Contributions
Author Contributions: RN, BF, YT, YD, and HO contributed to the research conceptualization and methodology. Data collection was performed by RN. RN analyzed the data and wrote the manuscript. BF, YD, and HO provided comments to improve the manuscript. All authors read and approved the final manuscript.
Funding
Funding: This research was partly funded by JSPS Grant-in-Aid for Scientific Research (B) JP20H01722 and JP23H01001, (Exploratory) JP21K19824, (Early Career) JP23K17012, (A) JP23H00505, and NEDO JPNP20006.
Data Availability Statement
Data Availability Statement: The data of this study is not open to the public due to participant privacy.
Acknowledgments
Acknowledgments: We used LLM for the English proofreading of this paper and this fact has been explicitly mentioned for transparency. As this study involves the use of student data, we acknowledge the importance of obtaining approval from the Institutional Review Board (IRB). We have taken the necessary steps to ensure compliance with ethical guidelines, and the study has been submitted to and approved by the IRB. Consent for using the students' data in our research is obtained from their guardians at the beginning of each academic year. We provide detailed information about the purpose of data collection, how it will be used, and the measures taken to ensure confidentiality and privacy. The guardians have the right to decline consent or withdraw their consent at any time without any negative consequences for the students.
Conflicts of Interest
The funders had no role in the design of the study; in the collection, analyses, or interpretation of data; in the writing of the manuscript; or in the decision to publish the results.
References
- Rittle-Johnson, B., Loehr, A.M., & Durkin, K. (2017). Promoting self-explanation to improve mathematics learning: A meta-analysis and instructional design principles. ZDM, 49, 599-611. [CrossRef]
- Rittle-Johnson, B. (2017). Developing Mathematics Knowledge. Child Development Perspectives, 11, 184-190. [CrossRef]
- Renkl, A. (2017). Learning from worked-examples in mathematics: students relate procedures to principles. ZDM, 49, 571-584. [CrossRef]
- Chi, M.T., Leeuw, N.D., Chiu, M., & LaVancher, C. (1994). Eliciting Self-Explanations Improves Understanding. Cogn. Sci., 18, 439-477. [CrossRef]
- Rittle-Johnson, B. (2006). Promoting transfer: effects of self-explanation and direct instruction. Child development, 77 1, 1-15. [CrossRef]
- Conati, C., VanLehn, K. (2000). Toward Computer-Based Support of Meta-Cognitive Skills: a Computational Framework to Coach Self-Explanation.
- Bisra, K., Liu, Q., Nesbit, J.C., Salimi, F., & Winne, P.H. (2018). Inducing Self-Explanation: a Meta-Analysis. Educational Psychology Review, 30, 703-725. [CrossRef]
- Crippen, K.J., Earl, B.L. (2007). The impact of web-based worked examples and self-explanation on performance, problem solving, and self-efficacy. Comput. Educ., 49, 809-821. [CrossRef]
- Nakamoto, R., Flanagan, B., Takam K., Dai Y., Ogata, H., Identifying Students’ Stuck Points Using Self-Explanations and Pen Stroke Data in a Mathematics Quiz, ICCE 2021, 2021.11.22-26.
- Nakamoto, R., Flanagan, B., Dai, Y., Takami, K., & Ogata, H. (2024). Unsupervised techniques for generating a standard sample self-explanation answer with knowledge components in a math quiz. Research and Practice in Technology Enhanced Learning, 19, 016. [CrossRef]
- Berthold, K., Eysink, T.H., & Renkl, A. (2009). Assisting self-explanation prompts are more effective than open prompts when learning with multiple representations. Instructional Science, 37, 345-363. [CrossRef]
- Berthold, K., Renkl, A. (2009). Instructional Aids to Support a Conceptual Understanding of Multiple Representations. Journal of Educational Psychology, 101, 70-87. [CrossRef]
- McEldoon, K. L., Durkin, K. L., & Rittle-Johnson, B. (2013). Is self-explanation worth the time? A comparison to additional practice. British Journal of Educational Psychology, 83(4), 615-632. [CrossRef]
- Panaite, M., Dascalu, M., Johnson, A.M., Balyan, R., Dai, J., McNamara, D.S., & Trausan-Matu, S. (2018). Bring It on! Challenges Encountered While Building a Comprehensive Tutoring System Using ReaderBench. International Conference on Artificial Intelligence in Education. [CrossRef]
- Hodds, M., Alcock, L., & Inglis, M. (2014). Self-explanation training improves proof comprehension. Journal for Research in Mathematics Education, 45, 62-101. [CrossRef]
- CyberAgent. (2023). Open-Calm-7B [Software]. Hugging Face. https://huggingface.co/cyberagent/open-calm-7b.
- Andonian, A., Anthony, Q., Biderman, S., Black, S., Gali, P., Gao, L., Hallahan, E., Levy-Kramer, J., Leahy, C., Nestler, L., Parker, K., Pieler, M., Purohit, S., Songz, T., Wang, P., & Weinbach, S. (2021). GPT-NeoX: Large Scale Autoregressive Language Modeling in PyTorch (Version 0.0.1) [Computer software]. [CrossRef]
- Brown, T.B., Mann, B., Ryder, N., Subbiah, M., Kaplan, J., Dhariwal, P., Neelakantan, A., Shyam, P., Sastry, G., Askell, A., Agarwal, S., Herbert-Voss, A., Krueger, G., Henighan, T.J., Child, R., Ramesh, A., Ziegler, D.M., Wu, J., Winter, C., Hesse, C., Chen, M., Sigler, E., Litwin, M., Gray, S., Chess, B., Clark, J., Berner, C., McCandlish, S., Radford, A., Sutskever, I., & Amodei, D. (2020). Language Models are Few-Shot Learners. ArXiv, abs/2005.14165.
- McNamara, D.S., Levinstein, I.B., & Boonthum, C. (2004). iSTART: Interactive strategy training for active reading and thinking. Behavior Research Methods, Instruments, & Computers, 36, 222-233. [CrossRef]
- Funayama, H., Asazuma, Y., Matsubayashi, Y., Mizumoto, T., & Inui, K. (2023). Reducing the Cost: Cross-Prompt Pre-finetuning for Short Answer Scoring. International Conference on Artificial Intelligence in Education. [CrossRef]
- Crossley, S.A., Kim, M., Allen, L.K., & McNamara, D.S. (2019). Automated Summarization Evaluation (ASE) Using Natural Language Processing Tools. International Conference on Artificial Intelligence in Education. [CrossRef]
- Özsoy, M.G., Alpaslan, F.N., & Çiçekli, I. (2011). Text summarization using Latent Semantic Analysis. Journal of Information Science, 37, 405 - 417. [CrossRef]
- León, J.A., Olmos, R., Escudero, I., Cañas, J.J., & Salmerón, L. (2006). Assessing short summaries with human judgments procedure and latent semantic analysis in narrative and expository texts. Behavior Research Methods, 38, 616-627. [CrossRef]
- Panaite, M., Ruseti, S., Dascalu, M., Balyan, R., McNamara, D.S., & Trausan-Matu, S. (2019). Automated Scoring of Self-explanations Using Recurrent Neural Networks. European Conference on Technology Enhanced Learning. [CrossRef]
- Cascante-Bonilla, P., Tan, F., Qi, Y., & Ordonez, V. (2020). Curriculum Labeling: Revisiting Pseudo-Labeling for Semi-Supervised Learning. AAAI Conference on Artificial Intelligence. [CrossRef]
- D. B. Rubin(1993), Statistical disclosure limitation,Journal of official Statistics., vol. 9, no. 2, pp. 461–468, 1993.
- Antulov-Fantulin, N., Bosnjak, M., Zlatic, V., Grcar, M., & Šmuc, T. (2012). Synthetic Sequence Generator for Recommender Systems - Memory Biased Random Walk on a Sequence Multilayer Network. IFIP Working Conference on Database Semantics. [CrossRef]
- Jelic, B. , Grbić, R., Vranješ, M., & Mijić, D. (2021). Can we replace real-world with synthetic data in deep learning-based ADAS algorithm development? IEEE Consumer Electronics Magazine, 1-1.
- Chen, R.J., Lu, M.Y., Chen, T.Y., Williamson, D.F., & Mahmood, F. (2021). Synthetic data in machine learning for medicine and healthcare. Nature Biomedical Engineering, 5, 493 - 497. [CrossRef]
- El Emam, K. (2020). Seven Ways to Evaluate the Utility of Synthetic Data. IEEE Security & Privacy, 18, 56-59. [CrossRef]
- Ping, H., Stoyanovich, J., & Howe, B. (2017). DataSynthesizer: Privacy-Preserving Synthetic Datasets. Proceedings of the 29th International Conference on Scientific and Statistical Database Management.
- Dahmen, J., & Cook, D.J. (2019). SynSys: A Synthetic Data Generation System for Healthcare Applcations. Sensors (Basel, Switzerland), 19.
- Berg, A., Mol, S.T., Kismihók, G., & Sclater, N. (2016). The Role of a Reference Synthetic Data Generator within the Field of Learning Analytics. J. Learn. Anal., 3. [CrossRef]
- Peña-Ayala, A. (2018). Learning analytics: A glance of evolution, status, and trends according to a proposed taxonomy. Wiley Interdisciplinary Reviews: Data Mining and Knowledge Discovery, 8.
- Flanagan, B., Majumdar, R., & Ogata, H. (2022). Fine Grain Synthetic Educational Data: Challenges and Limitations of Collaborative Learning Analytics. IEEE Access, PP, 1-1. [CrossRef]
- Dai, H., Liu, Z., Liao, W., Huang, X., Cao, Y., Wu, Z., Zhao, L., Xu, S., Liu, W., Liu, N., Li, S., Zhu, D., Cai, H., Sun, L., Li, Q., Shen, D., Liu, T., & Li, X. (2023). AugGPT: Leveraging ChatGPT for Text Data Augmentation. arXiv preprint . arXiv:2302.13007.
- Lightman, H., Kosaraju, V., Burda, Y., Edwards, H., Baker, B., Lee, T., Leike, J., Schulman, J., Sutskever, I., & Cobbe, K. (2023). Let's Verify Step by Step. ArXiv, abs/2305.20050.
- Flanagan, B., & Ogata, H. (2018). Learning analytics platform in higher education in Japan. Knowledge Management & E-Learning: An International Journal.
- Thompson, D.R., & Senk, S.L. (1998). Using rubrics in high school mathematics courses. Mathematics Teacher: Learning and Teaching PK–12, 91, 786-793.
- Cohen, J. (1960). A Coefficient of Agreement for Nominal Scales. Educational and Psychological Measurement, 20, 37 - 46. [CrossRef]
- Wang, T., Inoue, N., Ouchi, H., Mizumoto, T., & Inui, K. (2019). Inject Rubrics into Short Answer Grading System. Conference on Empirical Methods in Natural Language Processing.
- Vaswani, A., Shazeer, N.M., Parmar, N., Uszkoreit, J., Jones, L., Gomez, A.N., Kaiser, L., & Polosukhin, I. (2017). Attention isAll you Need. NIPS.
- Suzuki, M. (2019). Pretrained Japanese BERT models, GitHub repository, https://github.com/cl-tohoku/bert-japanese.
- Devlin, J., Chang, M. W., Lee, K., & Toutanova, K. (2019). BERT: Pre-training of Deep Bidirectional Transformers for Language Understanding. In Proceedings of the 2019 Conference of the North American Chapter of the Association for Computational Linguistics: Human Language Technologies, Volume 1 (Long and Short Papers), pages 4171–4186, Minneapolis, Minnesota. Association for Computational Linguistics.
- Liu, P., Yuan, W., Fu, J., Jiang, Z., Hayashi, H., & Neubig, G. (2021). Pre-train, Prompt, and Predict: A Systematic Survey of Prompting Methods in Natural Language Processing. ACM Computing Surveys, 55, 1 - 35. [CrossRef]
- Chai, T., & Draxler, R.R. (2014). Root mean square error (RMSE) or mean absolute error (MAE)? – Arguments against avoiding RMSE in the literature. Geoscientific Model Development, 7, 1247-1250. [CrossRef]
- Hodson, T.O. (2022). Root-mean-square error (RMSE) or mean absolute error (MAE): when to use them or not. Geoscientific Model Development. [CrossRef]
Figure 1.
Handwritten answer review playback and self-explanation input user interface. The self-explanation of the answer section includes the following: If triangle ABO's area is 1, then triangle AOC's area is 4. Given that the total area is five and straight-line OP bisects the area of triangle ABC, the joint area of quadrilateral ABPO and triangle POC is 2/5. Hence, the area ratio of triangle APO to triangle POC is 3:5, leading to a length ratio of straight-line AP to straight-line PC of 3:5.
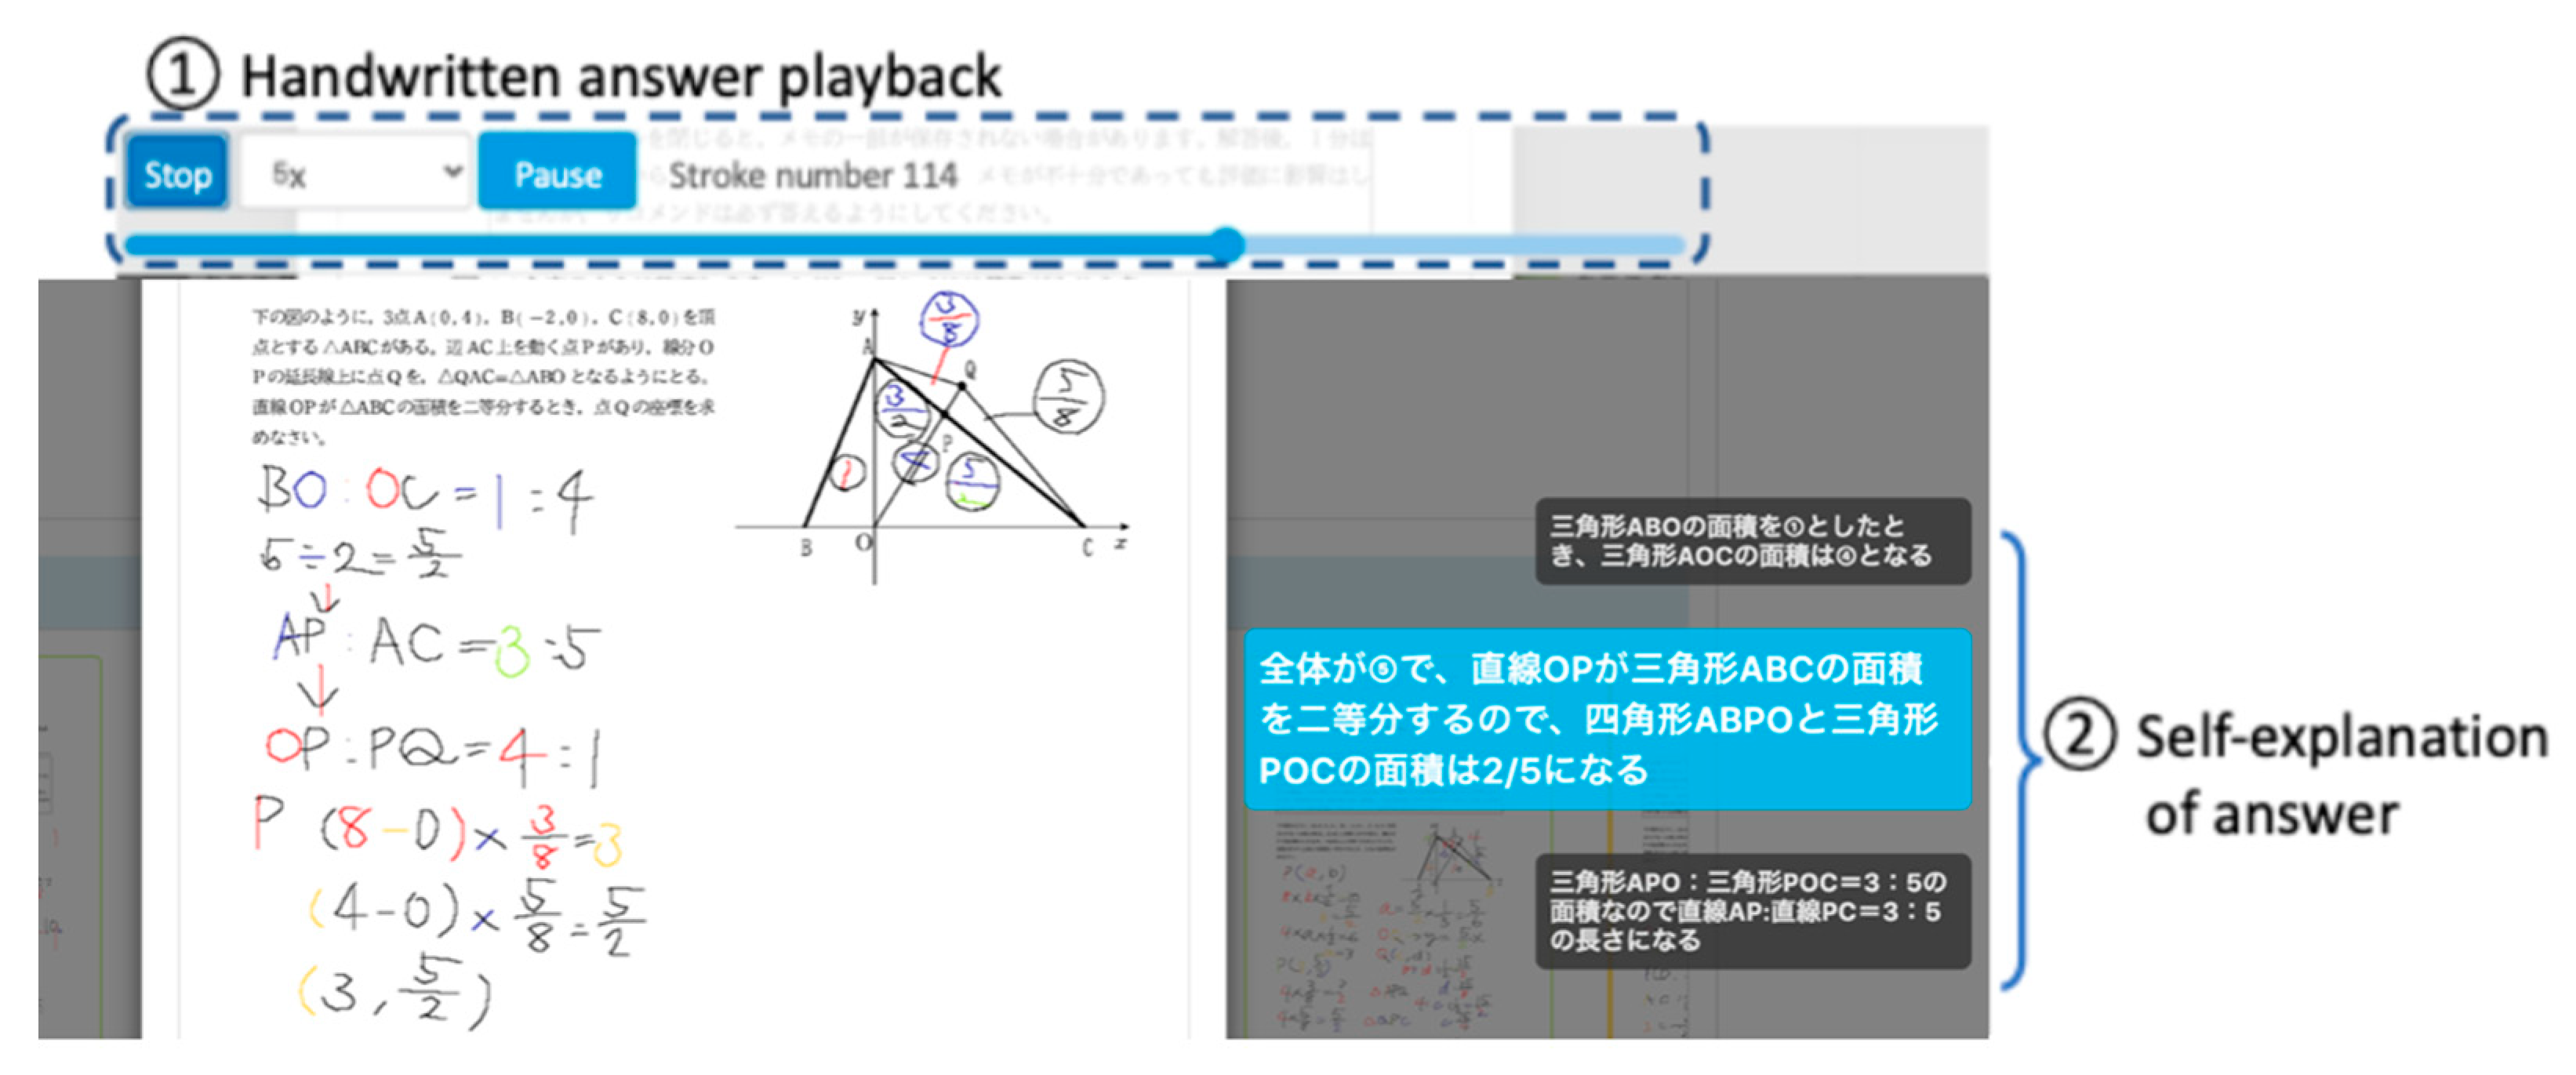
Figure 2.
Workflow for the BERT Regression Models.
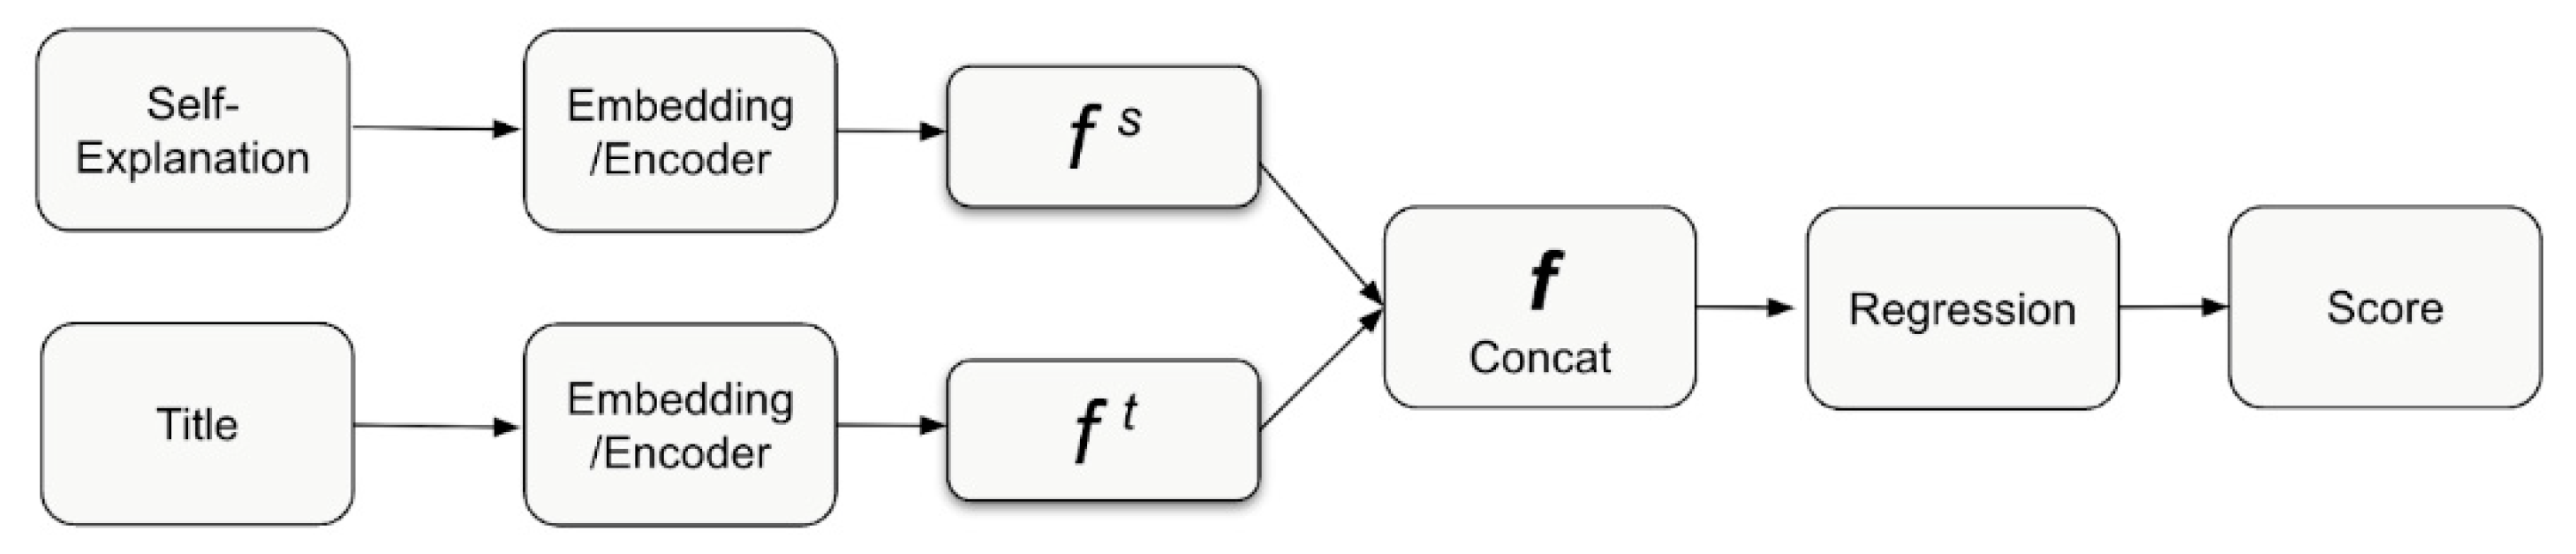
Figure 3.
The Overview of Pseudo Training Process.
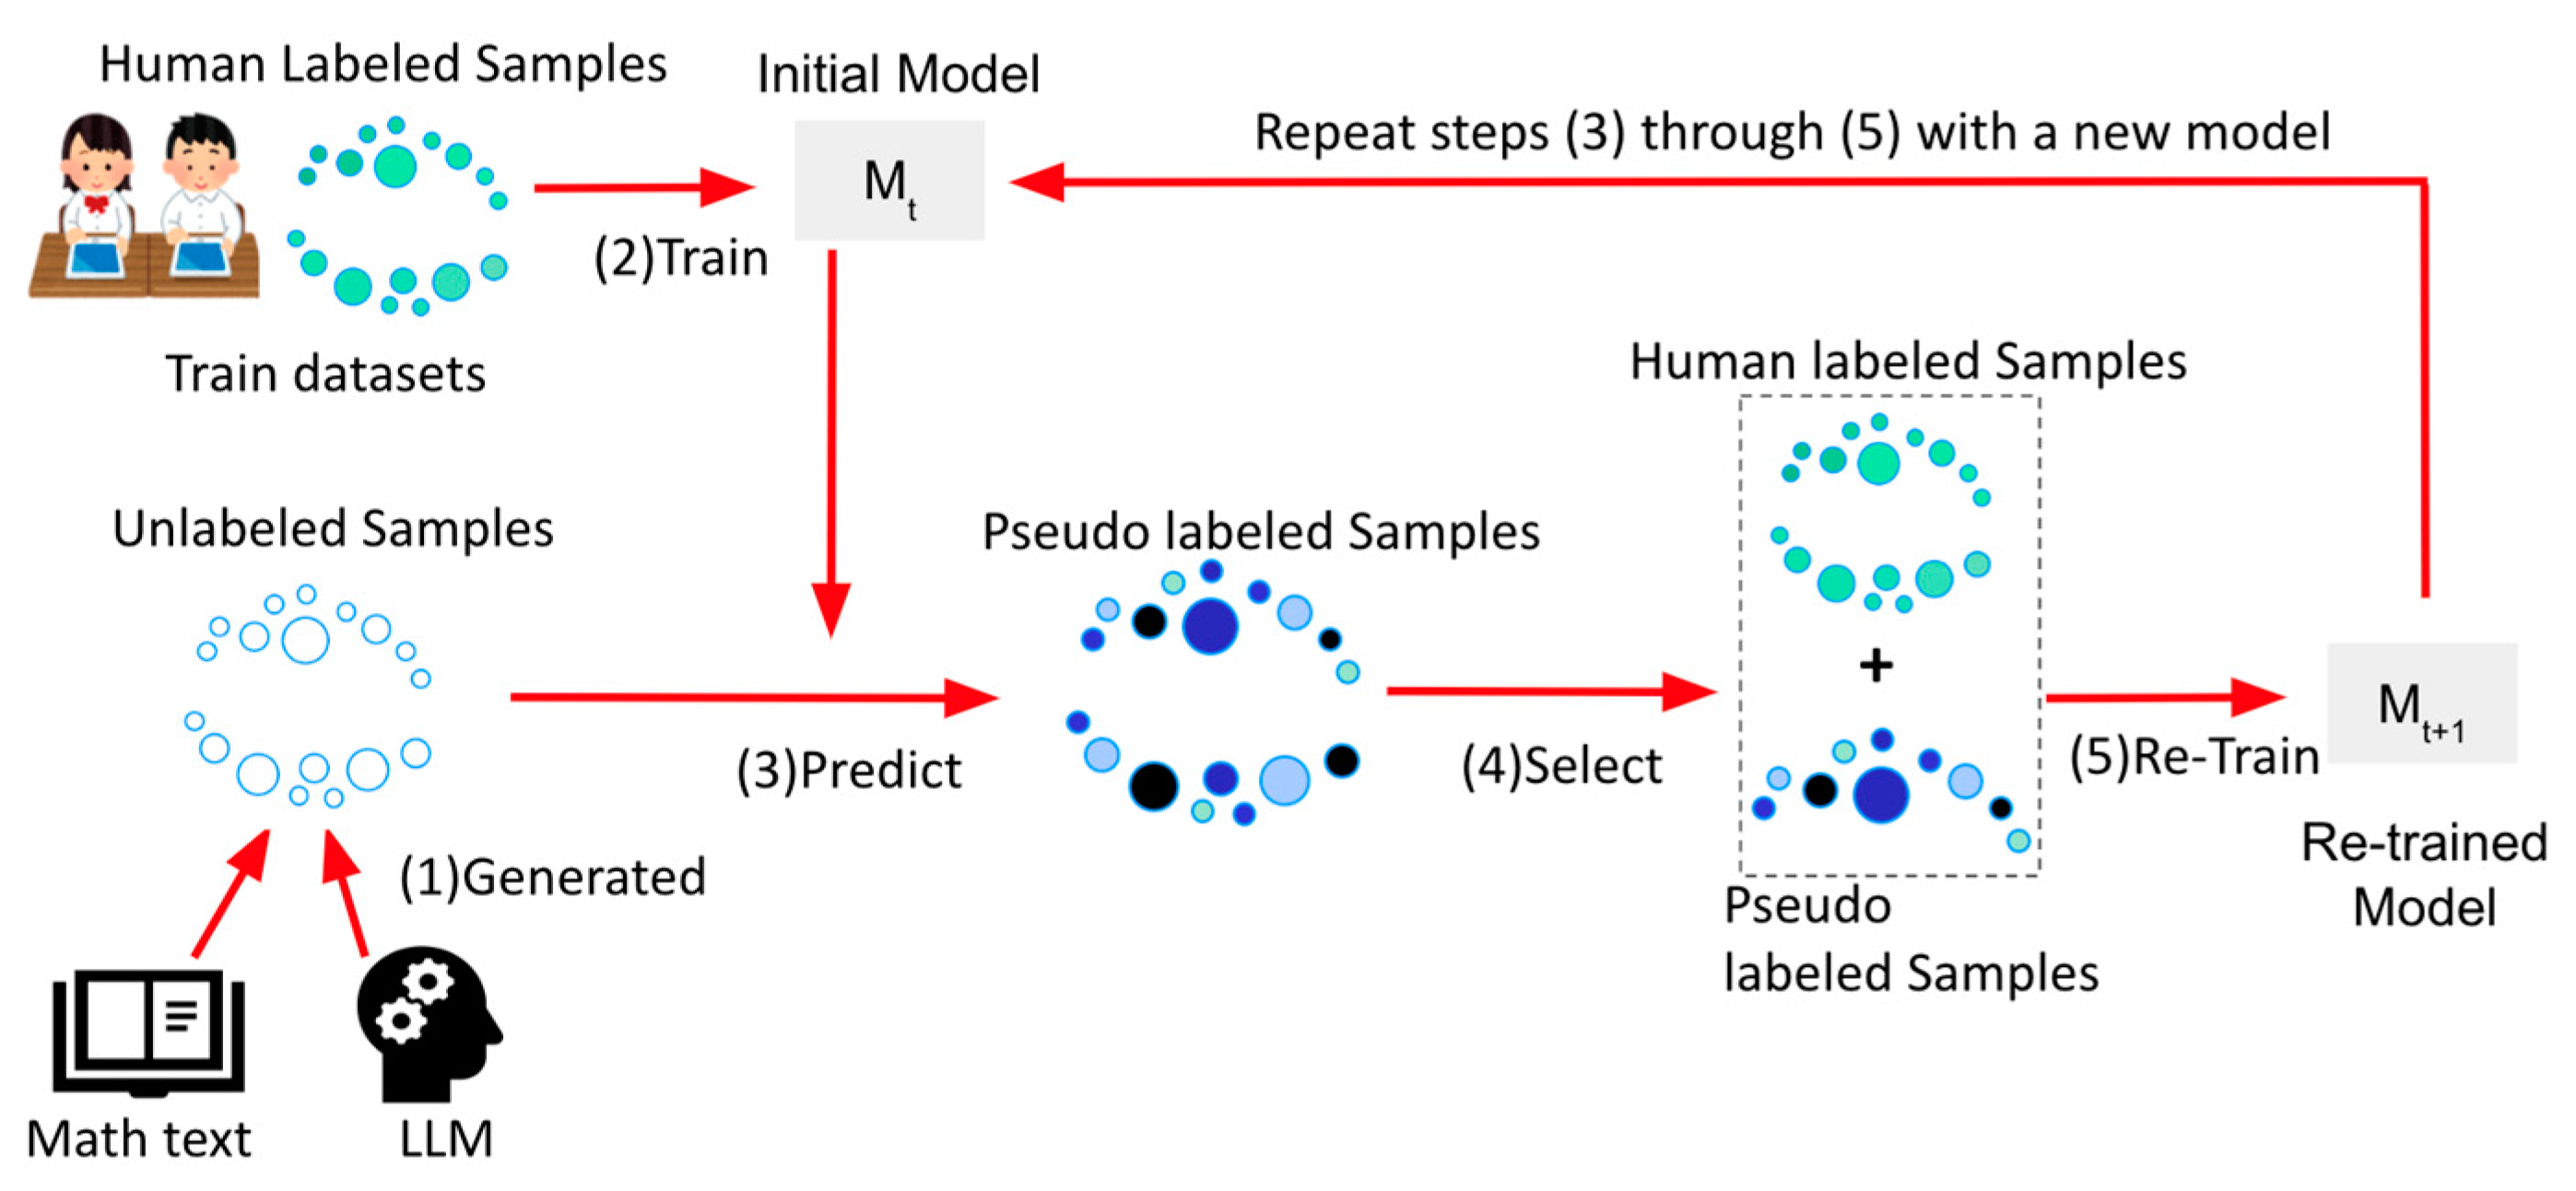
Figure 4.
The Detail of Pseudo Training Process.
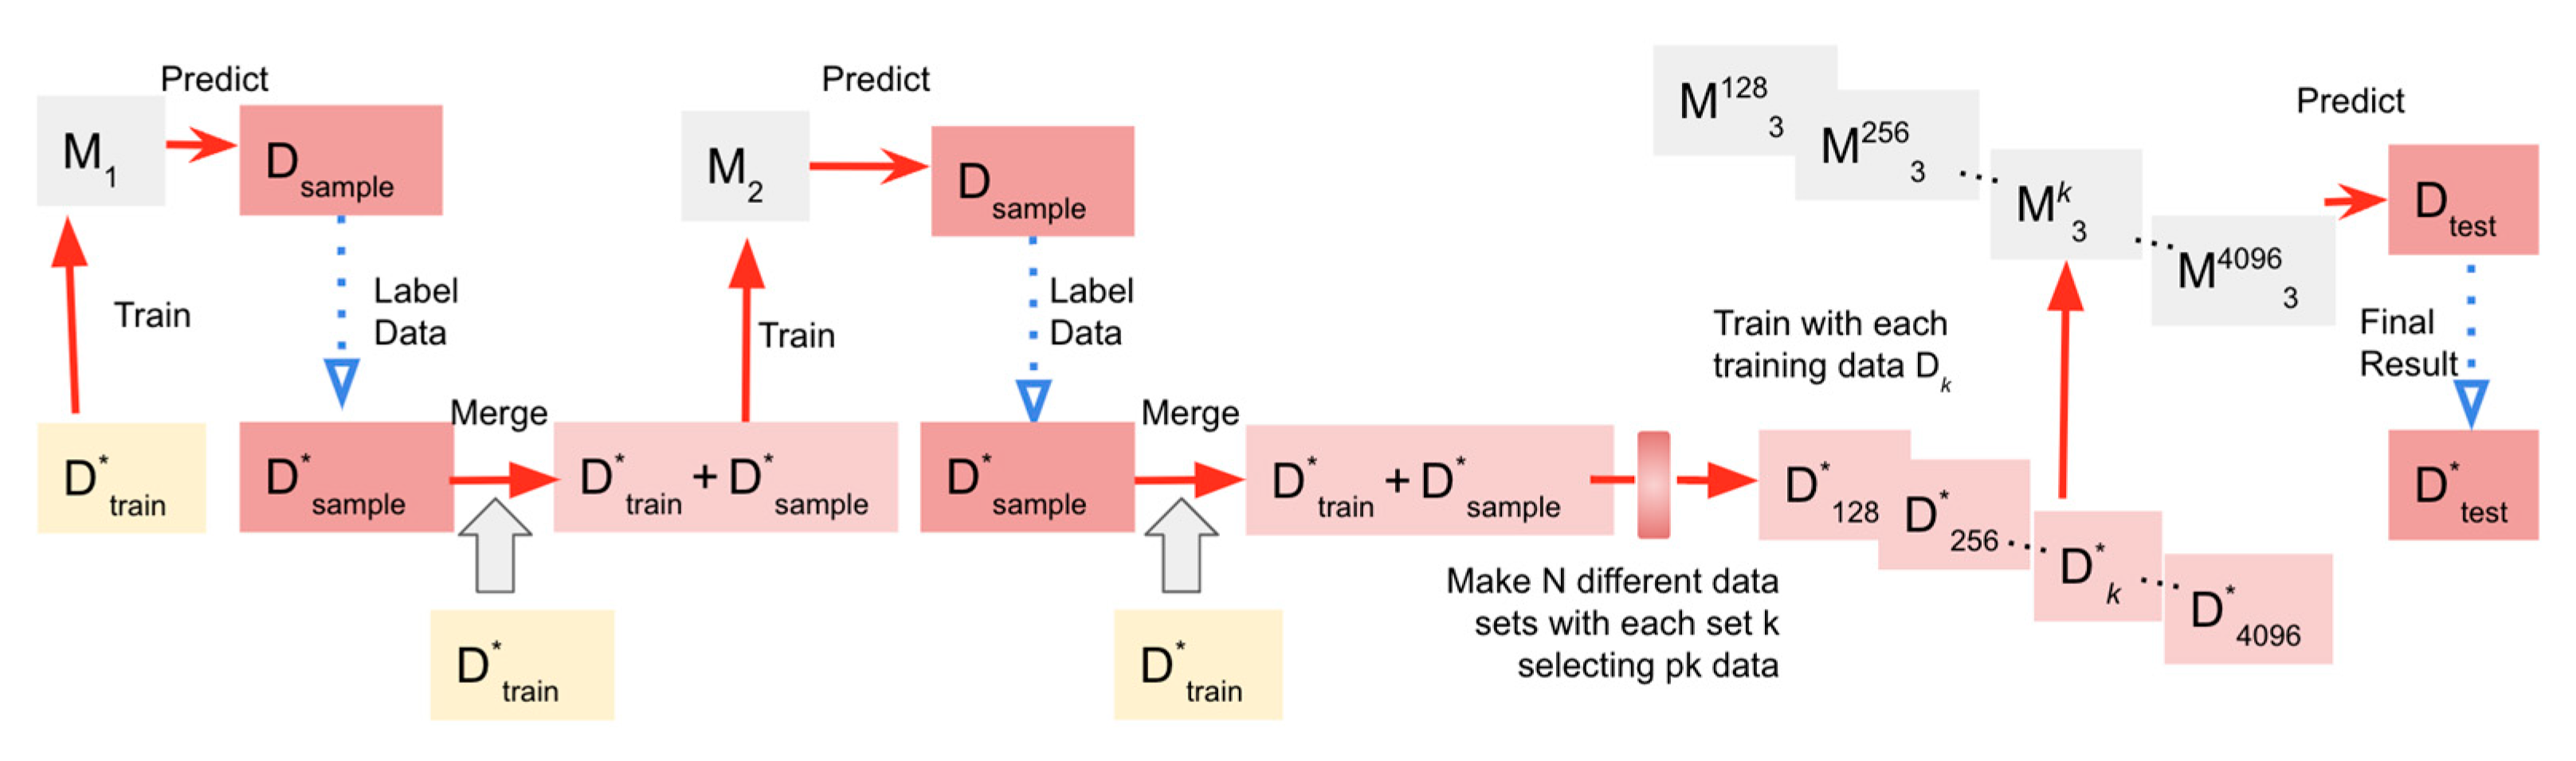
Figure 5.
Boxplots of Self-explanation Scores.
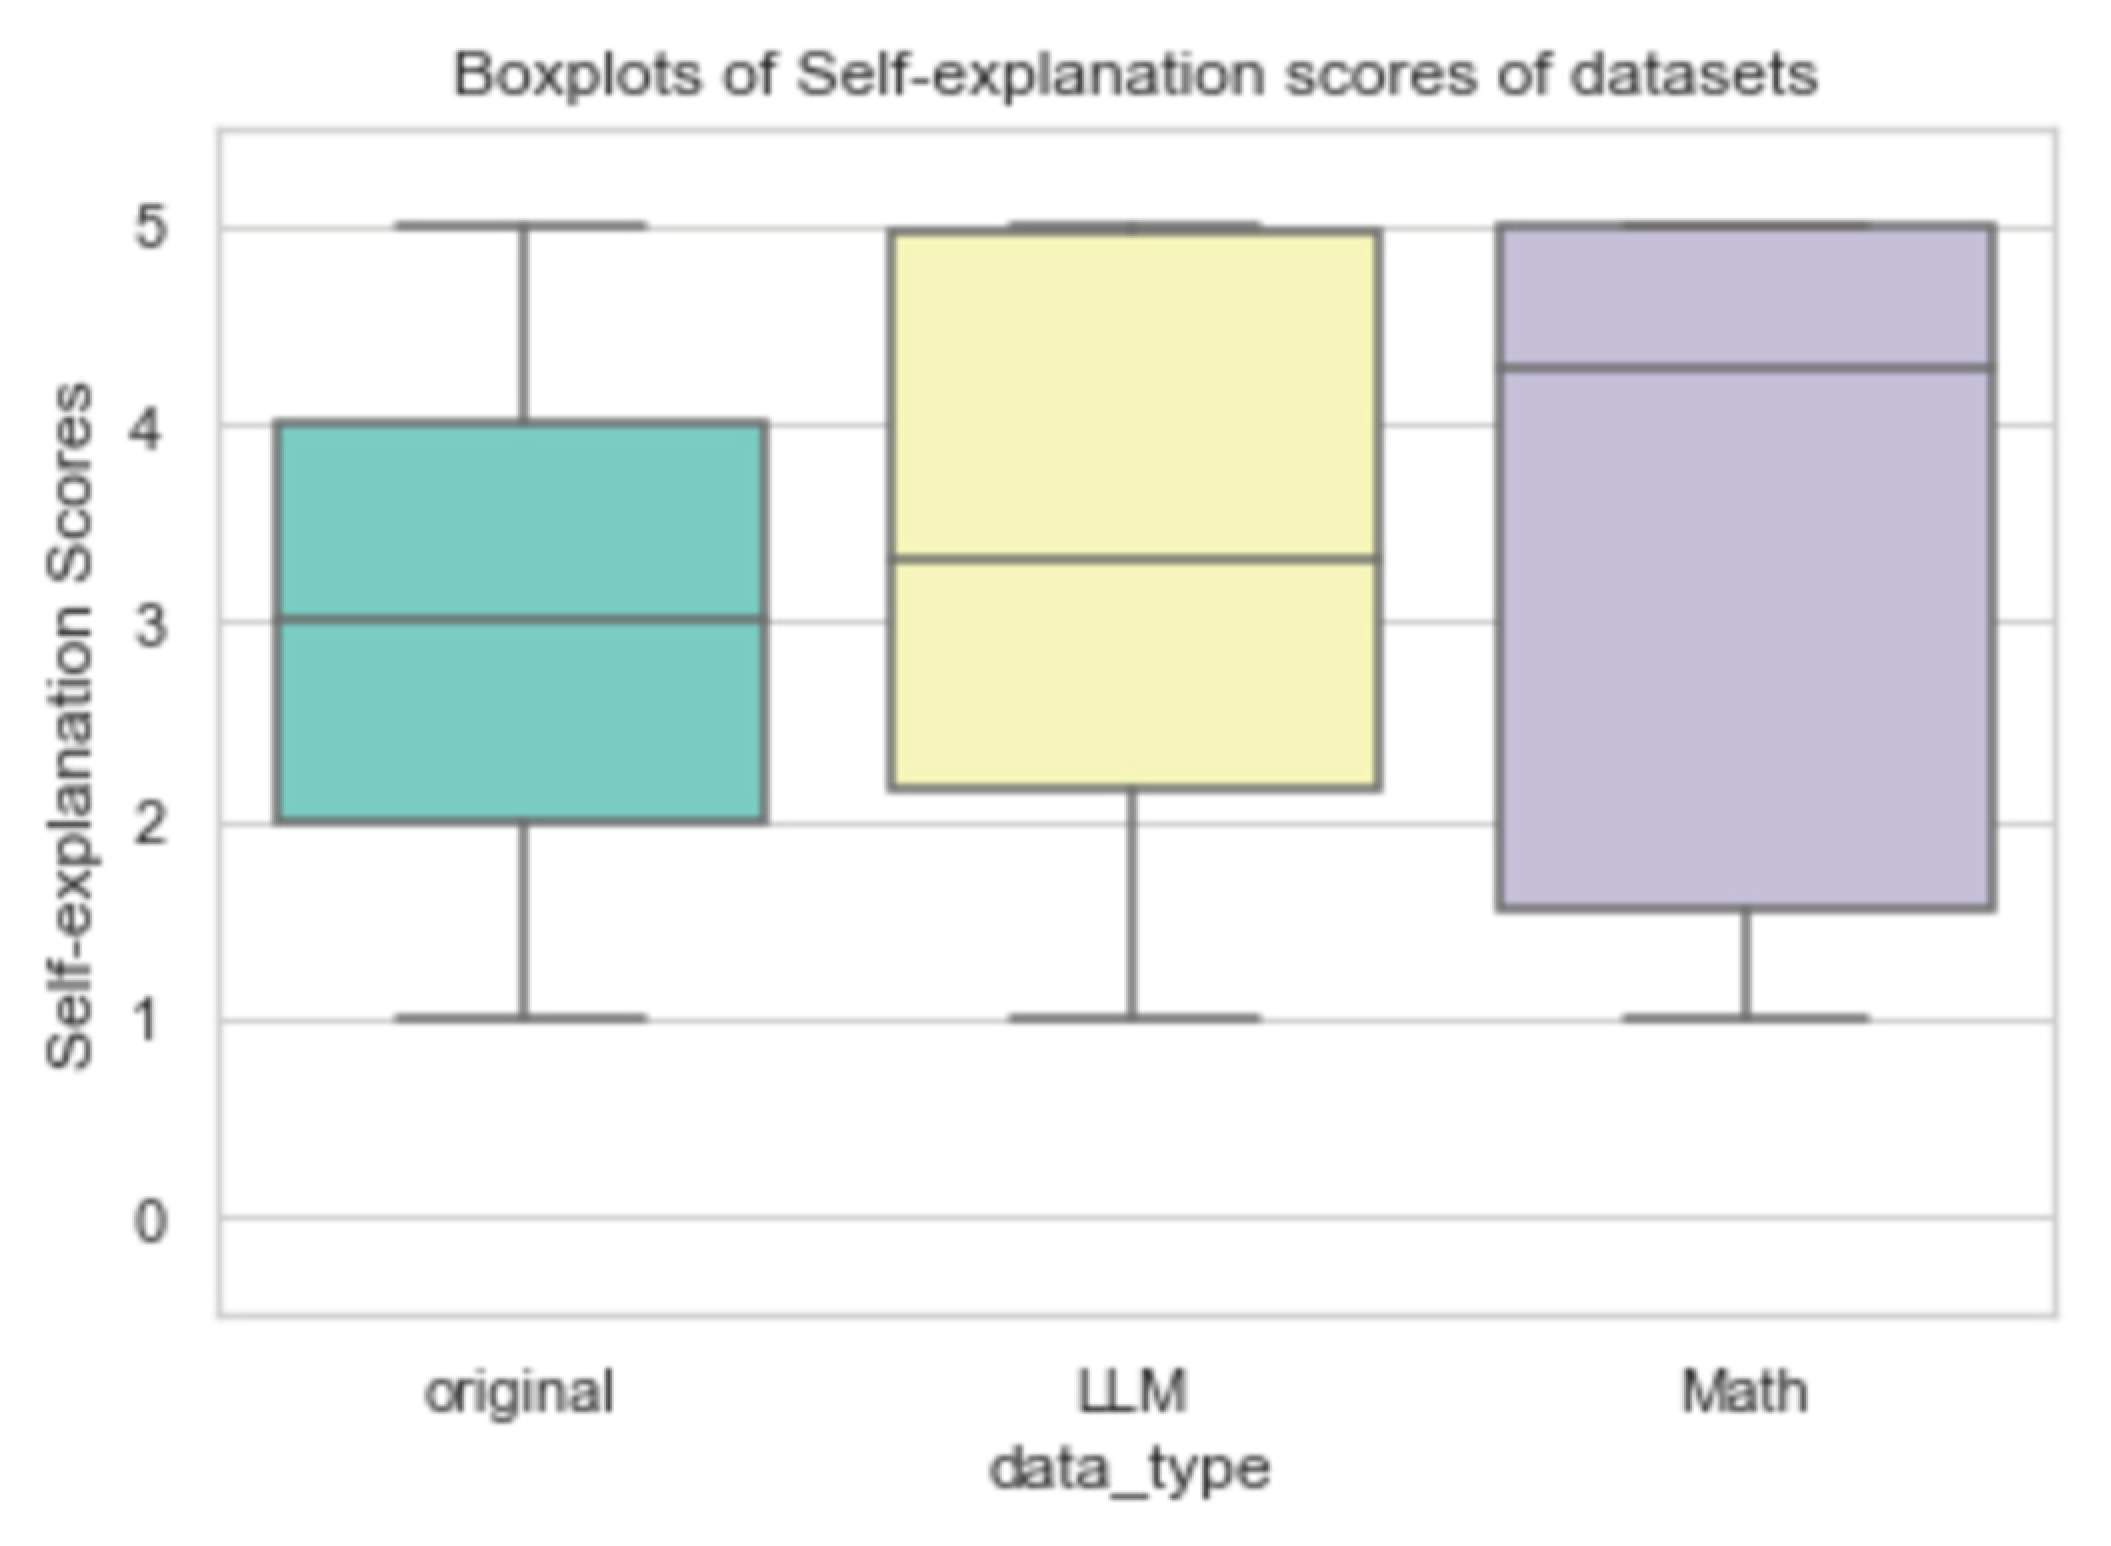
Table 1.
Rubrics and a sample answer of self-explanation in a quiz.
| Number | Rubric | Sample Answer of Self-explanations |
|---|---|---|
| Step 1 | Be able to find the equation of a linear function from two points. | Substituting the y-coordinate of p into the equation of the line AC. |
| Step 2 | Be able to find the equation of the line that bisects the area of a triangle. | Find the area of triangle ABC, then find the area of triangle OPC. |
| Step 3 | Be able to represent a point on a straight line using letters (P-coordinates). | With the line OC as the base, find the y-coordinate of p, which is the height. P’s coordinate is (t, -1/2t+4). |
| Step 4 | Be able to represent a point on a straight line using letters (Q-coordinate). | Since the coordinates of P are (3,5/2), the line OP is y=⅚x, and the coordinates of Q are (t,5/6). |
Table 2.
Score Grading Definitions.
| Graded Score | Description |
|---|---|
| 1 (Unacceptable) | The number of steps for which self-explanation is filled in for the steps required for the solution is minimal, and there were problematic expressions in the students' self-explanation (e.g., mistaken patterns, boredom.) |
| 2 (Poor) | self-explanation are mainly provided for the steps required for the solution. Still, they are more like bullet points than explanations. |
| 3 (Fair) | self-explanation are mainly provided for the steps required for the answer—the average self-explanation level among all respondents. |
| 4 (Very Good) | self-explanation are provided for most of the steps required for the answer, but there is room for improvement as an explanation (Logic, expressions). |
| 5 (Excellent) | self-explanation are mainly provided for the steps required for the answer, and the explanation is logical and well-written. |
Table 3.
Descriptive Statistics of Graded Self-Explanations.
|
Data Type |
Num of quiz | Variations of math units | Total answers |
Sentence Length (Character count) |
Quality Score | ||
|---|---|---|---|---|---|---|---|
| Mean | SD | Mean | SD | ||||
| Train | 40 | 8 | 1,420 | 67.8 | 56.8 | 2.94 | 1.34 |
| Valid | 37 | 8 | 355 | 67.3 | 59.3 | 2.92 | 1.31 |
| Test | 8 | 3 | 431 | 63.7 | 53.2 | 2.81 | 1.25 |
Table 8.
Datasets Overview.
| Dataset | base_line | LLM | math | mixed | only_LLM_math |
|---|---|---|---|---|---|
| Original (N=1,420) |
〇 | 〇 | 〇 | 〇 | |
| LLM- generated (N=4,096) |
〇 | 〇 | 〇 | ||
| Math texts (N=4,096) |
〇 | 〇 | 〇 | ||
| Total Number of Data | 1,420 | 5,516 | 5,516 | 9,612 | 8,192 |
Table 9.
Model Performance for Various Datasets (MAE).
| Data Type | base_line | LLM | math | mixed | only_LLM_math |
|---|---|---|---|---|---|
| Test | 0.749 | 0.699 | 0.646 | 0.692 | 1.135 |
| Val | 0.602 | 0.341 | 0.358 | 0.336 | 1.033 |
Table 10.
Test MAE with Varying Amounts of Added Pseudo-Self-Explanation Data.
| Dataset | Number of datasets added | |||||
| 128 | 256 | 512 | 1024 | 2048 | 4096 | |
| base_line | 0.75 | |||||
| LLM | 0.67 | 0.63 | 0.72 | 0.72 | 0.71 | 0.7 |
| math | 0.64 | 0.66 | 0.67 | 0.64 | 0.65 | 0.65 |
| mixed | 0.68 | 0.66 | 0.71 | 0.68 | 0.73 | 0.69 |
| only_LLM_math | 1.19 | 0.96 | 1.02 | 0.89 | 1.15 | 1.14 |
Table 11.
Validation MAE with Varying Amounts of Added Pseudo-Self-Explanatory Data.
| Dataset | Number of datasets added | |||||
| 128 | 256 | 512 | 1024 | 2048 | 4096 | |
| base_line | 0.60 | |||||
| LLM | 0.57 | 0.35 | 0.51 | 0.49 | 0.40 | 0.34 |
| math | 0.40 | 0.50 | 0.43 | 0.35 | 0.40 | 0.36 |
| mixed | 0.59 | 0.32 | 0.52 | 0.44 | 0.40 | 0.34 |
| only_LLM_math | 1.19 | 0.90 | 0.96 | 0.81 | 1.02 | 1.03 |
Disclaimer/Publisher’s Note: The statements, opinions and data contained in all publications are solely those of the individual author(s) and contributor(s) and not of MDPI and/or the editor(s). MDPI and/or the editor(s) disclaim responsibility for any injury to people or property resulting from any ideas, methods, instructions or products referred to in the content. |
© 2023 by the authors. Licensee MDPI, Basel, Switzerland. This article is an open access article distributed under the terms and conditions of the Creative Commons Attribution (CC BY) license (http://creativecommons.org/licenses/by/4.0/).
Copyright: This open access article is published under a Creative Commons CC BY 4.0 license, which permit the free download, distribution, and reuse, provided that the author and preprint are cited in any reuse.


