1. Introduction
Velocimetry is extremely important for characterizing and understanding the effects of fluid flow. Several techniques are applied in studying velocimetry, with it being possible to mention punctual and global applications capable of measuring the velocity of a point, or of the entire flow field.
Some of the punctual techniques include the pitot tube, rotating vane anemometry, hot wire or hot film anemometry, hot sphere anemometry, ultrasonic anemometry and laser Doppler velocimetry. The global techniques mainly include particle image velocimetry (PIV), particle tracking velocimetry (PTV) and particle shadow velocimetry (PSV), all based on optical principles. Detailed description of the mentioned techniques can be seen in the literature [
1,
2,
3].
Specifically considering the PIV technique, a previous study [
4] have mentioned that complete commercial systems is concentrated in a few suppliers in the world trade. In addition, acquiring a commercial PIV measurement system represents a high cost for many institutions, and thus makes the acquisition unfeasible even for large companies or research and teaching centers.
About the advantages of applying the PIV technique, the literature [
5,
6,
7] indicates developments in the direction of building experimental configurations with alternative resources and more accessible cost. These systems can be used for educational applications or even to meet the specificities of a research.
For example, using a smartphone camera with 240 frames per second (fps) to capture images in flowing water [
5], applying an action camera (GoPro Hero 5) to analyze the jet flow of an aquarium pump filled with water [
6], and working with 4 smartphones to capture images and perform velocimetry processing of TOMO-PIV tomographic particle images [
7].
A camera with a high image acquisition rate is essential in the process among the devices necessary to constitute the PIV technique, mainly for air flows in a wind tunnel since the flow velocity is normally higher when compared to natural hydraulic flow velocities.
To develop a low-cost PIV measurement technique applied in a wind tunnel, it is desirable using a system for image acquisition which is accessible, versatile and which can capture images with a suitable acquisition rate. In this direction, the literature indicates the development of experimental apparatus based on synthetic particle displacement to simulate the flow of particles with known displacement and to evaluate the use of alternative equipment for image acquisition. For example, a study [
6] reports the use of a plate with 100 mm of diameter in controlled rotation from 1.5 to 4 Hz, capturing images with a GoPro Hero 5 action camera. In another study [
8], it was reported the use of a plate with synthetic particles for experimental validation during the development of the SmartPIV software, available for smartphones with Android and IOS systems.
Thereby, this study proposes to test the viability to use smartphones as image acquisition systems for the PIV technique. So, an experimental apparatus inspired by the angular displacement of particles was built, in this case by synthetic printing of particles on the face of a plate coupled to a motor shaft. The images were acquired using two smartphones from different manufacturers, and subsequently processed using the PIVlab-MatLab® software program. Through the suggested method, it is possible to establish a particle displacement pattern according to an adjustment of the angular velocity of the plate with printed particles. Thus, with the known displacement pattern, it is then possible to evaluate only specific characteristics of the experimental apparatus.
2. Materials and Methods
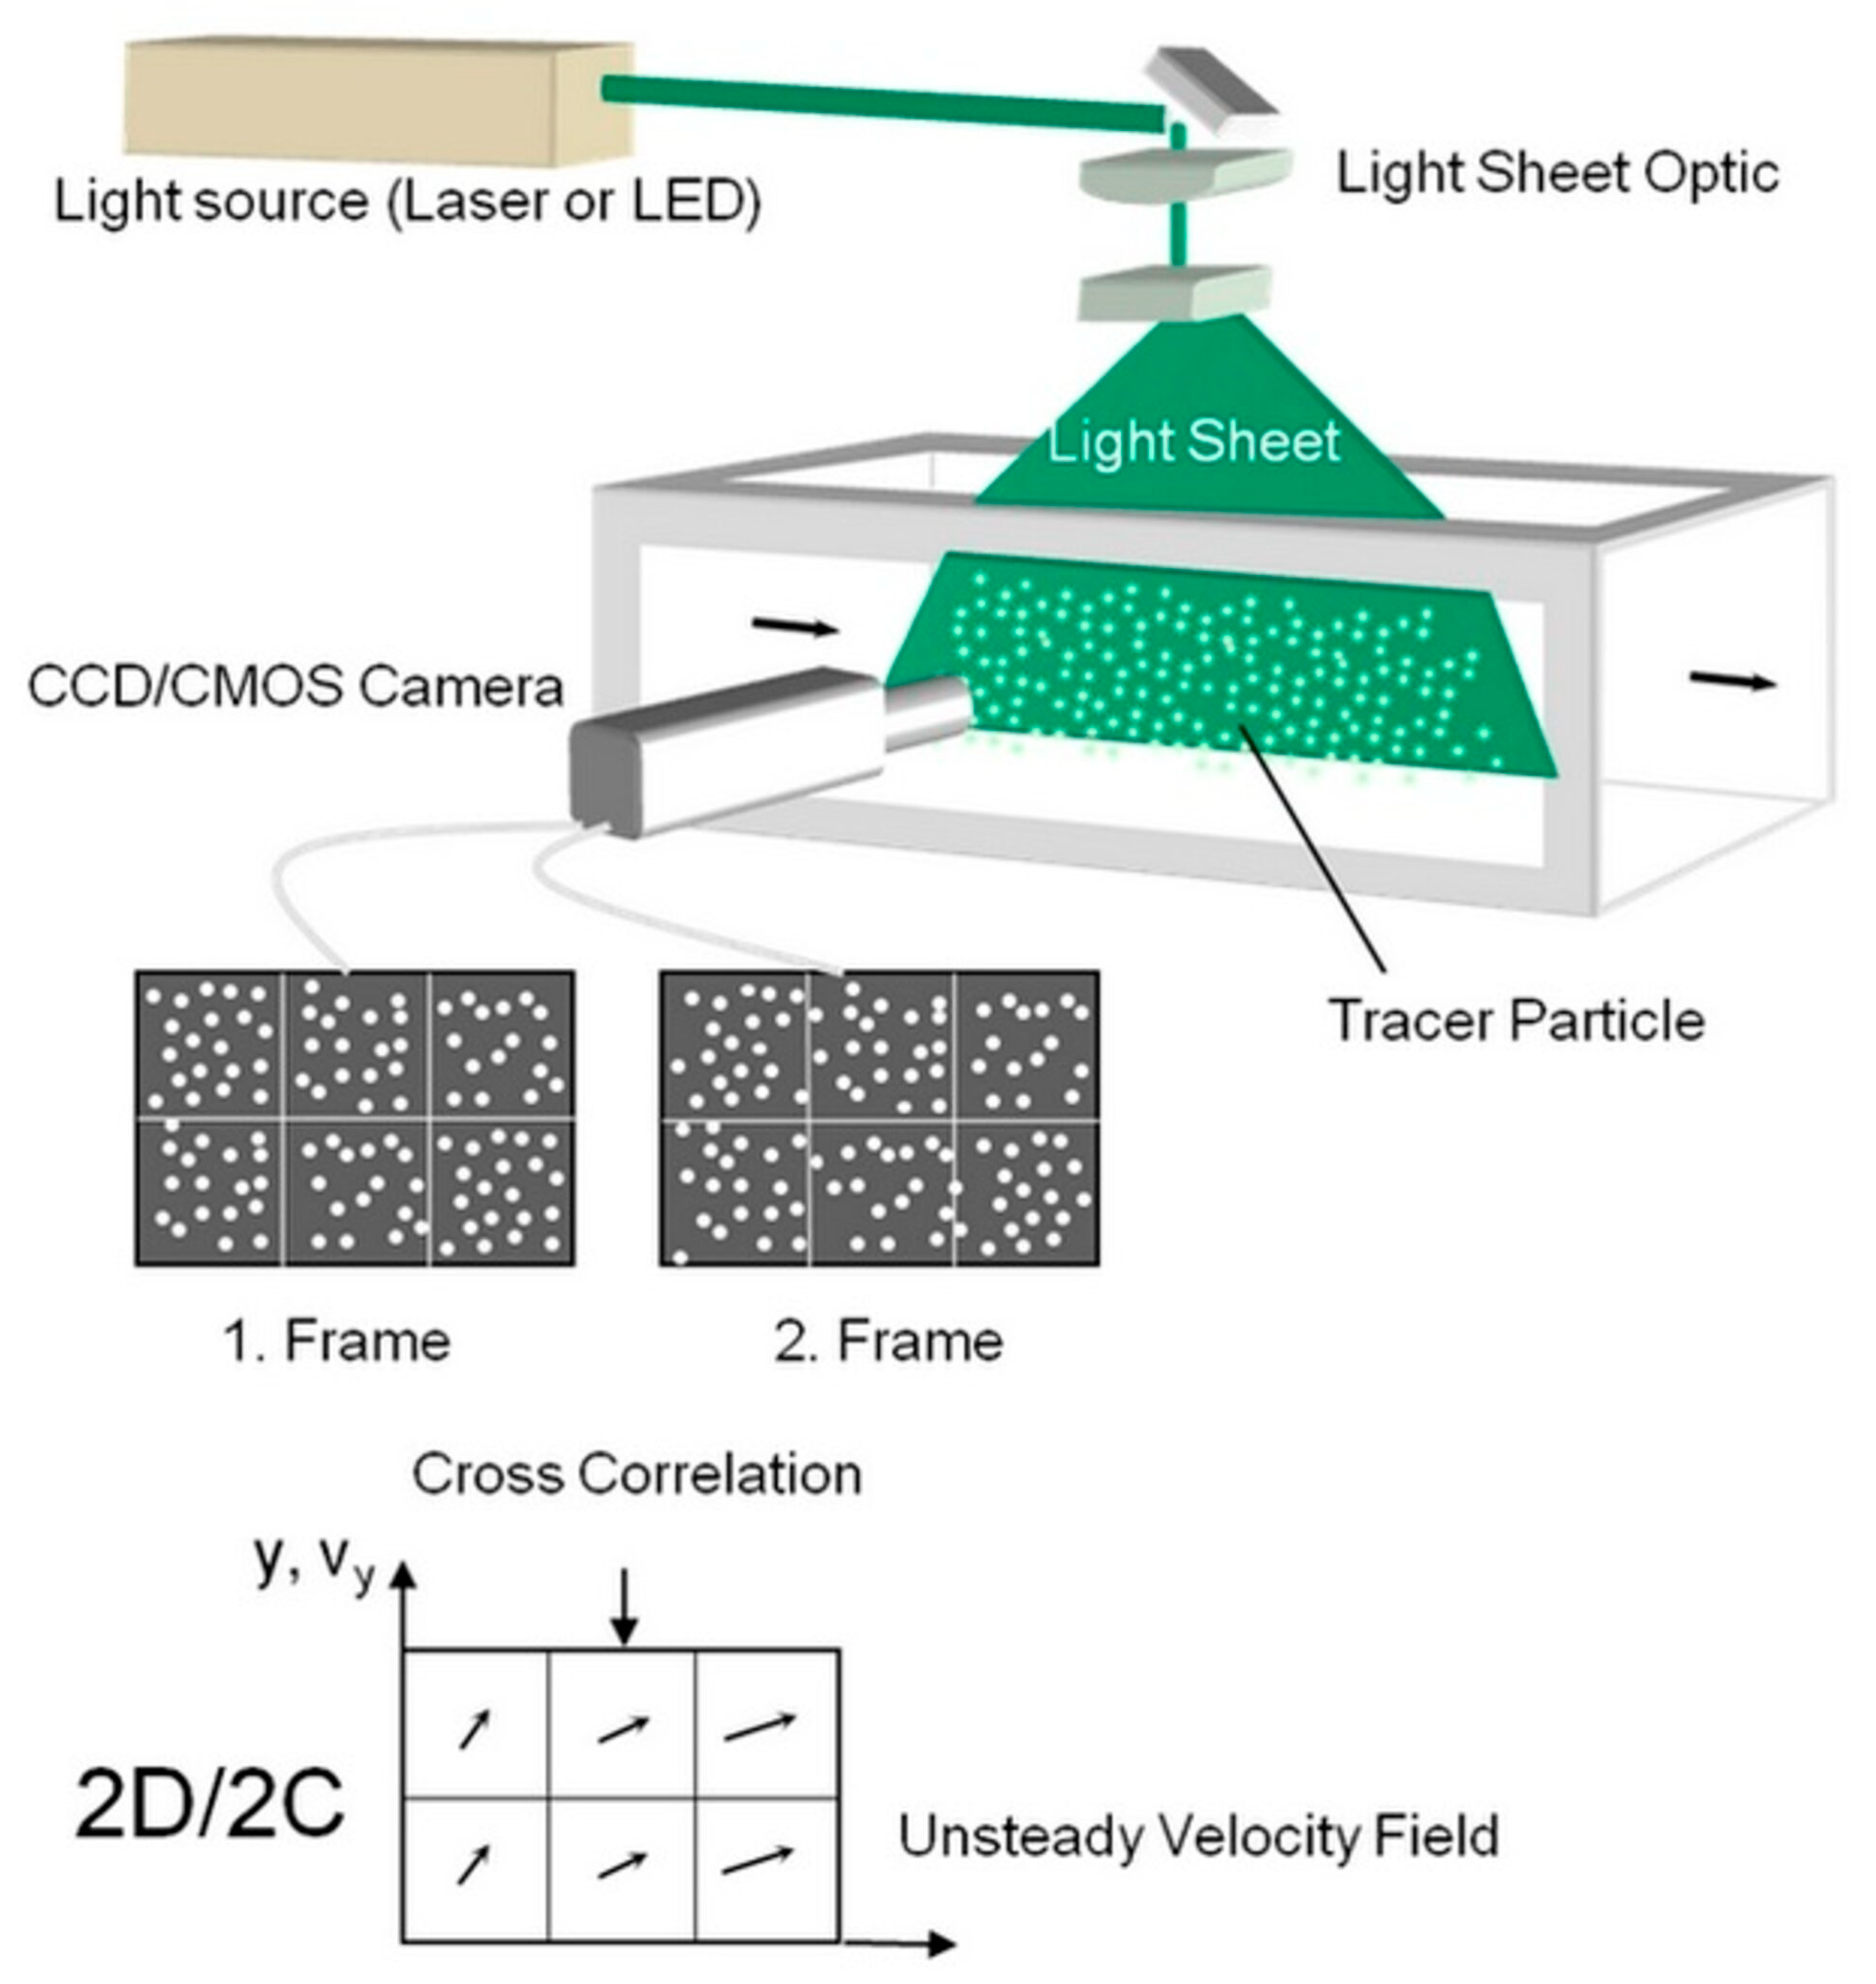
The basic configuration for applying the PIV technique in a wind tunnel is shown in
Figure 1. It consists of a particle seeder installed directly at the air flow inlet and the PIV measurement system in the test section of the tunnel. The PIV measurement system is also composed of an apparatus formed by a light-emitting laser and an optical assembly, responsible for converting the light beam into a planar stripe. The camera is positioned orthogonal to the planar stripe and acquires several images in a short time interval.
Commercially measurement systems use a high power multi-pulsed laser ensuring the delivery of greater energy for particle visualization. However, this system needs a synchronizing component to control the trigger time of the laser with the camera, thus making the system more complex and costly. In order to develop the low-cost PIV technique for wind tunnels, the use of a continuous wave - cw laser is desired, since in addition to the initial cost of the equipment being much lower, it is possible to eliminate the need for a synchronizer system.
2.1. Experimental setup
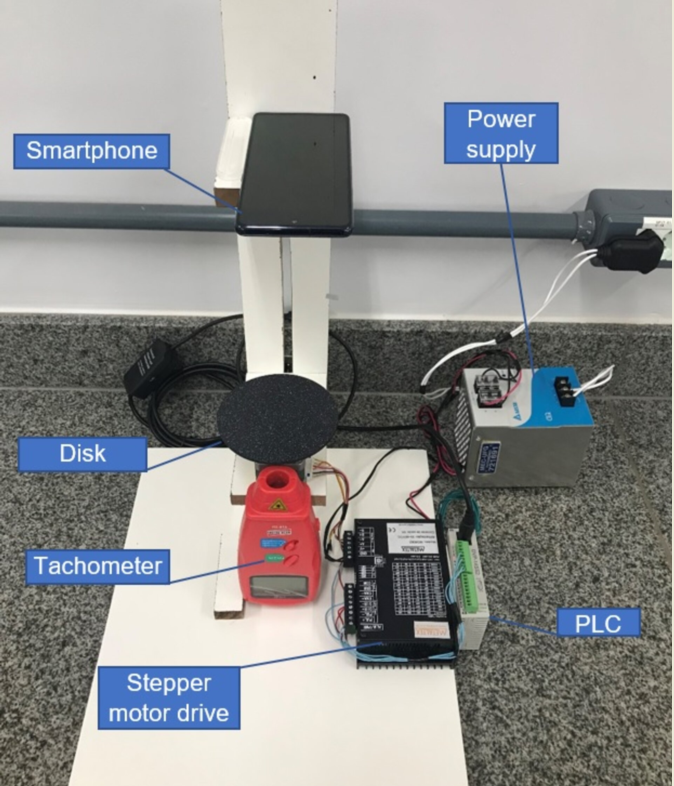
The proposed experimental apparatus uses a National Electrical Manufacturers Association (NEMA 17) standard stepper motor with a resolution of 200 steps per revolution and a step angle corresponding to 1.8 angular degrees. A rigid flange made of Nylon was coupled to its motor shaft and an MDF plate were mounted at the end. The Nylon flange consists of a threaded coupling element which facilitates interchanging plates, and which can receive the serigraphy of representative figures of different sizes and particle densities.
The power supply and control system consist of a 24VDC voltage source, a programmable logic controller (PLC), and a stepper motor drive. A digital tachometer was installed at the bottom of the plate so that it is possible to measure the angular velocity in revolutions per minute (RPM) with the use of a reflective tape attached to the bottom of the plate. A smartphone is positioned on an MDF support above the plate, and the focal length for capturing images can be easily changed by vertically adjusting the support base.
The experiments were carried out using a set of professional continuous lighting for photographs and filming to standardize the lighting in the environment, consisting of a soft box with dimensions of 0.5 m x 0.7 m and a spiral fluorescent lamp with 135 W of power and temperature of 5500 K color, known as daylight, which is quite used for photo studios. Details of the configured experimental apparatus and its components can be seen in
Figure 2.
2.2. Tracer Particles
According to the guidelines on the best practices for applying PIV [
9], the particles must be able to form visible images under a certain lighting; in addition, they must have the ability to accurately follow the fluid movement without influencing the flow and be able to mark enough points in space to effectively resolve spatial flow.
Thus, the correct addition of tracer particles in the fluid is essential for greater accuracy in vector field velocimetry results. The use of synthetic particles consists of a practical way of evaluating the image acquisition system in applying the PIV technique without the need to worry about the generation and feeding of tracer particles.
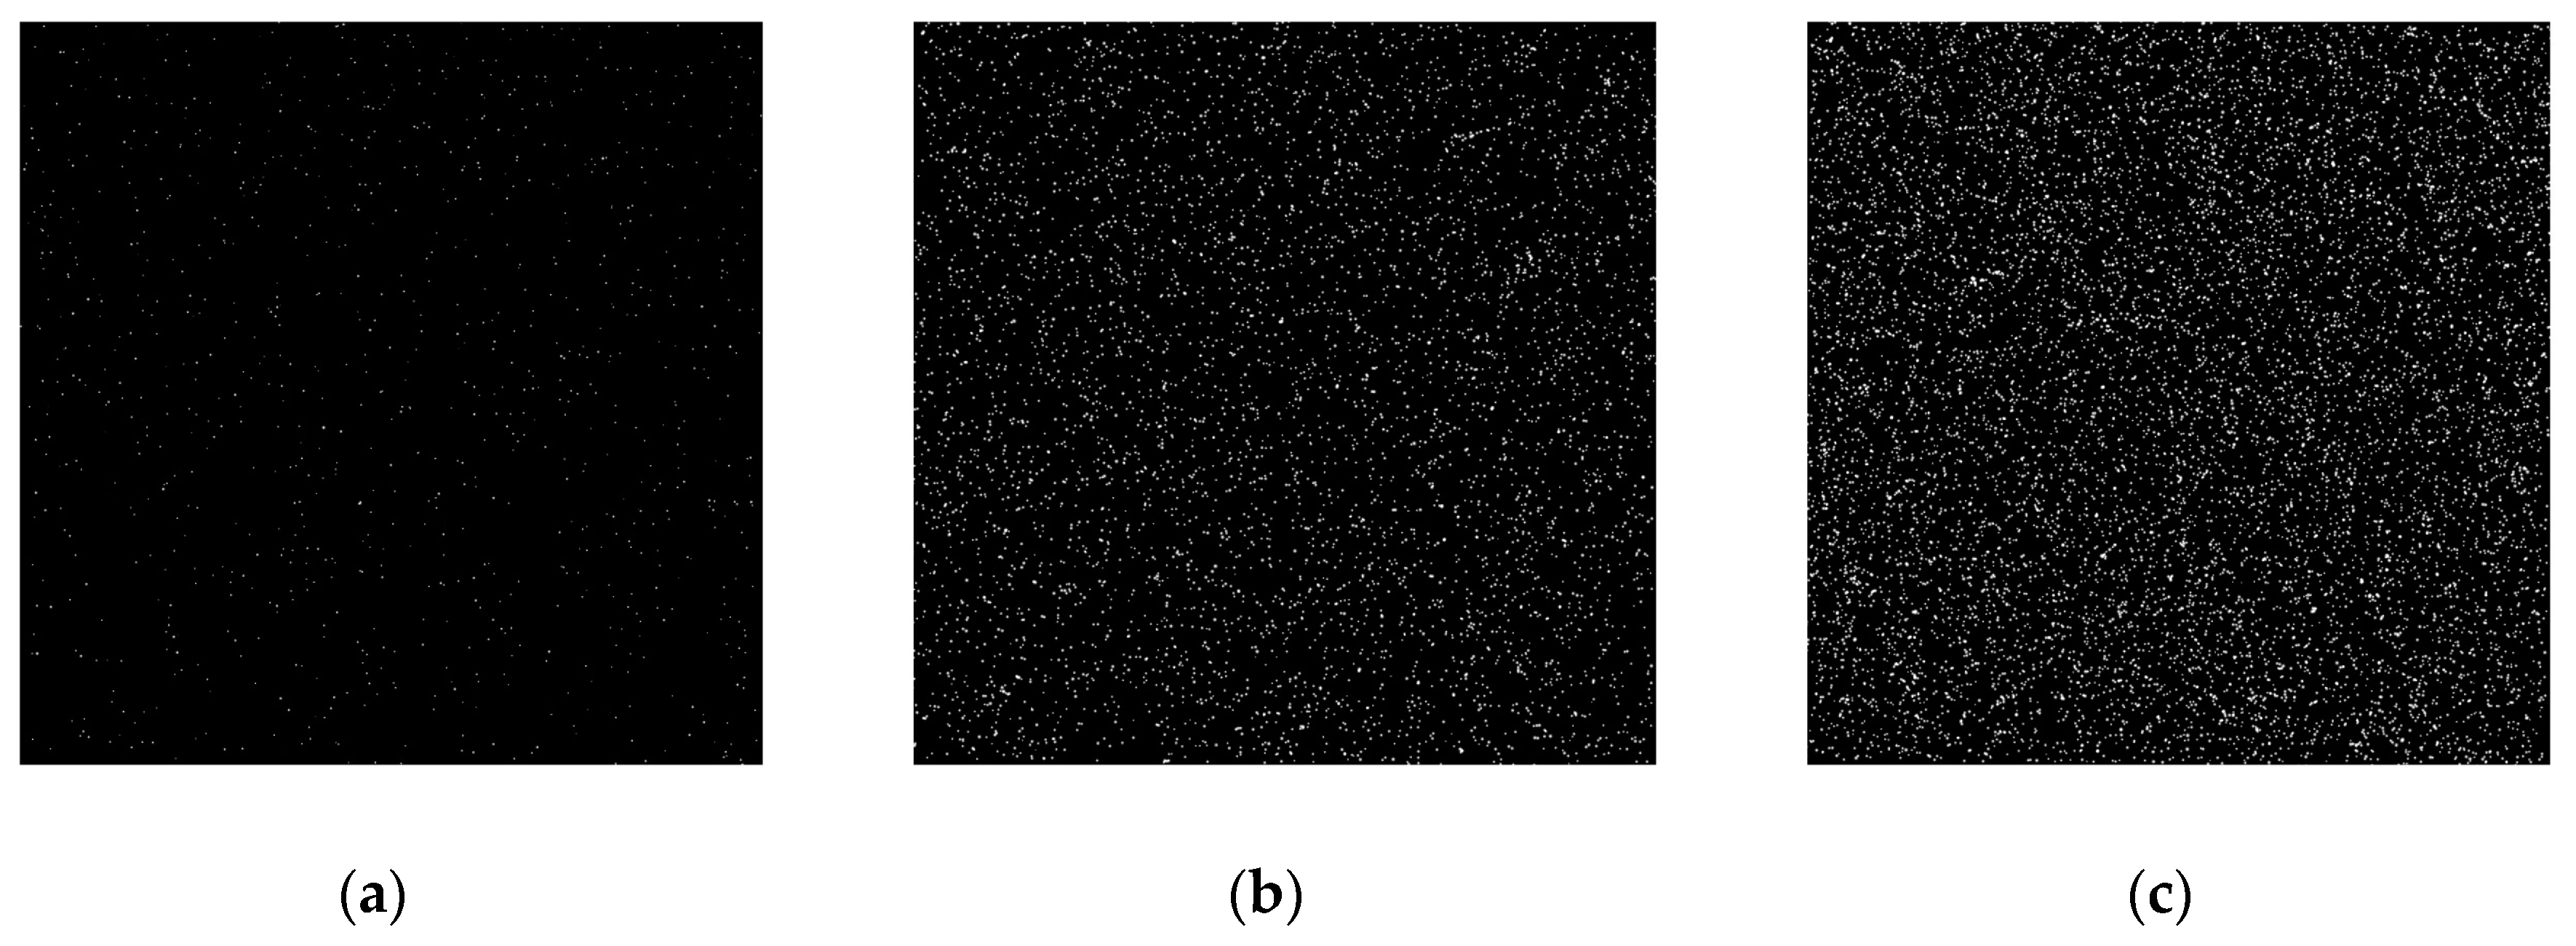
The images with synthetic particles were generated using the PIVlab-MatLab® application, through which it is possible to configure different parameters to change the particle size and density, as shown in
Figure 3.
A particle diameter optimization study [
10] observed that particles with a diameter of approximately 2 pixels presented results with lower measurement uncertainty for digital evaluation of PIV. Another study [
11] evaluate the influence of synthetic particle diameter, obtaining the smallest mean errors for particles with diameters between 1.0 and 3.0 pixels. Recently [
5], images of synthetic particles with 2.5 pixels of diameter were used to evaluate the PIV technique using a smartphone.
In addition to the parameter associated with particle size, particle concentration is quite relevant for the PIV technique, and a concentration about 10 particles per interrogation area was recommended [
12]. Based on data from the literature, the PIVlab-MatLab® synthetic particle generator was used to compose the images shown in
Figure 3, which were reproduced on a laser printer with a sheet of 75g alkaline bond paper and subsequently attached on an MDF plate with 3 mm thick and 100 mm in diameter, as shown in
Figure 2.
2.3. Image Acquisition System
Image acquisition was inspired by portable and easily accessible equipment on the market. With technological advances, smartphones equipped with cameras capable of recording images at up to 960 fps are easily available, thereby enabling to evaluate their use as a tool applied in acquiring images for the PIV technique. Inspired by this technological capacity and similar works found in the literature [
5,
6,
7], it was proposed to evaluate the applicability of two devices as image acquisition systems for the PIV technique.
The first tests used an Apple iPhone 7 Smartphone, named in this study as image sensor 1 (IS1) capable of recording videos in slow motion with 240 fps and a resolution of 720 x 1280 pixels. The videos were recorded in .MP4 format and loaded into the PIVlab-MatLab® application, which identifies the number of frames and resolution of the video. It is also possible to visualize the frames and select the start and end range of the frames to be loaded for processing in this application using the PIV technique.
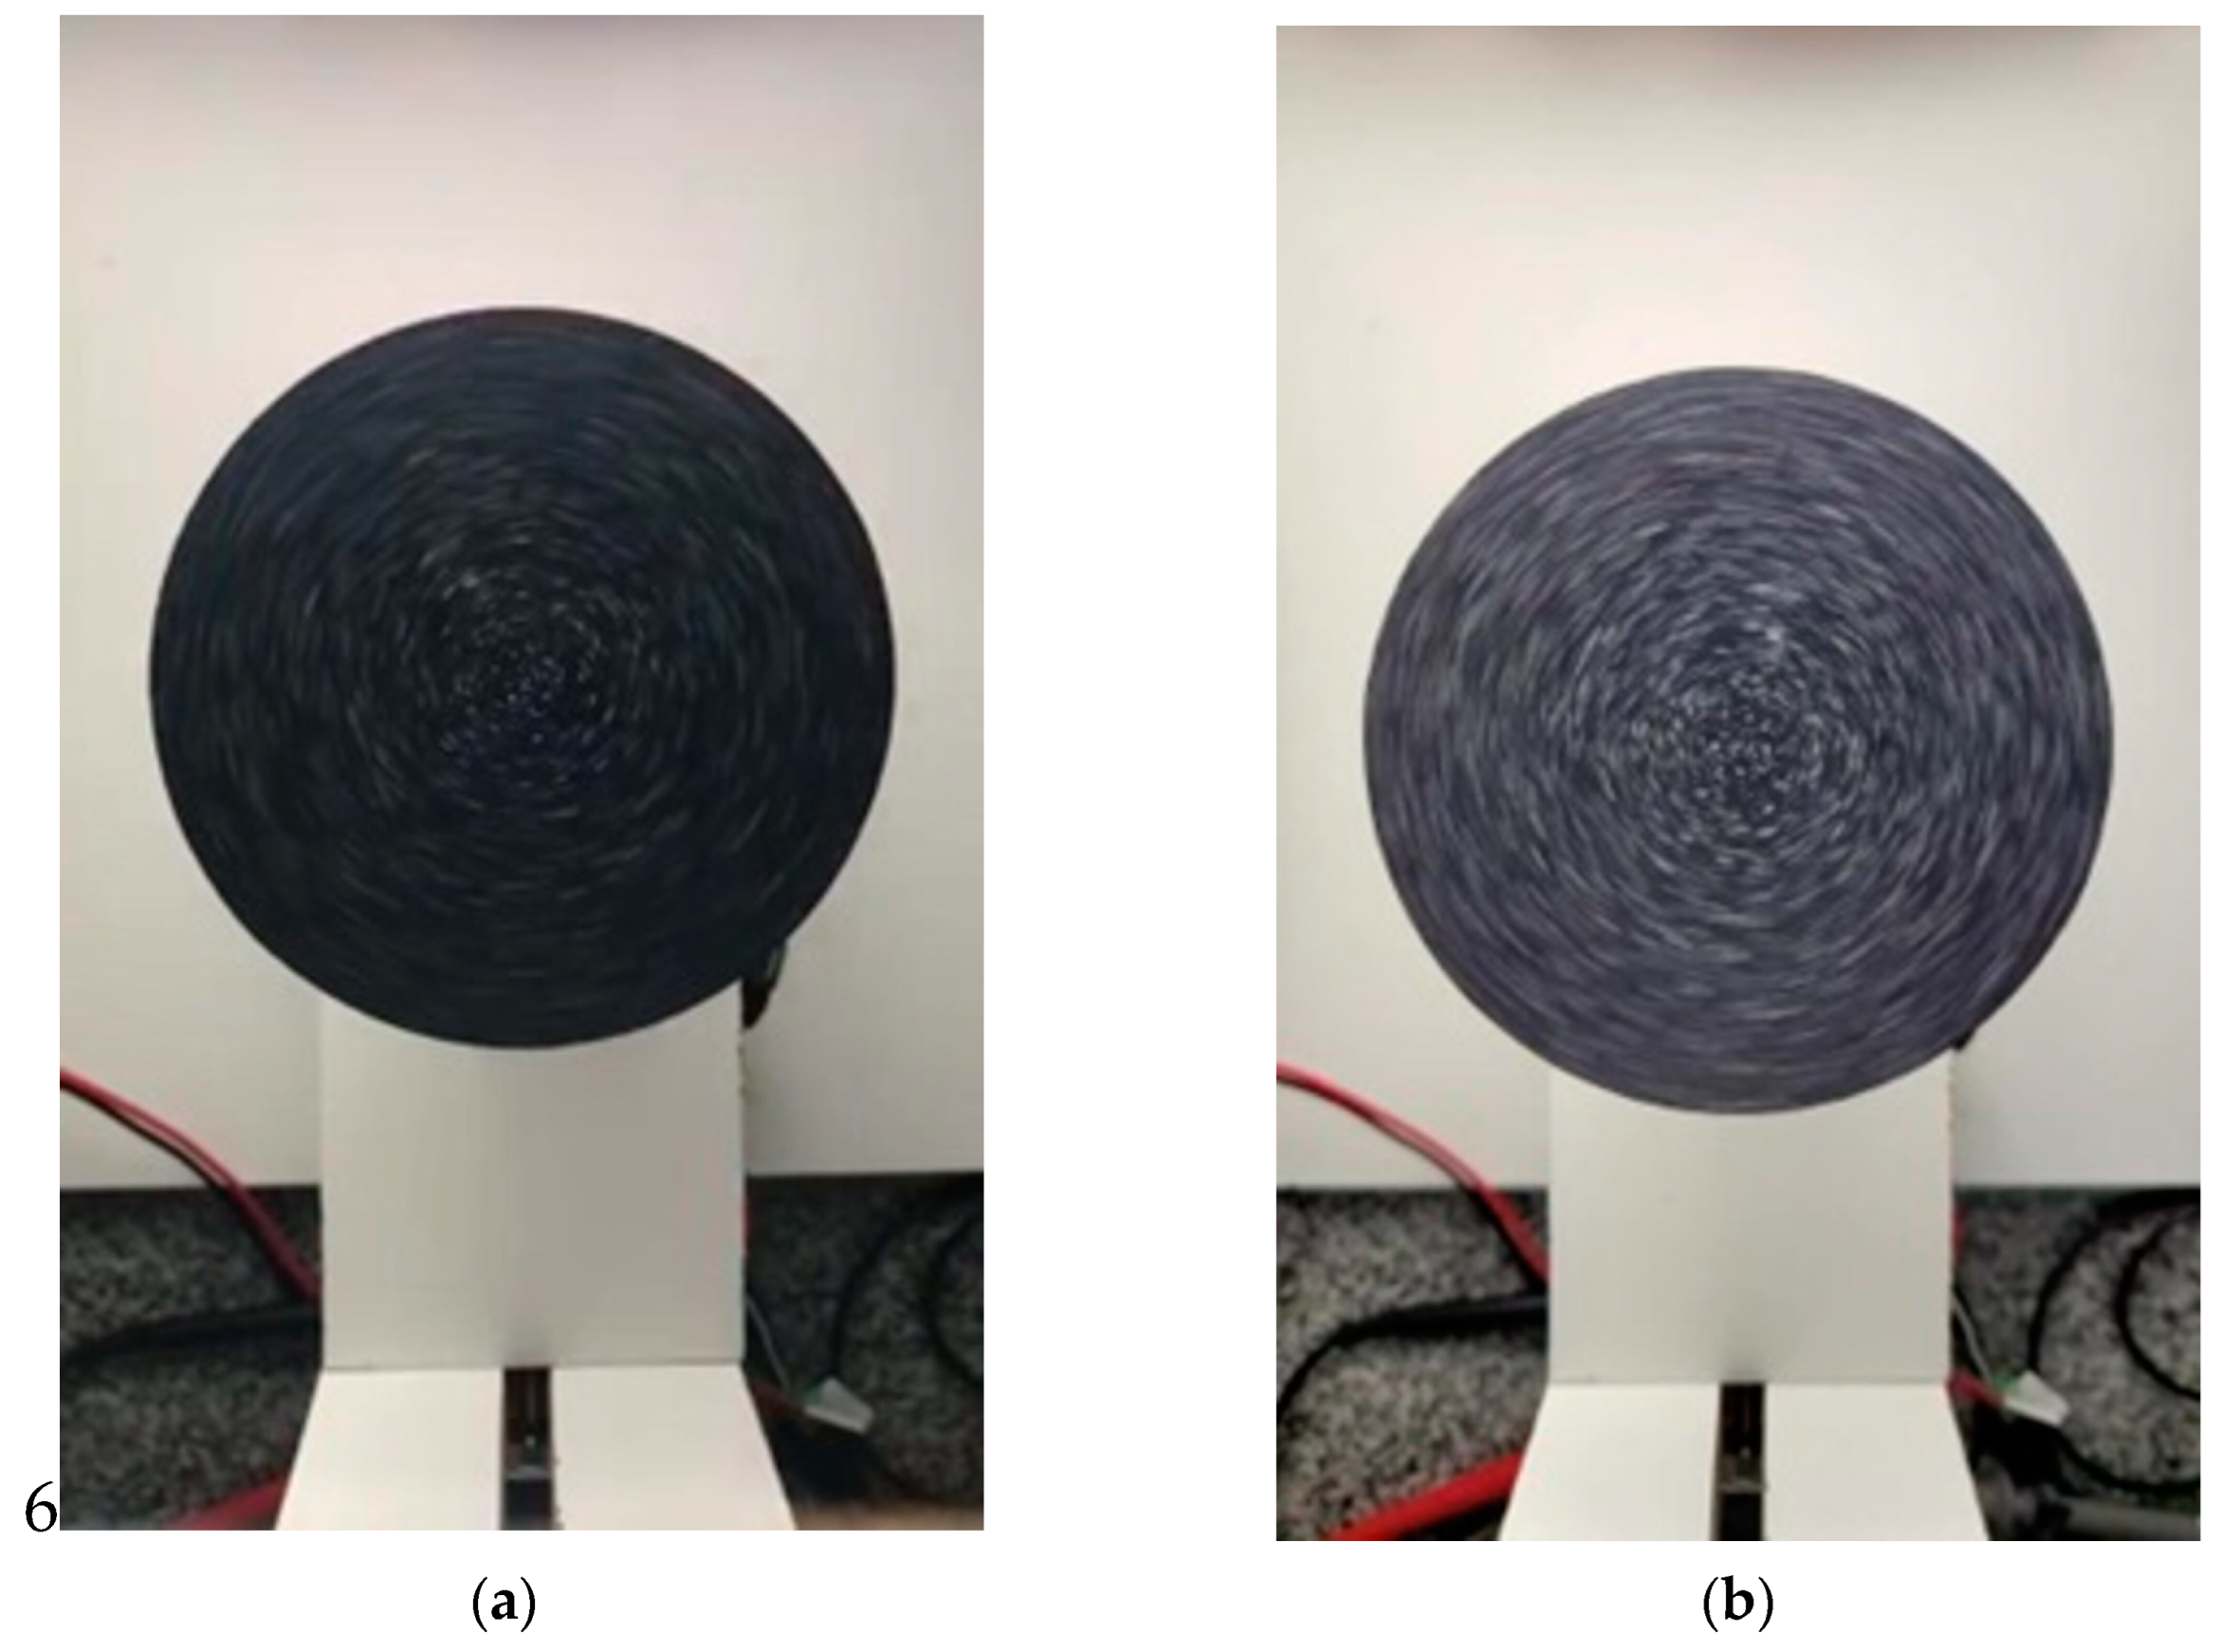
According to the experimental configuration, the IS1 was positioned 190 mm above the target and the field of view (FOV) obtained was 115 mm x 205 mm. Next, complete framing of the plate with a diameter of 100 mm was performed in this configuration. A field of view was established with a minimum edge of 5% free of the moving object around the entire perimeter of the plate, as preliminary tests pointed out flaws in the result when the vector field under analysis is close to or coincident with the field of view limit. Thus, it is possible to see in
Figure 4 that the captured field of view covers the entire plate image and a free area around its perimeter. Under these conditions, the spatial resolution obtained was 39.09 pixels/mm², which corresponds to a linear pixel length of 160 µm.
A Samsung S20 Fe smartphone was subsequently used, named in this study as image sensor 2 (IS2), with slow-motion recording capacity of 240 fps and resolution of 1080 x 1920 pixels, in addition to the Super Slow-Motion (SSM) mode with the ability to record at 960 fps and resolution of 720 x 1280 pixels. It is noteworthy that the recording mode time is limited to 0.5 seconds, and despite the short recording period, this is not a limiting factor for image processing using the PIV technique, since it obtains a video with approximately 560 frames. Several studies [
13,
14,
15,
16,
17] used up to 500 frames to process the PIV technique.
The smartphone was positioned 190 mm from the target for slow-motion recording at 240 fps, and the FOV obtained was 135 mm x 240 mm, while the spatial resolution was 64 pixels/mm² which corresponds to a linear pixel length of 125 µm. Then, in SSM mode and maintaining the target positioning distance of 190 mm, the FOV was maintained at 135 mm x 240 mm, but the spatial resolution goes to 28.44 pixels/mm², corresponding to the linear pixel length of 187 µm. It is possible to observe a comparison between the main characteristics of the image acquisition systems in
Table 1.
According to the guidelines on best practices for applying PIV/SPIV in towing tanks and cavitation tunnels [
9], the nominal spatial resolution value would be between 5 and 20 pixels/mm², and consequently the pixel length between 223 µm to 447 µm. However, another studies [
16,
17,
18,
19,
20] considered applying the PIV technique in a wind tunnel with different FOV, so that the pixel length varies between 5 µm and 200 µm.
Therefore, it can be said that the use of IS2 and IS1 guarantee processing conditions beyond those provided for in the ITTC guidelines, considering that image processing and analysis becomes more accurate the smaller the pixel length. In addition, the pixel length acquired in the settings falls within the range of sizes reported in the literature for applying the PIV technique in a wind tunnel.
2.4. Processing System
The PIVlab-MatLab® (version 2.56) application [
21] was used to perform the processing. Images acquired with both acquisition systems (IS1 and IS2) were analyzed with the same settings.
The IS2’s SSM function has the video acquisition limited to approximately 560 frames. The frameset was strategically divided into 3 parts of 180 frames, so the first and last third of the frameset were discarded, using only the central interval for processing. As the videos obtained in the IS1 and in the slow-motion mode of the IS2 do not have a recording time limitation, and consequently a limited number of frames, an acquisition time of approximately 5 seconds was defined using the central interval of 180 frames for analysis.
As the objective of this study is to evaluate the movement of the synthetic particles describing a known trajectory, an exclusion mask of the field external to the image of the plate in movement was created. Therefore, the processing result will only be presented in the area of interest of the plate’s rotational movement. In addition, it is possible to save computational processing time.
Time-resolved particle image velocimetry (TR-PIV) is based on a comparison between two subsequent images. It is possible to obtain the vector field of a given region through displacement and time variation between images. Several types of algorithms can estimate the displacement of a group of particles using cross-correlation techniques. The PIVlab-MatLab® application has three options of algorithms to perform the processing; in this study, the selected algorithm applies the cross-correlation function through the Fast Fourier Transform (FFT) method.
To configure this algorithm, it is necessary to scale the interrogation subareas with square dimensions (for example, 64 x 64, 32 x 32, 16 x 16 pixels) and also apply an overlapping factor. In addition, it is possible to perform multi-pass processing, which increases the probability of greater accuracy in the results [
21].
On the other hand, the PIVlab-MatLab® software has the option “configuration suggestion” to define the interrogation area. A quadrant within the FOV is selected and the algorithm measures particle size and density to propose a recommended configuration. The configuration is implemented through averaging based on displacement, particle quantity and experimental practice.
3. Results
This study is divided into three different analyses: section 3.1 analyzes the ability to use two different smartphones for image acquisition applied to the PIV technique; section 3.2 verifies the capacity in a single smartphone depending on changing the camera capture speed; and finally, in section 3.3 we evaluate the acquisition capacity of the smartphone which has the highest acquisition rate due to the increase in the flow rate of synthetic particles.
3.1. Comparative Analysis for Different Image Acquisition System
To analyze the velocimetry of particles with known displacement using the processing concepts of the PIV technique and the possibility of using easily accessible cameras, images were acquired with two different smartphone models: an Apple iPhone 7, called IS1, and a Samsung Galaxy S20 Fe, called IS2, both configured to capture images at a rate of 240 fps.
The synthetic image shown in
Figure 3(c) was considered to simulate the flow of particles. The angular speed of the plate was adjusted to 90, 180 and 360 RPM, whose values were previous calibrated using the tachometer. The application configuration to perform the processing was the Fast Fourier Transform (FFT) method, and the interrogation window was selected with three multi-passes (64 x 64, 32 x 32, and 16 x 16 pixels) with 50% overlap.
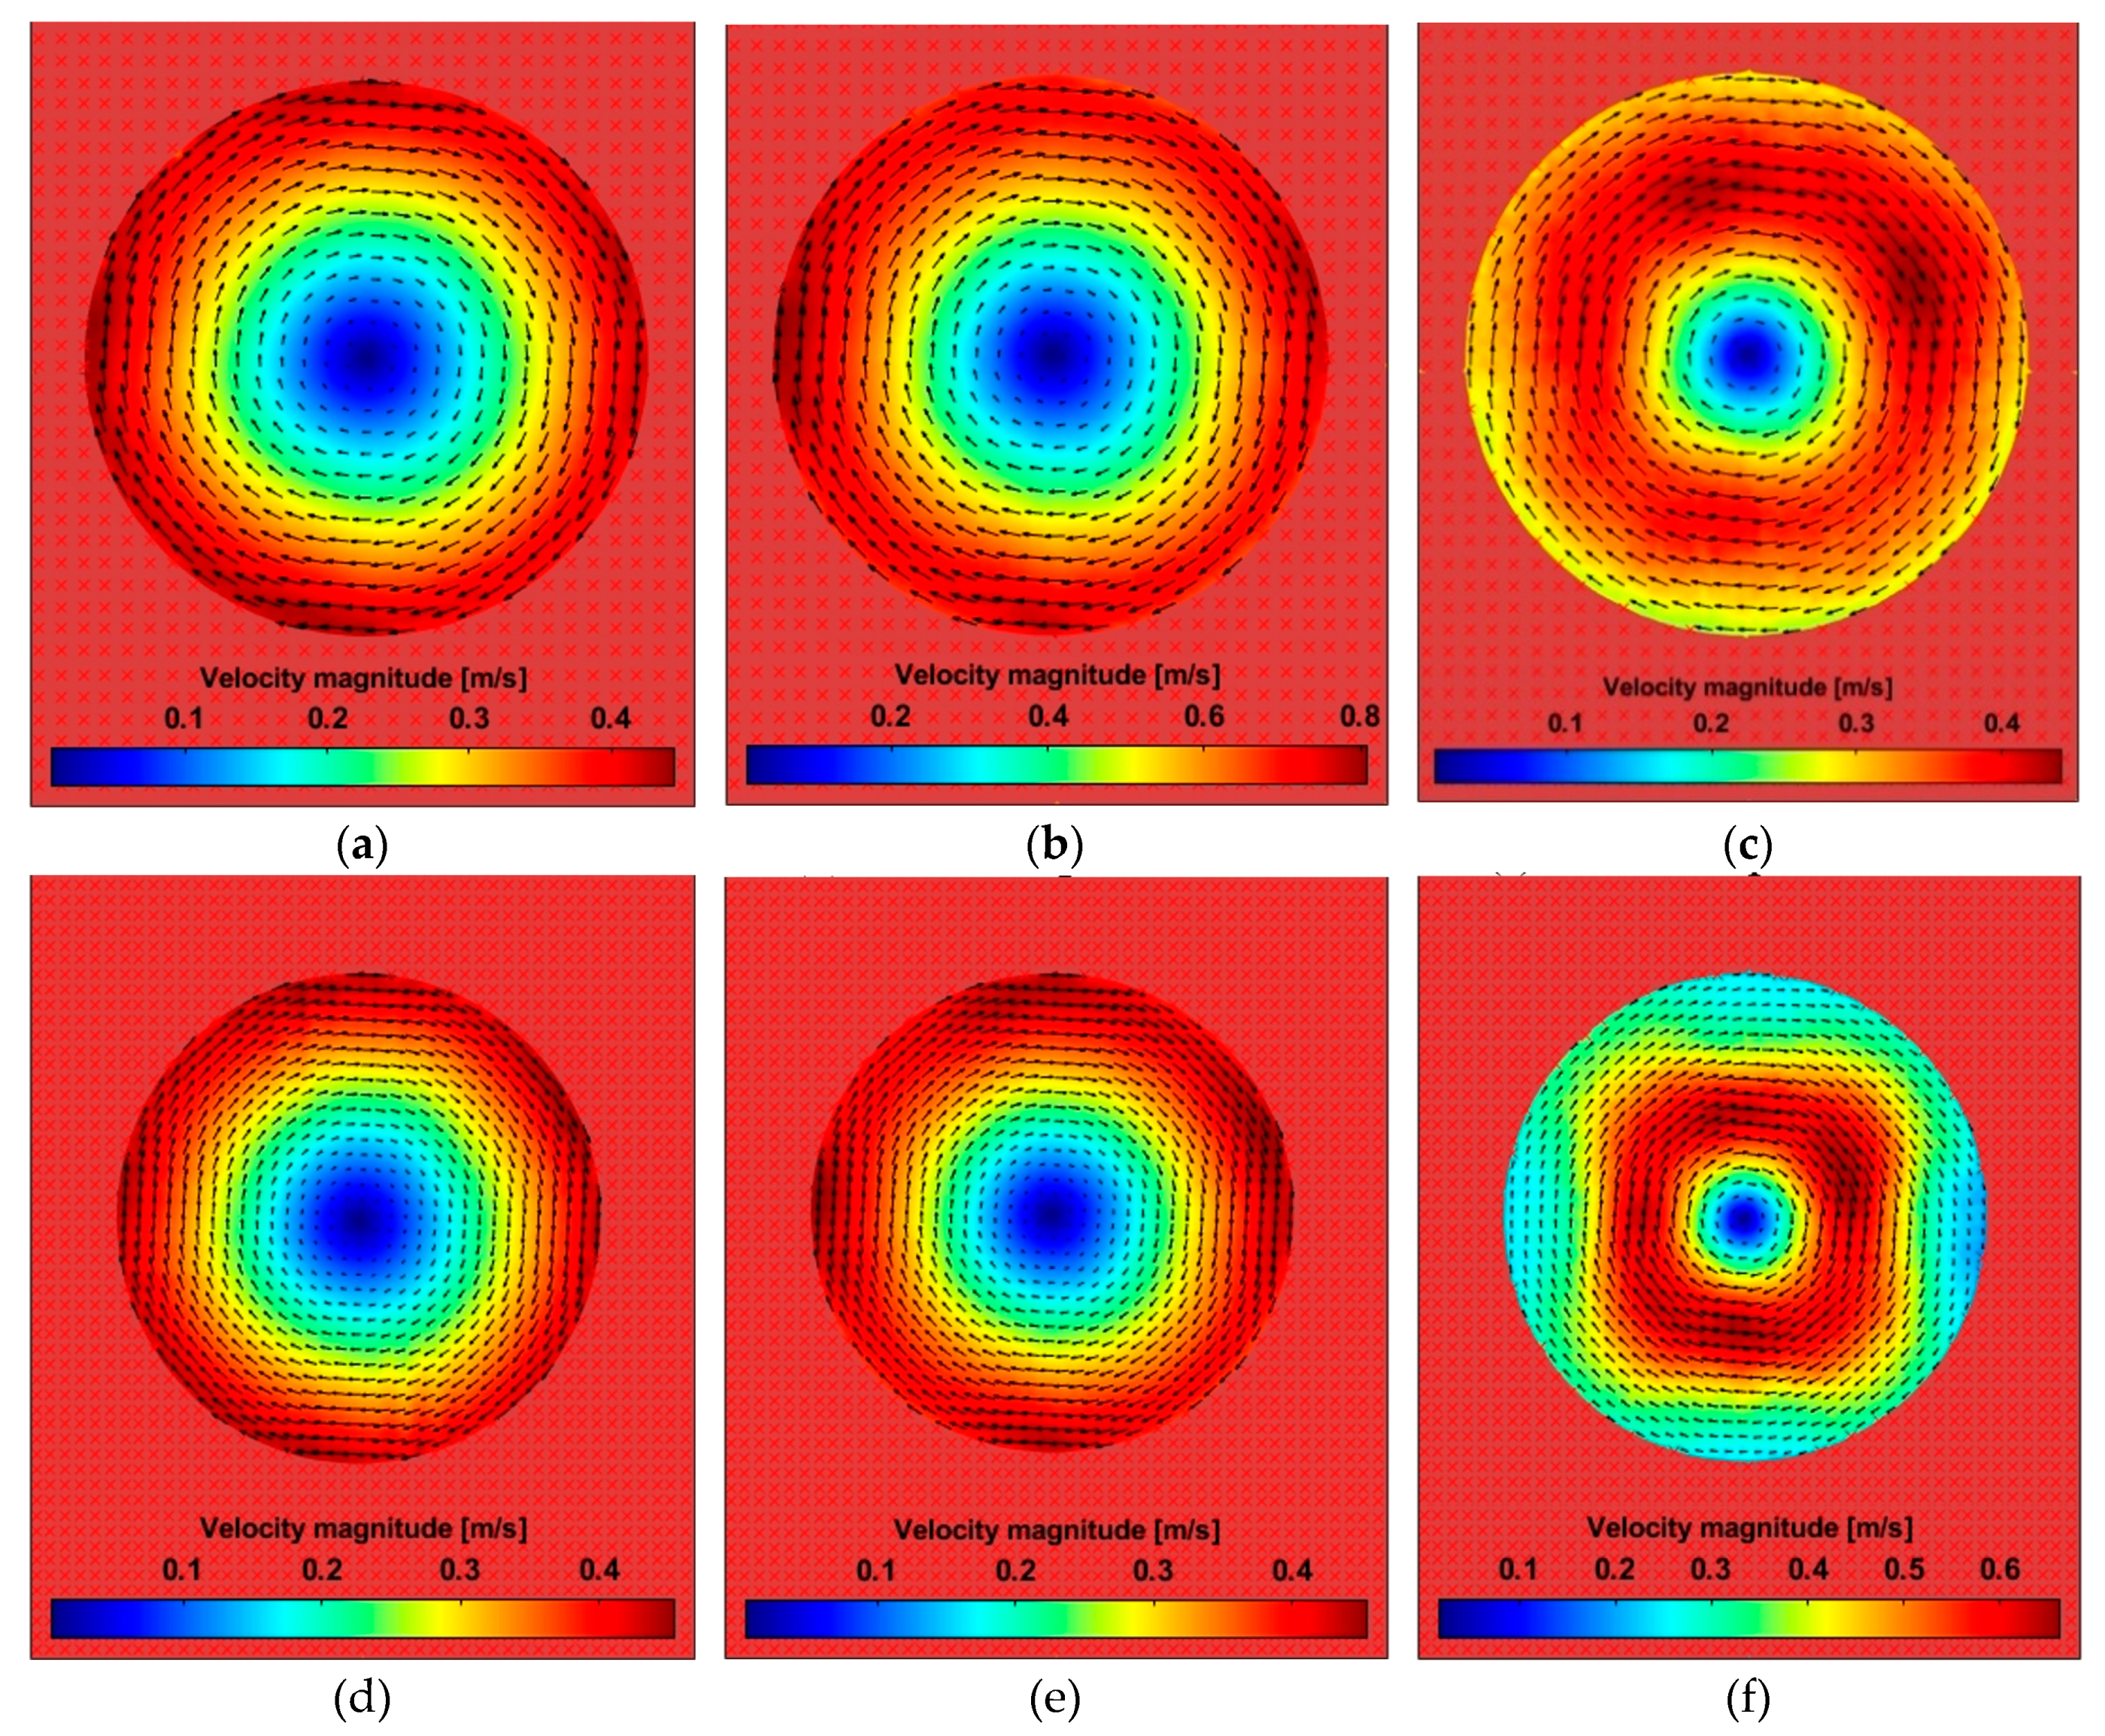
The qualitative results are shown in
Figure 5. The tangential velocity vectors for 90 RPM (
Figure 5 (a) and
Figure 5 (b)) and 180 RPM (
Figure 5 (d) and
Figure 5 (e)) are zero near the center of the plate and increase in magnitude moving to the edge.
On the other hand, the velocity vectors at 360 RPM (
Figure 5 (c) and
Figure 5 (f)) start with zero tangential velocity at the center, reaching the highest velocities in a region anterior to the edge of the plate. Moreover, a more pronounced drop in the magnitude of the tangential velocity vectors is observed for IS2 compared to IS1.
A quantitative analysis was performed by extracting vector data on an imaginary line, starting from the upper end of the circumference, passing through the center, and reaching the circumference lower end. The theoretical tangential velocity of a rotating plate can be easily calculated from the rotation frequency and the size of the plate using the Equation (1).
where
is the radius of the plate in meters and
is the plate rotation frequency in rotation per second (RPS).
Thus, a curve was also generated with the estimated tangential velocity for the points coinciding with the axis of the straight line drawn using the MatLab® software program.
One of the current alternatives for verifying and validating the PIV technique can be performed through computational fluid dynamics (CFD). In this case, it is possible to determine an absolute uncertainty limit for each velocity vector and a deviation about ±10% between PIV and CFD techniques was considered by studies reported in the literature [
22,
23].
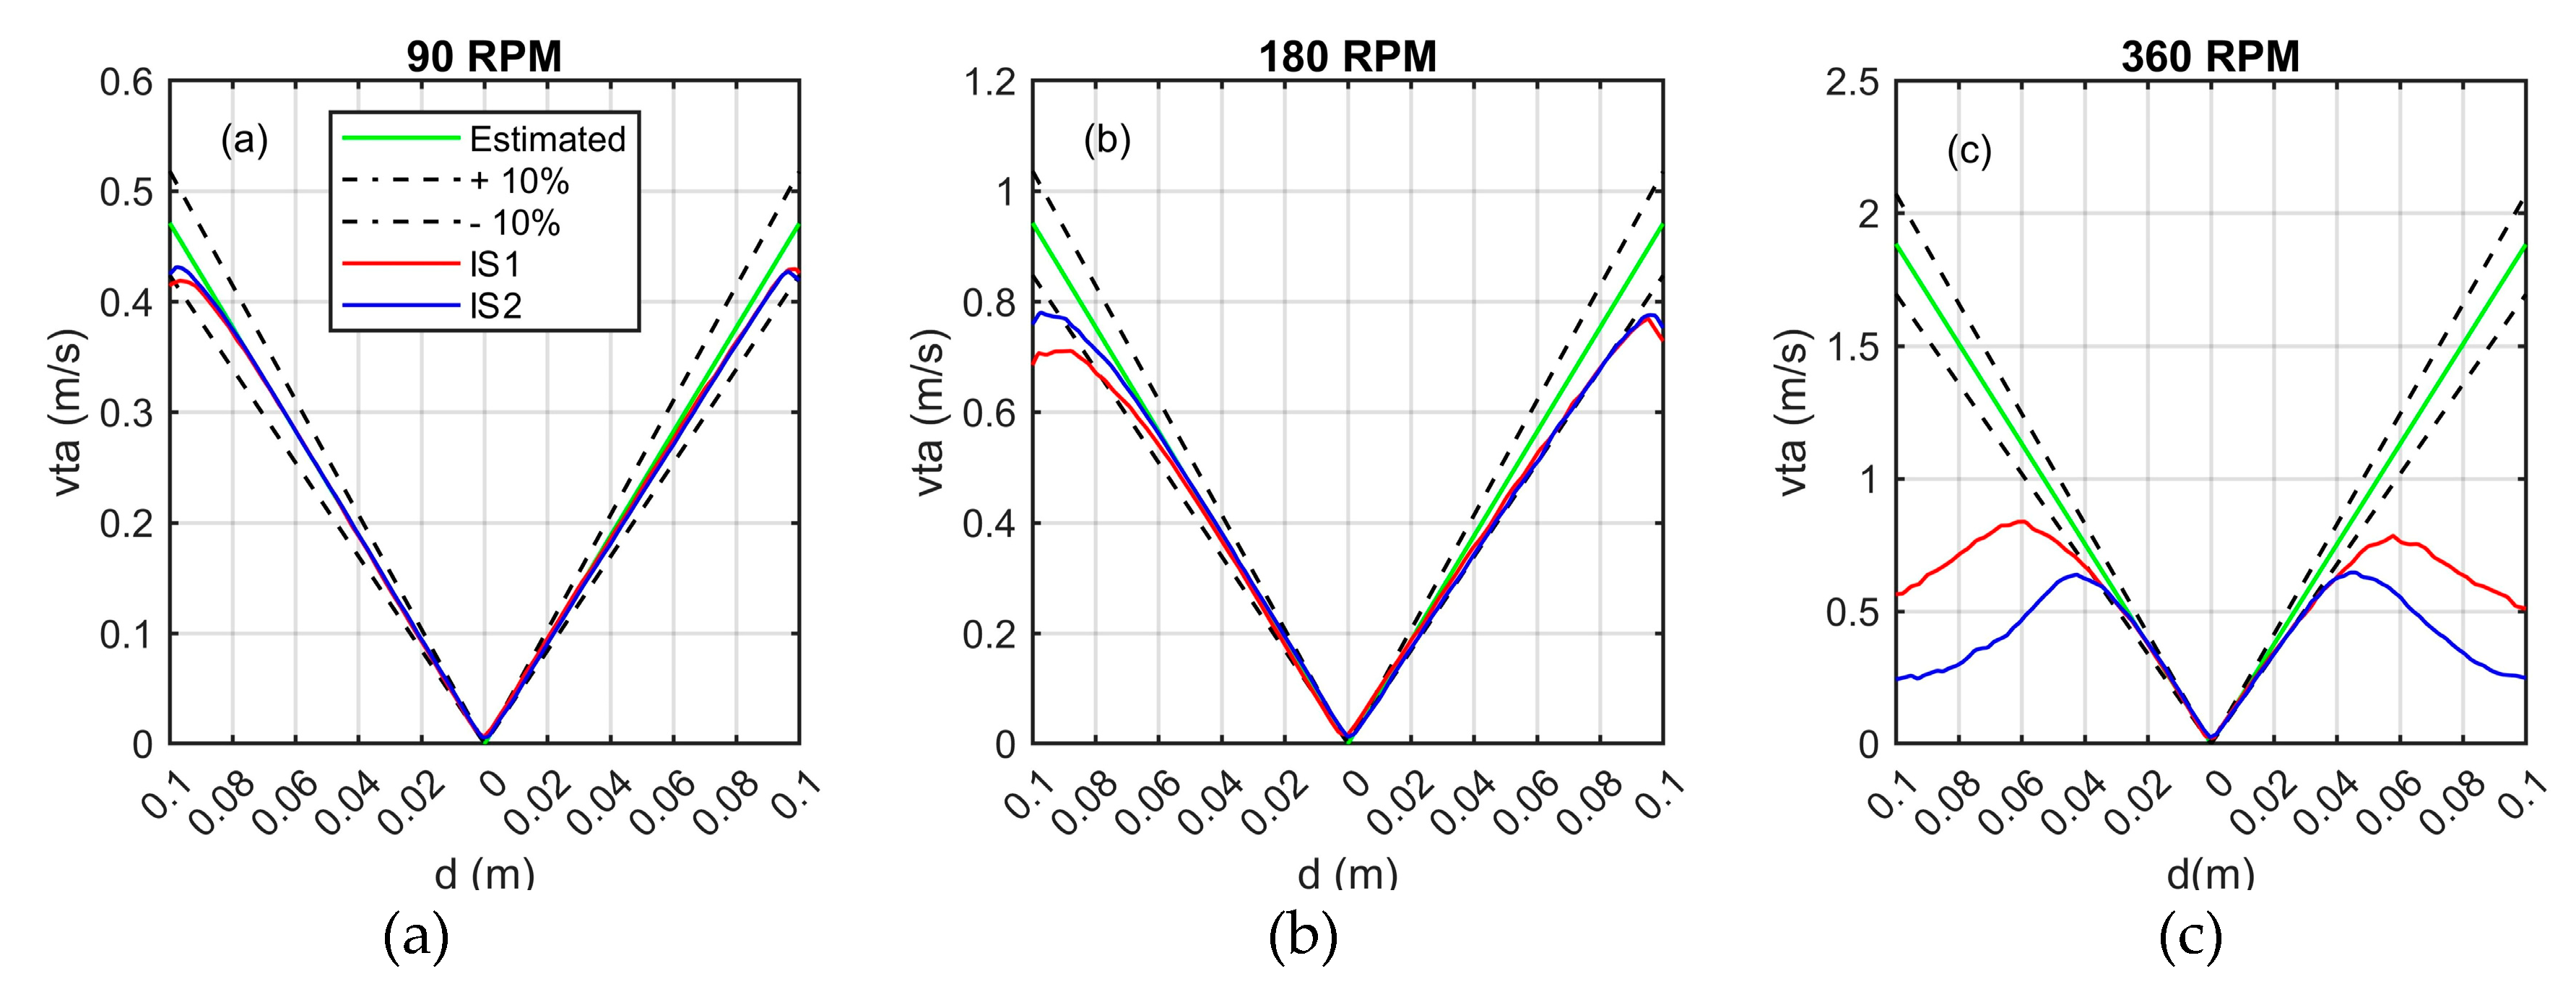
The absolute tangential velocity referring to the PIV technique results using the IS1 and IS2 acquisition systems, and the estimated tangential velocity for the angular velocities of 90 RPM, 180 RPM and 360 RPM can be seen in
Figure 6. In addition, the measurement deviation of ±10% on the estimated tangential velocity was represented as dashed lines.
Figure 6 (a) shows a good tangential velocity ratio for the entire evaluated section (the imaginary line) with angular velocity at 90 RPM.
It can be seen through
Figure 6(b) that the tangential velocity for 180 RPM showed a small deviation over the estimated value about 0.8 m/s, close to the edge of the plate. A small difference can be identified at the upper edge of the plate between the results obtained with IS1 and IS2, with the values obtained by IS2 being closer to the estimated velocity.
The results for the angular velocity of 360 RPM are shown in
Figure 6(c). In this case, both the acquisition performed by IS1 and IS2 showed divergent results after 0.6 m/s, equivalent to position 0.04 m on the plate diameter. In other words, both smartphones were unable to acquire coherent images beyond 0.6 m/s.
After these analyses, the capacity of reliable representation of the tangential velocity vectors through processing of the PIV technique using Smartphones is reduced with the increase of the angular velocity of the plate and according to the established experimental configurations. In addition, the two IS1 and IS2 models did not show significant differences that would influence the measurement range.
3.2. Comparative Analysis for Different Image Acquisition Speed
After comparing different image acquisition systems at a fixed acquisition rate (240 fps), this section presents the results obtained considering only the IS2 smartphone, through which it is possible to adjust different capture modes: slow motion (240 fps) and SSM (960 fps).
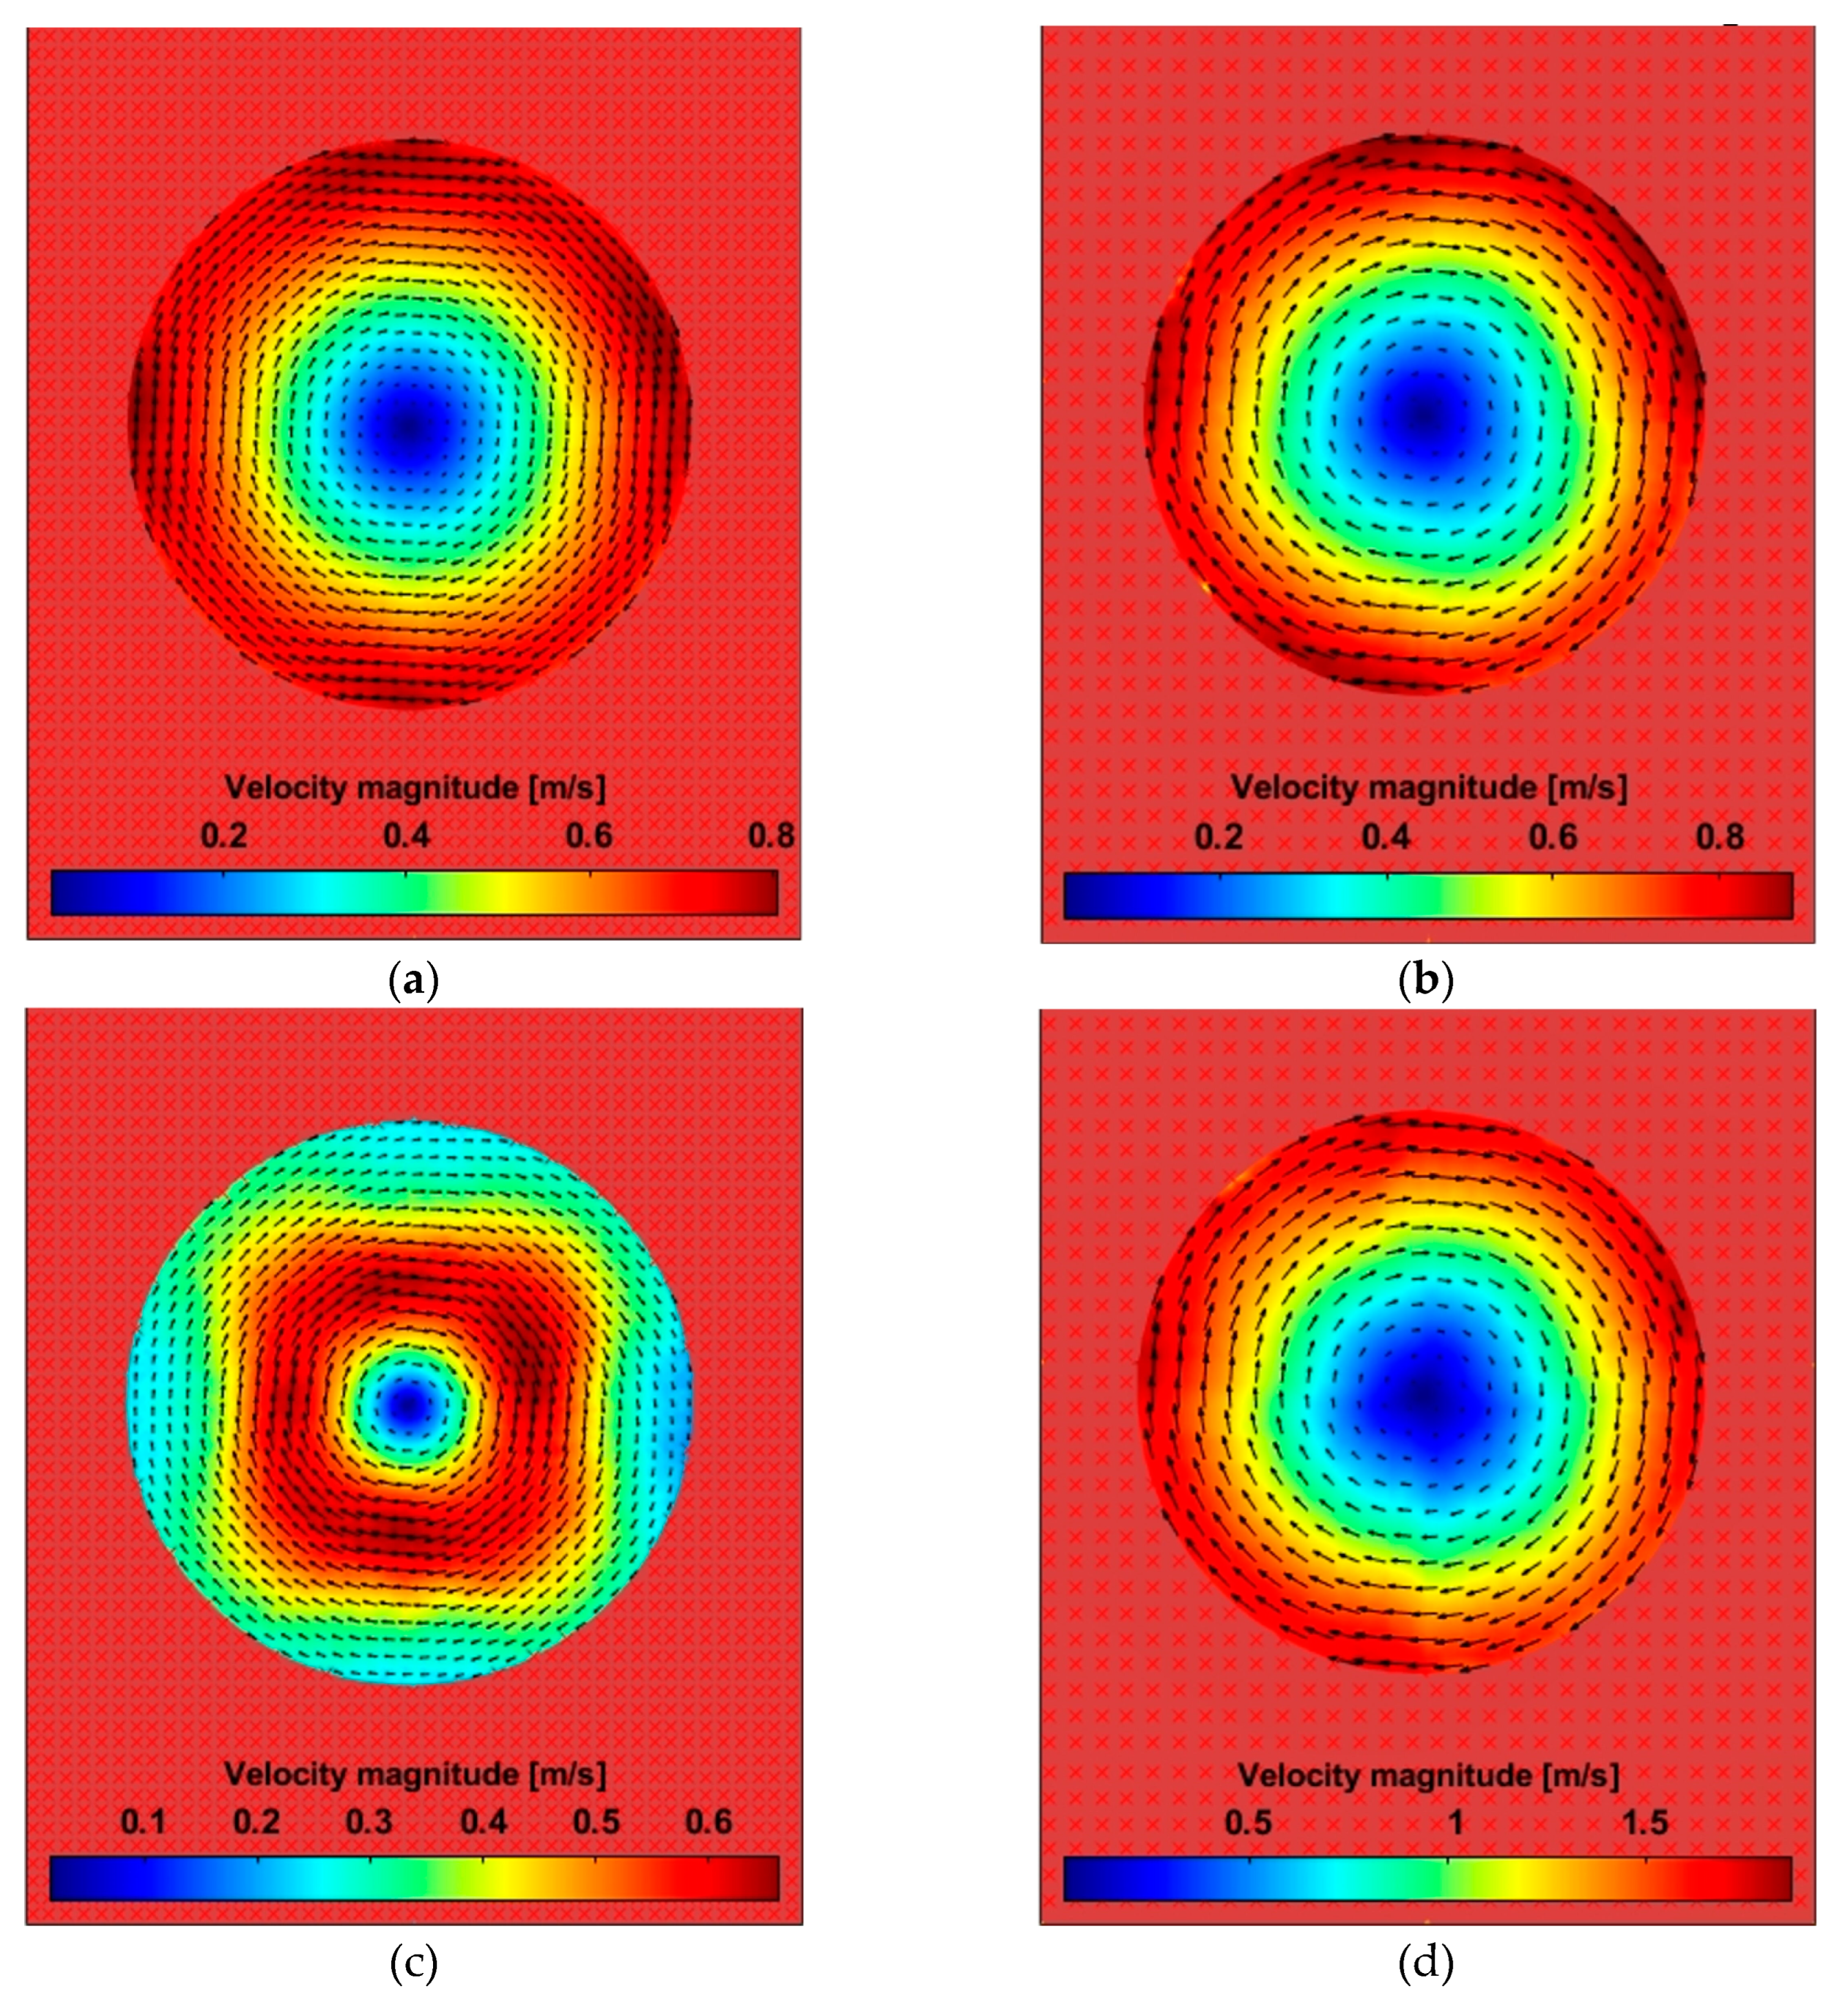
Thus, four tests were proposed with two angular velocity adjustments (180 and 360 RPM) for each available capture mode to evaluate the impact of increasing the acquisition rate. The following designation of (a) - (d) was applied for each test: (a) IS2 – 180 RPM - 240 fps; (b) IS2 – 180 RPM - 960 fps; (c) IS2 – 360 RPM - 240 fps; (d) IS2 – 360 RPM - 960 fps.
Figure 7 presents the result of the velocity fields obtained for the four proposed configurations.
Except for configuration (c), a positive gradient of vector fields from the center to the edges of the plate are observed. This evidences a limiting factor for applying the PIV technique considering an acquisition rate of 240 fps.
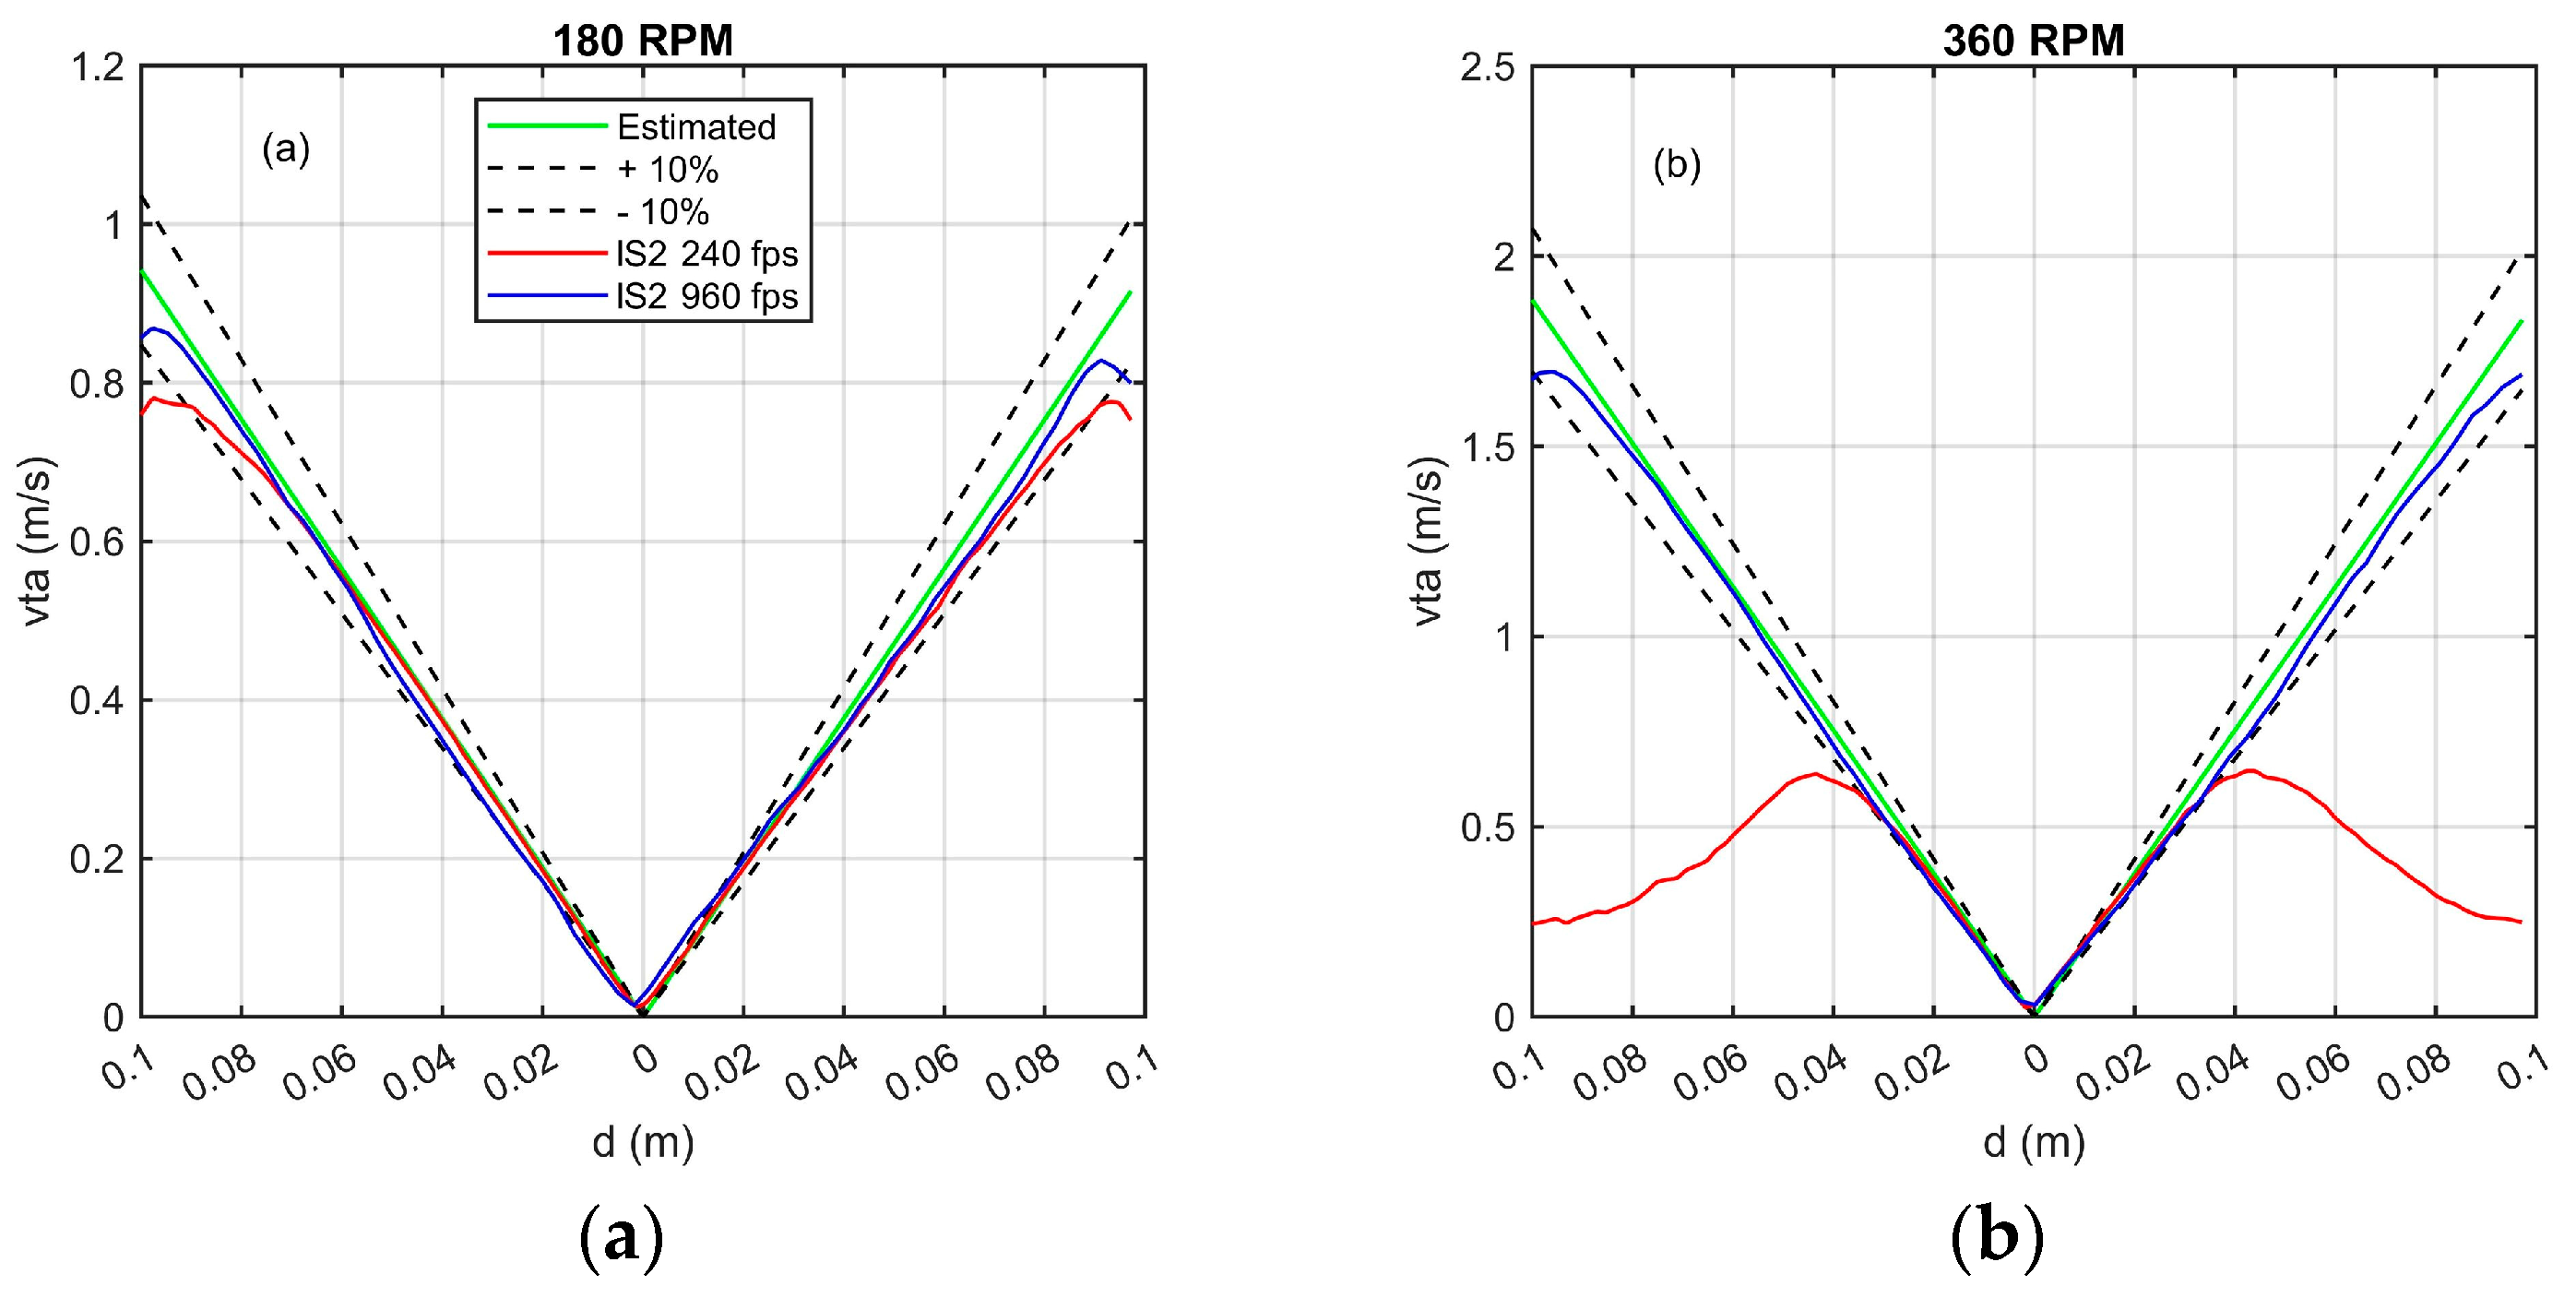
Figure 8 presents the graphical results of tangential velocity obtained with the PIVlab-MatLab® application, in addition to the estimated tangential velocity along the diametral position of the plate and the deviation considered in ±10%. The image acquisition for the angular velocity of 180 RPM (
Figure 8(a)) at 240 fps presented a tendency of an estimated curve up to approximately 0.06 m of diametral position equivalent to a tangential velocity of 0.7 m/s; meanwhile, the acquisition with 960 fps has a linear trend of the estimated value up to 0.095 m of the plate diameter, equivalent to a tangential velocity about 0.85 m/s.
It is also possible to visualize a deviation of the result in relation to the trend of the estimated value in
Figure 8(a), relating the upper and lower part of the plate. The top part of the plate should give identical or similar results to the bottom part of the plate, as the circular motion is uniform, and the image sensor is centered with the plate. Despite being a systematic error, this fact is still unknown, and may be related to some noise in the images arising from non-uniformity in the lighting on the plate, suggesting that it should be better evaluated in future studies.
The absolute tangential velocity observed in the test with an acquisition rate of 240 fps for an angular velocity of 360 RPM (
Figure 8(b)) trends to the estimated velocity up to approximately 0.04 m of diametral position, equivalent to the tangential velocity of 0.6 m/s. The acquisition with 960 fps presented a tangential velocity consistent with the estimate up to approximately 0.095 m diametral position, equivalent to a tangential velocity of 1.7 m/s. These values prove the qualitative result observed in
Figure 7(c) and in
Figure 7(d), evidencing the significant difference in the vector field for the acquisition rates of 240 fps and 960 fps.
Furthermore, it is possible to visualize a small deviation in the diametral end of the plate in both
Figure 8(a) and
Figure 8(b). This fact occurs due to the masking procedure of the remainder of the visual field. Therefore, the interrogation intervals at the edge of the plate are interpolated with null vectors from neighboring interrogation windows.
3.3. Comparative Analysis for Different Angular Velocities in SSM Mode using IS2
The highest image recording rate available in the experimental apparatus of 960 fps was evaluated and the analysis was conducted with different angular speeds of the plate. The aim was to increase the angular velocity of the plate to a value in which the observed results of the vector field begin to diverge from the estimated tangential velocity according to the known displacement.
Commercial systems provide specific equipment to apply the PIV technique, among which it is possible to highlight the high-speed camera. As an example, a study [
24] reports the use of a camera performing image acquisition at 500,000 fps to analyze the core of a turbulent round jet. However, with a low-cost approach, we used the Samsung Galaxy S20 Fe Smartphone in SSM mode with the ability to capture 960 fps, and this smartphone is currently among the devices with the highest capture speeds.
The angular velocities adjusted for this analysis were 90, 180, 360, 720, 960 and 1200 RPM. The acquisitions were performed in increasing order of speed while the other configurations were maintained, including the Smartphone positioning remaining unchanged between experiments.
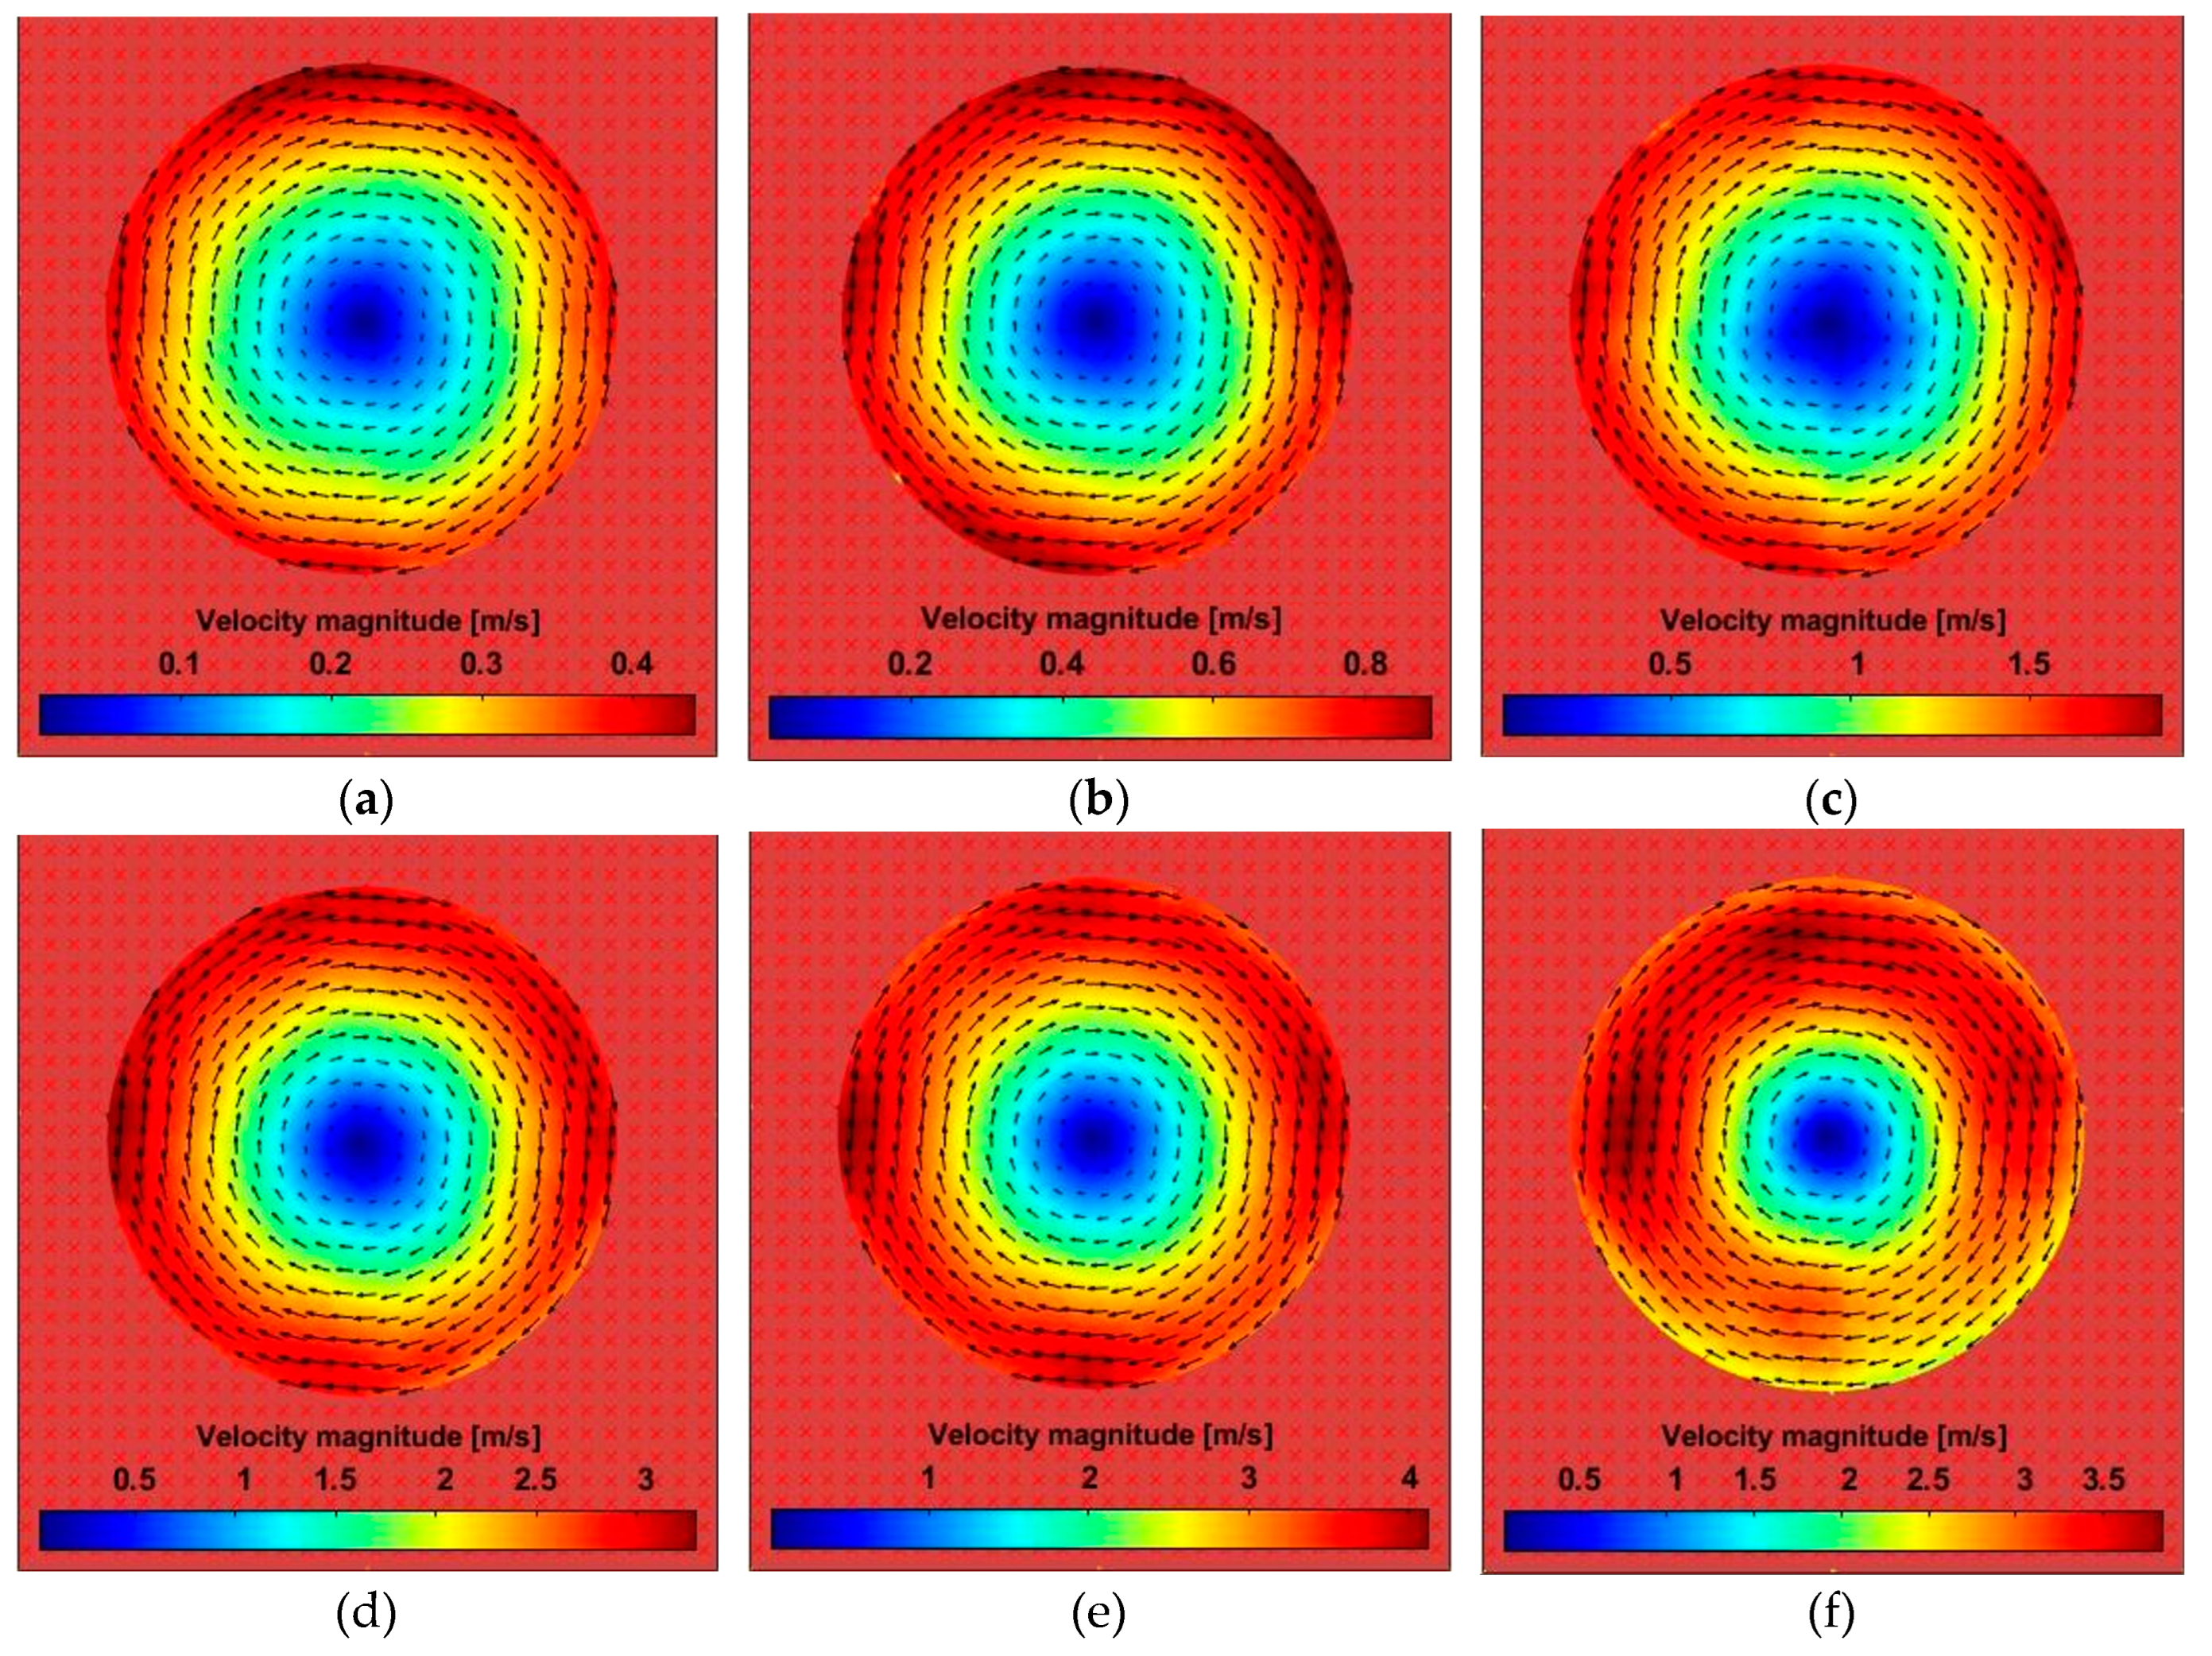
Figure 9 (a) to (f) present the qualitative results of the plate vector field for the different adjusted angular velocities.
Figure 9 (a), (b), (c) and (d) correspond to rotational speeds of 90, 180, 360, and 720 RPMs, respectively. The vector field of the plate showed an increasing result from the center of the plate to the end consistent with physical reality. Furthermore, as these experiments used a 100% increment in velocity of the previous experiment, the absolute velocity followed the coherence of the increment for the four velocity levels.
In addition,
Figure 9 (e) refers to the angular velocity of the plate at 960 RPM, in which the vector field is increasing between the center and the edge of the plate; however, it is possible to state that the maximum absolute tangential velocity is not consistent with reality physics, because the result is not proportional to the increments of the previous angular velocities.
Finally,
Figure 9 (f) used the plate rotation speed at 1200 RPM, resulting in a heterogeneous velocity field for the same diametral position. Furthermore, the verified speed is similar to Figure 11(e) with 960 RPM. Thus, it is considered totally uncertain and unnecessary to carry out acquisitions with rotation speeds greater than 1200 RPM, as the measurement system was not capable of reproducing effective results.
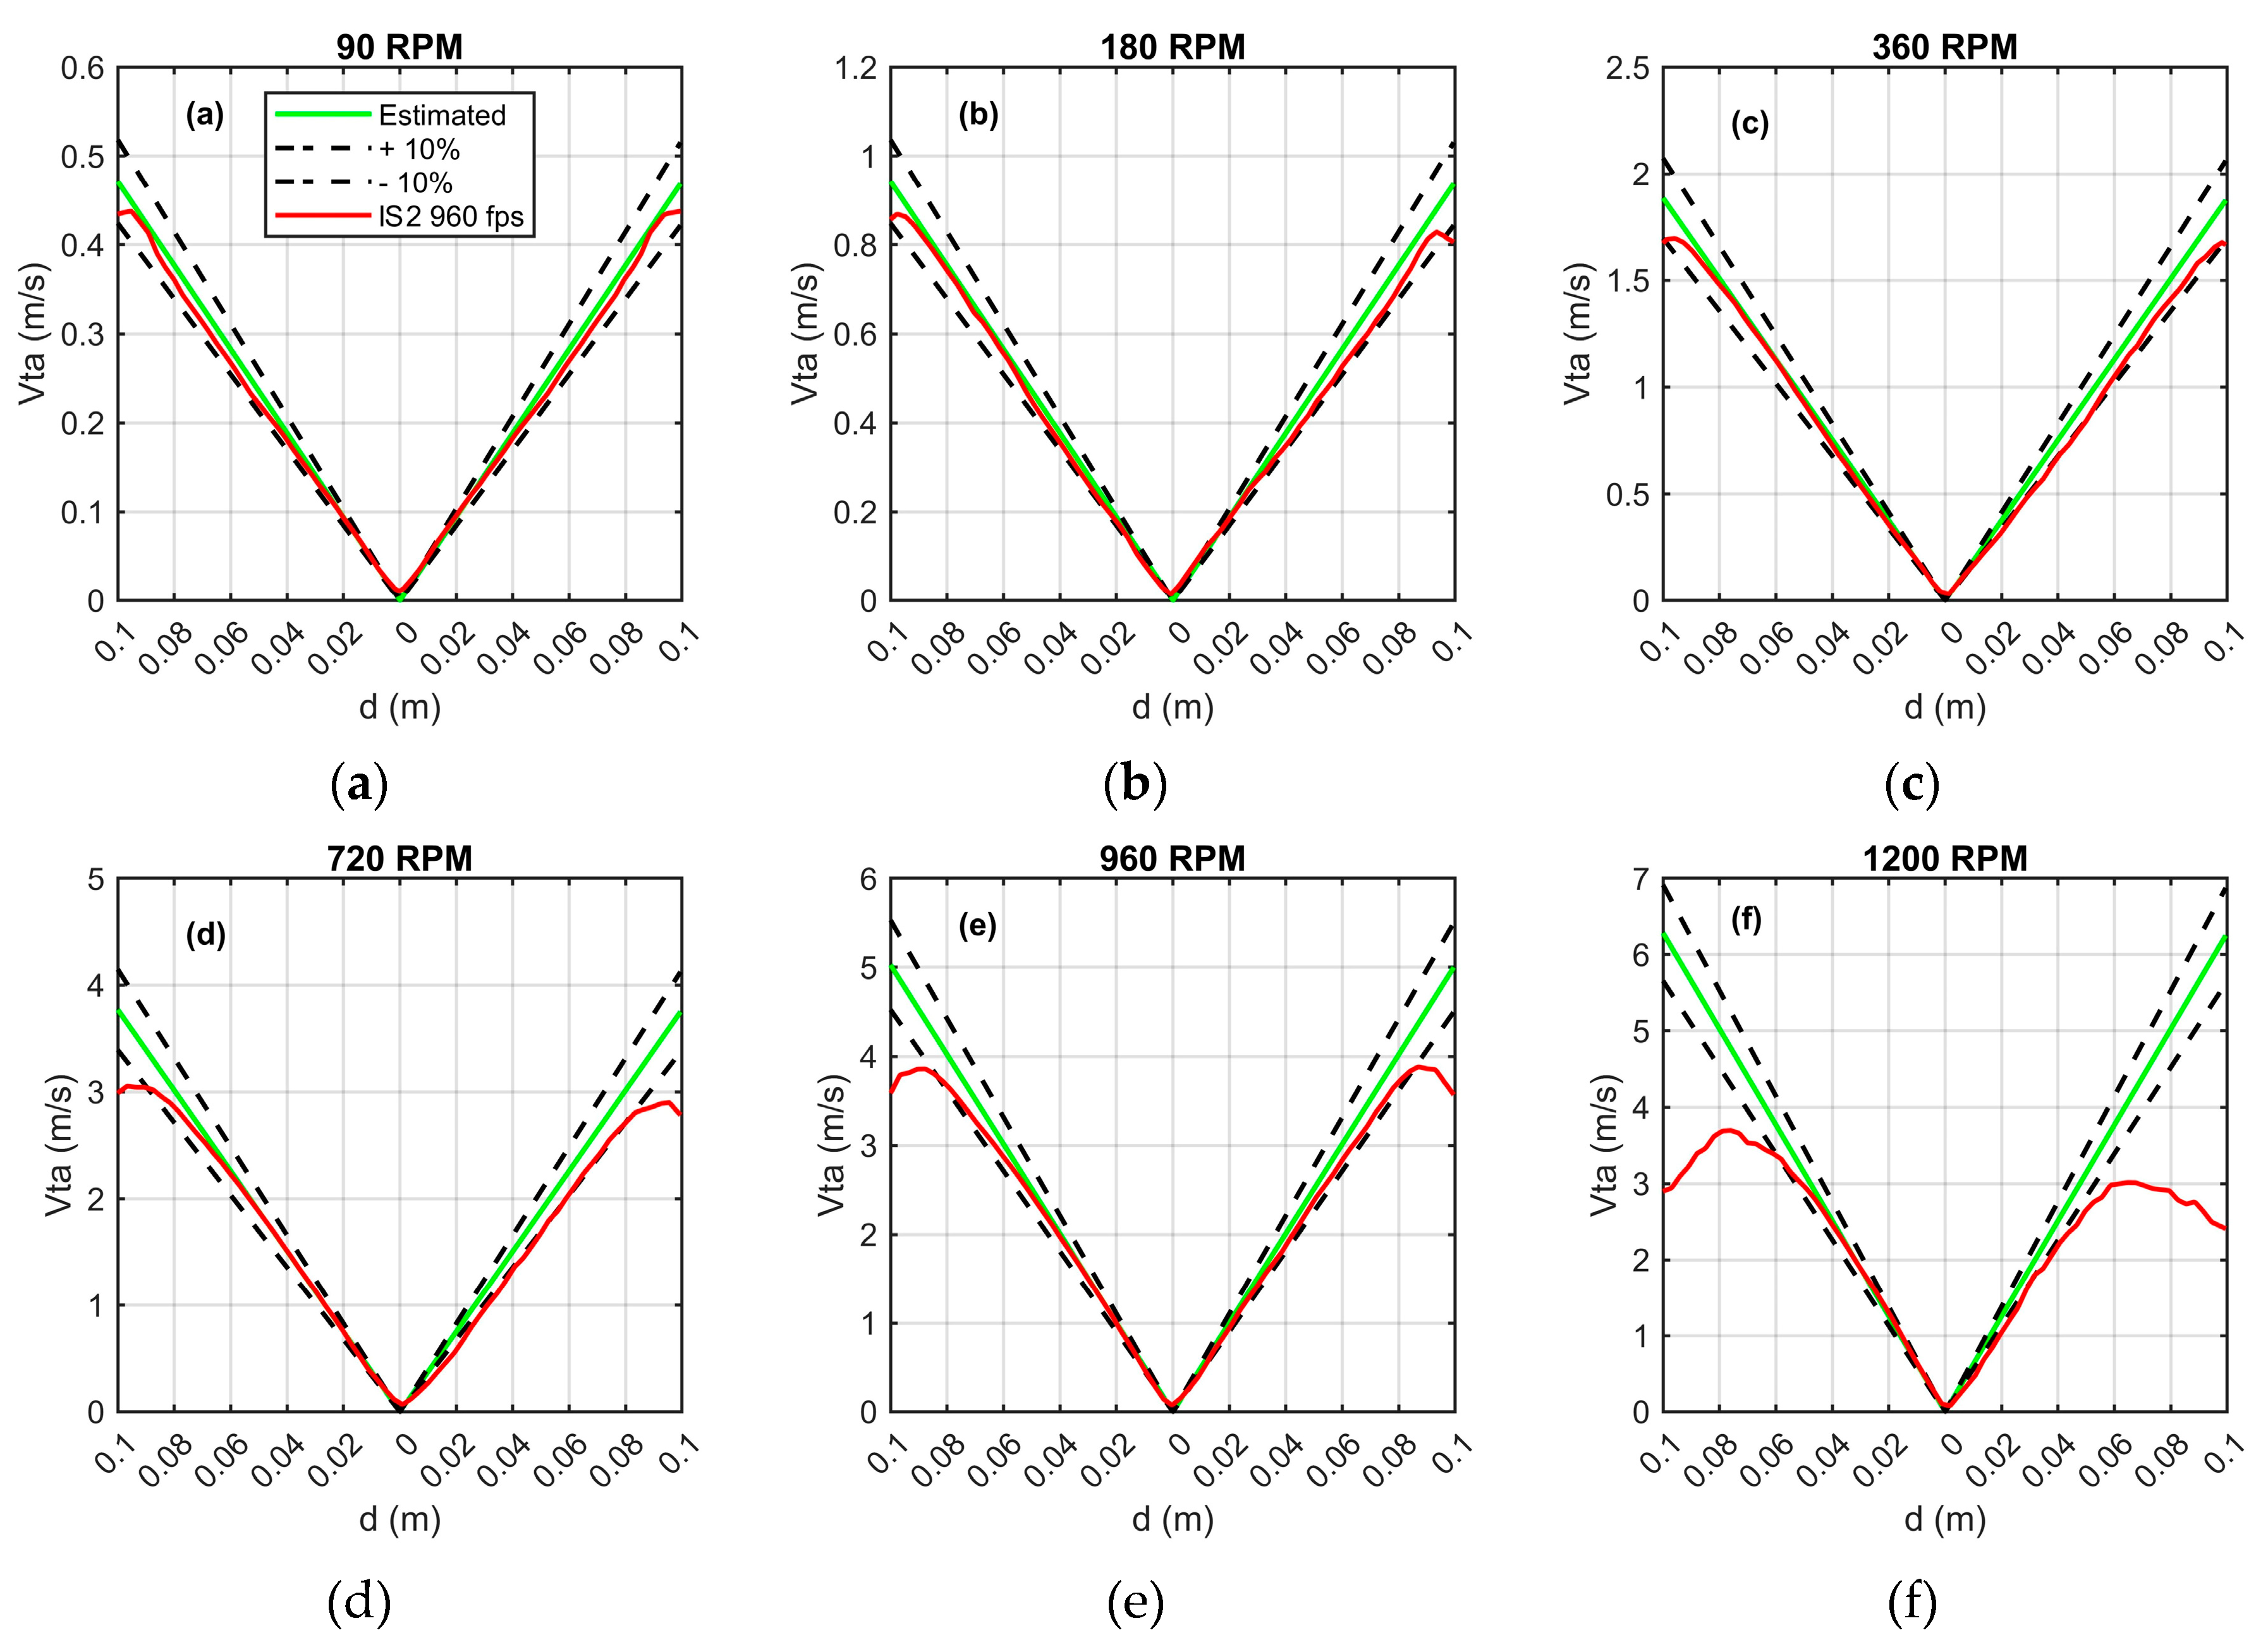
It is possible to observe the quantitative results obtained from the corresponding analysis of
Figure 10 (a) to
Figure 10 (f). Analyzing
Figure 10 (a), (b), (c) and (d) for angular plate speeds at 90 RPM, 180 RPM, 360 RPM and 720 RPM, respectively, the tangential velocity increase as the angular velocity increases, reaching a maximum value at the edge of the plate.
However, for 960 RPM in
Figure 10 (e), the maximum tangential velocity was approximately 3.8 m/s, corresponding to approximately 0.08 m in the plate diameter. The maximum tangential velocity obtained with an angular velocity of 1200 RPM in
Figure 10 (f) was 3.6 m/s in the upper part and 3 m/s in the lower part of the plate. In this case, and similarly to the qualitative analysis of
Figure 9 (f), there was no uniformity throughout the diametral range of the plate for the angular speed of 1200 RPM. Thus, the measurement system is unable to provide consistent results for the entire area of the plate due to the increase in the displacement speed of the particles. In turn, it is possible to visualize that the deviation of the tangential velocity, considering the deviation of ± 10 %, begins around 3.5 m/s for both cases, 960 RPM and 1200 RPM.
4. Discussion
The image velocimetry analysis of synthetic particles with known displacement is opportune to evaluate the applicability of the PIV technique using alternative methods for image acquisition, such as the use of smartphones. In addition, several software programs and algorithms can be analyzed and validated using known displacement of synthetic particles. In this study, three different analyzes were performed.
The first analysis compared the use of two image acquisition systems, called IS1 and IS2, with an acquisition rate of 240 fps. In this case, both models presented satisfactory results and the measurement range achieved was approximately 0.7 m/s. However, it is important to emphasize that the difference obtained from the beginning of the deviation can be related to the resolution difference of the images between the devices, or even to the algorithm used by the manufacturer. Nevertheless, the measurement ranges up to 0.08 m of plate diameter for the two smartphones are similar.
The second analysis only considered the use of IS2, comparing the acquisition mode in slow motion (240 fps) with the SSM acquisition mode (960 fps). While the acquisition with 240 fps showed deviations from the estimated velocity after a value around 0.6 m/s, the results in SSM mode (960 fps) are consistent up to the maximum admitted velocity of 1.8 m/s, or plate angular speed at 360 RPM.
The third analysis compared different angular speeds of the plate using the highest image acquisition rate of IS2, which was in SSM mode. According to the presented results, the tangential velocity of the synthetic particles for the analyzes with angular velocities of 90, 180, 360 and 720 RPM was similar to the estimated value. In addition, it was observed deviations for tangential velocities greater than 3.5 m/s in the 960 RPM and 1200 RPM setups. Thus, according to the characteristics and experimental configurations, we assume that the proposed PIV measurement system was able to reproduce velocimetry results up to 3.5 m/s, or up to 3 m/s assuming a conservative analysis. However, an experimental procedure that guarantees enough samples for statistical conclusions must be considered.
Finally, it is feasible to use smartphones for analyzing the PIV technique for educational purposes, in addition to the possibility of performing analyzes with low flow rates.
As future work, it would be interesting expand the study to different diameters and concentration of synthetic particles in the disk, evaluate the use of smartphones as image acquisition systems in an PIV application in a wind tunnel, respecting the limits of flow velocity, dimensions and particle concentration reported in this article, and propose an experimental procedure for applying the apparatus presented in fluid mechanics teaching activities.
Author Contributions
Conceptualization, A.G.G., S.K.J and J.P.S.F.; methodology, S.K.J and J.P.S.F.; data acquisition, A.G.G. software, A.G.G.; validation, A.G.G., S.K.J. and J.P.S.F.; investigation, A.G.G.; data curation, A.G.G.; writing—original draft preparation, A.G.G.; writing—review and editing, J.P.S.F., S.K.J AND F.P.M; visualization, J.P.S.F.; supervision, J.P.S.F.; project administration, F.P.M.; funding acquisition, F.P.M. All authors have read and agreed to the published version of the manuscript.
Funding
This research was funded by FURNAS Centrais Elétricas and Research and Technological Development Program (P&D) of ANEEL, grant number ANEEL PD-00394-1906/2019.
Institutional Review Board Statement
Not applicable.
Data Availability Statement
The data presented in this study are available on request from the corresponding author. The data are not publicly available due to contractual restrictions established with the funder.
Acknowledgments
The authors would like to thank FURNAS Centrais Elétricas and the “Programa de Pesquisa e Desenvolvimento Tecnológico” (P&D) of the ANEEL for the financial support. The authors are grateful to EMC-UFG for the available infrastructure as well as for the administrative and technical support.
Conflicts of Interest
The authors declare no conflict of interest. The funders had no role in the design of the study; in the collection, analyses, or interpretation of data; in the writing of the manuscript; or in the decision to publish the results.
References
- Mayinger, F.; Feldmann, O. Optical Measurements, Techniques and Applications, 2nd ed.; Springer. New York, USA, 2001. [CrossRef]
- Dracos, T. Three-Dimensional Velocity and Vorticity Measuring and Image Analysis Techniques, 1st ed.; Springer, Zurich Switzerland, 1996. [CrossRef]
- Sijie, F. , Pascal, H. B., Christian, M.; Particle tracking velocimetry for indoor airflow field: A review. Build Environ 2015, 87, 34–44. [Google Scholar] [CrossRef]
- Girardi, G.A.; Kitatani Júnior, S.; Fonseca, J.P.S. A review of particle image velocimetry techniques. In Proceedings of the 26th International Congress of Mechanical Engineering, Florianópolis, Brazil, 22-26 November 2021. [Google Scholar] [CrossRef]
- Cierpka, C.; Hain, R.; Buchmann, N.A. Flow visualization by mobile phones cameras. Exp Fluids 2016, 57, 108. [Google Scholar] [CrossRef]
- Käufer, T.; König, J.; Cierpka, C. Stereoscopic PIV measurements using low-cost action cameras. Exp Fluids 2021, 62, 57. [Google Scholar] [CrossRef]
- Aguirre-Pablo, A.A.; Alarj, M.K.; Li, E.Q.; Hernández-Sánchez, J.F.; Thoroddsen, S.T. Tomographic particle image velocimetry using smartphones and colored shadows. Sci Rep 2017, 7, 3714. [Google Scholar] [CrossRef] [PubMed]
- Cierpka, C.; Otto, H.; Poll, C.; Huther, J.; Jeschke, S.; Mader, P. SmartPIV: flow velocity estimates by smartphones for education and field studies. Exp Fluids 2021, 62, 172. [Google Scholar] [CrossRef]
- ITTC – International Towing tank conference (2014). Recommended Procedures and Guidelines. Guideline on Best Practices for the Applications of PIV/SPIV in Towing Tanks and Cavitation Tunnels. Available online: https://www.ittc.info/media/9587/75-02-01-04.pdf (accessed on 28 July 2023).
- Raffel, M.; Willert, C.E.; Scarano, F.; Kähler, C.J.; Wereley, S.T.; Kompenhans, J. Particle Image Velocimetry: A Practical Guide, 3rd ed.; Springer Cham, Switzerland, 2018; pp. 218–219. [CrossRef]
- Foucaut, J.M.; Miliat, B.; Perenne, N.; Stanislas, M. Characterization of different PIV algorithms using the EUROPIV synthetic image generator and real images from a turbulent boundary layer. In Particle Image Velocimetry: Recent Improvements, 1st ed.; : Stanislas, M., Westerweel, J., Kompenhans, J., Eds.; Springer-Verlag Berlin Heidelberg: New York, USA, 2004; Volume 2, pp. 163–185. [Google Scholar] [CrossRef]
- Willert, C.E.; and Gharib, M. Digital particle image velocimetry. Exp Fluids 1991, 10, 181–193. [Google Scholar] [CrossRef]
- Wei, X.; Huang, B.; Kanemoto, T.; Wang, L. Near wake study of counter-rotating horizontal axis tidal turbines based on PIV measurements in a wind tunnel. J Mar Sci Technol 2017, 22, 11–24. [Google Scholar] [CrossRef]
- Ullah, A.H.; Rostad, B. L.; Estevadeordal, J. Three-cylinder rotating system flows and their effects on a downstream dimpled airfoil. Exp Therm Fluid Sci 2021, 124, 110343. [Google Scholar] [CrossRef]
- Al-Garni, A.M.; Bernal, L.P. Experimental study of a pickup truck near wake. J Wind Eng Ind Aerodyn 2010, 98, 100–112. [Google Scholar] [CrossRef]
- Olasek, K.; Karczewski, M. Velocity data-based determination of airfoil characteristics with circulation and fluid momentum change methods, including a control surface size independence test. Exp Fluids 2021, 62, 108. [Google Scholar] [CrossRef]
- Bardera, R.; Rodríguez-Sevillano, Á.; García-Magariño, A. Aerodynamic investigation of a morphing wing for micro air vehicle by means of PIV. Fluids 2020, 5, 191. [Google Scholar] [CrossRef]
- Giovannetti, L. M.; Banks, J.; Turnock, S.R.; Boyd, S.W. Uncertainty assessment of coupled digital image correlation and particle image velocimetry for fluid-structure interaction wind tunnel experiments. J Fluids Struct 2017, 68, 125–140. [Google Scholar] [CrossRef]
- Faria, A. F.; Avelar, A.C.; Fisch, G. Wind tunnel investigation of the wind patterns in the launching pad area of the Brazilian Alcântara Launch Center. J of Aerosp Technol Manag 2019, 11, e0719. [Google Scholar] [CrossRef]
- Tominaga, Y.; Okaze, T.; Mochida, A.; Sasaki, Y.; Nemoto, M.; Sato, T. PIV measurements of saltating snow particle velocity in a boundary layer developed in a wind tunnel. J Vis 2013, 16, 95–98. [Google Scholar] [CrossRef]
- Thielicke, W.; Stamhuis, E.J. PIVlab – Towards user-friendly, affordable and accurate digital particle image velocimetry in MATLAB. J Open Res Softw 2014, 2, e30. [Google Scholar] [CrossRef]
- Ligus, G.; Wasilewski, M.; Kołodziej, S.; Zając, D. CFD and PIV investigation of a liquid flow maldistribution across a tube bundle in the shell-and-tube heat exchanger with segmental baffles. Energies 2020, 13, 5150. [Google Scholar] [CrossRef]
- Smith, L.D., III; Conner, M.E.; Liu, B.; Dzodzo, B.; Paramonov, D.V.; Beasley, D.E.; Langford, H.M.; Holloway, M.V. Benchmarking computational fluid dynamics for application to PWR fuel. In Proceedings of the 10th International Conference on Nuclear Engineering, Virginia, USA, 14–18 April 2002. pp. 823–830. [CrossRef]
- Geschwindner, C.; Westrup, K.; Dreizler, A.; Bohm, B. Ultra-high-speed time-resolved PIV of turbulent flows using a continuously pulsing fiber laser. Exp Fluids 2022, 63, 75. [Google Scholar] [CrossRef]
|
Disclaimer/Publisher’s Note: The statements, opinions and data contained in all publications are solely those of the individual author(s) and contributor(s) and not of MDPI and/or the editor(s). MDPI and/or the editor(s) disclaim responsibility for any injury to people or property resulting from any ideas, methods, instructions or products referred to in the content. |
© 2023 by the authors. Licensee MDPI, Basel, Switzerland. This article is an open access article distributed under the terms and conditions of the Creative Commons Attribution (CC BY) license (http://creativecommons.org/licenses/by/4.0/).
