
Submitted:
23 August 2023
Posted:
25 August 2023
Read the latest preprint version here
Abstract
Real-time monitoring the freshness of food that stored in refrigerator is of great significance to alarm the potential food spoilage and prevent severe health problems. Among those frequently reported methods, discriminating the food freshness through tracking volatile compounds receives extensive attention. Nevertheless, the ambient environment of low temperature (normally below 4oC) and high humidity (90% R.H.) as well as poor selectivity in sensing gas species still remain the challenge. In this research, an integrated smart gas tracking device is deigned and fabricated. Through applying pump voltage on an yttria-stabilized zirconia (YSZ) membrane, oxygen concentration in the testing chamber can be manually tailored. Due to working principle of the sensor follows the mixed potential behavior, distinct difference in sensitivity and selectivity are observed for the sensor that operated at different oxygen concentration. Typically, the sensor gives satisfactory selectivity to H2S, NH3, C2H5OH at the oxygen concentration of 10%, 30% and 40%, respectively. In addition, acceptable response/recovery rate (within 24 s) is also confirmed. Finally, a refrigerator prototype that includes the smart gas sensor is built, and satisfactory performance in discriminate food freshness status of fresh or semi-fresh is verified for the proposed refrigerator prototype. In conclusion, these aforementioned promising results suggest that the proposed integrated smart gas sensor could be a potential candidate for alarming food spoilage.
Keywords:
artificially tailored selectivity
; smart gas sensor
; yttria-stabilized zirconia (YSZ)
; volatile compounds
; food freshness
1. Introduction
Real-time monitoring the freshness of food that stored in refrigerator is of great significance since it will be helpful to alarming the potential food spoilage, and thereby can effectively prevent severe health problems (e.g., food poisoning) that may be caused by eaten rotten food.[1,2,3] Up to date, methods that have been frequently reported for food freshness monitoring include but not limited to microbiological testing, visual recognition, capillary electrochromatography, volatile compounds analysis, etc.[4,5,6,7,8,9] Among them, discriminating the food freshness through tracking volatile compounds receives extensive attention due to its attractive characteristics of rapid and non-invasive which are definitely suitable for alarming food spoilage at early stage.[10,11,12] However, in consideration of the ambient environment of low temperature (normally below 4oC) and high humidity (90% R.H.) in refrigerator, it is highly desired to develop high performance chemical gas sensors when tacking target volatile gas species.[5,7,12,13,14,15]
Typically, to effectively monitor the food freshness, three main target volatile compounds should be particularly focused, namely, H2S (derived from meat spoilage), NH3 (derived from meat spoilage) and C2H5OH (derived from vegetables/ fruits spoilage).[14,16,17] In comparison with chemireistive gas sensors, solid-state yttria-stabilized zirconia (YSZ) based gas sensors demonstrate reliable performance in harsh conditions.[18,19,20,21,22,23,24,25] In addition, because of the relatively high selectivity, it is expected that YSZ-based gas sensors could be a promising candidate for sensing these volatile compounds in refrigerator.[26,27,28,29] Nevertheless, highly selective tracking the aforementioned H2S, NH3, C2H5OH against other potential co-exist interference gases, like CO, NO, NO2 and SO2 still remains challenge.[30,31,32]
As is well known that YSZ-based gas sensors normally follow the working principle of mixed potential behavior when exposed to the gas mixture containing oxygen.[30,33,34,35] Hence, sensing characteristics (i.e., sensitivity and selectivity) of this type sensor could be artificially tailored through modulating oxygen concentration in gas mixture.[33,36] Consequently, in this research an integrated smart gas sensor with artificial tailored selectivity is proposed for tracking typical volatile compounds generated during food spoilage. An integrated ceramic-based oxygen pump is designed by using a YSZ membrane for controlling the oxygen concentration in testing chamber so that the selectivity of a miniaturized YSZ-based electrochemical gas sensor can be easily tailored. Meanwhile, the practicability of the integrated smart gas sensor to monitor the level of food freshness in refrigerator will be systematically evaluated. It is believed that this research would provide an alternative strategy for designing high performance gas sensors in the application of future food quality evaluation.
2. Experimental Section
2.1. Fabrication of the Integrated Smart Gas Sensor
The smart gas sensor comprises of two parts, namely, testing chamber (chamber oxygen concentration controlling module) and miniaturized YSZ-based sensor (target gas sensing module). The fabrication details of each part are summarized as fellow:
(i) Fabrication of the chamber oxygen concentration controlling module: Initially, Pt paste (Tanaka, Japan) and Mn2O3 paste were paint on the surface of commercial YSZ plates (length × width × thickness: 1.75 × 0.5 × 0.1 cm3; Nikkato, Japan) to form the oxygen pumping and sensing electrode. After that, two pieces of the as-fabricated commercial YSZ plates were bind together with the help of glass cement, followed by calcined at 1400 oC for 2.5 h to form the chamber oxygen concentration controlling module. The space of the internal testing chamber is about 0.06 cm3 (length × width × thickness: 1.5 × 0.4 × 0.1 cm3; as shown in Figure 2a).
(ii) Fabrication of the target gas sensing module and integrated smart gas sensor: YSZ-based sensors are fabricated by using commercial YSZ plates (length × width × thickness: 2 × 0.3 × 0.1 cm3; Nikkato, Japan). To simplify the configuration of the fabricated sensors, manganese-based reference-electrode (hereafter denoted as Mn-based RE) was used on these sensors. Commercial Mn3O4 powder (99%, Sigma, Germany) was thoroughly mixed with α- terpineol and the paste was painted on the surface of YSZ plates to form a 1 mm Mn3O4-banded electrode. After drying at 130 °C overnight, YSZ plates with the Mn3O4 layer were calcined at 1400 °C for 2.5 h in air to form the Mn-based RE. Each of the metal oxide-based sensing materials (SnO2, Co3O4, ZnO, NiO, Cr2O3 and In2O3: 99%, Sigma, Germany) was applied individually on the surface of YSZ plates to form the oxide layer with similar dimensions to the Mn-based RE. Each fabricated oxide layer was also calcined at high temperatures to obtain the photoactive SEs, the calcination temperature for the Cr2O3-SE sensor is ranged from 900 to 1100 °C, whereas for the sensor comprised of other SEs were fixed at 1000 °C. Finally, the as-fabricated YSZ-based sensors were inset into the testing chamber and sealed with glass cement to form the integrated smart gas sensors. Schematic view of the sensor can be found in Figure 1.
2.2. Evaluating the Gas Sensing Performance of the Integrated Smart Gas Sensor
Sensing experiments were performed by simultaneously expose the sensors to the base gas (diluted 21 vol% O2 + N2 balance) or the sample gas containing each of different volatile compounds in the range of 0.04–2 ppm for each in the based gas to evaluate gas-sensing characteristics. In consideration of the fact that H2S, NH3, C2H5OH are the main volatile compounds that emitted during food spoilage, these gas species are selected as the sample gas in this study. The humidity and the temperature of the gas mixture are kept at 90% RH and 4 oC to simulate the operating condition in refrigerator. To eliminate the negative impact derived from humidity and low ambient temperature, the sensor is operated at 425 oC through an internal aluminum oxide heating plate.
The oxygen concentration inside the testing chamber is manually modulated by applying pumping voltage on the pumping electrode which located on the surface of YSZ membrane (Figure 1b). By controlling the pumping time, oxygen concentration in the testing chamber can be artificially fixed in the range of 10-40 %. The sensing signal of electric potential difference ΔV (ΔV = Vsample gas – Vbase gas, where the Vsample gas represents the sensing response of the sensor towards sample gas, whereas the Vbase gas represents the sensing response of the sensor towards base gas) was recorded by using a multi-function data acquisition board (USB-6211, NI, USA). The 90% response/recovery time was calculated by the following way: the maximum value of the sensor given at response/recovery within the examined time was denoted as the ΔVresponse/recovery, then the value of 90% ΔVresponse/recovery can be read from the figure and its corresponding time was defined as the 90% response/recovery time.
3. Results and Discussion
3.1. General Vision of the Integrated Smart Gas Sensor
An integrated smart sensor is proposed and designed for food quality monitoring. Basically, the proposed sensor composes of chamber oxygen concentration controlling module and target gas sensing module (Figure 2a). When exposing the sensor to gas mixture, the oxygen concentration in the gas mixture will be automatically modulated with the help of oxygen concentration controlling module. By applying pumping voltage on the YSZ membrane, oxygen can be controllable pumped out of or inside the testing chamber, leading to low or high oxygen concentration in the gas mixture (in the testing chamber), shown in Figure 2b. In the meantime, oxygen concentration in the testing chamber is real-time monitored so that to manually set the oxygen concentration at the expected value (Figure 2c). A miniaturized YSZ-based gas sensor that embedded in the testing chamber will be designed for high-performance sensing target gases, given in Figure 2d. Due to the YSZ-based sensor fellows the working principle of mixed potential behavior, its sensing characteristics will directly be tailored by the oxygen concentration in the gas mixture (in the testing chamber). Consequently, high selectivity to specific gas at certain oxygen concentration is expected.
3.2. Sensing Performance of the Proposed Smart Gas Sensor
To realize the aforementioned attractive vision, initially, sensing behavior of YSZ based gas sensors that using several frequently reported sensing materials (e.g., SnO2, Co3O4, ZnO, NiO, Cr2O3 and In2O3) as the SE (vs Mn-based RE) to 0.04 ppm H2S, NH3, C2H5OH were characterized under different oxygen concentration (10%, 21%, 30% and 40%). As shown in Figure 3a, response signal of the YSZ-based gas sensors that attached with various sensing materials (as the sensing electrode, SE) vs. Mn-based reference electrode (RE) varied with the change of oxygen concentration and unobvious selectivity towards these studied gases were found for most of these sensors. Nevertheless, it is interestingly to observe that relatively high selectivity to H2S, NH3, C2H5OH was demonstrated by the sensor using Cr2O3-SE (vs. Mn-based RE) at different oxygen concentration. For instance, the repose signal of the sensor to 0.04 ppm H2S, NH3, C2H5OH under the oxygen concentration of 10%, 30% and 40% is (-3.7 mV, -4.9 mV, -17.3 mV), (0.8 mV, -4.3 mV, -0.2 mV) and (8.7 mV, -1 mV, 1.6 mV), respectively. This promising result suggests that it is highly possible to achieve the expected high selectivity for sensing volatile compounds that derived from rotten food through modulating oxygen concentration in the testing atmosphere.
Calcination temperature of the sensor attached with Cr2O3-SE is further optimized in the range of 900-1100 oC, with the intervals of 100 oC (shown in Figure 3b). Largest response signal and optimal selectivity are obtained for the sensor calcined at 1000oC. Regarding to the impact of calcination temperature, it can be explained through the balance of forming triple-phase boundary (TPB) and catalytic activity which has been systematically discussed elsewhere.Basically, TPB can be hardly formed at low calcination, leading to the weak electro-catalytic activity and low reactivity at the reaction interface (i.e., interface between SE and YSZ). However, excessively high calcination temperature normally destroys the catalytic activity of the sensing materials. Consequently, modest calcination temperature is not only helpful to improve the interfacial reactivity by forming a desirable TPB, but also keeps satisfactory catalytic activity. Thus, optimal sensing performance is observed at the calcination temperature of 1000 oC for the YSZ-based sensor that attached with Cr2O3-SE.
Figure 4(a)-(c) demonstrate dependence of the response signal on the concentration of the studied gases for the YSZ-based sensor using Cr2O3-SE (calcined at 1000 °C), in the range of 0.4–2 ppm that examined at different oxygen concentration. Linear relationship between the response signal and the logarithm of the gas concentration is observed for the sensor, regardless of the oxygen concentration contained in the gas mixture. Particularly, acceptable selectivity is also confirmed for the sensor through modulating the oxygen concentration. To further confirm the gas sensing specificity, comparison of the response signal to the 0.4 ppm single gas (e.g., H2S, NH3, C2H5OH) and to the gas mixture (target gas + 2 ppm interference gases) is investigated and shown in Figure 4(d)-(f). Acceptable specificity is confirmed for the sensor when sensing various targeted gases under different oxygen content. These impressive results directly indicate that selectivity of the proposed YSZ-based sensor that using Cr2O3-SE is successfully tailored by simply modulating oxygen content in tested environment. As for the tailored selectivity of the sensor, it can interpretate through the standard modified polarization curves that given in Figure 5(a). The difference in the modified polarization curves for each studied target gases at the oxygen concentration of 10-40% suggests that the interfacial catalytic activity of the sensor changed with the variation of the oxygen concentration. Particularly, due to the mixed potential behavior of the sensor, distinct different sensing behavior is obtained when modulating the oxygen concentration in the gas mixture.
Beyond the satisfactory selectivity, quick response/recovery rate and humidity resistance are also crucial technical index, since the research objective of this study is tracking target volatile compounds that generated during food spoilage. Figure 5(b) shows the response/recovery state, the 90% response/recovery time of the sensor to H2S, NH3, C2H5OH is 23.6s/17.1s, 7.3s/11.2s and 5.4s/15.2s, respectively, indicating acceptable response/recovery speed for sensing these gases. Meanwhile, water vapor gives negligible impact on the response behavior of the sensor (Figure 6). Based on these promising results, it is reasonable to give the conclusion: the smart sensor that integrated oxygen pump membrane and miniaturized YSZ-based gas sensor (attached with Cr2O3-SE and Mn-based RE) shows excellent oxygen concentration modulation capability and satisfactory gas sensing characteristics, thus, could be a potential candidate for food freshness evaluation.
3.3. Capability of Real-Time Monitoring Food Freshness
To evaluate the practicability of employing the proposed sensor in freshness monitoring, a refrigerator prototype that included the smart gas sensor is built and its performance is also examined. It should be particularly noted that in order to effectively eliminate potential interference derived from other gases (e.g., CO, NO2, NO and SO2), commercialized catalyst powder (C21900, Minstrong Tech., China) is placed in front of the sensing chamber to remove potential interference gases. Figure 7a demonstrate the photograph of the designed prototype. Basically, the prototype includes a sensing chamber (placing the smart gas sensor), min-pump (sucking in gas that derived from food), catalyst tank (placing commercialized catalyst powder) and other refrigerator modules. When the prototype works, gas species in fresh room would be automatically pumped into sensing chamber and examined by the sensor. Figure 7b gives the conversion rate of each gas, calculated by comparing the concentration difference before and after the gas passing through the catalyst. Obviously, the catalyst essentially removed those potential interference gases, due to the high conversion rate to CO, NO2, NO and SO2. Therefore, the smart gas sensor that placed behind the catalyst tank reveals high response signal to H2S, NH3, C2H5OH against aforementioned interference gases (Figure 8c). Consequently, it is believed that the designed prototype would be capable of alarming food spoilage by simply tracking volatile compounds.
Pork, banana and strawberry are selected as the research example of meat and fruit to test the performance of the prototype. The above-mentioned foods are kept in the fresh room with the temperature set at 4oC for 0-14 days. The variation of the response signal to the gases sucked from fresh room is continuously recorded during tested period. It is found that when keeping these foods in fresh room more than 7 days, obvious color change can be caught in the photograph (Figure 8), suggesting the food spoilage started. Figure 7c, d shows variation of the response signal to H2S, NH3, C2H5OH in the form of heat map, during the studied 14 days. In sum, according to the variation of the response signal, it can be deduced that significantly increasing in H2S, NH3 is found during meat spoilage, while for fruit spoilage gas concentration increment is mainly found in C2H5OH. Figure 9 summarized the pilot results of freshness monitoring by utilizing the designed refrigerator prototype. In this research, principal components analysis (PCA) method is employed to discriminate status of fresh (kept within half day) or semi-fresh (kept more than 3.5 days). Basically, response signal of H2S, NH3 for the meat kept for 3.5 days is around 11.2 mV and -7.4 mV, respectively, while the value of C2H5OH for fruit at the semi-fresh status is roughly estimated to be -19.4 mV. These results that depict in the form of PCA map implies satisfactory capability of the prototype in distinguish food freshness, particularly when the experimental sample is meat. Conclusively, the prototype that integrated with the smart gas sensor successfully implemented the online freshness monitoring and would provide effective strategy for alarming food spoilage.
4. Conclusions
An integrated smart gas sensor is designed and fabricated for real-time monitoring food freshness. Through applying the pumping voltage on the YSZ membrane, oxygen concentration in the testing chamber is artificially controlled. Due to the mixed potential behavior, distinct different sensing characteristics are demonstrated by the YSZ-based smart gas sensor that attached with Cr2O3-SE and Mn-based RE, under different oxygen concentration. Basically, the sensor gives satisfactory selectivity to H2S, NH3, C2H5OH when the oxygen concentration in the gas mixture is at 10%, 30% and 40%, respectively. In addition, acceptable response/recovery rate is further confirmed for the sensor.
To verify the capability of monitoring the food freshness for the proposed integrated smart gas sensor, a refrigerator prototype that included the smart gas sensor is built. With the help of commercialized catalyst, high selectivity to these target gases (i.e., H2S, NH3 and C2H5OH) that emitted during food spoilage. Moreover, satisfactory performance in discriminate food freshness status of fresh or semi-fresh is further confirmed for the proposed refrigerator prototype. Conclusively, these promising results suggest that the proposed integrated smart gas sensor could be a potential candidate for alarming food spoilage. Particularly, the strategy of modulating response selectivity through tailoring the oxygen concentration would be a useful way to design future high performance gas sensors.
Author Contributions
HJ: YW designed the experiments. YLX, ZCL, JTZ, YYW, CHY performed the experiments. YNZ, SG, NDH, NVH, AAG, KYV, AG, AJ, VC, DXC gave valuable suggestions on materials preparation, sensor fabrication & sensing platform construction. All authors contributed to the data analysis and provided valuable feedback. HJ, YW, YLX and ZCL wrote the paper.
Funding
The authors gratefully acknowledge the financial support for this research from the National Natural Science Foundation of China (Grant No. 2022YFE0118800, 62227815, 52000133), “the Belt and Road” young scientist exchange program of the Science and Technology Commission of Shanghai (Grant No. 20490743000), Shanghai Natural Science Foundation (Grant No. WF220403061), Sichuan Natural Science Foundation (Grant No. 2022NSFSC0390, KX002), Oceanic Interdisciplinary Program of Shanghai Jiao Tong University (Grant No. SL2020MS014) and Program of National Key Laboratory (SKLPBS2249).
Acknowledgments
The authors gratefully acknowledge the support for this research from Yuyao Wu, Chenhan Yi, Cuili Xue, Yuna Zhang, Shan Gao and Kistenev Yury V.
Conflicts of Interest
The authors declare no conflict of interest.
References
- Sequino, G.; Valentino, V.; Villani, F.; Filippis, F.D. Omics-based Monitoring of Microbial Dynamics Across the Food Chain for the Improvement of Food Safety and Quality. Food Res. Int. 2022, 157, 111242. [Google Scholar] [CrossRef] [PubMed]
- Yokoyama, H. Parasites in Fisheries Food causing Food Poisoning. Jpn. J. Food Microbiol. 2021, 38, 139–143. [Google Scholar] [CrossRef]
- Odeyemi, O.A.; Alegbeleye, O.O.; Strateva, M.; Stratev, D. , Understanding Spoilage Microbial Community and Spoilagemechanisms in foods of animal origin. Compr. Rev. Food Sci. Food Saf. 2020, 19, 311–331. [Google Scholar] [CrossRef] [PubMed]
- Raudiene, E.; Gailius, D.; Vinauskiene, R.; Eisinite, V.; Balciunas, G.; Dobilne, J.; et al. , Rapid Evaluation of Fresh Chicken Meat Quality by Electronic Nose. Czech J. Food Sci. 2018, 36, 420–426. [Google Scholar] [CrossRef]
- Peris, M.; Gilabert, L.E. A 21st Century Technique for Food Control: Electronic Noses. Anal. Chim. Acta 2009, 638, 1–15. [Google Scholar] [CrossRef]
- Wang, S.; Chen, H.; Sun, B. Recent progress in food flavor analysis using gas chromatography–ion mobility spectrometry (GC–IMS). Food Chem. 2020, 315, 126158. [Google Scholar] [CrossRef]
- Shaik, M.I.; Azhari, M.F.; Sarbon, N.M. Gelatin-Based Film as a Color Indicator in Food-Spoilage Observation: A Review. Foods 2022, 11, 3797. [Google Scholar] [CrossRef]
- Sonwani, E.; Bansal, U.; Alroobaea, R.; Baqasah, A.M.; Hedabou, M. An Artificial Intelligence Approach Toward Food Spoilage Detection and Analysis. Front. Public Health 2022, 9, 816226. [Google Scholar] [CrossRef]
- Peng, X.; Liu, J.; Tan, Y.; Mo, R.; Zhang, Y. A CuO thin film type sensor via inkjet printing technology with high reproducibility for ppb-level formaldehyde detection. Sens. Actuators B Chem. 2022, 362, 131775. [Google Scholar] [CrossRef]
- Wang, M.; Gao, F.; Wu, Q.; Zhang, J.; Xue, Y.; Wan, H.; Wang, P. Real-time assessment of food freshness in refrigerators based on a miniaturized electronic nose. Anal. Methods 2018, 10, 4741–4749. [Google Scholar] [CrossRef]
- Yuan, Z.; Bariya, M.; Fahad, H.M.; Wu, J.B.; Han, R.; Gupta, N.; et al. , Trace-Level, Multi-Gas Detection for Food Quality Assessment Based on Decorated Silicon Transistor Arrays. Adv. Mater. 2020, 32, 1908385. [Google Scholar] [CrossRef] [PubMed]
- Hu, W.; Wu, W.; Jian, Y.; Haick, H.; Zhang, G.; Qian, Y.; Yuan, M.; Yao, M. Volatolomics in healthcare and its advanced detection technology. Nano Res. 2022, 15, 8185–8213. [Google Scholar] [CrossRef] [PubMed]
- Cui, S.; Yang, L.; Wang, J.; Wang, X. Fabrication of a sensitive gas sensor based on PPy/TiO2 nanocomposites films by layer-by-layer self-assembly and its application in food storage. Sens. Actuators B Chem. 2016, 233, 337–346. [Google Scholar] [CrossRef]
- X. Z. Guo, Y.Q. Ding, C.Y. Liang, B.S. Du, C.J. Zhao, Y.L. Tan; et al., Humidity-Activated H2S Sensor based on SnSe2/WO3 Composite for Evaluating the Spoilage of Eggs at Room Temperature. Sens. Actuat B-Chem. 2022, 357, 131424. [Google Scholar] [CrossRef]
- Sun, Y.; Hu, J.; Zhang, Y. Visible light assisted trace gaseous NO2 sensor with anti-humidity ability via LSPR enhancement effect. Sens. Actuators B Chem. 2022, 367. [Google Scholar] [CrossRef]
- Shaalan, N.M.; Ahmed, F.; Saber, O.; Kumar, S. Gases in Food Production and Monitoring: Recent Advances in Target Chemiresistive Gas Sensors. Chemosensors 2022, 10, 338. [Google Scholar] [CrossRef]
- Preethichandra, D.M.G.; Gholami, M.D.; Izake, E.L.; O'Mullane, A.P.; Sonar, P. Conducting Polymer Based Ammonia and Hydrogen Sulfide Chemical Sensors and Their Suitability for Detecting Food Spoilage. Adv. Mater. Technol. 2022, 8. [Google Scholar] [CrossRef]
- Sato, T.; Plashnits, V.V.; Utiyam, M.; Miura, N. YSZ-based Sensor Using NiO Sensing Electrode for Detection of Volatile Organic Compounds in ppb Level. J. Electrochem. Soc. 2011, 158, J175–J178. [Google Scholar] [CrossRef]
- Tanaka, Y.; Sato, T.; Ikeda, H.; Miura, N. Cobalt-based solid reference-electrode usable in zirconia-based sensors for detection of oxygen or volatile organic compounds. Sens. Actuators B Chem. 2014, 203, 899–903. [Google Scholar] [CrossRef]
- Cheng, C.; Zou, J.; Zhou, Y.; Wang, Z.; Jin, H.; Xie, G.; Jian, J. Fabrication and electrochemical property of La0.8Sr0.2MnO3 and (ZrO2)0.92(Y2O3)0.08 interface for trace alcohols sensor. Sens. Actuators B Chem. 2021, 331. [Google Scholar] [CrossRef]
- Hu, J.; Liu, X.; Zhang, J.; Gu, X.; Zhang, Y. Plasmon-activated NO2 sensor based on Au@MoS2 core-shell nanoparticles with heightened sensitivity and full recoverability. Sens. Actuators B Chem. 2023, 382. [Google Scholar] [CrossRef]
- Jian, Y.; Zhang, N.; Liu, T.; Zhu, Y.; Wang, D.; Dong, H.; Guo, L.; Qu, D.; Jiang, X.; Du, T.; et al. Artificially Intelligent Olfaction for Fast and Noninvasive Diagnosis of Bladder Cancer from Urine. ACS Sens. 2022, 7, 1720–1731. [Google Scholar] [CrossRef] [PubMed]
- Zhang, M.; Sun, J.J.; Khatib, M.; Lin, Z.-Y.; Chen, Z.-H.; Saliba, W.; Gharra, A.; Horev, Y.D.; Kloper, V.; Milyutin, Y.; et al. Time-space-resolved origami hierarchical electronics for ultrasensitive detection of physical and chemical stimuli. Nat. Commun. 2019, 10, 1120. [Google Scholar] [CrossRef]
- X. Y. Ding, Y.C. Zhang, Y. Zhang, X.F. Ding, H.X. Zhang, T. Cao; et al., Modular Assembly of MXene Frameworks for Noninvasive Diagnosis via Urinary Volatiles. ACS Nano 2022, 16, 17376–17388. [Google Scholar] [CrossRef] [PubMed]
- Lin, Z.-Y.; Xue, S.-F.; Chen, Z.-H.; Han, X.-Y.; Shi, G.; Zhang, M. Bioinspired Copolymers Based Nose/Tongue-Mimic Chemosensor for Label-Free Fluorescent Pattern Discrimination of Metal Ions in Biofluids. Anal. Chem. 2018, 90, 8248–8253. [Google Scholar] [CrossRef]
- Perera, A.; Pardo, A.; Barrettino, D.; Hierlermann, A.; Marco, S. Evaluation of fish spoilage by means of a single metal oxide sensor under temperature modulation. Sens. Actuators B Chem. 2010, 146, 477–482. [Google Scholar] [CrossRef]
- Ghasemi-Varnamkhasti, M.; Mohtasebi, S.S.; Siadat, M.; Balasubramanian, S. Meat Quality Assessment by Electronic Nose (Machine Olfaction Technology). Sensors 2009, 9, 6058–6083. [Google Scholar] [CrossRef]
- Matindoust, S.; Farzi, G.; Nejad, M.B.; Shahrokhabadi, M.H. Polymer-based gas sensors to detect meat spoilage: A review. React. Funct. Polym. 2021, 165, 104962. [Google Scholar] [CrossRef]
- Shaalan, N.M.; Ahmed, F.; Kumar, S.; Melaibari, A.; Hasan, P.M.Z.; Aljaafari, A. Monitoring Food Spoilage Based on a Defect-Induced Multiwall Carbon Nanotube Sensor at Room Temperature: Preventing Food Waste. ACS Omega 2020, 5, 30531–30537. [Google Scholar] [CrossRef]
- Itagaki, Y.; Mori, M.; Sadaoka, Y. EMF response of the YSZ based potentiometric sensors in VOC contaminated air. Curr. Opin. Electrochem. 2018, 11, 72–77. [Google Scholar] [CrossRef]
- Sato, T.; Breedon, M.; Miura, N. Selectivity Enhancement of YSZ-based VOC Sensor Utilizing SnO2/NiO-SE via the Application of a Physical Gas-diffusion Barrier. ECS Trans. 2012, 50, 129–37. [Google Scholar] [CrossRef]
- Kasalizadeh, M.; Khodadadi, A.A.; Mortazavi, Y. Coupled Metal Oxide-Doped Pt/SnO2Semiconductor and Yittria-Stabilized Zirconia Electrochemical Sensors for Detection of VOCs. J. Electrochem. Soc. 2013, 160, B218–B224. [Google Scholar] [CrossRef]
- Ramaiyan, K.P.; Mukundan, R. Editors’ Choice—Review—Recent Advances in Mixed Potential Sensors. J. Electrochem. Soc. 2020, 167, 037547. [Google Scholar] [CrossRef]
- Miura, N.; Sato, T.; Anggraini, S.A.; Ikeda, H.; Zhuiykov, S. A review of mixed-potential type zirconia-based gas sensors. Ionics 2014, 20, 901–925. [Google Scholar] [CrossRef]
- Jiang, X.; Zou, J.; Ni, Y.; Wang, Y.; Qian, X.; Li, X.; Wei, S.; Su, Y.; Xie, G.; Zhou, M.; et al. Synergistic Au passivation and prolonged aging optimization enhance the long-term catalytic stability of porous YSZ/Pt electrodes. J. Alloy. Compd. 2023, 940. [Google Scholar] [CrossRef]
- Hu, W.; Wan, L.; Jian, Y.; Ren, C.; Jin, K.; Su, X.; Bai, X.; Haick, H.; Yao, M.; Wu, W. Electronic Noses: From Advanced Materials to Sensors Aided with Data Processing. Adv. Mater. Technol. 2018, 4. [Google Scholar] [CrossRef]
- Lin, Q.; Cheng, C.; Zou, J.; Kane, N.; Jin, H.; Zhang, X.; et al. , Study of Rsponse and Recovery rate of YSZ-based Electrochemical Sensor by Laser ablation Method. Ionics 2020, 26, 4163–4169. [Google Scholar] [CrossRef]
Figure 1.
schematical view of the details on fabricating the integrated smart gas sensors.
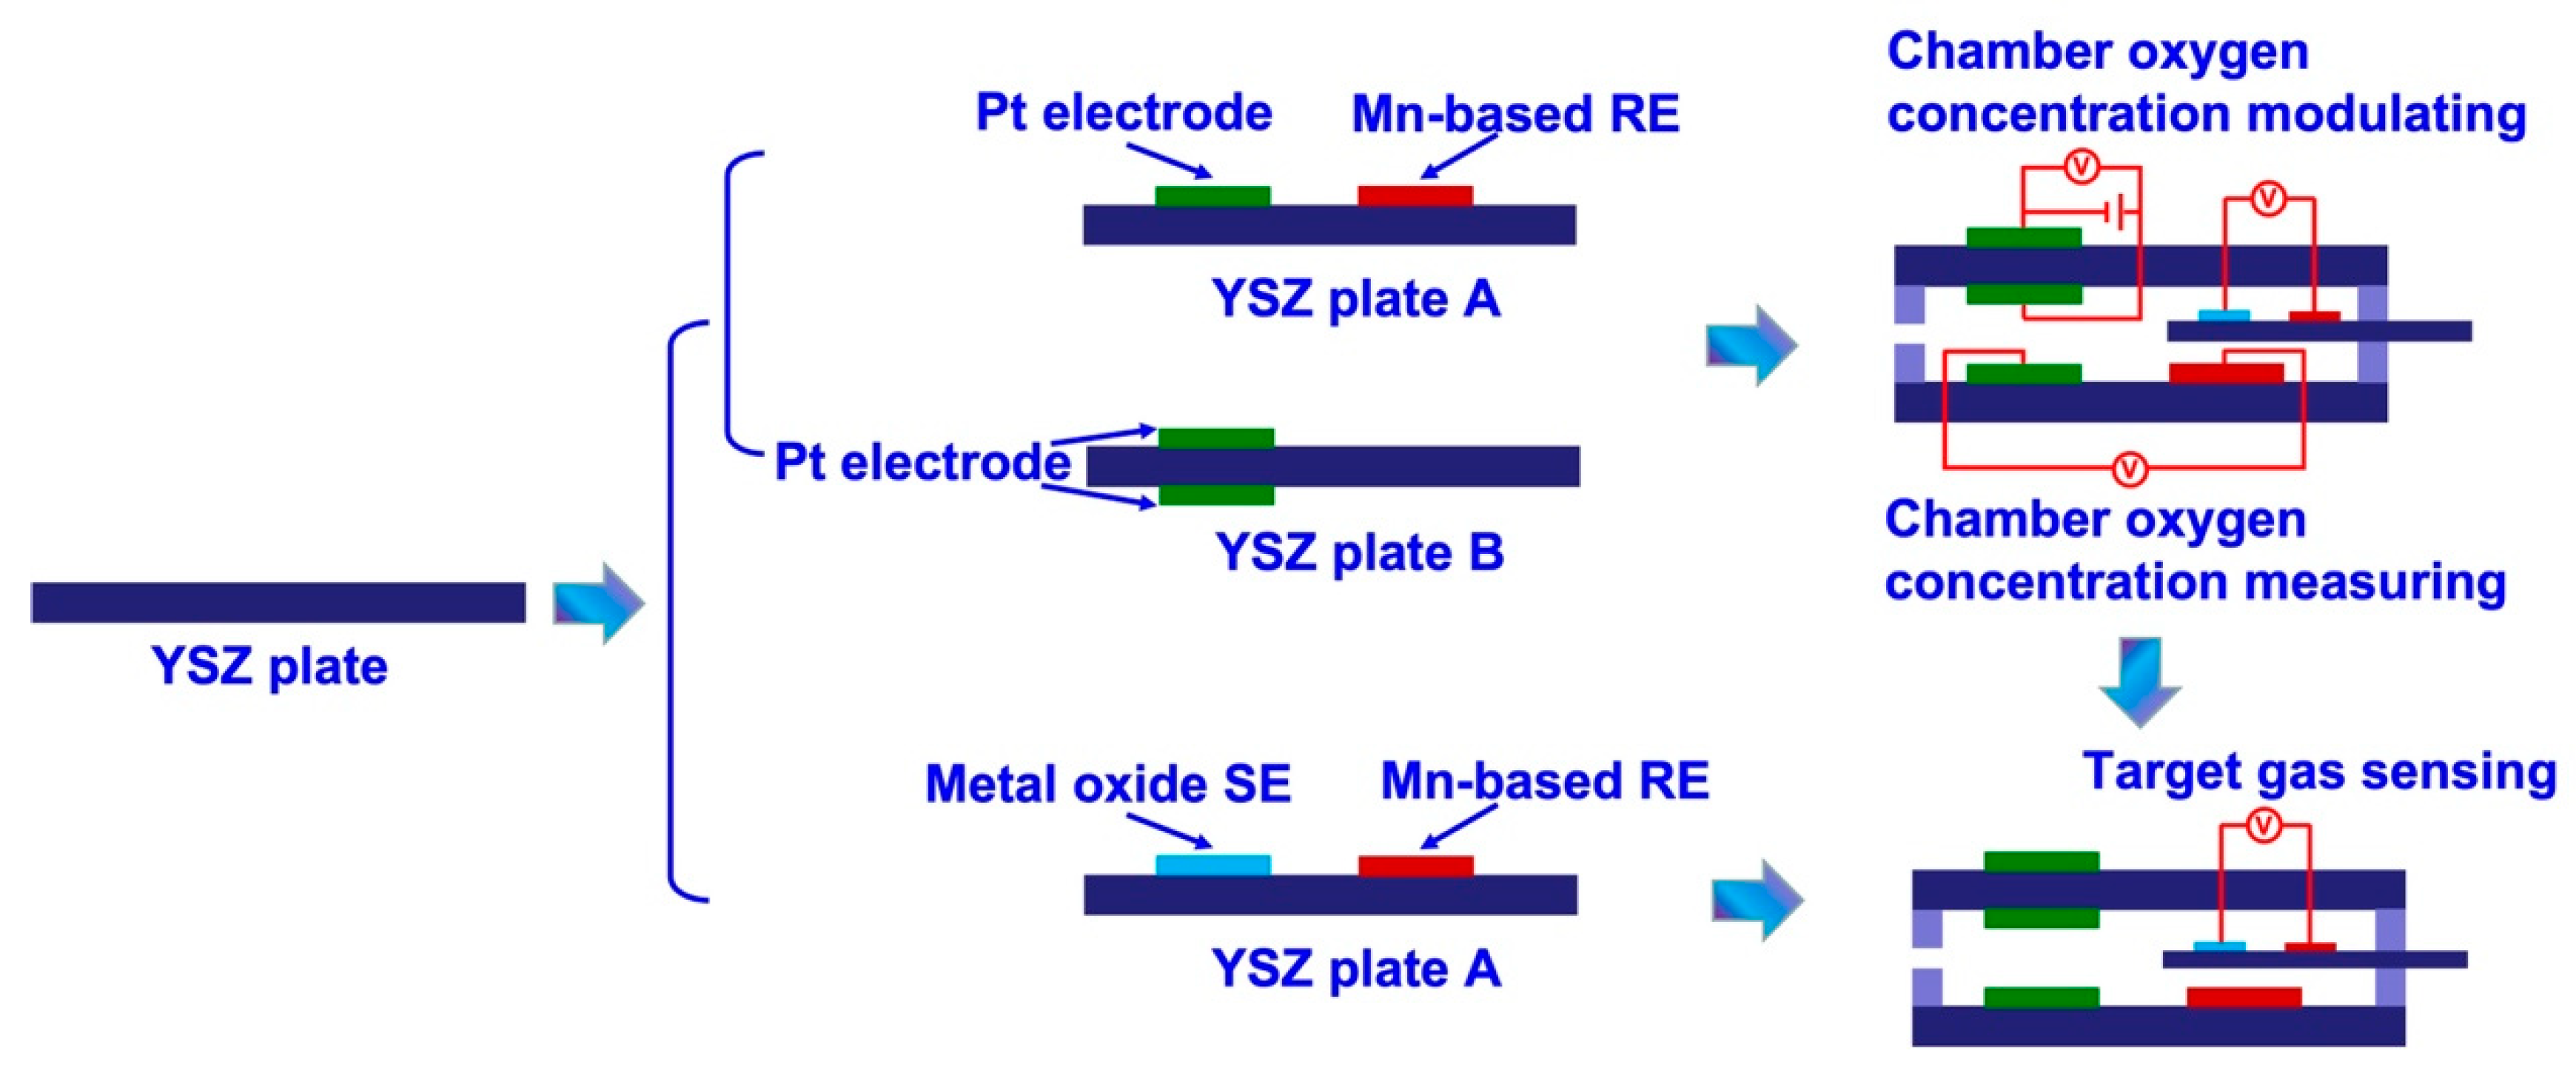
Figure 2.
Illustration of the integrated smart gas sensor. (a) general configuration of the integrated smart gas sensor; (b), (c) working principle of manually controlling the oxygen concentration in the testing chamber; (d) miniaturized YSZ-based sensor for tracking target gas.
Figure 2.
Illustration of the integrated smart gas sensor. (a) general configuration of the integrated smart gas sensor; (b), (c) working principle of manually controlling the oxygen concentration in the testing chamber; (d) miniaturized YSZ-based sensor for tracking target gas.

Figure 3.
Sensing characteristics of the smart gas sensor attached with various SEs and Mn-based RE, under different oxygen concentration. (a) Cross-sensitivity of the sensor to various gases at the oxygen concentration of 10-40%; (b) Impact of the calcination temperature on the sensing performance of the sensor attached with Cr2O3-SE; (b)-(d) dependence of the response signal on the concentration of the studied gases for the sensor using Cr2O3-SE, in the range of 0.4–2 ppm is examined at different oxygen concentration.
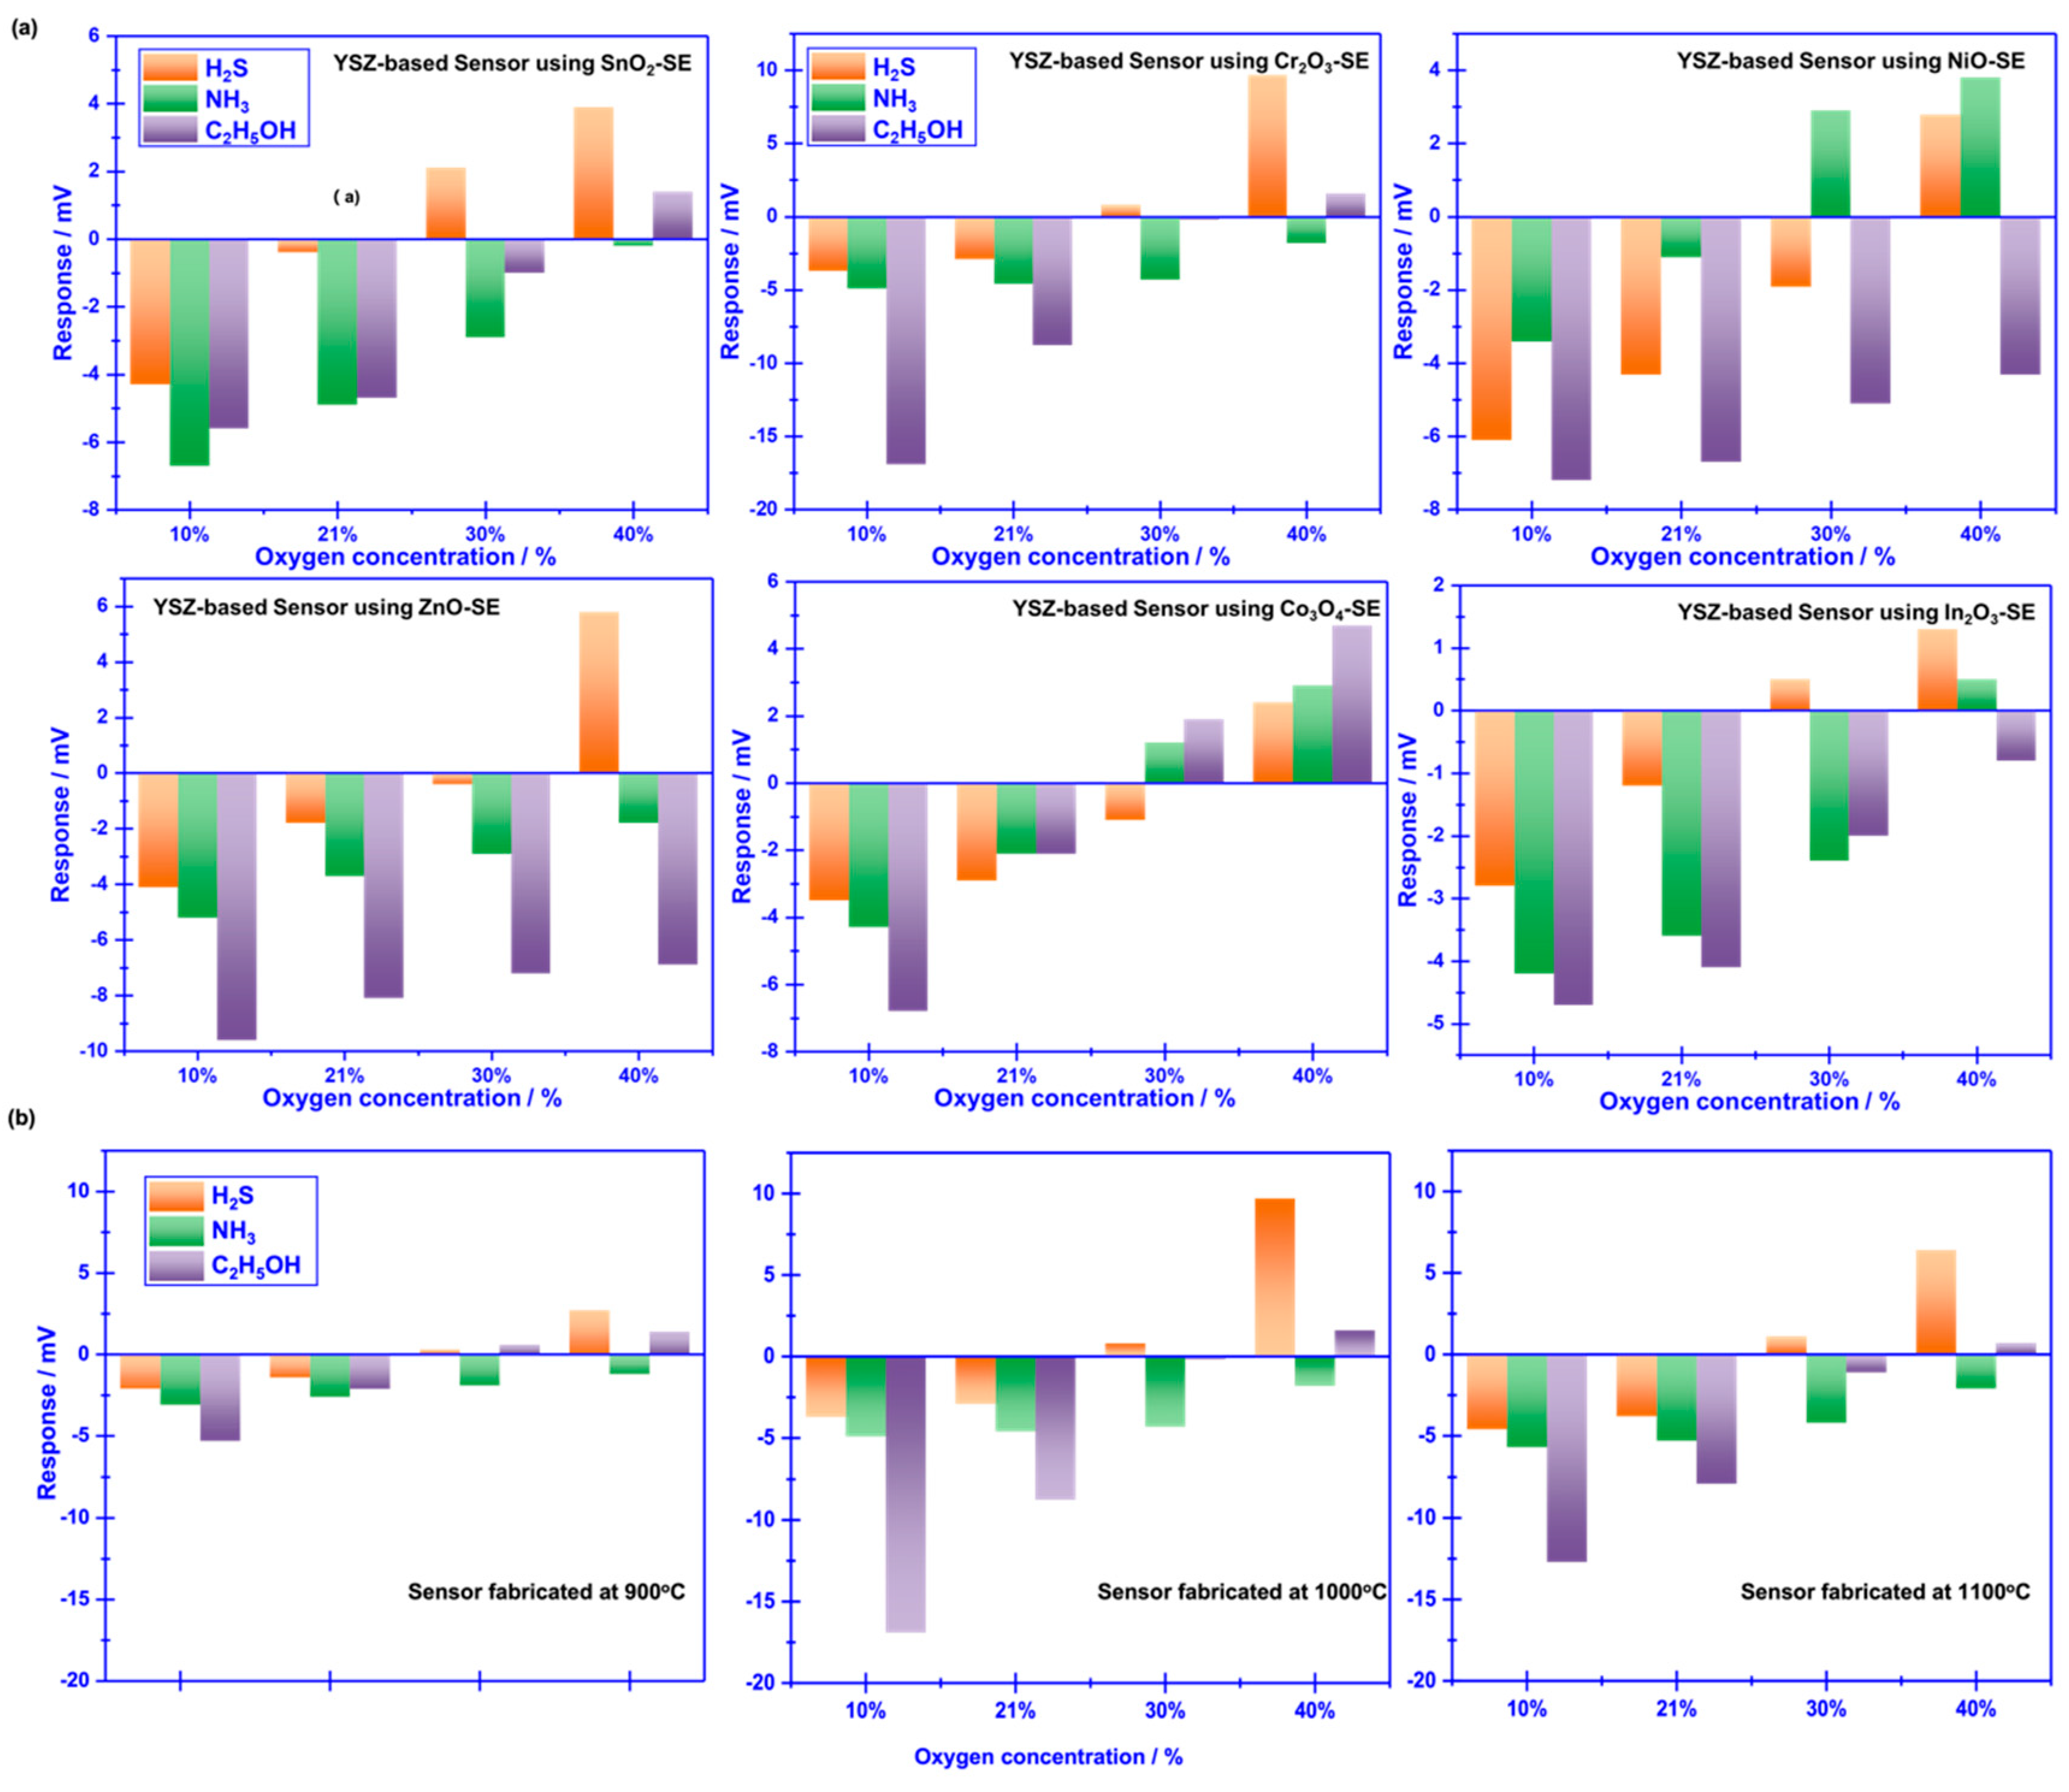
Figure 4.
(a)-(c) dependence of the response signal on the concentration of the studied gases for the sensor using Cr2O3-SE, in the range of 0.4–2 ppm is examined at different oxygen concentration; (d)-(f) dependence of the response signal on the concentration of the studied gases for the sensor using Cr2O3-SE, in the range of 0.4–2 ppm is examined at different oxygen concentration (d)-(f) Comparison of the response signal for the smart gas sensor to the studied gas mixture.
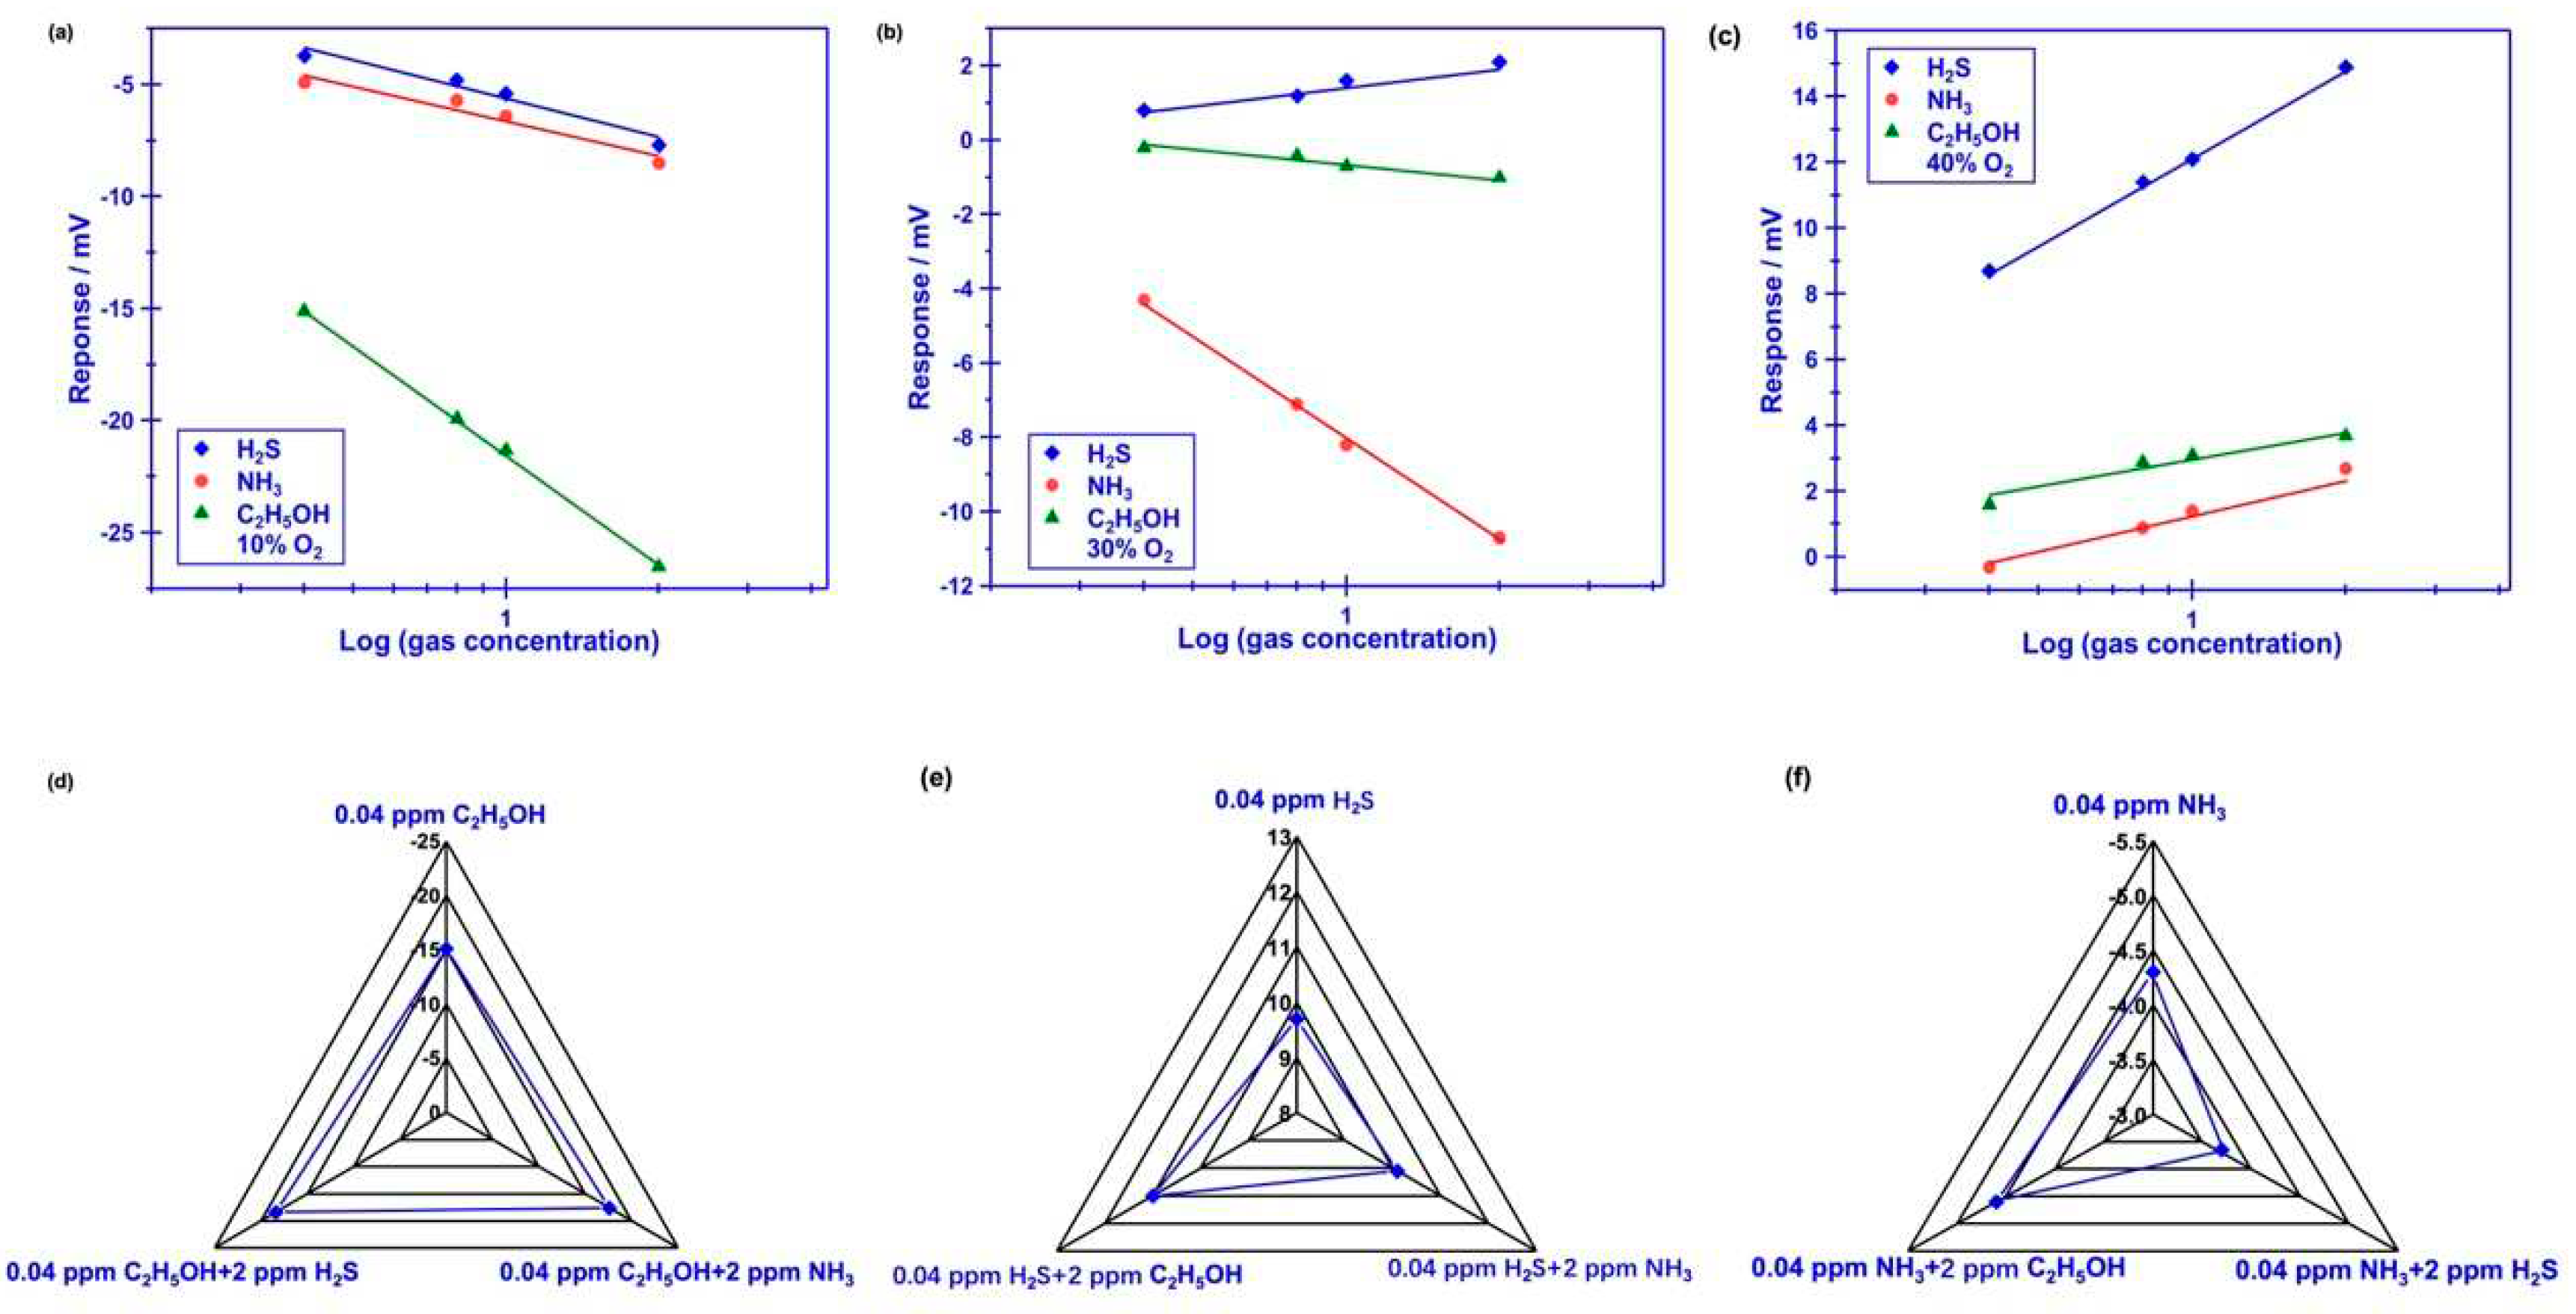
Figure 5.
(a) Standard modified polarization curves, measured in 0.04 ppm H2S, NH3, C2H5OH under different oxygen concentration value over the range of 10–40 vol.% (with intervals of around 10 vol.%), for the smart gas sensor coupled with Cr2O3-SE and Mn-based RE; (b) 90% response/recovery time of the sensor that using Cr2O3-SE to H2S, NH3, C2H5OH.
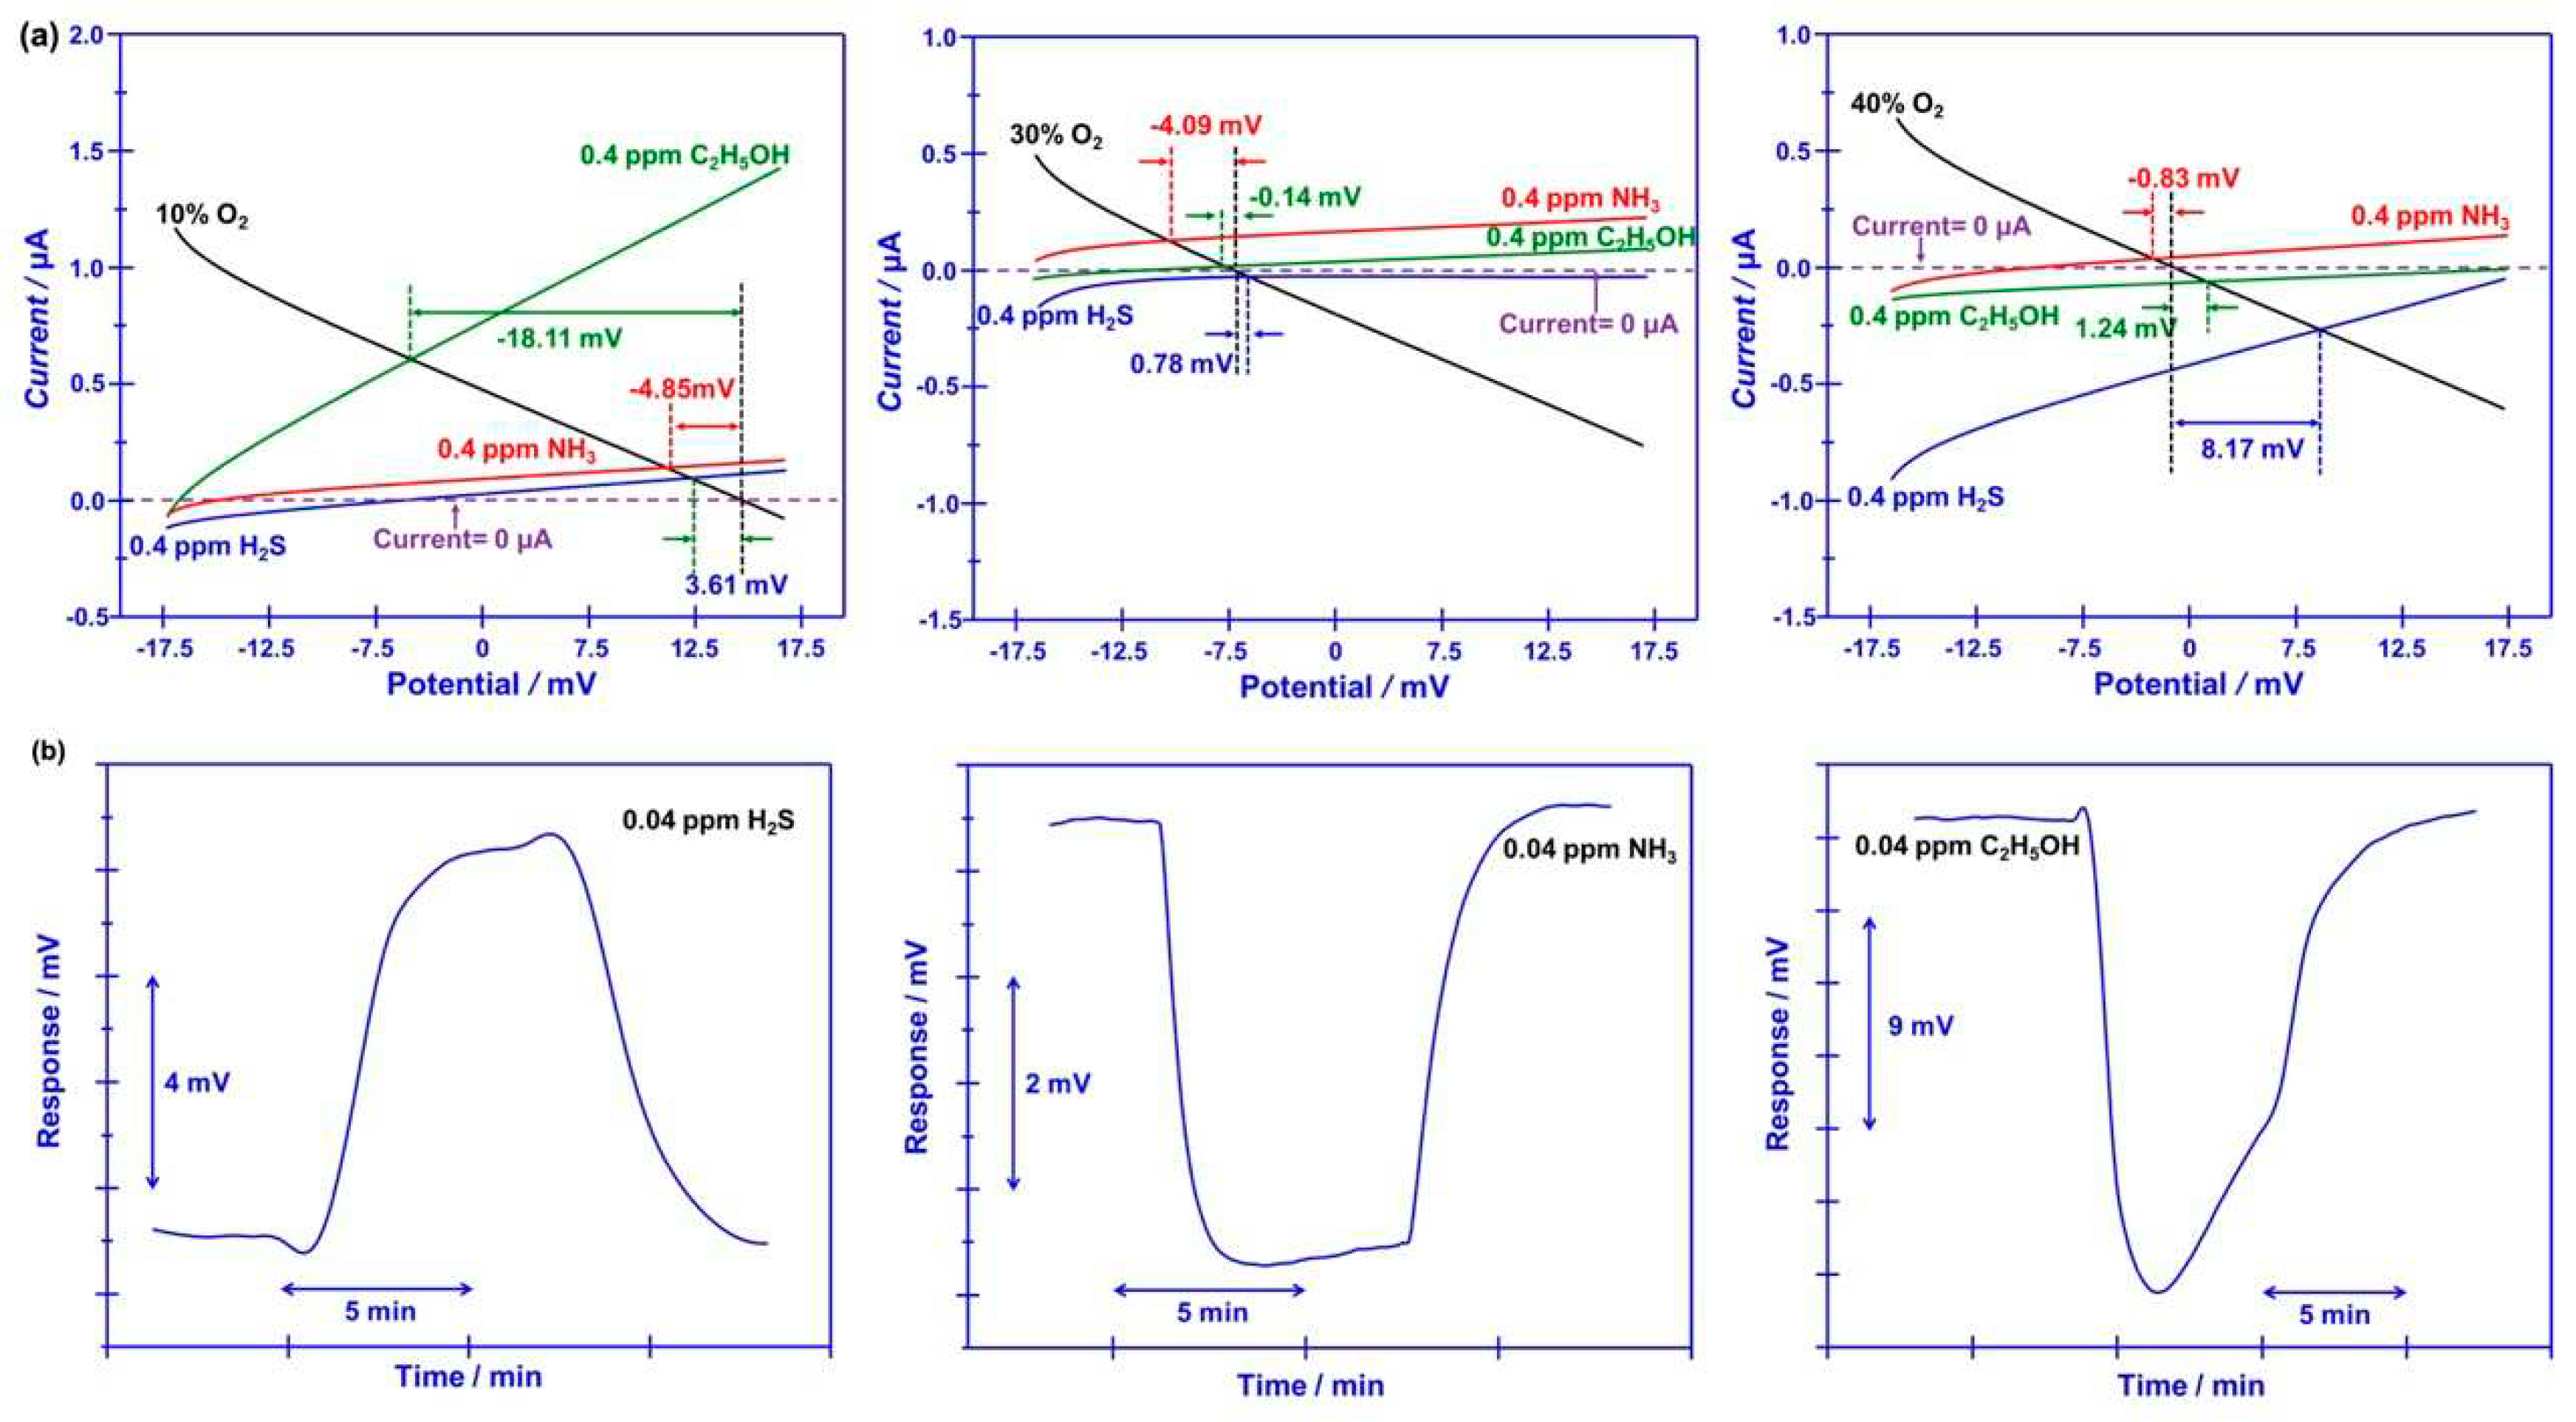
Figure 6.
Impact of water vapor on the response behavior of the sensor using Cr2O3-SE.
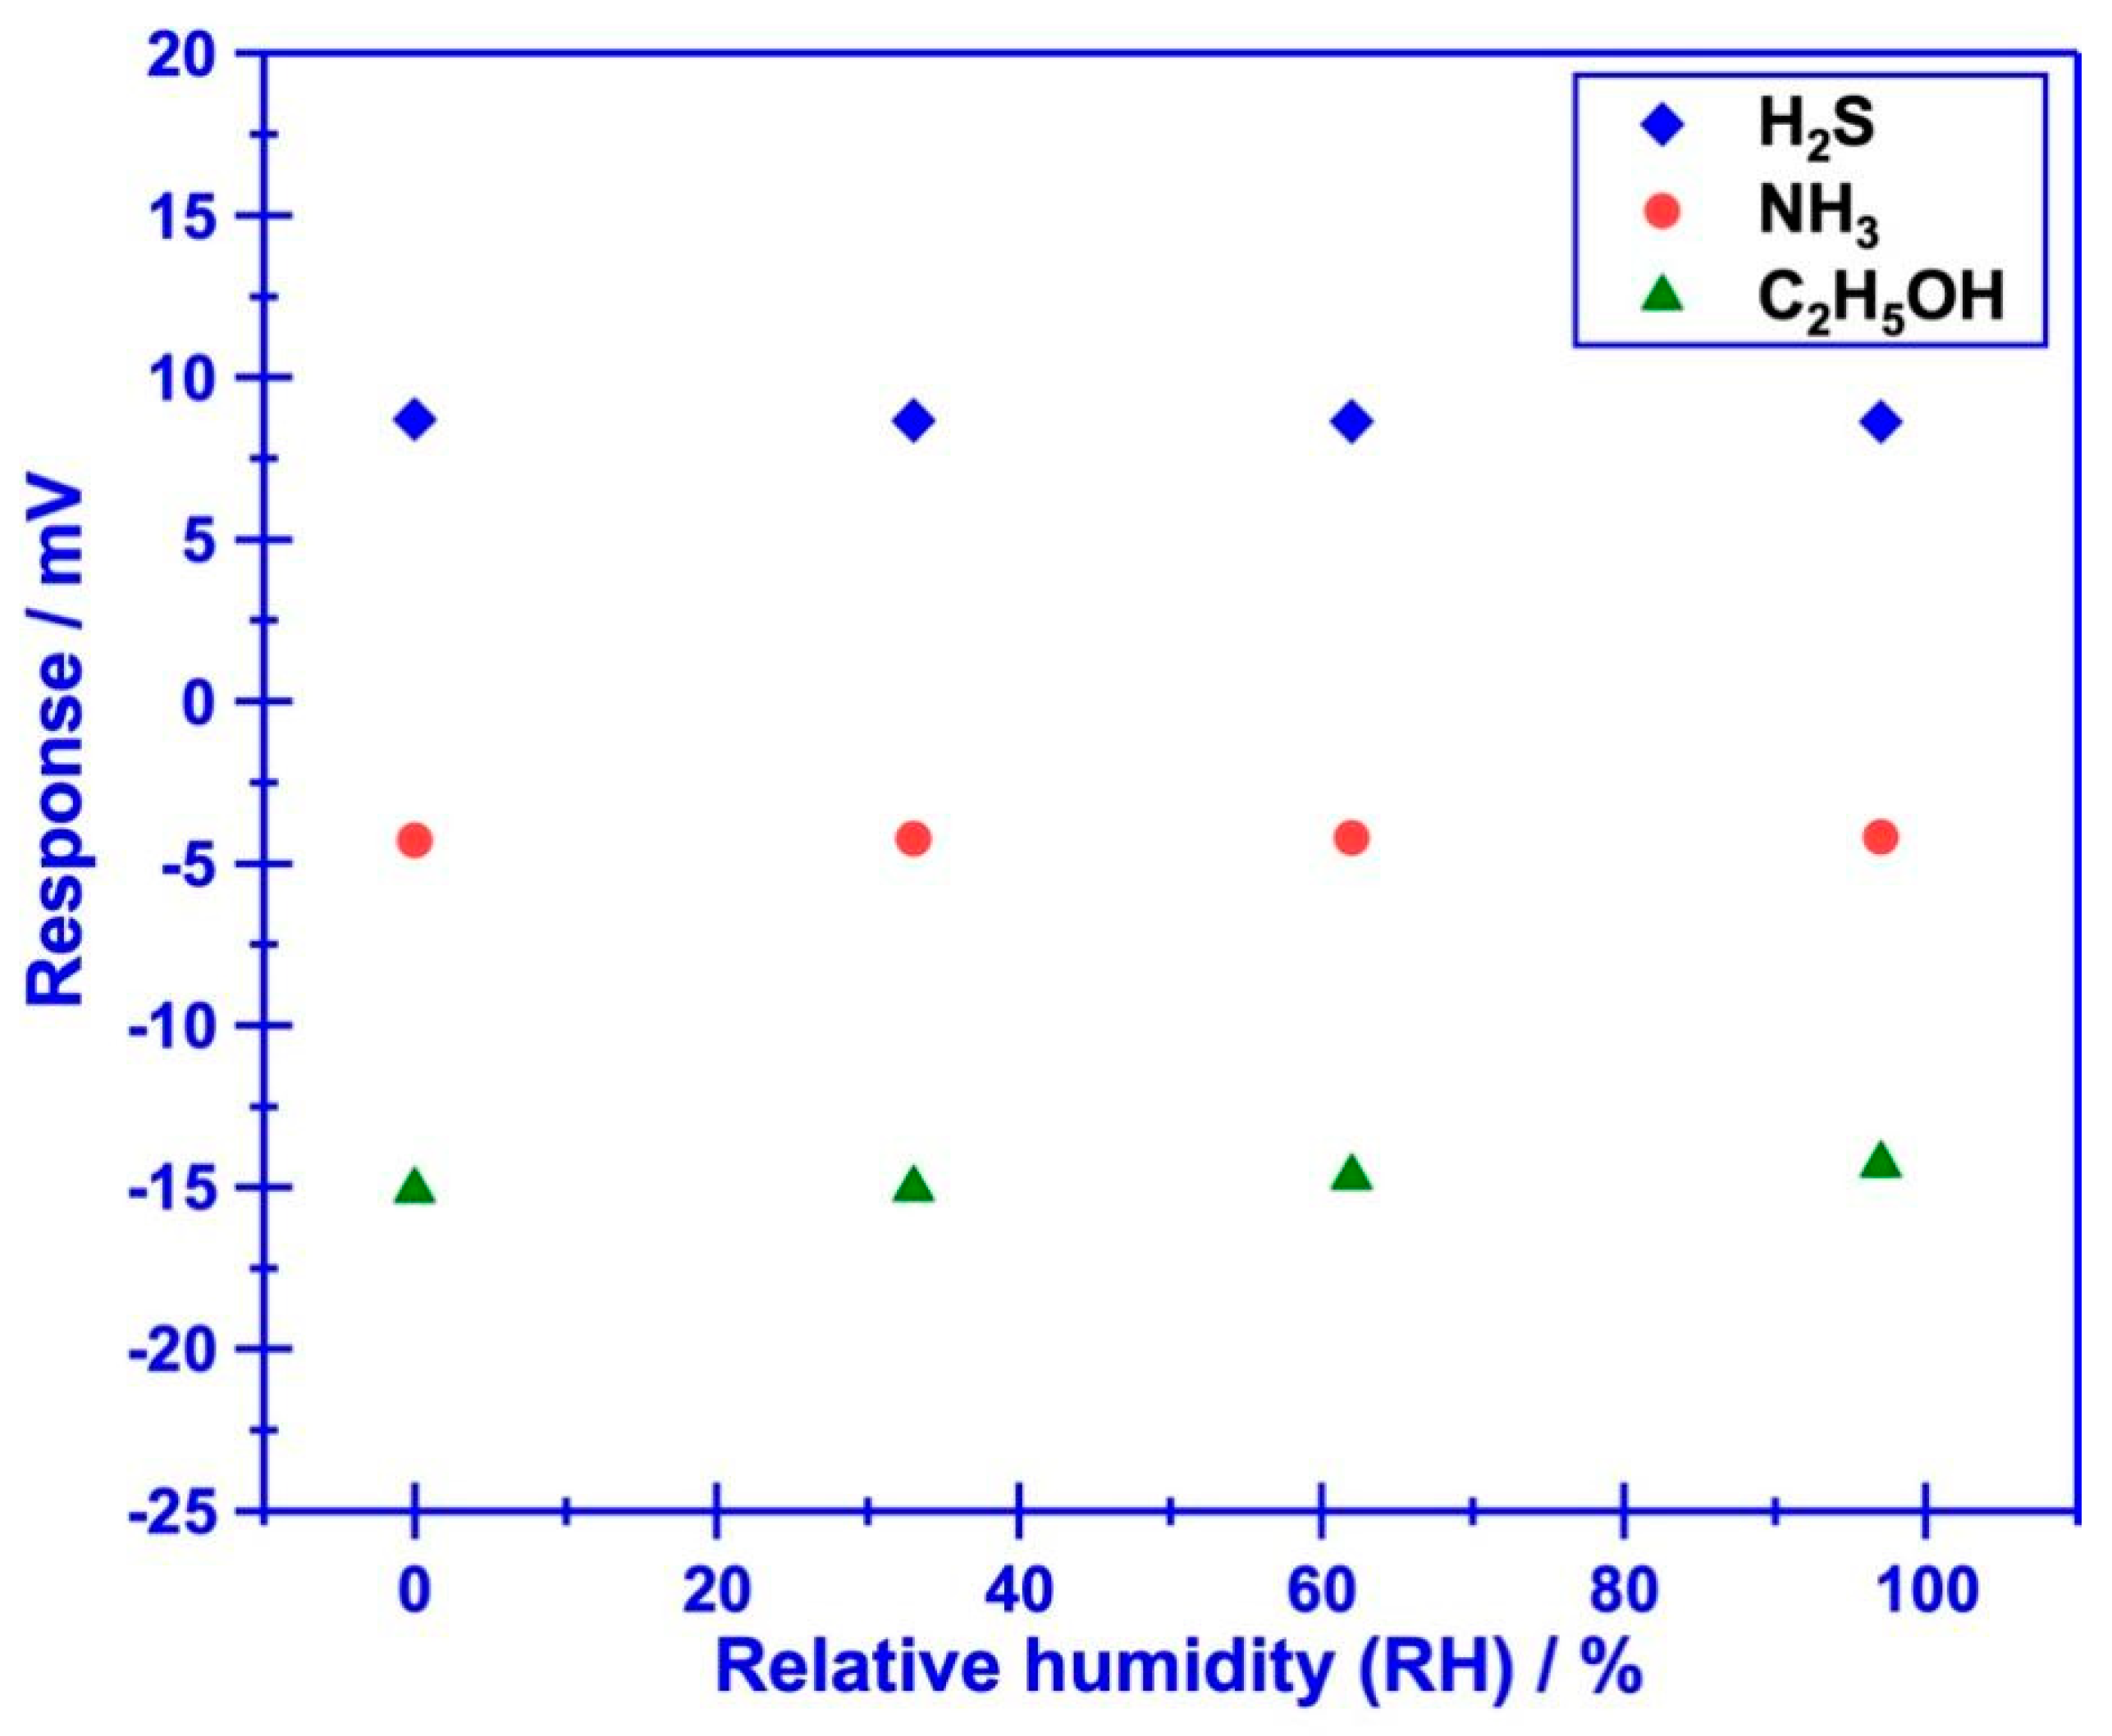
Figure 7.
Photograph and sensing performance of the refrigerator prototype: (a) internal details of the refrigerator prototype; (b) comparison of the conversion rate for the studied gases before and after passing through the catalyst; (c) response signal of the integrated smart gas sensor against potential interference gases with the help of the commercialized catalyst; (d), (e) variation of the response signal to H2S, NH3, C2H5OH in the form of heat map, during the studied 14 days.
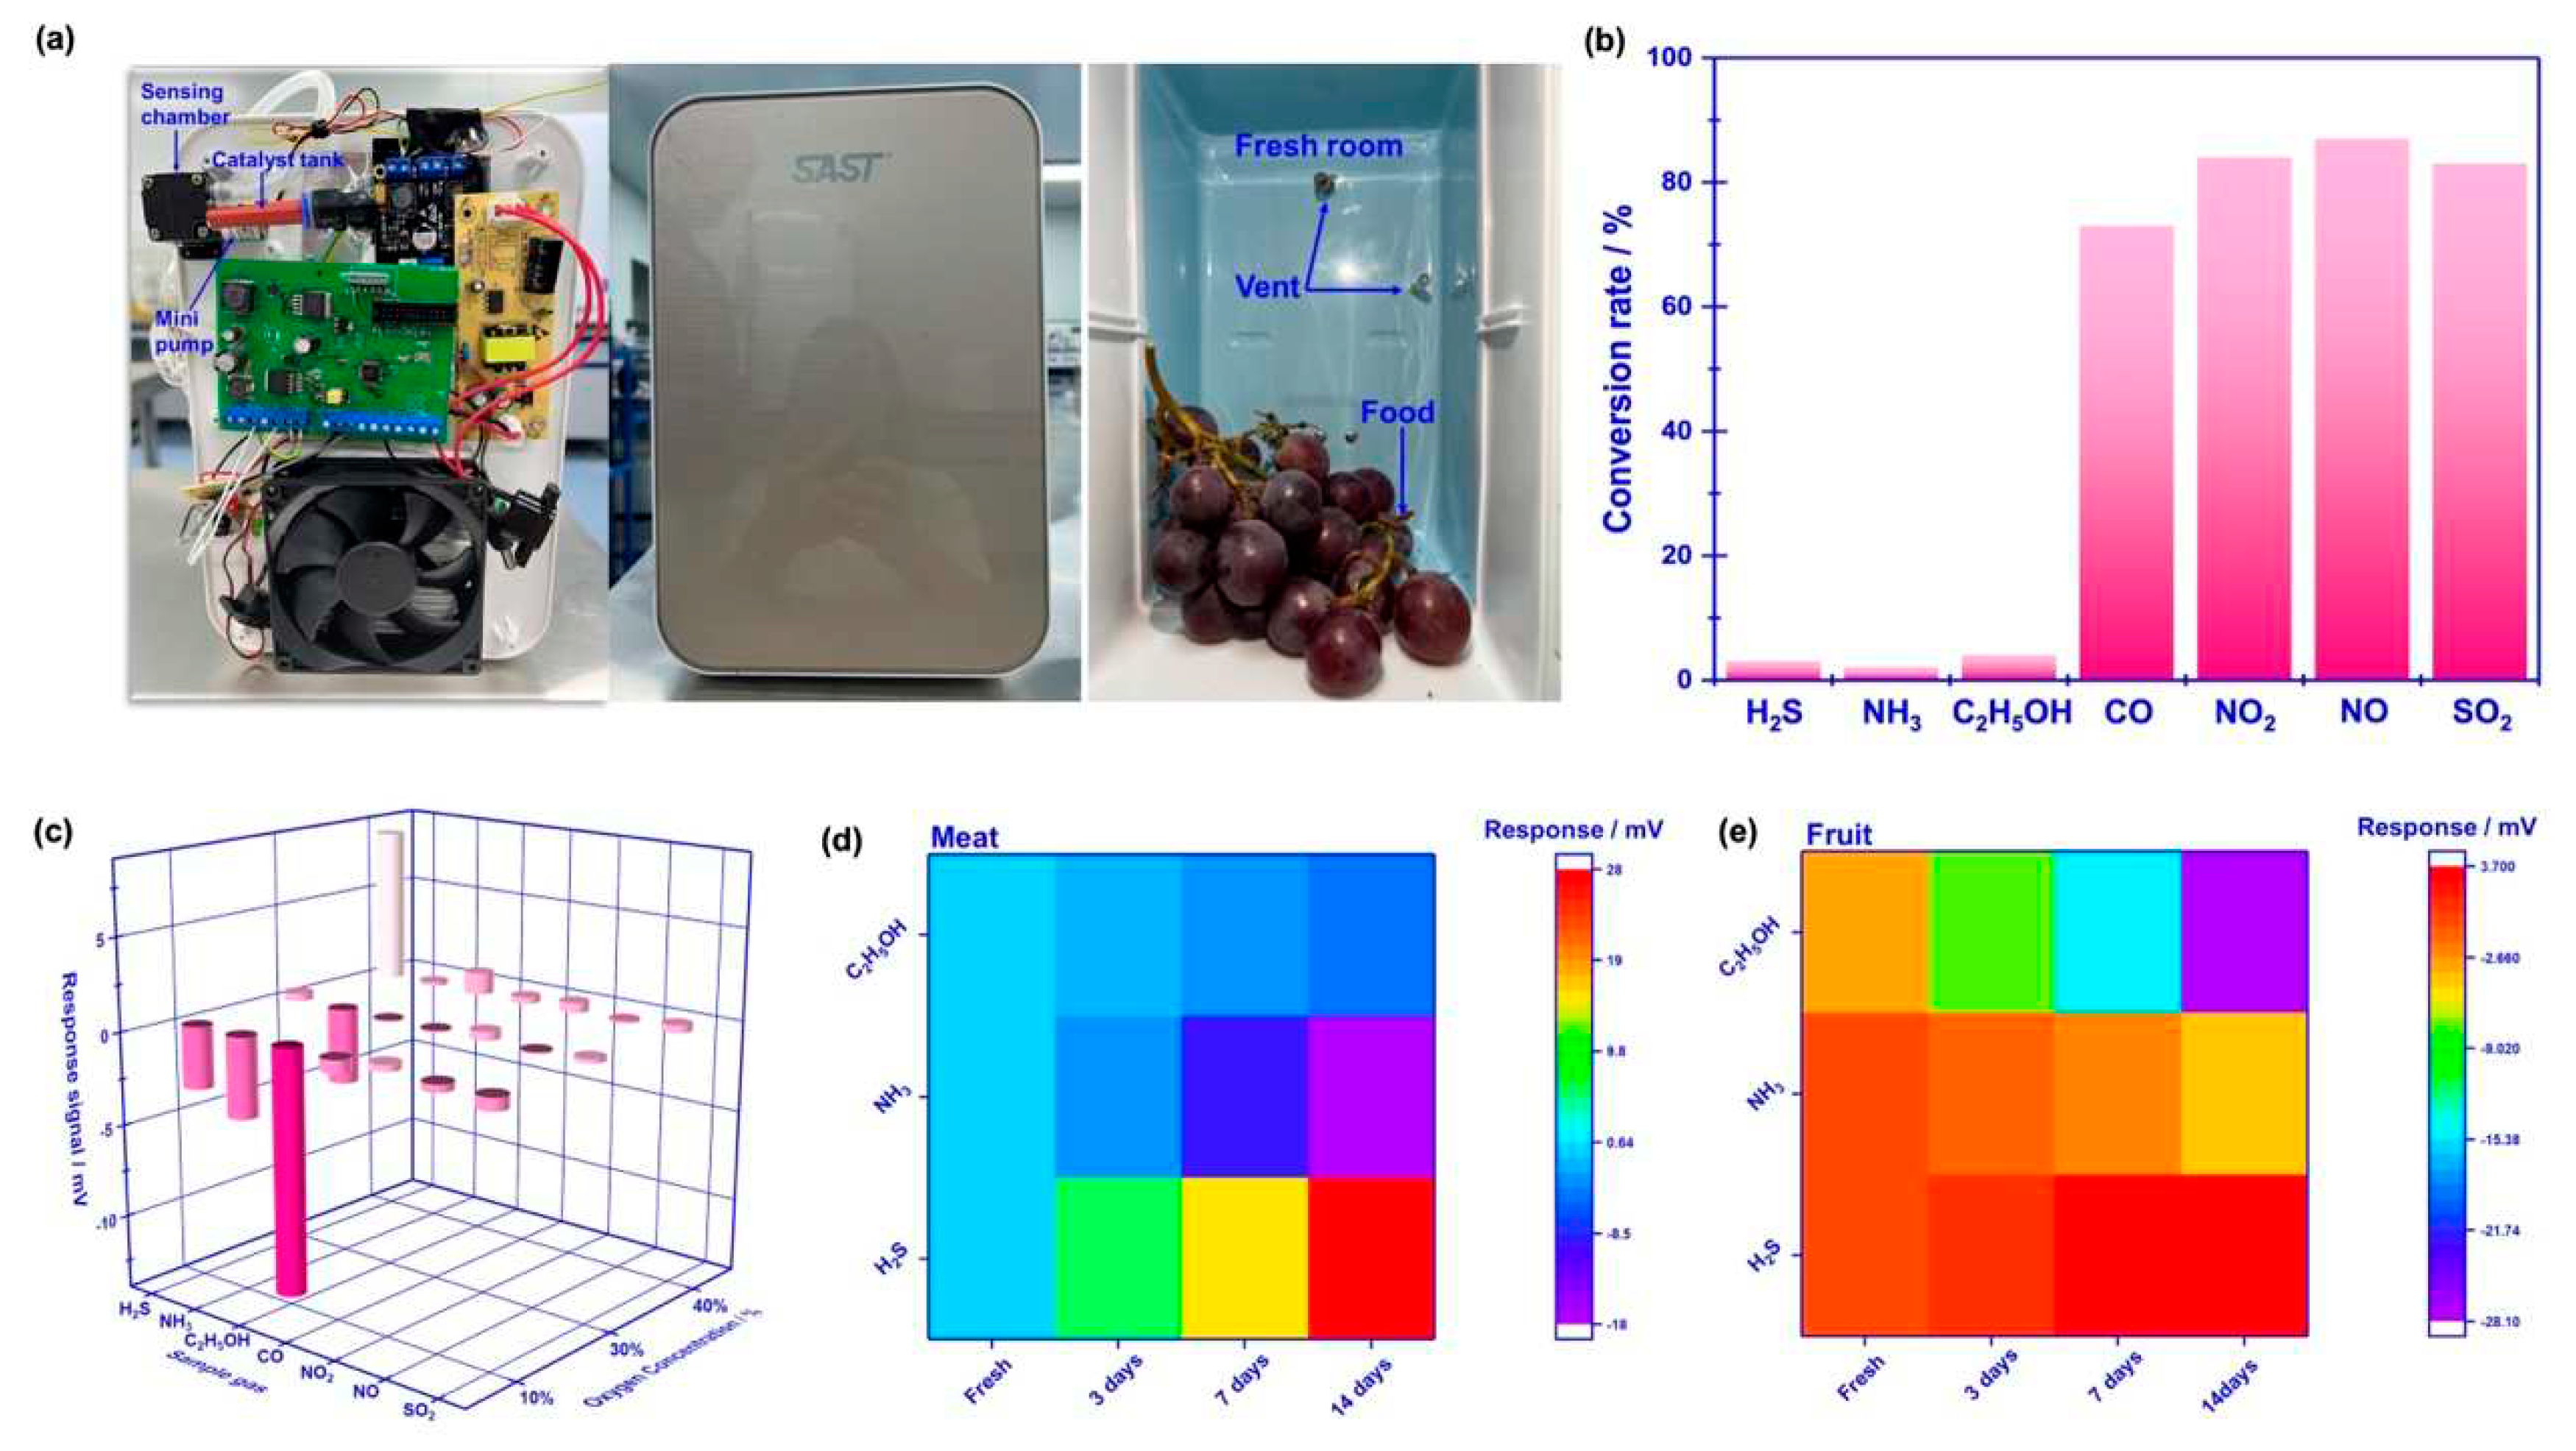
Figure 8.
Photograph of pork and selected fruits that kept for different time.
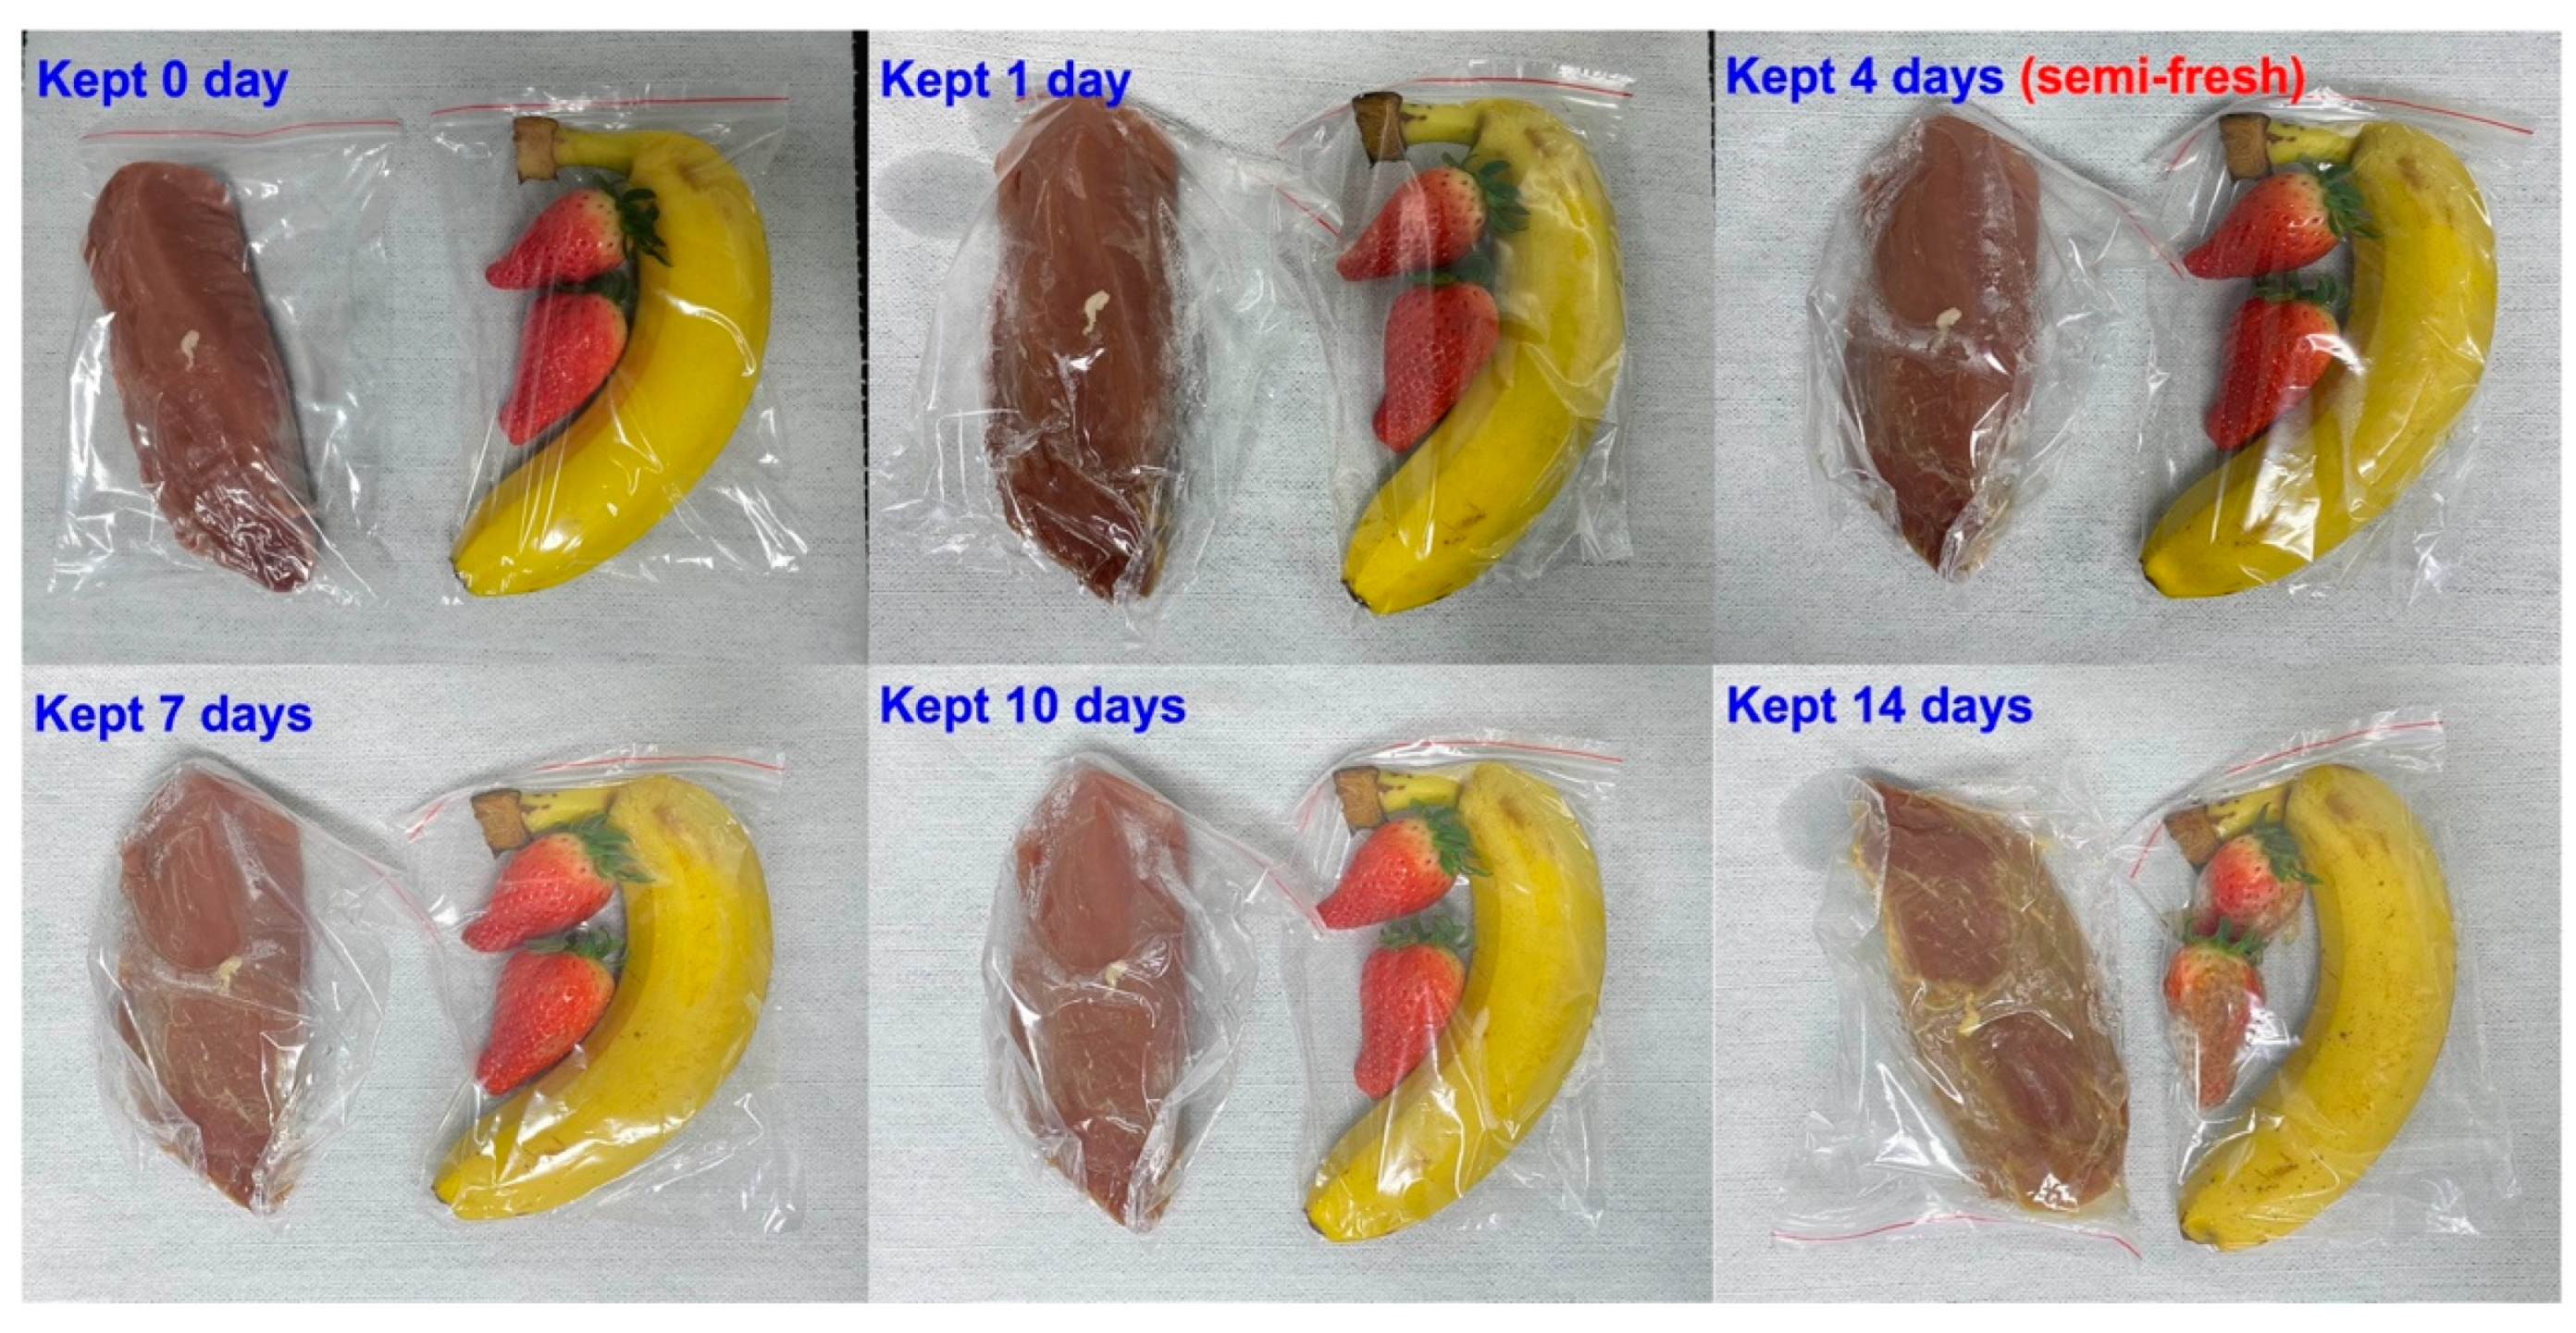
Figure 9.
Pilot results of the (a) meat and (b) fruit freshness monitoring for the designed refrigerator prototype, depicted in the form of PCA map.
Disclaimer/Publisher’s Note: The statements, opinions and data contained in all publications are solely those of the individual author(s) and contributor(s) and not of MDPI and/or the editor(s). MDPI and/or the editor(s) disclaim responsibility for any injury to people or property resulting from any ideas, methods, instructions or products referred to in the content. |
© 2023 by the authors. Licensee MDPI, Basel, Switzerland. This article is an open access article distributed under the terms and conditions of the Creative Commons Attribution (CC BY) license (http://creativecommons.org/licenses/by/4.0/).
Copyright: This open access article is published under a Creative Commons CC BY 4.0 license, which permit the free download, distribution, and reuse, provided that the author and preprint are cited in any reuse.


