Submitted:
20 August 2023
Posted:
22 August 2023
You are already at the latest version
Abstract
Background: A prognostic index validated for the outcomes of advanced high-grade serous ovarian cancer (HGSOC) patients with neoadjuvant chemotherapy (NACT) is still lacking. We therefore developed an ovarian neoadjuvant chemotherapy prognostic index (ONCPI) to enhance predictive accuracy.
Methods: We analyzed clinicopathologic feature of advanced HGSOC patients receiving platinum-based NACT. Blood inflammatory composite markers were calculated and binary-transformed by optimal cutoffs. The omental hematoxylin and eosin (H&E) stained slides were selected for the assessment of chemotherapy response score (CRS). Logistic regression analyses and Cox proportional hazard regression model were utilized to develop a prognostic index.
Results: Multivariate analysis showed that CRS and neutrophils-to-lymphocyte ratio (NLR) are independent risk factors for platinum-chemotherapy response. Meanwhile, Kaplan–Meier and Cox regression analysis revealed that CRS score was significantly correlated with PFS and OS, and NLR-high patients was associated with poor OS. We further developed an ONCPI model based on the CRS score and NLR level. Survival analysis suggested that patients with score 0 and 1 of ONCPI were significantly associated with improved PFS and OS.
Conclusions: The ONCPI score emerges as a significant prognostic marker for predicting NACT outcomes in advanced HGSOC patients. Its integration into clinical practice and risk-stratified trial design is conceivable.
Keywords:
high grade serous ovarian cancer
; neoadjuvant chemotherapy
; prognostic index
Introduction
Primary debulking surgery (PDS) followed by platinum-based chemotherapy has been globally approved as the standard treatment for high-grade serous ovarian cancer (HGSOC) and is considered as a crucial treatment approach for this patient population [1]. However, in cases of unresectable disease and high perioperative risk, neoadjuvant chemotherapy (NACT) followed by interval debulking surgery (IDS) has been recommended in clinical practice guidelines for advanced HGSOC patients [2]. Despite the initial high response rate to chemotherapy, there is still a proportion of patients who eventually experience relapse [3]. Therefore, there is a growing need for markers and prognostic factors to evaluate treatment outcomes.
Various tumor and hematological markers have been used to predict the prognostic risk in patients with advanced HGSOC [4,5]. Some blood inflammatory composite markers have been extensively studied for their predictive value in HGSOC, aiding in predicting patients' survival, treatment response, and recurrence [6,7]. Parameters like the neutrophil-to-lymphocyte ratio (NLR), platelet-to-lymphocyte ratio (PLR), monocyte-to-lymphocyte ratio (MLR), and systemic inflammation index (SII) are commonly employed [8,9]. Increasing evidences indicated that the presence of an inflammatory microenvironment significantly impacts the malignant characteristics of tumors by regulating biological processes involved in their development [10]. Uncontrolled inflammation can promote tumor growth, which may be reflected in changes in blood inflammatory markers, explaining why even early-stage diagnosed and treated HGSOC patients have poor outcomes [7]. Thus, evaluating inflammatory responses is crucial for prognosticating HGSOC. Additionally, the chemotherapy response score (CRS) has been established as a pathology index that aids in determining prognosis and guiding decision-making in epithelial ovarian cancer [11]. The CRS system as a simple and reproducible histopathological grading system was firstly proposed by Böhm et al [12]. Based on 2019 ESMO ovarian cancer guidelines, the three-tiered CRS system was recommended for advanced patients receiving NACT to assess chemotherapy response and predict survival outcomes [13]. To put it simple, CRS 1 suggests minimal chemotherapy response, characterized by few fibroinflammatory changes. CRS 2 indicates moderate response with visible tumor cells and degenerative changes. CRS 3 signifies near-complete response with few scattered tumor foci and significant degeneration-associated changes [14]. Recent research has shown that patients with a complete chemotherapy response have significantly better survival rates compared to those with a partial or no response [14]. Although these prognostic markers are associated with improved oncological outcomes, a more precise and objective system based on validated prognostic markers for the neoadjuvant setting is essential.
In the present study, we developed an ovarian neoadjuvant chemotherapy prognostic index (ONCPI) model to predict prognostic value in advanced HGSOC patients who underwent NACT followed by resection based on objective histopathological and blood parameters that can be readily evaluated in routine clinical practice.
Materials and Methods
Patients
This single-center, retrospective study was conducted at the Department of Obstetrics and Gynecology, Sun Yat-sen Memorial Hospital of Sun Yat-sen University in Guangzhou, China. Patients were enrolled with advanced HGSOC receiving platinum-based neoadjuvant chemotherapy (NACT) before interval debulking surgery (IDS) and postoperative adjuvant chemotherapy from July 2013 to March 2022. This study was reviewed and approved by the Institutional Review Board of Sun Yat-sen Memorial Hospital (SYSKY-2023-600-01). Eligible patients were selected based on the following inclusion criteria: 1) confirmed diagnosis of HGSOC by two experienced pathologists; 2) clinical stage III-IVB according to the 2018 International Federation of Gynecology and Obstetrics (FIGO) guideline; 3) Eastern Cooperative Oncology Group (ECGO) performance status of 0 to 1; 4) no prior anti-cancer therapy; 5) receiving ≥ 3 cycles of platinum-based NACT followed by IDS; and 6) complete pre-treatment blood test results and clinical and imaging data. Patients with other pathological types, without NACT or IDS, incomplete pre-treatment data, or lost to follow up were excluded from the study. A total of 139 patients met the eligibility criteria were included in the study.
Clinical Characteristics and Laboratory Testing
This study enrolled patients with advanced HGSOC who met the inclusion criteria mentioned above. The enrolled patients received NACT in a 3-week cycle for ≥ 3 cycles, followed by IDS upon completion of NACT. Various clinicopathologic variables, including age, FIGO 2018 clinical stage, histologic grade, Eastern Cooperative Oncology Group (ECOG) score, body mass index (BMI), and routine laboratory parameters were collected retrospectively from medical records. The routine blood tests and tumor marker measurements, including CA125, HE4, and inflammation-related serum biomarkers including neutrophils, lymphocytes, monocytes, fibrinogen, and platelets, were conducted within 3 days before initial NACT. From these measurements, several ratios were calculated, including neutrophils-to-lymphocyte ratio (NLR), monocytes-to-lymphocyte ratio (MLR), fibrinogen-to-lymphocyte ratio (FLR), platelet-to-lymphocyte ratio (PLR), and systemic immune-inflammation index (SII = platelet count × NLR). Progression free survival (PFS) was calculated from the date of the first NACT until disease progression or death due to any cause. Similarly, overall survival (OS) was calculated from the date of the first NACT administration until death due to any cause. Patients who had not experienced progression nor death at the data cutoff date in Dec 2022 were considered as censored at the time of the last follow-up.
Radiological and Pathological Response Evaluation
Radiographic responses were evaluated with computed tomography (CT) before and after NACT by a radiologist who was blinded to the clinical information of patients. The response evaluation was conducted according to the Response Evaluation Criteria in Solid Tumors (RECIST, version 1.1). For pathological evaluation, the resected specimens were stained with haematoxylin and eosin (H&E) and reviewed independently by two gynecologic pathologists, both of whom were blind to clinical data and each other’s results. Consensus was reached for the evaluation of all cases. The pathology slide obtained from the site of omentum, which was usually with most viable tumor, was selected for CRS assessment according to the three-tiered CRS system recommended by 2019 European Society for Medical Oncology (ESMO) ovarian cancer guidelines [15]. Briefly, the CRS score is summarized as follows: CRS 1: No or minimal tumor response. CRS 2: Incomplete tumor response. CRS 3: Complete or near-complete response with almost no residual tumor.
Statistical Analysis
Categorical variables were described with proportions and compared using either Chi-square test or Fisher exact test. Continuous variables were described with medians (range), medians with interquartile range (IQR) or mean with standard deviation (SD) and estimated by Student’s t-test or Mann Whitney U test if applicable. The optimal cutoff values for blood test results were determined using the Receiver Operating Characteristic (ROC) curve according to Youden index, and subsequently transformed into binary variables. For NLR, the optimal cutoff value was set at 3.61. Univariate and multivariate logistic regression analysis were employed to identify independent risk factors for patients’ response to platinum chemotherapy. Survival analyses were conducted using Cox proportional hazard regression model and Kaplan–Meier method. The reported P value in this paper were two-tailed and considered statistically significant when less than or equal to 0.05. All statistical analyses were performed with the GraphPad Prism software 8 (GraphPad Software Inc., San Diego, CA) and IBM SPSS Statistics for Windows, version 26.0 (IBMCorp., Armonk, N.Y., USA).
Results
Baseline Clinicopathological Characteristics of Advanced HGSOC Patients
The present study retrospectively enrolled 465 patients with advanced ovarian cancer at the Department of Obstetrics and Gynecology, Sun Yat-sen Memorial Hospital (Guangzhou, China) from July 2013 to March 2022. The exclusion criteria were as follows: other pathological types (n = 53), without NACT or IDS (n = 251), incomplete pre-treatment data (n = 10), and lost to follow up (n = 12). Finally, 139 advanced HGSOC patients who received NACT with complete clinicopathological information were included (Figure 1). In the Table 1, the median age of the 139 patients was 57 years (range, 32–75 years). The Body Mass Index (BMI) was 22.2 ± 3.7 kg/cm2. Eastern cooperative oncology group (ECOG) score was 0 in 116 patients (83.5%), and 1 in 23 patients (16.5%). Moreover, there were 50 (35.9%) patients with CRS 1, 20 (20.9%) patients with CRS2 and 60 (43.2%) patients with CRS3. 119 (85.6%) underwent 3 cycles of NACT and most patients were clinical FIGO 2018 III stage. After NACT, treatment efficacy was assessed per NCCN guidelines. For primary tumor, 115 (82.7%) patients who relapse 6 months or more after initial chemotherapy are termed platinum-sensitive. However, 24 (17.3%) patients whose disease recurs in less than 6 months were classified as platinum-resistant. More importantly, the median follow-up time was 41 months (interquartile range (IQR), 27-58 months) with 51.1% (71/139) patients experiencing recurrence and 23.0% (32/139) death. The median platinum-free interval (PFI) time was 12.8 months (IQR, 7.3-24.9 months) and median progression-free survival (PFS) and overall survival (OS) were 20.2 months (IQR, 12.7-30.5 months) and 30.5 months (IQR 20.6-44.5 months) respectively.
CRS and NLR Level as Risk Factors for Efficacy of Platinum-Based Chemotherapy
To identify the independent risk factors for the efficacy NACT treatment, we further analyzed the correlation between clinicopathological features, laboratory data, and NACT response in advanced HGSOC patients (Table 2 and Figure S1). To enhance clinical value and statistical convenience, the optimal cutoff values for blood test results were calculated by ROC curve based on Youden index and then transformed into binary variables. The optimal cutoff values defined are displayed in Table S1. Univariate analysis demonstrated that CRS score (95% CI: 0.215-0.683, p = 0.001), neutrophils (95% CI: 1.125-6.924, p = 0.027), and NLR level (95% CI: 1.151-11.152, p = 0.028) were associated with response to the platinum-based chemotherapy. Moreover, in the multivariate analysis, the CRS score (95% CI: 0.226-0.742, p = 0.003) and NLR level (95% CI: 1.025-13.913, p = 0.046) remained correlated with the chemotherapy efficacy indicating that both CRS score and NLR level emerged as risk factors for platinum-based chemotherapy resistance in advanced HGSOC patients.
Given the pivotal roles suggested by our aforementioned analyses in NACT efficacy, we incorporated a waterfall plot of platinum-free interval, alongside individual patient profiles, to further explore the relationship between key risk factors and NACT treatment (Figure 2). We found that 66.6% of platinum-resistant patients corresponded to CRS 1, while 48.7% of platinum-sensitive patients were CRS 3 (Figure 3A). However, no discernible correlation emerged between CRS and clinical characteristics of advanced HGSOC patients (Figure 3B-D). We assessed CRS in platinum-free interval level for two representative cases (Case 1: platinum-resistant and Case 2: platinum-sensitive) (Figure 3E). These results further demonstrated that CRS score had the promising predictive value for platinum-based chemotherapy response. Moreover, we evaluated the relationship between the NLR level and the context of distinct clinicopathological factors in our cohort. High NLR level has previously been linked to poor long-term survival in various solid tumors. Consistently, our findings showed that patients with platinum-resistant tended to have high NLR, whereas patients with low NLR level were more likely to be platinum-sensitive (Figure 4A). Interestingly, NLR level was associated with the CRS score. The higher NLR in CRS1 than CRS3 suggested that the high inflammatory conditions could lead to no response to NACT treatment (Figure 4B). However, there was no correlation between the NLR level and the clinical characteristics of advanced HGSOC patients (Figure 4C-F). Overall, these results collectively underscore the robust predictive value of CRS and NLR level for platinum-based chemotherapy response in advanced HGSOC patients.
CRS and NLR Level as Robust Prognostic Index after NACT in Advanced HGSOC Patients
Numerous studies have linked chemotherapy-induced resistance to unfavorable outcomes in advanced HGSOC patients [16,17]. Although our data has indicated that CRS and NLR level are independent risk factors for the efficacy of platinum-based chemotherapy, their prognostic significance in advanced HGSOC patients remains uncertain. Univariate and multivariate analyses of PFS using the Cox proportional hazards model are detailed in Table 3 and Figure S2. Univariate analysis revealed that CRS (p = 0.000, HR = 0.535, 95% CI: 0.407-0.705), neutrophils count (p = 0.008, HR = 1.883, 95% CI: 1.178-3.009) and NLR (p = 0.026, HR = 1.788, 95% CI: 1.072-2.982) significantly associated with shorter PFS. Multivariable analysis confirmed only the association between CRS and inferior PFS (p = 0.000, HR = 0.528, 95% CI: 0.400-0.699). Similarly, in univariate analysis of OS, the CRS (p = 0.000, HR = 0.408, 95% CI:1.882-9.419), neutrophils count (p = 0.000, HR = 4.210, 95% CI = 1.178-3.009), fibrinogen concentration (p = 0.026, HR = 2.280, 95% CI: 1.105-4.704), NLR (p = 0.002, HR = 9.304, 95% CI: 2.219-39.001) and SII (p = 0.002, HR = 3.101, 95% CI: 1.511-6.361) corrected with inferior OS. These variables were then entered into a multivariable Cox hazards model. The analyses showed that the CRS (p = 0.004, HR = 0.518, 95% CI: 0.331-0.810) and NLR (p = 0.012, HR = 6.463, 95% CI: 1.510-27.670) were the independent prognostic factors for OS in the advanced HGSOC patients (Table 4 and Figure S3).
Kaplan-Meier survival curves, categorized by CRS and NLR level, were further examined. PFS curves revealed disparities among CRS1, CRS2, and CRS3 subgroups (Figure 5A). Consistent with these findings, patients with CRS1 or CRS2 (on a 3-tiered system) correlated with notably shorter overall survival compared to CRS3 (Figure 5B). Notably, patients with CRS3 demonstrated significantly improved PFS and OS compared to those with CRS1 and CRS2. Additionally, high NLR level was significantly associated with poor PFS (p = 0.0048, HR = 1.876, 95% CI = 1.169-3.012) and OS (p = 0.0007, HR = 9.123, 95% CI = 4.465-18.640) (Figure 5C-D). emphasized the prognostic importance of CRS1/2 scores and elevated NLR levels, indicating their robust prognostic value in advanced HGSOC patients receiving NACT. Consequently, we propose an integration of these metrics, aiming to develop a clinically useful scoring index for predicting outcomes of platinum-based chemotherapy in advanced HGSOC patients.
Combined CRS and NLR as New Prognostic Index for NACT Outcomes in Patients with Advanced HGSOC
Given the robust prognostic nature of both CRS score and NLR level, we speculated that their combination could offer insights into NACT treatment resistance among advanced HGSOC patients, leading to the development of an ovarian neoadjuvant chemotherapy prognostic index (ONCPI). ONCPI scoring was established: low NLR (≤ 3.61) received 0, high NLR (> 3.61) received 1 and CRS1, CRS2, CRS3 corresponded to 2, 1, 0, respectively. Therefore, the ONCPI scoring ranged from 0 to 3. To summarize: Score 0: low NLR (≤ 3.61) + CRS3; Score 1: low NLR (≤ 3.61) + CRS2 or high NLR (> 3.61) + CRS3; Score 2: low NLR (≤ 3.61) + CRS1 or high NLR (> 3.61) + CRS2; Score 3: high NLR (>3.61) + CRS1. Of the 139 evaluated patients, 27 (36%) had score 0 of ONCPI, 46 (49%) had score 1 of ONCPI, 28 (49%) had score 2 of ONCPI and 38 (15%) had score 3 of ONCPI. Median PFS was 28.1 months (IQR, 17.2 to 41.4 months), 25.6 months (IQR, 15.1 to 33.2 months), 15.6 months (IQR, 12.0 months to 25.1 months) and 13.1 months (IQR, 9.6 months to 21.6 months) for the ONCPI score of 0, 1, 2, 3, respectively (p<0.001). In addition, Median OS was 40.5 months (IQR, 27.7 months to 51.8 months), 30.5 months (IQR, 22.7 months to 45.4 months), 29.6 months (IQR, 20.1 months to 42.6 months) and 24.2 months (IQR, 12.0 months to 38.4 months) for the ONCPI score of 0, 1, 2, 3, respectively (p<0.001) (Table 5). Kaplan-Meier survival curve showed that patients with ONCPI score of 0 and 1 have a significantly improved PFS and OS compared with the score of 2 and 3 (Figure 6). These findings indicated that incorporating CRS with NLR as ONCPI predictive model could be a promising diagnostic tool to identify the outcomes in advanced HGSOC patients responsive to NACT treatment.
Discussion
NACT is a common approach in treating ovarian cancer patients with advanced disease or when upfront surgery is unfeasible or unsafe [3,18]. Growing evidence endorses the application of NACT in advanced HGSOC patients, potentially leading to improved both PFS and OS [19,20]. However, patient outcomes still fall short of satisfactory. In light of this, we conducted a retrospective study to identify the independent prognostic markers in advanced HGSOC patients who underwent NACT followed by IDS.
Multivariate analysis unveiled a significant association between CRS (3 vs 2 vs 1) and NLR (high NLR > 3.61 vs low NLR ≤ 3.61) with platinum-based chemotherapy efficacy. The chemotherapy response is typically evaluated using established scoring systems, such as CRS [1]. In our cohort, CRS1, CRS2, and CRS3 accounted for 35.9%, 20.9%, and 43.2% of patients, respectively. Notably, 68.6% of platinum-resistant patients progressed to CRS1, while 48.7% of platinum-sensitive patients exhibited CRS3. Survival analyses further indicated that CRS significantly correlated with PFS and OS. These results demonstrated that the CRS might be an appropriate predictor. As we know, NLR was defined as a readily available and cost-effective biomarker assessing the balance between neutrophils and lymphocytes in the blood [21]. It also was recognized as a potential prognostic marker in various cancers, including HGSOC [22]. Previous studies have indicated that elevated NLR level before or during NACT might be associated with a poorer prognosis in ovarian cancer patients [23,24], as higher NLR are often indicative of systemic inflammation, promoting tumor growth, invasion, metastasis, and resistance to chemotherapy [22,24]. We found that patients with platinum-resistant tended to have high NLR level, whereas patients with low NLR level were more likely to be platinum-sensitive, which was consistent with the results of previous studies. Although the independent prediction of NLR level was not confirmed in multivariate analysis for PFS, low NLR significantly extended OS. Therefore, NLR can serves as a key piece of information to aid clinical decision-making. These findings supported the conclusion that CRS and NLR level might be potential independent prognostic factors for NACT-treated advanced HGSOC patients. However, in our study, nearly 29.6% CRS 1 patients were recognized as platinum-sensitive, and some of them had a favorable prognosis, suggesting limited CRS prediction. Thus, a precise, validated, neoadjuvant-specific system is needed.
Our analysis highlighted a significant relationship between NLR and CRS in predicting patient prognosis. Interestingly, CRS1 patients demonstrated higher NLR levels than CRS3 patients, suggesting inflammatory status influenced NACT outcomes negatively. We therefore developed a ONCPI score, a combined index integrating NLR and CRS to predict prognostic value in neoadjuvant-treated advanced HGSOC patients. Previous studies have explored various combined indexes to predict the prognosis of ovarian cancer, typically integrating NLR with tumor and hematological markers or radiological data, such as the CA-125, PLR, SII and PET/CT or MRI characteristics [5,24,25]. Although these combined indexes have demonstrated their influence on disease progression and response to treatment, it is rare to find an index that encompasses both blood inflammatory composite markers and pathology index in specific patients. Therefore, the ONCPI score offers a novel approach by providing a more comprehensive and intuitive assessment of the host immune status and the tumor response to platinum-based chemotherapy. This index holds potential benefits for risk stratification, treatment decision-making, and identification of advanced HGSOC patients who may benefit from more aggressive therapeutic strategies or additional follow-up care.
Despite these promising findings, our study has several limitations. Firstly, this is a single-center retrospective analysis, which may introduce selection bias and limit the generalizability of the results. Additionally, the relatively limited sample size might impact the statistical power and precision of the findings. Therefore, further validation in larger prospective studies is warranted to establish the predictive value of the ONCPI score in a broader patient population.
Conclusions
In conclusion, our study highlights the significance of CRS score and NLR level as independent prognostic factors. Moreover, we have successfully devised a prognostic index for advanced HGSOC patients undergoing NACT, which distinctly reflects patient outcomes using these readily available clinical parameters. The utilization of the ONCPI score has the potential to greatly inform the design of future clinical trials and facilitate personalized treatment strategies.
Supplementary Materials
Supporting Information is available from the author.
Author Contributions
Conception and design, Huaiwu Lu, and Bowen Li. Development of Methodology, Bowen Li, Huaiwu Lu and Xinyuan Lei. Data Acquisition, Chuying Huo, Bin Wu, Dongdong Ye, Yuhao Zhang and Bowen Li. Data Analysis & Interpretation, Chuying Huo, Bin Wu, Dongdong Ye, Miaochun Xu. Writing, Reviewing, and/or Revision of Manuscript, Chuying Huo, Bowen Li and Huaiwu Lu. Administrative, Technical, and Material Support, Shaolin Ma, Aoshuang Cheng, Yunyun Liu, Chunxian Huang, Zhongqiu Lin. Study Supervision, Huaiwu Lu, Bowen Li and Xinyuan Lei.
Funding
This research was funded by Guangdong Basic and Applied Basic Research Foundation (2022A1515012432), Beijing Xisike Clinical Oncology Research Foundation (Y-Young2022--0145) and Sun Yat-sen Clinical Research Cultivating Program (SYS-C-202001), China Postdoctoral Science Foundation (Grant No. 2021M703692); Department of Health of Guangdong Province Science Foundation (Grant No. A2022165).
Institutional Review Board Statement
The study was reviewed and approved by the Institutional Review Board of Sun Yat-sen Memorial Hospital (SYSKY-2023-600-01).
Informed Consent Statement
Informed consent was obtained from all patients involved in the study.
Data Availability Statement
The data supporting the results of this study are available from the corresponding authors upon reasonable request.
Acknowledgments
The authors express sincere appreciation to all the individuals involved in the improvement of this manuscript. Special thanks are extended to two experienced pathologists, Chao Qin and Huiying Chen, for their invaluable support in conducting pathological evaluation.
Conflicts of Interest
The authors declare no conflict of interest.
References
- Wu, M.F.; Liang, J.X.; Li, H.; Ye, Y.F.; Liang, W.F.; Wang, L.J.; Zhang, B.Z.; Chen, Q.; Lin, Z.Q.; Li, J. Effects of neoadjuvant hyperthermic intraperitoneal chemotherapy on chemotherapy response score and recurrence in high-grade serous ovarian cancer patients with advanced disease: A multicentre retrospective cohort study. Bjog 2022, 129 Suppl 2, 5–13. [Google Scholar] [CrossRef]
- Colombo, N.; Sessa, C.; du Bois, A.; Ledermann, J.; McCluggage, W.G.; McNeish, I.; Morice, P.; Pignata, S.; Ray-Coquard, I.; Vergote, I.; et al. ESMO-ESGO consensus conference recommendations on ovarian cancer: pathology and molecular biology, early and advanced stages, borderline tumours and recurrent disease†. Ann Oncol 2019, 30, 672–705. [Google Scholar] [CrossRef] [PubMed]
- Armstrong, D.K.; Alvarez, R.D.; Bakkum-Gamez, J.N.; Barroilhet, L.; Behbakht, K.; Berchuck, A.; Chen, L.M.; Cristea, M.; DeRosa, M.; Eisenhauer, E.L.; et al. Ovarian Cancer, Version 2.2020, NCCN Clinical Practice Guidelines in Oncology. J Natl Compr Canc Netw 2021, 19, 191–226. [Google Scholar] [CrossRef] [PubMed]
- Liontos, M.; Andrikopoulou, A.; Koutsoukos, K.; Markellos, C.; Skafida, E.; Fiste, O.; Kaparelou, M.; Thomakos, N.; Haidopoulos, D.; Rodolakis, A.; et al. Neutrophil-to-lymphocyte ratio and chemotherapy response score as prognostic markers in ovarian cancer patients treated with neoadjuvant chemotherapy. J Ovarian Res 2021, 14, 148. [Google Scholar] [CrossRef] [PubMed]
- Liang, W.F.; Wang, L.J.; Li, H.; Liu, C.H.; Wu, M.F.; Li, J. The added value of CA125 normalization before interval debulking surgery to the chemotherapy response score for the prognostication of ovarian cancer patients receiving neoadjuvant chemotherapy for advanced disease. J Cancer 2021, 12, 946–953. [Google Scholar] [CrossRef]
- Mezquita, L.; Auclin, E.; Ferrara, R.; Charrier, M.; Remon, J.; Planchard, D.; Ponce, S.; Ares, L.P.; Leroy, L.; Audigier-Valette, C.; et al. Association of the Lung Immune Prognostic Index With Immune Checkpoint Inhibitor Outcomes in Patients With Advanced Non-Small Cell Lung Cancer. JAMA Oncol 2018, 4, 351–357. [Google Scholar] [CrossRef]
- Yang, J.; Ma, J.; Cheng, S.; Wang, Y. The Combination of Plasma Fibrinogen Concentration and Neutrophil Lymphocyte Ratio (F-NLR) as a Prognostic Factor of Epithelial Ovarian Cancer. Onco Targets Ther 2020, 13, 7283–7293. [Google Scholar] [CrossRef] [PubMed]
- Fan, X.; Wang, D.; Zhang, W.; Liu, J.; Liu, C.; Li, Q.; Ma, Z.; Li, H.; Guan, X.; Bai, Y.; et al. Inflammatory Markers Predict Survival in Patients With Advanced Gastric and Colorectal Cancers Receiving Anti-PD-1 Therapy. Front Cell Dev Biol 2021, 9, 638312. [Google Scholar] [CrossRef] [PubMed]
- Sui, Q.; Zhang, X.; Chen, C.; Tang, J.; Yu, J.; Li, W.; Han, K.; Jiang, W.; Liao, L.; Kong, L.; et al. Inflammation promotes resistance to immune checkpoint inhibitors in high microsatellite instability colorectal cancer. Nat Commun 2022, 13, 7316. [Google Scholar] [CrossRef]
- Li, C.; Wu, J.; Jiang, L.; Zhang, L.; Huang, J.; Tian, Y.; Zhao, Y.; Liu, X.; Xia, L.; E, H.; et al. The predictive value of inflammatory biomarkers for major pathological response in non-small cell lung cancer patients receiving neoadjuvant chemoimmunotherapy and its association with the immune-related tumor microenvironment: a multi-center study. Cancer Immunol Immunother 2023, 72, 783–794. [Google Scholar] [CrossRef] [PubMed]
- Rodolakis, I.; Pergialiotis, V.; Liontos, M.; Haidopoulos, D.; Loutradis, D.; Rodolakis, A.; Bamias, A.; Thomakos, N. Chemotherapy Response Score in Ovarian Cancer Patients: An Overview of Its Clinical Utility. J Clin Med 2023, 12. [Google Scholar] [CrossRef]
- Lee, J.Y.; Chung, Y.S.; Na, K.; Kim, H.M.; Park, C.K.; Nam, E.J.; Kim, S.; Kim, S.W.; Kim, Y.T.; Kim, H.S. External validation of chemotherapy response score system for histopathological assessment of tumor regression after neoadjuvant chemotherapy in tubo-ovarian high-grade serous carcinoma. J Gynecol Oncol 2017, 28, e73. [Google Scholar] [CrossRef]
- Betrian, S.; Angeles, M.A.; Gil Moreno, A.; Cabarrou, B.; Deslandres, M.; Ferron, G.; Mery, E.; Floquet, A.; Guyon, F.; Pérez-Benavente, A.; et al. Survival impact of histological response to neoadjuvant chemotherapy according to number of cycles in patients with advanced ovarian cancer. Int J Gynecol Cancer 2022. [Google Scholar] [CrossRef] [PubMed]
- Böhm, S.; Faruqi, A.; Said, I.; Lockley, M.; Brockbank, E.; Jeyarajah, A.; Fitzpatrick, A.; Ennis, D.; Dowe, T.; Santos, J.L.; et al. Chemotherapy Response Score: Development and Validation of a System to Quantify Histopathologic Response to Neoadjuvant Chemotherapy in Tubo-Ovarian High-Grade Serous Carcinoma. J Clin Oncol 2015, 33, 2457–2463. [Google Scholar] [CrossRef] [PubMed]
- Santoro, A.; Angelico, G.; Piermattei, A.; Inzani, F.; Valente, M.; Arciuolo, D.; Spadola, S.; Mulè, A.; Zorzato, P.; Fagotti, A.; et al. Pathological Chemotherapy Response Score in Patients Affected by High Grade Serous Ovarian Carcinoma: The Prognostic Role of Omental and Ovarian Residual Disease. Front Oncol 2019, 9, 778. [Google Scholar] [CrossRef]
- Fagotti, A.; Ferrandina, M.G.; Vizzielli, G.; Pasciuto, T.; Fanfani, F.; Gallotta, V.; Margariti, P.A.; Chiantera, V.; Costantini, B.; Gueli Alletti, S.; et al. Randomized trial of primary debulking surgery versus neoadjuvant chemotherapy for advanced epithelial ovarian cancer (SCORPION-NCT01461850). Int J Gynecol Cancer 2020, 30, 1657–1664. [Google Scholar] [CrossRef] [PubMed]
- Cohen, P.A.; Powell, A.; Böhm, S.; Gilks, C.B.; Stewart, C.J.R.; Meniawy, T.M.; Bulsara, M.; Avril, S.; Brockbank, E.C.; Bosse, T.; et al. Pathological chemotherapy response score is prognostic in tubo-ovarian high-grade serous carcinoma: A systematic review and meta-analysis of individual patient data. Gynecol Oncol 2019, 154, 441–448. [Google Scholar] [CrossRef] [PubMed]
- Vergote, I.; Coens, C.; Nankivell, M.; Kristensen, G.B.; Parmar, M.K.B.; Ehlen, T.; Jayson, G.C.; Johnson, N.; Swart, A.M.; Verheijen, R.; et al. Neoadjuvant chemotherapy versus debulking surgery in advanced tubo-ovarian cancers: pooled analysis of individual patient data from the EORTC 55971 and CHORUS trials. Lancet Oncol 2018, 19, 1680–1687. [Google Scholar] [CrossRef]
- Lei, Z.; Wang, Y.; Wang, J.; Wang, K.; Tian, J.; Zhao, Y.; Chen, L.; Wang, J.; Luo, J.; Jia, M.; et al. Evaluation of Cytoreductive Surgery With or Without Hyperthermic Intraperitoneal Chemotherapy for Stage III Epithelial Ovarian Cancer. JAMA Netw Open 2020, 3, e2013940. [Google Scholar] [CrossRef]
- Kim, S.I.; Kim, J.H.; Lee, S.; Cho, H.; van Driel, W.J.; Sonke, G.S.; Bristow, R.E.; Park, S.Y.; Fotopoulou, C.; Lim, M.C. Hyperthermic intraperitoneal chemotherapy for epithelial ovarian cancer: A meta-analysis. Gynecol Oncol 2022, 167, 547–556. [Google Scholar] [CrossRef]
- Fiore, M.; Ljevar, S.; Pasquali, S.; Morelli, D.; Callegaro, D.; Sanfilippo, R.; Barisella, M.; Sangalli, C.; Miceli, R.; Gronchi, A. Preoperative Neutrophil-to-Lymphocyte Ratio and a New Inflammatory Biomarkers Prognostic Index for Primary Retroperitoneal Sarcomas: Retrospective Monocentric Study. Clin Cancer Res 2023, 29, 614–620. [Google Scholar] [CrossRef]
- Zhao, Z.; Zhao, X.; Lu, J.; Xue, J.; Liu, P.; Mao, H. Prognostic roles of neutrophil to lymphocyte ratio and platelet to lymphocyte ratio in ovarian cancer: a meta-analysis of retrospective studies. Arch Gynecol Obstet 2018, 297, 849–857. [Google Scholar] [CrossRef] [PubMed]
- Cupp, M.A.; Cariolou, M.; Tzoulaki, I.; Aune, D.; Evangelou, E.; Berlanga-Taylor, A.J. Neutrophil to lymphocyte ratio and cancer prognosis: an umbrella review of systematic reviews and meta-analyses of observational studies. BMC Med 2020, 18, 360. [Google Scholar] [CrossRef]
- Henriksen, J.R.; Nederby, L.; Donskov, F.; Waldstrøm, M.; Adimi, P.; Jakobsen, A.; Steffensen, K.D. Prognostic significance of baseline T cells, B cells and neutrophil-lymphocyte ratio (NLR) in recurrent ovarian cancer treated with chemotherapy. J Ovarian Res 2020, 13, 59. [Google Scholar] [CrossRef] [PubMed]
- Wang, J.; Liu, L.; Pang, H.; Liu, L.; Jing, X.; Li, Y. Preoperative PET/CT score can predict incomplete resection after debulking surgery for advanced serous ovarian cancer better than CT score, MTV, tumor markers and hematological markers. Acta Obstet Gynecol Scand 2022, 101, 1315–1327. [Google Scholar] [CrossRef] [PubMed]
Figure 1.
Flowchart of patient selection.
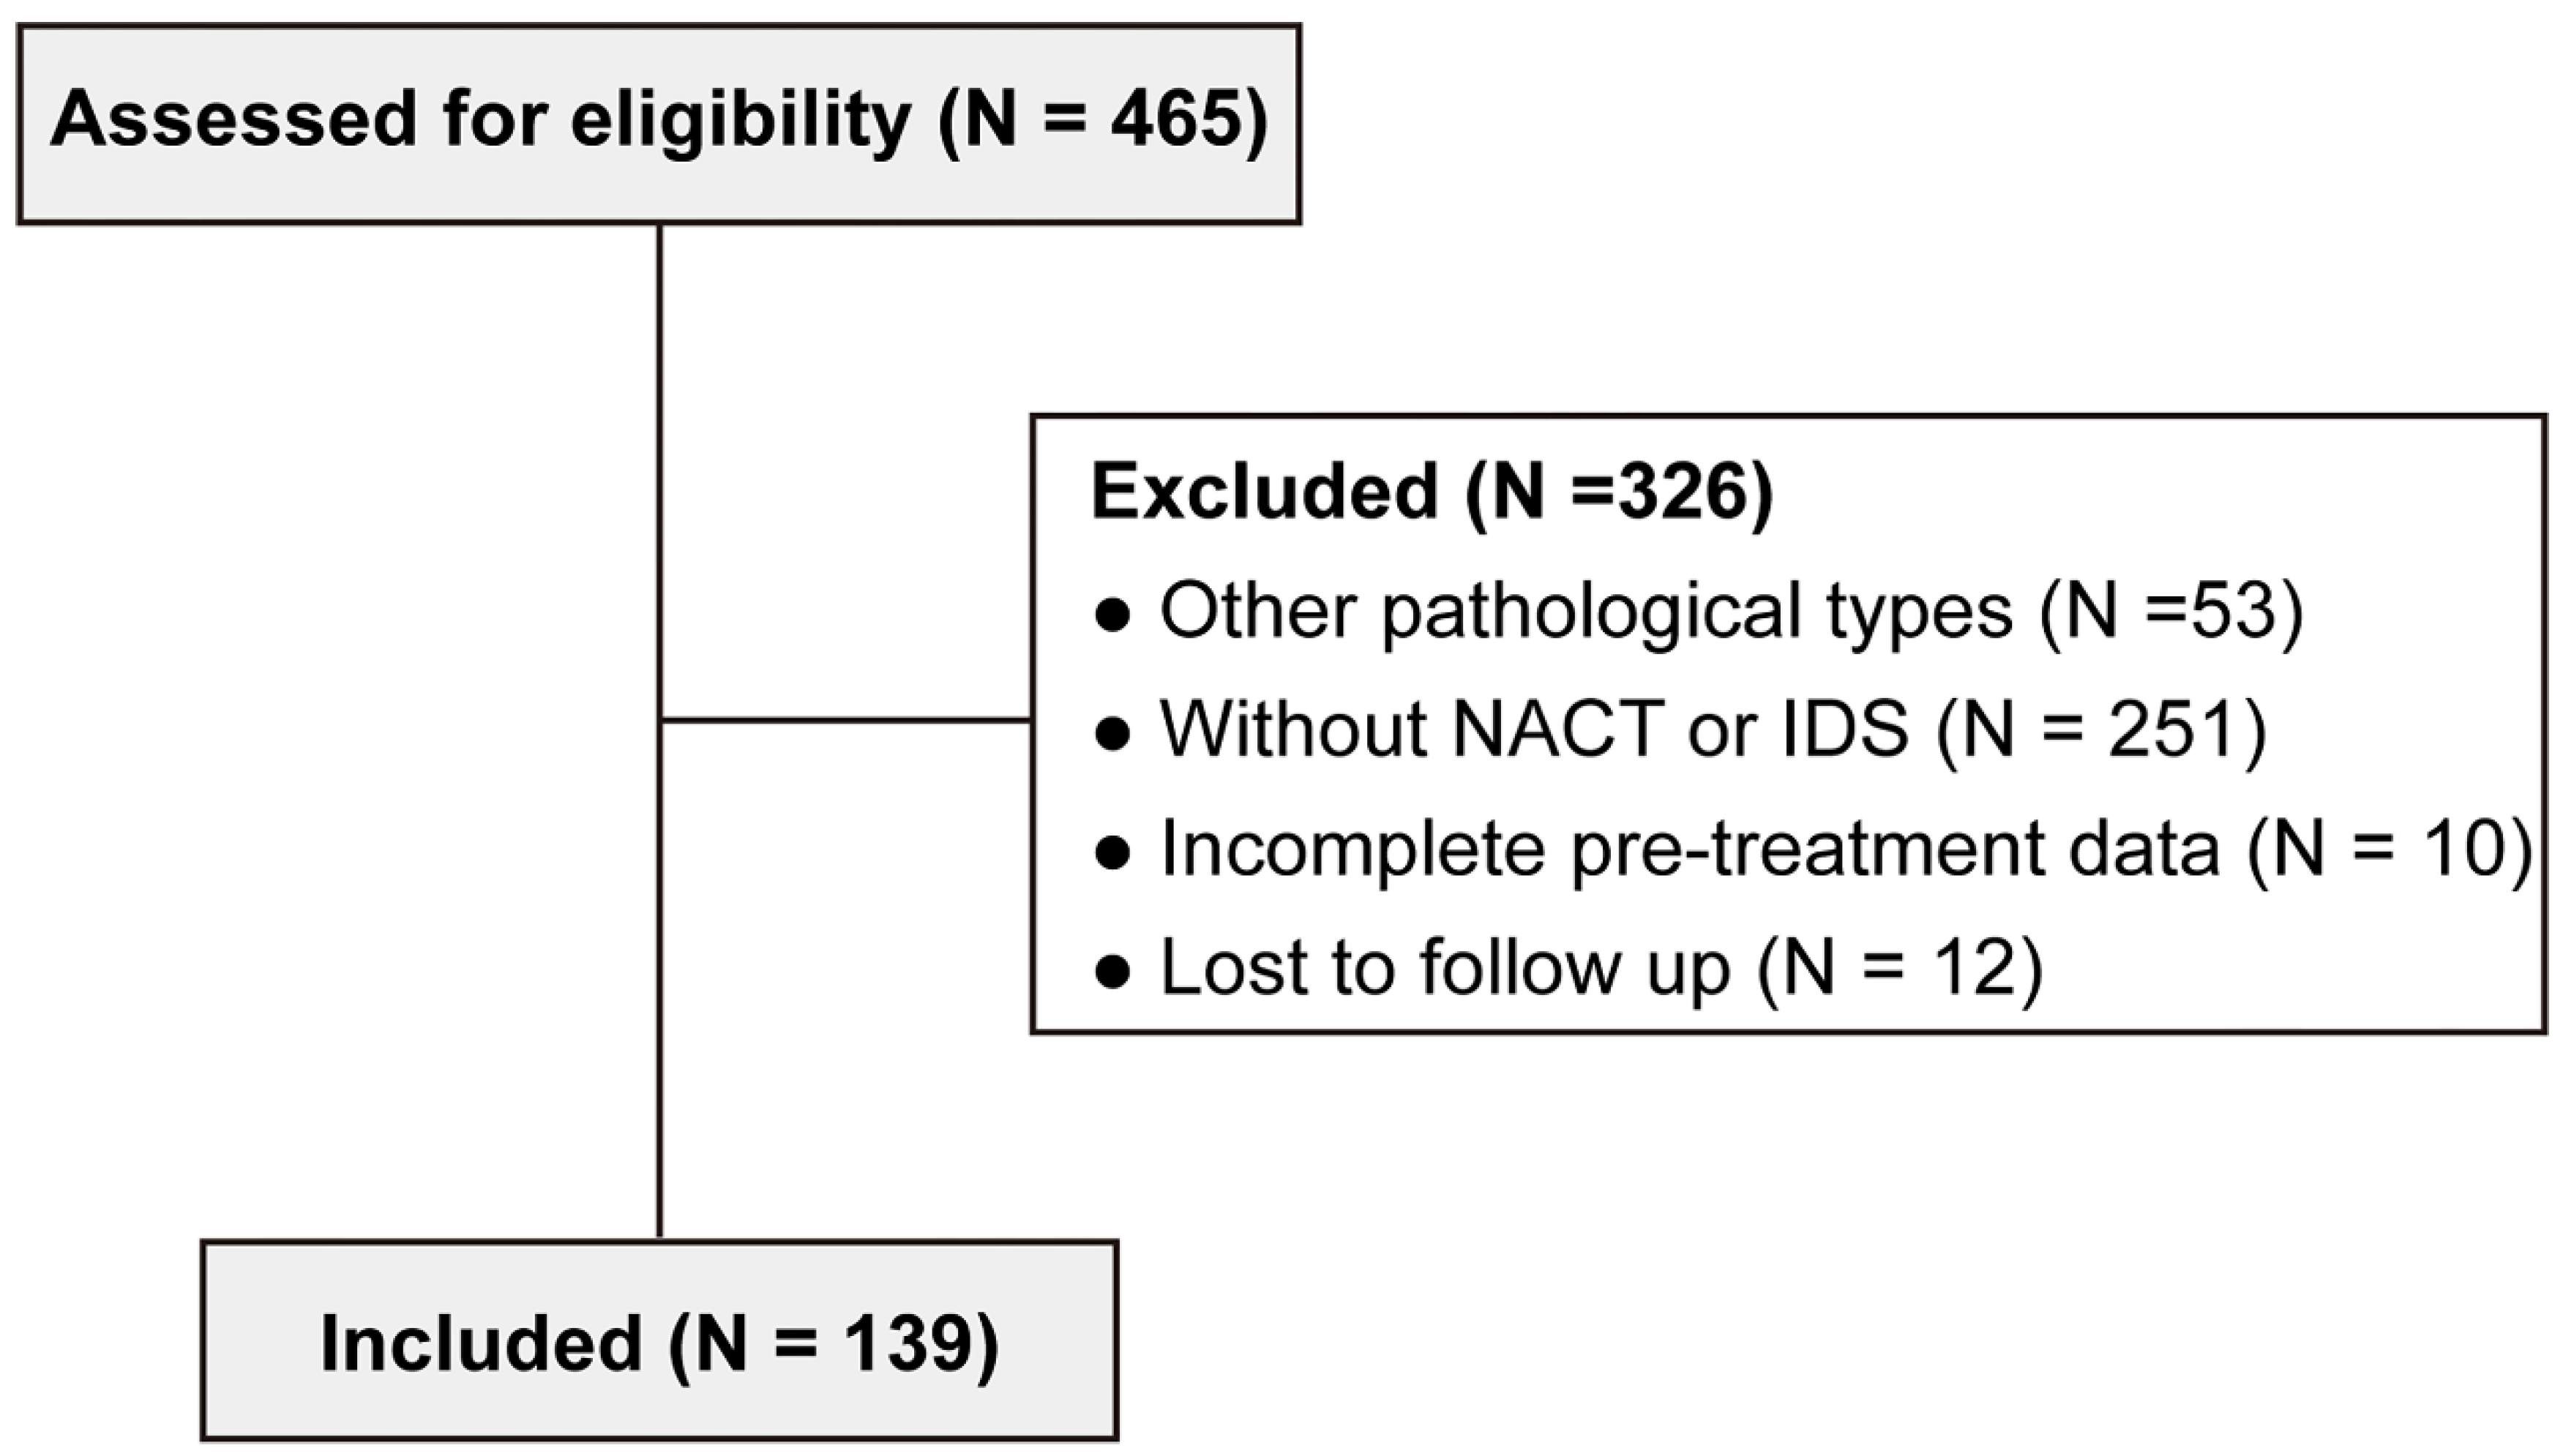
Figure 2.
Waterfall diagram of clinical information of advanced HGSOC patients.
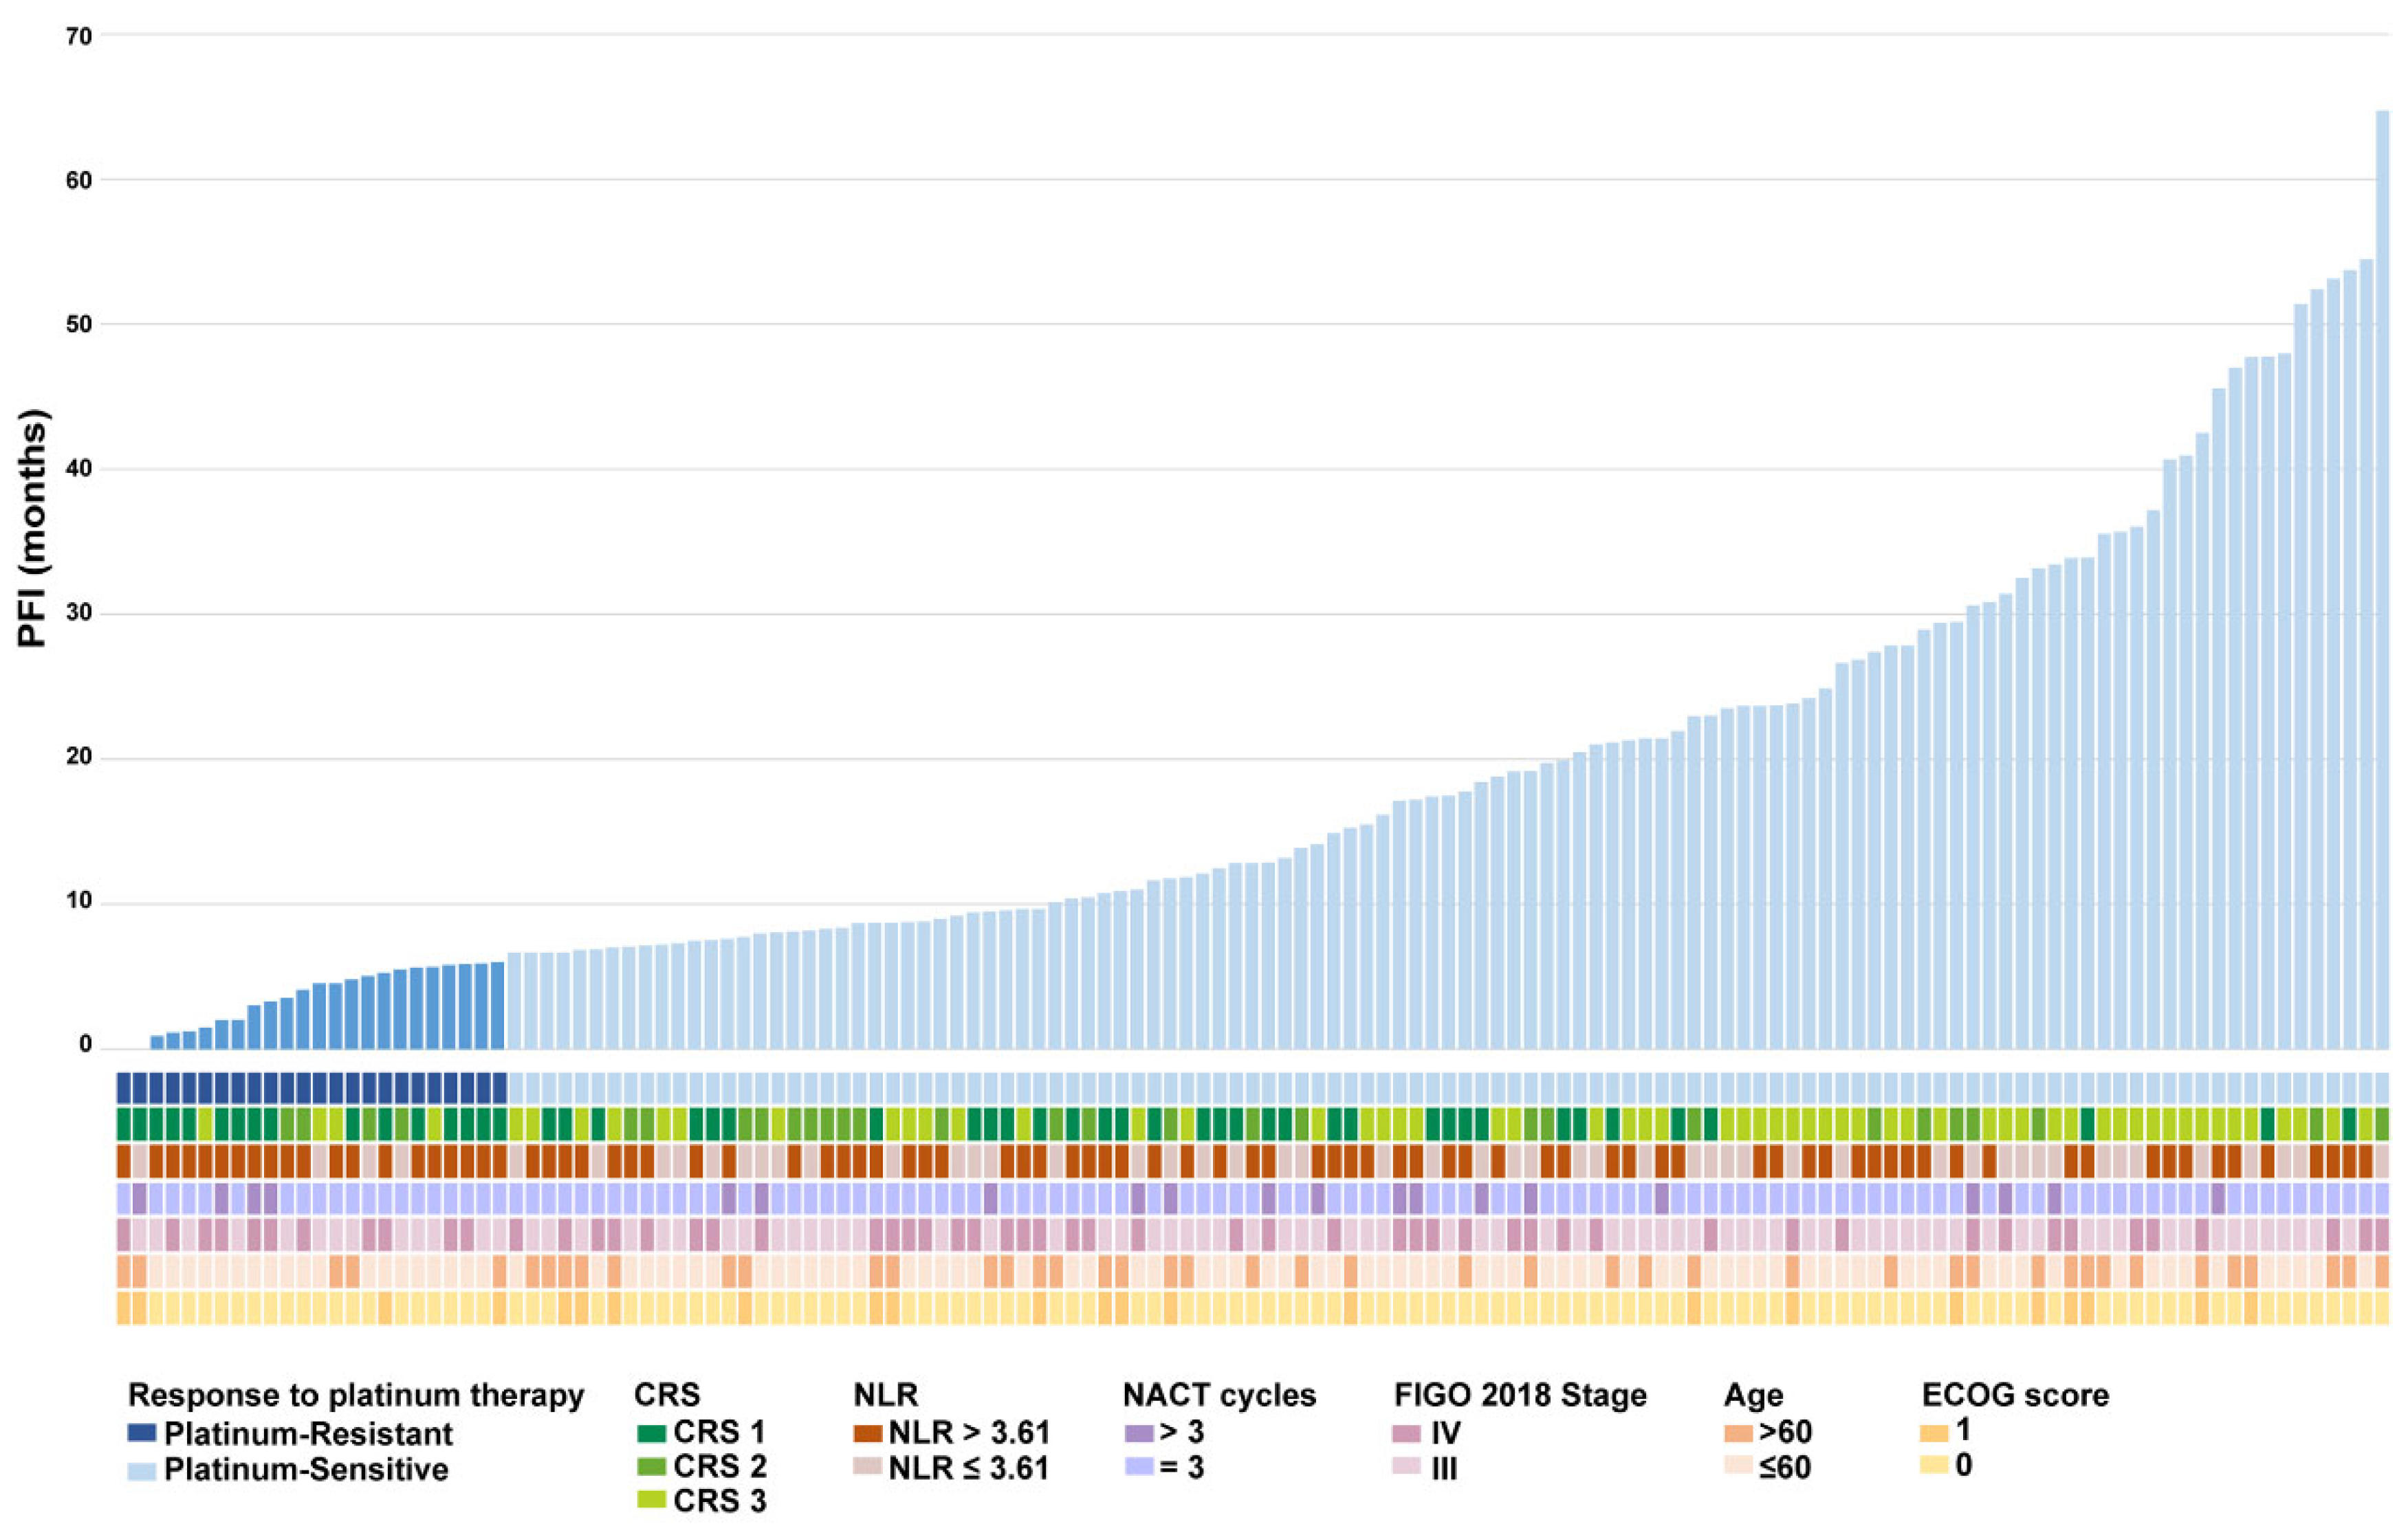
Figure 3.
CRS is associated with the response to platinum chemotherapy. Distribution of patients with advanced HGSOC based on the correlation between CRS and different clinical characteristics, such as the (A) response to platinum chemotherapy, (B) FIGO 2018 stage, (C) age at diagnosis and (D) ECOG score. (E) Left side of the pictures are the CT images of platinum-resistant and platinum-sensitive patients before and after neoadjuvant chemotherapy, which are the coronary abdominal and pelvic scans, and the cross-sectional pelvic scans including the arterial phase (upper) and venous phase (lower) (the red dotted areas are tumor lesions). Right side of the pictures are the pathological images (×40,×100) of the H&E stained slides of the omentum corresponding to the patient after neoadjuvant chemotherapy (the yellow dotted areas are the residual tumor cells).
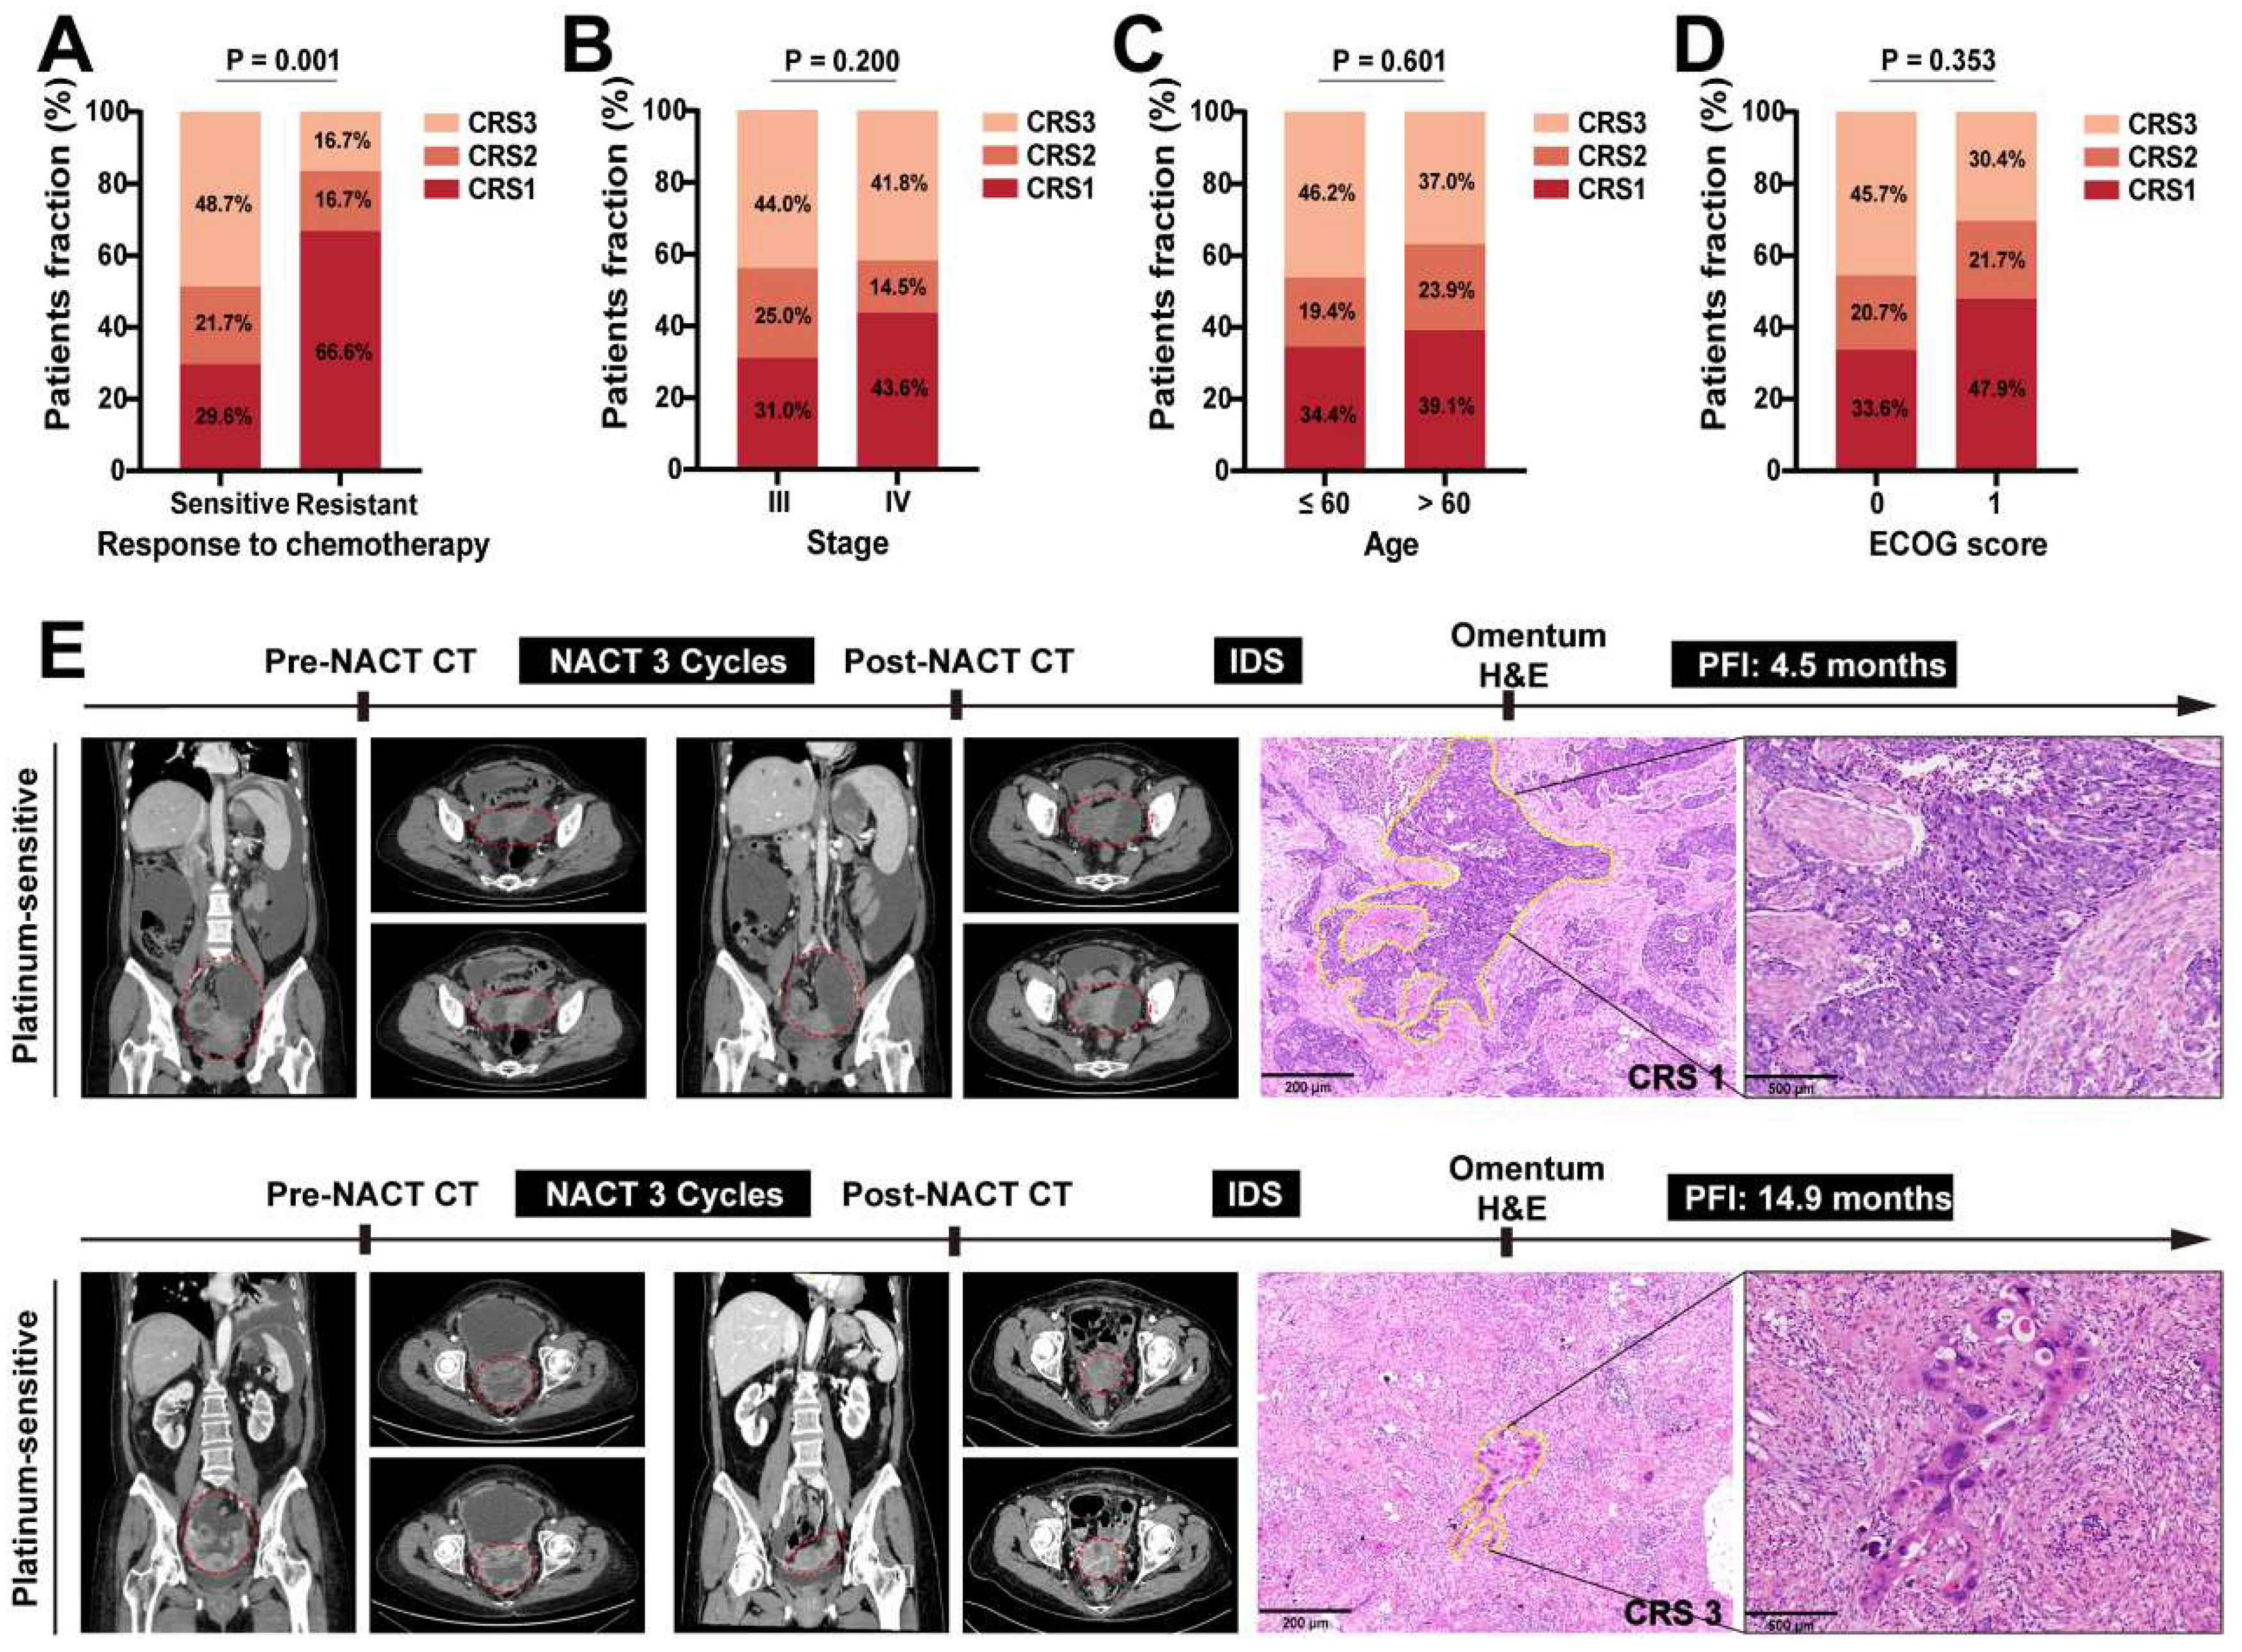
Figure 4.
Associations of NLR with clinicopathologic feature in advanced HGSOC patients. (A) The level of NLR was positively correlated with the resistance to platinum-based chemotherapy, but negatively correlated with the (B) CRS score. Distribution of patients with advanced HGSOC based on correlation between the level of NLR and different clinical characteristics, such as the (C) NACT cycles, (D) age at diagnosis, (D) FIGO 2018 stage and (E) ECOG score.
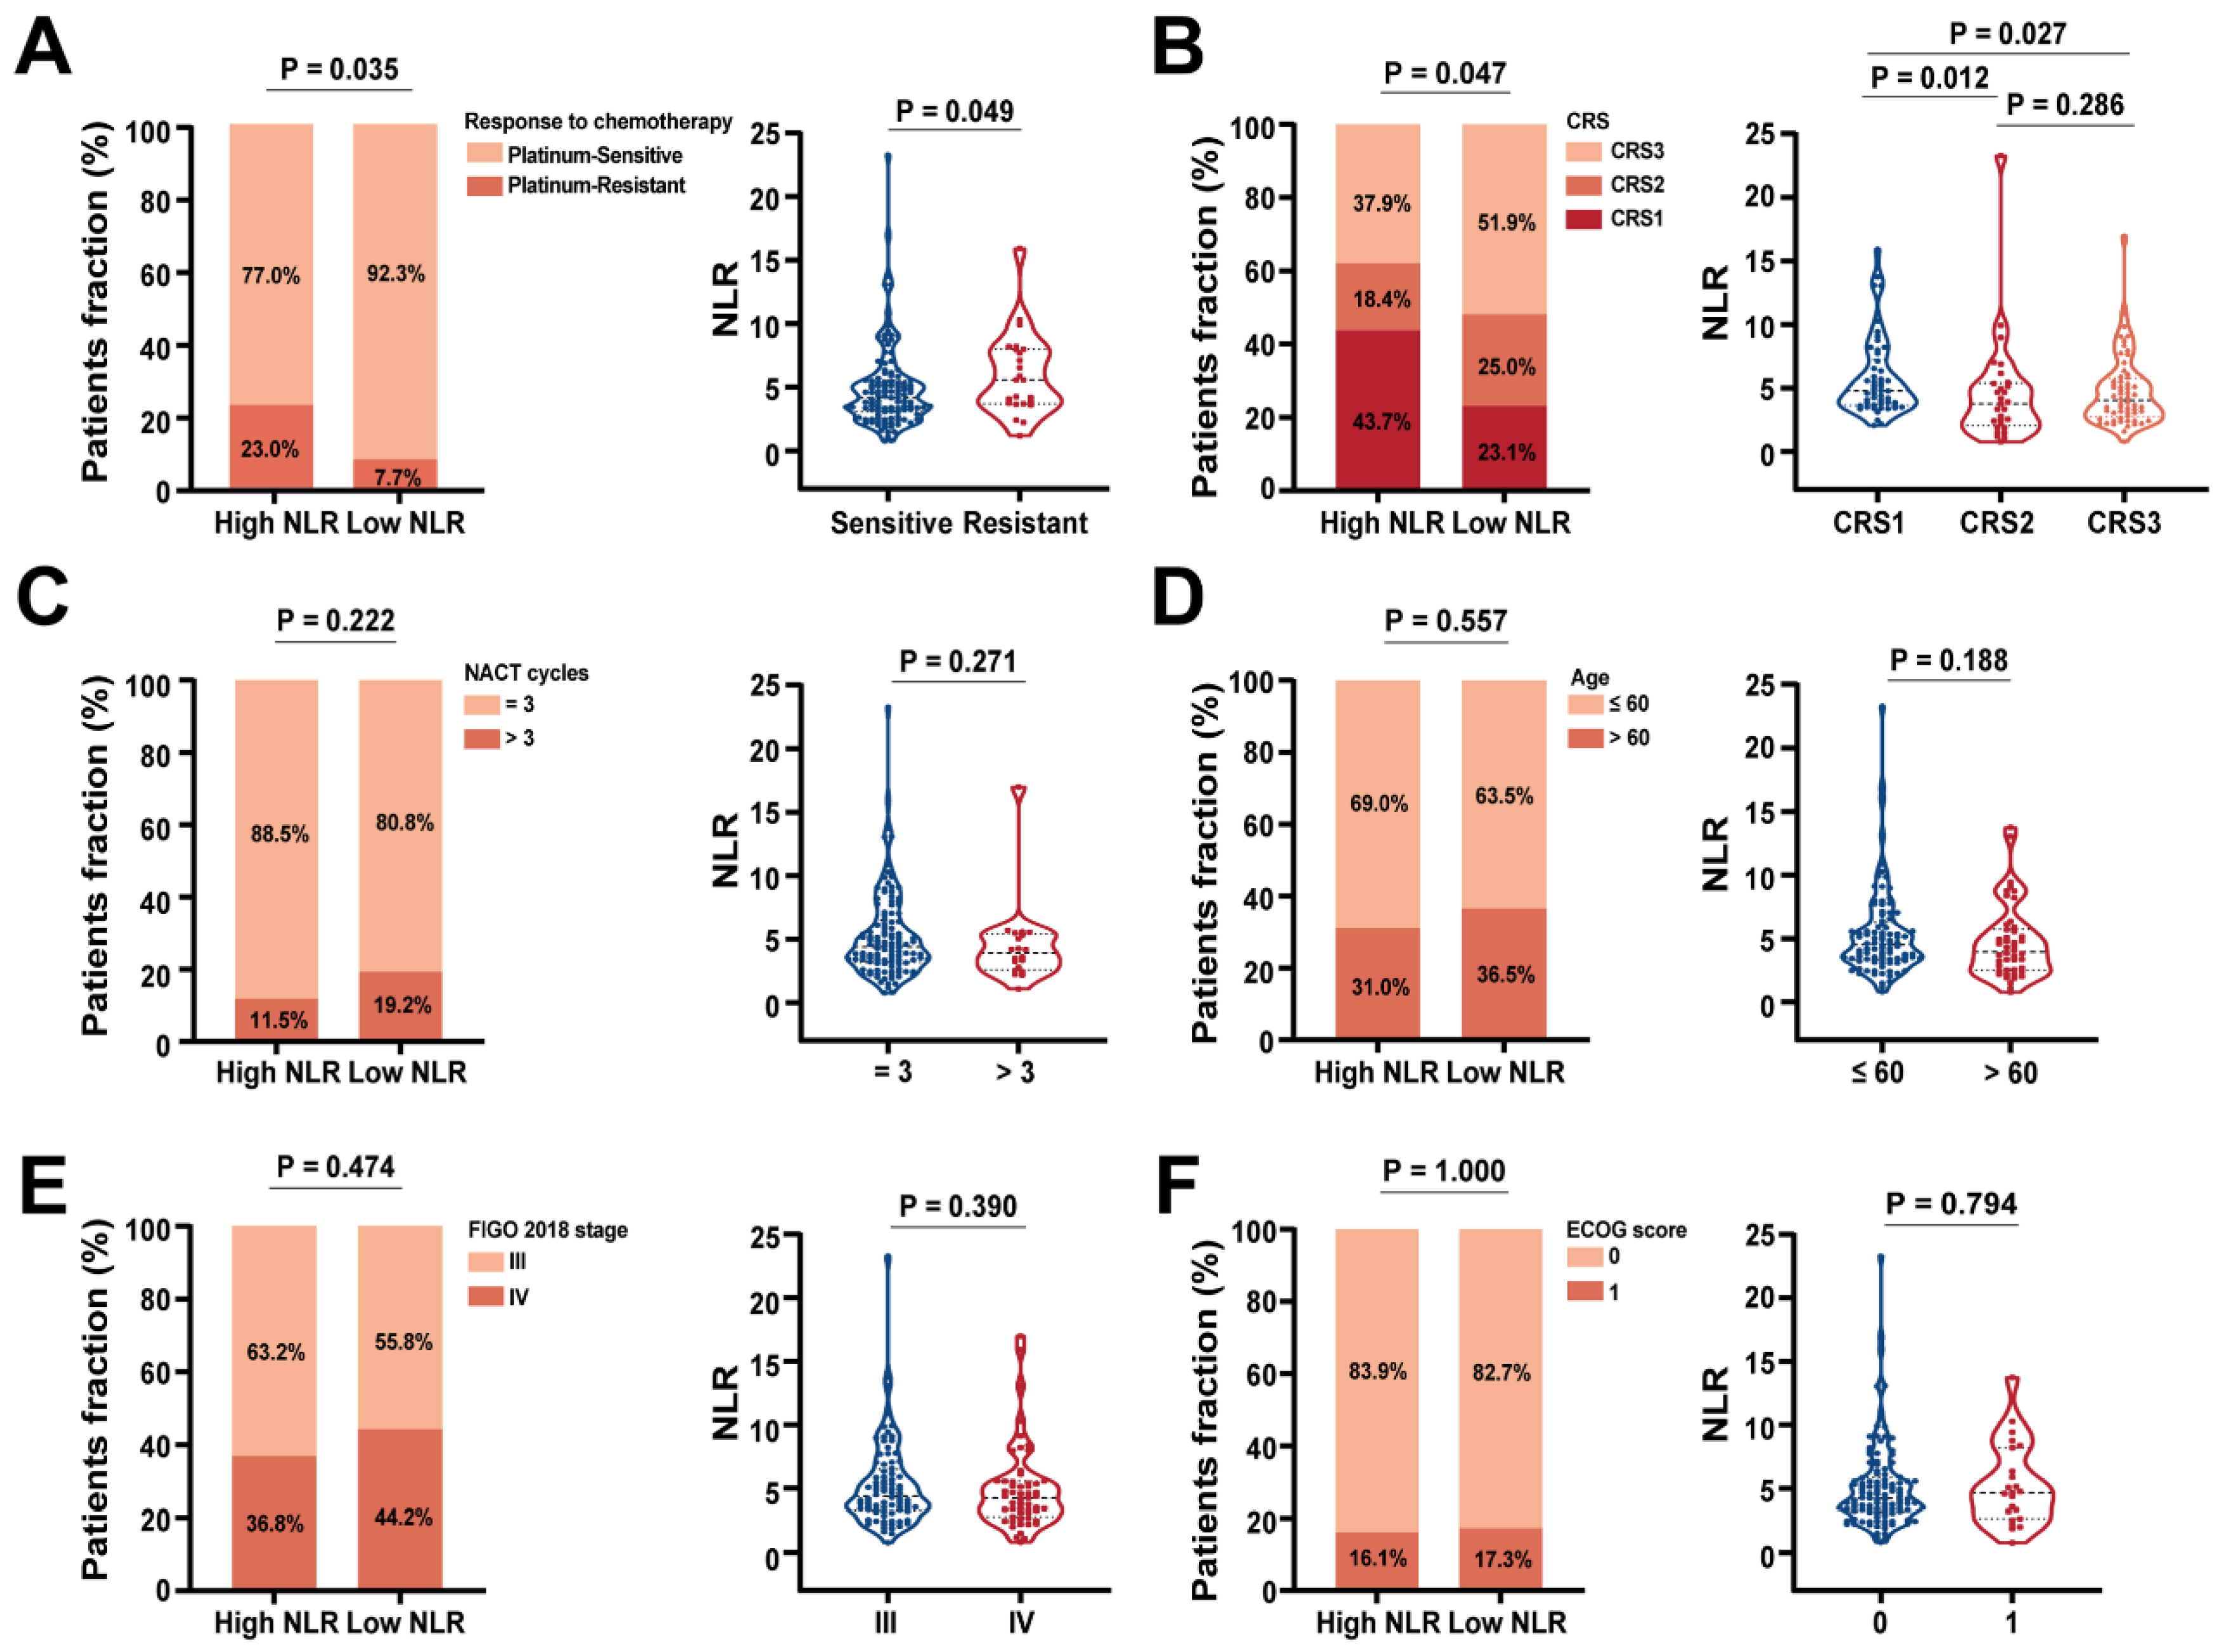
Figure 5.
Progression-free survival (PFS) and overall survival (OS) analysis based on CRS and NLR level. Kaplan–Meier survival curves of all advanced HGSOC patients stratified by CRS and NLR level for (A, C) progression-free survival (PFS) and (B, D) overall survival (OS), respectively.
Figure 5.
Progression-free survival (PFS) and overall survival (OS) analysis based on CRS and NLR level. Kaplan–Meier survival curves of all advanced HGSOC patients stratified by CRS and NLR level for (A, C) progression-free survival (PFS) and (B, D) overall survival (OS), respectively.
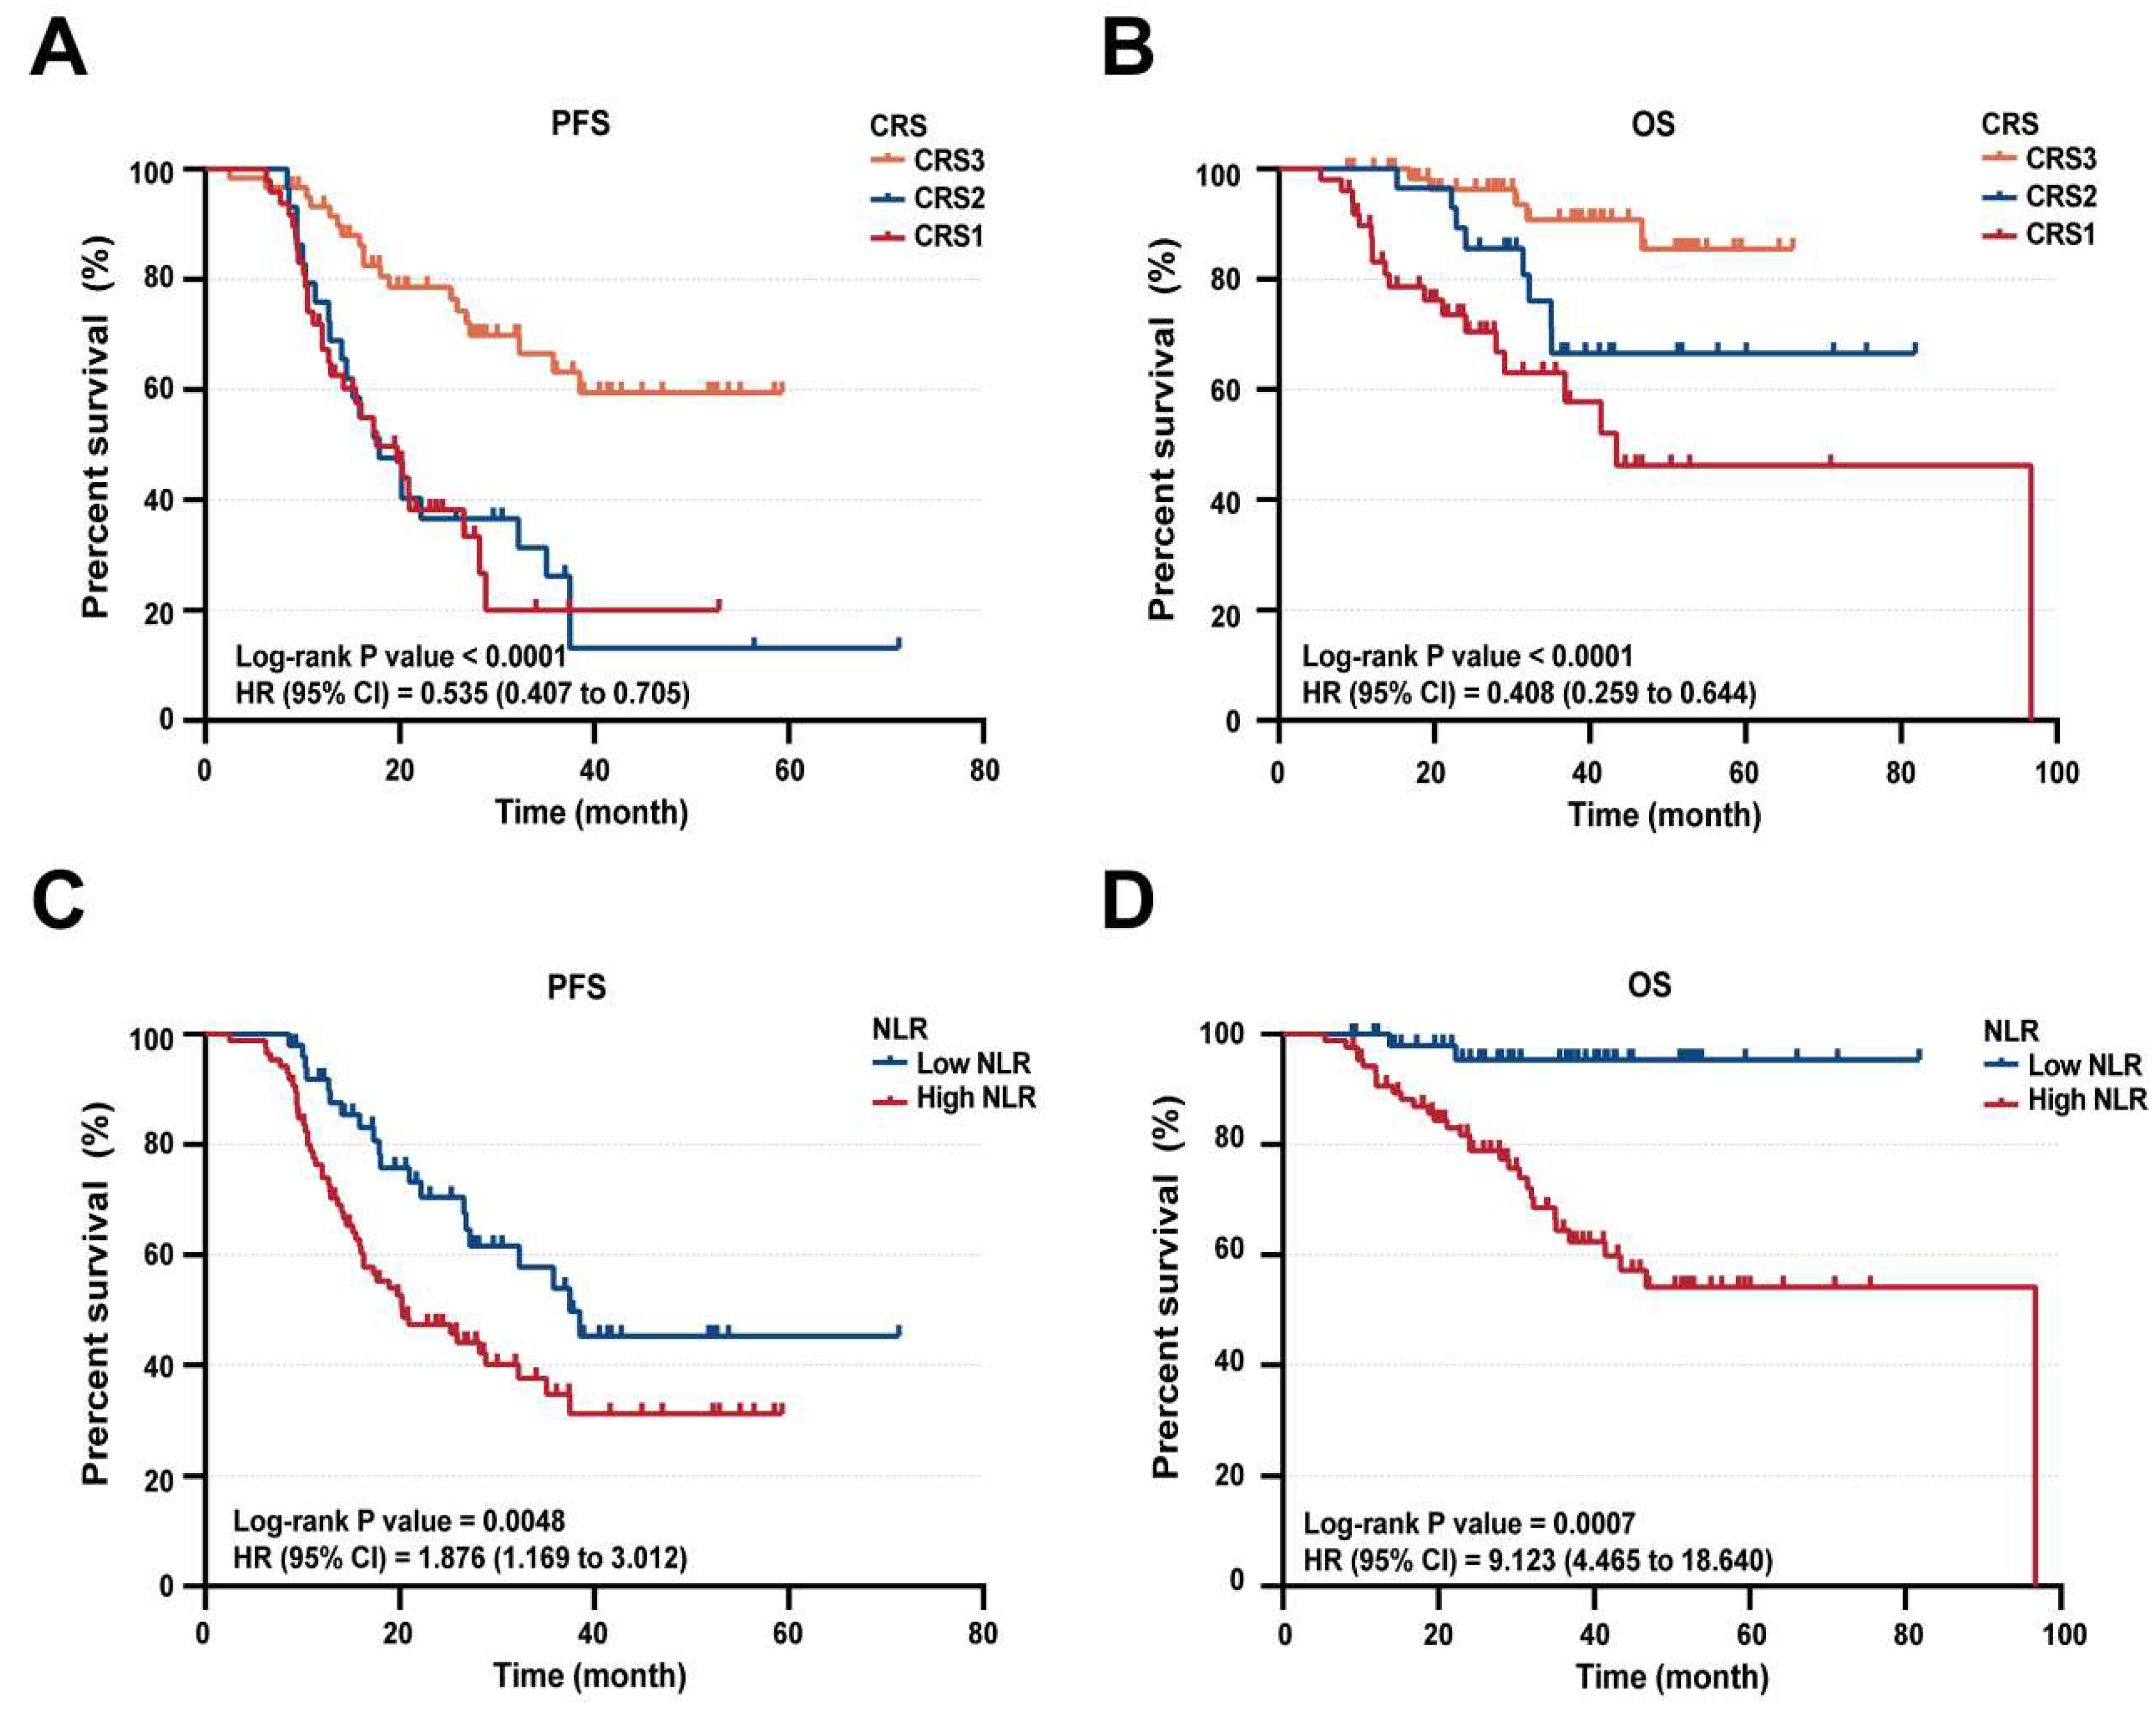
Figure 6.
Progression-free survival (PFS) and overall survival (OS) analysis based on ONCPI score. Kaplan–Meier survival curves of all advanced HGSOC patients stratified by Index and ONCPI score for (A progression-free survival (PFS) and (B) overall survival (OS), respectively.
Figure 6.
Progression-free survival (PFS) and overall survival (OS) analysis based on ONCPI score. Kaplan–Meier survival curves of all advanced HGSOC patients stratified by Index and ONCPI score for (A progression-free survival (PFS) and (B) overall survival (OS), respectively.
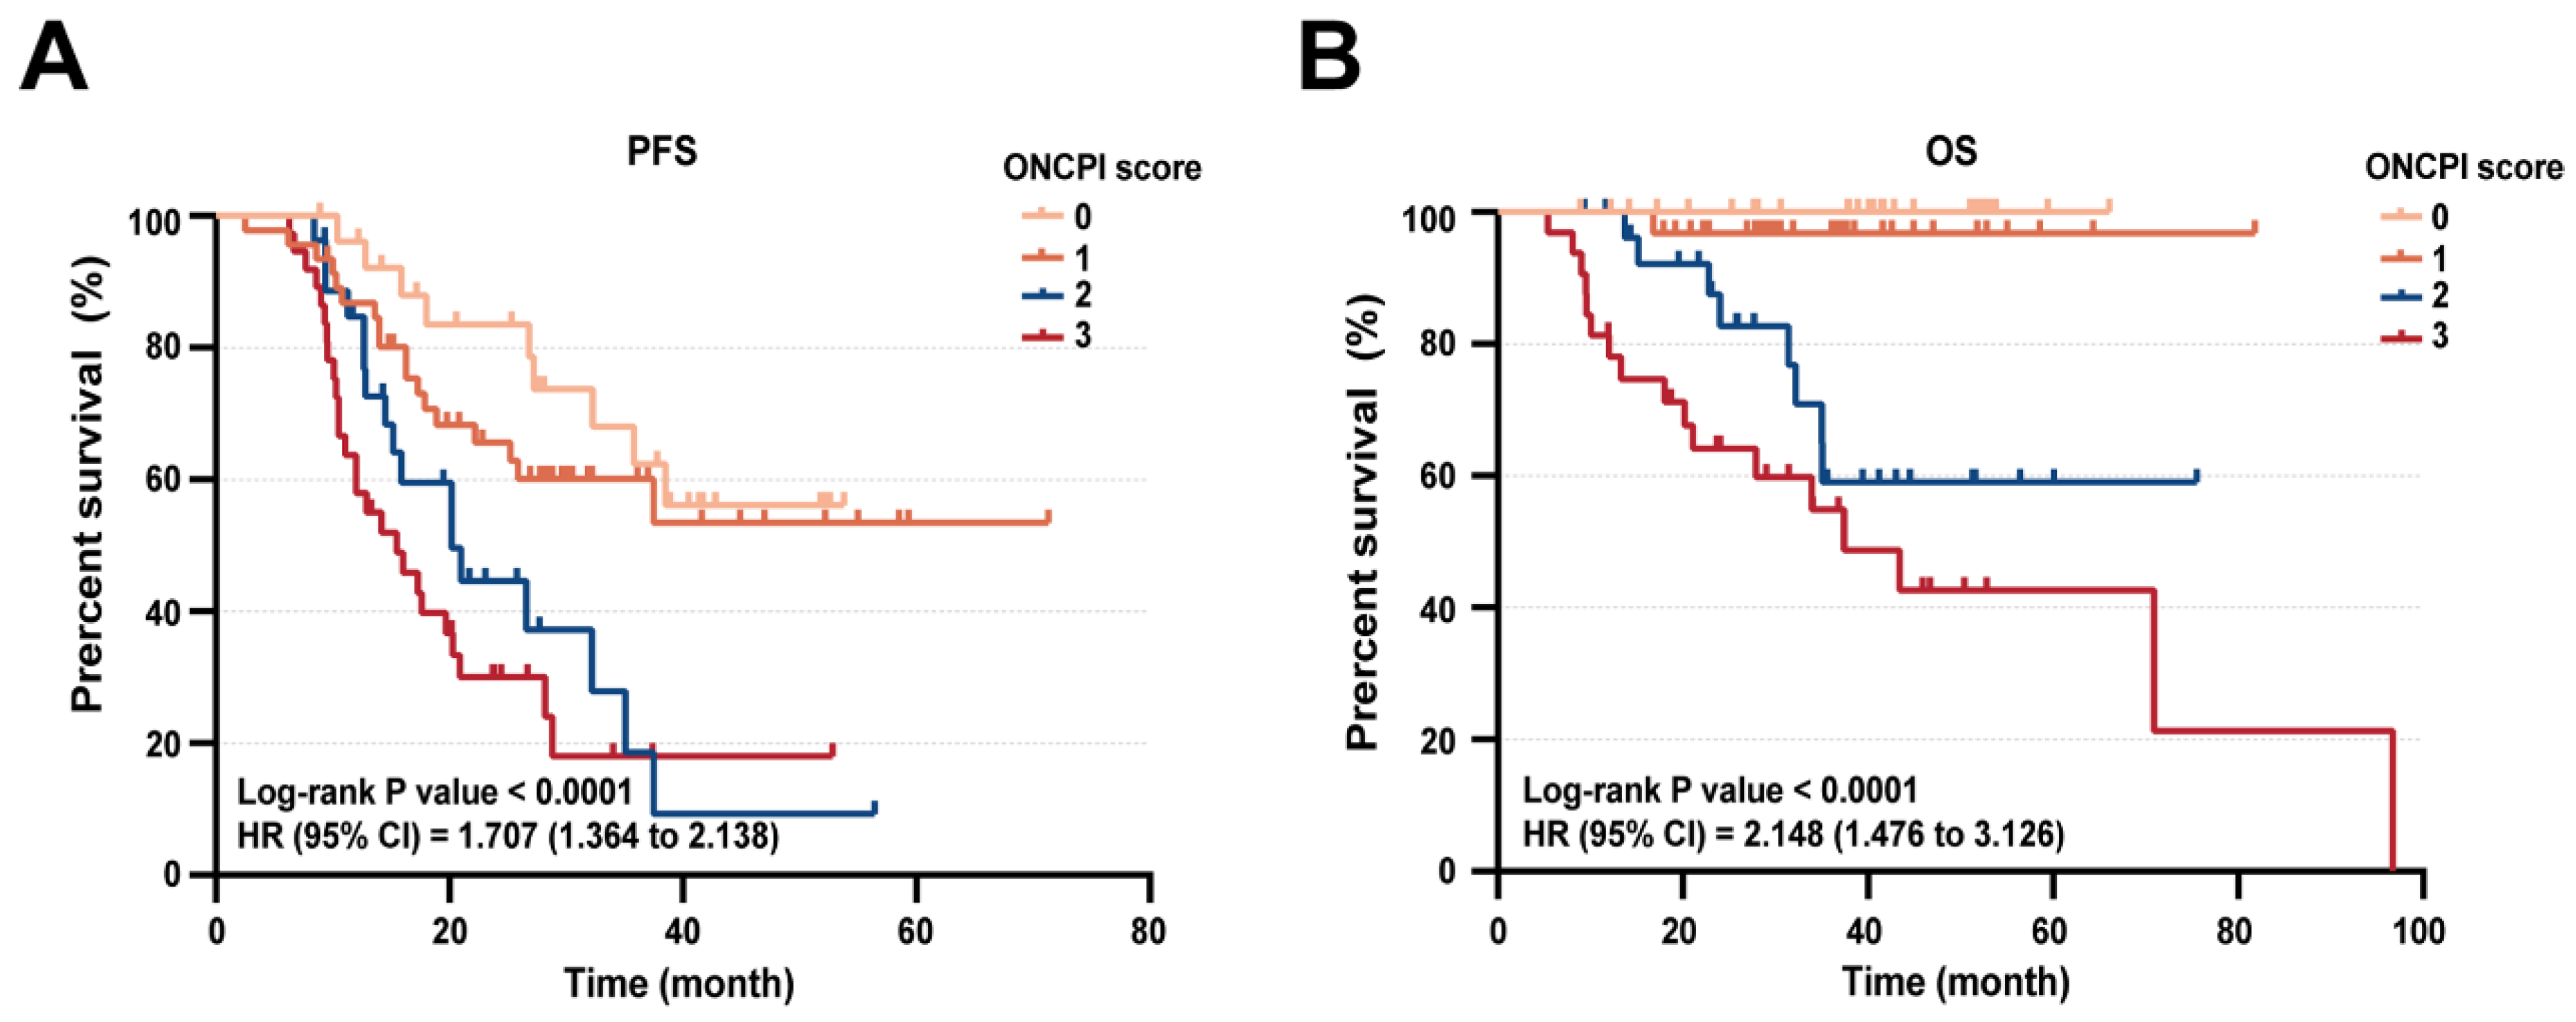

Table 1.
Baseline clinical characteristics of advanced HGSOC patients.
| Characteristics | N=139 |
|---|---|
| Age, years, median (range) | 57 (32-75) |
| BMI, kg/cm2, Mean ± SD | 22.2 ± 3.7 |
| ECOG score, n (%) | |
| 0 | 116 (83.5) |
| 1 | 23 (16.5) |
| CRS, n (%) | |
| CRS 1 | 50 (35.9) |
| CRS 2 | 29 (20.9) |
| CRS 3 | 60 (43.2) |
| NACT cycles, n (%) | |
| = 3 | 119 (85.6) |
| > 3 | 20 (14.4) |
| FIGO 2018 stage, n (%) | |
| III | 84 (60.4) |
| IV | 55 (39.6) |
| Response to platinum therapy, n (%) | |
| Sensitive (PFI > 6months) | 115 (82.7) |
| Resistant (PFI ≤ 6months) | 24 (17.3) |
| Recurrence, n (%) | |
| Yes | 71 (51.1) |
| No | 68 (48.9) |
| Death, n (%) | |
| Yes | 32 (23.0) |
| No | 107 (77.0) |
| Follow-up time, mo, median (IQR) | 41 (27.0-58.0) |
| PFI, mo, median (IQR) | 12.8 (7.3-24.9) |
| PFS, mo, median (IQR) | 20.2 (12.7-30.5) |
| OS, mo, median (IQR) | 30.5 (20.6-44.5) |
BMI = Body Mass Index; CRS = Chemotherapy response score; ECOG = Eastern cooperative oncology group; IQR = Interquartile range; NACT = Neoadjuvant chemotherapy; OS = Overall survival; PFI = Platinum-free interval; PFS = Progression-free survival.
Table 2.
Univariable and multivariable logistics regression of response to platinum chemotherapy.
| Characteristics | Univariable analysis | Multivariable analysis | ||||
|---|---|---|---|---|---|---|
| P value | OR | 95% CI | P value | OR | 95% CI | |
| Age, years, (> 60 vs ≤ 60) | 0.167 | 0.475 | 0.165-1.366 | |||
| BMI, kg/cm2, mean ± SD | 0.176 | 0.909 | 0.791-1.044 | |||
| ECOG score, (1 vs 0) | 0.986 | 1.011 | 0.310-3.292 | |||
| CRS, (3 vs 2 vs 1) | 0.001* | 0.383 | 0.215-0.683 | 0.003 | 0.410 | 0.226-0.742 |
| NACT cycle, (>3 vs =3) | 0.678 | 1.289 | 0.388-4.284 | |||
| CA125, U/mL, (High vs Low) | 0.525 | 1.438 | 0.470-4.401 | |||
| HE4, pmol/L, (High vs Low) | 0.278 | 4.750 | 0.285-79.169 | |||
| Neutrophils, 10^9/L, (High vs Low) | 0.027* | 2.791 | 1.125-6.924 | |||
| Monocyte, 10^9/L, (High vs Low) | 0.089 | 2.198 | 0.886-5.451 | |||
| Lymphocyte, 10^9/L, (High vs Low) | 0.912 | 0.949 | 0.373-2.415 | |||
| Platelet, 10^9/L, (High vs Low) | 0.174 | 1.948 | 0.744-5.100 | |||
| Fibrinogen, g/L, (High vs Low) | 0.196 | 1.860 | 0.726-4.766 | |||
| NLR, (High vs Low) | 0.028* | 3.582 | 1.151-11.152 | 0.046 | 3.776 | 1.025-13.913 |
| MLR, (High vs Low) | 0.075 | 2.283 | 0.920-5.667 | |||
| PLR, (High vs Low) | 0.210 | 1.973 | 0.681-5.712 | |||
| FLR, (High vs Low) | 0.127 | 3.250 | 0.714-14.795 | |||
| SII, (High vs Low) | 0.070 | 2.658 | 0.922-7.663 | |||
BMI = Body Mass Index; CRS = Chemotherapy response score; ECOG = Eastern cooperative oncology group; OR = Odd ratio; NACT = Neoadjuvant chemotherapy; NLR = Neutrophil-to-lymphocyte ratio; PLR = Platelet-to-lymphocyte ratio; MLR = Monocyte-to-lymphocyte ratio; FLR = Fibrinogen-to-lymphocyte ratio; SII = Systemic immune-inflammation index. *Characteristics with p value < 0.05 obtained from univariate logistic regression analysis were included in multivariate analysis.
Table 3.
Univariable and multivariable Cox regression analysis: hazard ratios (HR) for progression-free survival (PFS).
Table 3.
Univariable and multivariable Cox regression analysis: hazard ratios (HR) for progression-free survival (PFS).
| Characteristics | Univariable analysis | Multivariable analysis | ||||
|---|---|---|---|---|---|---|
| P value | HR | 95% CI | P value | HR | 95% CI | |
| Age, years, (>60 vs ≤ 60) | 0.457 | 0.824 | 0.494-1.373 | |||
| BMI, kg/cm2, mean ± SD | 0.464 | 0.975 | 0.911-1.043 | |||
| ECOG score, (1 vs 0) | 0.399 | 1.296 | 0.710-2.367 | |||
| CRS, (3 vs 2 vs 1) | 0.000* | 0.535 | 0.407-0.705 | 0.000 | 0.528 | 0.400-0.699 |
| NACT cycle, (>3 vs =3) | 0.406 | 0.732 | 0.351-1.528 | |||
| CA125, U/mL, (High vs Low) | 0.839 | 1.070 | 0.557-2.056 | |||
| HE4, pmol/L, (High vs Low) | 0.767 | 1.349 | 0.186-9.774 | |||
| Neutrophils, 10^9/L, (High vs Low) | 0.008* | 1.883 | 1.178-3.009 | |||
| Monocyte, 10^9/L, (High vs Low) | 0.975 | 1.008 | 0.621-1.636 | |||
| Lymphocyte, 10^9/L, (High vs Low) | 0.403 | 0.812 | 0.498-1.324 | |||
| Platelet, 10^9/L, (High vs Low) | 0.867 | 1.042 | 0.644-1.686 | |||
| Fibrinogen, g/L, (High vs Low) | 0.054 | 1.646 | 0.991-2.735 | |||
| NLR, (High vs Low) | 0.026* | 1.788 | 1.072-2.982 | |||
| MLR, (High vs Low) | 0.935 | 1.020 | 0.629-1.655 | |||
| PLR, (High vs Low) | 0.946 | 1.018 | 0.613-1.689 | |||
| FLR, (High vs Low) | 0.326 | 1.367 | 0.732-2.554 | |||
| SII, (High vs Low) | 0.252 | 1.341 | 0.812-2.215 | |||
BMI = Body Mass Index; CRS = Chemotherapy response score; ECOG = Eastern cooperative oncology group; NACT = Neoadjuvant chemotherapy; NLR = Neutrophil-to-lymphocyte ratio; PLR = Platelet-to-lymphocyte ratio; MLR = Monocyte-to-lymphocyte ratio; FLR = Fibrinogen-to-lymphocyte ratio; SII = Systemic immune-inflammation index. *Characteristics with p value <0.05 obtained from univariate Cox regression analysis were included in multivariate analysis.
Table 4.
Univariable and multivariable analysis: hazard ratios (HR) for overall survival (OS).
| Characteristics | Univariable analysis | Multivariable analysis | ||||
|---|---|---|---|---|---|---|
| P value | HR | 95% CI | P value | HR | 95% CI | |
| Age, years, (>60 vs ≤ 60) | 0.893 | 0.950 | 0.446-2.020 | |||
| BMI, kg/cm2, Mean ± SD | 0.692 | 0.979 | 0.880-1.089 | |||
| ECOG score, (1 vs 0) | 0.555 | 1.309 | 0.536-3.194 | |||
| CRS, (3 vs 2 vs 1) | 0.000* | 0.408 | 0.259-0.644 | 0.004 | 0.518 | 0.331-0.810 |
| NACT cycle, (>3 vs =3) | 0.903 | 1.068 | 0.372-3.060 | |||
| CA125, U/mL, (High vs Low) | 0.965 | 0.977 | 0.336-2.838 | |||
| HE4, pmol/L, (High vs Low) | 0.198 | 3.768 | 0.500-28.382 | |||
| Neutrophils, 10^9/L, (High vs Low) | 0.000* | 4.210 | 1.882-9.419 | |||
| Monocyte,10^9/L, (High vs Low) | 0.473 | 1.301 | 0.635-2.666 | |||
| Lymphocyte, 10^9/L, (High vs Low) | 0.364 | 0.715 | 0.347-1.474 | |||
| Platelet, 10^9/L, (High vs Low) | 0.751 | 0.889 | 0.431-1.833 | |||
| Fibrinogen, g/L, (High vs Low) | 0.026* | 2.280 | 1.105-4.704 | |||
| NLR, (High vs Low) | 0.002* | 9.304 | 2.219-39.001 | 0.012 | 6.463 | 1.510-27.670 |
| MLR, (High vs Low) | 0.520 | 1.268 | 0.615-2.614 | |||
| PLR, (High vs Low) | 0.737 | 1.143 | 0.523-2.498 | |||
| FLR, (High vs Low) | 0.060 | 3.974 | 0.945-16.710 | |||
| SII, (High vs Low) | 0.002* | 3.101 | 1.511-6.361 | |||
BMI = Body Mass Index; CRS = Chemotherapy response score; ECOG = Eastern cooperative oncology group; NACT = Neoadjuvant chemotherapy; NLR = Neutrophil-to-lymphocyte ratio; PLR = Platelet-to-lymphocyte ratio; MLR = Monocyte-to-lymphocyte ratio; FLR = Fibrinogen-to-lymphocyte ratio; SII = Systemic immune-inflammation index. *Characteristics with p value <0.05 obtained from univariate Cox regression analysis were included in multivariate analysis.
Table 5.
Progression-free survival and overall survival of advanced HGSOC patients based on ONCPI score.
Table 5.
Progression-free survival and overall survival of advanced HGSOC patients based on ONCPI score.
| Characteristics | ONCPI score | |||
|---|---|---|---|---|
| ONCPI Score of 0 (n=27) | ONCPI Score of 1 (n=46) | ONCPI Score of 2 (n=28) | ONCPI Score of 3 (n=38) | |
| PFS | ||||
| Hazard ratio (95% CI) | 0.222 (0.102-0.482) | 0.320 (0.174-0.589) | 0.754 (0.413-1.376) | 1 [Reference] |
| PFS, median, mo (IQR) | 28.1 (17.2-41.4) | 25.6 (15.1-33.2) | 15.6 (12.0-25.1) | 13.1 (9.6-21.6) |
| Log-rank p value | < 0.001 | |||
| OS | ||||
| Hazard ratio (95% CI) | NA | 0.223 (0.088-0.567) | 0.143 (0.534-0.230) | 1 [Reference] |
| OS, median, mo (IQR) | 40.5 (27.7-51.8) | 30.5 (22.7-45.4) | 29.6 (20.1-42.6) | 24.2 (12.0-38.4) |
| Log-rank p value | <0.001 | |||
NA = Not available; ONCPI = Ovarian cancer Neoadjuvant Chemotherapy Prognosis Index; PFS = Progression-free survival; OS = Overall survival.
Disclaimer/Publisher’s Note: The statements, opinions and data contained in all publications are solely those of the individual author(s) and contributor(s) and not of MDPI and/or the editor(s). MDPI and/or the editor(s) disclaim responsibility for any injury to people or property resulting from any ideas, methods, instructions or products referred to in the content. |
© 2023 by the authors. Licensee MDPI, Basel, Switzerland. This article is an open access article distributed under the terms and conditions of the Creative Commons Attribution (CC BY) license (http://creativecommons.org/licenses/by/4.0/).
Copyright: This open access article is published under a Creative Commons CC BY 4.0 license, which permit the free download, distribution, and reuse, provided that the author and preprint are cited in any reuse.


