Submitted:
17 August 2023
Posted:
18 August 2023
You are already at the latest version
Abstract
In this paper we study a special kind of finite mixture model. The sample drawn from the model consisits of three parts. The first two parts are drawn from specified distributions f1 and f2, while the third one is drawn from the mixture. A problem of interest is whether the two distributions f1 and f2 are the same. To test this hypothesis, we first define the regular location and scale family of distributions and assume that f1 and f2 are regular denisty functions. Then the hypothesis transforms to the equalities of the location and scale parameters, respectively. To utilize the information in the sample, we use Bayes’ theorem to obtain the posterior distribution and give the sampling method. Then we propose the posterior p-value to test the hypothesis. The simulation studies show that our posterior p-value largely improves the power in both normal and logistic cases while nicely controls the Type-I error. A real halibut dataset is used to illustrate the validity of our method.
Keywords:
three sample problem
; homogeneity test
; bernstein-von Mises theorem
; posterior p-value
1. Introduction
In this paper we focus on the model proposed by Hosmer [1], which is used to study the halibut data. There are two different sources of halibut data. One is from the research cruises, where the sex, age and length of the halibut are available while another comes from the commercial catch where only age and length can be obtained since the fish have been cleaned before the boats returned to the port. The length distribution of an age class of halibut is closely approximated by a mixture of two normal distributions, which is
where and are the probability density functions of the normal distributions and is the proportion of the male halibut in the commercial catches. Hosmer [1] estimated the parameters of the two distributions using the iterative maximum likelihood estimate method. Murray and Titterington [2] summarized the techniques for maximum likelihood estimation and Bayesian analysis. Anderson [3] proposed a semiparametric modeling assumption known as the exponential tilt mixture model. The estimating of the proportion is done by a general method based on direct estimation of the likelihood ratio. The estimation of the model is further studied by Qin [4], who extended Owen ’s [5] empirical likelihood to the semiparametric model. Qin gave the asymptotic variance formula for the maximum semiparametric likelihood estimation. Later, Zou et al. [6] showed that the partial profile empirical likelihood also worked well with realistic sample size. An EM algorithm for this semiparametric model is further given by Zhang [7]. Furthermore, Inagaki and Komaki [8] and Tan [9] respectively modified the profile likelihood function and provided better estimators for the parameters.
Except for the estimation of parameters, another important issue is to test the homogeneity of the model. Thus the null hypothesis is
To test the null hypothesis, Liang and Rathouz [10] proposed a score test and applied it to genetic linkage. Lemdani and Pons [11] suggested using likelihood ratio tests(LRT) under modified likelihood function since classical results on LRT may be invalid. Chen et al. [12,13] proposed a modified LRT with a general parametric kernel distribution family and they proved that the modified LRT has a -type of null limiting distribution and is asymptotically most powerful under local alternatives. Chen and Li [14] proposed an EM approach for the normal mixture models. Li et al. [15] used a high-order expansion to establish a nonstandard convergence rate for the odds ratio parameter estimator and solved the problem of degeneration of the Fisher information. These works are applied to a variety of genetic mixture model in real applications. For example, genetic imprinting and quantitative trait locus mapping, see Li et al. [16] and Liu et al. [17].
Most mixture models discribed above mainly consider the case when and are normal distributions. In this paper, we want to extend the conclusion to more general cases. Similar question has been researched by Ren et al. [18]. In their paper a two-block Gibbs sampling method are proposed to obtain the samples of the generalized pivot quantities of the parameters. They studied both cases when and are normal and logistic distributions. In our paper, we assume that and are in a specified location-scale family with location parameter and scale parameter . We propose a posterior p-value based on the posterior distribution to test the homogeneity. To sample from the posterior distirbutions, we propose to use approximate Bayesian computation (ABC) method for the case when and are normal distributions, which is different from the cases when and are general distributions. This is because the posterior distirbution of the normal case can be regard as using the information contained in the first two samples as prior distribution and updating it via the third one without loss of information. We find in our simulation that this method is promising and efficient even we use the simplest reject-sampling. For the general case, since ABC method is no longer available, we use MCMC method such as Metropolis-Hastings sampling method proposed by Hannig et al. [19] and the two-block Gibbs sampling proposed by Ren et al. [18] to sample from the posterior distribution.
The paper is organized as follow. In Section 2 we first define the regular location-scale family and give some properties of the family. Then we propose our posterior p-value for testing the homogeneity. We further introduce the sampling method for different cases. A real data of the halibut is studied in Section 3 to illustrate the validity of our method. The simulation study is given in Section 4 while the conclusion is given in Section 5.
2. Test Procedure
In this section we consider model (1) where the distributions are in a certain regular location-scale family. Thus, we first give the definition in the following subsection.
2.1. Regular Location-Scale Family
In this section we first give the definition of the regular location-scale family.
Definition 1 (regular location-scale family).
Let be a probability density function. If satisfies
- (1)
- , ;
- (2)
- is continous;
- (3)
- ;
- (4)
- .
Then is defined as a regular density function, and
is defined as the regular location-scale family.
It is easy to verify that many families of distributions are regular location-scale families. For example, let
Then and are regular density functions. The families of distributions that constructed by and are regular, which are the families of normal distributions and logistic distibutions, respectively. The two families of distributions are concerned in the paper later.
The following lemma highlights some properties of this family.
Lemma 1.
If is a regular density function, then we have
- (1)
- ;
- (2)
- ;
- (3)
- ;
- (4)
- ;
- (5)
- ;
- (6)
- .
The proof of this lemma is given in Appendix.
We further calculate the Fisher information matrix of the regular location-scale family with the following proposition.
Proposition 1.
Assume that is in the regular location-scale family, where . The parameter space . Let . Then
- (1)
- The score function satisfies
- (2)
- The Fisher information matrix satisfieswhere
- (3)
- The Fisher information matrix is given by
The proof is given in Appendix.
Proposition 2.
Assume that and is regular. Then given by
where and , has following properties.
- (1)
- (2)
- (3)
The proof is given in Appendix.
We then give the Fisher information matrix of the normal and logistic distribution. For the normal distribution, we have
Thus the Fisher information matrix of normal distribution is
Similarly, for the logistic distribution,
Thus the Fisher information matrix of logistic distribution is
2.2. A Posterior p-Value
Now we consider testing the homogeneity of model (1) where and are in ,
This is equivalent to testing equality of the parameters of the two density functions, that is,
Consider the density function
where is the unknown parameter. is the regular density function, then the Fisher information matrix is
where
When ,
the last row and column of is zero, which means that and is non-definite. Thus, we may encounter some difficulties when using some traditional test methods, such as the likelihood ratio test.
We suggest a solution here. First we assume that is known. Then there are 4 parameters and we still denote them by . We use the estimate of instead since is unknown. This is because that when the homogeneity hypothesis holds, the distribution of the population is irrelative to . So the level of the test is irrelative to the estimate of . We then give the inference on below. For the first two samples, the fiducial density of and are
where “∝” denote “proportion to”, see the example 3 of Hannig et al. [19]. Then to combine (4) with the third sample, we regard (4) as the prior distribution. By the Bayes’ theorem
Denote the probability measure on the parameter space determined by (5) by , where , , , . denotes the random variable. We can see from the expression (5) that is the posterior distribution under the prior distribution
To establish Bernstein-von Mises theorem for multiple samples, we first introduce some necessary assumptions below. Let be the log-likelihood function of the ith sample, where .
Assumption 1.
Given any , there exists such that in the expansion
where is the true value of the parameter. is the Fisher Information matrix. The probability of the following event
tends to 0 as , where is the Euclidean norm and denotes the largest absolute eigenvalues of a square matrix A.
Assumption 2.
For any , there exists such that the probability of the event
tends to 1 as .
Assumption 3.
Under the prior π, there exist such that the integral of below exists,
Assumption 4.
When ,
Then we give the Berstein-von Mises theorem for multiple samples as follow.
Theorem 1.
Denote the posterior density of by , where
If the Assumption 1, 2 and 4 hold, then
Furthermore, if Assumption 3 holds, then
Then we can define the posterior p-value as follow
Definition 2.
Let
where is the probability under the posterior distribution. is the posterior mean and is the posterior covariance matrix. We call as a posterior p-value.
The theorem below gurantees the validity of the posterior p-value.
Theorem 2.
Under the assumption of Theorem 1, the p-value define by (7) satisfies
where is the convergence in distribution and is the uniform distribution on the internal .
The proof is given in Appendix. Then for a given significance level , we may reject the null hypothesis if the p-value is less than .
2.3. Sampling Method
The posterior mean and the posterior variance in equation (7) can be estimated by the sample mean and variance, respectively. Now the remain problem is how to sample from the posterior distribution. When is unknown, we first propose an EM algorithm to estimate , then we sample from the posterior distribution where is fixed to the estimate of . The Markov Chain Monte Carlo (MCMC) method are commonly used. However, as we have mentioned earlier, MCMC method needs to discard a large number of samples in the burn-in period to gurantee the samples accepted sufficiently close to the ones from the real distribution. Fortunately, when and are normal distributions, we find that the posterior distribution can be transformed and sampled by using the approximate Bayesian computation (ABC) method. However, when and are some more common distributions, such as the logistic distributions, the two-block Gibbs sampling proposed by Ren et al. [18] can be an appropriate substitution. We will discuss the details in the following subsection.
2.3.1. Em Algorithm for
In this subsection we propose the EM alogorithm for estimating .
The log-likelihood function of the model is
where and are in the same regular location-scale family , with parameters and respectively. in the log-likelihood function of the third sample is
The EM algorithmis is first proposed by Dempster et al. [20] and broadly applied to a wide variety of parametric models, see McLachlan and Krishnan [21] for a better review.
Assume that we have obtain the estimate of the parameters after m times of iterative, denote them by and . We introduce the latent variable , the component indicates which distribution the sample is drawn from. when it is drawn from the first distribution , otherwise, . Then we have
The density of the joint distribution of is
Given , the conditional distribution of is
where , . Thus the conditional expectation of is
When and , the conditional expectation of can be the estimate of .
.
The log likelihood function is
Since the latent variable is unknown, we use its conditional expectation. Besides, the MLE of is
Then in the E-step, we calculate the expectation of new parameters conditional on ,
Let , then
In the M-step we compute the simultaneous equations below to maximize . The solutions are the new parameters . We give the equations of , similarly can we get .
In the simulation study we consider the normal and logistic cases. Then the maximization step of the normal case can be simplified as
while that of the logistic case is
The two steps are repeated sufficiently to gurantee the convergence. Then we can get the MLE of the parameters.
2.3.2. Normal Case
When the estimate of is obtained, the posterior distribution (5) can be rewritten as
This means that the posterior distribution is equivalent to using the first two terms on the right side of the equation as the “prior distribution” and the third term as the likelihood function. For the first term we have
Denote the sample mean and variance by and , respectively, we have
which follows a normal and distribution respectively, that is,
Let and be two independent random variables. Then
Given and , then and can be regard as the functions of U and V
The joint distribution of is
Then the joint distribution of can be calculated as
where . This coincides with the joint fiducial density proposed by Fisher [22], which means that the fiducial distribution of is
Similarly can we get
where and are the sample mean and variance of the second sample and .
With the conclusion above, sampling from the posterior distribution (5) can be done by sampling first from the fiducial distribution of the parameters and then combine the information with the likelihood function of the third sample from the mixture model (1). This can be done simply using the approximate Bayesian computation (ABC) method. In this case, we regard the fiducial distributions of as the prior distribution. After we drawn samples of parameters from (10) and (11), denote by , we generate simulations from the model below and denote them by ,
where is the MLE of estimated aforehand using the EM algorithm proposed in the last subsection. Then we calculate the distance between the simulations and the observation and accept those whose distance is below a given threshold . The algorithm is given below.
- Compute the sample mean and variance of the first two samples and denote them by , , and . Calculate the MLE of using EM algorithm and denote it by
- Sample and from the standard normal distribution, from the distribution and from . respectively. To sample from the fiducial distributions of the parameters, we calculate , , and usingWe denote the samples of the parameters by .
- Generate a simulation of size fromThe simulation is represented by .
- Calculate the Euclidean distance between the order statistics of the observation and the simulation . We accept the parameters if the distance is below a given threshold . Otherwise we reject the parameters.
- The procedure is repeated until we accept a certain number of parameters.
2.3.3. General Case
When and are not normal distributions, to sample from the posterior (8), it is natural to use the Markov chain Monte Carlo (MCMC) method. Metropolisi-Hastings (MH) sampling method and Gibbs sampling method are commonly used. An early version of MH algorithm was given by Metropolis et al. [23] in a statistical physics context, with subsequent generalization by Hastings [24], who focused on statistical problems. Some computational problem and solutions can be further see in Owen and Glynn [25].
The initial values of the parameters can be determined by the EM algorithm mentioned above. For the proposal distribution, we choose
where and denote the gamma distribution and normal distribution respectively. and , denotes the parameters accepted in the th loop. After we get , we can further obtain via the following two-step algorithm.
- Sample respectively from the proposal distribution . Compute
- Accept with probabilityand let . Otherwise we reject the parameters and return to the first step.
The algorithm should be repeated sufficiently before obtain the samples from the posterior distribution. This cost much more time compare with the ABC algorithm for the normal case. What’s more, in our simulation we found that the MH algorithm may be too conservative. A better subsititution can be the two-block Gibbs sampling proposed by Ren et al. [18]. In this sampling method, is first estimiated using the EM algorithm, then for each loop, the parameters are updated by the conditional generalized pivotal quantities.
3. Real Data Example
In this section we apply the proposed posterior p-value to the real halibut dataset studied by Hosmer [1], which is given by International Halibut Commission in Seattle, Washington. This dataset consists of the lengths of 208 halibut caught on one of their research cruises, in which 134 are female while the rest 74 are male. The data is summarized by Karunamuni and Wu [26] and given in Table 1. We follow their method and randomly select 14 males and 26 females from the samples and regard them as the first and second sample of the mixture model 1. Then the remain male proportion of 60/168 is approximately indentical to the original male proportion of 74/208, which is 0.3558. 100 replications is generated with the same procedure. Hosmer [1] pointed out that the component for the dataset can be fitted by the normal distribution. A problem of interest is whether the sex effects the length of the halibut.
To test the homogeneity, for each replication we first use the EM algorithm to estimate , then we use the reject-ABC method to generate 8000 samples. We choose a moderate threshold to balance the accuracy and the computational cost. For the 100 replications, the mean of estimate of the male proportion is 0.3381, with the mean squared error 0.0045, which illustrate the accuracy of our EM algorithm The estimates of the location and scale parameter of the male halibut are and while that of the female ones are and . This is close to the estimates of Ren et al. [18]. As with the hypothesis testing , we calculate the posterior p-value of the 100 replications. Given the significance level , all the p-values are less than . Thus the null hypothesis is rejected, which indicates that there exists association between the sex and length of the halibut.
4. Simulation Study
In this section we give the simulation study of the cases discussed above. We compare the results of the posterior p-value (7) using different sampling methods and the generalized fiducial method proposed by Ren et al. [18]. As we can see from the simulations, the posterior p-value we proposed largely improves the testing of homogeneity.
4.1. Normal Case
When and are normal distributions, we compare the results of three different tests. The first two are the posterior p-value we proposed, but using two-block Gibbs sampling and reject-ABC sampling method, respectively. The last one is the generalized fiducial method proposed by Ren et al. [18]. In the following tables, the first two are denoted by “” and “”, while the last is denoted by “G”. We fix to while is set to be , , and . For each and we consider and different sample sizes for and . We simulate repetitions for each case. For the Gibbs sampling, we accept 3000 samples after burning in the first 2000. For the reject-ABC sampling method, we first calculate the estimate of and accept 4000 parameters with set to . Then we calculate the posterior p-value using the samples. We set the significance level to and reject the null hypothesis when the posterior p-value is below . The results are shown in Table 2, Table 3, Table 4 and Table 5. We further give the QQ-plot of in Figure 1, which indicates the correctness of Theorem 2. The first row are the cases of =, and , while the second row are the cases of , and .
We can see from the results that the posterior p-value largely improves the testing of homogeneity in normal cases. The Type-I error is controlled as well as the generalized fiducial methods. Moreover, our method significantly improves the power of testing homogeneity, especially when is different. The reject-ABC sampling method has the advantage of lower computational cost, comparing with the two-block Gibbs sampling method. However, the power of using reject-ABC sampling method is smaller than using two-block Gibbs sampling when is much larger than and . Thus, we can use reject-ABC sampling method when the sample size is small or moderate and two-block Gibbs sampling when the sample size is large.
4.2. General Case
For general case we assume that and are logistic distributions. The location and scale parameters of and are set the same as that of the normal case. We simulate 10000 repetitions for each sample size. We propose three methods in this simulation. The first two are the generalized fiducial method proposed by Ren et al. [18] and our posterior p-value using two-blocks Gibbs sampling. They are denoted by “G” and “” as last simulation. The last one is the posterior p-value using M-H algorithm, which is denoted by “”. First we calculate the MLE of using the EM algorithm. Then we propose the Metropolis-Hastings algorithm to obtain 12000 samples after first burn-in 8000 ones. To avoid the dependency between the samples, we choose the first one in every three samples, which leaves us 4000 samples. Then we use these samples to calculate the posterior p-value. The algorithm is natural and seems to be feasible. However, from the Table 6 we can see that with this sampling method the results are rather conservative. Given the significance level , the type-I error of is always much more smaller than 0.05, which makes the power of also smaller than the rest two when . However, We find that the two-block Gibbs sampling method can successfully solve the problem. It can be seen that the type-I error of can be controlled well while the power is largerly improved, compares with the genralized fiducial method. The results are shown in Table 7, Table 8 and Table 9. We also give the QQ-plot of in Figure 2.
5. Conclusions
In this paper, we propose a new posterior p-value for testing the homogeneity of the three-sample problem. We define the regular location-scale family and assume that both and are in the same family. Then testing the homogeneity is equivalent to testing the equality of the location and scale parameters. We use the Bayes’ theorem to obtain the posterior distribution of the parameters and propose the Bernstein-von Mises theorem for multiple samples. Then we propose the posterior p-value for testing the equality of the parameters. To sample from the posterior distribution, we compare different sampling methods. The simulation studies illustrate that reject-ABC sampling method may be a good choice for the normal case while the two-block Gibbs sampling is better for the general ones. It should be noticed that we transform the hypotheses of homogeneity to the hypotheses (6). Then with different matrix , we can generate our method to a variety of hypotheses.
Author Contributions
Conceptualization, X.X.; methodology, X.X.; software, Y.W.; validation, Y.W. and X.X.; formal analysis, Y.W. and X.X.; writing—original draft preparation, Y.W.; writing—review and editing, Y.W.; visualization, Y.W.; supervision, X.X.; project administration, X.X.; funding acquisition, X.X. All authors have read and agreed to the published version of the manuscript.
Funding
This work was supported by the National Natural Science Foundation of China under Grant No.11471035.
Institutional Review Board Statement
The study did not require ethical approval.
Informed Consent Statement
Not applicable.
Data Availability Statement
Not applicable.
Acknowledgments
The author is very grateful to the referees and to the assistant editor for their kind and professional remarks.
Conflicts of Interest
The authors declare no conflict of interest. The funders had no role in the design of the study; in the collection, analyses, or interpretation of data; in the writing of the manuscript; or in the decision to publish the results.
Appendix A
Proof of lemma 1.
(1) First we show that
By the third condition in Definition 1, there exists a such that when , . Let be a sequence satisfies and let . Then for sufficiently large m and n such that and , we have
This indicates that when , . Thus is a Cauchy sequence, which must be convergence. Since is an arbitrary sequence, then the limit exists. Notice that is a continuous density function, so
Similarly can we show that
By condition (3) in Definition 1, for arbitrary , there exists a number B such that when , . Then by (A1) we have
This means that . In the same way can we obtain (2) From (A1) we can get
(3) As we can see
Then by the lemma we just proved and the fact that is a density function,
(4) Since
Then it is easy to get
(5)
Then by (A1)
(6)
Then by (A2), we have
□
Proof of Proposition 1.
(1) The log likelihood function is
Then we can get the derivatives as below
Using the second term in Lemma 1, we can get the expectation of the first derivatives
(2) The elements of the Fisher information matrix are computed as
So the equation holds. By the fourth condition in Definition 1, we can prove that
Now we show that . Suppose that , then there exists a nonzero vector such that , which also means that
Since , we have
where L is the Lebesgue measure. Because is nonzero, so , then
where . When ,
where D is a constant. Then , this is contradict to the first equation in Lemma 1. Thus the assumption of is not true, then . (3) We first calculate the second derivatives of the parameters.
Then by Lemma 1, we have
□
Proof of Proposition 2.
(1) First we calculate the derivatives as follow.
Then by the second equation in Lemma 1, we have
By Lemma 1(3),
Similarly can we prove that
(2) First we calculate the derivatives on the location parameter as
Similarly we have
Then as with the scale parameter, we have
Then .
(3)
Then by the fourth equation in Lemma 1 can we get
The same procedure can be applied to the rest 9 equations to show that the conclusion holds. □
Proof of Theorem 1.
First we give the Bernstein-von Mises theorem for multiple samples, see the Theorem 2 in Long and Xu [27]. Besides the Assumption 1 to 4 in the context, there are some other assumptions below
Assumption 5.
For all , the density function of the population satisfies the following conditions:
(a) The parameter space of θ contains an open subset , in which the true value is included.
(b) The set is independent of θ.
(c) For almost all , as a function of θ admits continous second derivatives , , for all .
(d) Denote by the Fisher’s information matrix of . The first and second derivatives of the logarithm of satisfy the equations
(e) Suppose the sample size of satisfies that when , . Let
We assume that all entries of are finite, and is positive definite.
Then, by Definition 1, Proposition 1 and 2 and Assumption A1- A5, the Theorem 1 holds. It should be noticed that since the prior is , its second moment doesn’t exist. So we draw samples from the first two density functions and combine them with , thus we get the new prior. This is a trick in the research of big data. □
Proof of Theorem 2.
First we give two conclusions
Let be the expectation of under distribution P. Then
By the Theorem 1, the above equation converges in probability to 0.
From the conclusion above we have
then by Theorem 1,
thus,
Then we can get
The expression above should have the same asymptotic distribution as , where and . From the conclusion above we have , thus we can get
where k is the degree of freedom and also the rows of matrix A. Thus
Under the null hypothesis,
Since , the expression above is equalivalent to
The first term can be rewritten as
This asypototically follows the distribution. The second and third terms tend to 0 in probability. Thus
Where is the cumulative distribution function of . Then by the asymptotic property, we have
□
References
- Hosmer, D.W. A Comparison of Iterative Maximum Likelihood Estimates of the Parameters of a Mixture of Two Normal Distributions Under Three Different Types of Sample. Biometrics 1973, 29, 761–770. [Google Scholar] [CrossRef]
- Murray, G.D.; Titterington, D.M. Estimation Problems with Data from a Mixture. Journal of the Royal Statistical Society. Series C (Applied Statistics) 1978, 27, 325–334. [Google Scholar] [CrossRef]
- Anderson, J.A. Multivariate logistic compounds. Biometrika 1979, 66, 17–26. [Google Scholar] [CrossRef]
- Qin, J. Empirical likelihood ratio based confidence intervals for mixture proportions. The Annals of Statistics 1999, 27, 1368–1384. [Google Scholar] [CrossRef]
- Owen, A. Empirical Likelihood Ratio Confidence Regions. The Annals of Statistics 1990, 18. [Google Scholar] [CrossRef]
- Zou, F.; Fine, J.P.; Yandell, B.S. On empirical likelihood for a semiparametric mixture model. Biometrika 2002, 89, 61–75. [Google Scholar] [CrossRef]
- Zhang, B. Assessing goodness-of-fit of generalized logit models based on case-control data. Journal of Multivariate Analysis 2002, 82, 17–38. [Google Scholar] [CrossRef]
- Inagaki, K.; Komaki, F. A modification of profile empirical likelihood for the exponential-tilt model. Statistics and Probability Letters 2010, 80, 997–1004. [Google Scholar] [CrossRef]
- Tan, Z. A note on profile likelihood for exponential tilt mixture models. Biometrika 2009, 96, 229–236. [Google Scholar] [CrossRef]
- Liang, K.Y.; Rathouz, P.J. Hypothesis Testing Under Mixture Models: Application to Genetic Linkage Analysis. Biometrics 1999, 55, 65–74. [Google Scholar] [CrossRef]
- Lemdani, M.; Pons, O. Likelihood Ratio Tests in Contamination Models. Bernoulli 1999, 5, 705. [Google Scholar] [CrossRef]
- Chen, H.; Chen, J.; Kalbfleisch, J.D. A Modified Likelihood Ratio Test for Homogeneity in Finite Mixture Models. Journal of the Royal Statistical Society Series B: Statistical Methodology 2002, 63, 19–29. [Google Scholar] [CrossRef]
- Chen, H.; Chen, J.; Kalbfleisch, J.D. Testing for a Finite Mixture Model with Two Components. Journal of the Royal Statistical Society Series B: Statistical Methodology 2003, 66, 95–115. [Google Scholar] [CrossRef]
- Chen, J.; Li, P. Hypothesis test for normal mixture models: The EM approach. The Annals of Statistics 2009, 37. [Google Scholar] [CrossRef]
- Li, P.; Liu, Y.; Qin, J. Semiparametric Inference in a Genetic Mixture Model. Journal of the American Statistical Association 2017, 112, 1250–1260. [Google Scholar] [CrossRef]
- Li, S.; Chen, J.; Guo, J.; Jing, B.Y.; Tsang, S.Y.; Xue, H. Likelihood Ratio Test for Multi-Sample Mixture Model and Its Application to Genetic Imprinting. Journal of the American Statistical Association 2015, 110, 867–877. [Google Scholar] [CrossRef]
- Liu, G.; Li, P.; Liu, Y.; Pu, X. Hypothesis testing for quantitative trait locus effects in both location and scale in genetic backcross studies. Scandinavian Journal of Statistics 2020, 47, 1064–1089. [Google Scholar] [CrossRef]
- Ren, P.; Liu, G.; Pu, X. Generalized fiducial methods for testing the homogeneity of a three-sample problem with a mixture structure. Journal of Applied Statistics 2023, 50, 1094–1114. [Google Scholar] [CrossRef] [PubMed]
- Hannig, J.; Iyer, H.; Lai, R.C.S.; Lee, T.C.M. Generalized Fiducial Inference: A Review and New Results. Journal of the American Statistical Association 2016, 111, 1346–1361. [Google Scholar] [CrossRef]
- Dempster, A.P.; Laird, N.M.; Rubin, D.B. Maximum likelihood from incomplete data via the EM algorithm. J. Roy. Statist. Soc. Ser. B 1977, 39, 1–38. [Google Scholar] [CrossRef]
- McLachlan, G.J.; Krishnan, T. The EM algorithm and extensions; Wiley Series in Probability and Statistics: Applied Probability and Statistics, John Wiley & Sons, Inc., New York, 1997. [Google Scholar]
- Fisher, R.A. The fiducial argument in statistical inference. Annals of Eugenics 1935, 6, 391–398. [Google Scholar] [CrossRef]
- Metropolis, N.; Rosenbluth, A.W.; Rosenbluth, M.N.; Teller, A.H.; Teller, E. Equation of State Calculations by Fast Computing Machines. The Journal of Chemical Physics 1953, 21, 1087–1092. [Google Scholar] [CrossRef]
- Hastings, W.K. Monte Carlo Sampling Methods Using Markov Chains and Their Applications. Biometrika 1970, 57, 97–109. [Google Scholar] [CrossRef]
- Owen, A.B.; Glynn, P.W. (Eds.) Monte Carlo and Quasi-Monte Carlo Methods; Springer International Publishing, 2018.
- Karunamuni, R.; Wu, J. Minimum Hellinger distance estimation in a nonparametric mixture model. Journal of Statistical Planning and Inference 2009, 139, 1118–1133. [Google Scholar] [CrossRef]
- Long, Y.; Xu, X. Bayesian decision rules to classification problems. Aust. N. Z. J. Stat. 2021, 63, 394–415. [Google Scholar] [CrossRef]
Figure 1.
The QQ-plot of the normal cases.
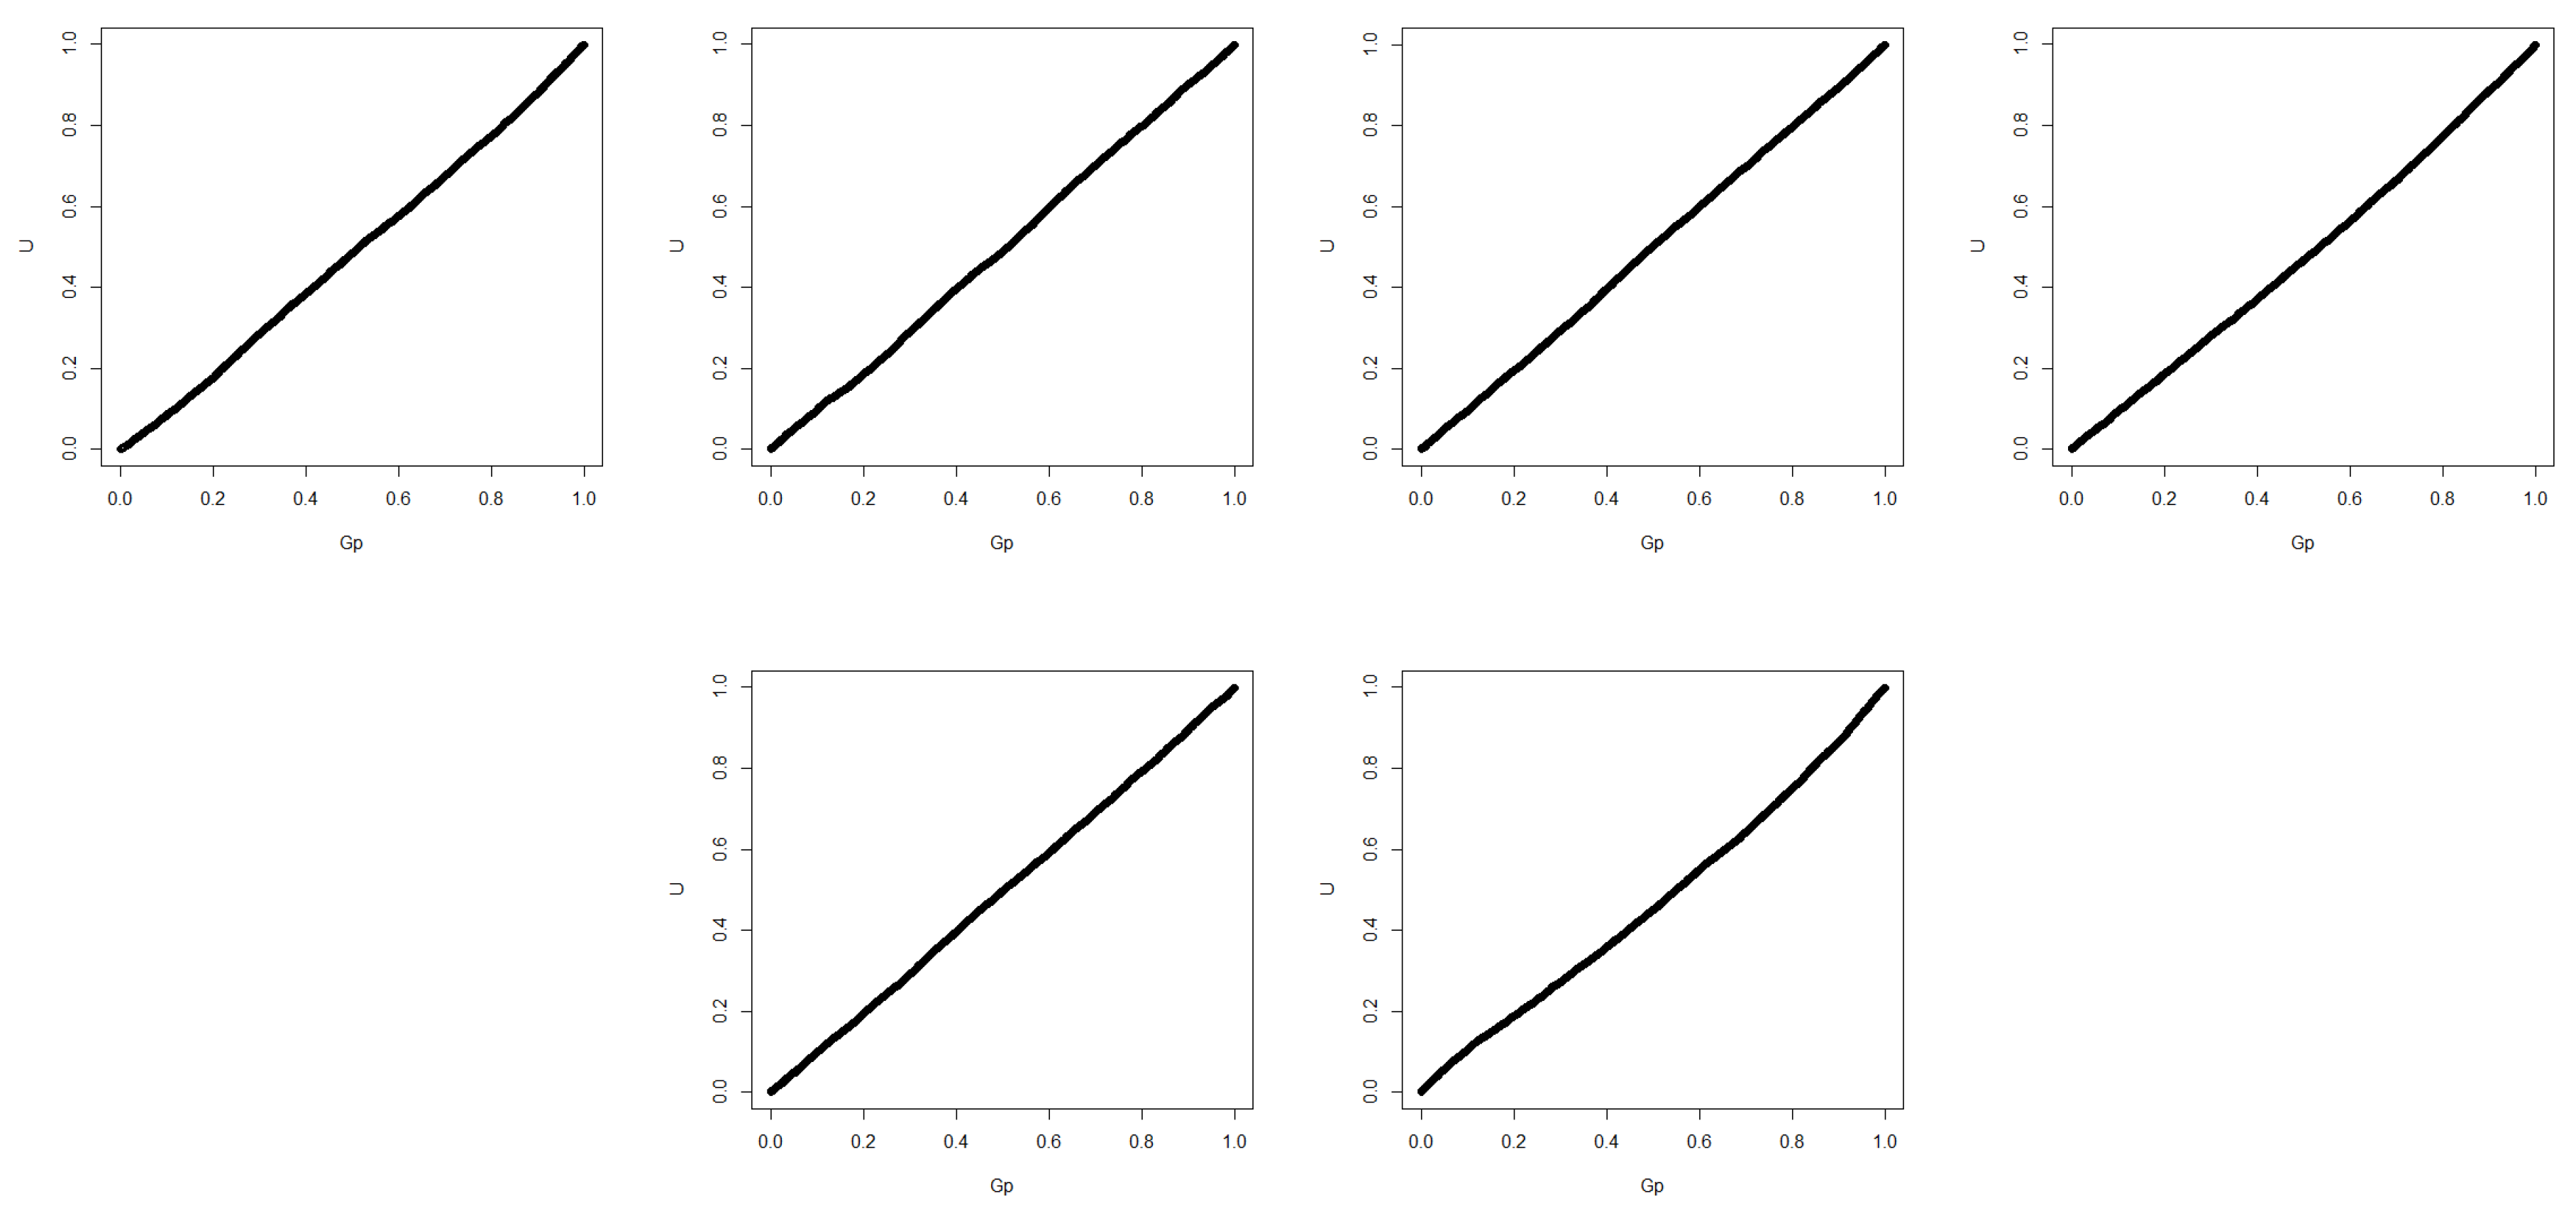
Figure 2.
The QQ-plot of the logistic cases.
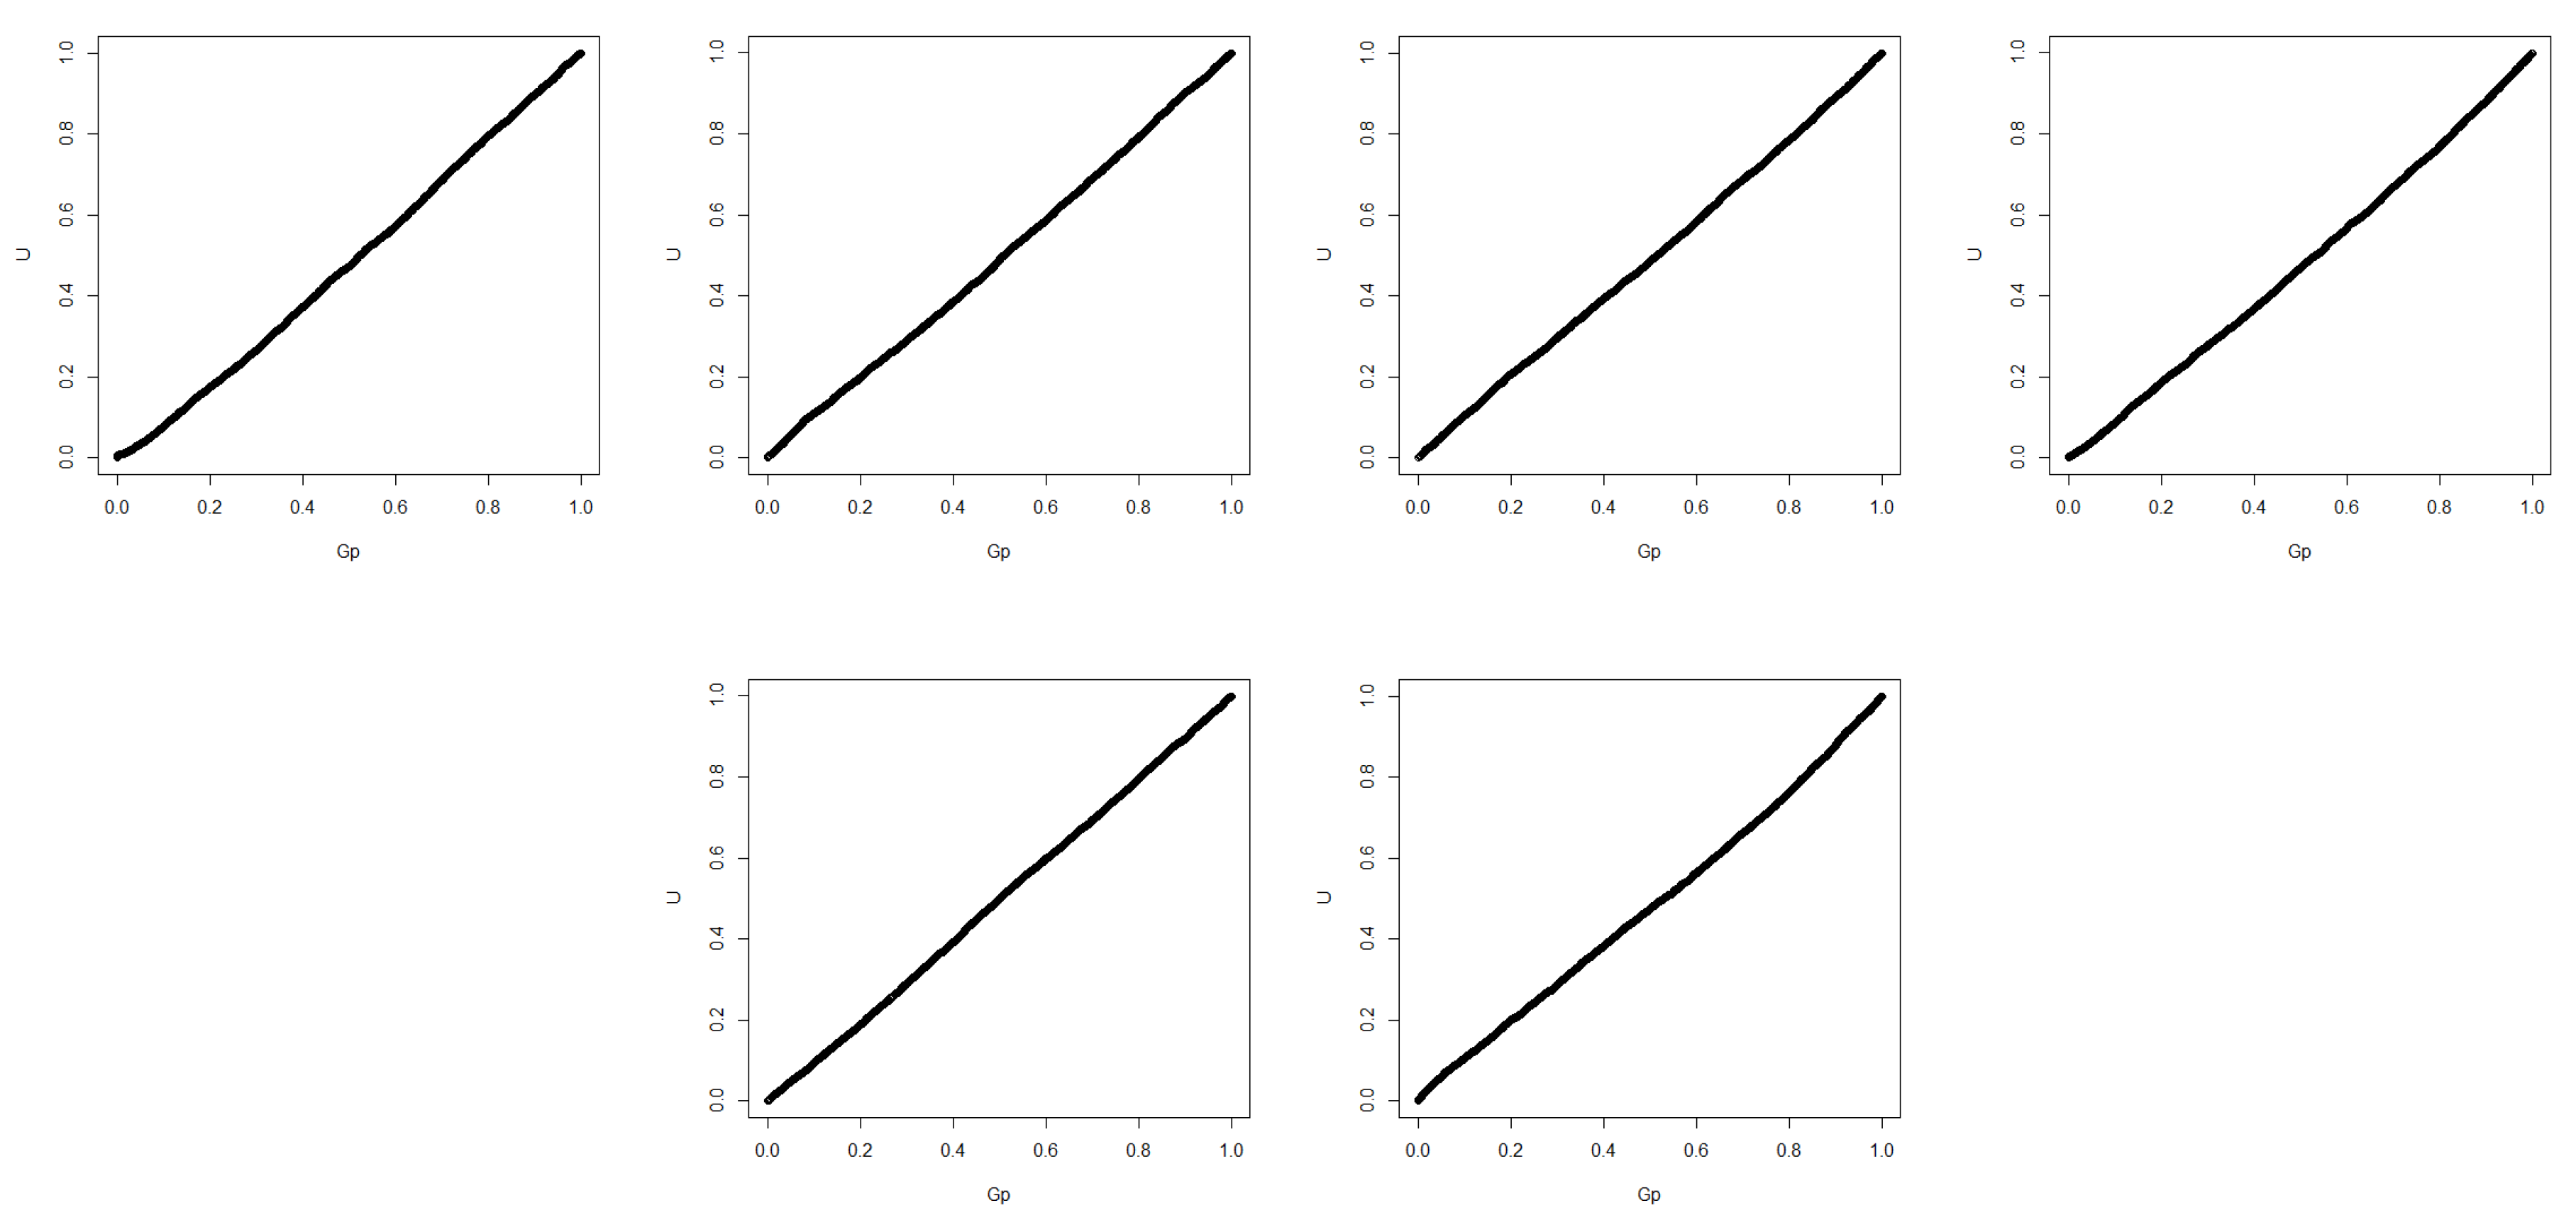

Table 1.
Frequency distribution of the lengths in centimeters of 11 year old male and female halibut caught on Western Trip I, April
Table 1.
Frequency distribution of the lengths in centimeters of 11 year old male and female halibut caught on Western Trip I, April
| 75 | 80 | 85 | 90 | 95 | 100 | 105 | 110 | 115 | 120 | 125 | 130 | 135 | |
| Males | 2 | 7 | 8 | 6 | 7 | 11 | 10 | 9 | 9 | 3 | 2 | 0 | 0 |
| Females | 0 | 1 | 0 | 0 | 4 | 2 | 7 | 18 | 22 | 29 | 28 | 13 | 10 |
Table 2.
Type-I errors(%) of the three methods in normal cases.
| G | |||
| 4.72 | |||
| ) | 4.63 | 4.75 | 5.42 |
| 4.85 | 4.36 | ||
| 4.46 | 4.79 | ||
| 3.92 | 4.64 | 4.77 | |
| 5.65 | 4.51 |
Table 3.
Power comparison(%) of the cases when and .
| 0.3 | 0.5 | 0.7 | |||||||
| G | G | G | |||||||
| (10, 10, 10) | 32.2 | 33.9 | 36.8 | 32.2 | 33.9 | 36.5 | 33.3 | 35.9 | 36.5 |
| (20, 20, 20) | 70.6 | 74.2 | 76.3 | 70.3 | 74.0 | 76.0 | 72.3 | 76.2 | 75.6 |
| (30, 30, 30) | 90.2 | 93.3 | 92.1 | 89.2 | 91.2 | 92.2 | 90.7 | 92.2 | 92.0 |
| (10, 20, 30) | 46.3 | 50.9 | 46.4 | 51.3 | 56.1 | 45.6 | 56.8 | 63.2 | 45.6 |
| (30, 20, 10) | 84.3 | 85.8 | 85.3 | 81.3 | 83.3 | 85.4 | 82.8 | 84.3 | 85.2 |
| (10, 10, 100) | 35.4 | 43.0 | 41.8 | 33.1 | 41.9 | 41.7 | 34.3 | 44.5 | 41.2 |
| (15, 25, 150) | 63.5 | 70.7 | 71.5 | 66.8 | 75.1 | 74.0 | 75.8 | 82.3 | 72.6 |
Table 4.
Power comparison(%) of the cases when and .
| 0.3 | 0.5 | 0.7 | |||||||
| G | G | G | |||||||
| (10, 10, 10) | 11.8 | 20.8 | 22.5 | 13.9 | 22.3 | 22.8 | 14.0 | 24.3 | 22.4 |
| (20, 20, 20) | 28.4 | 39.9 | 43.8 | 29.7 | 41.6 | 44.6 | 32.8 | 44.5 | 43.4 |
| (30, 30, 30) | 42.2 | 57.1 | 58.5 | 44.1 | 56.3 | 58.3 | 45.5 | 57.4 | 58.5 |
| (10, 20, 30) | 14.3 | 23.8 | 26.3 | 15.5 | 26.8 | 26.5 | 20.9 | 33.5 | 26.8 |
| (30, 20, 10) | 38.4 | 50.5 | 50.1 | 38.6 | 49.8 | 51.3 | 38.9 | 49.2 | 50.7 |
| (10, 10, 100) | 9.4 | 18.0 | 25.2 | 14.4 | 22.2 | 23.7 | 18.5 | 27.6 | 25.4 |
| (15, 25, 150) | 20.9 | 35.4 | 35.6 | 28.2 | 42.5 | 37.7 | 35.3 | 48.8 | 38.4 |
Table 5.
Power comparison(%) of the cases when and .
| 0.3 | 0.5 | 0.7 | |||||||
| G | G | G | |||||||
| (10, 10, 10) | 38.9 | 42.6 | 46.6 | 38.2 | 42.1 | 41.7 | 42.0 | 46.2 | 42.6 |
| (20, 20, 20) | 77.3 | 79.7 | 82.3 | 75.2 | 78.0 | 80.6 | 80.0 | 82.6 | 80.8 |
| (30, 30, 30) | 93.6 | 94.2 | 95.5 | 93.8 | 94.0 | 93.3 | 93.9 | 94.5 | 94.4 |
| (10, 20, 30) | 47.2 | 50.0 | 55.2 | 55.4 | 59.6 | 57.2 | 62.1 | 66.0 | 56.1 |
| (30, 20, 10) | 88.4 | 89.0 | 88.9 | 85.8 | 87.2 | 86.5 | 86.3 | 87.6 | 85.3 |
| (10, 10, 100) | 46.0 | 48.9 | 49.1 | 53.8 | 56.9 | 45.9 | 59.1 | 64.6 | 48.6 |
| (15, 25, 150) | 77.1 | 78.6 | 78.1 | 83.9 | 84.8 | 74.4 | 89.6 | 91.5 | 75.1 |
Table 6.
Type-I errors(%) of the three methods in logistic cases.
| G | |||
| 2.81 | |||
| 3.85 | 2.67 | ||
| 4.61 | 2.31 | ||
| 4.72 | 4.92 | 3.41 | |
| 4.16 | 4.92 | 2.58 | |
| 5.96 | 2.91 |
Table 7.
Power comparison(%) of the cases when and .
| 0.3 | 0.5 | 0.7 | |||||||
| G | G | G | |||||||
| (10, 10, 10) | 12.2 | 12.0 | 13.2 | 12.6 | 13.3 | 14.5 | 13.2 | 13.0 | 13.7 |
| (20, 20, 20) | 29.4 | 30.3 | 26.2 | 28.3 | 29.9 | 26.4 | 28.9 | 30.2 | 26.0 |
| (30, 30, 30) | 43.2 | 45.4 | 36.6 | 43.1 | 45.2 | 35.9 | 43.9 | 46.5 | 37.3 |
| (10, 20, 30) | 17.5 | 18.1 | 15.1 | 19.3 | 20.2 | 16.9 | 22.2 | 23.2 | 18.7 |
| (30, 20, 10) | 35.4 | 36.6 | 31.8 | 33.9 | 35.8 | 32.4 | 33.5 | 35.1 | 30.4 |
| (10, 10, 100) | 13.8 | 17.8 | 12.7 | 13.8 | 17.1 | 11.8 | 13.9 | 16.6 | 11.9 |
| (15, 25, 150) | 24.4 | 29.3 | 20.1 | 25.3 | 30.0 | 22.7 | 30.9 | 38.1 | 24.1 |
Table 8.
Power comparison(%) of the cases when and .
| 0.3 | 0.5 | 0.7 | |||||||
| G | G | G | |||||||
| (10, 10, 10) | 10.3 | 13.5 | 16.2 | 10.5 | 14.7 | 16.3 | 11.2 | 15.9 | 15.9 |
| (20, 20, 20) | 20.8 | 32.4 | 23.6 | 21.7 | 33.3 | 23.7 | 23.0 | 33.4 | 24.1 |
| (30, 30, 30) | 32.4 | 44.7 | 33.3 | 33.8 | 44.9 | 33.2 | 34.9 | 46.2 | 34.1 |
| (10, 20, 30) | 9.6 | 15.3 | 12.1 | 11.1 | 18.0 | 15.2 | 14.2 | 21.9 | 17.9 |
| (30, 20, 10) | 27.4 | 37.1 | 21.9 | 27.1 | 36.7 | 22.4 | 27.1 | 36.3 | 22.3 |
| (10, 10, 100) | 8.9 | 14.8 | 10.6 | 10.2 | 16.3 | 12.2 | 12.7 | 18.4 | 16.8 |
| (15, 25, 150) | 15.1 | 26.2 | 20.6 | 21.1 | 32.0 | 20.7 | 24.2 | 35.6 | 22.0 |
Table 9.
Power comparison(%) of the cases when and .
| 0.3 | 0.5 | 0.7 | |||||||
| G | G | G | |||||||
| (10, 10, 10) | 17.4 | 17.9 | 18.1 | 18.3 | 21.7 | 18.8 | 18.5 | 22.6 | 19.6 |
| (20, 20, 20) | 43.7 | 49.4 | 36.3 | 43.7 | 49.3 | 36.2 | 45.2 | 51.3 | 37.7 |
| (30, 30, 30) | 62.9 | 67.3 | 58.1 | 62.2 | 67.2 | 57.9 | 63.6 | 68.4 | 59.6 |
| (10, 20, 30) | 20.6 | 24.2 | 21.3 | 24.1 | 29.4 | 26.2 | 30.1 | 35.8 | 35.8 |
| (30, 20, 10) | 52.7 | 57.0 | 37.6 | 51.7 | 55.9 | 39.7 | 51.5 | 56.0 | 38.8 |
| (10, 10, 100) | 19.9 | 24.1 | 18.7 | 23.1 | 27.3 | 19.8 | 23.5 | 30.2 | 19.7 |
| (15, 25, 150) | 36.7 | 43.1 | 40.4 | 44.6 | 51.5 | 40.7 | 51.0 | 57.8 | 40.1 |
Disclaimer/Publisher’s Note: The statements, opinions and data contained in all publications are solely those of the individual author(s) and contributor(s) and not of MDPI and/or the editor(s). MDPI and/or the editor(s) disclaim responsibility for any injury to people or property resulting from any ideas, methods, instructions or products referred to in the content. |
© 2023 by the authors. Licensee MDPI, Basel, Switzerland. This article is an open access article distributed under the terms and conditions of the Creative Commons Attribution (CC BY) license (http://creativecommons.org/licenses/by/4.0/).
Copyright: This open access article is published under a Creative Commons CC BY 4.0 license, which permit the free download, distribution, and reuse, provided that the author and preprint are cited in any reuse.


