Submitted:
11 August 2023
Posted:
16 August 2023
You are already at the latest version
Abstract
This study delves into the foundational aspects of electrocardiographic (ECG) lead systems, specifically focusing on Einthoven’s Triangle and Wilson’s Central Terminal. We introduce the innovative concept of a Precordial Central Terminal, a strategic arrangement of thoracic electrodes that establishes two Einthoven’s triangles within the horizontal plane, in accordance with physical-mathematical principles. Furthermore, we meticulously scrutinize Goldberger’s contributions to the field of ECG, particularly augmented leads, which shed light on the development of our theory. Additionally, we propose the implementation of a novel standardized electrocardiograph, characterized by its use of exclusively “precordial” electrodes, yet capable of providing a comprehensive three-dimensional perspective of cardiac electrical activity. By amalgamating theoretical underpinnings with empirical experimentation, our study lays the groundwork for future investigations, including the experimental validation of our innovative Precordial Terminal. This validation holds the promise of yielding substantial advancements in the realm of clinical electrocardiography.
Keywords:
electrocardiography
; Einthoven’s Triangle
; Wilson’s Central Terminal
I. Introduction
The generation of electrocardiographic (ECG) records is grounded in models that capture the complexity of cardiac electrical signals. An indispensable cornerstone of this field is the iconic Einthoven’s Triangle, an equilateral triangle establishing the foundation for cardinal and augmented leads on the ECG. It also serves as the basis for defining Wilson’s Central Terminal (WCT)[1]. Yet, despite its prominence in clinical practice, profound questions persist concerning the underlying theory and precise interpretation of both leads and the WCT.
This article embarks on a comprehensive exploration of the core principles of cardinal leads within the context of Einthoven’s Triangle. We delve into the concept of the bipolar lead vector, which delineates the electrical potential difference between two measurement points on the conductor surface. Through this understanding of vectors, we expose the mathematical and geometric relationships that establish the foundations for the classic cardinal leads: DI, DII, and DIII.
A meticulous examination is carried out on Goldberger’s contribution to ECG theory, particularly in the context of augmented leads. These leads are intricately linked with the cardinal vectors, shedding light on their functional interrelation.
At the heart of our analysis lies the WCT, a concept that has intrigued researchers for decades. Our discussion revolves around the historical interpretations of this terminal and its connection to the cardinal and augmented leads. Through meticulous exploration, we reveal the evolution of the interpretation of WCT, along with the persisting limitations and challenges in its precise measurement.
This article confronts current challenges in interpreting and measuring cardinal and augmented leads. We scrutinize the disparities between traditional theories and contemporary observations, underscoring the necessity for a robust integration between theoretical concepts and experimental practices. In this vein, we develop a potential theory that harmonizes both facets in a more cohesive method.
II. Conceptual Framework Construction
II.1. Reference electrode
The standard electrocardiogram (ECG) employs 12 leads and includes a reference electrode positioned on the Right Leg (RL), resulting in a total of 9 electrodes [2] responsible for its generation:
- 6 precordial electrodes (V1-V6).
The three limb electrodes give rise to the three vertices of Einthoven’s Triangle [2]. These vertices are separated from each other by an angle of 120º, considering the lines originating from the centroid.
Based on this, we can define:
where represents the cardiac electrical potential measured by an electrode on the limb or, equivalently, at a vertex point of Einthoven’s Triangle.
Eq.1 signifies that the values of various potentials are inherently linked to the potential of the right leg, . Assuming that is measured concerning a neutral potential (e.g., earth ground)[2], any potential difference measurement should inherently refer to . For instance: .
Similarly, the augmented leads introduced by Goldberger are calculated as the difference between one of the limb potentials (, , and ) and the average of the remaining two [5]. For instance:
II.2. Wilson’s Central Terminal
As evident in Eq.2, the calculation of WCT involves taking the average of potentials recorded by the cardinal leads of Einthoven’s Triangle. However, an additional aspect needs consideration: a high-value resistance (≥ 5 kΩ) is added to those connected to each of the electrodes. These three corresponding electrodes are positioned to converge at a common point, where the theoretical placement of the WTC is posited: at the centroid of Einthoven’s Triangle [2,6] (Figure 1).
Clearly represented in Eq.2, WCT is calculated as the average of the potentials registered by the cardinal leads of the Einthoven’s Triangle; but we must add one aspect: from those that are connected to each of the electrodes a resistance of high value (≥ 5 kΩ). The three corresponding electrodes are made to coincide at a common point, which is where the theoretical location of the WTC is assumed: the centroid of the Einthoven’s Triangle [2,6] (Figure 1).
The WCT serves as a neutral reference point for the precordial leads within the 12-lead ECG. As demonstrated in Eq.2, its influence is rooted in the three cardinal electrodes, implying that its value hinges on the positioning of the limb electrodes. However, recent observations have unveiled fluctuations in the WCT throughout the cardiac cycle, resembling behaviour akin to a lead [2,7,8]. There has even been suggesting its potential existence beyond the geometric plane defined by the cardinal leads [2], in essence, beyond the plane encompassing Einthoven’s Triangle.
Despite a few investigations [2,7,8], research on the WCT has been relatively limited in recent years, perhaps attributed to the arduous methods necessitated by experimental studies attempting its measurement, such as the immersion of study subjects in water after their confinement within a metallic structure [7].
In the 1950s, Ernest Frank [9], in his influential work “General theory of heat-vector projection”, was the pioneer in raising concerns about fluctuations in the WCT during the cardiac cycle, an observation that has since been validated. This validation is exemplified by recent measurements, such as the quantification of the WCT amplitude relative to the DII amplitude, yielding a value of 51.2 % (with a reported standard deviation of 27.4 %) and even reaching peaks exceeding 100 %[8].
The comprehensive investigation conducted by Gargiulo et al. in 2016[8] substantiates considering the WCT as an additional reference. However, the persistence of a theoretical discrepancy between Wilson’s original work and present-day observations raises questions. Could there be an opportunity to refine the definition of the WCT grounded in its physical-mathematical structures?
As of today, ongoing experiments continue to probe the significance of the WCT and its spatial location. Nonetheless, it remains imperative to synthesize the historical theoretical groundwork with the findings of contemporary empirical studies.
II.3. Bipolar Lead Vector Definition
The generation of an ECG recording is predicated on a model wherein the limb (or cardinal) leads constitute Einthoven’s Triangle. Within this triangle’s centroid, a dipole moment vector is postulated to be anchored at its origin, functioning as an analogy of cardiac electrical activity. Throughout the cardiac cycle, it rotates as a temporal function [2]. We establish the concept of an arbitrary electric dipole consistent with theoretical principles [6], represented as , relative to the canonical basis of the Cartesian Coordinate System. This dipole is affixed at the origin and is defined as follows:
where , , and denote the components of along the , , and axes, respectively.
Consider an arbitrary point located on the surface of any conductor. We establish the potential due to the presence of the dipole at point as follows:
where is a vector whose components, , , and , correspond to the values of the measurement under the assumption that the electric dipole is represented by the basis vectors themselves. The operation denotes the dot product. This vector, , is identified as the lead vector. In this context, the reference point for potential measurements at point is regarded as arbitrary [6].
When we take into account an infinite number of points, , distributed across the surface of the conductor and assume a constant dipole, we can express:
This enables us to define:
where denotes the electric potential difference between points and . We refer to these points as “leads”, and they are the locations on the conductor’s surface where the electrodes are positioned [6] (Figure 2).
Following this, we have:
where , and this difference is referred to as the “bipolar lead vector” since it involves two measurement points (leads).
II.4. Lead Vectors of Einthoven’s Triangle
Within Einthoven’s Triangle, the lead vectors , and are characterized as vectors originating from the centroid of the triangle and extending to the vertices R, L, and F (signifying the right arm, left arm, and left leg electrodes, respectively) (Figure 3). Consequently, the potentials at the vertices can be established for an arbitrary constant dipole as follows:
, and within Einthoven’s Triangle.
These vectors (, and ) originate and terminate at the vertices of Einthoven’s Triangle. They are the vectors recognized in clinical practice, as they define the orientations of the axes DI, DII, and DIII within the Bailey Hexaxial System.
The notations DI, DII, and DIII essentially represent the “standard leads of the members”. In other words, they denote the notations employed for the scalar magnitudes of potential differences , and .
The magnitudes of the potential differences , and in the directions , and , respectively, they are not independent; rather, they adhere to Kirchhoff’s Law [6]:
II.5. The Front Plane and Appropriate Coordinate System
To accurately define the spatial orientation of Einthoven’s Triangle, it is imperative to adopt a coordinate system that eliminates any ambiguity or confusion in the interpretation of magnitudes involved in our analysis.
For the purposes of this paper, we will establish a reference coordinate system in which the positive directions of the , , and axes correspond to the front, right (from the observer’s perspective), and top directions, respectively. With this setup, assuming α represents the angle between the vector , fixed at the centroid of Einthoven’s Triangle, and the horizontal axis, we can express this relationship as follows [6]:
This relationship leads to the following conclusion:
It's noteworthy that these three vector equations involve the component . In other words, the plane’s description disregards the -coordinate of our chosen coordinate system (Figure 4).
, and within Einthoven’s Triangle.
II.6. Vector Analysis of Central Terminal Structures
Based on the accumulated theory, let’s delve into the workings “inside” the definition of the WCT. According to Eq.2,
The sum invariably results in the additive identity of vector summation due to the additive inverse nature of vector operations. Additionally, the outcome of Eq.3 yields a scalar value of zero, stemming from the dot product of a vector , where its components , and are all null.
If Eq.3 were valid, the introduction of resistors to establish a neutral reference would not have been essential; indeed, the reference potential of WCT would have been precisely zero.
Conversely, in augmented leads, a similar strategy with resistors is adopted. Here, two resistances of are integrated from the leads designated as reference points. These leads are connected and converge at a common point known as Goldberger’s Central Terminal (GCT). Intriguingly, the orientation of the augmented lead vectors, namely aVR, aVL, and aVF, corresponds to that of the vectors , and , respectively. This alignment signifies a clear and distinctive functional relationship between Einthoven’s and Goldberger’s leads:
As per Eq.4, it becomes necessary to suggest the positioning of three GCT at the midpoint of each side of Einthoven’s Triangle. Consequently, the orientation of augmented leads aligns with the medians of Einthoven’s Triangle, consistent with the respective vertices they are denoted by.
Interestingly, the parallels between the behaviour of GCT and WCT appear to diverge. The author’s literature review did not yield significant data that reproduces the phenomena observed with WCT.
II.7. Proposal for a New Central Terminal
Building on Goldberger’s concept of enhancing the signal from leads VR, VL, and VF by altering WCT to GCT, a notion arises to extract the potential from the specific electrode in question.
Given the intrinsic relationship between augmented leads and the cardinal leads, we can infer the subsequent equations [5]:
While Goldberger’s concept was indeed ingenious, it’s noteworthy that the precordial leads continue to reference the WCT. Notably, no inherent issue arises from this arrangement, as none of the precordial leads are encompassed within the WCT framework.
The rationale behind augmenting the signal was particularly pertinent during an era when ECG traces were characterized by their high thickness and low amplitude [10].
Could it be possible to formulate a Central Terminal for the precordial leads using reasoning akin to Goldberger’s approach? Goldberger extracted the electrode potentials from an existing Central Terminal (Wilson’s), while keeping the remaining two as references. However, in the case of precordial leads, they refer to a Central Terminal that doesn’t inherently include the precordial electrodes.
It raises the question: can we potentially devise a Central Terminal solely using precordial leads that could function as a reference point? If such a formulation were attainable, the terminal’s fluctuations might parallel the behaviour observed in GCT fluctuations within augmented leads, which demonstrate consistent comportment.
A study conducted by Medias et al. [10] presents intriguing insights. They suggested a shift from the 12-lead ECG to a 9-lead ECG comprising the 3 non-augmented leads (VR, VL, VF) and the 6 precordial leads. They proposed using VR, VL, and VF leads by placing the initial three precordial electrodes on the right arm, left arm, and left leg, respectively [10]. This generated three signals that, while slightly reduced in amplitude compared to their magnified counterparts, maintained sufficient visual quality for clinical diagnosis.
Moreover, an alternate 9-lead ECG model has been employed, maintaining the concept of a reliable reference. For example, a model retained the limb leads (both Goldberger’s and Einthoven’s) but excluded V2, V4, and V5. Although this model still used 12 electrodes, it incorporated 6 distinct reference electrodes positioned on the right leg [11].
After thoroughly examining prior research and aligning it with the theoretical framework developed in this paper, we were initially inclined to propose the following definition:
This concept aimed to establish a precordial lead in relation to the average of the other five leads, distributing electrodes equally around the thorax. However, upon more in-depth analysis, we realized that this formulation would not harmonize with the vector theory we have developed, as the lead vectors would lack a coherent arrangement.
Upon further scrutiny, and consistent with the current theory, we arrive at the following proposition as a potential solution to the issue of precordial reference electrodes:
In this context, indicates that the other two leads being considered must be separated by an angle of 120º.
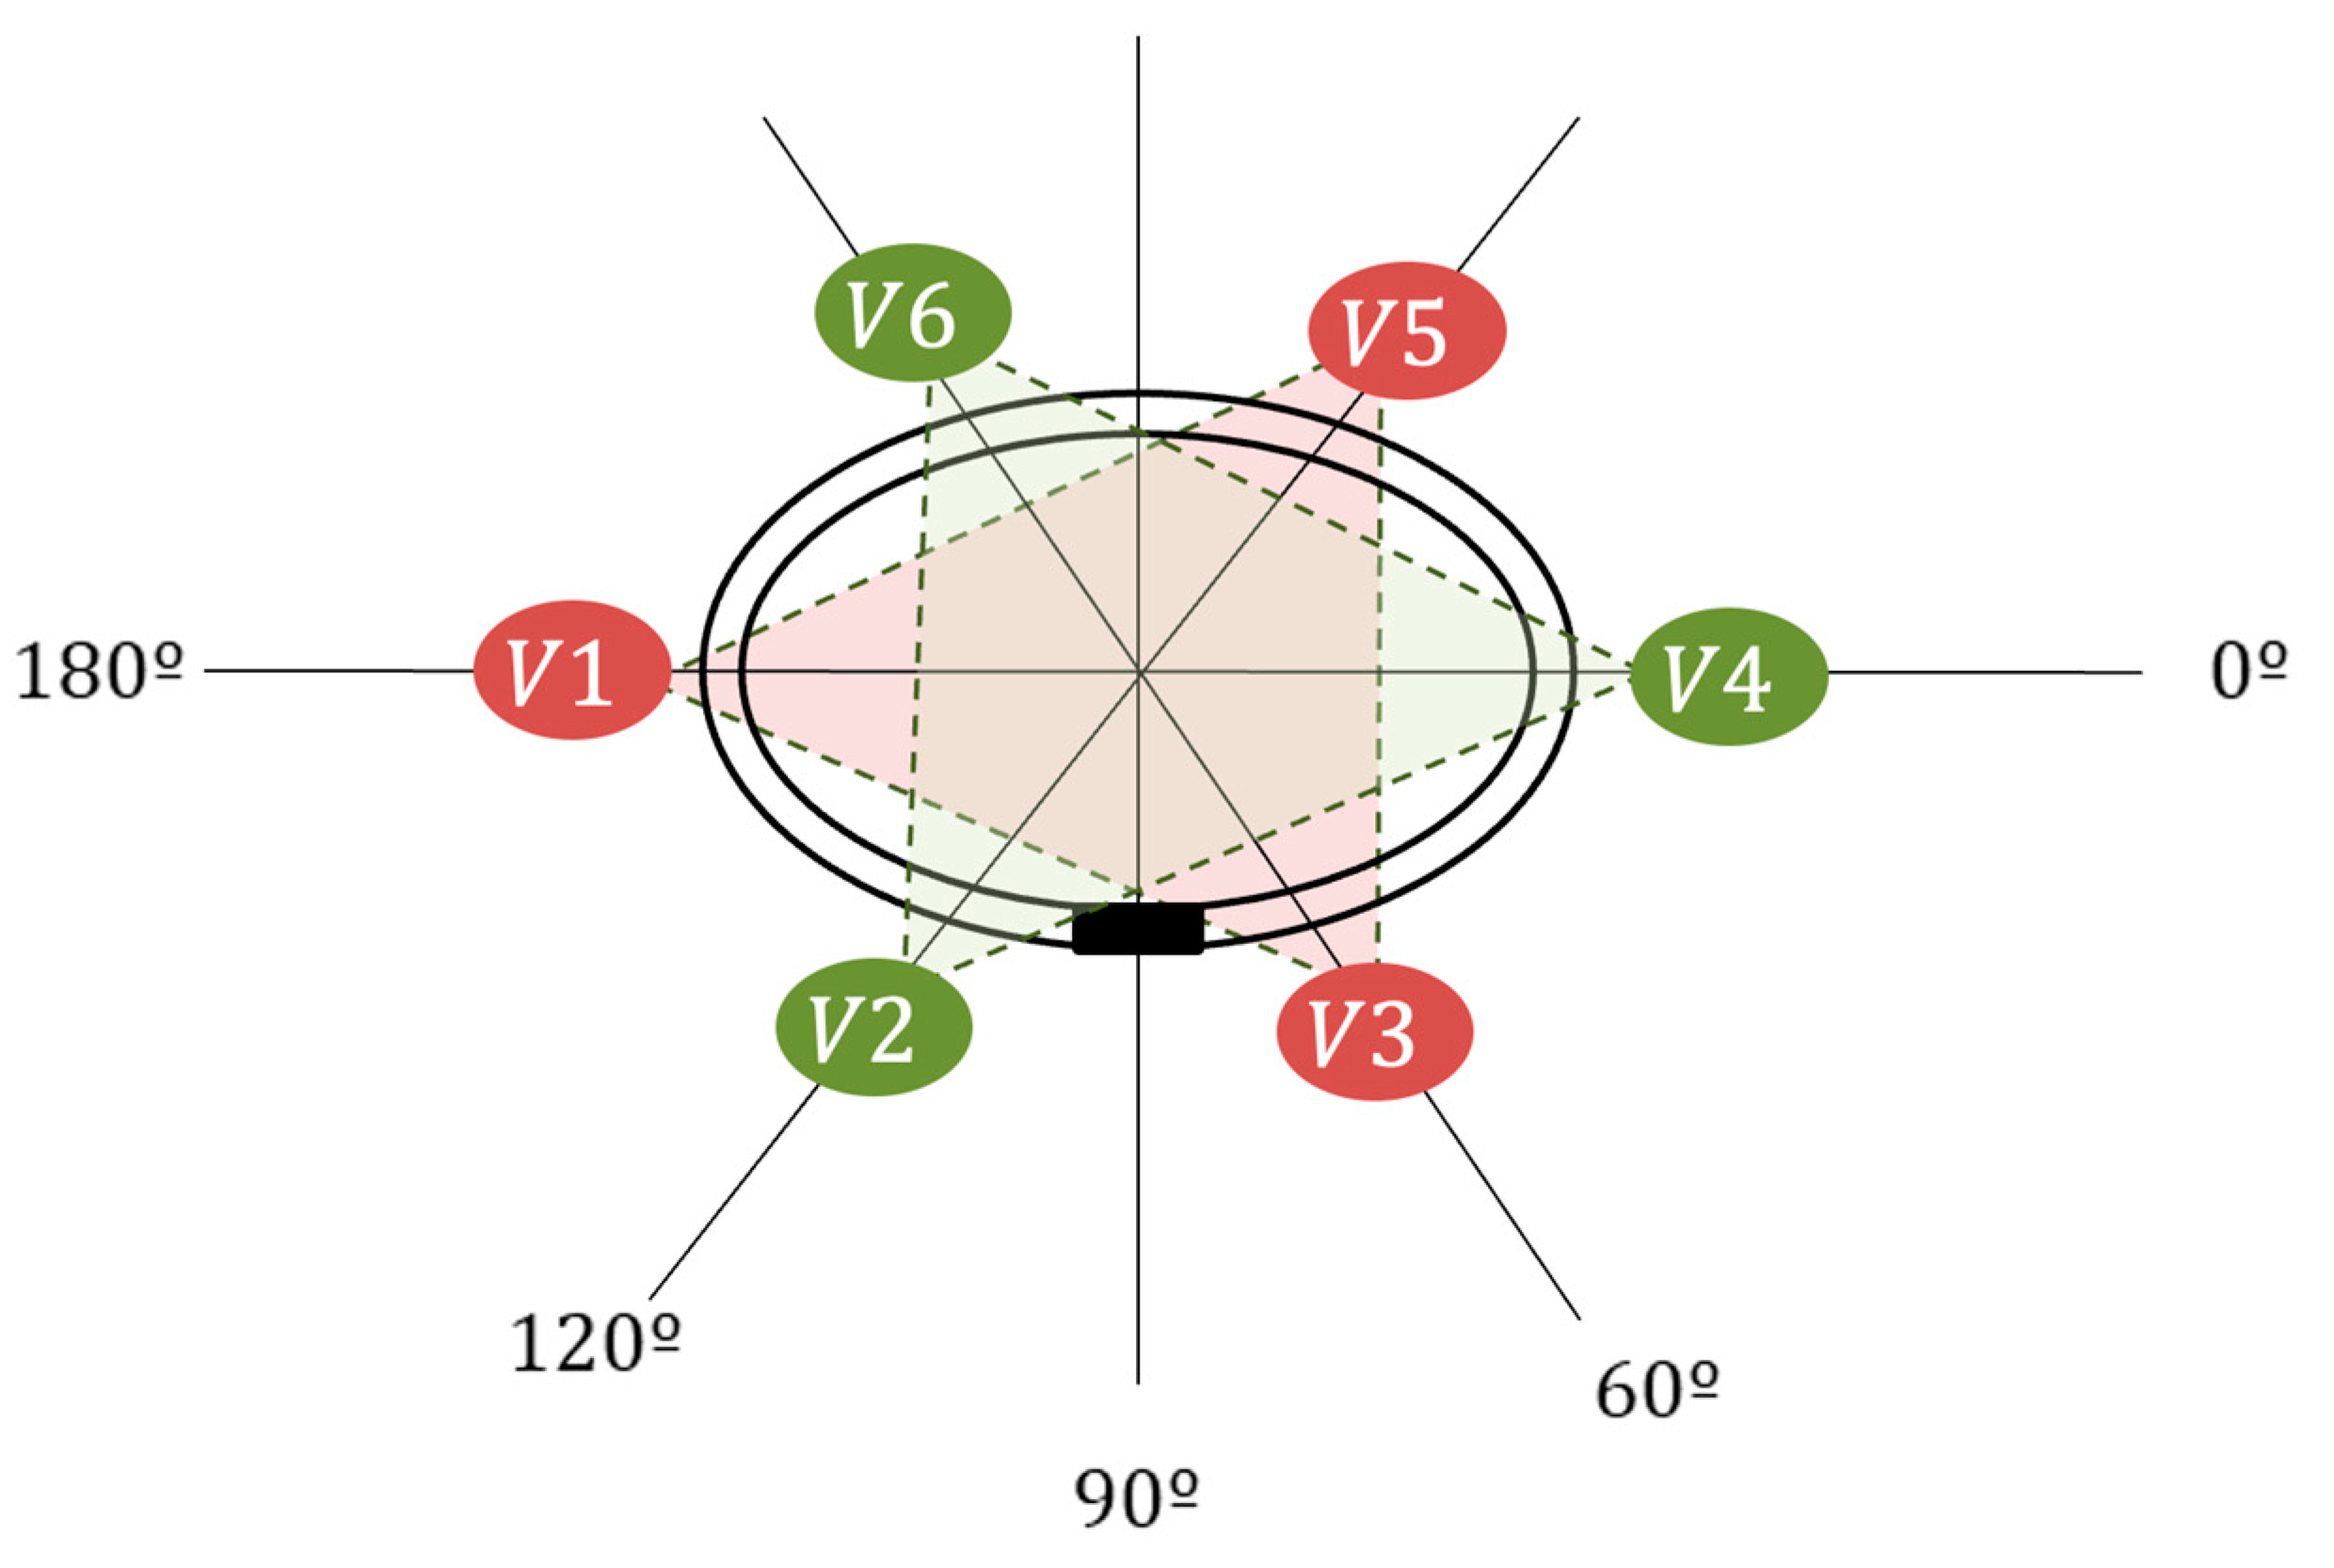
To achieve the desired spatial distribution of the 6 precordial electrodes, it is necessary to position the electrodes around the thoracic circumference at intervals of 60º, as 360º/6 = 60º (Figure 5).
As illustrated in Figure 5, we can create a configuration resembling two “Einthoven’s Triangles” arranged horizontally, forming what we can refer to as a “six pointed star”. Drawing from the earlier vector analysis, the distinct Central Terminals will be situated at the midpoint of the opposing side of each precordial lead, with both triangles sharing the same centroids. Furthermore, the arrangement of the bipolar lead vectors reproduces that of Einthoven’s Triangle with a frontal orientation. This signifies that we can establish lead vectors within our horizontal triangles much like we described for Einthoven’s Triangle.
By placing the origin of our coordinate system at the intersection point of all the medians from both triangles, we acquire a coordinate framework in which we can accommodate the frontal Einthoven’s Triangle and the two Einthoven’s Triangles.
In light of this, we can conceive a “novel electrocardiograph” that is entirely standardized in terms of its Central Terminals and leads, exclusively utilizing “precordial” electrodes. Consequently, “non-augmented” frontal plane leads could be derived from the same precordial leads, as proposed by Medias et al. [10]. This approach, considering the insights presented by Cho et al. [11], suggests that even the reference to the right leg might not be dispensable.
Traditional electrocardiographs are structured with three main components: Einthoven’s leads, Goldberger’s leads, and precordial leads. The first two exhibit clear functional relationships, while the third, seemingly isolated, holds inherent potential to generate three frontal plane leads of adequate quality. In the contemporary context, it appears essential to standardize conventional electrocardiography, despite the historical concepts tailored to our clinical convenience.
III. Conclusions
We have conducted a comprehensive review of the theoretical and conceptual foundations supporting ECG leads and central leads in the context of Einthoven’s Triangle. Through a thorough exploration of the underlying mathematical and geometric relationships.
We reaffirm the crucial importance of Einthoven’s Triangle as an essential basis for the generation of electrocardiographic records. This model establishes the foundation for the cardinal leads, including DI, DII, and DIII. Our analysis highlights its clinical relevance and its primary role as a reference point for measuring cardiac electrical potentials.
We use the concept of the “bipolar lead vector” to be able to more accurately address potential differences between measurement points on the conductor surface. This vectorial approach has allowed us to establish solid mathematical and geometric relationships that support the cardinal leads and that allow branching towards other hypotheses while keeping the theoretical bases invariant.
We delve into the WCT and its historical evolution, focusing on the need for a more solid physical-mathematical definition due to the observed fluctuations in its position and amplitude throughout the cardiac cycle.
We established a significant link between augmented Goldberger’s leads and cardinal vectors, highlighting their functional connection. We explore how augmented leads interact with WCT and venture to reconsider the interpretation of central leads in relation to precordial leads.
We proposed an innovative Central Terminal for the precordial leads, based on the spatial arrangement of the electrodes around the thorax and which is intrinsically related to the formulation of two Einthoven’s triangles in the horizontal plane. This new formulation also has the potential to generate clinical-grade “non-augmented” frontal plane leads, possibly marking a milestone in the standardization of conventional electrocardiography.
We highlight the importance of uniting theoretical foundations with practical experimentation, underlining the need for a coherent and solid understanding between the two. In addition, we recognize the inherent clinical importance of our conclusions and point the way for future research. We suggest experimentally validating our proposal for the new Central Terminal and exploring its applicability in clinical diagnosis, opening up exciting possibilities to improve current clinical practices.
Conflicts of Interest
The authors declare no conflict of interest.
References
- Wilson FN, Johnston FD, MacLeod AG, et al. Electrocardiograms that represent the potential variations of a single electrode. Am Heart J 1934, 9, 447–458. [Google Scholar] [CrossRef]
- Gargiulo GD, Bifulco P, Cesarelli M, McEwan AL, Moeinzadeh H, O’Loughlin A, Shugman IM, Tapson JC, Thiagalingam A. On the Einthoven Triangle: A Critical Analysis of the Single Rotating Dipole Hypothesis. Sensors. 2018, 18, 2353. [CrossRef]
- Einthoven W, Fahr GE, De Waart A. Über die Richtung und die manifeste Grösse der Potentialschwankungen im menschlichen Herzen und den Einfluss der Herzlage auf die Form des Elektrokardiogramms. Pfluegers Arch 1950, 150, 275–315. [Google Scholar]
- Goldberger, E. A simple, indifferent, electrocardiographic electrode of zero potential and a technique of obtaining augmented, unipolar, extremity leads. Am Heart J 1942, 23, 483–492. [Google Scholar] [CrossRef]
- Kligfield P, Gettes LS, Bailey JJ, Childers R, Deal BJ, Hancock EW, van Herpen G, Kors JA, Macfarlane P, Mirvis DM, Pahlm O, Rautaharju P, Wagner GS; American Heart Association Electrocardiography and Arrhythmias Committee, Council on Clinical Cardiology; American College of Cardiology Foundation; Heart Rhythm Society; Josephson M, Mason JW, Okin P, Surawicz B, Wellens H. Recommendations for the standardization and interpretation of the electrocardiogram: part I: The electrocardiogram and its technology: a scientific statement from the American Heart Association Electrocardiography and Arrhythmias Committee, Council on Clinical Cardiology; the American College of Cardiology Foundation; and the Heart Rhythm Society: endorsed by the International Society for Computerized Electrocardiology. Circulation. 2007, 115, 1306–24. [Google Scholar] [CrossRef]
- Malmivuo, J.; Plonsey, R. Bioelectromagnetism—Principles and Applications of Bioelectric and Biomagnetic Fields; Oxford University Press: Oxford, UK, 1995. [Google Scholar]
- Gargiulo, GD. True unipolar ECG machine for Wilson Central Terminal measurements. Biomed Res Int. 2015, 2015, 586397. [Google Scholar] [CrossRef] [PubMed]
- Gargiulo GD, Bifulco P, Cesarelli M, McEwan AL, Moeinzadeh H, O’Loughlin A, Shugman IM, Tapson JC, Thiagalingam A. On the “Zero of Potential of the Electric Field Produced by the Heart Beat”. A Machine Capable of Estimating this Underlying Persistent Error in Electrocardiography. Machines. 2016, 4, 18. [Google Scholar] [CrossRef]
- FRANK, E. General theory of heat-vector projection. Circ Res. 1954, 2, 258–70. [Google Scholar] [CrossRef]
- Madias, JE. A proposal for a 9-lead electrocardiogram recorded via the Wilson's central terminal. Ann Noninvasive Electrocardiol. 2013, 18, 103–6. [Google Scholar] [CrossRef] [PubMed]
- Cho, Jae Hyung & Selen, Mats & Kocheril, Abraham. Screening of young competitive athletes for the prevention of sudden cardiac death with a wireless electrocardiographic transmission device: A pilot study. BMC research notes. 2015, 8, 342. [Google Scholar] [CrossRef]
Figure 1.
Theoretical placement of Wilson’s Central Terminal within Einthoven’s Triangle. This position is assumed to be at the centroid of the triangle. The vertices are positioned at intervals of 120º from one another, with consideration given to the lines originating from the origin at the centroid.
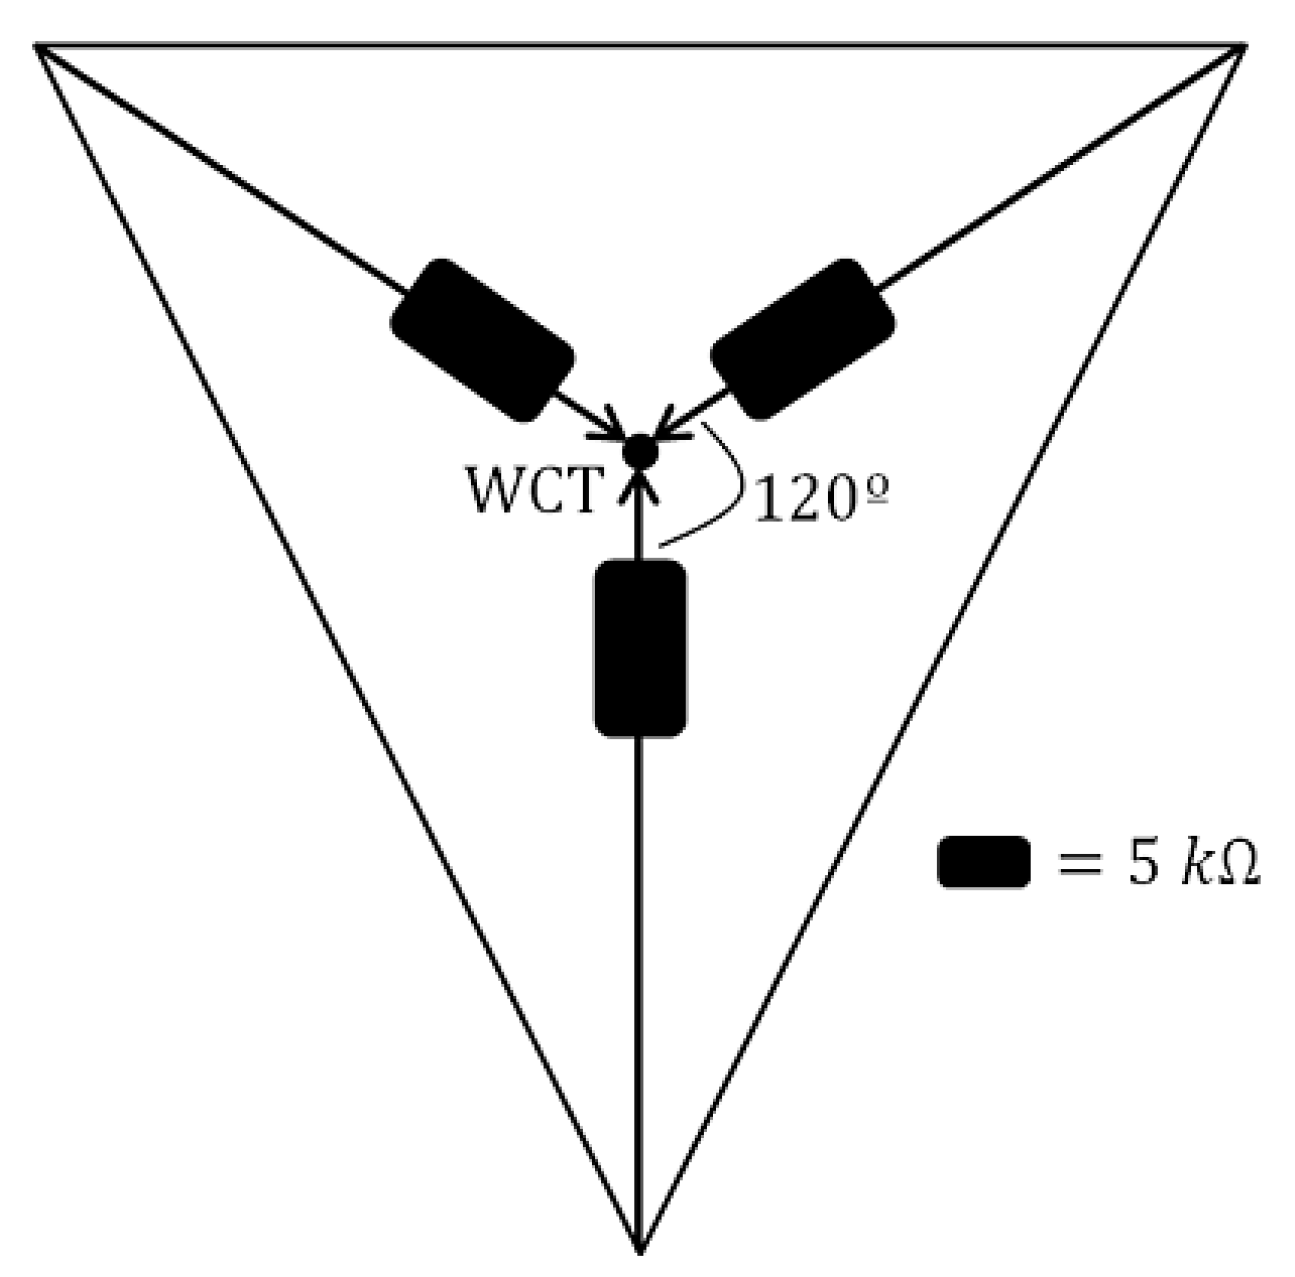
Figure 2.
Cartesian coordinates of the electric dipole vector and the positions of points (leads) designated for measuring electric potential on the surface of a conductor (depicted as yellow tissue).
Figure 2.
Cartesian coordinates of the electric dipole vector and the positions of points (leads) designated for measuring electric potential on the surface of a conductor (depicted as yellow tissue).
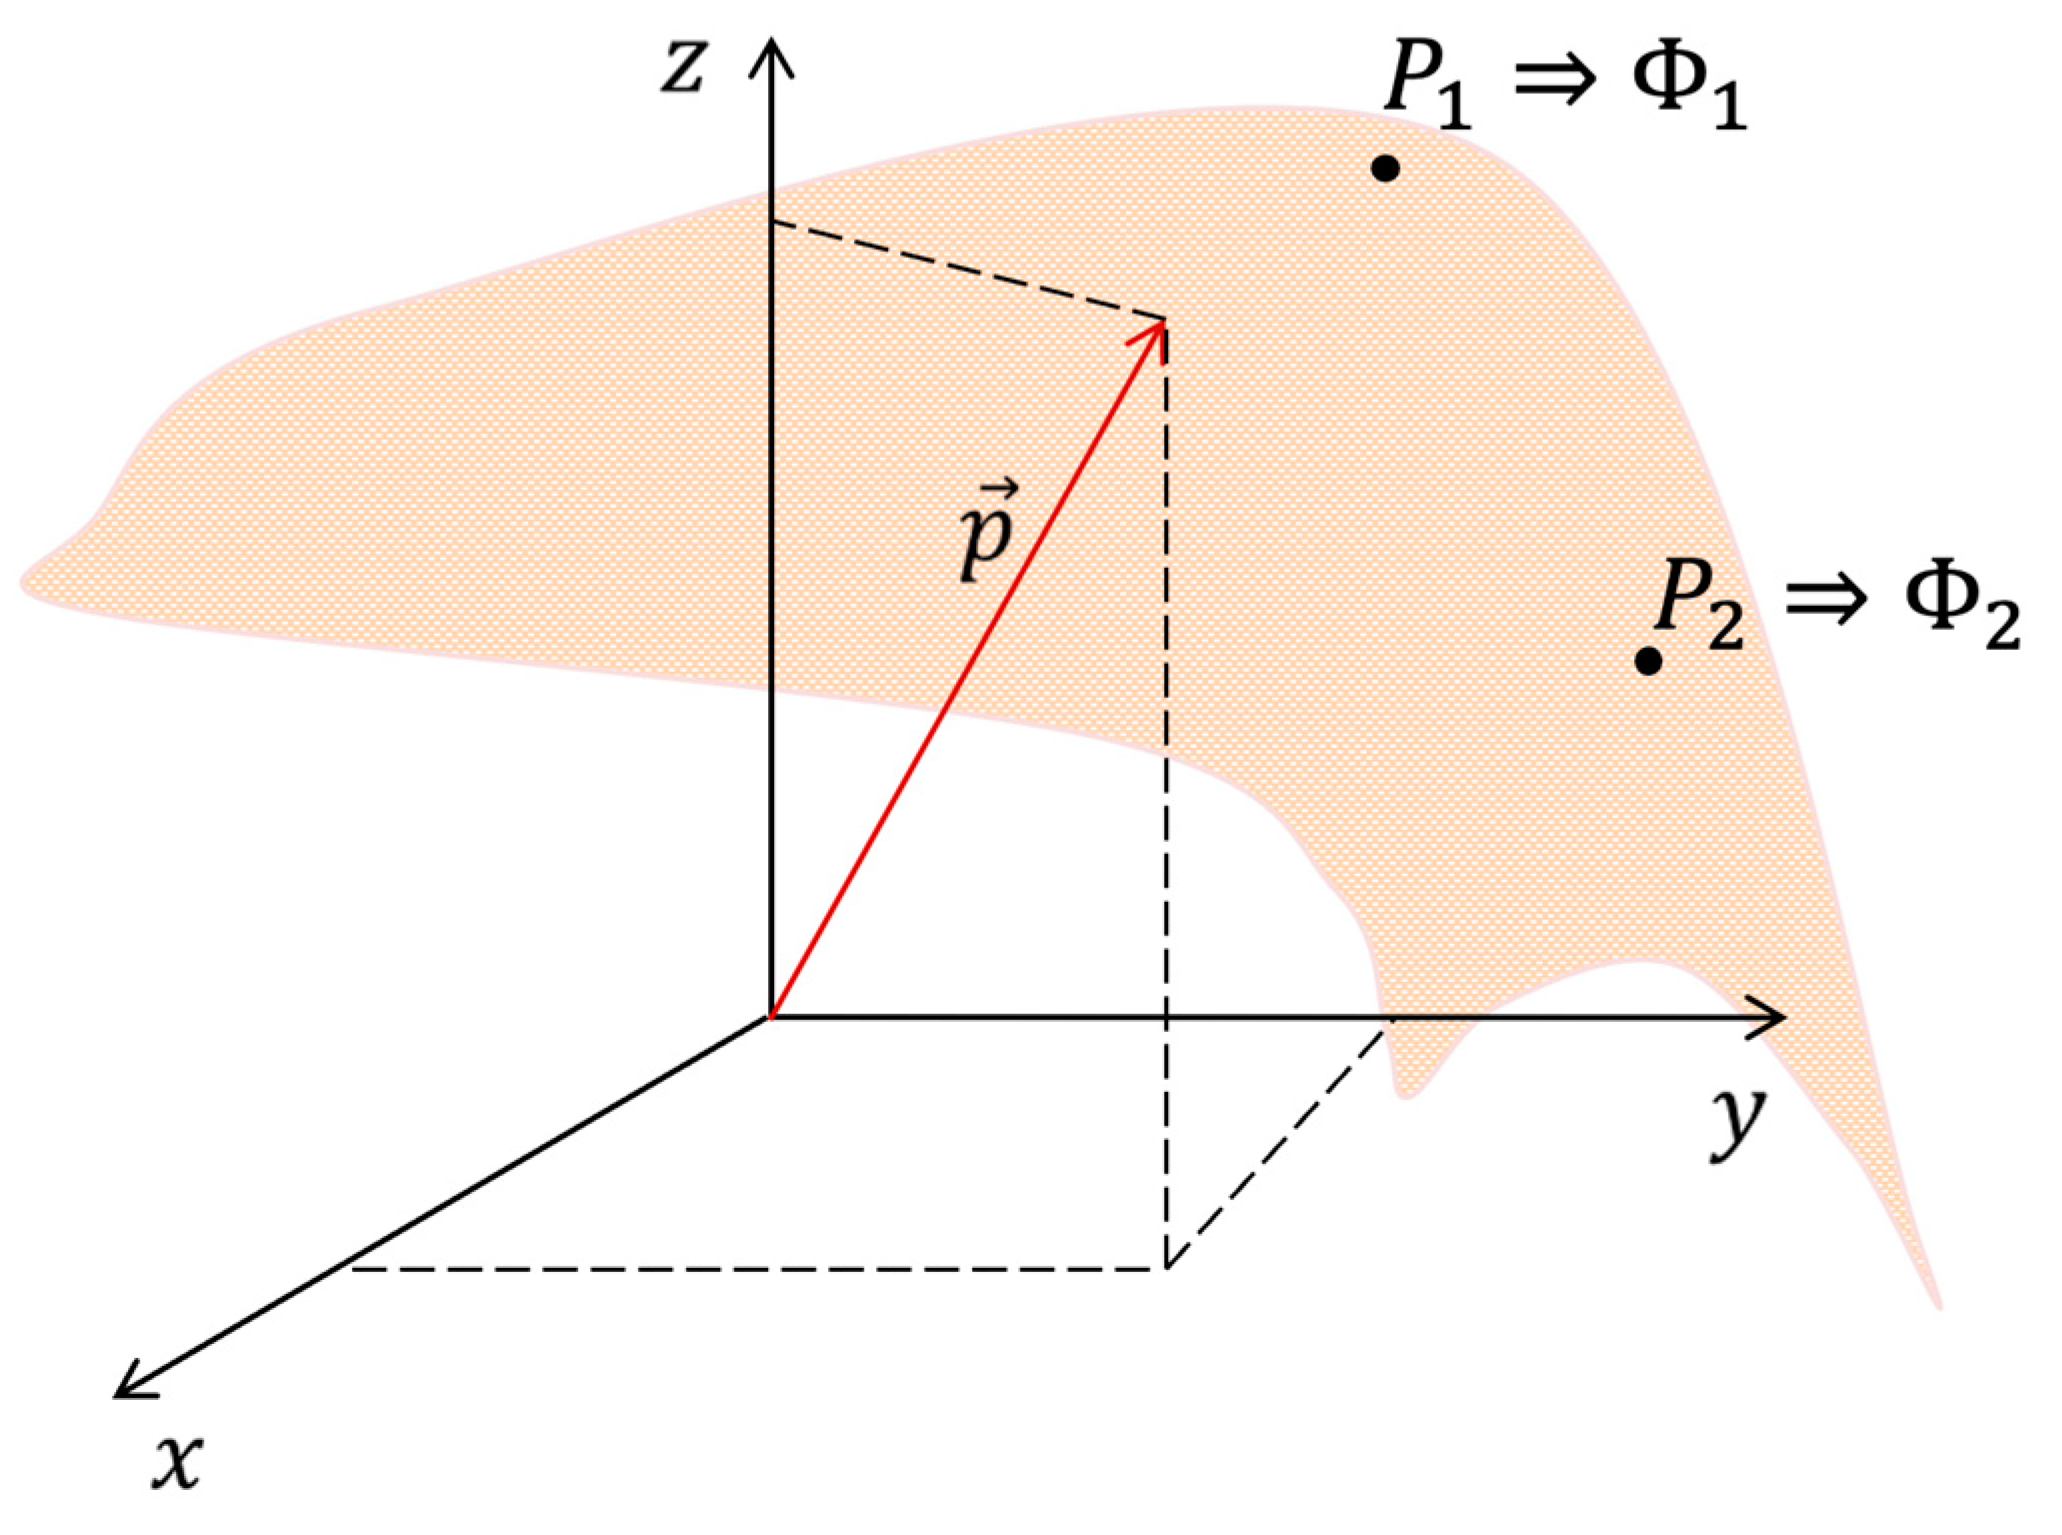
Figure 3.
Spatial arrangement of the vectors
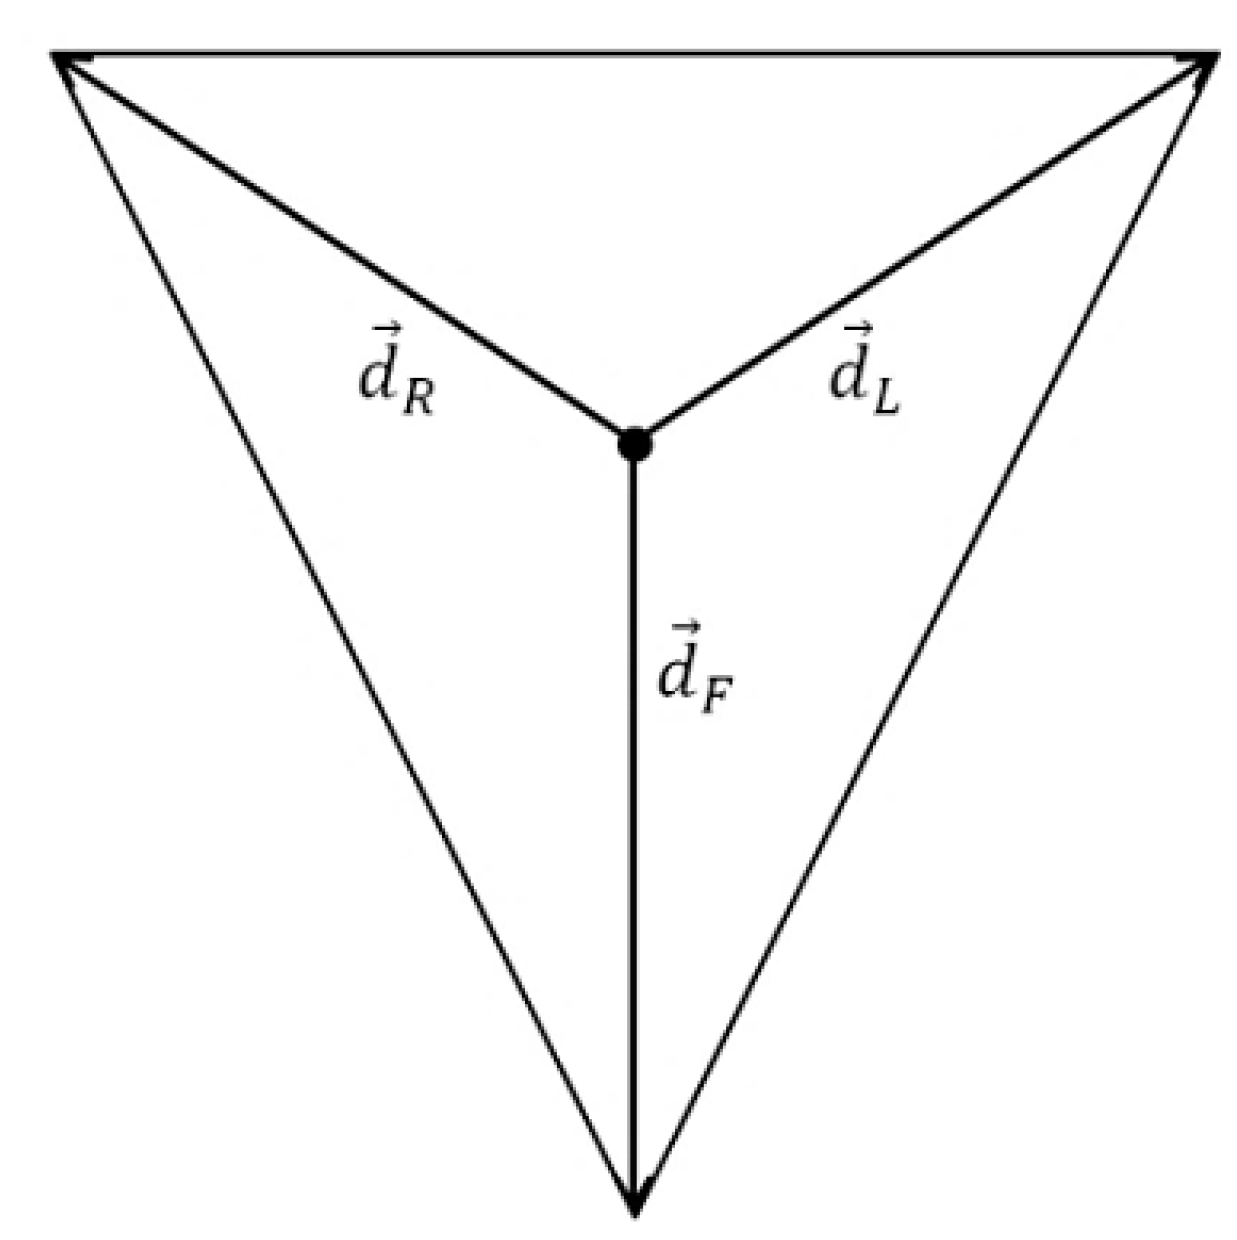
Figure 4.
Spatial arrangement of the vectors
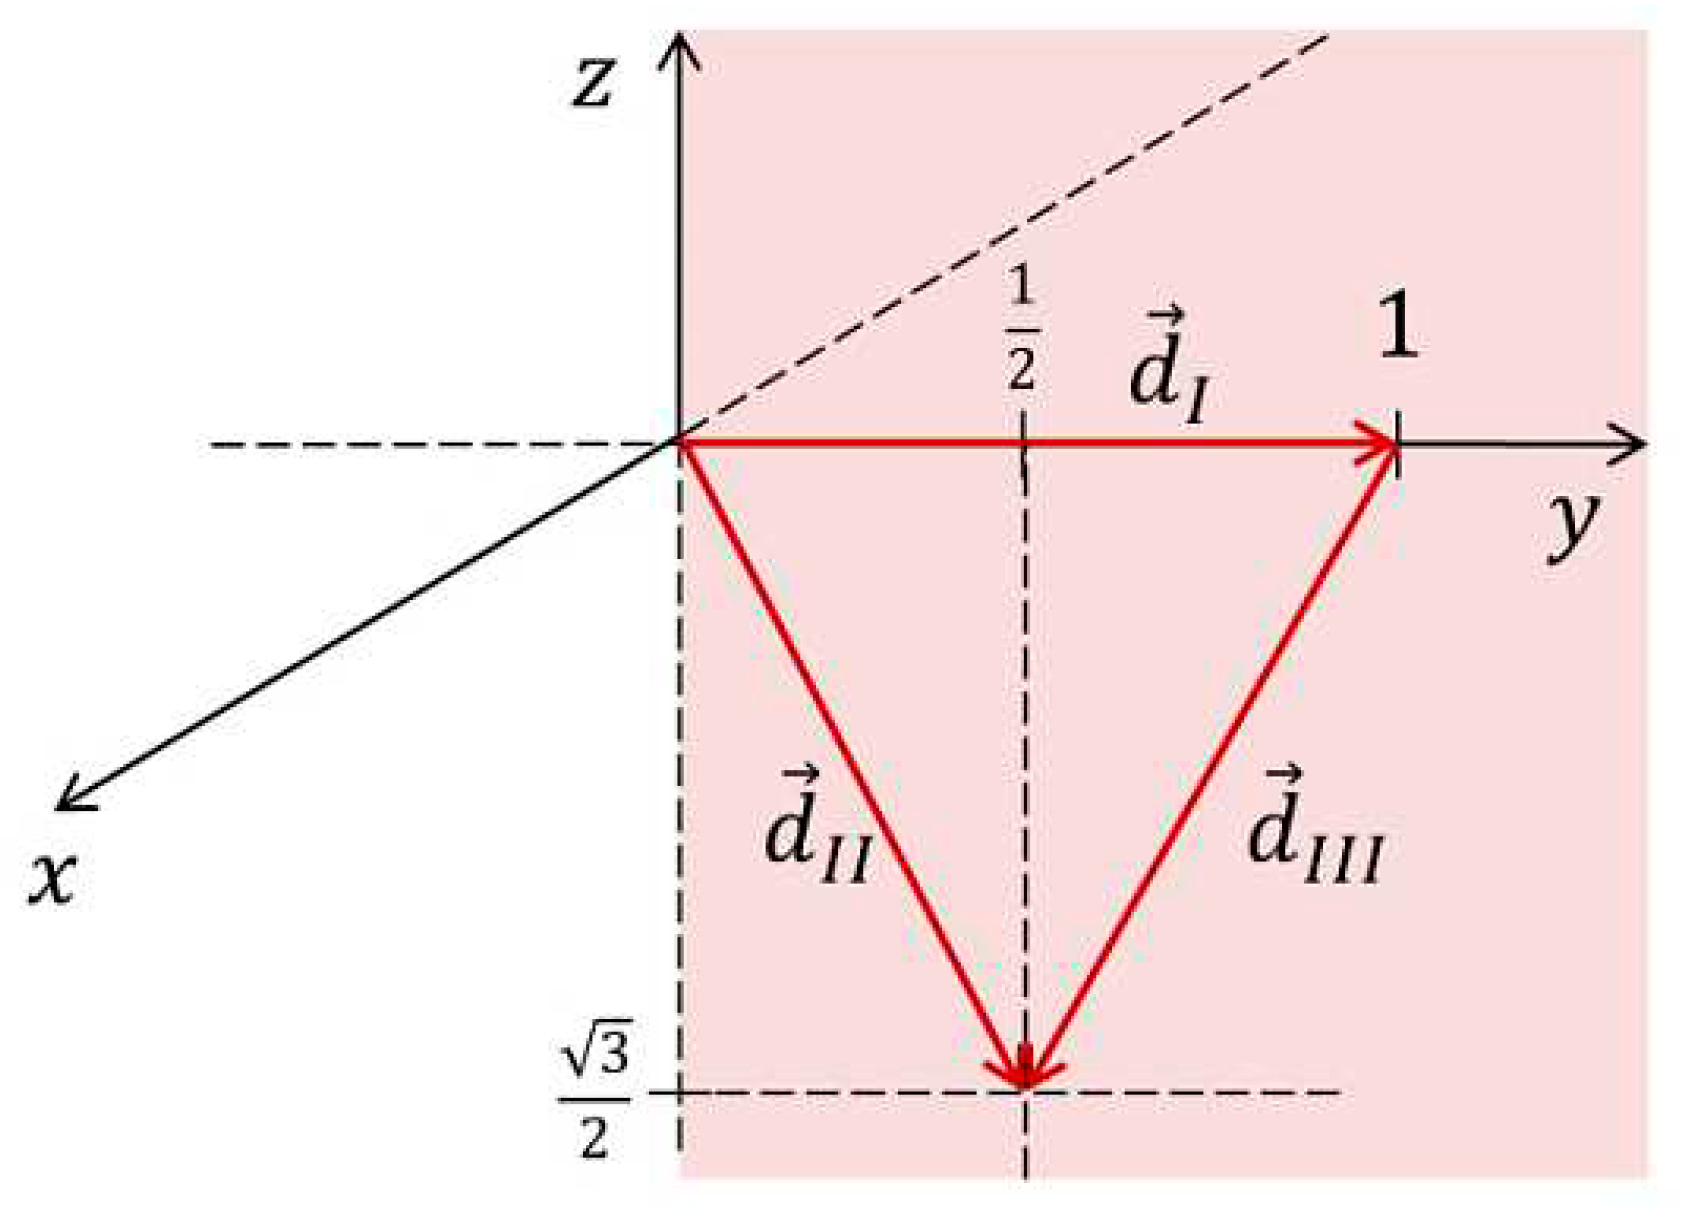
Figure 5.
Cross-sectional view of the thorax depicting the arrangement of precordial electrodes in the revised configuration for calculating a precordial Central Terminal. The leads under consideration are positioned at intervals of 120º from one another and are separated by 120º angles. Two groups of three leads each form two equilateral triangles, analogous to Einthoven’s Triangle. The sternum is indicated by a black rectangle.
Disclaimer/Publisher’s Note: The statements, opinions and data contained in all publications are solely those of the individual author(s) and contributor(s) and not of MDPI and/or the editor(s). MDPI and/or the editor(s) disclaim responsibility for any injury to people or property resulting from any ideas, methods, instructions or products referred to in the content. |
© 2023 by the authors. Licensee MDPI, Basel, Switzerland. This article is an open access article distributed under the terms and conditions of the Creative Commons Attribution (CC BY) license (http://creativecommons.org/licenses/by/4.0/).
Copyright: This open access article is published under a Creative Commons CC BY 4.0 license, which permit the free download, distribution, and reuse, provided that the author and preprint are cited in any reuse.


