
Submitted:
10 August 2023
Posted:
11 August 2023
You are already at the latest version
Abstract
In this systematic review of the literature on using Machine Learning (ML) for credit risk prediction, we raise the need for financial institutions to use AI and ML to assess credit risk, analyzing large volumes of information. We posed research questions about algorithms, metrics, results, data sets, variables, and related limitations in predicting credit risk. We searched renowned databases to answer them and identified 52 relevant studies with the credit industry microfinance. Challenges and approaches in credit risk prediction using ML models we identified, difficulties with the implemented models such as the black box model, the need for explanatory artificial intelligence, the importance of selecting relevant features, addressing multicollinearity, and the problem of the imbalance in the input data. By answering the questions, we identified that the Boosted Category is the most researched family of ML models; the most commonly used metrics for evaluation are Area Under Curve (AUC), Accuracy (ACC), Recall, precision measure F1 (F1), and Precision; Research mainly uses public data sets to compare models, and private ones to generate new knowledge when applied to the real world. The most significant limitation identified is the representativeness of reality, and the variables primarily used in the microcredit industry are related data to the demographic, the operation, and payment behavior. This study aims to guide the developers of credit risk management tools and software towards the existing offer of ML methods, metrics, and techniques used to forecast it, thereby minimizing possible losses due to default and guiding risk appetite.
Keywords:
loan
; credit risk
; prediction
; machine learning
; systematic literature review
1. Introduction
The digitization of processes and artificial intelligence (AI) is already part of our daily life and have been developing in all areas with which we interact, especially in the period of the COVID-19 pandemic [1,2]. This trend continued with the promotion of online loans and internet sales [3], Shih et al. [4] underlines that in 2019 consumer loans in the United States of America (USA) reached the order of 4 trillion US dollars, with an expectation of 4% annual growth; by 2022 it will increase to 7.9% reaching 4.8 trillion [5] and crowdfunding over the Internet will reach 300 billion dollars by 2025 [6]. The World Bank (WB) emphasizes that the banking sector is important because it improves the well-being of a country’s population and is essential for the growth of the economy [7]. In this crisis, to continue fulfilling their role and to maintain their validity, financial institutions need to reinvent themselves by generating new products and services, creating shareholder value, and improving the customer experience [8]. The Superintendency of Banking, Insurance, and AFP (SBS - Peru) maintains in its stability report of May 2022 that, in a scenario with great uncertainty caused by the "... international crisis generated by the COVID-19 pandemic and in amid the armed conflict between Russia and Ukraine, which, beyond the humanitarian crisis it has generated, is having a global economic impact." [9].
In this competitive environment, financial institutions seek to differentiate themselves, generate shareholder value, improve the customer experience, and promote financial inclusion. In this sense, they face the challenge of developing hyper-personalized products and services and distinguishing themselves from their competitors [8]. Microfinance has the challenge of adopting data-based innovation or data driver innovation (DDI), applying BIG DATA for product design, risk management, customer management, seeking efficiency, and increasing sales [10]. Information technology - cloud services, Internet of Things (IoT), BIG DATA, AI, and mobile telephony - is considered the fourth industrial revolution [11]. According to Del [8], 51% of consumers expect that banks already generate suggestions and forecast needs, even anticipating contact with customers.
For DDI and ML in financial institutions, there are still many use cases to be solved [12,13]. Hariri et al. [14], argues that there are gaps in the evaluation and uncertainty in the results when processing large volumes of information, using ML algorithms for real-time applications [10]. On the other hand, Hani et al. [10] argues that using ML techniques, through association, collaborative filtering, recommended and personalized content, systems can provide personalized assistance to users to address their individual preferences . Likewise, BIG DATA tools and technology could help increase competitiveness in changing markets, considering their potential to create value for companies and their environment [12,15].
Using machine learning in business intelligence to reduce the uncertainty of payment behavior, also called credit risk, is a necessity in the microfinance industry since it allows the analysis of large volumes of information generated [16], especially in the post-pandemic context COVID-19 and technological development [17]. The challenges are determining which configurations of attributes and algorithms are best suited and identifying limitations in the application. Consequently, we propose the research topics shown in Table 1.
2. Materials and methods
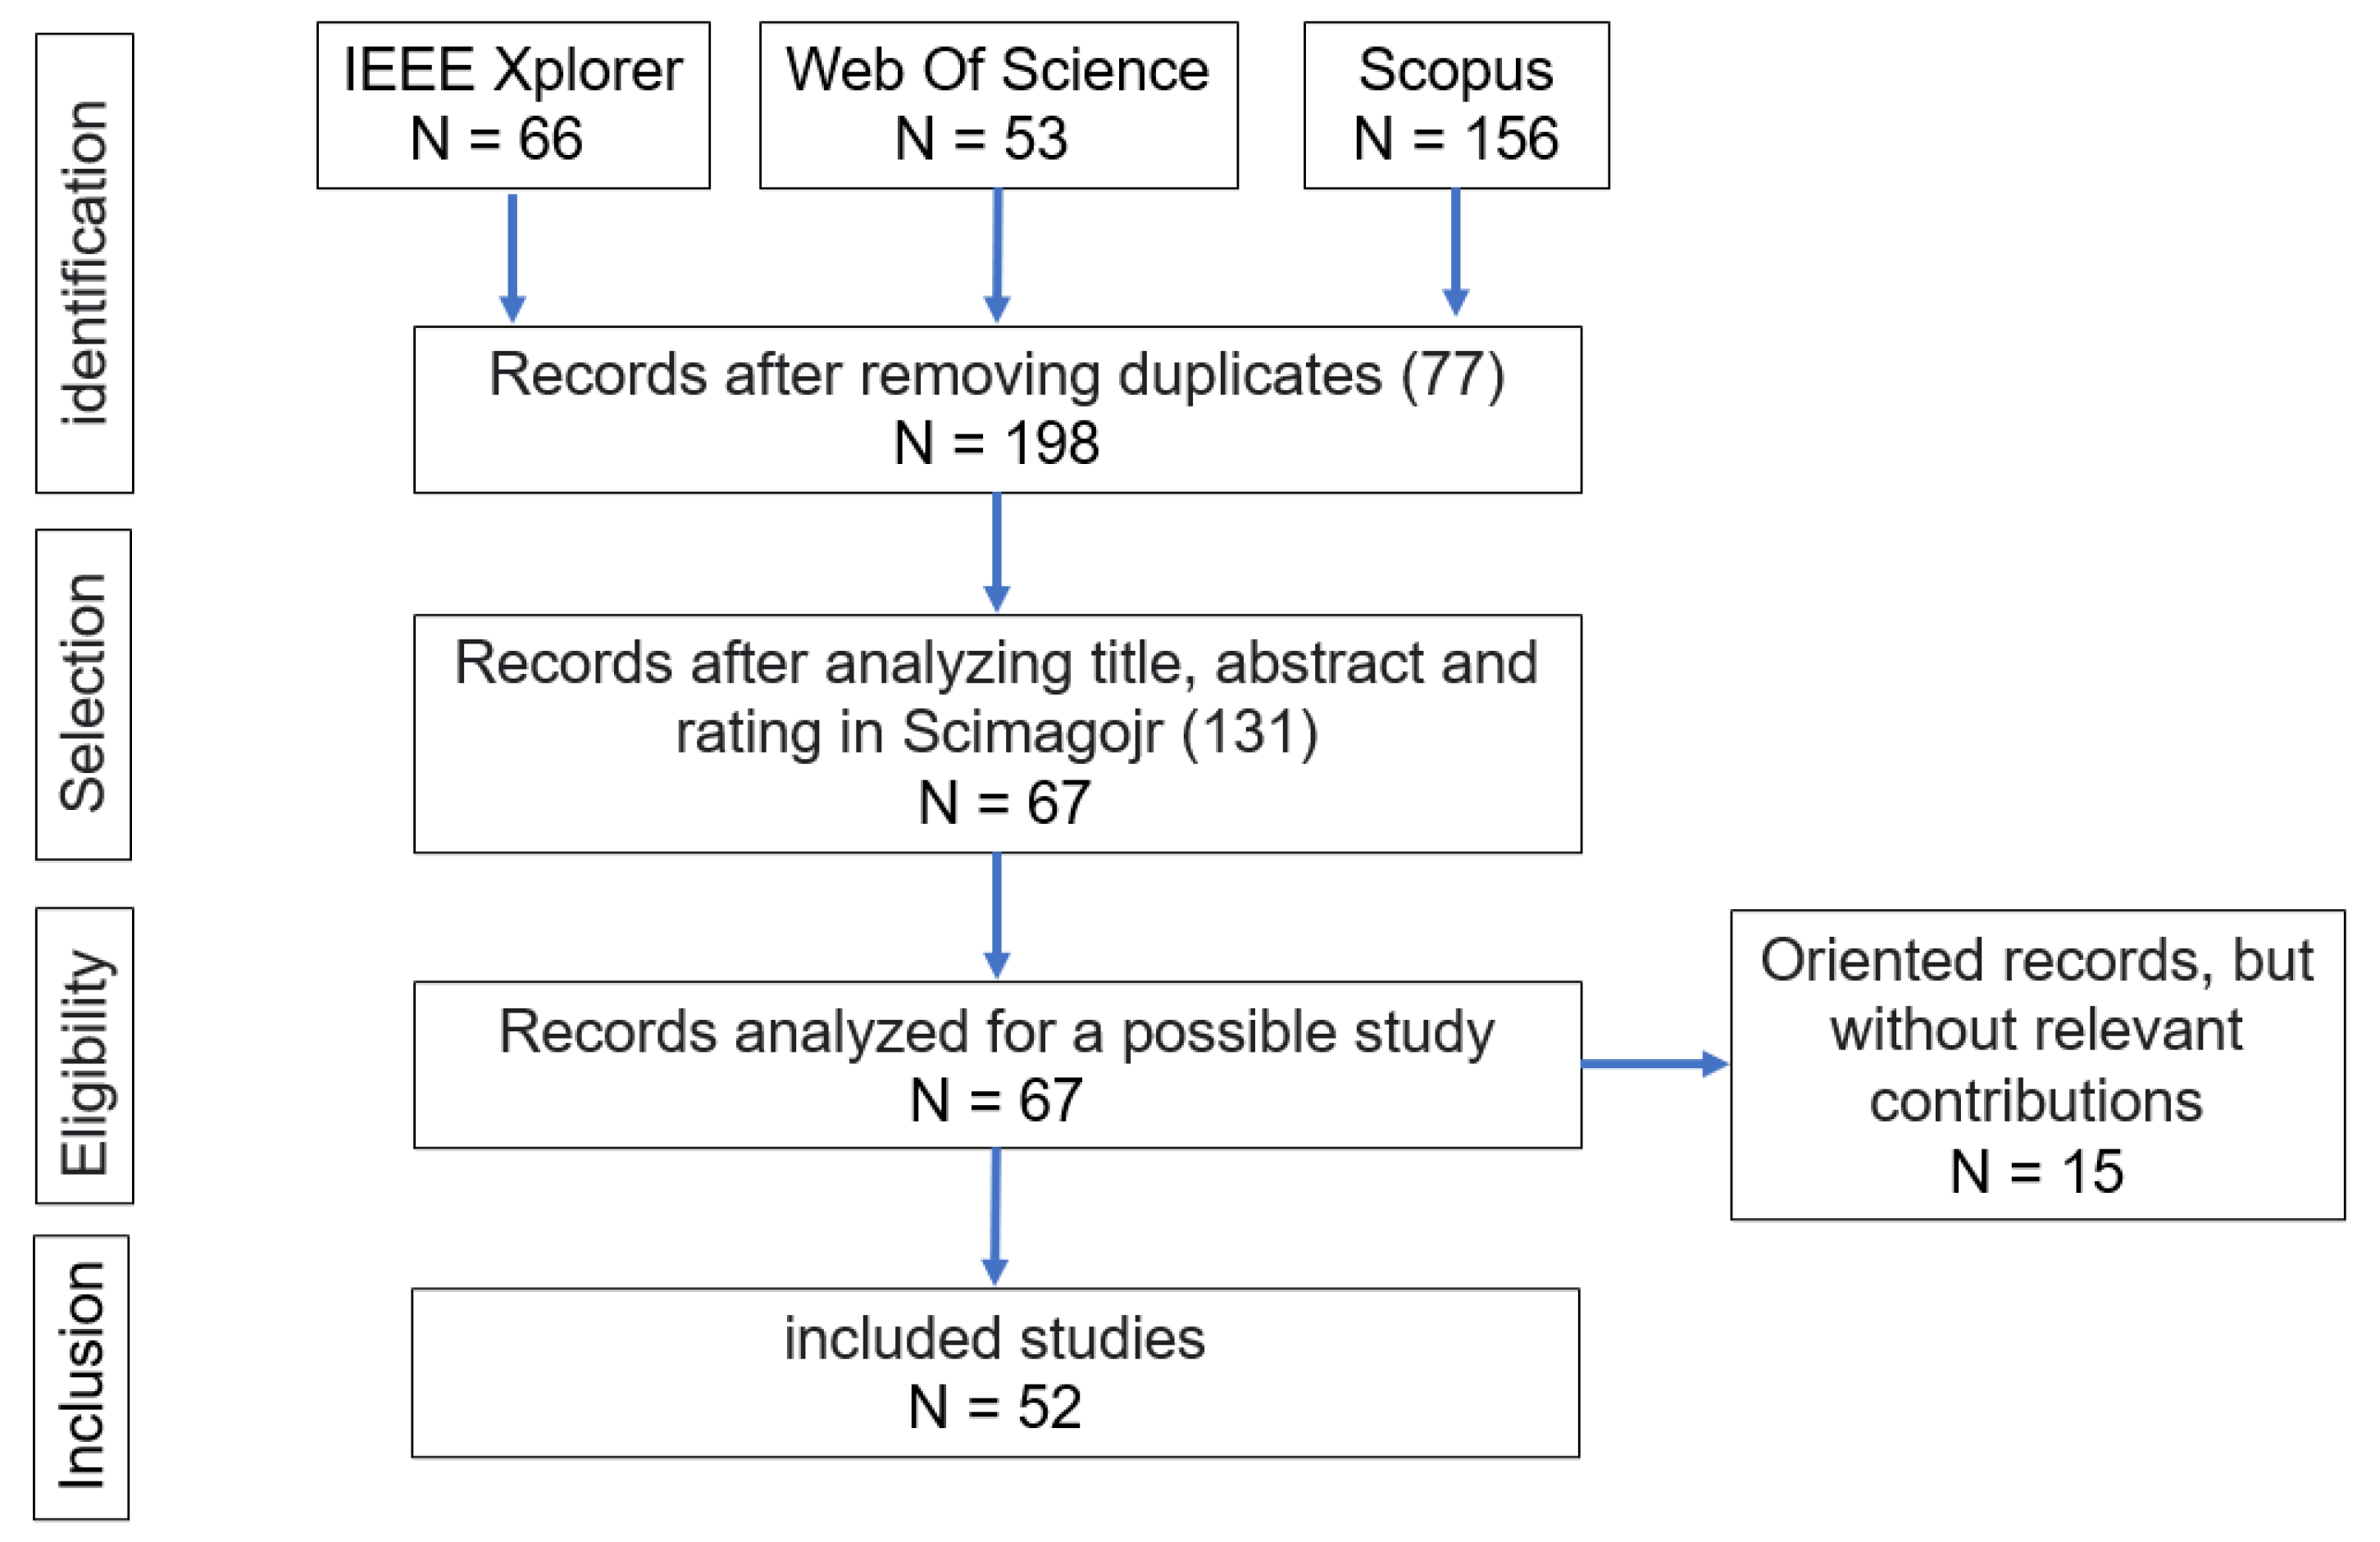
We use the Preferred Reporting Items for Systematic Review and Meta-Analysis (PRISMA) method; consequently, a search string defines our interest topic. The most relevant words identified to build our search string We apply in the recognized databases: IEEE Xplore, Scopus, and Web Of Science (WOS), considering that the studies belong to journal and conference articles published from 2019 to May 2023 and that are related to the area of computer science (view Figure 1). We identified 275 studies, 77 removes due to being duplicates, 131 delete applying the eligibility criteria: full access to the document, ranking in Scimagojr, irrelevant title or abstract, and 15 delete for not having relevance after the complete analysis of the document.
2.1. Aim
Identify models, features, and limitations that could predict credit risk using machine learning in the microfinance industry.
2.1.1. Research Questions
For this study, we propose the following research questions:
(RQ1) What are the algorithms, methods, and models used to predict credit risk?.
(RQ2) Which are the metrics to evaluate the performance of algorithms, methods, or models?.
(RQ3) What are these models’ accuracy, precision, F1 measure, and AUC?.
(RQ4) What datasets are using in the prediction of credit risk?.
(RQ5) What variables or features are using to prediction credit risk?.
(RQ6) What are the main problems or limitations of predicting credit risk?.
2.2. Research Strategy
2.2.1. Research string
TITLE-ABS-KEY ( ( "credit" OR "loan" ) AND ( "machine learning" ) AND ( "model" OR "algorithm" OR "method" ) AND ( "financial" ) AND ( "credit risk" ) ) AND ( LIMIT-TO ( PUBYEAR , 2023 ) OR LIMIT-TO ( PUBYEAR , 2022 ) OR LIMIT-TO ( PUBYEAR , 2021 ) OR LIMIT-TO ( PUBYEAR , 2020 ) OR LIMIT-TO ( PUBYEAR , 2019 ) ) AND ( LIMIT-TO ( DOCTYPE , "cp" ) OR LIMIT-TO ( DOCTYPE , "ar" ) ) AND ( LIMIT-TO ( SUBJAREA , "COMP"))
Figure 1.
PRISMA Research Strategy.
2.3. Selection Criteria
In this systematic review, we have considered the inclusion and exclusion criteria presented in Table 2. We also included the number of studies and their percentage of participation in the total articles identified with our research string.
2.4. Data extraction from study
To determine the importance of studies, we assess that they include: relevant conclusions or results; attributes or features of data sets; description of the proposed model or algorithm; the metrics with which the models evaluate; preprocessing techniques; identified problems or limitations; and future studies. We also consider that when the article includes more than one set of data or experiments, we choose one of them to present the metrics considering the most relevant in terms of ACC, AUC, or another metric in case the indicated ones not use. We also according to our criteria and in the cases in which it applies, we chose the UCI German Dataset dataset, considering that it is unbalanced [18], it is a frequent use, and it will allow us to compare results between investigations that include it.
2.5. Risk of bias
The main limitation when carrying out a systematic review is bias, considering that the decisions of the researchers influence the application of the method framed in the experiences and previous knowledge, for example, the choice of the topic, the choice of electronic resources, the proposal of the research questions, the methodology for data collection, and their evaluation. We have tried to meticulously follow the PRISMA method, taking into account the application of the most appropriate criteria and procedures in the construction of this document.
3. Current Research
The demand for online credits generates considerable information, which, when used through BIG DATA [19], to design new products, machine learning models, and credit risk assessment methods [20]. Consequently, in scenarios of increased demand, credit risks also increase considerably, in a non-linear manner, considering the level of risk, rate, and terms of credit [21]. In the same sense, there is an expectation of an increase in fraud in the following years [22]. Another problem to consider is the consistency of the information that records in the different stages of the process, such as sales data [23], cultural variables, environmental [24], macroeconomics [25], capacities innovation management and development, exchange rate evolution, Gross Domestic Product (GDP) growth trend [25,26], economic activity, experience [27].
The relevant problems are addressed by various research papers, using different ML approaches for the respective interpretations and decision-making [28]. However, there are also difficulties with implemented models [29], which generally follow the black box model; that is, predict, for example, the good and bad payers [30,31,32]. These models have presented problems, especially in difficult times, such as "the financial crisis of 2008" [1,33], since financial institutions focus on loans that generate the most income, being, therefore, the higher risk due to payment defaults [21,24]. It was also observed by Zou et al. [22] that automatic evaluation models, based on credit data, could confuse good paying customers for bad ones, and apply penalties on possible benefits [34]. The low explainability of advanced non-linear ML models is slowing down their implementation [35], the challenge in the development of Explainable artificial intelligence (XAI) whose objective is to provide predictive models with inherent transparency, especially in complex cases [36,37], in that sense Ariza-Garzón et al. [38] proposed the use of Shapley Additive exPlanations (SHAP), to expose the parameter dependency , and Dumitrescu et al. [39] proposes a model interpretable payment risk forecast from penalized logistic tree to enhance the performance of Logistic Regression (LR). Ma and Lv [40], indicated that the MLIA model and variable coefficient logistic regression more intuitively reveal the contribution of a variable to the predicted outcome. The "non-payment" problem is important because it could generate significant losses for financial entities [41,42]. Here the challenge of machine learning is to consider the existing multicollinearity in the input data [43,44], with high correlation of variables and some not useful for classification [2], imbalance in the data actual used, with probable overfit [22], which could generate biases in machine learning [45,46], chaotic reputation management, malicious or criminal deception [47]. In other words, the challenge is to determine the effective, relevant features [48], for example, for the training of neural networks (NN) –which is end-to-end by interactions–, additional constraints with desirable features known a priori in order to reduce the number of interactions, and prioritize smoothness, factors of explanatory interest, in the domain, control and generative modeling of features [49]. Other authors recommend the use of genetic algorithms to guide training, with data sequences that have the best result Tripathi et al. [50], the use of hive intelligence is also highlighted for this purpose [51,52,53]; noise removal using fuzzy logic (FL) and contribution to the identification of main attributes [30,54,55]. Rishehchi Fayyaz et al. [56] and Wang and Yang [19], discuss the interaction of borrowers within their supply chain. The use of images, interviews, text and social information, and interaction with mobile technology would give the credit risk assessment a multidimensional and multi-focus characteristic [17,57,58]; the inclusion of integrated accounting information with statistical variables of profitability, liquidity, asset quality, management indices, capital adequacy, efficiency, SCORECARD scorecard and the maximization of the internal rate of return (IRR), risks of the industry, GDP [1,25].
While Haro et al. [59] maintains that the most relevant characteristics are: gender, educational level, mortgage loan, microfinance, and debt balance, days past due . For de Castro Vieira et al. [60], the most relevant variable is days in arrears, especially those greater than 90 days, to determine non-payment behavior, and considers that discriminatory variables such as gender, age, and marital status should not be considered , [59], consequently the challenge of validating the quality of the features [61,62] arises. For this part, Wang and Yang [19], maintains that the number of influential variables for risk assessment has increased, and the linear and non-linear time series relationships have increased their complexity.
Alam et al. [63] proposes the following methods to address the imbalance problem: Random Undersampling (RUS), Near Miss (NMISS), Cluster Centroid (CC), Random Oversampling (ROS); Adaptive Synthetic (ADASYN), Synthetic Minority Oversampling Technique (SMOTE), Borderline-Smot (B-SMOT), and Smotetomek (SMOTE-T), other authors propose the use of CS-classifiers [64], and KFold [31,60]. However, other authors propose considering imbalance and missing data as characteristics to take into account in the [65,66] evaluation. As an initial part of the model evaluations in the experiments, the importance of optimizing the hyperparameters highlight using, for example, GA [17], K-Fold CV [39], random search (RS) [22], grid search (GS) [55,63], and other methods [65].
4. Results
4.1. Answer to RQ1: What are the algorithms, methods, and models used to predict credit risk?
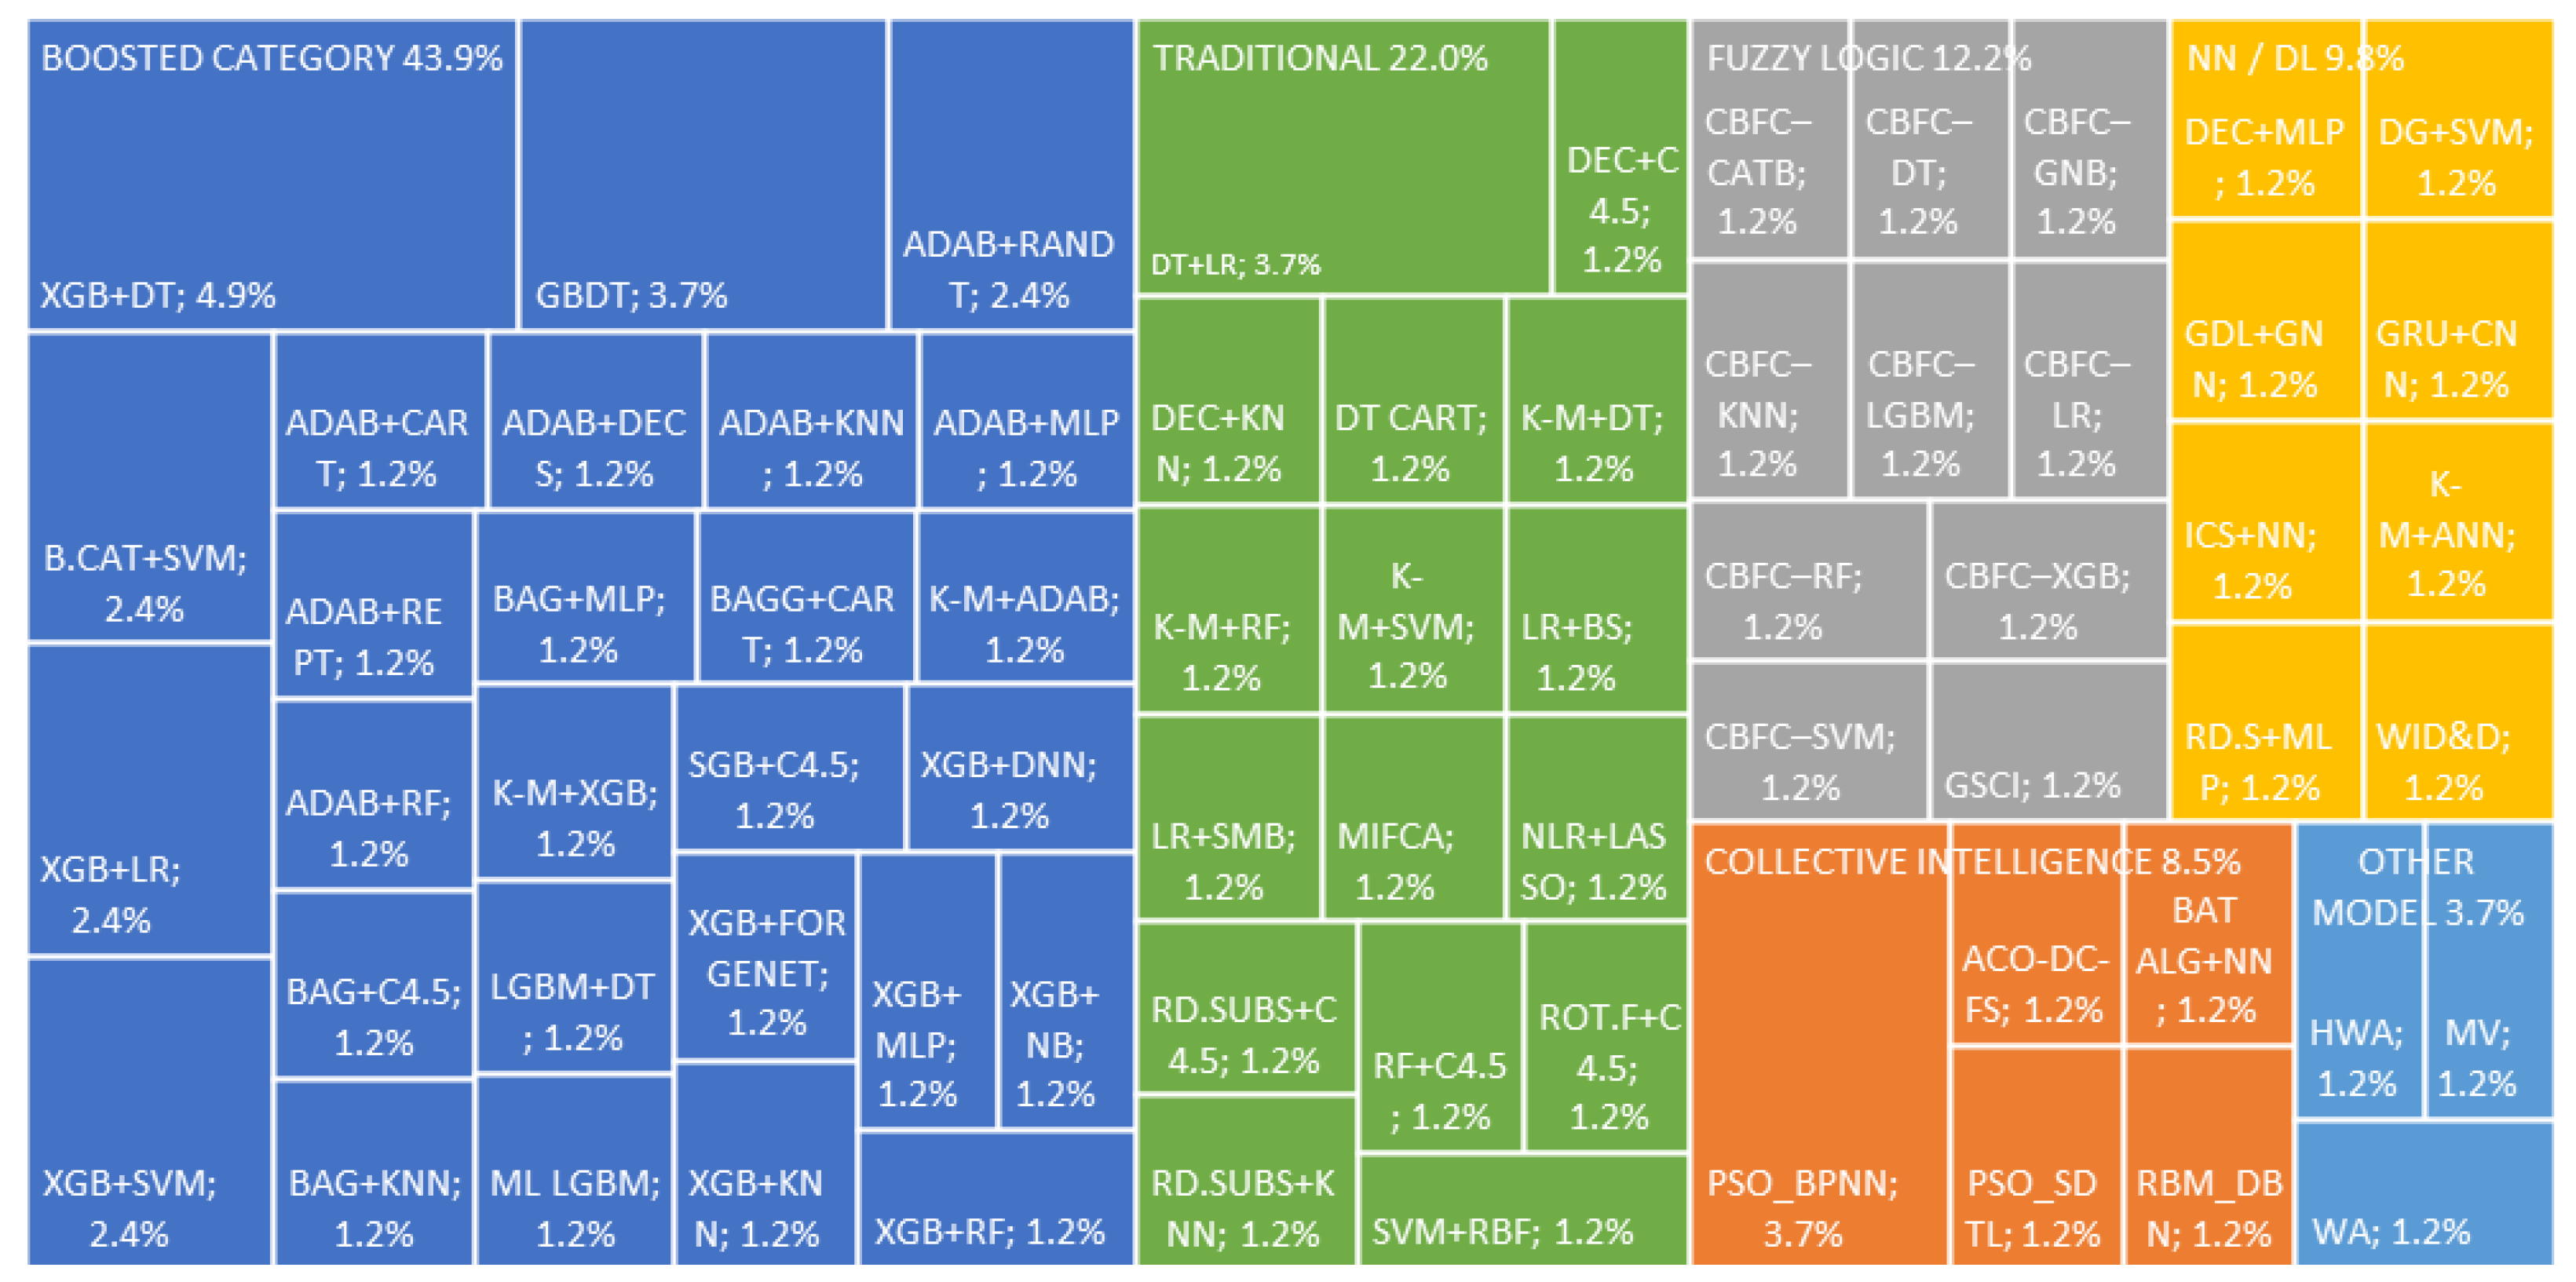
In their research to forecast credit risk, the authors use ML models: 72.76% non-assembled (N-Ass) and 27.24% assembled (Ass), which are shown in Table 3. For a better presentation, in the Figure 2 and Figure 3, we group them into the following families: Boosted Category, the models related to the Boosted algorithm; Collective Intelligence, models related to collective or swarm intelligence, Fuzzy Logic, to models related to Fuzzy Logic; NN / DL, to models related to neural networks or Deep Learning (DL); Traditional, to the models cataloged but not related to previous models; and Other Models, to the models not cataloged. Of the total models used, 50.83% correspond to the Traditional model family, 27.24% to the Boosted Category, and 11.96% to NN / DL.
Analyzing the groups separately corresponding to Ass and N-Ass, and as shown in Figure 2 and Figure 3, the Category Boosted family was used at 21% and 43.9% for N-Ass and Ass, respectively; NN/DL has use of 12.8% and 9.8%; Traditional has a use rate of 61.6% and 22%; Other Models have a use at 4.6% and 3.7%; Fuzzy Logic has used at 12.2% only on Ass; and Collective Intelligence, in the order of 8.5% only in Ass.
Figure 2.
Non Assembled Models.
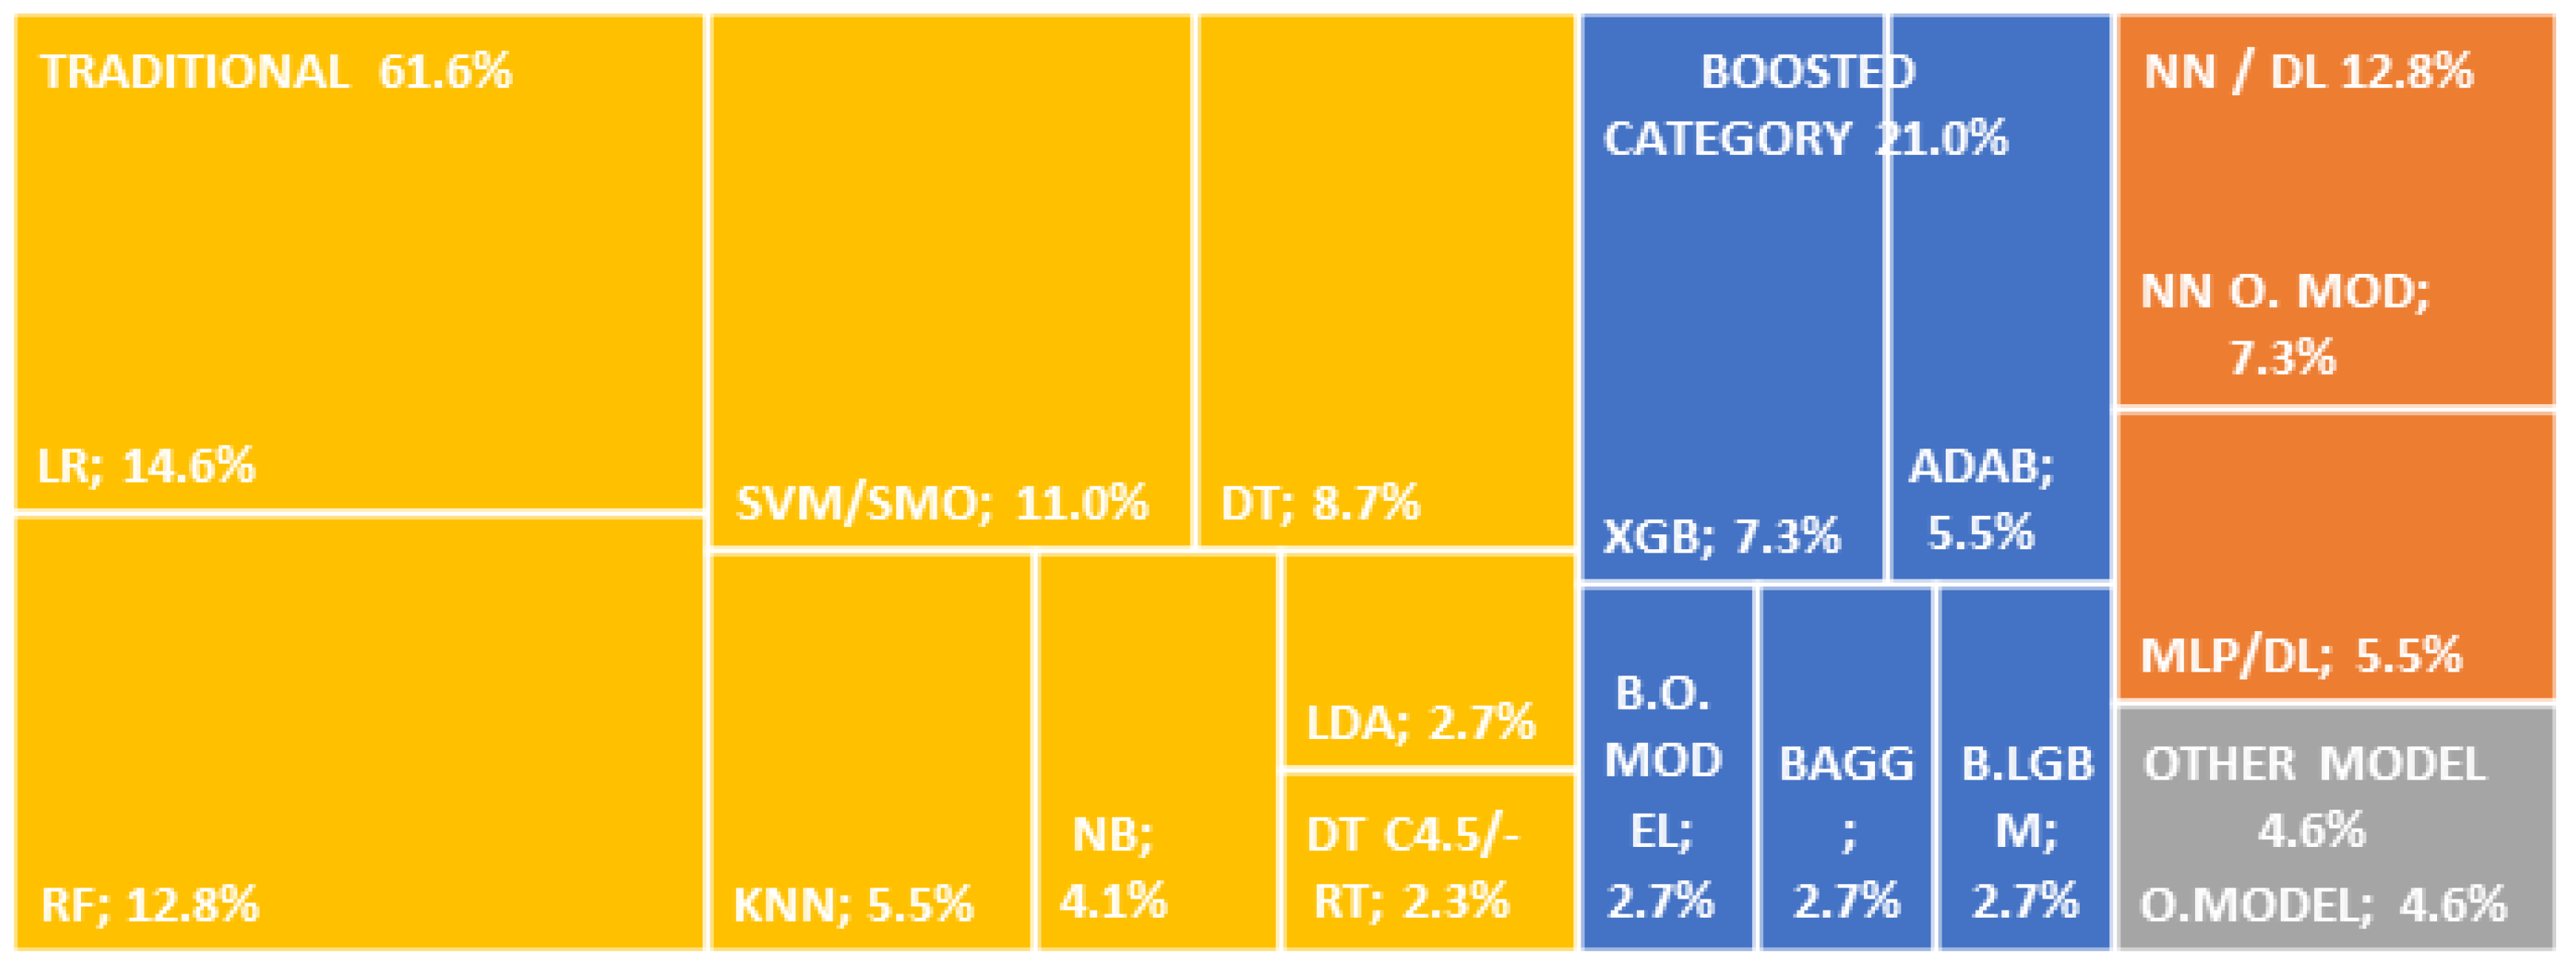
Figure 3.
Assembled Models.
4.2. Answer to RQ2: Which are the metrics to evaluate the performance of algorithms, methods, or models?
We collected the metrics used by the researchers in their articles, taking into account that for the cases in which they evaluate more than one data set and more than one model is applied, a pair is searching, taking into account the best ACC and AUC values, or another in the cases where these not use, as shown in the Figure 4. From this simplification, the authors propose 48% assembled models and 52% non-assembled models. Among the assembled models: Boosted Category has 21%; Collective Intelligence has 8%; NN/DL has 8%; Traditional has 8%; and Fuzzy Logic has 4%. On non-assembled models: Boost Category has 25%; Traditional has 21%; and NN/DL has 6%. In these models, the metrics used by the authors are: AUC with 16%, ACC with 14%, F1 measure with 11%, others with 11%, Precision with 10%, Recall with 9%, True Positive Rate (TPR) with 7%, True Negative Rate (TNR) with 6%, Geometric Mean (GMEAN) with 4%, Kolmogorov-Smirnov (KS) with 3%, Brier Score (BS) with 3%, GINNI Score (GINNI) with 2%, Root Mean Squared Error (RMSE), KAPPA coefficient (KAPPA), and Mean Absolute Error (MAE) whose group participation is 2%, the detail is shown in the Table 4.
4.3. Answer to RQ3: What are these models’ accuracy, precision, F1 measure, and AUC?
We list the values of the five metrics most used by the authors in their research: AUC, ACC, F1 measure, Precision, and Recall, as shown in Table 4. We have taken the values in each case according to the tuple defined in the previous question. The following figures show the metrics the authors obtained in their research Table 5.
Considering that there are experiments in which the same dataset to use, we can compare their prediction capabilities as in the case of the UCI German Dataset in which the XGB + DT model proposed by Alam et al. [63], has an ACC of 84, against the LR models proposed by Bao et al. [30], and Random forest (RF) + C4.5 proposed by García et al. [18]. Other less-used datasets on which we can compare the metrics are Tsinghua - Pekin U RESSET database and the Kaggle Prosper dataset, as shown in Table 5. It is essential to indicate that the Lending Club dataset is possible; however, it is necessary to consider different date ranges for the investigations [37,38].
4.4. Answer to RQ4: What datasets are using in the prediction of credit risk?
The dataset used by the authors can be divided into 53.85% public and 46.15% private, seeking mainly in the first case to validate new models, to be able to compare them with experiments, we show the data in the Figure 5—private datasets to used to extract knowledge by revalidating existing models in real scenarios. In the public group, the most used is the UCI German dataset with a use of 15.38%, possibly due to its characteristics [18]; the second most used is the Lending Club platform, which is a P2P loan platform with 15.38%. Some authors in their experiments validate both public and private data, Ass and N-Ass models, and determine their behavior in different scenarios.
4.5. Answer to RQ5: What variables or features are using to prediction credit risk?
The authors propose many variables using different methods to identify the variables with the best predictive capacity, genetic algorithms, fuzzy logic, hive intelligence, statistical methods, and functions to determine the correlation are applied. To simplify the analysis, we have grouped the proposed variables into Demographic, which has a 54.09% share; Operation with 29.18%; Payment behavior with 7.62%; External factors with 6.69%; Unstructured data with 1.30%, and Transaction with 1.12%, as shown in the Table 6, in the Table 7 we show details.
4.6. Answer to RQ6: What are the main problems or limitations of predicting credit risk?
In the reviewed articles, the authors state limitations or problems that they have faced during the experiments, although in each case there are nuances, we have grouped them into: Representativeness of reality with 32%, refers to the fact that many of the existing variables do not reflects the true nature of the information; Unbalanced data with 28%, refers to the fact that, according to some authors, the use of highly unbalanced data significantly reduces the performance of the models; Inconsistency in information recording with 17%, reference is made to the fact that the existing records have been entered with errors, bias, noise that generates the need to apply cleaning techniques, with the risk of losing certain information; Lack of ability to explain the proposed results with 13%, refers to the explainability limitation that the most robust ML models have; Availability of information and centralized processing with 6%, refers to the need to process information centrally, which can generate additional losses, noise and delays; and Adaptability in processing structured and unstructured information with 4%, refers to the need to process structured and unstructured data within the operation process, we show the results in the Table 8.
5. Additional findings
During the development of this RSL, we identified preprocessing techniques that the authors refer to during their experiments
5.1. Dataset balancing techniques
The most used algorithms to mitigate the problem of imbalance in the data sets are SMOTE at 28.24%, followed by KFold with 20%, RUS at 11.76%, and ROS in a similar way at 11.76%. We show the detail in Table 9. Also use: ADASYN, some variants of SMOTE like B-SMOTE, SMOTE-T, adapted classification algorithms like KN-SMOTE, Under-Bagging, techniques to identify missing values NMISS, CC, CS-Classifiers, and RESAMPLE.
5.2. Techniques for determination of hyperparameters
The techniques most used by the authors for estimating the hyperparameters are KFold at 58.33% and Grid Search at 22.22%. We show the detail in Table 10.
6. Discussion
The most widely used ML models to assess credit risk correspond to the traditional family, possibly due to their easy implementation, and many developments have already for them. On the other hand, those with the best prediction results correspond to the Boosted Category, both in the Ass and in the N-Ass groups. This trend evidences in the Table 11, where this family obtains 24 evaluations out of 52 and is constantly growing in recent years. Another trend identified is that better results are obtained with the N-Ass models [68], for example, Alam et al. [63] and Pandey et al. [27], which obtained AUC 91.00 with the AdaBoost + RF model and 91.20 with XGBoost + Decision Tree (DT), respectively, as shown in Table 5 and Figure 4, these results could be explained by gradient-based optimization features, parallelism, high volume throughput, and missing values. The most used metrics correspond to AUC, ACC, F1 measure, Recall, and Precision; the authors propose more specialized metrics according to the situation to are evaluating, AUC and ACC with 16.11% and 14.22%, mainly due to the ability to measure the capacity of different types of ML models, in the first case it does not vary before the transformation by normalization, it allows analyzing unbalanced data or with a high cost of classification; and in the second case, it works better with balanced data, and of easy explanation.
Likewise, of the experiments carried out, the most significant number of databases used are 53.85% public data sets, while 46.15% correspond to private ones; the first serves to evaluate the predictive capacity of the new models proposed by the authors, comparing the results with previous experiences and the second to generate new knowledge through its application in the real world. In the experiments, the authors identify as the main problem in the data sets for the design of ML models the misrepresentation of reality due to possible bias, inconsistency, or error when recording the information, the second problem corresponds to the imbalance of the data, which can impair the excellent performance of the models, to face this problem the SMOTE algorithm is mainly is using, and for the optimization of the hyperparameters, the Kfold CV and Grid Search Method techniques are using. However, some authors propose intelligence of hive [53] and genetic algorithms [28,52] to guide optimization. Finally, the most used variables that best represent the intention and ability to pay, which in turn originate credit risk, correspond to the demographic, transaction, and payment behavior features; these encompass the main characteristics expected to predict it, see Table 7. Although the corresponding external features and unstructured data must consider, considering the former, the influence in the hyperconnected world, the growing development of DDI, and the processing capacity of BIG DATA.
7. Conclusion
In this article, we systematically review the literature following the PRISMA method on credit risk prediction using ML. We identified 52 articles that met the inclusion and exclusion rules, relevance to the study, and full access to the document. By answering the research questions, we identified the following:
- Boosted Category is the family of ML models that are being researched the most in Ass and N-Ass, due to the best results it is showing, although the trend is its use in Ass.
- The five most used metrics are AUC, ACC, Recall, F1 measure, and Precision, although, in practice, the problem must consider choosing the most appropriate metrics.
- Public data sets are more used; of this group, the most used are UCI German Dataset and Landing Club Dataset. Its main use is to validate the behavior against other models under the same conditions. Private Datasets generate knowledge from the application to a specific situation.
- For the evaluation through ML of credits, demographic and operational variables are mainly used since they are oriented to identify patterns to predict behaviors. However, external variables and those related to unstructured data should consider the hyper-connectivity and development of DDI and BIG DATA processing.
- The main problems are the representativeness of reality, the imbalance of data for the training, and the inconsistency in recording information; both cases arise due to biases, errors, or problems in recording the information.
- The most widely used method to solve the imbalance problem is SMOTE to optimize the performance of ML models, while the methods to determine the hyperparameters are KFold-CV and Grid Search to guide their optimization.
8. Future Research
The credit risk prediction contribution corresponds to the stage that originates the loan; In this sense, we propose extending the application of ML to accurate credit data sets from specialized companies, including these models in other processes, such as credit collection and customer retention, considering the regulatory impositions that governments are implementing as an initiative to mitigate possible losses in the industry. This research can continue to focus on BIG DATA analysis, especially on unstructured data such as images, text, writing, sentiment, and hive intelligence, to assess adaptability to changing scenarios. Finally, and in the same sense, including variables that represent the state of the environment could contribute to reducing uncertainty in this sector.
Funding
This research received no external funding.
Conflicts of Interest
The authors declare no conflict of interest.
References
- Lombardo, G.; Pellegrino, M.; Adosoglou, G.; Cagnoni, S.; Pardalos, P.M.; Poggi, A. Machine Learning for Bankruptcy Prediction in the American Stock Market: Dataset and Benchmarks. Future Internet 2022, 14, 244. [Google Scholar] [CrossRef]
- Ziemba, P.; Becker, J.; Becker, A.; Radomska-Zalas, A.; Pawluk, M.; Wierzba, D. Credit decision support based on real set of cash loans using integrated machine learning algorithms. Electronics 2021, 10, 2099. [Google Scholar] [CrossRef]
- Liu, C.; Ming, Y.; Xiao, Y.; Zheng, W.; Hsu, C.H. Finding the next interesting loan for investors on a peer-to-peer lending platform. IEEE Access 2021, 9, 111293–111304. [Google Scholar] [CrossRef]
- Shih, D.H.; Wu, T.W.; Shih, P.Y.; Lu, N.A.; Shih, M.H. A Framework of Global Credit-Scoring Modeling Using Outlier Detection and Machine Learning in a P2P Lending Platform. Mathematics 2022, 10, 2282. [Google Scholar] [CrossRef]
- FED20230403 Consumer Credit - G.19. https://www.federalreserve.gov/releases/g19/current/. Accedido: 2023-02-28.
- Zhang, Z.; Jia, X.; Chen, S.; Li, M.; Wang, F. Dynamic Prediction of Internet Financial Market Based on Deep Learning. Computational Intelligence and Neuroscience 2022, 2022. [Google Scholar] [CrossRef] [PubMed]
- BM Panorama general. https://www.bancomundial.org/es/topic/financialsector/overview. Accedido: 2021-12-22.
- Deloitte The future of retail banking: The hyper-personalisation imperative. https://www2.deloitte.com/content/dam/Deloitte/uk/Documents/financial-services/deloitte-uk-hp-the-future-of-retail-banking-1.pdf. Accedido: 2023-01-20.
- SBS Informe de Estabilidad del Sistema Financiero – mayo 2022. https://www.sbs.gob.pe/Portals/0/jer/pub-InformeEstabilidad/InfEstFin-2022-1-v2.pdf. Accedido: 2023-01-20.
- Hani, U.; Wickramasinghe, A.; Kattiyapornpong, U.; Sajib, S. The future of data-driven relationship innovation in the microfinance industry. Annals of Operations Research 2022, 1–27. [Google Scholar] [CrossRef]
- Zhang, C.; Zhong, H.; Hu, A. A Method for Financial System Analysis of Listed Companies Based on Random Forest and Time Series. Mobile Information Systems 2022, 2022. [Google Scholar] [CrossRef]
- Yıldırım, M.; Okay, F.Y.; Øzdemir, S. Big data analytics for default prediction using graph theory. Expert Systems with Applications 2021, 176, 114840. [Google Scholar] [CrossRef]
- Bi, W.; Liang, Y. Risk Assessment of Operator’s Big Data Internet of Things Credit Financial Management Based on Machine Learning. Mobile Information Systems 2022, 2022. [Google Scholar] [CrossRef]
- Hariri, R.H.; Fredericks, E.M.; Bowers, K.M. Uncertainty in big data analytics: survey, opportunities, and challenges. Journal of Big Data 2019, 6, 1–16. [Google Scholar] [CrossRef]
- Chen, Z.; Chen, W.; Shi, Y. Ensemble learning with label proportions for bankruptcy prediction. Expert Systems with Applications 2020, 146, 113155. [Google Scholar] [CrossRef]
- SBS Resolución S.B.S. N° 00053-2023. https://intranet2.sbs.gob.pe/dv_int_cn/2240/v1.0/Adjuntos/0053-2023.R.pdf. Accedido: 2023-04-20.
- Fan, S.; Shen, Y.; Peng, S. Improved ML-based technique for credit card scoring in internet financial risk control. Complexity 2020, 2020, 1–14. [Google Scholar] [CrossRef]
- García, V.; Marques, A.I.; Sánchez, J.S. Exploring the synergetic effects of sample types on the performance of ensembles for credit risk and corporate bankruptcy prediction. Information Fusion 2019, 47, 88–101. [Google Scholar] [CrossRef]
- Wang, M.; Yang, H. Research on personal credit risk assessment model based on instance-based transfer learning. In Proceedings of the Intelligence Science III: 4th IFIP TC 12 International Conference, ICIS 2020, Durgapur, India, February 24–27, 2021, Revised Selected Papers 4. Springer, 2021, pp. 159–169. [CrossRef]
- Teles, G.; Rodrigues, J.J.; Rabêlo, R.A.; Kozlov, S.A. Comparative study of support vector machines and random forests machine learning algorithms on credit operation. Software: Practice and Experience 2021, 51, 2492–2500. [Google Scholar] [CrossRef]
- Orlova, E.V. Decision-making techniques for credit resource management using machine learning and optimization. Information 2020, 11, 144. [Google Scholar] [CrossRef]
- Zou, Y.; Gao, C.; Gao, H. Business failure prediction based on a cost-sensitive extreme gradient boosting machine. IEEE Access 2022, 10, 42623–42639. [Google Scholar] [CrossRef]
- Fritz-Morgenthal, S.; Hein, B.; Papenbrock, J. Financial risk management and explainable, trustworthy, responsible AI. Frontiers in Artificial Intelligence 2022, 5, 5. [Google Scholar] [CrossRef] [PubMed]
- Sun, M.; Li, Y.; et al. Credit Risk Simulation of Enterprise Financial Management Based on Machine Learning Algorithm. Mobile Information Systems 2022, 2022. [Google Scholar] [CrossRef]
- Mousavi, M.M.; Lin, J. The application of PROMETHEE multi-criteria decision aid in financial decision making: Case of distress prediction models evaluation. Expert Systems with Applications 2020, 159, 113438. [Google Scholar] [CrossRef]
- Zhao, L.; Yang, S.; Wang, S.; Shen, J. Research on PPP Enterprise Credit Dynamic Prediction Model. Applied Sciences 2022, 12, 10362. [Google Scholar] [CrossRef]
- Pandey, M.K.; Mittal, M.; Subbiah, K. Optimal balancing & efficient feature ranking approach to minimize credit risk. International Journal of Information Management Data Insights 2021, 1, 100037. [Google Scholar] [CrossRef]
- Pławiak, P.; Abdar, M.; Acharya, U.R. Application of new deep genetic cascade ensemble of SVM classifiers to predict the Australian credit scoring. Applied Soft Computing 2019, 84, 105740. [Google Scholar] [CrossRef]
- Cho, S.H.; Shin, K.s. Feature-Weighted Counterfactual-Based Explanation for Bankruptcy Prediction. Expert Systems with Applications 2023, 216, 119390. [Google Scholar] [CrossRef]
- Bao, W.; Lianju, N.; Yue, K. Integration of unsupervised and supervised machine learning algorithms for credit risk assessment. Expert Systems with Applications 2019, 128, 301–315. [Google Scholar] [CrossRef]
- Mitra, R.; Goswami, A.; Tiwari, M.K. Financial supply chain analysis with borrower identification in smart lending platform. Expert Systems with Applications 2022, 208, 118026. [Google Scholar] [CrossRef]
- Jemai, J.; Zarrad, A. Feature Selection Engineering for Credit Risk Assessment in Retail Banking. Information 2023, 14, 200. [Google Scholar] [CrossRef]
- Chen, S.F.; Chakraborty, G.; Li, L.H. Feature selection on credit risk prediction for peer-to-peer lending. In Proceedings of the New Frontiers in Artificial Intelligence: JSAI-isAI 2018 Workshops, JURISIN, AI-Biz, SKL, LENLS, IDAA, Yokohama, Japan, November 12–14, 2018, Revised Selected Papers. Springer, 2019, pp. 5–18. [CrossRef]
- Si, Z.; Niu, H.; Wang, W. Credit Risk Assessment by a Comparison Application of Two Boosting Algorithms. In Fuzzy Systems and Data Mining VIII; IOS Press, 2022; pp. 34–40. [Google Scholar] [CrossRef]
- Merćep, A.; Mrčela, L.; Birov, M.; Kostanjčar, Z. Deep neural networks for behavioral credit rating. Entropy 2020, 23, 27. [Google Scholar] [CrossRef]
- Bussmann, N.; Giudici, P.; Marinelli, D.; Papenbrock, J. Explainable machine learning in credit risk management. Computational Economics 2021, 57, 203–216. [Google Scholar] [CrossRef]
- Moscato, V.; Picariello, A.; Sperlí, G. A benchmark of machine learning approaches for credit score prediction. Expert Systems with Applications 2021, 165, 113986. [Google Scholar] [CrossRef]
- Ariza-Garzón, M.J.; Arroyo, J.; Caparrini, A.; Segovia-Vargas, M.J. Explainability of a machine learning granting scoring model in peer-to-peer lending. Ieee Access 2020, 8, 64873–64890. [Google Scholar] [CrossRef]
- Dumitrescu, E.; Hué, S.; Hurlin, C.; Tokpavi, S. Machine learning for credit scoring: Improving logistic regression with non-linear decision-tree effects. European Journal of Operational Research 2022, 297, 1178–1192. [Google Scholar] [CrossRef]
- Ma, X.; Lv, S. Financial credit risk prediction in internet finance driven by machine learning. Neural Computing and Applications 2019, 31, 8359–8367. [Google Scholar] [CrossRef]
- Karn, A.L.; Sachin, V.; Sengan, S.; Gandhi, I.; Ravi, L.; Sharma, D.K.; Subramaniyaswamy, V. DESIGNING A DEEP LEARNING-BASED FINANCIAL DECISION SUPPORT SYSTEM FOR FINTECH TO SUPPORT CORPORATE CUSTOMER’S CREDIT EXTENSION. Malaysian Journal of Computer Science 2022, 116–131. [Google Scholar] [CrossRef]
- Zheng, B. Financial default payment predictions using a hybrid of simulated annealing heuristics and extreme gradient boosting machines. International Journal of Internet Technology and Secured Transactions 2019, 9, 404–425. [Google Scholar] [CrossRef]
- Mancisidor, R.A.; Kampffmeyer, M.; Aas, K.; Jenssen, R. Learning latent representations of bank customers with the variational autoencoder. Expert Systems with Applications 2021, 164, 114020. [Google Scholar] [CrossRef]
- Wang, T.; Liu, R.; Qi, G. Multi-classification assessment of bank personal credit risk based on multi-source information fusion. Expert Systems with Applications 2022, 191, 116236. [Google Scholar] [CrossRef]
- Liu, W.; Fan, H.; Xia, M.; Pang, C. Predicting and interpreting financial distress using a weighted boosted tree-based tree. Engineering Applications of Artificial Intelligence 2022, 116, 105466. [Google Scholar] [CrossRef]
- Andrade Mancisidor, R.; Kampffmeyer, M.; Aas, K.; Jenssen, R. Deep generative models for reject inference in credit scoring. Knowledge-Based Systems 2020. [Google Scholar] [CrossRef]
- Wu, Z. Using machine learning approach to evaluate the excessive financialization risks of trading enterprises. Computational Economics 2021, 1–19. [Google Scholar] [CrossRef]
- Liu, J.; Zhang, S.; Fan, H. A two-stage hybrid credit risk prediction model based on XGBoost and graph-based deep neural network. Expert Systems with Applications 2022, 195, 116624. [Google Scholar] [CrossRef]
- Shu, R. Deep Representations with Learned Constraints; Stanford University, 2022. [Google Scholar]
- Tripathi, D.; Edla, D.R.; Kuppili, V.; Bablani, A. Evolutionary extreme learning machine with novel activation function for credit scoring. Engineering Applications of Artificial Intelligence 2020, 96, 103980. [Google Scholar] [CrossRef]
- Uj, A.; Nmb, E.; Ks, C.; Skl, D. Financial crisis prediction model using ant colony optimization-ScienceDirect. International Journal of Information Management 2020, 50, 538–556. [Google Scholar] [CrossRef]
- Feng, Y. Bank Green Credit Risk Assessment and Management by Mobile Computing and Machine Learning Neural Network under the Efficient Wireless Communication. Wireless Communications and Mobile Computing 2022, 2022. [Google Scholar] [CrossRef]
- Tian, J.; Li, L. Digital universal financial credit risk analysis using particle swarm optimization algorithm with structure decision tree learning-based evaluation model. Wireless Communications and Mobile Computing 2022, 2022. [Google Scholar] [CrossRef]
- Chen, X.; Li, S.; Xu, X.; Meng, F.; Cao, W. A novel GSCI-based ensemble approach for credit scoring. IEEE Access 2020, 8, 222449–222465. [Google Scholar] [CrossRef]
- Koç, O.; Başer, F.; Kestel, S.A. Credit Risk Evaluation Using Clustering Based Fuzzy Classification Method. Expert Systems With Applications 2023. [Google Scholar] [CrossRef]
- Rishehchi Fayyaz, M.; Rasouli, M.R.; Amiri, B. A data-driven and network-aware approach for credit risk prediction in supply chain finance. Industrial Management & Data Systems 2021, 121, 785–808. [Google Scholar] [CrossRef]
- Muñoz-Cancino, R.; Bravo, C.; Ríos, S.A.; Graña, M. On the combination of graph data for assessing thin-file borrowers’ creditworthiness. Expert Systems with Applications 2023, 213, 118809. [Google Scholar] [CrossRef]
- Li, Y.; Stasinakis, C.; Yeo, W.M. A hybrid XGBoost-MLP model for credit risk assessment on digital supply chain finance. Forecasting 2022, 4, 184–207. [Google Scholar] [CrossRef]
- Haro, B.; Ortiz, C.; Armas, J. Predictive Model for the Evaluation of Credit Risk in Banking Entities Based on Machine Learning. In Proceedings of the Brazilian Technology Symposium. Springer, 2018, pp. 605–612. [CrossRef]
- de Castro Vieira, J.R.; Barboza, F.; Sobreiro, V.A.; Kimura, H. Machine learning models for credit analysis improvements: Predicting low-income families’ default. Applied Soft Computing 2019, 83, 105640. [Google Scholar] [CrossRef]
- Li, D.; Li, L. Research on Efficiency in Credit Risk Prediction Using Logistic-SBM Model. Wireless Communications and Mobile Computing 2022, 2022. [Google Scholar] [CrossRef]
- Qian, H.; Wang, B.; Yuan, M.; Gao, S.; Song, Y. Financial distress prediction using a corrected feature selection measure and gradient boosted decision tree. Expert Systems with Applications 2022, 190, 116202. [Google Scholar] [CrossRef]
- Alam, T.M.; Shaukat, K.; Hameed, I.A.; Luo, S.; Sarwar, M.U.; Shabbir, S.; Li, J.; Khushi, M. An investigation of credit card default prediction in the imbalanced datasets. IEEE Access 2020, 8, 201173–201198. [Google Scholar] [CrossRef]
- Song, Y.; Peng, Y. A MCDM-based evaluation approach for imbalanced classification methods in financial risk prediction. IEEE Access 2019, 7, 84897–84906. [Google Scholar] [CrossRef]
- Li, Z.; Zhang, J.; Yao, X.; Kou, G. How to identify early defaults in online lending: a cost-sensitive multi-layer learning framework. Knowledge-Based Systems 2021, 221, 106963. [Google Scholar] [CrossRef]
- Chrościcki, D.; Chlebus, M. The Advantage of Case-Tailored Information Metrics for the Development of Predictive Models, Calculated Profit in Credit Scoring. Entropy 2022, 24, 1218. [Google Scholar] [CrossRef] [PubMed]
- Biswas, N.; Mondal, A.S.; Kusumastuti, A.; Saha, S.; Mondal, K.C. Automated credit assessment framework using ETL process and machine learning. Innovations in Systems and Software Engineering 2022, 1–14. [Google Scholar] [CrossRef]
- Machado, M.R.; Karray, S. Assessing credit risk of commercial customers using hybrid machine learning algorithms. Expert Systems with Applications 2022, 200, 116889. [Google Scholar] [CrossRef]
Figure 4.
Bets Models with family and author.
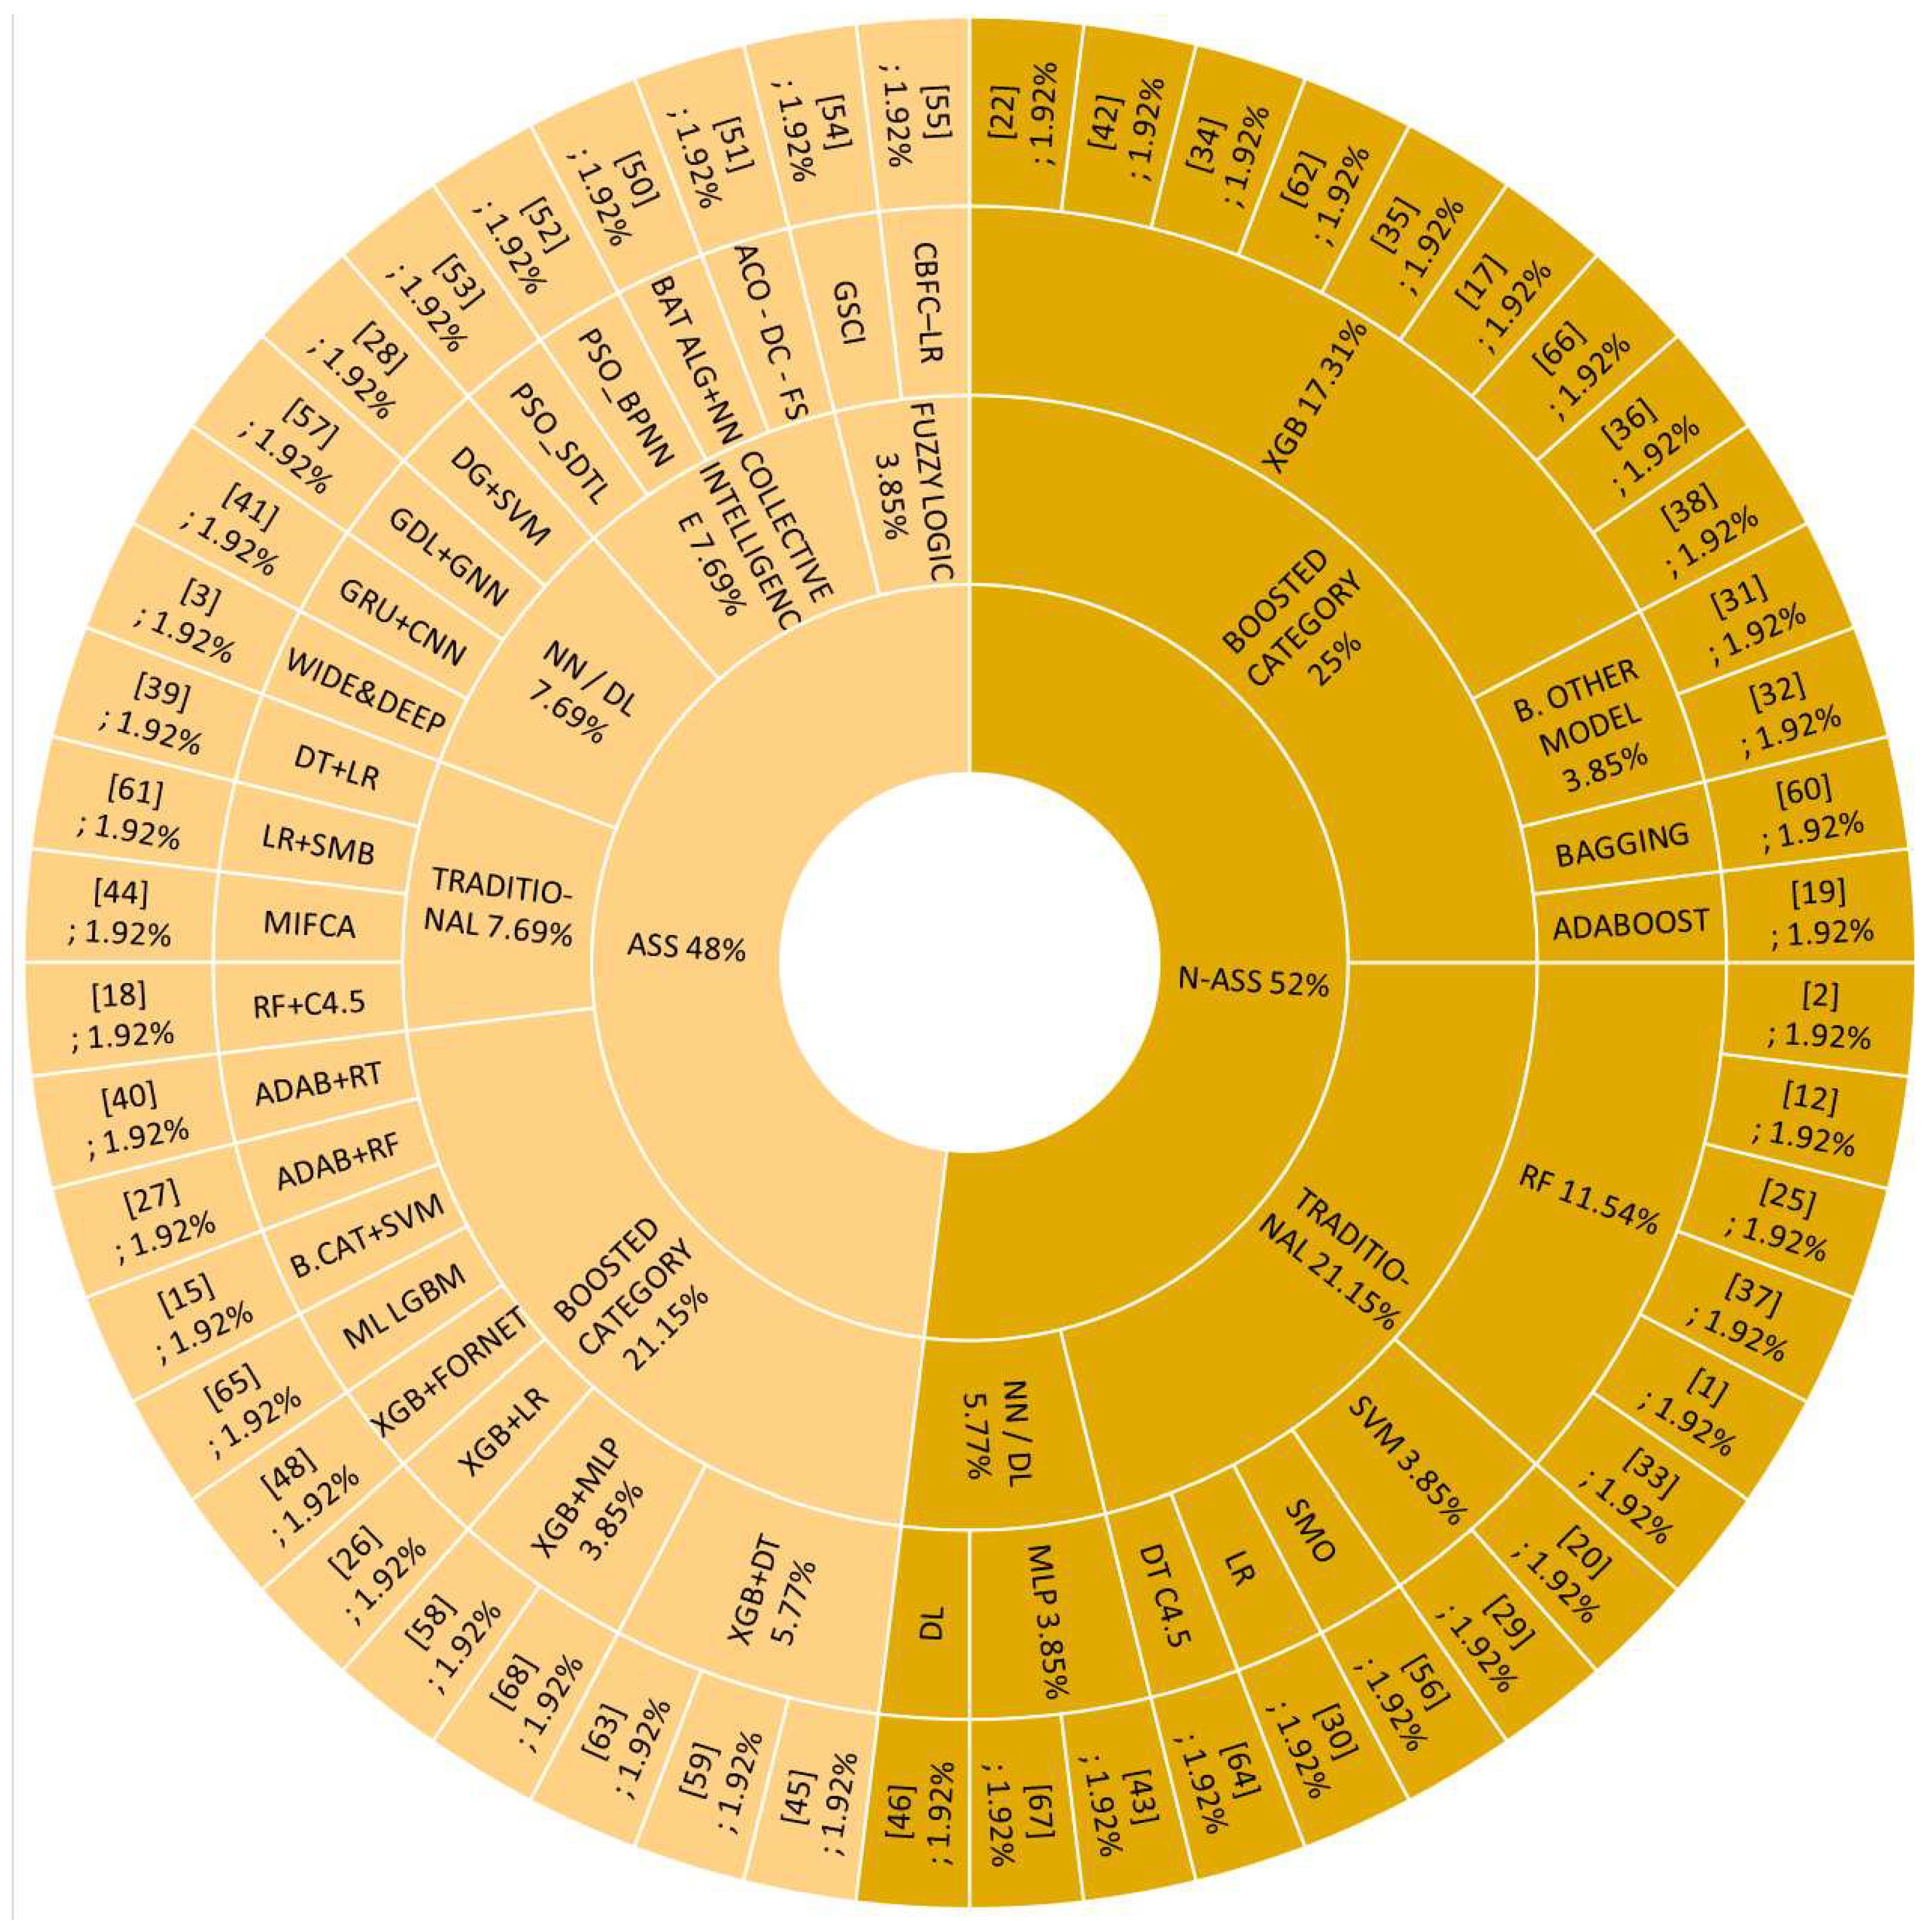
Figure 5.
Dataset used.
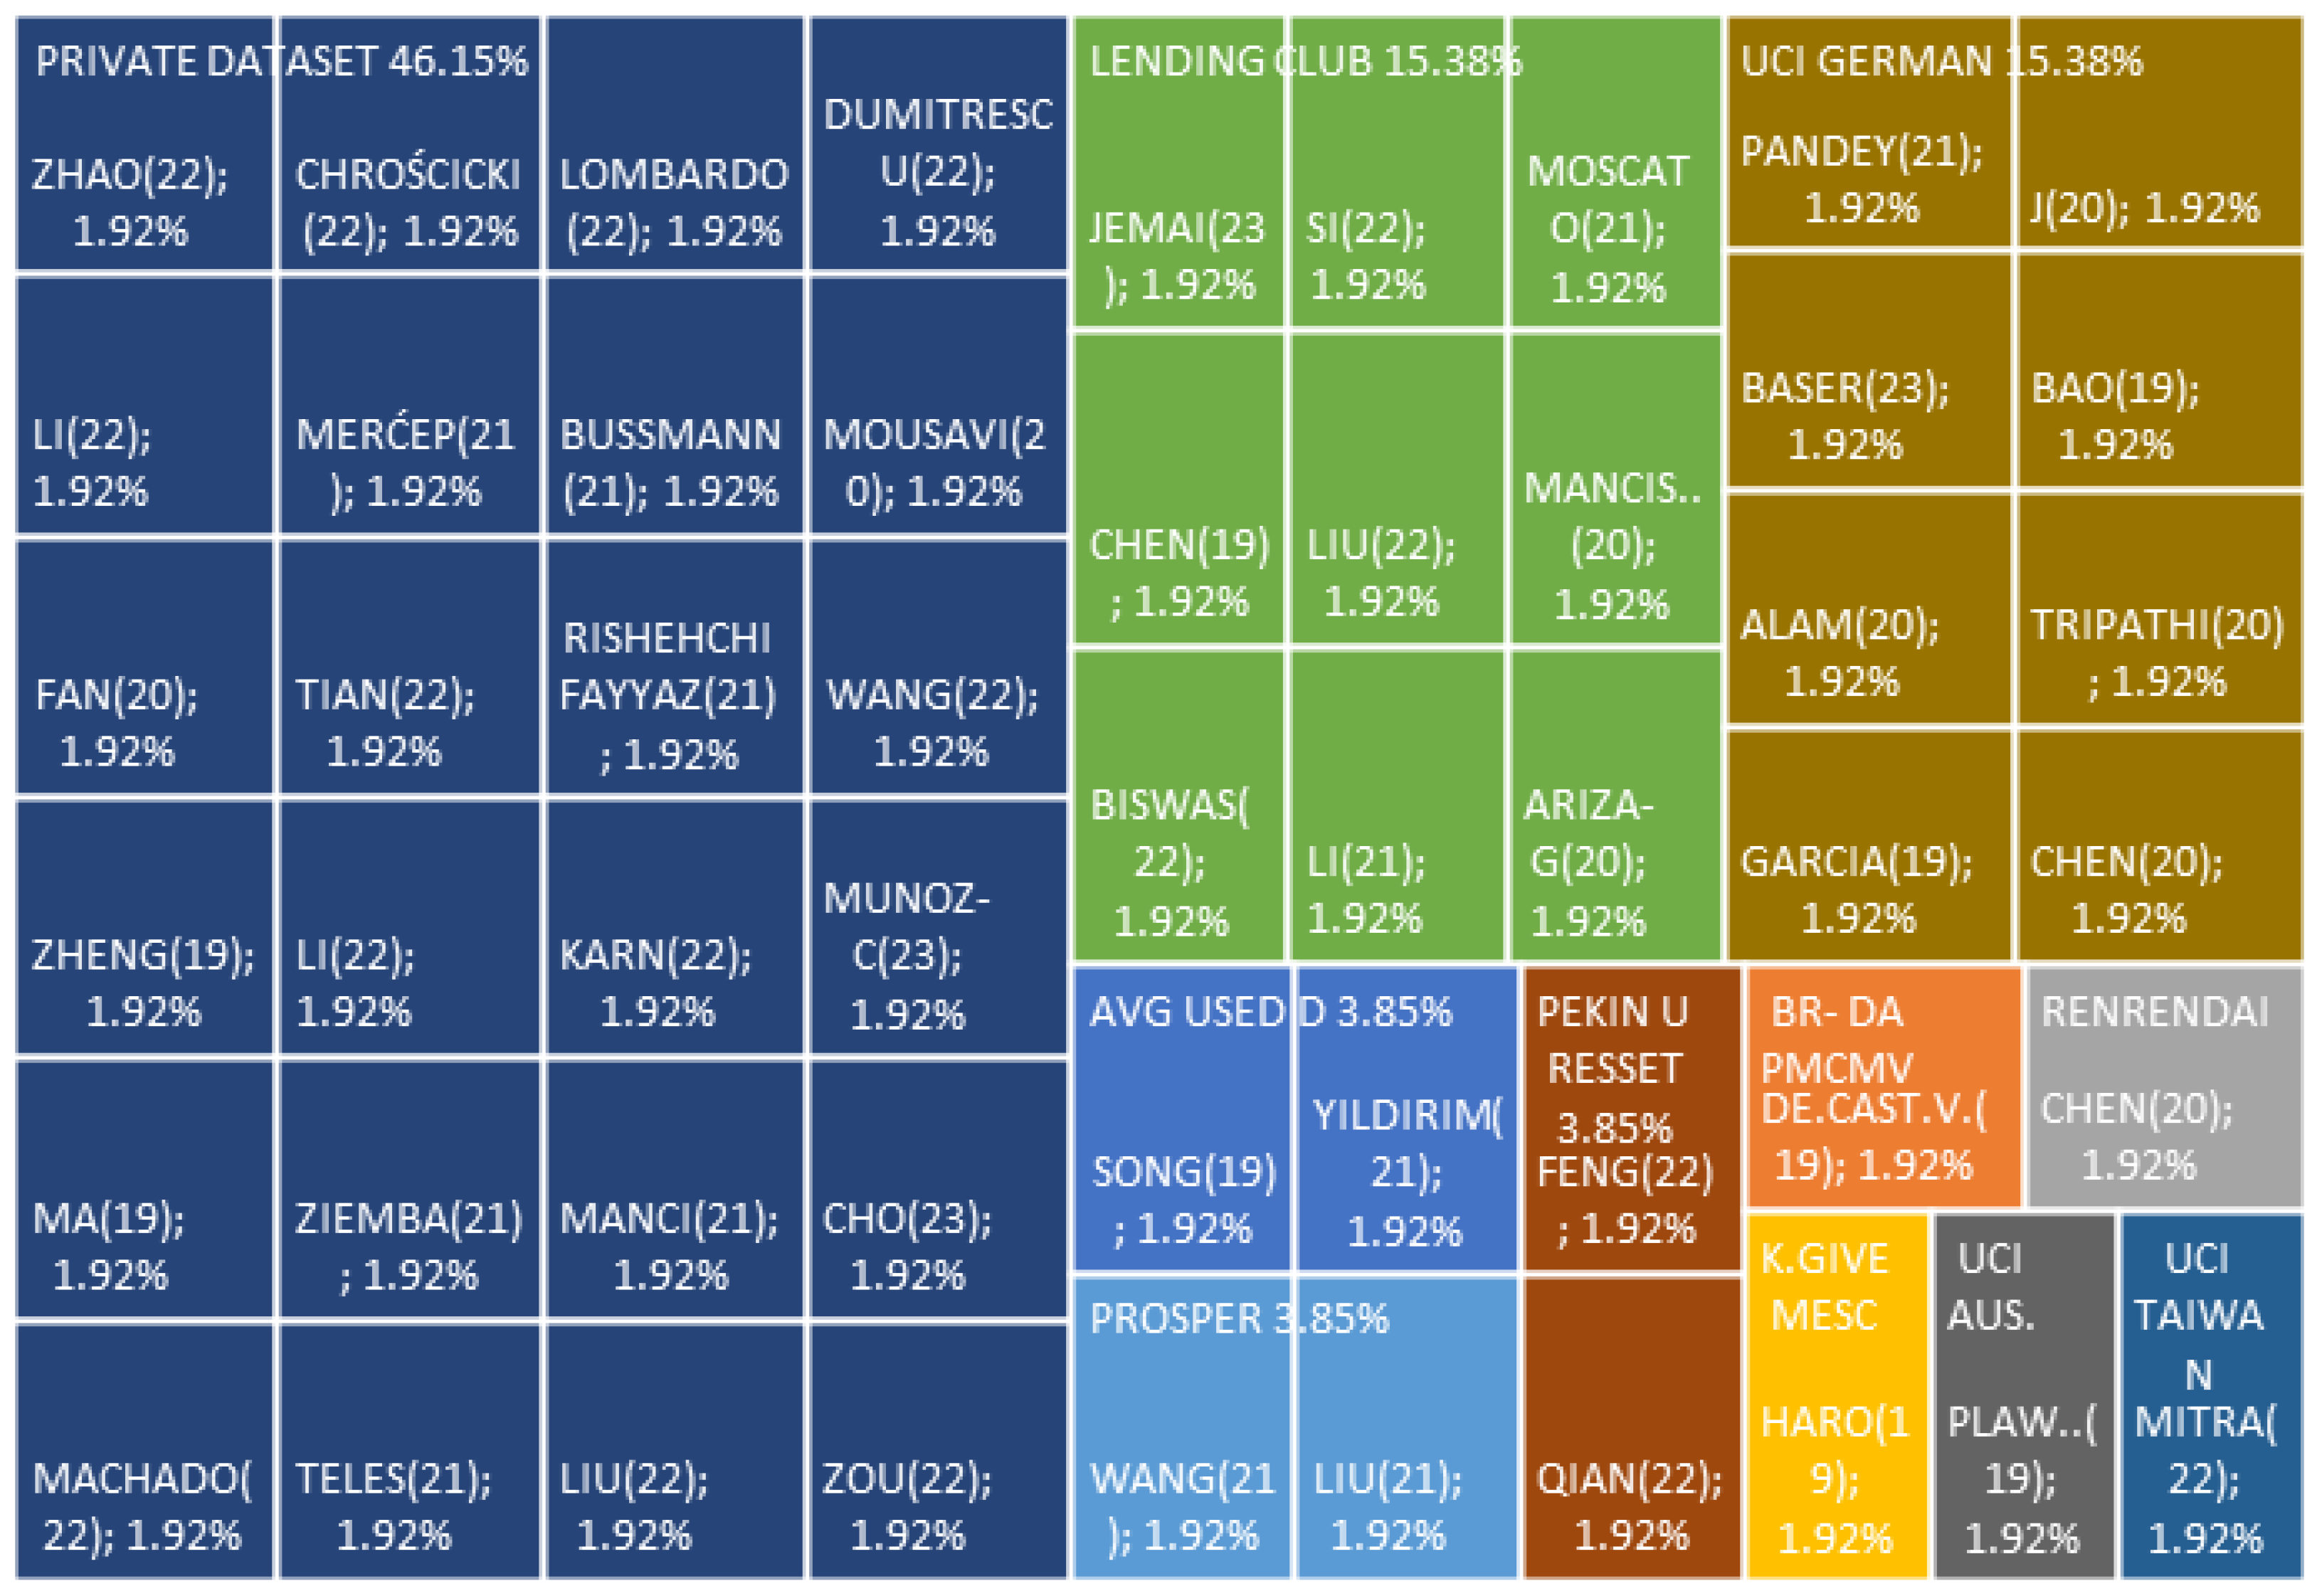

Table 1.
Research Topic.
| Research Topics | Motivation |
| The algorithms, methods, and models used to predict credit risk. | We wish to know what models the industry and academics use to predict credit risk. |
| The metrics to evaluate the performance of algorithms, methods, or models. | We wish to know what metrics to use in the industry and academics to evaluate the performance of algorithms, methods or models predict credit risk. |
| The models’ accuracy, precision, F1 measure, and AUC. | We wish to know the metrics accuracy, precision, F1 measure, and AUC of algorithms, methods, or models predict credit risk. |
| The datasets are using in the prediction of credit risk. | We wish to know what datasets to use in the industry and academics to predict credit risk. |
| The variables or features are using to prediction credit risk. | We wish to know what variables or features to use in the industry and academics to predict credit risk. |
| The main problems or limitations of predicting credit risk. | We wish to know the main problems or limitations to predict credit risk. |
Table 2.
Application of inclusion and exclusion criteria.
| Inclusion criteria | Exclusion criteria | # | % |
| Article of conference | 2 | 0.73% | |
| Article of journal | 50 | 18.18% | |
| Article duplicated | 77 | 28.00% | |
| No related | 15 | 5.45% | |
| Review article | 1 | 0.36% | |
| Without access to the full document | 57 | 20.73% | |
| Without rank in Scimagojr | 73 | 26.55% | |
| Total | 275 | 100.00% |
Table 3.
Family of algorithms, methods, and models.
| It. | Family | # | % | |||||
| Ass | N-Ass | Total | Ass | N-Ass | Total | |||
| 1 | Boosted Category | 36 | 46 | 82 | 11.96% | 15.28% | 27.24% | |
| 2 | Collective Intelligence | 7 | 7 | 2.33% | 0.00% | 2.33% | ||
| 3 | Fuzzy Logic | 10 | 10 | 3.32% | 0.00% | 3.32% | ||
| 4 | NN / DL | 8 | 28 | 36 | 2.66% | 9.30% | 11.96% | |
| 5 | Other Model | 3 | 10 | 13 | 1.00% | 3.32% | 4.32% | |
| 6 | Traditional | 18 | 135 | 153 | 5.98% | 44.85% | 50.83% | |
| Total | 82 | 219 | 301 | 27.24% | 72.76% | 100.00% | ||
Table 4.
Metrics.
| It. | Metrics | # | % | It. | Metrics | # | % | |
| 1 | AUC | 34 | 16.11% | 9 | KS | 7 | 3.32% | |
| 2 | ACC | 30 | 14.22% | 10 | BS | 6 | 2.84% | |
| 3 | F1 Measure | 24 | 11.37% | 11 | GINNI | 5 | 2.37% | |
| 4 | Precision | 22 | 10.43% | 12 | RMSE | 2 | 0.95% | |
| 5 | RECALL | 19 | 9.00% | 13 | KAPPA | 1 | 0.47% | |
| 6 | TPR | 14 | 6.64% | 14 | MAE | 1 | 0.47% | |
| 7 | TNR | 13 | 6.16% | 15 | Other | 24 | 11.37% | |
| 8 | GMEAN | 9 | 4.27% | |||||
| Total | 211 | 100.00% |
Table 5.
Metrixs author.
| It. | Dataset | Author | ACC? | Precis? | F1? | Recall? | AUC? |
| 1 | UCI Taiwan | [31] | 85.00 | 70.00 | 50.00 | 62.00 | |
| 2 | UCI German | [63] | 83.50 | 82.10 | 84.40 | 86.80 | 91.00 |
| 3 | UCI German | [27] | 82.80 | 91.20 | |||
| 4 | UCI German | [50] | 81.18 | 85.38 | |||
| 5 | UCI German | [51] | 76.60 | 84.74 | |||
| 6 | UCI German | [30] | 75.80 | 54.20 | 82.00 | 85.90 | |
| 7 | UCI German | [55] | 74.90 | 75.80 | |||
| 8 | UCI German | [18] | 79.40 | ||||
| 9 | Lending Club | [34] | 92.60 | 97.90 | 92.20 | 97.00 | |
| 10 | Lending Club | [67] | 84.40 | 88.99 | 91.42 | 93.98 | |
| 11 | Lending Club | [32] | 76.10 | 75.98 | 75.95 | 76.35 | 76.80 |
| 12 | Lending Club | [48] | 88.77 | 94.14 | |||
| 13 | Lending Club | [33] | 74.90 | ||||
| 14 | Lending Club | [37] | 64.00 | 71.70 | |||
| 15 | Lending Club | [38] | 63.60 | 85.30 | 73.50 | 64.50 | 67.40 |
| 16 | Lending Club | [46] | 18.25 | 46.88 | 63.63 | ||
| 17 | Lending Club | [65] | 2.72 | 75.86 | |||
| 18 | K Prosper | [3] | 78.50 | 54.70 | |||
| 19 | K Prosper | [19] | 79.00 | 71.00 | 65.00 | 80.00 | |
| 20 | K Give Me | [59] | 88.30 | 78.50 | 77.60 | 76.70 | 93.30 |
| 21 | RenRenDai | [54] | 93.35 | 73.12 | 82.64 | ||
| 22 | BR | [60] | 96.68 | 89.63 | |||
| 23 | AVG Used | [12] | 92.80 | 31.60 | 33.40 | 35.50 | 82.80 |
| 24 | AVG Used | [64] | 91.89 | 96.19 | |||
| 25 | UCI Austr... | [28] | 97.39 | ||||
| 26 | Tsinghua | [52] | 91.23 | ||||
| 27 | Tsinghua | [62] | 77.20 | 75.90 | 77.54 | 79.38 | 85.01 |
| 28 | Private Data | [20] | 98.34 | 100.00 | 96.00 | ||
| 29 | Private Data | [53] | 98.00 | ||||
| 30 | Private Data | [58] | 97.80 | 98.90 | 98.70 | 98.90 | |
| 31 | Private Data | [17] | 90.10 | ||||
| 32 | Private Data | [29] | 84.29 | 82.63 | 84.68 | 86.83 | 84.29 |
| 33 | Private Data | [44] | 84.15 | 82.15 | 83.40 | 84.68 | |
| 34 | Private Data | [56] | 83.00 | 83.50 | 83.00 | 83.00 | 83.30 |
| 35 | Private Data | [61] | 77.49 | 79.87 | 85.59 | 92.18 | 79.00 |
| 36 | Private Data | [26] | 87.15 | 84.56 | 83.91 | 83.59 | |
| 37 | Private Data | [66] | 46.10 | ||||
| 38 | Private Data | [1] | 75.40 | ||||
| 39 | Private Data | [39] | 85.68 | ||||
| 40 | Private Data | [35] | 93.39 | ||||
| 41 | Private Data | [36] | 93.00 | ||||
| 42 | Private Data | [42] | 42.81 | 52.00 | 67.01 | 78.00 | |
| 43 | Private Data | [40] | 71.32 | ||||
| 44 | Private Data | [2] | 91.40 | ||||
| 45 | Private Data | [41] | 88.00 | 88.00 | 88.00 | 93.00 | |
| 46 | Private Data | [43] | 77.56 | ||||
| 48 | Private Data | [22] | 95.50 |
Table 6.
Features Group.
| It. | Features Group | # | % |
| 1 | Demographic | 291 | 54.09% |
| 2 | Operation | 157 | 29.18% |
| 3 | Payment behavior | 41 | 7.62% |
| 4 | External factors | 36 | 6.69% |
| 5 | Unstructured data | 7 | 1.30% |
| 6 | Transaction | 6 | 1.12% |
| Total | 538 | 100.00% |
Table 7.
Features.
| It. | Features Group | Feature | # | % |
| 1 | Demographic | External Debt Value / historical | 27 | 5.02% |
| 2 | Demographic | Domestic Debt Value / historical | 27 | 5.02% |
| 3 | Operation | Loan value | 24 | 4.46% |
| 4 | Demographic | Average / Total revenue | 20 | 3.72% |
| 5 | Demographic | Residence / Registered Assets | 19 | 3.53% |
| 6 | Demographic | Economic Activity / Experience | 18 | 3.35% |
| 7 | Demographic | Family Income | 18 | 3.35% |
| 8 | Payment behavior | Days in arrears / Range Days in arrears | 17 | 3.16% |
| 9 | Operation | Historical use of debt | 16 | 2.97% |
| 10 | Operation | Destination of the Credit / Purpose | 16 | 2.97% |
| 11 | Operation | Interest Rate | 16 | 2.97% |
| 12 | External factors | Debt Profitability | 16 | 2.97% |
| 13 | Demographic | Total Debt / Income / DTI | 15 | 2.79% |
| 14 | Demographic | Gender / Sex | 14 | 2.60% |
| 15 | Demographic | Risk Segment / Buro Rating / Score | 14 | 2.60% |
| 16 | Demographic | Age / Date of Birth | 13 | 2.42% |
| 17 | Operation | Checking / Savings Account | 13 | 2.42% |
| 18 | Operation | Credit Line Limit | 13 | 2.42% |
| 19 | Demographic | Civil Status | 12 | 2.23% |
| 20 | Demographic | Mortgage Debt | 12 | 2.23% |
| 21 | Operation | Monthly Fees | 12 | 2.23% |
| 22 | Payment behavior | Collection status | 11 | 2.04% |
| 23 | Payment behavior | Unpaid Installment Number | 11 | 2.04% |
| 24 | Demographic | Financial maturity | 9 | 1.67% |
| 25 | Demographic | Residence type | 9 | 1.67% |
| 26 | Demographic | Fee value | 9 | 1.67% |
| 27 | External factors | Inventory turnover | 9 | 1.67% |
| 28 | Demographic | Labor Old | 7 | 1.30% |
| 29 | Demographic | Education Level | 7 | 1.30% |
| 30 | Others | Others | 114 | 21.21% |
| Total | 538 | 100.00% |
Table 8.
Limitations.
| It. | Limits Identified | # | % |
| 1 | Representativeness of reality | 39 | 31.71% |
| 2 | Unbalanced data | 35 | 28.46% |
| 3 | Inconsistency in information recording | 21 | 17.07% |
| 4 | Lack of ability to explain the proposed results | 16 | 13.01% |
| 5 | Availability of information and centralized processing | 7 | 5.69% |
| 6 | Adaptability in processing struct. and unstruct. information | 5 | 4.07% |
| Total | 123 | 100.00% |
Table 9.
Dataset balancing techniques.
| It. | Method | # | % | It. | Method | # | % | |
| 1 | SMOTE | 24 | 28.24% | 8 | CC | 2 | 2.35% | |
| 2 | KFold | 17 | 20.00% | 9 | CS-Classifiers | 2 | 2.35% | |
| 3 | ROS | 10 | 11.76% | 10 | KN-SMOTE | 2 | 2.35% | |
| 4 | RUS | 10 | 11.76% | 11 | NMISS | 2 | 2.35% | |
| 5 | ADASYN | 4 | 4.71% | 12 | RESAMPLE | 2 | 2.35% | |
| 6 | SMOTEBoost | 4 | 4.71% | 13 | SMOTE-T | 2 | 2.35% | |
| 7 | B-SMOT | 2 | 2.35% | 14 | Under-Bagging | 2 | 2.35% | |
| Total | 85 | 100.00% |
Table 10.
Techniques for determination of hyperparameters.
| It. | Method | # | % |
| 1 | KFold CV | 21 | 58.33% |
| 2 | Grid Search Method | 8 | 22.22% |
| 3 | LightGBM Bayesian Optimisation | 2 | 5.56% |
| 4 | Genetic Algorithm (GA) | 2 | 5.56% |
| 5 | Random Search | 1 | 2.78% |
| 6 | Ant Colony Optimiation (ACO) | 1 | 2.78% |
| 7 | Other | 1 | 2.78% |
| Total | 36 | 100.00% |
Table 11.
Models trends.
| It. | Family | 2019 | 2020 | 2021 | 2022 | 2023 | Total |
| 1 | Boosted Category | 4 | 4 | 5 | 10 | 1 | 24 |
| 2 | Traditional | 4 | 1 | 5 | 4 | 1 | 15 |
| 3 | NN / DL | 1 | 1 | 2 | 2 | 1 | 7 |
| 4 | Collective Intelligence | 2 | 2 | 4 | |||
| 5 | Fuzzy Logic | 1 | 1 | 2 | |||
| Total | 9 | 9 | 12 | 18 | 4 | 52 |
Disclaimer/Publisher’s Note: The statements, opinions and data contained in all publications are solely those of the individual author(s) and contributor(s) and not of MDPI and/or the editor(s). MDPI and/or the editor(s) disclaim responsibility for any injury to people or property resulting from any ideas, methods, instructions or products referred to in the content. |
© 2023 by the authors. Licensee MDPI, Basel, Switzerland. This article is an open access article distributed under the terms and conditions of the Creative Commons Attribution (CC BY) license (http://creativecommons.org/licenses/by/4.0/).
Copyright: This open access article is published under a Creative Commons CC BY 4.0 license, which permit the free download, distribution, and reuse, provided that the author and preprint are cited in any reuse.


