1. Introduction
The role of the blood supply chain in healthcare systems proved to be critical due to the key role of blood in supplying oxygen and nutrition to body organs and serving as a lifeline for patients in need of blood transfusions and life-saving treatments [
1,
2]. However, several challenges shall be tackled to manage this complex supply chain efficiently [
3]. These challenges include uncertainty in patients' and donors' arrival [
4,
5]. Such uncertainties, along with requirements for keeping blood units safe, lead to uncertainties in blood availability and a need to make decisions about appropriate storage size. The number of studies that addressed such a concern is limited. Two recent studies that take account of storage size and stochasticity nature of blood inventory level in their studies, used approximation and metaheuristic algorithms to address the problem [
6,
7].
Blood as a valuable living tissue within the human body, is of significant medical importance. For a successful human blood transfusion, it is crucial to evaluate the compatibility of two key antigen systems, namely: ABO and Rh resulting in the eight major blood types. It is worth noting that, some blood types are compatible with several other types, albeit with different priorities of substitution [
8,
9]. Given the perishability of blood and special storage requirements, deciding on the appropriate storage size is vital for reducing costs of investments, blood perishability, and rejecting donations because of the capacity [
10,
11].
Overall, the blood supply chain has several stages that include, but are not limited to, collecting donor’s blood and storing it, delivery of stored blood, and transfusing it to patients [
12]. All of the aforementioned have uncertain natures in the form of stochasticity.
On the other hand, in natural disaster crises such as earthquakes, there is a need to supply blood to affected patients promptly [
13,
14]. Overall, a cut-point of 51 hours—less than 3 days—is suggested for the more than 2200 search and rescue processes studied [
15]. This time is far less than a week shelf life suggested for the whole blood [
16]. Therefore in this study, we only consider the storage capacity and ignore blood perishability.
In the literature, queueing models with Poisson arrivals and Exponential service times are used to model networks and inventory systems [
7,
17,
18]. For instance, Gelenbe used the concept of “energy packets” a discretized interpretation of Energy arrival to model a node and an analytical routing of an energy-harvesting wireless sensor network [
19,
20]. Such networks were studied further considering intermittent connections in another study [
21]. Recently level dependent perishable items are investigated using a Jackson network—an extension of queueing systems [
22].
However, to the best of our knowledge, previous studies have not used an aggregated queueing model to investigate a blood supply chain with uncertainties in donors’ and patients’ arrival, along with a stochastic delivery system. In this study, we use an integrated queueing system to decide about the appropriate blood bank size designed to address crises due to an unusual blood demand caused by disasters. The study also investigates the stability conditions of the system such that human casualties are minimized. Finally, a sensitivity analysis is performed to identify the most crucial intervals for parameters to help managers know when to use means such as campaigns or investment in vehicles to improve system performance.
2. Materials and Methods
The blood delivery problem under study investigates a system with a random delivery of patients to the hospital wherein units of blood are stored. Throughout our modeling, we consider a storage constraint that decides the maximum capacity for storing units of blood safely. We wish to remind the readers that, in a crisis, the capacity for patient care spaces who need to be transferred for blood transfusion is considered unlimited (i.e., they are moved to safe areas and wait for ambulances to move them to a hospital). However, the quality of healthcare and safety concerns associated with the location of the crisis may impact the mortality rate of patients. What follows presents the notations used in this paper:
|
The mortality rate of patients |
|
The rate of the local demand (i.e., not related to the crisis) |
|
The transportation rate per patient, including travel time |
|
The rate of finding victims in need of blood (patients) |
|
The blood donation rate |
|
The probability of having no blood stored in the storage |
|
The probability of having no storage capacity to accept donors |
|
The probability of having no patients in need of blood |
|
Utilization factor of blood storage |
|
Utilization factor of temporary patient care spaces |
|
Storage size decided based on the given parameter |
We wish to remind the readers that because the hospital and patients are not located in the same place, we need to transfer the patients or unit of blood; therefore, a transfusion is possible if and only if we have a patient, the unit of blood, and a vehicle ready to transfer either of them.
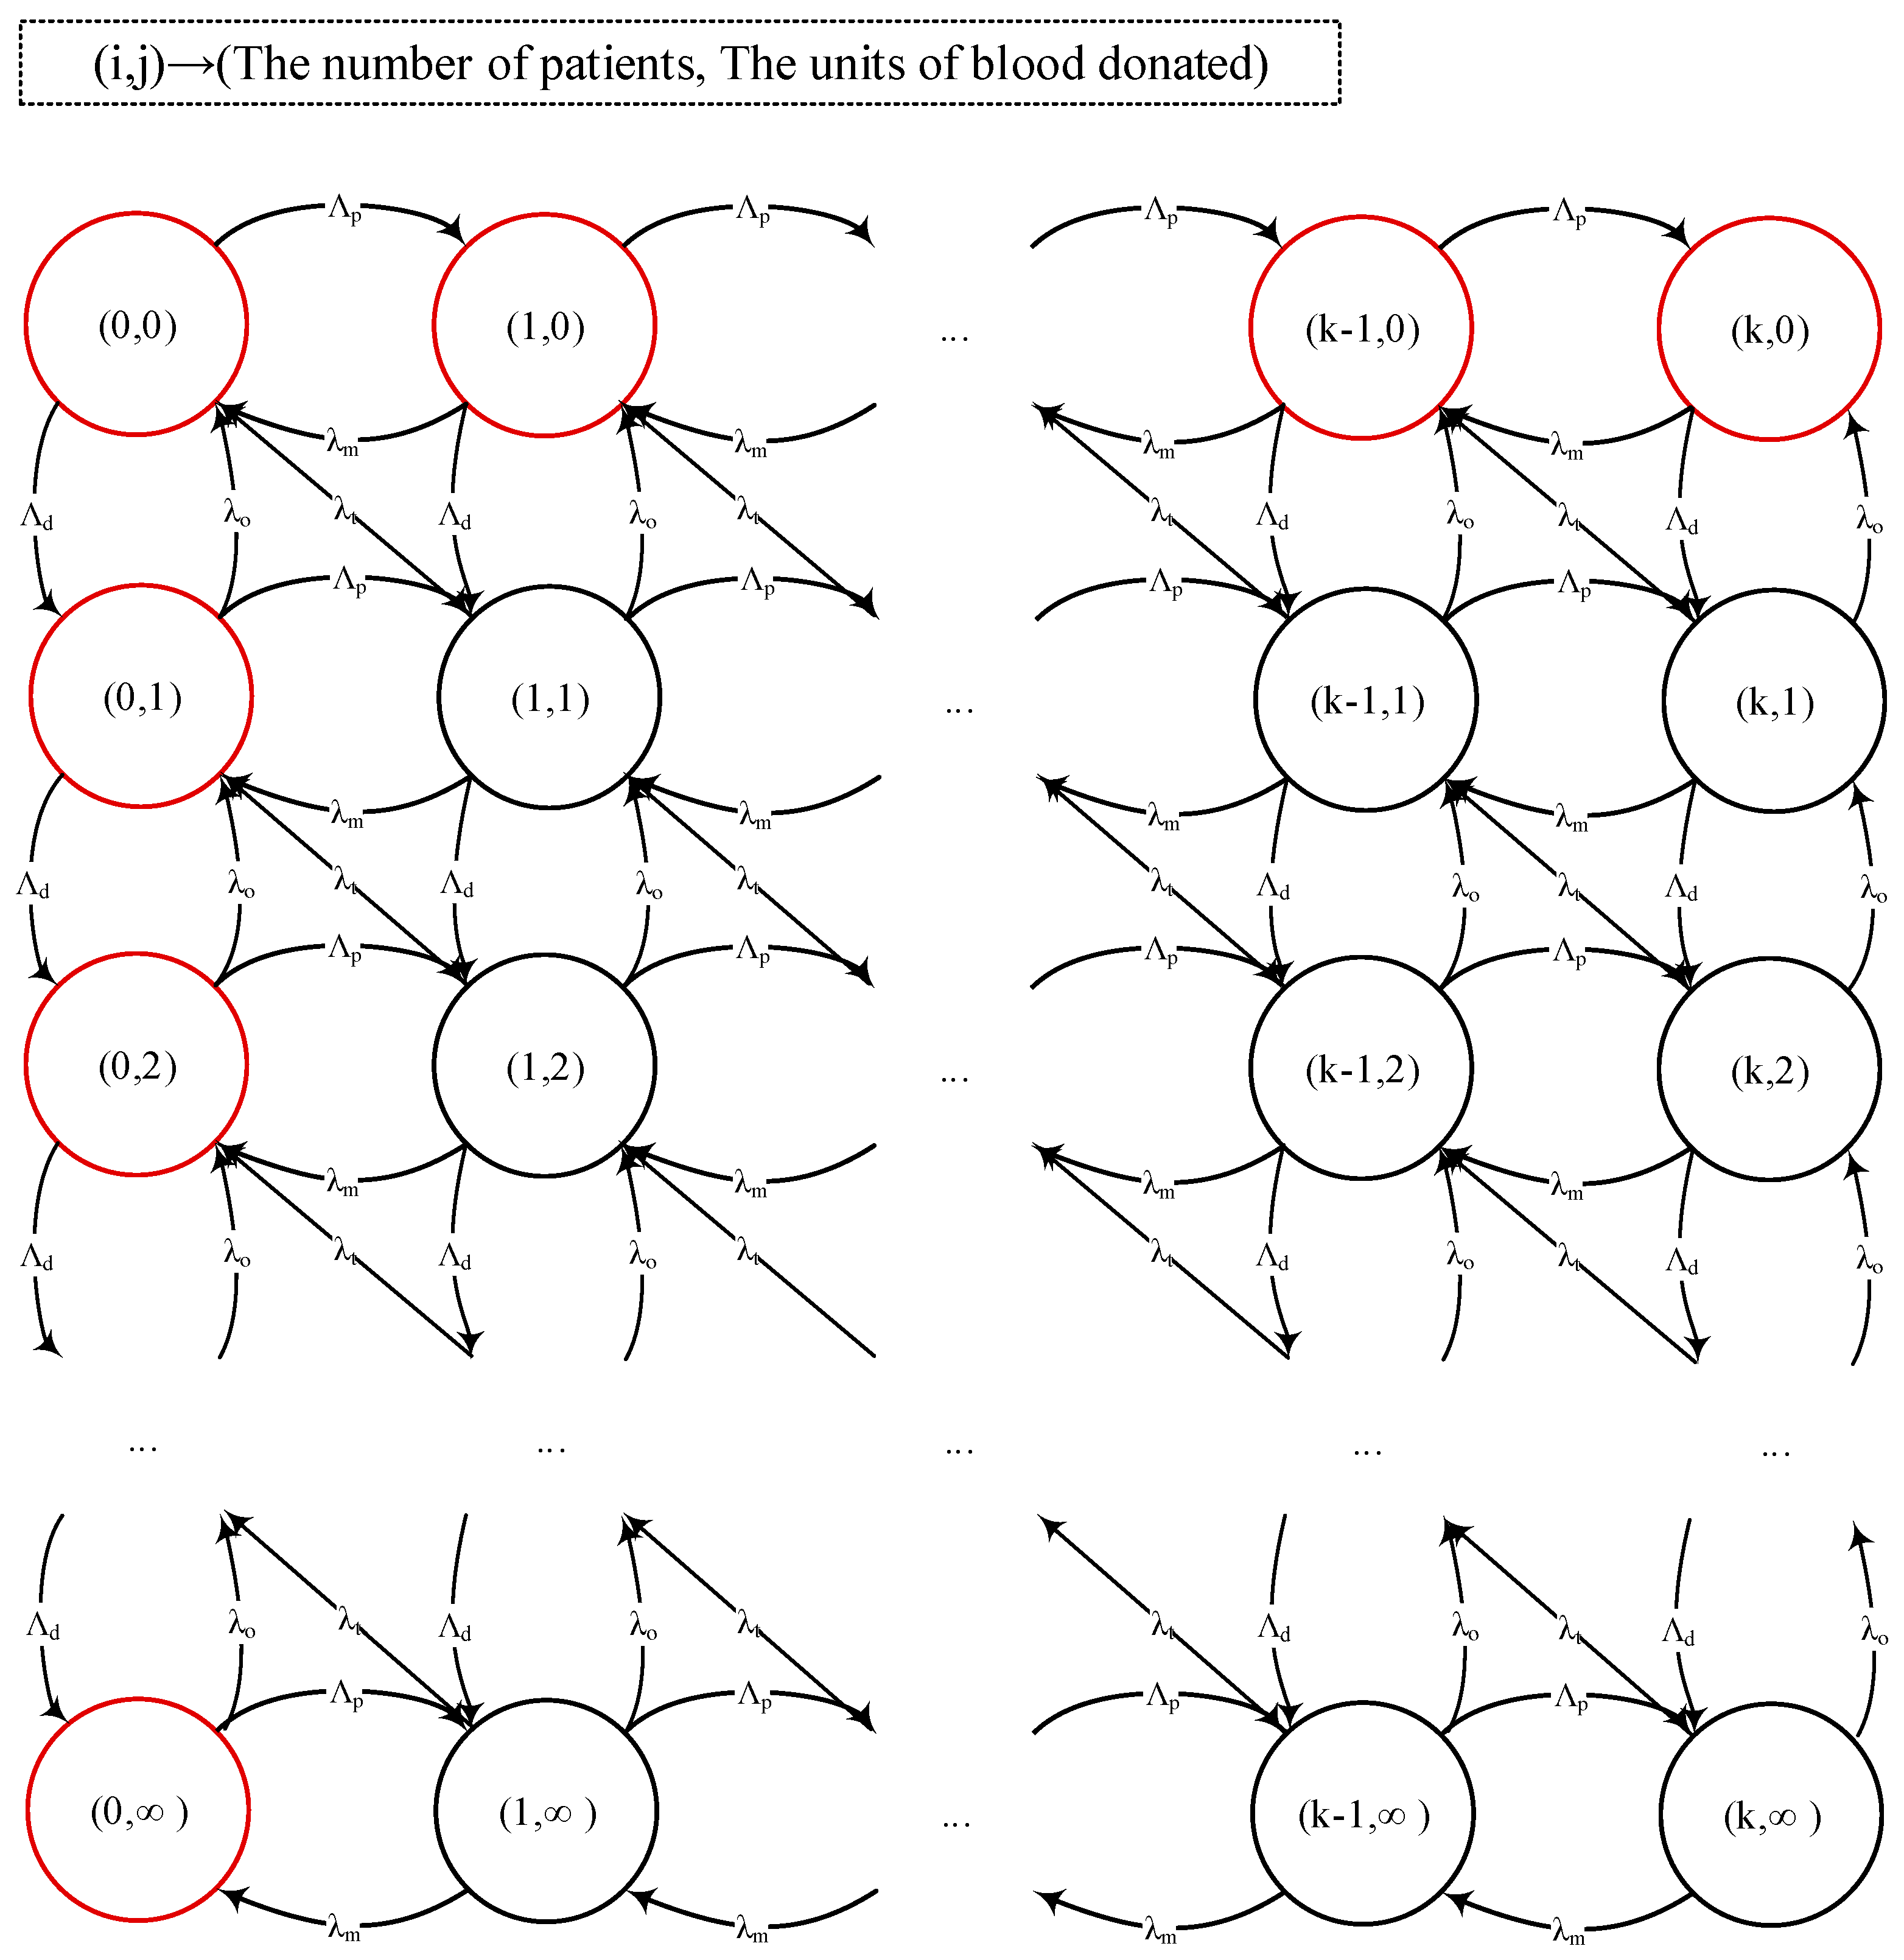
Figure 1 illustrates the system’s behavior. In this figure,
indicates the state of the system and means that there are
patients in need of blood in the system and
units of blood is stored. The red circles indicate states under which blood transfusion is impossible (i.e., either there is no blood or no patient). Using probabilities of having no patients in the system
and no blood stored
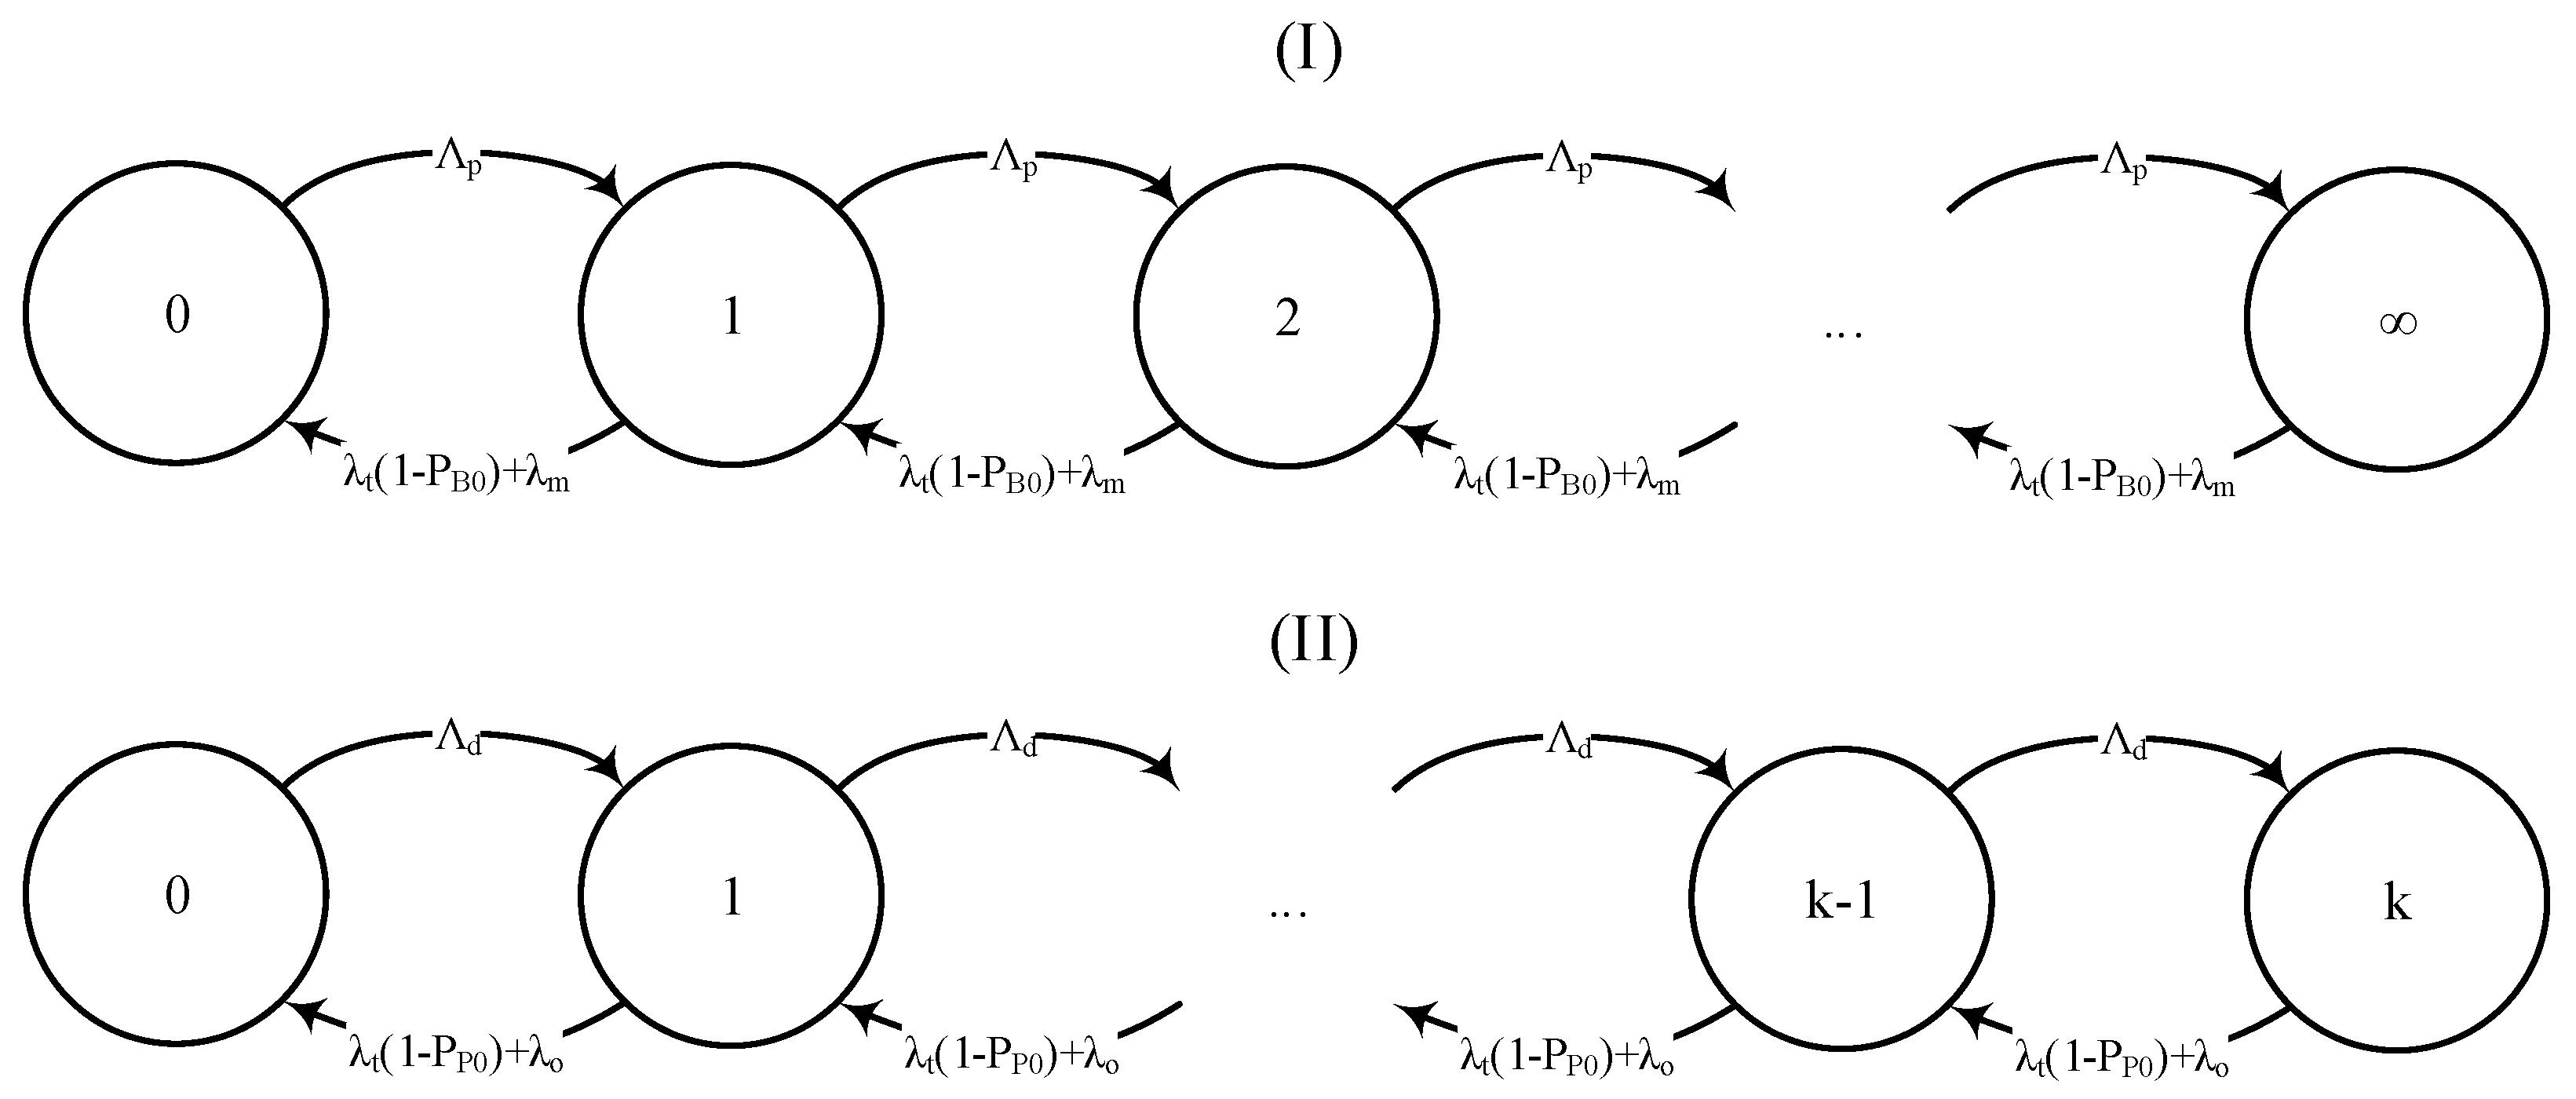
, we can decompose the system as shown in
Figure 2.
Given the abovementioned, the interrelationship between blood storage, transportation, and the number of patients in need of blood can be modeled using a decomposition method (see
Figure 2). As can be seen, the model is composed of two coupled queues for patients and blood storage, respectively. In this model, the patient queue follows an
discipline and the blood queue (with limited storage) follows an
discipline. Given the probabilities of blood stockout
, absence of patients
, and lack of space in storage
, one may obtain the stationary states distribution as follows:
where
, and
. We now consider the case
, that is:
The utilization factor of the blood queue is obtained as follows:
Substituting equations 1 and 4 in equations 2 and 3 yields:
As can be seen in Equations (6) and (7), we can obtain storage size (i.e.,
) based on the probabilities of blood shortage
or the proportion of time that we cannot accept any donations
. For a simpler presentation, let us define
,
, we have:
By substituting
and
with
and
respectively, and using simple calculations, including rearranging equation (8) and taking logarithms of both sides, one obtains the following values for
and
:
Substituting
and
with their respective values we have:
It is worth noting that in Equation (12) if i.e. , there is a lower bound for . In other words, if there are always some blood donors that are declined, because the system does not have sufficient capacity. However, leads to a lower bound for that is more critical—it means some levels of blood shortage must be accepted.
Note that for small enough
and
, equations (6) and (7) turn into much simpler equations as follows:
Using a similar procedure as stated earlier, one obtains the following values for
and
:
In Equations (19) and (20), the second terms are obtained using L’Hopital’s rule.
Now that we have obtained the closed-form solutions to obtain the storage size, we are ready to analyze the stability conditions of the system. First, we investigate the lower bound for the system to be out of blood for patients (i.e.,
. The
is defined by:
Therefore, one may calculate the following for different intervals of
:
As can be seen in equation (22), when
is less than 1 we face some shortages regardless of storage size. Given equation (5) and assuming that there are no patients in need of blood (i.e.,
to avoid constant blood shortage, we have:
That means the donation rate shall exceed the rate of local demand for blood to guarantee that there is no permanent shortage of blood units for local demand. Because we aim to avoid patients’ mortality for delays in blood transfusion, let us set
to zero. By substituting equations (1) and (4) in equation (5), we have:
Given that
is positive, we have
. Now we investigate the transportation rate of patients. We wish to remark that, although the main goal of blood transportation is to reduce the number of patients in need of transfusion to zero (i.e.,
), if we stay in
, we do not need any storage and blood donors anymore. Now we are ready to investigate the lower bound of
(
) as follow:
As can be seen in equation (25) to avoid a constant postponement of donations (i.e., having enough space to keep donations in the long run), we need
be near zero, which is not achievable for
greater than 1. Therefore, we have:
Given that in a crisis demands of on-site patients are much higher than the perishability plus demands from local patients (i.e.
) and by setting
to zero, we have
. Note that the relation is intuitive, given that campaigns to attract donors in a crisis are unhelpful when investments in transportation infrastructure did not take place in advance. So the stability conditions are as follows: (a)
, (b)
, (c)
, and (d)
, note that relation (d) is inferred from relations (a) and (b). There is an additional condition that is stated earlier (after Equation (16)), (e)
The following is a summarization of the aforementioned conditions, noting that conditions (a) and (c) are inferred from condition (e):
Finally, we wish to remind the readers that for calculating
we need to use
which itself is a function of
Therefore, updating
leads to a change in
and
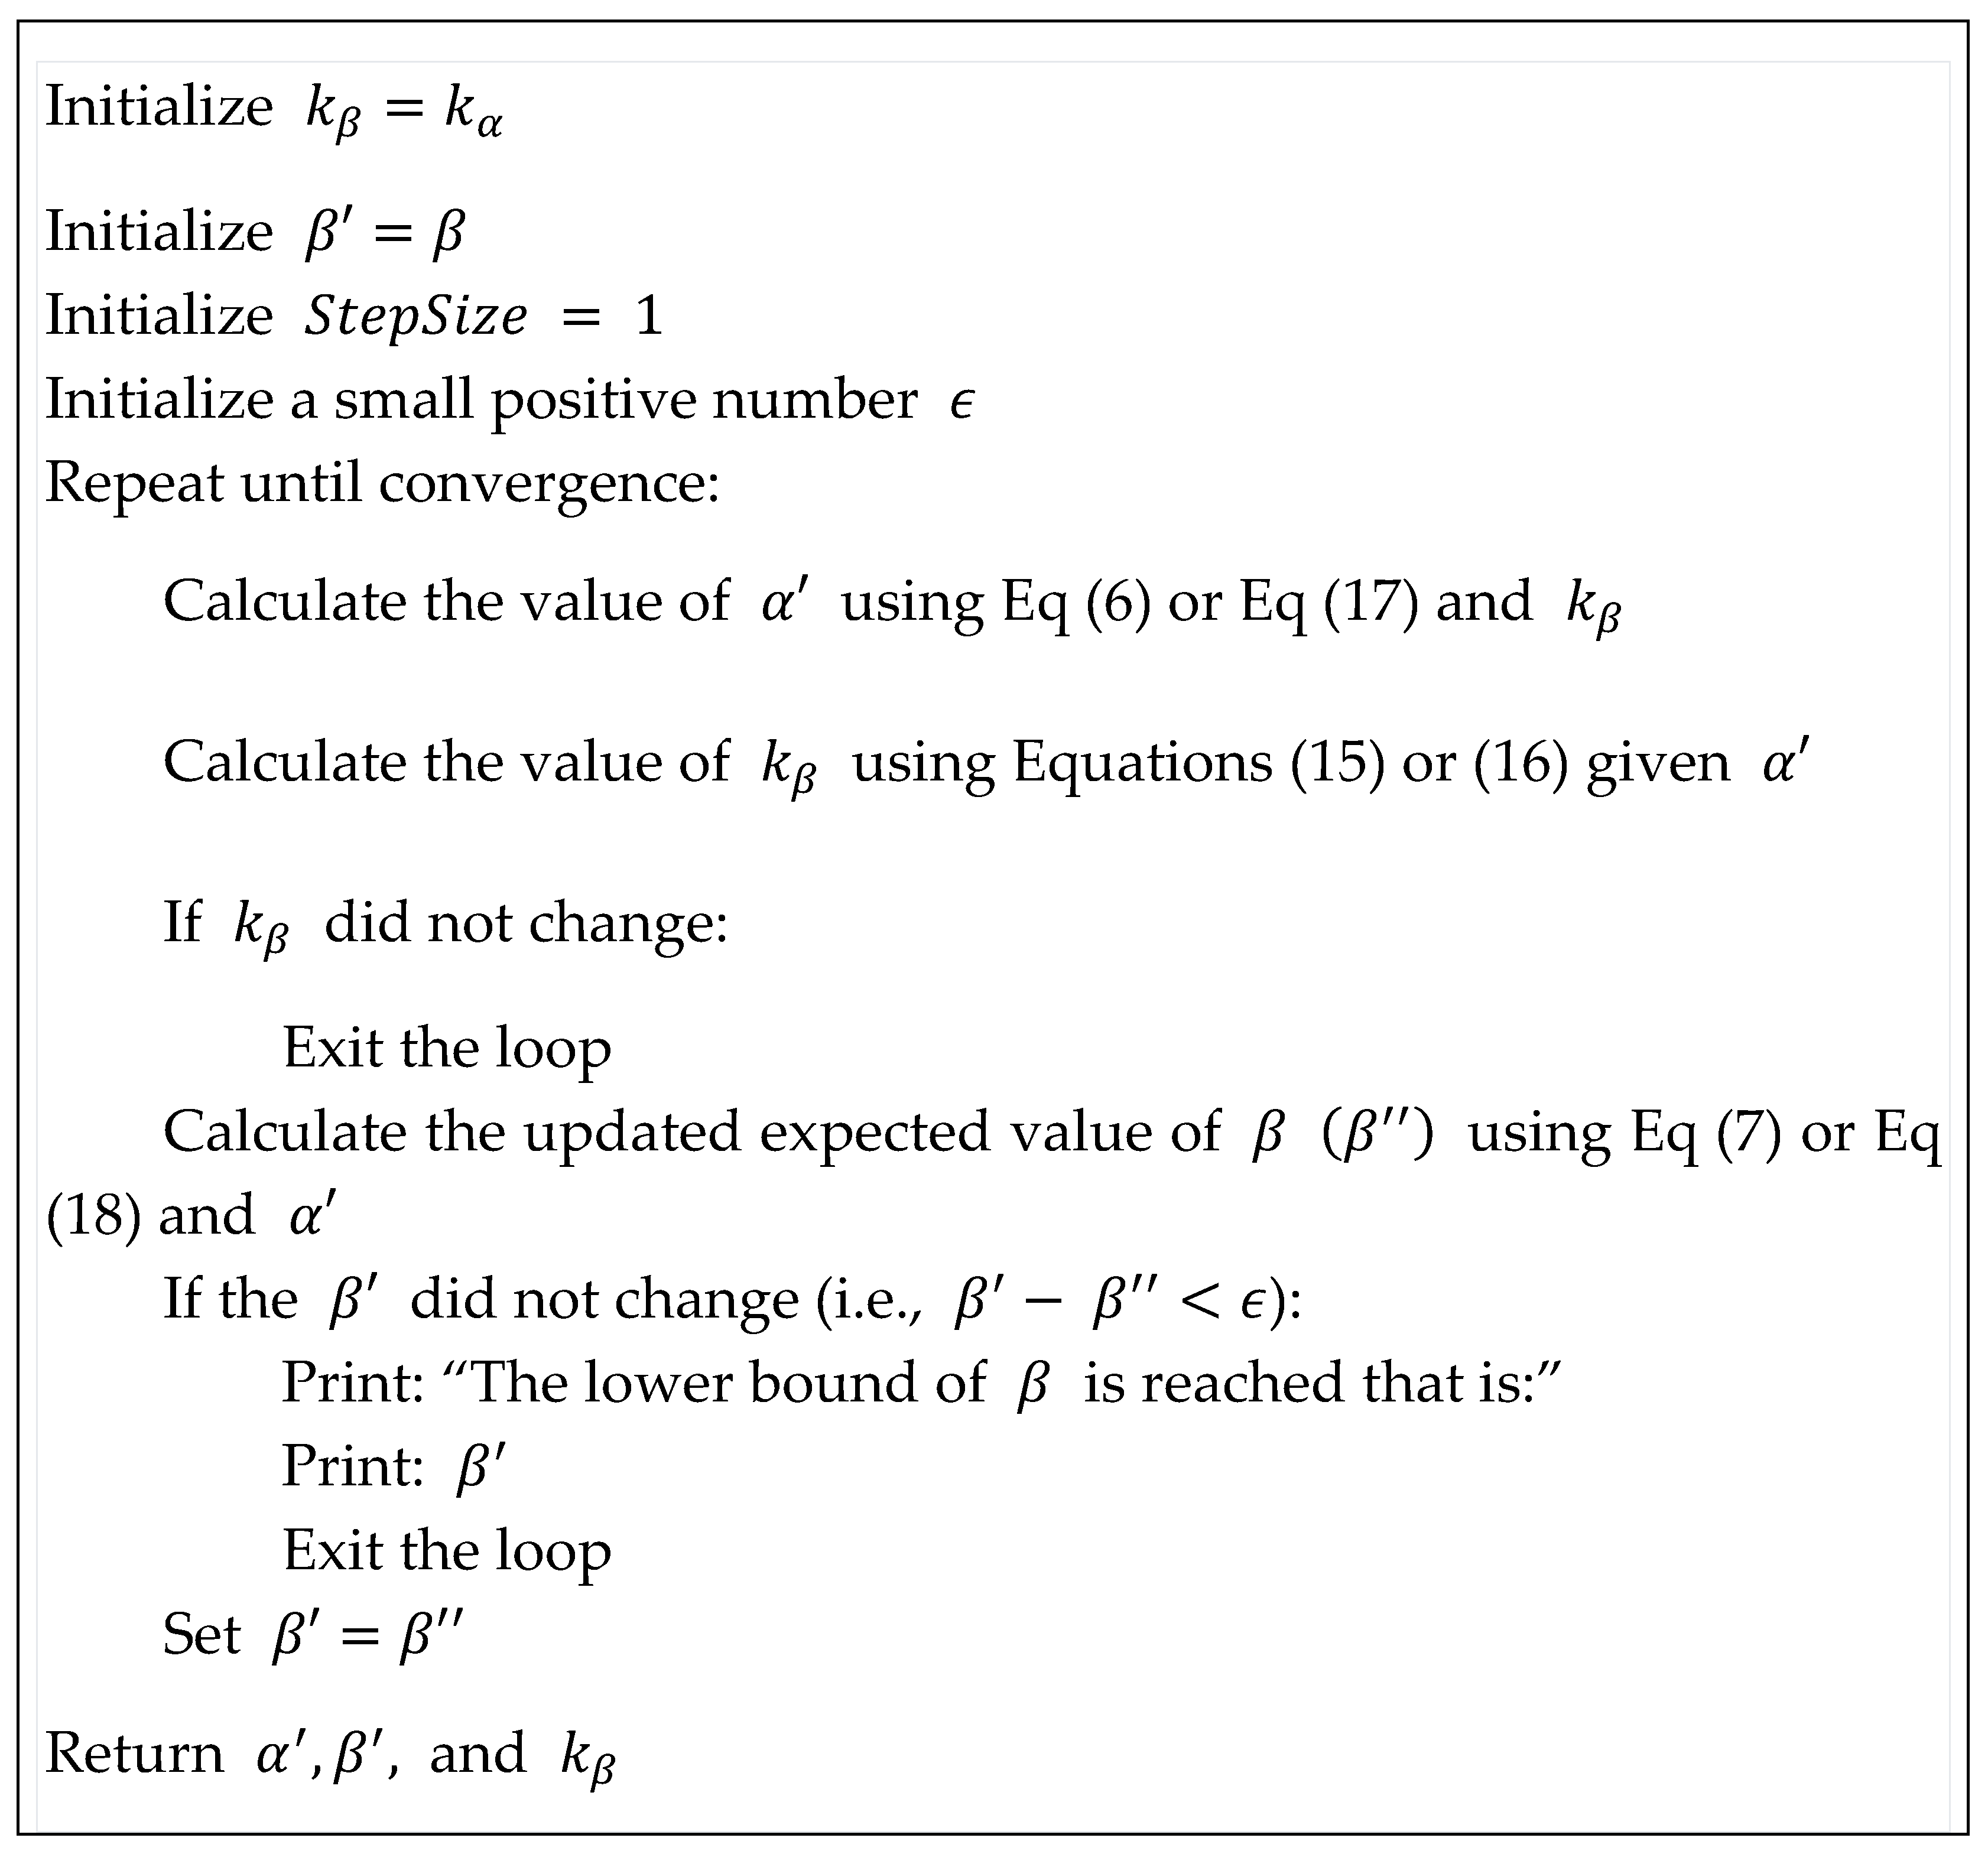
, respectively. To overcome this issue, we will use a successive approximation algorithm, to update values of
and
, given the new value of
(See
Figure 3). This algorithm is applicable when we have a lower blood donation rate than patient discovery—i.e., inevitable shortage and accepting some mortality on patients’ part caused by delayed blood delivery—that is not addressed in this study.
3. Results
In this section, we evaluate the impact of changes in different parameters on parameters. First, we investigate the impact of changes in parameter values on
. As can be seen in Equation (14),
is a hypervolume in a six-dimensional space. Therefore, to visualize
first, we rewrite Equation (14) as follows:
In our analysis, we always assess the impact of changes in
coupled with changes in
(
Figure 4),
(
Figure 5), and
(
Figure 6).
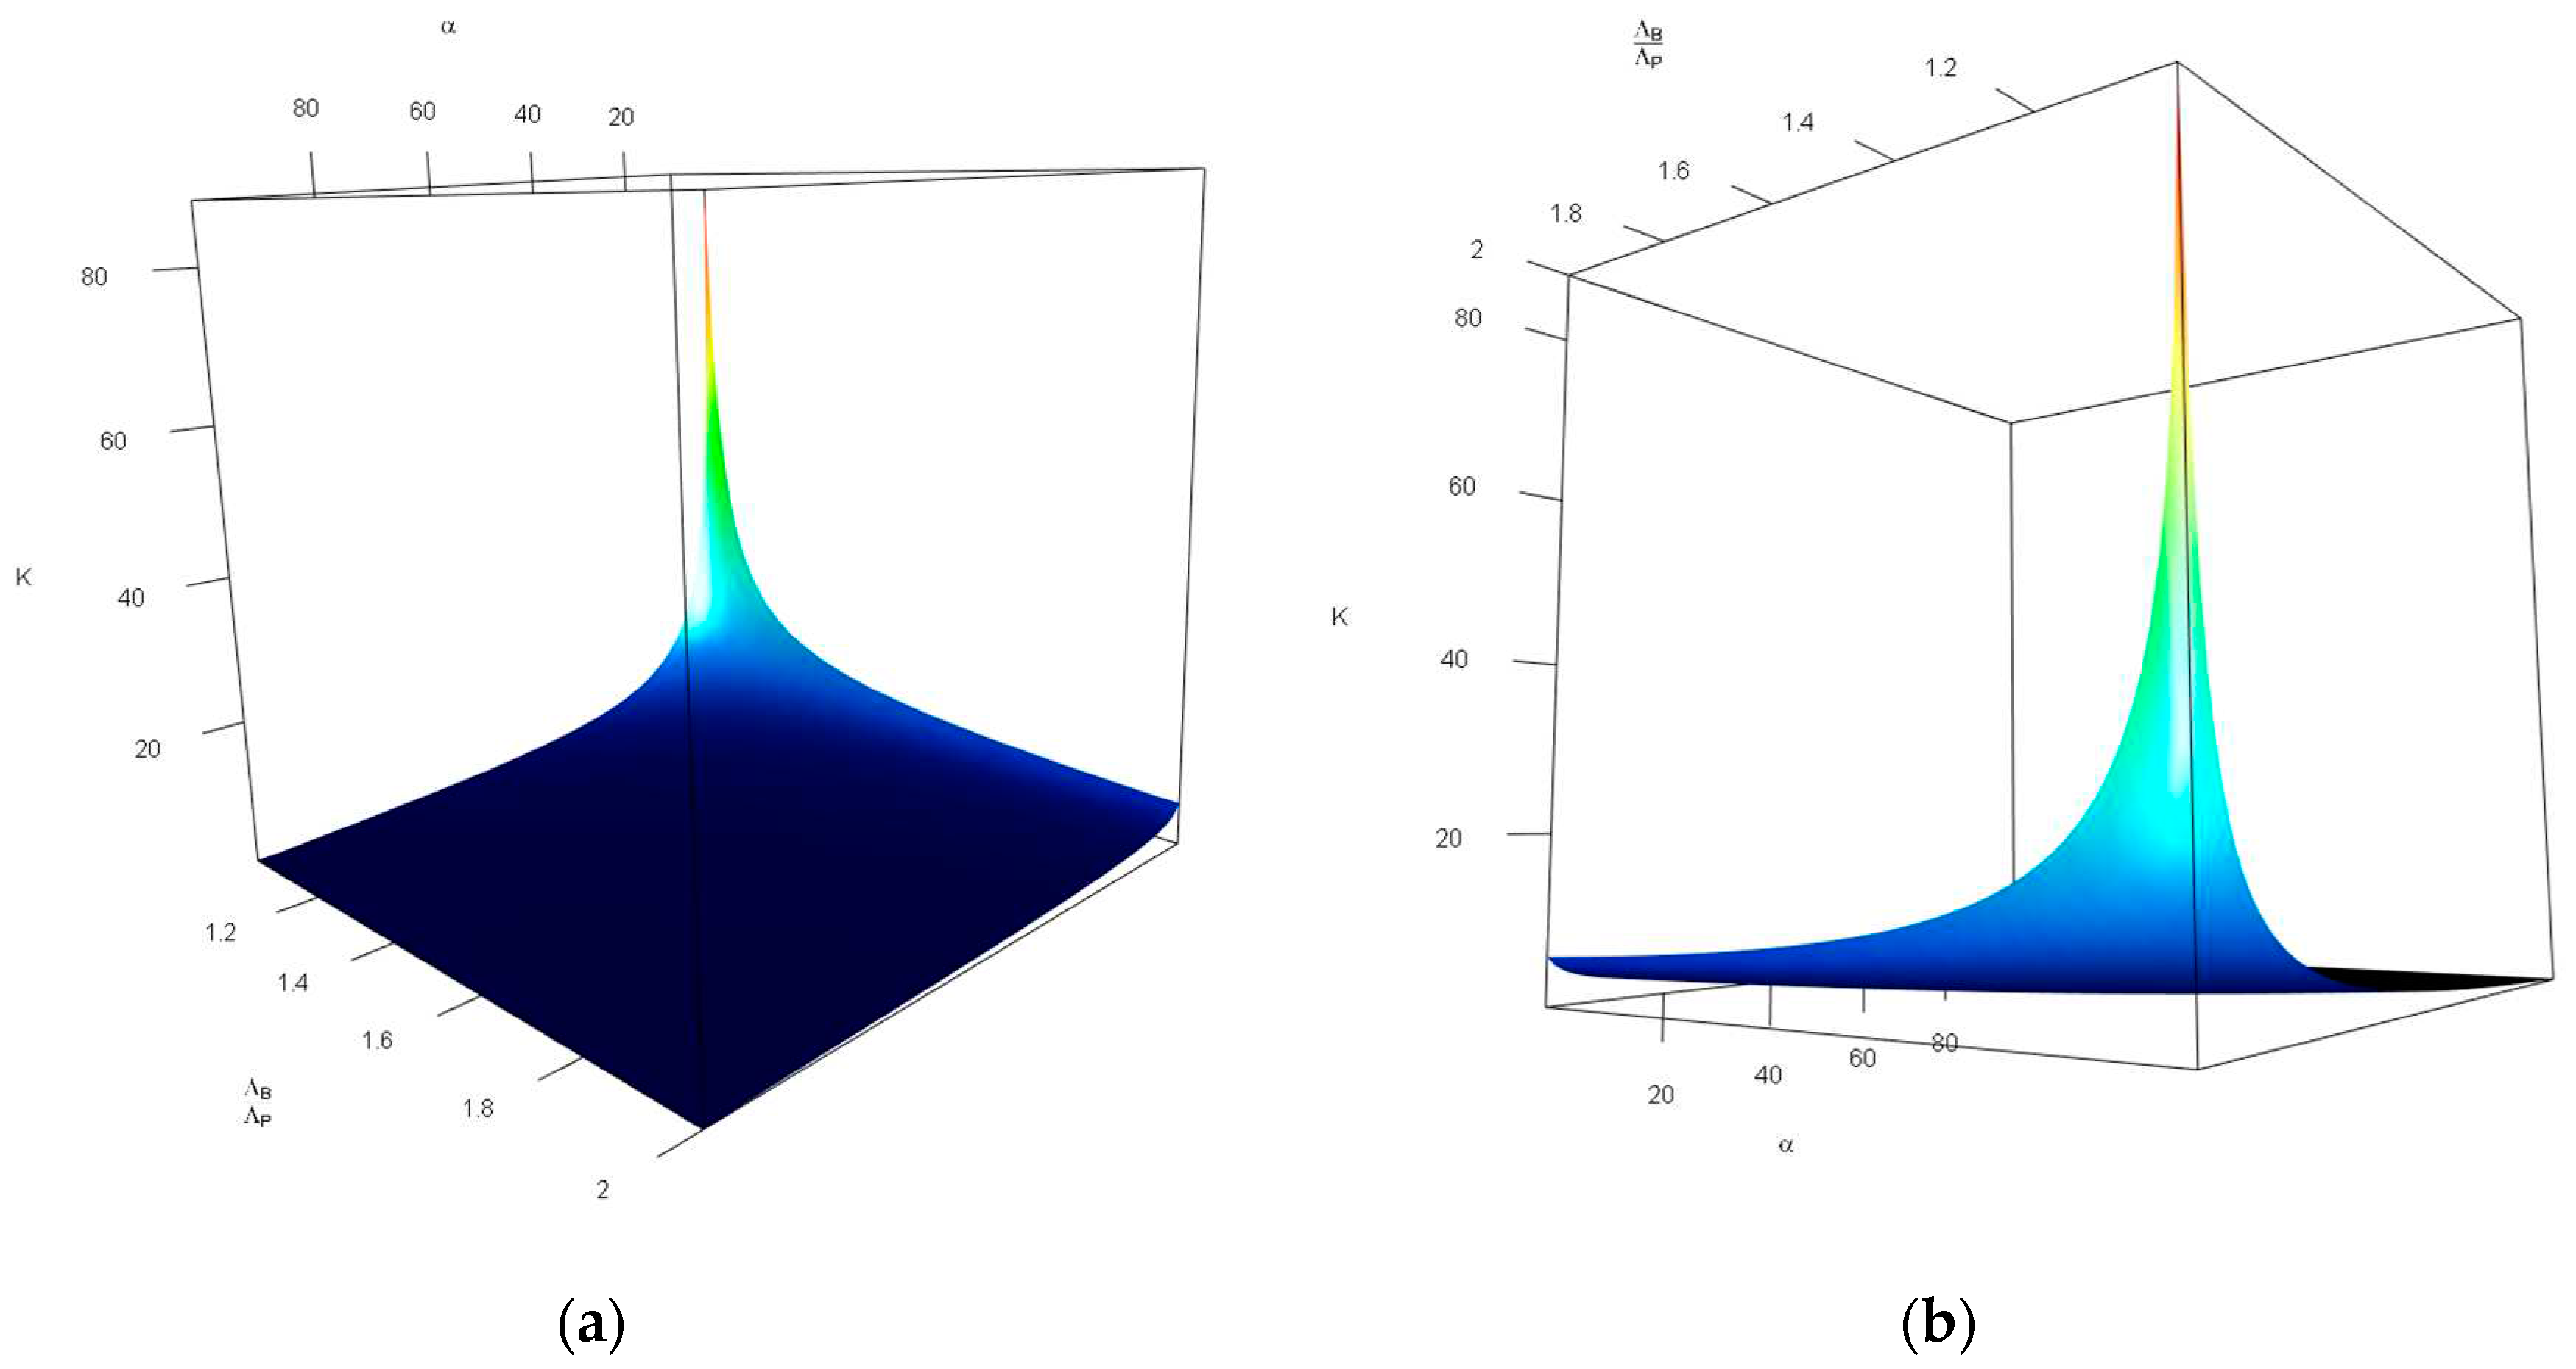
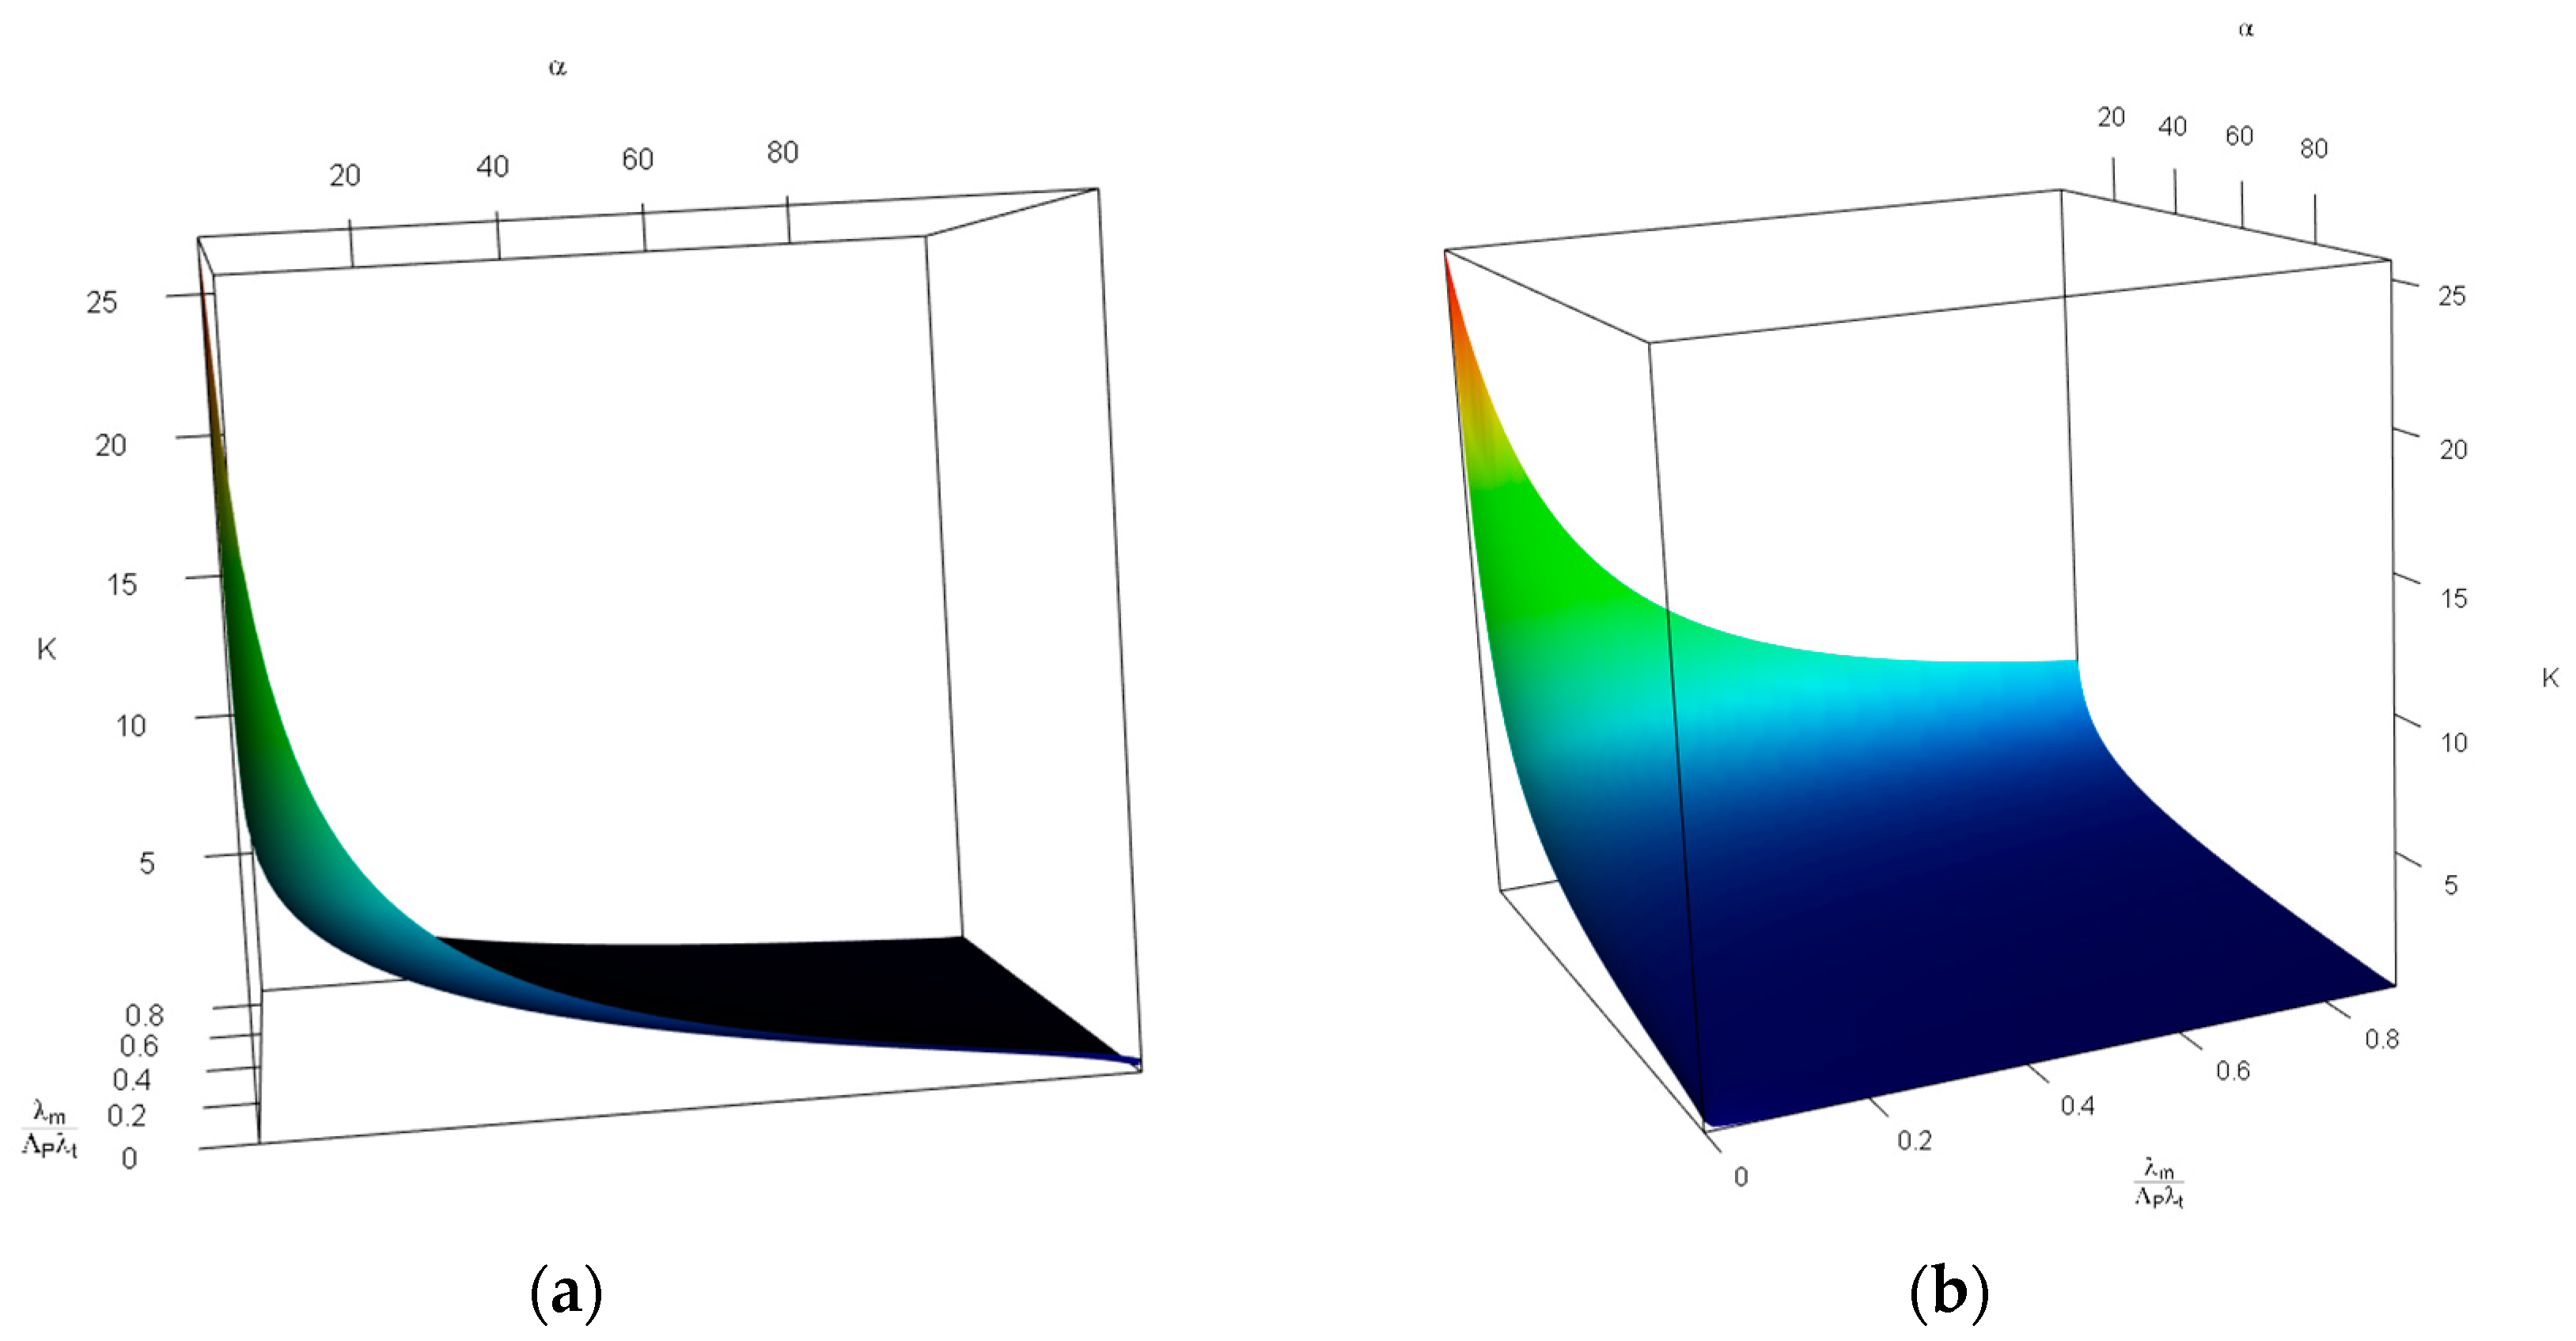
Figure 4 investigates the impact of changes in the probability of tolerable blood unit shortage in percent—
(x-axis, top), and the average blood donors per patient discovered—
(y-axis, bottom) on the storage capacity—
(z-axis, vertical). As can be seen in
Figure 4, the combination of large values of
and small values of
increases
drastically. Otehrwise, small values of
can manage the our expectations. It is intuitive, having in mind that larger
means more tollerations towards the unavailability of blood units and small values of
leads to a lower storage space for blood units—there is a limited number of donors in comparison with patients which means most of the donated blood units are consumed in a short time.
Figure 5 investigates the impact of changes in the probability of tolerable blood unit shortage in percent—
(x-axis, top), and the average patient mortality per patient transfer per patient discovered—
(y-axis, bottom) on the storage capacity—
(z-axis, vertical). As can be seen in
Figure 5, the combination of small values of
and
increases
. We only discuss the impact of large values of
. This means a high patient mortality per patient transfer in comparison with the patient discovery means less storage space requirement; however, this impact is more moderate than that of
—in the latter almost a flat plane is observed.
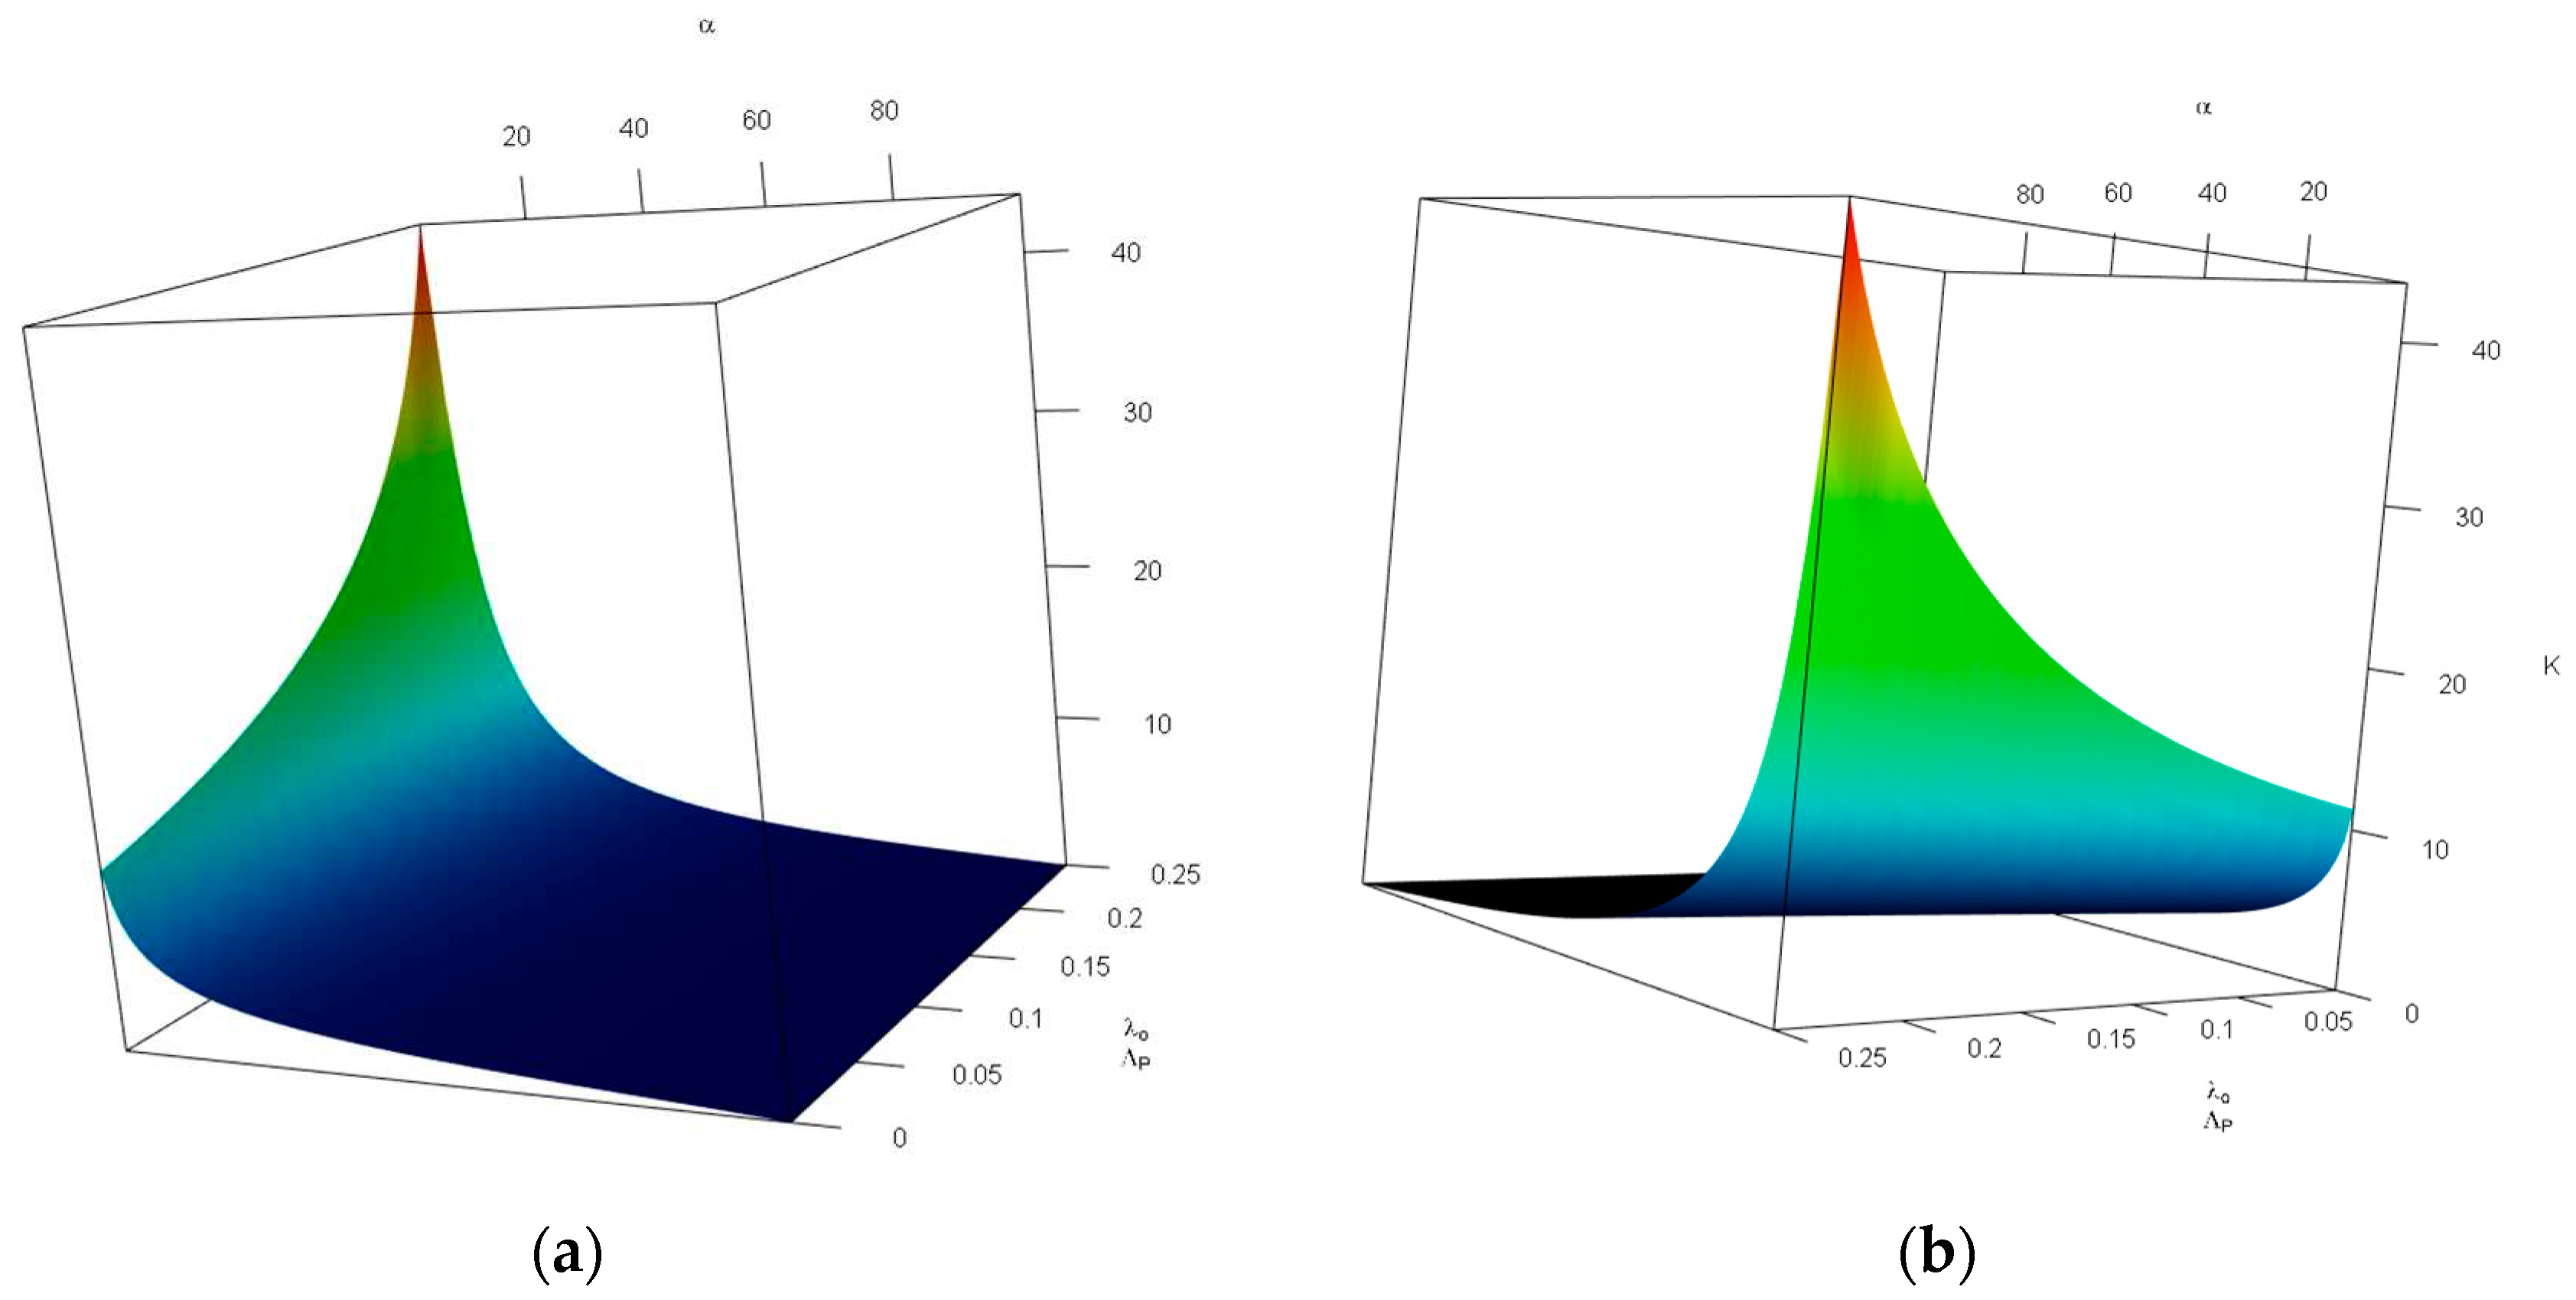
Figure 5 investigates the impact of changes in the probability of tolerable blood unit shortage in percent—
(x-axis, top), and the average local demand per patient discovered—
(y-axis, bottom) on the storage capacity—
(z-axis, vertical). As can be seen in
Figure 6, the combination of large values of
and small values of
increases
. We only discuss the impact of large values of
. In other words, a lower local demand per patient discovery leads to a less storage space requirement; this impact is more severe than that of
—in the latter a flatter plane was observed.
As stated earlier, obtaining
is not easy for two reasons: (a) we need an iterative process to approximate its value (see
Figure 3), and (b)
has a lower bound that means
is not attainable for some
values. Here, we investigate the impact of
,
, and
on
. For simplicity we rewrite Equation (18) as follows:
We wish to remind the reader that
and
are dependent variables—i.e., we can obtain one using the other.
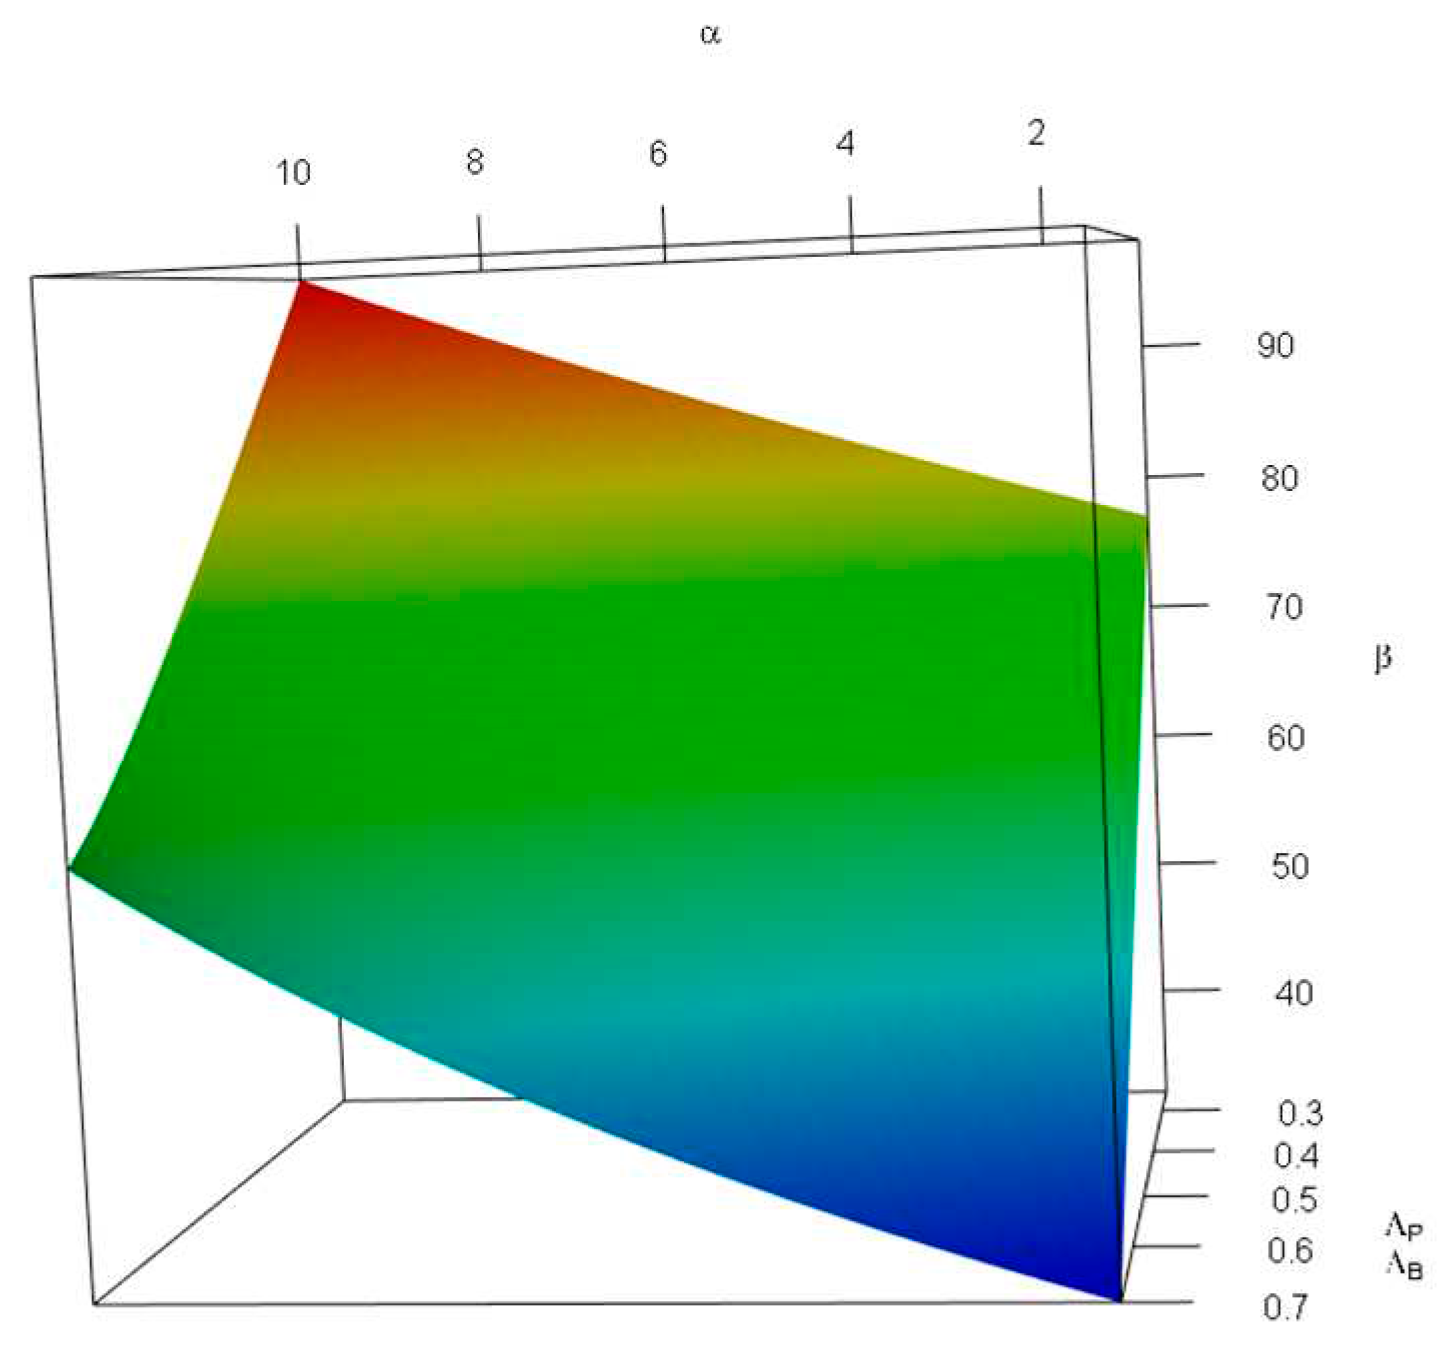
Figure 7 demonstrates the impact of changes in the probability of tolerable blood unit shortage in percent—
(x-axis, top), and the average patient discovered per donor—
(y-axis, bottom) on the probability of not having any further capacity—
(z-axis, vertical). For this figure, we limited
values to the
interval, and
to
—i.e.,
falls in
intervals. We used such intervals to avoid obtaining invalid values of
caused by inconsistency between shortage and rate of patient discovery—the combination of a high probability of shortage and low rates of patient discovery per donor is invalid. As can be seen in
Figure 7,
is an increasing function of
, and a decreasing function of
. This is because, on one hand, more tolerable shortage means less storage capacity; and on the other hand, less patient discovery in comparison with blood donors means a lower demand rate—i.e., the more time blood units need to be stored.
(in percent) for values of , and (in percent), given and .
As stated earlier, the values are applicable for cases wherein some levels of shortage in blood availability is inevitable; therefore, having the stability conditions means .
4. Discussion and Conclusion
In this study, we proposed a blood bank storage design policy to be used for disaster management—e.g., for designing a blood bank near an earthquake-prone area. We proposed a stochastic queueing model facing a coupled Poisson arrival process on both patient’s and donor’s queues. The probabilities of significance—i.e., the probability of having no blood stored in the bank or having no capacity to accept new donors, which then enable us to calculate a closed-form solution for optimal bank storage size given the aforementioned probabilities. We have also analyzed system stability conditions by obtaining acceptable donation and transportation rates, given patient discovery and local demand. These results are applicable in defining the number of allocated vehicles for disaster management purposes and running campaigns to encourage blood donations. Overall, blood collection campaigns are important and shall be designed based on the capacity to avoid donors’ dissatisfaction for reasons such as waiting for a long time or not accepting them because bank storage is full [
12]. The results not only help us to decide about the optimum blood bank size, but they also declare the conditions under which the system stability is guaranteed.
With respect to the results and analysis conducted earlier, the blood bank size cannot be very small. Note that the combination of small values of probability of shortage
and a low ratio of blood donors (
) to patients discovered
means a high storage size. Furthermore, during disasters, there is often a significant increase in the demand for blood. Additionally, rejecting numerous donors can result in their dissatisfaction, and a high frequency of rejection reduces the likelihood of them returning to donate again. Therefore, instead of relying solely on designing campaigns that encourage a larger number of people to donate, we should focus on increasing storage capacity—see
Figure 7 for donors’ rejection rate and
Figure 4 for the relation among
as well as
[
12]. On the other hand, if historical data suggests that the local demand for blood is high, we shall also consider such a demand in designing the blood bank (see
Figure 6).
We wish to remind the readers that in emergencies unmatched Type O Rh-negative (
might be used for patients [
23]. Such an approach persuades us to address the demand and supply for each blood type independently; therefore, although in this study we evaluated the storage capacity for blood donors and patients irrespective of the blood type, the model shall be employed for each blood type once to decide the capacity required. Given the uncertain nature of supply and demand in blood transfusion, it is better to avoid allocating unutilized storage of one blood type to another.
As a future direction of this research, blood perishability for longer periods can be taken into account. The researchers may also study batch delivery of patients or blood, and consider a network of blood banks and smaller storages to study a more realistic situation.
Author Contributions
Conceptualization A. P., A. H. A. S., and N. S.; methodology, A. P., A. H. A. S., and N. S.; software, A. P., A. H. A. S., and N. S.; formal analysis, A. P., A. H. A. S., and N. S.; writing—original draft preparation, A. P.; writing—review and editing, A. P., A. H. A. S., and N. S.; visualization, A. P.; supervision, A. H. A. S., and N. S. All authors have read and agreed to the published version of the manuscript.
