

Submitted:
06 August 2023
Posted:
08 August 2023
You are already at the latest version
Abstract
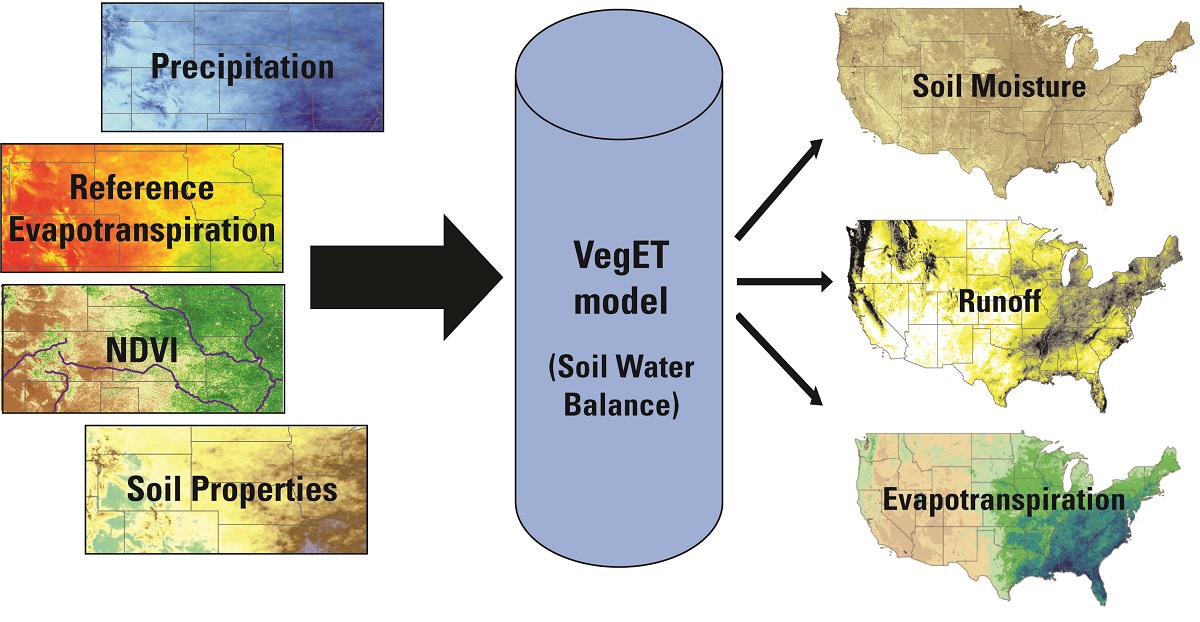
We enhanced the agro-hydrologic VegET model to include snow accumulation and melt processes and the separation of runoff into surface runoff and deep drainage. Driven by global weather datasets and parameterized by Land Surface Phenology (LSP), the enhanced VegET model was implemented in the cloud to simulate daily soil moisture (SM), actual evapotranspiration (ETa), and runoff (R) for the conterminous United States (CONUS) and the Greater Horn of Africa (GHA). Evaluation of the VegET model with independent data showed satisfactory performance, capturing the temporal variability of SM (Pearson correlation r: 0.22–0.97), snowpack (r: 0.86–0.88), ETa (r: 0.41–0.97), and spatial variability of R (r: 0.81–0.90). Absolute magnitudes showed some biases, indicating the need of calibrating the model for water budget analysis. The seasonal Landscape Water Requirement Satisfaction Index (L-WRSI) for CONUS and GHA showed realistic depictions of drought hazard extent and severity, indicating the usefulness of the L-WRSI for the convergence of evidence toolkit used by the Famine Early Warning System Network to monitor potential food insecurity conditions in different parts of the world. Using projected weather datasets and landcover-based LSP, the VegET model can be used not only for global monitoring of drought conditions, but also for evaluating scenarios on the effect of a changing climate and land cover on agriculture and water resources.
Keywords:
VegET model
; soil moisture
; actual evapotranspiration
; runoff
; land surface phenology
; drought
; water budget
1. Introduction
Large-area modeling of rainfall-runoff processes has been an important component of many environmental assessments, particularly for flood early warning [1,2], drought monitoring and impact assessment [3,4], water accounting [5], and hydrologic studies [6,7,8,9,10]. Although hydrologic models vary in their degree of complexity in terms of model components and parameters, the fundamental principle remains the same in that all models are designed to conserve mass through water budget accounting at all time scales over a defined volume. By its nature, large-area rainfall-runoff modeling benefits from spatially distributed inputs and parameters. As the primary driver for all hydrologic models is precipitation, the availability of global satellite-based gridded precipitation data allows model implementation over large basins, continents, and the globe [11,12,13]. Similarly, model-assimilated gridded datasets are available for potential evapotranspiration [14,15,16,17], another key input to hydrologic models. Based on the purpose and desired accuracy, hydrologic models are parameterized to account for water storage and flux quantities over the landscape. Almost all hydrologic models define the soil moisture storage capacity using parameters such as water holding capacity (WHC) derived from soil texture properties [18,19]. More comprehensive models also include snow and canopy interception storage terms [7,8,20]. In addition to storage terms, flux-controlling parameters (surface runoff, drainage, and evapotranspiration) are mainly tied to land cover, soil properties, and climatic factors.
The purpose and availability of data may determine the complexity of the model from short time interval (minutes) flood prediction models to monthly water balance models such as the U.S. Geological Survey (USGS) water balance model [21]. Simple models with one-dimensional (vertical) accounting of fluxes are well suited for drought monitoring and basin-scale water budget studies at longer time scale. For agricultural drought monitoring purposes, simple bucket models that only account for the root-zone water balance status have been used by various modeling groups [3,4,22,23] with numerous simplifying assumptions. One of the early models is the Water Requirement Satisfaction Index (WRSI) by the Food and Agriculture Organization (FAO) [4] that parameterizes the seasonality of crop water use (actual evapotranspiration, ETa) using published crop coefficients (Kc) [24]. The WRSI model is based on the ratio of ETa (as a result of precipitation over a season) to an ideal water requirement of a well-watered crop, which is defined by the potential ET (atmospheric demand) and the seasonally prescribed Kc. Because of the difficulty in defining Kc values over large areas due to unknown crops and/or unreliability of published values outside of their experimental region/continent, the VegET model incorporated Land Surface Phenology (LSP) derived from remotely sensed Normalized Difference Vegetation Index (NDVI) [3]. Evaluation and application of the VegET model showed good performance for ETa [25] and runoff estimation [26].
The original version of the VegET model [3] did not include snow accumulation and snowmelt processes, which limited its representation in snow-influenced landscapes for simulating soil moisture and runoff using the principle of saturation excess [27,28]. Furthermore, the previous version of the VegET model did not partition runoff into surface runoff and deep drainage. The main objectives of this study are to (1) describe the updated components and parameterizations to the VegET model, (2) evaluate the performance of the VegET model using independent data for soil moisture, snowpack, ETa, and runoff, and (3) demonstrate the applications of the updated VegET model for drought monitoring and early warning.
2. Materials and Methods
2.1. Study Area and Data Sources
The updated VegET v2.0 model [29] was implemented over the conterminous United States (CONUS) and the Greater Horn of Africa (GHA) (Figure 1), making use of Open Source Python libraries and leveraging a combination of cloud computing and local servers at the USGS Earth Resources Observation and Science (EROS) Center.
The model uses different input datasets including precipitation, reference ET, air temperature, and soil properties. The data for the CONUS is described in Table 1.
The precipitation, reference evapotranspiration (ETo), and air temperature (Ta) were downloaded from the Gridded Surface Meteorological (gridMET) website [30] and converted from the native netcdf format to geotiff. The air temperature data (daily minimum, maximum, and average) also were converted from Kelvin (K) to degree Celsius (°C) and a median climatology was created from 1984–2017. The Land Surface Phenology (LSP) is based on the Moderate Resolution Imaging Spectroradiometer (MODIS) NDVI provided by National Aeronautics and Space Administration (NASA) Land Processes Distributed Active Archive Center (LP DAAC). A daily median climatology NDVI for 2001–2019 (19 years) was established with linear interpolation from the 16-day dataset. The soil properties included WHC (also referred to as available water holding capacity, AWC), field capacity (FC), and soil porosity (POR). The WHC represents the difference between FC and the wilting point (WP). Detailed information on the soil data can be found in [33]. The schematic representation of the WHC and associated parameters are shown in Figure 2.
The interception data were created from the MODIS Vegetation Continuous Fields (VCF: [35]) in proportion to a pixel’s percentage of tree, herbaceous, and bare coverage using Equation 1 [3]:
where is the tree cover layer (%) with a maximum interception of 15%; is the herbaceous cover layer (%) with a maximum interception of 10%; and is the bare ground cover layer (%) with no interception.
Input datasets for GHA are described in Table 2. The precipitation data source is Climate Hazards Group InfraRed Precipitation with Stations (CHIRPS) [36], which uses remote sensing data in combination with station information to create a dataset suitable for crop monitoring and hydrologic applications. The LSP was created using MODIS NDVI (Aqua and Terra) to generate a 15-year median climatology (2003–2017) and then interpolated linearly from the 8-day time step to daily. The reference evapotranspiration (ETo) was obtained from NOAA [37]. Air temperature (minimum, maximum, and mean) was sourced from Climatologies at High resolution for the Earth’s Land Surface Areas (CHELSA); the monthly climatology from 1981 to 2010 was interpolated linearly from monthly to daily and converted from K to °C units. The soil property raster data were provided by the International Soil Reference and Information Centre (ISRIC – World Soil Information) through their Soil Data Hub [38]. A list of soil parameters was extracted to generate WHC, FC, and POR: AWCh3_M_Sl6_250m_II.tif, (WWP_M_sl6_250m_II.tif and AWCh3_M_Sl6_250m_II.tif), and AWCtS_M_sl6_250m_ll.tif. POR layer was used to represent the soil saturation (SAT) level. To convert the raster data from volumetric percent representation (m3/m3) to depth (mm) per meter root-zone, they were multiplied by a unit conversion factor of 10 ((soil raster * 1000)/100). Additionally, the SAT value was capped to not be lower than FC. Interception was determined using Equation 1.
2.2. Model Formulation
2.2.1. Original model setup
The original VegET model by [3] was developed to timely process and integrate readily available global weather and remote sensing datasets using water balance modeling techniques for drought monitoring purposes. ETo, a soil stress coefficient (Ks), and a phenology-based crop coefficient (Kcp) are used to determine daily soil moisture, runoff (R), and ETa using the root-zone as the control volume (Figure 2). The soil water level is determined using a daily soil water balance using Equation 2.
where SM is soil moisture (mm), Peff is effective precipitation (mm), ETa is simulated actual ET (mm) and i represents the current day and i–1 represents the previous day. ETa is calculated using Equation 3 as follows:
where Kcp is the LSP-derived landscape “crop” coefficient (-); is soil water stress coefficient (-), and ETo is the grass reference ET (mm).
The innovation in the VegET model is on the calculation of Kcp, which is comparable to the Kc that is widely used by agronomists [40]. The key difference between the two parameters is that Kcp is derived from remotely sensed data as opposed to region-specific field experiments for Kc. Kcp represents both the spatial and temporal dynamics of the landscape water-use pattern on a grid basis. LSPs are characterized and converted into Kcp parameter functions for each modeling grid from NDVI climatology datasets with the assumption that the LSP climatology represents the target vegetation condition of the landscape where water requirement is met by precipitation. Thus, ETa is calculated using the modified version of the classical crop coefficient approach [24] using the LSP-derived crop coefficient.
Ks is determined from a soil water balance model like the one developed by [22] for USGS Famine Early Warning Systems Network (FEWS NET) applications using Equation (4) and (5). The dimensionless Ks coefficient varies from 0 to 1 depending on the soil water level in the root zone and is calculated as:
where SMi is the soil water of current time step in depth unit (mm); MAD (mm) is the maximum allowable depletion level of soil water in the root zone below which the vegetation ETa is less than “potential” and will be constrained by the availability of soil water.
Although MAD varies by crop/vegetation type, a nominal value of 50% of the WHC can be used for most generalized crops, such as cereals and natural vegetation. Thus, MAD was estimated as 50% of the WHC (i.e., 0.5 * WHC). More discussion on the setup and application of the soil water balance model for operational crop monitoring is available in [22].
The model estimates a combined surface runoff and deep drainage based on the principle of saturation excess where soil water in excess of the WHC is considered to be unavailable for plant use in the root zone; thus, SMi is set to a maximum of WHC and a minimum of 0 during the modeling time step.
where R is total runoff (surface runoff and deep drainage); WHC is soil water holding capacity (mm), i.e., the difference between FC and WP (Figure 2).
2.2.2. Model Updates
The original VegET model has been updated with improved parameterization to be more inclusive of hydrologic processes and for computing efficiency. The new modifications to the model include the incorporation of snowpack and snowmelt processes and the separation of runoff into surface runoff and deep drainage. Furthermore, parameterization of the LSP has been simplified to use a set of linear equations without the need to specify the minimum and maximum Kc that was part of the original formulation.
Figure 2 shows the schematic representation of the updated VegET v2.0 model [29]. Interception losses are first estimated to determine effective precipitation using the MODIS VCF (Equation 1). Effective precipitation (Equation 2) is split into rain and SWE (snow water equivalent) to enter the Soil Water Store (soil moisture) or Snow Water Store (snowpack) based on a temperature-index (Equations 10–13) approach [41]. MODIS NDVI is used to create the LSP for the Kcp function (Equations 8–9). Rn (net radiation), Ta (air temperature), U (wind speed), RH (relative humidity), and r (atmospheric pressure) are parameters used to estimate ETo (reference ET). Kcp and Ks are critical parameters to calculate outfluxes: surface runoff, deep drainage, and ETa. The Soil Water Store is defined by the soil-texture properties. Saturation (SAT), defined in the model, is equivalent to soil porosity (POR) from the soils database [38]; FC defines the maximum amount of water retention by the soil matrix that is available to plants; and WP (permanent wilting point) represents the water retention level at which point plants are unable to access moisture. WHC (difference between FC and WP) is the readily available water for plant access, but plant stress occurs in proportion to the remaining soil moisture (SM) once SM reduces below the MAD limit (Equations 4–5). Runoff (R) is generated once SM is in excess of WHC (Equations 6–7). All SM in excess of SAT will be surface runoff, but SM that is within SATfc (between SAT and FC) will be split into surface runoff and deep drainage (Equations 17–20). L-WRSI (Landscape-Water Requirement Satisfaction Index) is determined using ETa and landscape water requirement (ETc) (Equations 21–22). The VegET model is initialized with empty (0) amounts for SM and snowpack with a one complete year spin-up period.
Land surface phenology and landscape coefficients (Kcp)
The crop coefficient (Kc) determines the ideal (water unlimited condition) demand of the crop based on the type and stage of the crop [24]. In VegET, the crop water requirement (demand) is replaced with the landscape water requirement. The traditional tabular Kc by Allen et al. [24] is replaced by the phenology-based Kc known as Kcp. The main assumption is that the NDVI-derived Kcp represents the landscape “crop” water requirement in regions where a major land cover change does not occur for a large area. For example, the Land Change Monitoring, Assessment, and Projection (LCMAP) group indicates a less than 1% land cover change per year on average over the CONUS [42]. For drought monitoring purposes where the VegET is applied, the main goal is to determine if the precipitation amount and distribution meet the average demand of the landscape. The use of a climatology NDVI creates smoother and more realistic seasonal water use patterns compared to Kc, but it may underestimate the demand during years of vigorous vegetation activity. However, its effectiveness for drought monitoring would not be affected under such favorable wet conditions. Figure 3 illustrates the development and seasonal progression of LSP-based Kcp derived from climatology NDVI and its schematic Kc equivalent.
Snowpack and snowmelt
The updated VegET model accounts for snowpack and snowmelt processes using air temperature-based empirical equations by [41]. A given day’s precipitation is split into rainfall and snow water equivalent based on air temperature thresholds.
where is the rain fraction of precipitation that falls as rain (as opposed to snow) based on daily average air temperature Tavg for that day. If Tavg for a given day is below 0 °C, all precipitation is assumed to fall as snow ( if Tavg is above 6 °C all precipitation is assumed to be rainfall (; if Tavg is between 0 and 6 °C, the rain fraction is interpolated using Equation (12).
The rainfall and snow (snow water equivalent, SWE) components are then partitioned as follows:
where is the snow water equivalent (mm) and (mm) is the effective precipitation (precipitation minus canopy interception losses), determined using the interception parameters from Equation 1. The rainfall component is simply a product of the and while is the difference between and the rainfall (rain) component (Equations 10–12).
The consideration of the timing of accumulation and melting of snow is useful for regions where snowpack (Snow Water Store) retains the precipitation instead of immediately releasing it as runoff during a cold season. The snowpack accumulates and melts based on the addition of new SWE and melting of snowpack using a daily snowpack () balance. The daily snowmelt is calculated based on the melt (mm) rate as:
where 0.06 is the melt factor (mm/°C 2), is the daily maximum air temperature (°C), and is the daily minimum air temperature (°C). The equation was adapted from [41]. All snow related parameters such as snowpack and melt are expressed in SWE forms.
where is the current snowpack in SWE unit (mm); is the previous day’s snowpack (mm); is the additional fresh snow in SWE unit (mm) and is today’s snowmelt in SWE unit (mm) on the current day (i).
Deep drainage and surface runoff partitioning
The original VegET model estimates total runoff without the separation of quick flow (surface runoff) and deep percolation (deep drainage). A simple approximation coefficient is used to differentiate the quick flow (part of the total runoff that joins the stream network as overland flow) from the deep drainage (part of the flow that may combine interflow and deep percolation to groundwater). Although the separation of surface runoff and deep drainage does not affect the soil moisture and ETa estimation, the potential application of the VegET runoff in flood and streamflow simulation could benefit from this separation. VegET does not have a flow routing routine; therefore, runoff from one pixel does not affect soil moisture and evapotranspiration (ET) on nearby pixels. It is important to note that the VegET model is more optimized to simulate ET; thus, its use for hydrologic applications would benefit from more investigation, evaluation, and refinement.
In the updated VegET model, the deep drainage (dd) amount is estimated as the difference between total runoff (R) (Equations 6–7) and surface runoff (srf) as follows:
where R is determined as daily SM in excess of the soil water holding capacity; is estimated based on the daily soil water, a quick-flow (qc)/drainage (dc) coefficient, soil saturation (SAT), and field capacity (FC) parameters (Figure 2):
where SATfc is the difference between SAT and FC; qc is the quick flow coefficient, which is a complement to the drainage coefficient (dc) as qc = 1 – dc. In this study, a uniform value of 0.35 is used for qc as a first approximation; however, this partitioning coefficient is expected to vary by soil type and topography, and thus a calibration procedure is required to estimate this coefficient more accurately.
2.2.3. Evaluation Data
The VegET model output parameters were evaluated using limited illustrative data from the Soil Climate Analysis Network (SCAN) [45] measurements for soil moisture, snow measurements from SNOpack TELemetry (SNOTEL) [46], AmeriFlux Network and FluxNet 2015 [47,48] measurements for ETa, and runoff data from the USGS [49] (Figure 4).
Evaluation for soil moisture
One of the outputs of the VegET model is the daily soil moisture for a 1-m (39-inch) root zone. VegET SM was evaluated using SCAN data provided by the Natural Resources Conservation Service (NRCS) of the U.S. Department of Agriculture (USDA) summarized Table 3 [45]. Data for the growing season of May to September 2019 were used. The daily soil moisture measurements for five different depths (2 inches, 4 inches, 8 inches, 20 inches, and 40 inches) were averaged and converted from volumetric water content (m3/m3) percentage to depth of water per meter depth (mm/m) with a unit conversion factor of 10.
Evaluation for snow water equivalent
Evaluation for actual evapotranspiration
The ETa results from the VegET model were evaluated using eddy covariance (EC) flux tower data from the AmeriFlux network [47]. For this evaluation, three EC towers were selected (Table 5) across the CONUS for availability of data to represent rainfed systems simulated by VegET. The locations of the towers are shown in Figure 4. Monthly data were obtained from the FLUXNET2015 dataset [48].
Evaluation for runoff
The VegET runoff (R) was evaluated against independent runoff obtained from the USGS WaterWatch [49] at 8-digit hydrologic unit code (HUC8) scale [50] across the CONUS (Table 6). The runoff data are generated from historical flow observations at the USGS streamgage locations, drainage basin boundaries of the streamgages, and the HUC8 boundaries [51]. The daily VegET runoff were summed by water year and the pixel values were spatially averaged within the HUC8 boundaries to obtain a single value and compared with the runoff (non-spatial single value) for water years 2012 (dry year), 2016 (wet year), and 2018 (average year). The HUC8s with high runoff values from the USGS WaterWatch were excluded from the comparison. For example, runoff more than 40% of precipitation (R/P > 40%) with potential regional groundwater flow contributions and possibility of watershed water balance closure issues [52,53].
3. Results and Discussion
3.1. Water Balance Components
The VegET model produces several parameters, fluxes, state variables, and indices including interception losses, rainfall, snow water equivalent, snowpack, snow melt, soil moisture, surface runoff, deep drainage, actual evapotranspiration, landscape water requirement, and the drought monitoring product L-WRSI [54]. Figure 5 provides an illustrative overview of the model inputs, outputs, and parameters for a flux tower location in Minnesota.
Figure 5(a) shows precipitation and NDVI as a reference for providing an overview of the water supply and vegetation demand over the year. Precipitation is the main input and NDVI is an important rate controlling parameter representing the state of vegetation and its water use phenology. Figure 5(b) includes soil moisture level, snowpack, deep drainage, and surface runoff. The soil moisture (SM) shows a steady increase once snowpack decreases due to melt and additional rainfall and remains high for much of the spring with small variability around 150 mm, which is close to WHC =160 mm. We note that no runoff component is generated during the summer, which requires SM to exceed the WHC. SM shows a substantial reduction in mid-August due to reduced precipitation events in frequency and magnitude, which leads to a reduction in ETa (Figure 5(c)). When SM reduces below the MAD level (half of WHC), ETa (green line, Figure 5(c)) will be lower than landscape water requirement (ETc) (Figure 5(c)), which leads to a deficit. The ETc is created as the product of ETo (Figure 5(c)) and Kcp.
VegET takes spatially explicit inputs and parameters and produces spatially explicit outputs, making it useful to create a continuous surface for agro-hydrologic applications. The annual ETa maps for CONUS are shown in Figure 6, in which water years 2012, 2016, and 2018 represent a drier year, a wetter year, and an average year, respectively. The drier landscape responses (ETa < 400 mm/yr) are noticeable for 2012 in large parts of Nebraska, Kansas, and Texas where drought conditions were reported by the U.S. Drought Monitor [55].
The calculation of ETa depends heavily on SM because reduction from ETa begins when SM falls below the MAD level. Due to differences in soil texture, maps of normalized SM as percentage of the WHC across the CONUS is shown in Figure 7 for selected days (1 October, 1 January 1 April, and 1 July) during water year 2018. In this example, the relative SM in the soil started out low in October after the end of the growing season and increased over the next months until April. In July, SM showed a general reduction, especially in the southwestern CONUS.
The major improvement in VegET v2.0 model [29] is the inclusion of the snowpack and snowmelt processes. Figure 8 shows the state of snowpack based on the simple temperature-index algorithm to accumulate and melt the snow. As expected, the largest coverage of snowpack was observed on 1 January (Figure 8(b)) and the least snow was on 1 October after the summer (Figure 8(a)). Because of the simplicity of the model, only the relative magnitudes are reliable, which is sufficient for drought monitoring purposes. These maps are useful when comparing relative snowpack build-up and timing of melt across regions and years.
3.2. Evaluation
Although VegET products are not calibrated with independently measured datasets and are not expected to be highly accurate in magnitude, the relative distribution in time and space can be evaluated. Illustrative comparisons with in situ observations for soil moisture, snowpack, ETa, and runoff are presented below.
3.2.1. Soil Moisture (SM)
VegET estimates SM for the entire 1-m (39-inch) depth root zone; SM represents the readily available water for plants, i.e., with a soil suction pressure between FC and WP. Comparisons with observed measurements from three different sites in the SCAN network are illustrated in Figure 9 for the growing season from 1 May to 30 September, 2019. The sites located from north to south have different characteristics for soil properties and precipitation. Crescent Lake #1 (Figure 9(a)), Minnesota, received about 900 mm of precipitation in 2019 with a WHC = 70 mm. The temporal patterns of observed and simulated SM show a strong agreement (Pearson correlation r = 0.82). However, the observed SM shows a much higher magnitude. This can be attributed to the fact that the simulated SM only accounts for the amount of water between FC and WP with any moisture above FC (gravity water) that is assumed to be excess and would drain from the root-zone as runoff. The Fort Reno site (WHC = 190 mm) in Oklahoma (Figure 9(b)) portrays similar strong temporal agreement (r = 0.97), with observed SM showing much higher magnitudes and comparable decreasing rates during the growing season with limited precipitation events and amount. At the drier (~400 mm annual precipitation) New Mexico site (WHC = 140 mm), not only the temporal agreement is weak (r = 0.22), in contrast to the other two sites, the observed SM is lower than the simulated SM. This is probably due to overestimated WHC (140 mm) data used in the model, causing even greater estimation than the Minnesota (Figure 9(a)) site (WHC = 70 mm). This highlights the importance of acquiring accurate quality soils data for hydrologic modeling.
Despite the differences in absolute magnitude, the simulated SM shows satisfactory performance in terms of capturing the temporal variability, which is key for ETa estimation and drought monitoring applications.
3.2.2. Snow Water Equivalent (SWE)
Snow water equivalent (SWE) of snowpacks at three SNOTEL sites over six years (2015 –2020) was used for evaluation. Generally, agreement is good (r: 0.86–0.88) on the timing and duration of SWE accumulation at the three sites (Figure 10). Although the magnitude is reasonable at the Cole Canyon site (Figure 10(a)), bias is large at Columbine Pass (Figure 10(b)). The Sierra Blanca (Figure 10(c)) site shows a good agreement on timing and mixed results on bias in water-year 2016, with a reasonable agreement during 2017–2020. The difference in magnitude can be partially attributed to errors in gridMET dataset used in VegET, which underestimated precipitation by as much as 200 mm for a calendar year at Columbine Pass. Furthermore, any differences between actual air temperature and simulated air temperature could cause discrepancy in the timing of melt and magnitude of snowpack. In winter, the average temperature input in the VegET model exceeded the average temperature recorded by SNOTEL by 1.5 °C at Cole Canyon, whereas Columbine Pass temperature input into VegET was warmer by 7.7 °C on average, which explains some of the differences in snow accumulation between the two sites.
Although large biases in snowpack SWE magnitude exist at a few sites like Columbine Pass (Figure 10(b)), the consistent performance of VegET for timing and duration makes it useful for monitoring water availability in areas of the world with limited in situ observations. Moreover, relative variations in SWE are more important than actual magnitudes for predicting relative changes in river flows for irrigation. The simplified snow module in VegET can be used to provide valuable and timely insight into yearly changes and trends in snow accumulation and melt over watersheds and regions as well as to generate future scenarios with projected climate datasets.
3.2.3. Actual Evapotranspiration (ETa)
VegET ETa was compared to EC ETa over several years (Figure 11) using monthly ETa data obtained from the FLUXNET2015 dataset [48] for the following sites: US-AR1 (2009–2012), US-Ne3 (2009–2012), and US-Var (2009–2012). Because of the strong connection between ETa and biomass/yield, the performance of VegET ETa is crucial for accurate biomass estimation and drought monitoring.
Although the general seasonal pattern of VegET shows good agreement with the observed ETa, there are some seasonal inconsistencies in the two sites (US-AR1 and US-Ne3). VegET ETa captures well the winter and spring ETa at all sites but tends to show a relatively dry condition compared to the observed ETa in the summer during reduced precipitation periods at US-Ne3 and US-AR1. One explanation is that the footprint of the EC tower may include ETa from landscapes that have access to additional sources of water such as groundwater by deep-rooted trees or from nearby irrigated fields, especially for the Nebraska site (Figure 11(b)). The Oklahoma grassland site (US-AR1, Figure 11(a)) shows reasonable agreement in 2009 and 2010 but showed an out-of-phase behavior in 2011 and 2012. There was a reduction in precipitation during the summer of 2012, which is reflected in VegET ETa, but the EC tower shows a high ETa, contrary to the expected drought-year response. Furthermore, the EC data for the winter months of 2009 (January –March) show unrealistically high values compared to other years, casting doubt on the accuracy of the EC data from this site.
The simulated ETa from VegET corresponds consistently to precipitation, usually exhibiting increases in ETa with a month lag, after peak precipitation in the summer (Figure 11(a)-Figure 11(c)). Except for US-Var (Figure 11(c)), the peak seasonal ETa from VegET generally lags behind the peak ETa recorded by the EC tower. This is reflected in the lower r statistic in the comparison of US-AR1 and US-Ne3 (r = 0.41 and r = 0.76, respectively) (Figure 11(a) and Figure 11(b)) relative to US-Var (r = 0.97) (Figure 11c) where it performs favorably in both pattern and magnitude. A further investigation with more sites would be useful to help understand and characterize the spatiotemporal dynamics of the performance of the simulated ETa.
The monthly temporal patterns of simulated ETa at point locations and the annual ETa maps over CONUS are consistent with seasonal and regional patterns of vegetation and precipitation in the CONUS. This reinforces the proposed application of the VegET model for quantifying green-water ETa (from precipitation and soil moisture), which is an important parameter in the determination of net irrigation water use (blue water) as the difference between total ETa from energy balance models and VegET ETa as suggested by [25].
3.2.4. HUC8 Runoff
Although the main purpose of the VegET model is to estimate precipitation-driven landscape ETa to develop an integrated drought monitoring product L-WRSI, one byproduct of VegET is runoff, which can be evaluated with independent data sources. The annual total runoff from VegET was compared with the model-assimilated observed runoff from the USGS WaterWatch [49] to evaluate the performance of VegET runoff in capturing the spatial variability across HUC8 watersheds over three years. Correlation coefficients above 0.80 for all water years show a reasonable performance of VegET runoff for capturing the spatial dynamics. The VegET runoff values are lower than WaterWatch runoff values for the filtered HUC8s (R/P ≤0.40) for all water years as shown in Figure 12. The underestimations of VegET are within 5% (≤ 7 mm/yr) for water years 2012 and 2016, and within 15% (≤24 mm/yr) for water year 2018 (Figure 12, Table 7). The root mean square error (RMSE) values are relatively high with an average of 62%, indicating uncertainties over individual HUC8s while capturing the overall spatial dynamics. The performance of the VegET model improved substantially for runoff estimation when the R/P ≤0.40 was applied (Table 7). With the R/P (<=0.4) filter, the model bias reduced for all three water years with the largest reduction of 15.6% (from -20.2% to -4.6%) for 2012 (dry year) and the least of 9.2% (from -23.9% to -14.6%) for 2018 (average year).
Figure 13 shows major water balance components for the Upper Mississippi River Basin including precipitation, actual evapotranspiration, and runoff, along with their monthly variations for the water year 2012. Areas of higher precipitation correspond with higher VegET-simulated ETa and R, as expected, capturing the general spatial distribution of major fluxes. Also, seasonal runoff dynamics compare well between VegET (simulated) and WaterWatch (observed) in relative terms, with higher runoff during spring (March-May) and peak runoff in May (both for VegET and WaterWatch). However, there is a large difference in the monthly R values between the observed and simulated, indicating that calibrating the model and improving the parameterization of the runoff are warranted. The combined ETa and R account for about 93% of water year total precipitation, with the remaining fraction attributed to interception (~8%) and change in storage (~-1%).
Despite the bias and uncertainty, the overall performance of the VegET runoff is satisfactory for an uncalibrated model. Potential sources of errors could be attributed to the gridded precipitation input and model parameters. For example, if gridded precipitation is lower than the actual amount fallen over a basin, the VegET runoff will certainly be lower than the observed. The relative accuracy of VegET runoff is not critical for the estimation of ETa as ETa is assigned a priority in the calculation using the saturation excess principle, i.e., runoff is generated once the root-zone is filled with enough soil moisture.
The annual runoff comparison provided good results with percent bias less than 15% (with R/P<=0.40 filter) for all water years. The percent bias is acceptable considering these are an uncalibrated results from a simple bucket model to handle complex physical processes that are often unique to each watershed. It is possible that the performance of VegET model varies across HUC8 watersheds, and the single threshold (R/P <= 0.40) filter applied to the CONUS-scale study may not represent the water balance characteristics of each watershed. However, the VegET model can be calibrated and optimized when finer scale spatial information is needed.
4. Case Study Applications
The spatially explicit Landscape Water Requirement Satisfaction Index (L-WRSI) is an indicator of landscape performance akin to the well-established WRSI for monitoring crop production based on the availability of precipitation and soil moisture to meet crop or landscape water requirements (ETc) during the growing season [22]. L-WRSI can be estimated as the ratio (%) of seasonal ETa to the seasonal ETc. Similar calculations are used for L-WRSI where Kcp is used instead of Kc to define the landscape water requirement phenology as follows:
where is the sum of ETa (mm) for the selected time period (month, season, year); is the sum of the landscape water requirement (mm) for the selected time period and denotes landscape-specific ETo after an adjustment is made to the reference crop ETo by the use of the LSP coefficient (Kcp). Kcp values define the seasonal water requirement patterns of the landscape.
Figure 14 illustrates the concept of the L-WRSI. The gray (ETc) and green (ETa) lines are the two components creating the L-WRSI. The difference between the two lines indicates the water deficit during insufficient precipitation, which leads to the reduction of the L-WRSI from 100%. The annual (January–December) and seasonal (May–September) cumulative deficit are represented by L-WRSI values of 85 and 89, respectively, i.e., 85% and 89% of the median landscape water requirement, met by precipitation, for the year and the season in 2018. The main deficit in the growing season was observed in July with a relatively low amount of precipitation. However, the 11% deficit for the season may not necessarily reflect an actual water deficit that would lead to a proportional yield reduction due to uncertainties in model inputs and assumptions; however, the relative magnitude in space and time could be used for drought monitoring and early warning by comparing the index across years and regions.
The L-WRSI values for the CONUS and GHA were calculated and used to illustrate their agro-hydrologic applications for drought monitoring. L-WRSI is an integrated index that includes precipitation, atmospheric demand, phenology, and soil properties.
4.1. CONUS
Figure 15 shows seasonal L-WRSI for three years, namely 2012, 2016, and 2018. L-WRSI less than 100 indicates some form of water stress. Generally, L-WRSI > 95 is considered optimal and less than 80 indicates a serious precipitation shortfall that may lead to a substantial biomass and yield reduction for crops. A crop WRSI < 50 indicates crop failure and need for irrigation to grow crops. It is important to note that L-WRSI is calculated based on availability of moisture in the 1-m root-zone and does not take into account potential access to groundwater by deep-rooted trees and shrubs. This is one explanation why L-WRSI shows lower values (Figure 15) during the growing season in the southeast (e.g., Georgia) where the vegetation demand could be partially met by groundwater resources for the tree-dominated landscapes. It also explains the supplemental irrigation requirement for growing crops during the growing season in the region.
For the country-wide assessment, L-WRSI was grouped into four qualitative categories of Good (L-WRSI > 95%), Fair (80-95%), Poor (50-80%), and Severe Damage (L-WRSI < 50%). A summary of the L-WRSI by croplands [56] of the CONUS (Figure 16) shows the drought year of 2012 had 66% of the CONUS under severe damage whereas 2016 and 2018 experienced severe damage to a lesser extent (26-27%). The extent observed in 2016 and 2018 may represent the areas that normally require irrigation for crop production. Such kind of metric would allow the expression of the impact of a drought year relative to a normal year. In this case, one could say the 2012 damage was twice as severe as that of 2018 (an average precipitation year).
4.2. GHA
L-WRSI was generated for the Greater Horn of Africa where frequent droughts create serious food insecurity challenges (Figure 17). In the GHA region, the L-WRSI is combined with other drought monitoring products such as NDVI and hydrologic indicators to develop the convergence of evidence framework needed for food insecurity assessment by FEWS NET. Figure 17 shows 3-month L-WRSI ending on the named month. For example, January 2018 L-WRSI comprises the ratio of ETa to ETc for the months of November 2017, December 2017, and January 2018. The spatial distribution of L-WRSI in the different seasons shows the complex nature of precipitation and vegetation pattern in the region. L-WRSI values can be summarized by district or watershed over a historical period to understand the relative performance of the landscape across regions and time periods.
As opposed to the existing WRSI product of FEWS NET [22] for crop monitoring, the current continuous 3-month L-WRSI brings enhanced features of (1) the L-WRSI is continuous in space because the Kcp is generated from the NDVI-based LSP and does not depend on crop types or growing regions where the Kc is applied, (2) L-WRSI does not require estimation of start-of-season and end-of-season layers, which could introduce additional sources of uncertainty, making year-to-year comparison more reliable, and (3) because of the daily, year-round modeling, any desired time period can be simulated in the world instead of pre-specified seasons for a given region.
5. Conclusions
The main objective of this study is to present the updated agro-hydrologic VegET v2.0 model [29] along with performance evaluation results and drought monitoring applications over the conterminous United States and Greater Horn of Africa. A successful integration of a simple temperature-index based snowpack and melt process algorithm has been adapted to work with the VegET model.
Limited evaluation results indicate an encouraging performance in terms of capturing the timing and duration of snow accumulation and melt. Evaluation of soil moisture, ETa, and runoff estimations were reasonable in terms of capturing relative differences in space and time, indicating the usefulness of the model for drought monitoring purposes across diverse ecosystems using the highly integrated L-WRSI product. The operational implementation of the L-WRSI in the Greater Horn of Africa by the Famine Early Warning System Network can be expanded to a global coverage due to the readily available nature of gridded weather datasets and remotely sensed model parameters.
The spatiotemporal patterns of VegET ETa indicate that VegET could be used for the determination of net irrigation water use (blue water) when combined with energy balance models that estimate total ETa by quantifying the green water contribution from precipitation and soil moisture.
With continued evaluation and improvement, the VegET model can also be used to help improve flood forecasting because of the unique inclusion of the readily available land surface phenology (LSP) that accounts for vegetation dynamics in hydrologic modeling, without requiring specification of land cover types.
Supplementary Material
The data that support the findings of this study are openly available at https://doi.org/10.5066/P9ILC6RP [54]. The VegET v2.0 model is available at https://doi.org/10.5066/P9ZYT75R [29].
Author Contributions
Conceptualization, G.S.; Methodology, G.S.; Software, S.K. and G.P.; Validation, G.S., S.K., G.P. K.K.; Formal Analysis, G.S., S.K., G.P., K.K., O.B., N.M.V.; Resources, G.S.; Data Curation, S.K., G.P., and K.K.; Writing – Original Draft Preparation, G.S., S.K., G.P., and K.K.; Writing – Review & Editing, G.S., S.K., G.P. K.K., O.B., and N.M.V.; Visualization, S.K., G.P. and K.K.; Supervision, G.S.; Project Administration, G.S.; Funding Acquisition, G.S.
Funding
This work was performed under the U.S. Geological Survey (USGS) contract 140G0119C0001 in support of the USGS Land Change Science projects WaterSMART and Landsat Water Balance, and the USGS OpenET activities supported by the USGS Water Mission Area.
Acknowledgements
We gratefully acknowledge the institutions and individuals who made various geospatial data freely available: GridMET reference evapotranspiration (John Abatzoglou), CHELSA (Climatologies at high resolution for the earth’s land surface areas), and SRIC – World Soil Information, runoff by USGS, soil moisture and snow by U.S. Department of Agriculture. We thank individual principal investigators for the use of AmeriFlux tower data in our research. We greatly appreciate the internal reviewer Lei Ji, anonymous journal reviewers, and the USGS Approving Officer for their edits and constructive feedback. Any use of trade, firm, or product names is for descriptive purposes only and does not imply endorsement by the U.S. Government.
Conflicts of Interest
The authors declare no conflict of interest.
References
- Asante, K.O.; Macuacua, R.D.; Artan, G.A.; Lietzow, R.W.; Verdin, J.P. Developing a flood monitoring system from remotely sensed data for the Limpopo basin. IEEE Transactions on Geoscience and Remote Sensing 2007, 45, 1709–1714. [Google Scholar] [CrossRef]
- Artan, G.; Gadain, H.; Smith, J.L.; Asante, K.; Bandaragoda, C.J.; Verdin, J.P. Adequacy of satellite derived rainfall data for stream flow modeling. Natural Hazards 2007, 43, 167–185. [Google Scholar] [CrossRef]
- Senay, G.B. Modeling landscape evapotranspiration by integrating land surface phenology and a water balance algorithm. Algorithms 2008, 1, 52–68. [Google Scholar] [CrossRef]
- Frere, M.; Popov, G. Early agrometeorological crop yield assessment; 1986; p. 144. [Google Scholar]
- Molden, D.; Sakthivadivel, R. Water accounting to assess use and productivity of water. International Journal of Water Resources Development 1999, 15, 55–71. [Google Scholar] [CrossRef]
- Leavesley, G.H. Precipitation-runoff modeling system: User's manual; US Department of the Interior, 1984; Vol. 83. [Google Scholar]
- Arnold, J.G.; Srinivasan, R.; Muttiah, R.S.; Williams, J.R. Large area hydrologic modeling and assessment part I: model development 1. JAWRA Journal of the American Water Resources Association 1998, 34, 73–89. [Google Scholar] [CrossRef]
- Liang, X.; Lettenmaier, D.P.; Wood, E.F.; Burges, S.J. A simple hydrologically based model of land surface water and energy fluxes for general circulation models. Journal of Geophysical Research: Atmospheres 1994, 99, 14415–14428. [Google Scholar] [CrossRef]
- Niu, G.Y.; Yang, Z.L.; Mitchell, K.E.; Chen, F.; Ek, M.B.; Barlage, M.; Kumar, A.; Manning, K.; Niyogi, D.; Rosero, E. The community Noah land surface model with multiparameterization options (Noah-MP): 1. Model description and evaluation with local-scale measurements. Journal of Geophysical Research: Atmospheres 2011, 116. [Google Scholar] [CrossRef]
- Miralles, D.G.; Holmes, T.; De Jeu, R.; Gash, J.; Meesters, A.; Dolman, A. Global land-surface evaporation estimated from satellite-based observations. Hydrology and Earth System Sciences 2011, 15, 453–469. [Google Scholar] [CrossRef]
- Herman, A.; Kumar, V.B.; Arkin, P.A.; Kousky, J.V. Objectively determined 10-day African rainfall estimates created for famine early warning systems. International Journal of Remote Sensing 1997, 18, 2147–2159. [Google Scholar] [CrossRef]
- Funk, C.; Peterson, P.; Landsfeld, M.; Pedreros, D.; Verdin, J.; Shukla, S.; Husak, G.; Rowland, J.; Harrison, L.; Hoell, A. The climate hazards infrared precipitation with stations—a new environmental record for monitoring extremes. Scientific data 2015, 2, 1–21. [Google Scholar] [CrossRef]
- Huffman, G.J.; Bolvin, D.T.; Nelkin, E.J.; Wolff, D.B.; Adler, R.F.; Gu, G.; Hong, Y.; Bowman, K.P.; Stocker, E.F. The TRMM multisatellite precipitation analysis (TMPA): Quasi-global, multiyear, combined-sensor precipitation estimates at fine scales. Journal of hydrometeorology 2007, 8, 38–55. [Google Scholar] [CrossRef]
- Abatzoglou, J.T.; Dobrowski, S.Z.; Parks, S.A.; Hegewisch, K.C. TerraClimate, a high-resolution global dataset of monthly climate and climatic water balance from 1958–2015. Scientific data 2018, 5, 1–12. [Google Scholar] [CrossRef] [PubMed]
- Hobbins, M.; Harrison, L.; Blakeley, S.; Dewes, C.; Husak, G.; Shukla, S.; Jayanthi, H.; McNally, A.; Sarmiento, D.; Verdin, J. Drought in Africa: Understanding and exploiting the demand perspective using a new evaporative demand reanalysis. Authorea Preprints 2022. [Google Scholar]
- Senay, G.; Verdin, J.; Lietzow, R.; Melesse, A.M. Global daily reference evapotranspiration modeling and evaluation 1. JAWRA Journal of the American Water Resources Association 2008, 44, 969–979. [Google Scholar] [CrossRef]
- Zomer, R.J.; Xu, J.; Trabucco, A. Version 3 of the global aridity index and potential evapotranspiration database. Scientific Data 2022, 9, 409. [Google Scholar] [CrossRef]
- Milly, P.; Dunne, K. Sensitivity of the global water cycle to the water-holding capacity of land. Journal of climate 1994, 7, 506–526. [Google Scholar] [CrossRef]
- Wang-Erlandsson, L.; Bastiaanssen, W.G.; Gao, H.; Jägermeyr, J.; Senay, G.B.; Van Dijk, A.I.; Guerschman, J.P.; Keys, P.W.; Gordon, L.J.; Savenije, H.H. Global root zone storage capacity from satellite-based evaporation. Hydrology and Earth System Sciences 2016, 20, 1459–1481. [Google Scholar] [CrossRef]
- Adams III, T. Flood forecasting in the United States NOAA/national weather service. In Flood forecasting; Elsevier, 2016; pp. 249–310. [Google Scholar]
- McCabe, G.J.; Markstrom, S.L. A monthly water-balance model driven by a graphical user interface; US Geological Survey: Reston, VA, USA, 2007; Vol. 1088. [Google Scholar]
- Senay, G.B.; Verdin, J. Characterization of yield reduction in Ethiopia using a GIS-based crop water balance model. Canadian Journal of Remote Sensing 2003, 29, 687–692. [Google Scholar] [CrossRef]
- Tercek, M.T.; Thoma, D.; Gross, J.E.; Sherrill, K.; Kagone, S.; Senay, G. Historical changes in plant water use and need in the continental United States. Plos one 2021, 16, e0256586. [Google Scholar] [CrossRef]
- Allen, R.G.; Pereira, L.S.; Raes, D.; Smith, M. FAO Irrigation and drainage paper No. 56; 1998; p. e156. [Google Scholar]
- Velpuri, N.M.; Senay, G.B. Partitioning evapotranspiration into green and blue water sources in the conterminous United States. Scientific reports 2017, 7, 6191. [Google Scholar] [CrossRef]
- Velpuri, N.M.; Senay, G.B. Assessing the potential hydrological impact of the Gibe III Dam on Lake Turkana water level using multi-source satellite data. Hydrology and Earth System Sciences 2012, 16, 3561–3578. [Google Scholar] [CrossRef]
- Beven, K.; Lamb, R.; Quinn, P.; Romanowicz, R.; Freer, J. Topmodel. Computer models of watershed hydrology. 1995, 627–668. [Google Scholar]
- Beven, K.J.; Kirkby, M.J. A physically based, variable contributing area model of basin hydrology/Un modèle à base physique de zone d'appel variable de l'hydrologie du bassin versant. Hydrological sciences journal 1979, 24, 43–69. [Google Scholar] [CrossRef]
- Senay, G.; Kagone, S.; Parrish, G.; Butzer, T.; Boiko, O. veget_model. U.S. Geological Survey software release. 2023. [Google Scholar] [CrossRef]
- Abatzoglou, J.T. Development of gridded surface meteorological data for ecological applications and modelling. International Journal of Climatology 2013, 33, 121–131. [Google Scholar] [CrossRef]
- Didan, K. MOD13Q1 MODIS/Terra vegetation indices 16-day L3 global 250m SIN grid V006. NASA EOSDIS Land Processes DAAC 2015, 10. [Google Scholar]
- NRCS. NRCS Soils: Gridded National Soil Survey Geographic Database (gNATSGO). Available online: https://www.nrcs.usda.gov/resources/data-and-reports/gridded-national-soil-survey-geographic-database-gnatsgo (accessed on 17 May 2023).
- Boiko, O.; Kagone, S.; Senay, G.B. Soil properties dataset in the United States: U.S. Geological Survey data release. 2021. [Google Scholar] [CrossRef]
- DiMiceli, C.; Sohlberg, R.; Townshend, J. MODIS/Terra Vegetation Continuous Fields Yearly L3 Global 250m SIN Grid V061, NASA EOSDIS Land Processes DAAC. 2022. [Google Scholar] [CrossRef]
- Hansen, M.; DeFries, R.; Townshend, J.; Carroll, M.; Dimiceli, C.; Sohlberg, R. Global percent tree cover at a spatial resolution of 500 meters: First results of the MODIS vegetation continuous fields algorithm. Earth Interactions 2003, 7, 1–15. [Google Scholar] [CrossRef]
- Funk, C.C.; Peterson, P.J.; Landsfeld, M.F.; Pedreros, D.H.; Verdin, J.P.; Rowland, J.D.; Romero, B.E.; Husak, G.J.; Michaelsen, J.C.; Verdin, A.P. A quasi-global precipitation time series for drought monitoring. US Geological Survey data series 2014, 832, 1–12. [Google Scholar]
- Hobbins, M.; Dewes, C.; Jansma, T. Global reference evapotranspiration for food-security monitoring: U.S. Geological Survey data release. 2022. [Google Scholar] [CrossRef]
- ISRIC. ISRIC - World Soil Information. Available online: https://data.isric.org/geonetwork/srv/eng/catalog.search#/home (accessed on 13 June 2023).
- Karger, D.N.; Conrad, O.; Böhner, J.; Kawohl, T.; Kreft, H.; Soria-Auza, R.W.; Zimmermann, N.E.; Linder, H.P.; Kessler, M. Climatologies at high resolution for the earth’s land surface areas. Scientific data 2017, 4, 1–20. [Google Scholar] [CrossRef] [PubMed]
- Michael, M.G.; Bastiaanssen, W.G. A new simple method to determine crop coefficients for water allocation planning from satellites: results from Kenya. Irrigation and drainage systems 2000, 14, 237. [Google Scholar] [CrossRef]
- Moussav, M.; Wyseure, G.; Feyen, J. Estimation of melt rate in seasonally snow-covered mountainous areas. Hydrological sciences journal 1989, 34, 249–263. [Google Scholar] [CrossRef]
- Auch, R.F.; Wellington, D.F.; Taylor, J.L.; Stehman, S.V.; Tollerud, H.J.; Brown, J.F.; Loveland, T.R.; Pengra, B.W.; Horton, J.A.; Zhu, Z. Conterminous United States land-cover change (1985–2016): new insights from annual time series. Land 2022, 11, 298. [Google Scholar] [CrossRef]
- Nemani, R.; Running, S. Land cover characterization using multitemporal red, near-IR, and thermal-IR data from NOAA/AVHRR. Ecological applications 1997, 7, 79–90. [Google Scholar] [CrossRef]
- Allen, R.G.; Pereira, L.S.; Howell, T.A.; Jensen, M.E. Evapotranspiration information reporting: I. Factors governing measurement accuracy. Agricultural Water Management 2011, 98, 899–920. [Google Scholar] [CrossRef]
- NRCS. UADA NRCS Soil Climate Analysis Network. Available online: https://www.nrcs.usda.gov/resources/data-and-reports/soil-climate-analysis-network (accessed on 24 May 2023).
- NRCS. USDA NRCS National Water and Climate Center. Available online: https://www.nrcs.usda.gov/wps/portal/wcc/home/ (accessed on 24 May 2023).
- AmeriFlux. AmeriFlux. Available online: https://ameriflux.lbl.gov/ (accessed on 13 June 2023).
- Pastorello, G.; Trotta, C.; Canfora, E.; Chu, H.; Christianson, D.; Cheah, Y.-W.; Poindexter, C.; Chen, J.; Elbashandy, A.; Humphrey, M. The FLUXNET2015 dataset and the ONEFlux processing pipeline for eddy covariance data. Scientific data 2020, 7, 1–27. [Google Scholar] [CrossRef]
- USGS. USGS WaterWatch. Available online: https://waterwatch.usgs.gov/index.php (accessed on 5 June 2023).
- Seaber, P.R.; Kapinos, F.P.; Knapp, G.L. Hydrologic unit maps (Vol. 2294, p. 1987). Washington, DC, USA: US Government Printing Office 1987.
- Brakebill, J.; Wolock, D.; Terziotti, S. Digital hydrologic networks supporting applications related to spatially referenced regression modeling 1. JAWRA Journal of the American Water Resources Association 2011, 47, 916–932. [Google Scholar] [CrossRef] [PubMed]
- Senay, G.B.; Parrish, G.E.; Schauer, M.; Friedrichs, M.; Khand, K.; Boiko, O.; Kagone, S.; Dittmeier, R.; Arab, S.; Ji, L. Improving the Operational Simplified Surface Energy Balance Evapotranspiration Model Using the Forcing and Normalizing Operation. Remote Sensing 2023, 15, 260. [Google Scholar] [CrossRef]
- Senay, G.B.; Friedrichs, M.; Morton, C.; Parrish, G.E.; Schauer, M.; Khand, K.; Kagone, S.; Boiko, O.; Huntington, J. Mapping actual evapotranspiration using Landsat for the conterminous United States: Google Earth Engine implementation and assessment of the SSEBop model. Remote Sensing of Environment 2022, 275, 113011. [Google Scholar] [CrossRef]
- Senay, G.B.; Kagone, S.; Parrish, G.E.L.; Khand, K. VegET v2.0 illustrative products and evaluation: U.S. Geological Survey data release. 2023. [Google Scholar] [CrossRef]
- Svoboda, M.; LeComte, D.; Hayes, M.; Heim, R.; Gleason, K.; Angel, J.; Rippey, B.; Tinker, R.; Palecki, M.; Stooksbury, D. The drought monitor. Bulletin of the American Meteorological Society 2002, 83, 1181–1190. [Google Scholar] [CrossRef]
- Shen, Y.; Zhang, X.; Yang, Z.; Ye, Y.; Wang, J.; Gao, S.; Liu, Y.; Wang, W.; Tran, K.H.; Ju, J. Developing an operational algorithm for near-real-time monitoring of crop progress at field scales by fusing harmonized Landsat and Sentinel-2 time series with geostationary satellite observations. Remote Sensing of Environment 2023, 296, 113729. [Google Scholar] [CrossRef]
Figure 1.
Study areas including the conterminous United States (CONUS) and the Greater Horn of Africa (GHA) using Normalized Difference Vegetation Index (NDVI) to capture the spatial distribution of relative vegetation productivity for July 2018.
Figure 1.
Study areas including the conterminous United States (CONUS) and the Greater Horn of Africa (GHA) using Normalized Difference Vegetation Index (NDVI) to capture the spatial distribution of relative vegetation productivity for July 2018.
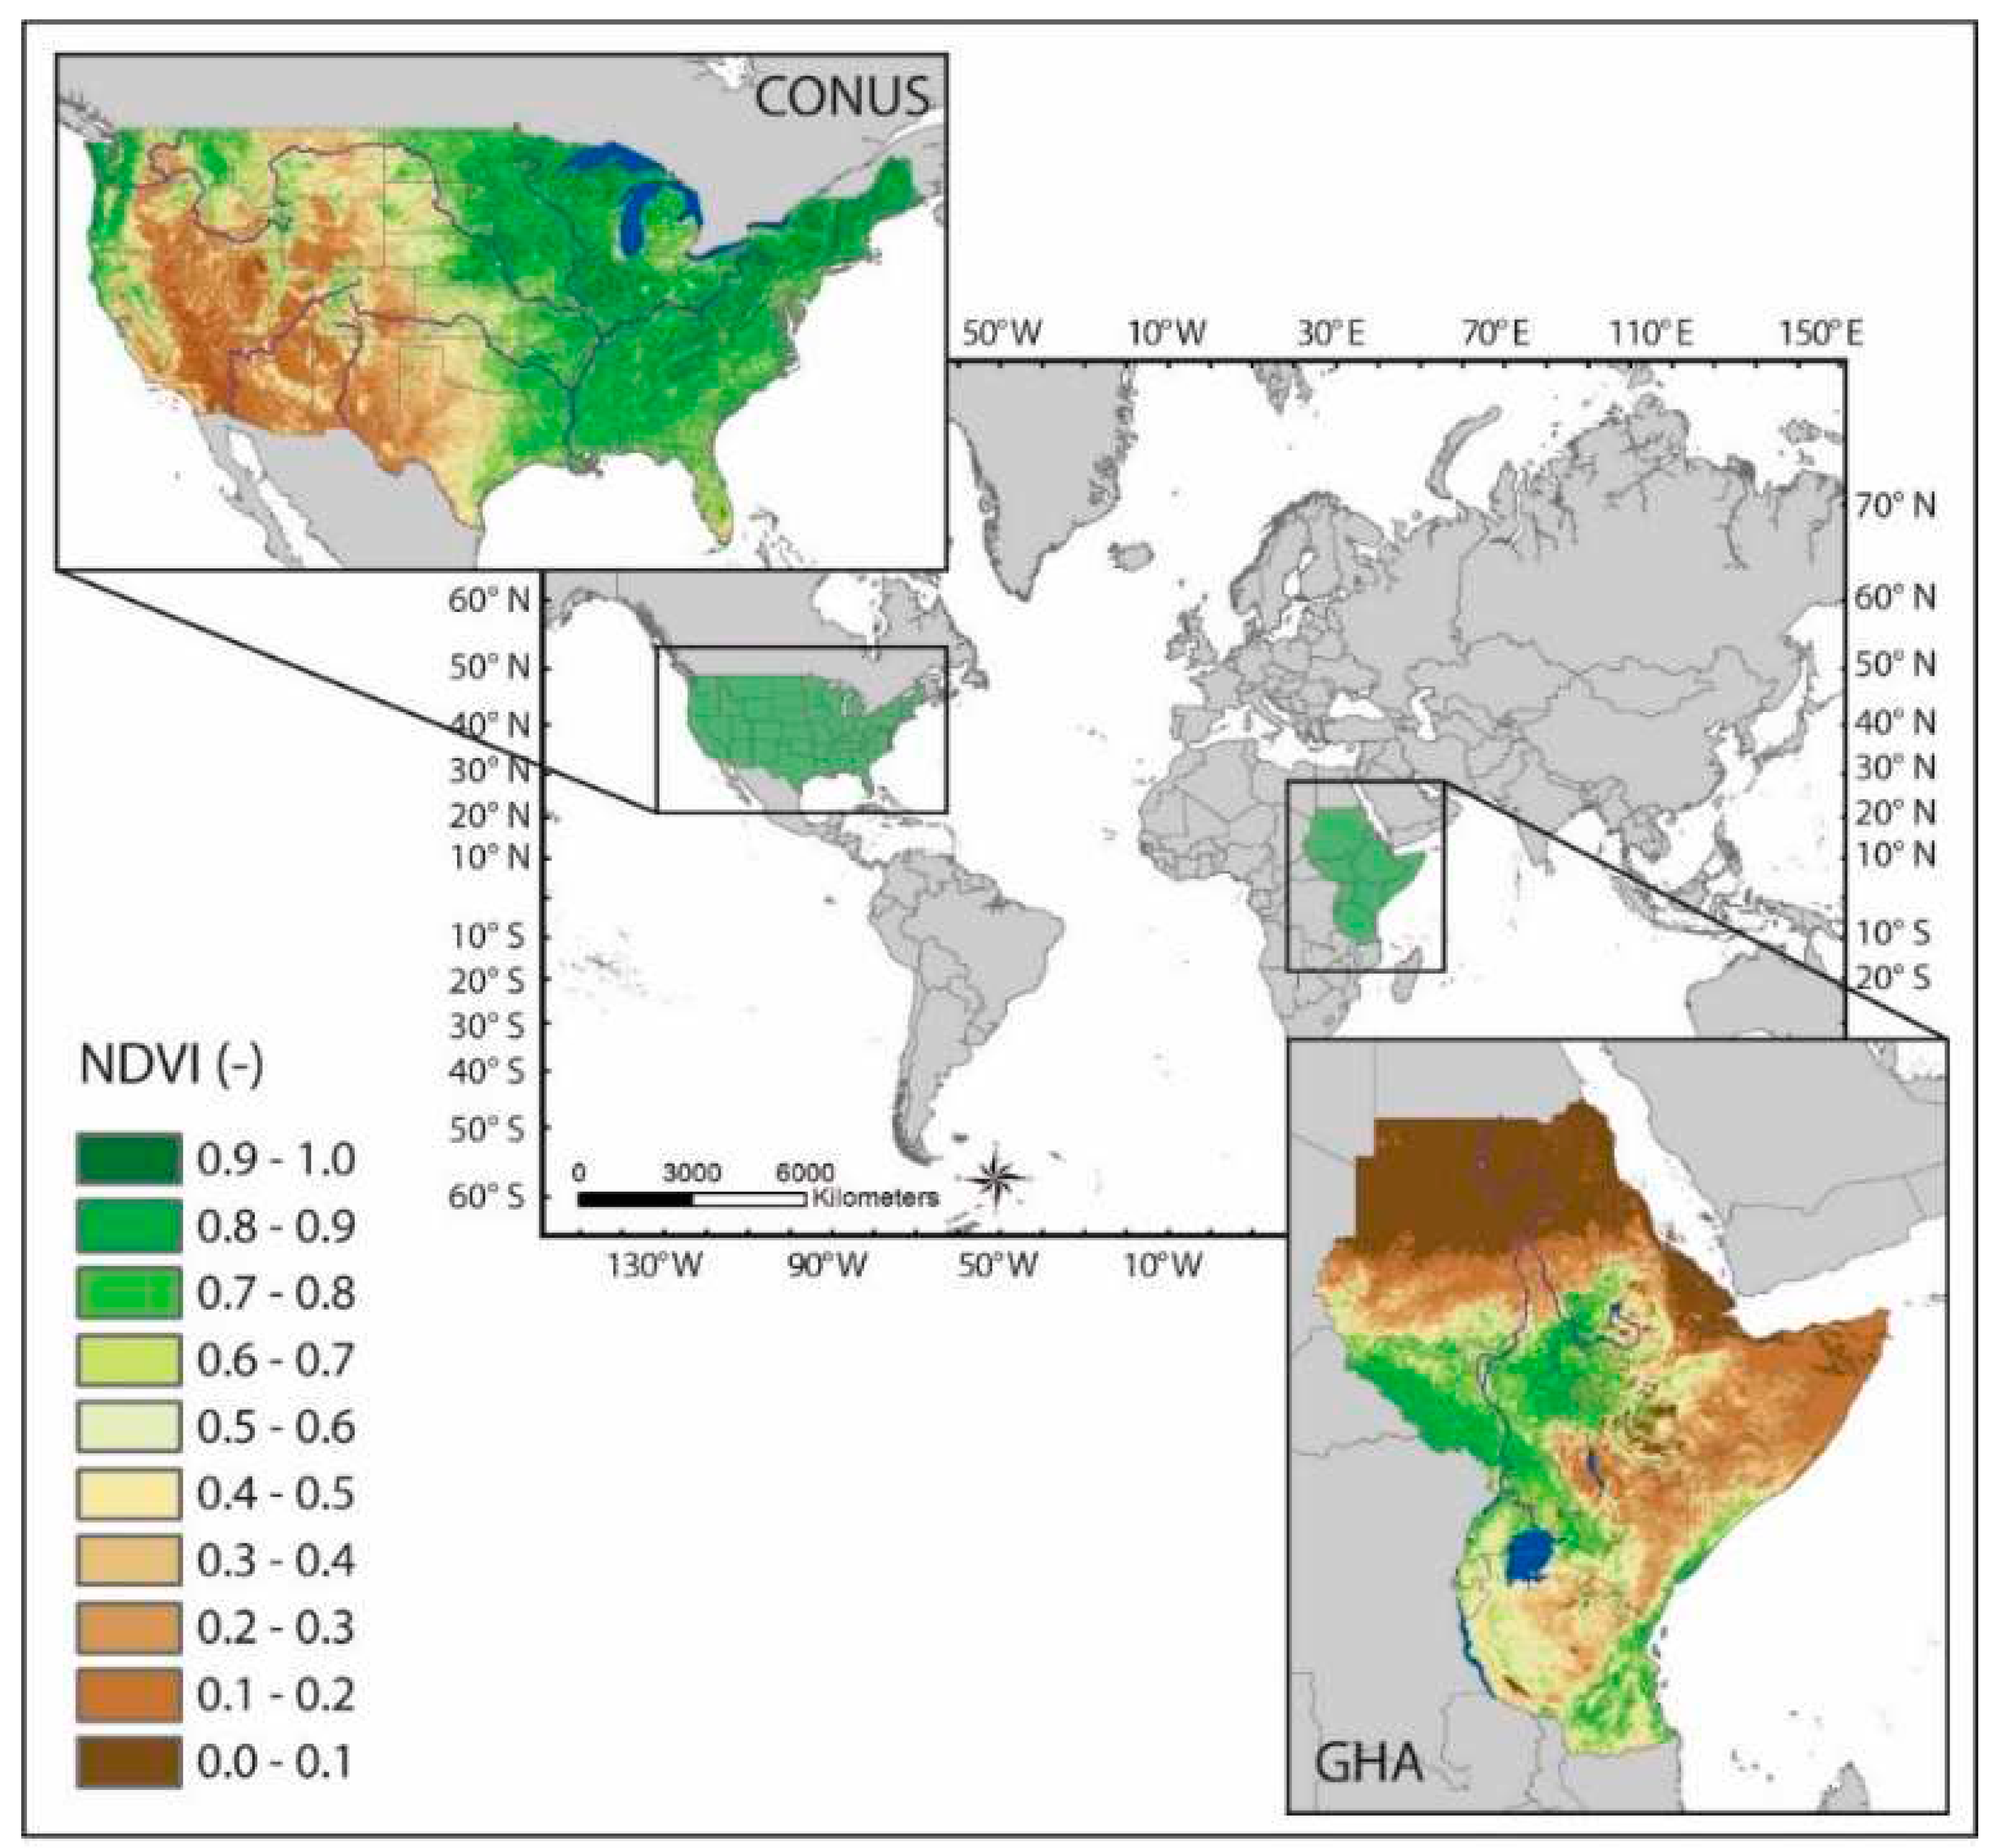
Figure 2.
Schematic representation of the updated VegET model (v2.0) [29]. The Soil Water Store is defined by two major sections: “gravity water” is filled once the soil moisture is above field capacity (FC) and “plant available water” is the section between FC and permanent wilting point (WP). VCF: vegetation continuous field, P: precipitation, Peff: effective precipitation, SWE: snow water equivalent, Ta: air temperature; ETo: reference ET, Rn: net radiation, U: wind speed, RH: relative humidity, r = air pressure, Kcp: landscape water use coefficient, LSP: land surface phenology, Ks: soil stress coefficient, WHC: water holding capacity, MAD: maximum allowable depletion, SM: soil moisture, SAT, soil saturation, SATfc: volume between SAT and FC, L-WRSI: landscape water requirement satisfaction index.
Figure 2.
Schematic representation of the updated VegET model (v2.0) [29]. The Soil Water Store is defined by two major sections: “gravity water” is filled once the soil moisture is above field capacity (FC) and “plant available water” is the section between FC and permanent wilting point (WP). VCF: vegetation continuous field, P: precipitation, Peff: effective precipitation, SWE: snow water equivalent, Ta: air temperature; ETo: reference ET, Rn: net radiation, U: wind speed, RH: relative humidity, r = air pressure, Kcp: landscape water use coefficient, LSP: land surface phenology, Ks: soil stress coefficient, WHC: water holding capacity, MAD: maximum allowable depletion, SM: soil moisture, SAT, soil saturation, SATfc: volume between SAT and FC, L-WRSI: landscape water requirement satisfaction index.
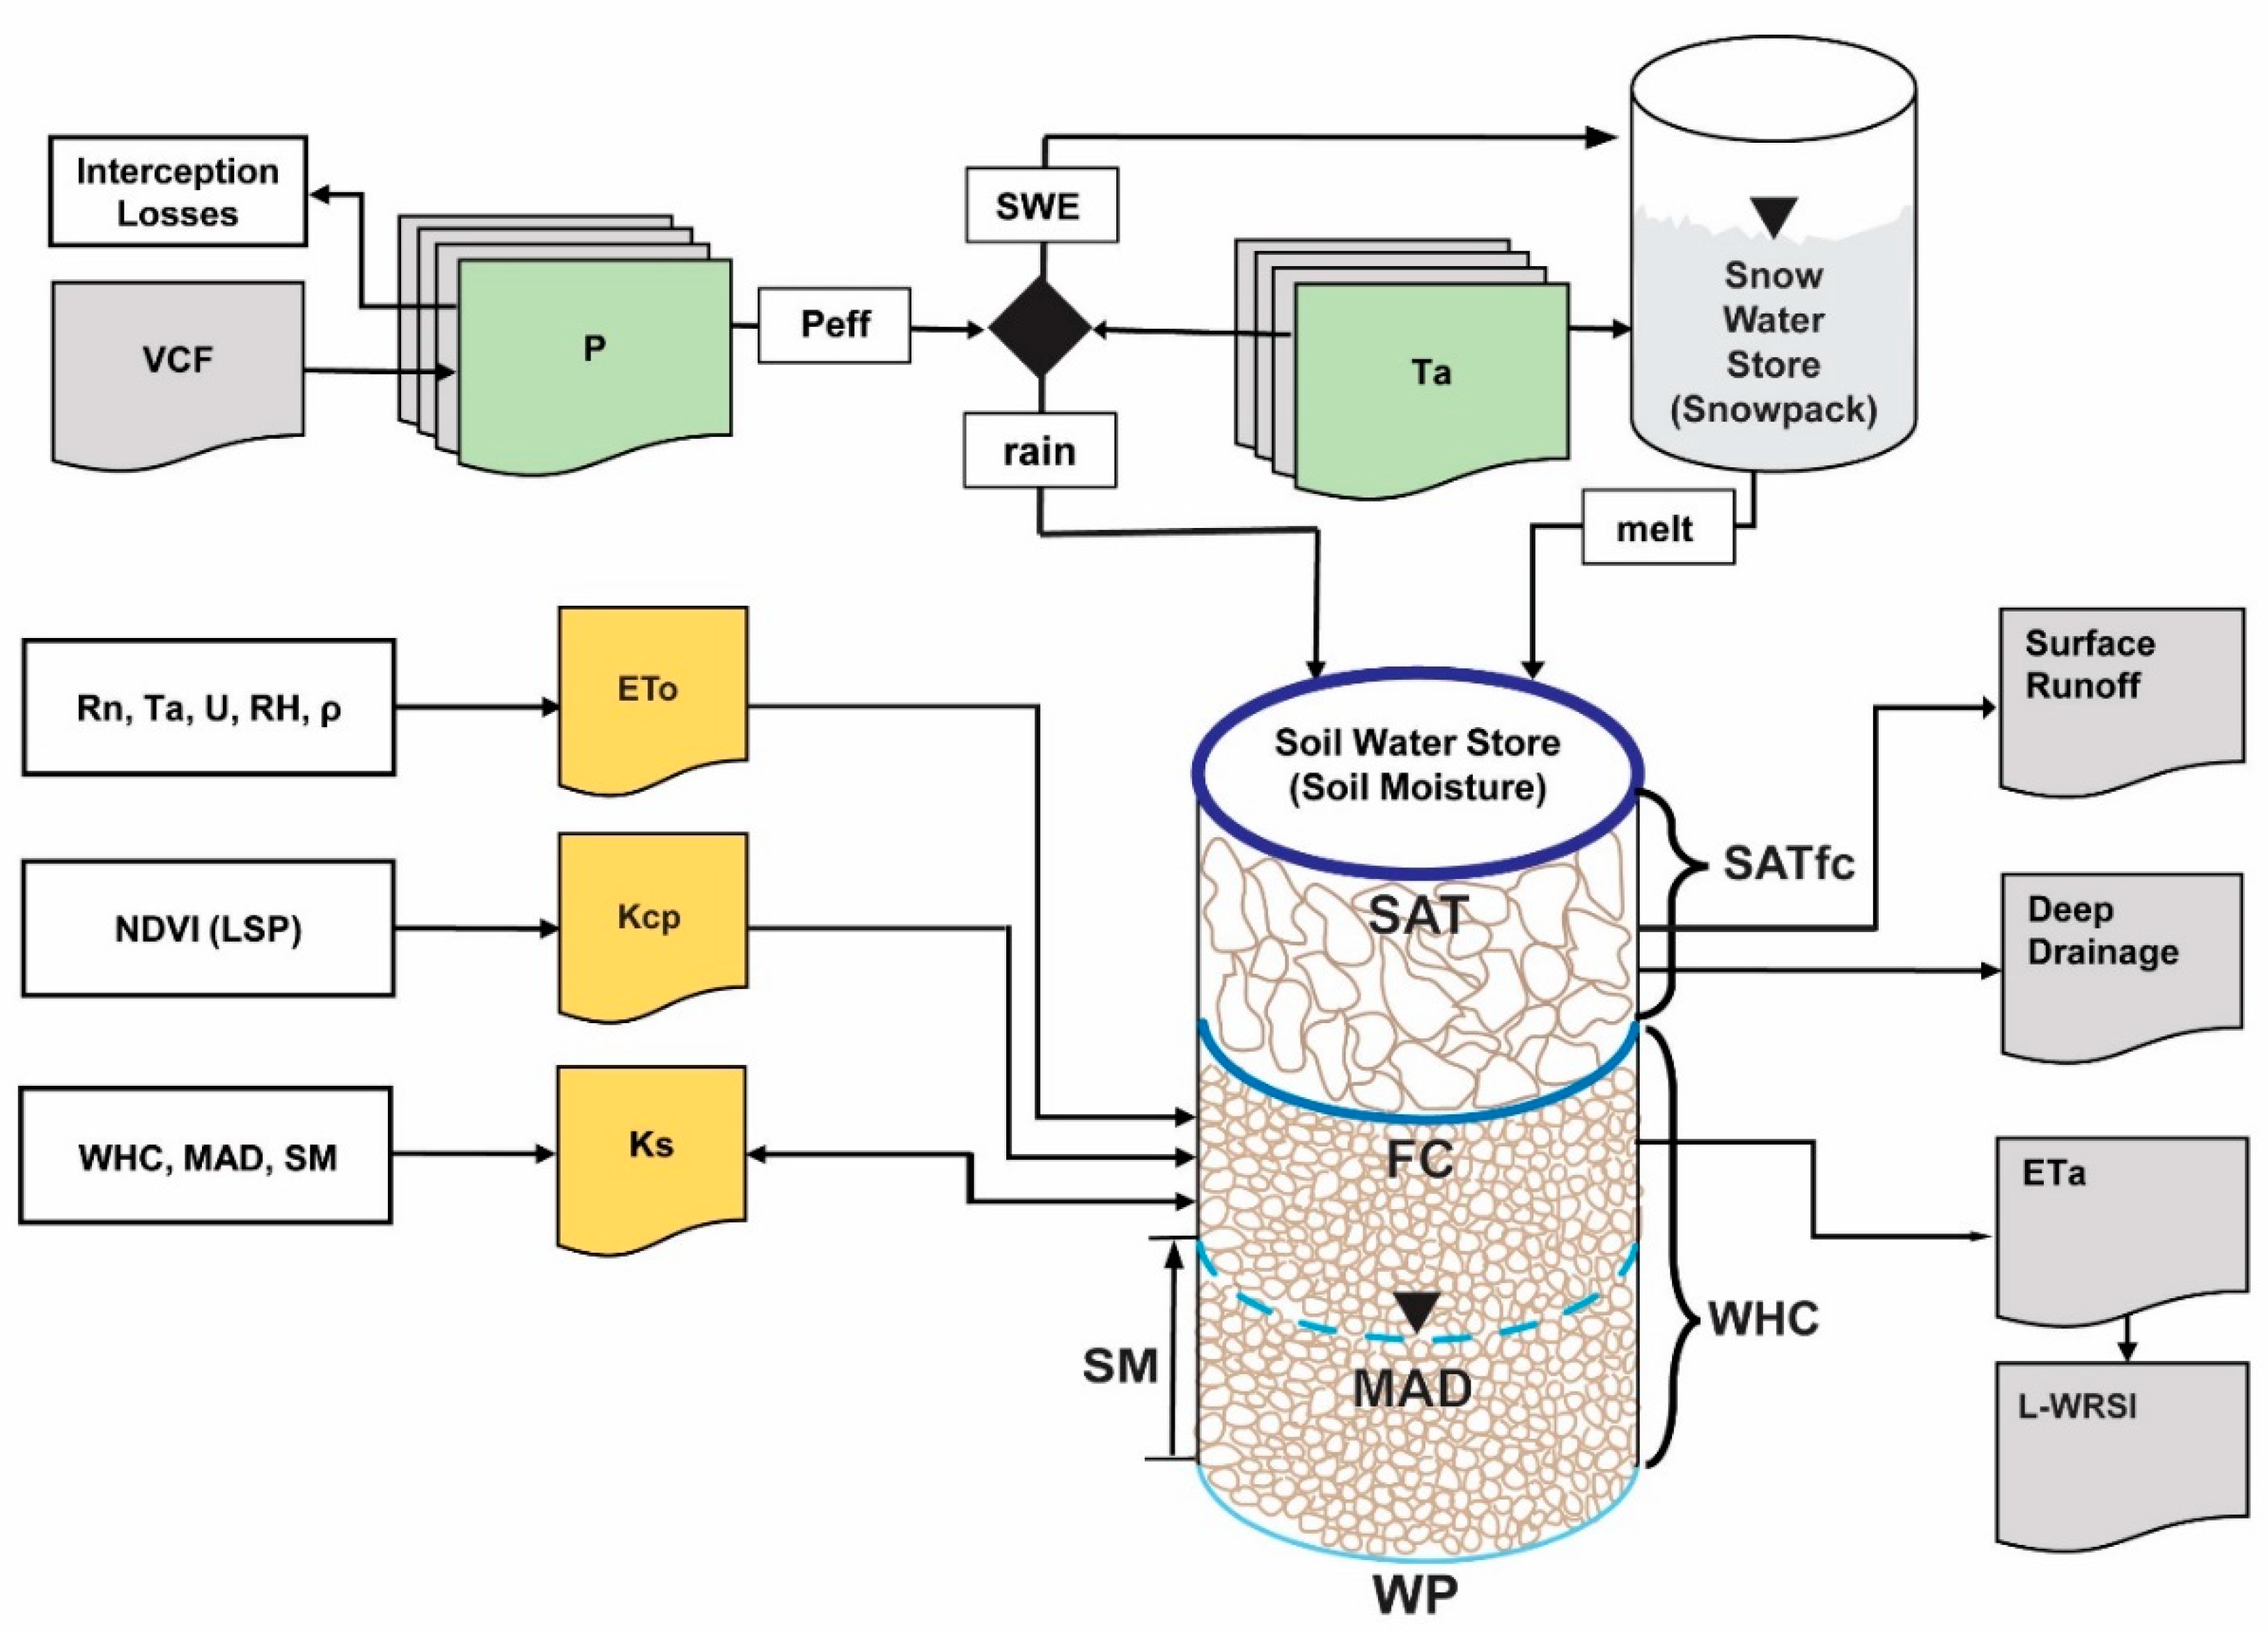
Figure 3.
Schematic representation of (a) the traditional crop coefficient (Kc) and (b) the Land Surface Phenology (LSP) (Kcp) coefficient.
Figure 3.
Schematic representation of (a) the traditional crop coefficient (Kc) and (b) the Land Surface Phenology (LSP) (Kcp) coefficient.
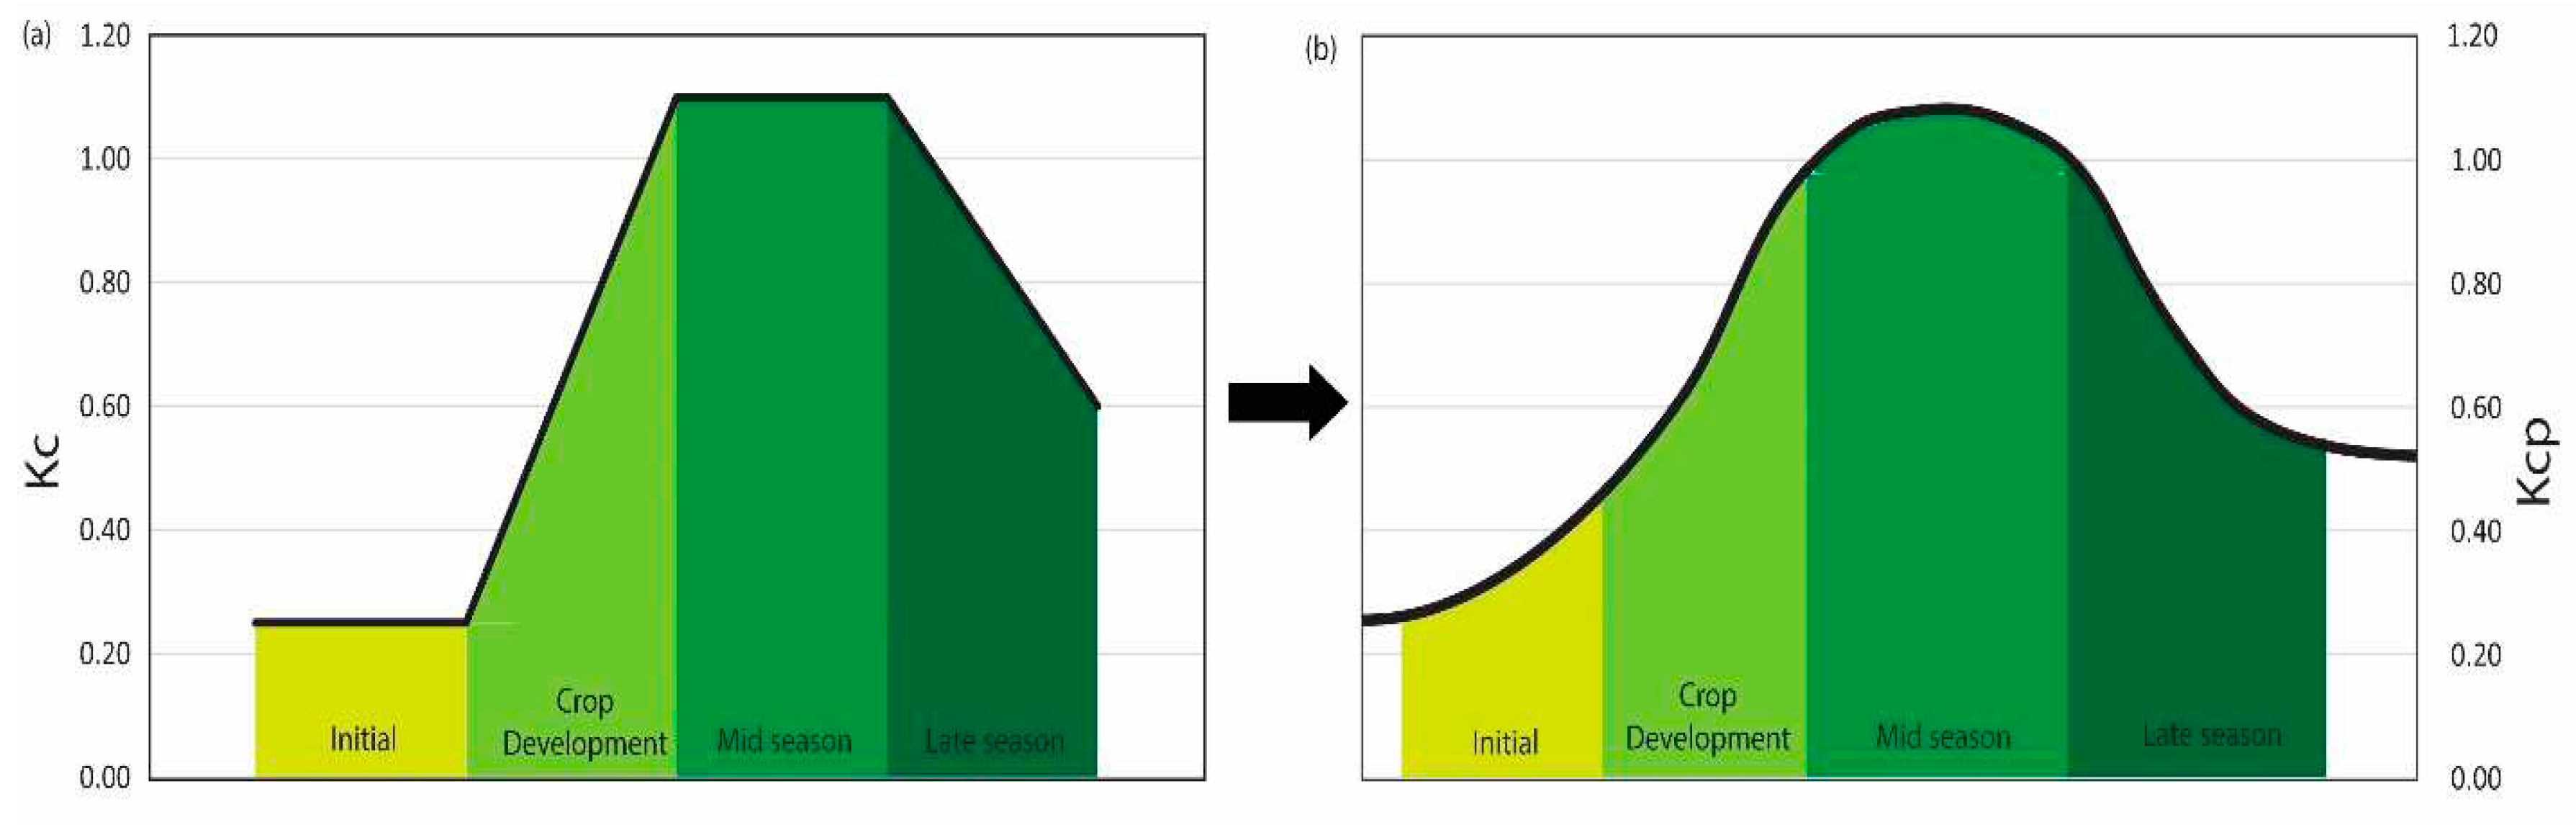
Figure 4.
Location map for Soil Climate Analysis Network (SCAN) sites, SNOTEL (SNOpack TELemetry) sites, AmeriFlux Tower sites, and eight-digit Hydrologic Unit Code (HUC8) in the conterminous United States for water year 2012 evaluation. The map shows the Upper Mississippi River Basin used for the detailed water budget analysis. GA: Georgia, KS: Kansas, MN: Minnesota, NE: Nebraska, NM: New Mexico, OK: Oklahoma, TX: Texas.
Figure 4.
Location map for Soil Climate Analysis Network (SCAN) sites, SNOTEL (SNOpack TELemetry) sites, AmeriFlux Tower sites, and eight-digit Hydrologic Unit Code (HUC8) in the conterminous United States for water year 2012 evaluation. The map shows the Upper Mississippi River Basin used for the detailed water budget analysis. GA: Georgia, KS: Kansas, MN: Minnesota, NE: Nebraska, NM: New Mexico, OK: Oklahoma, TX: Texas.
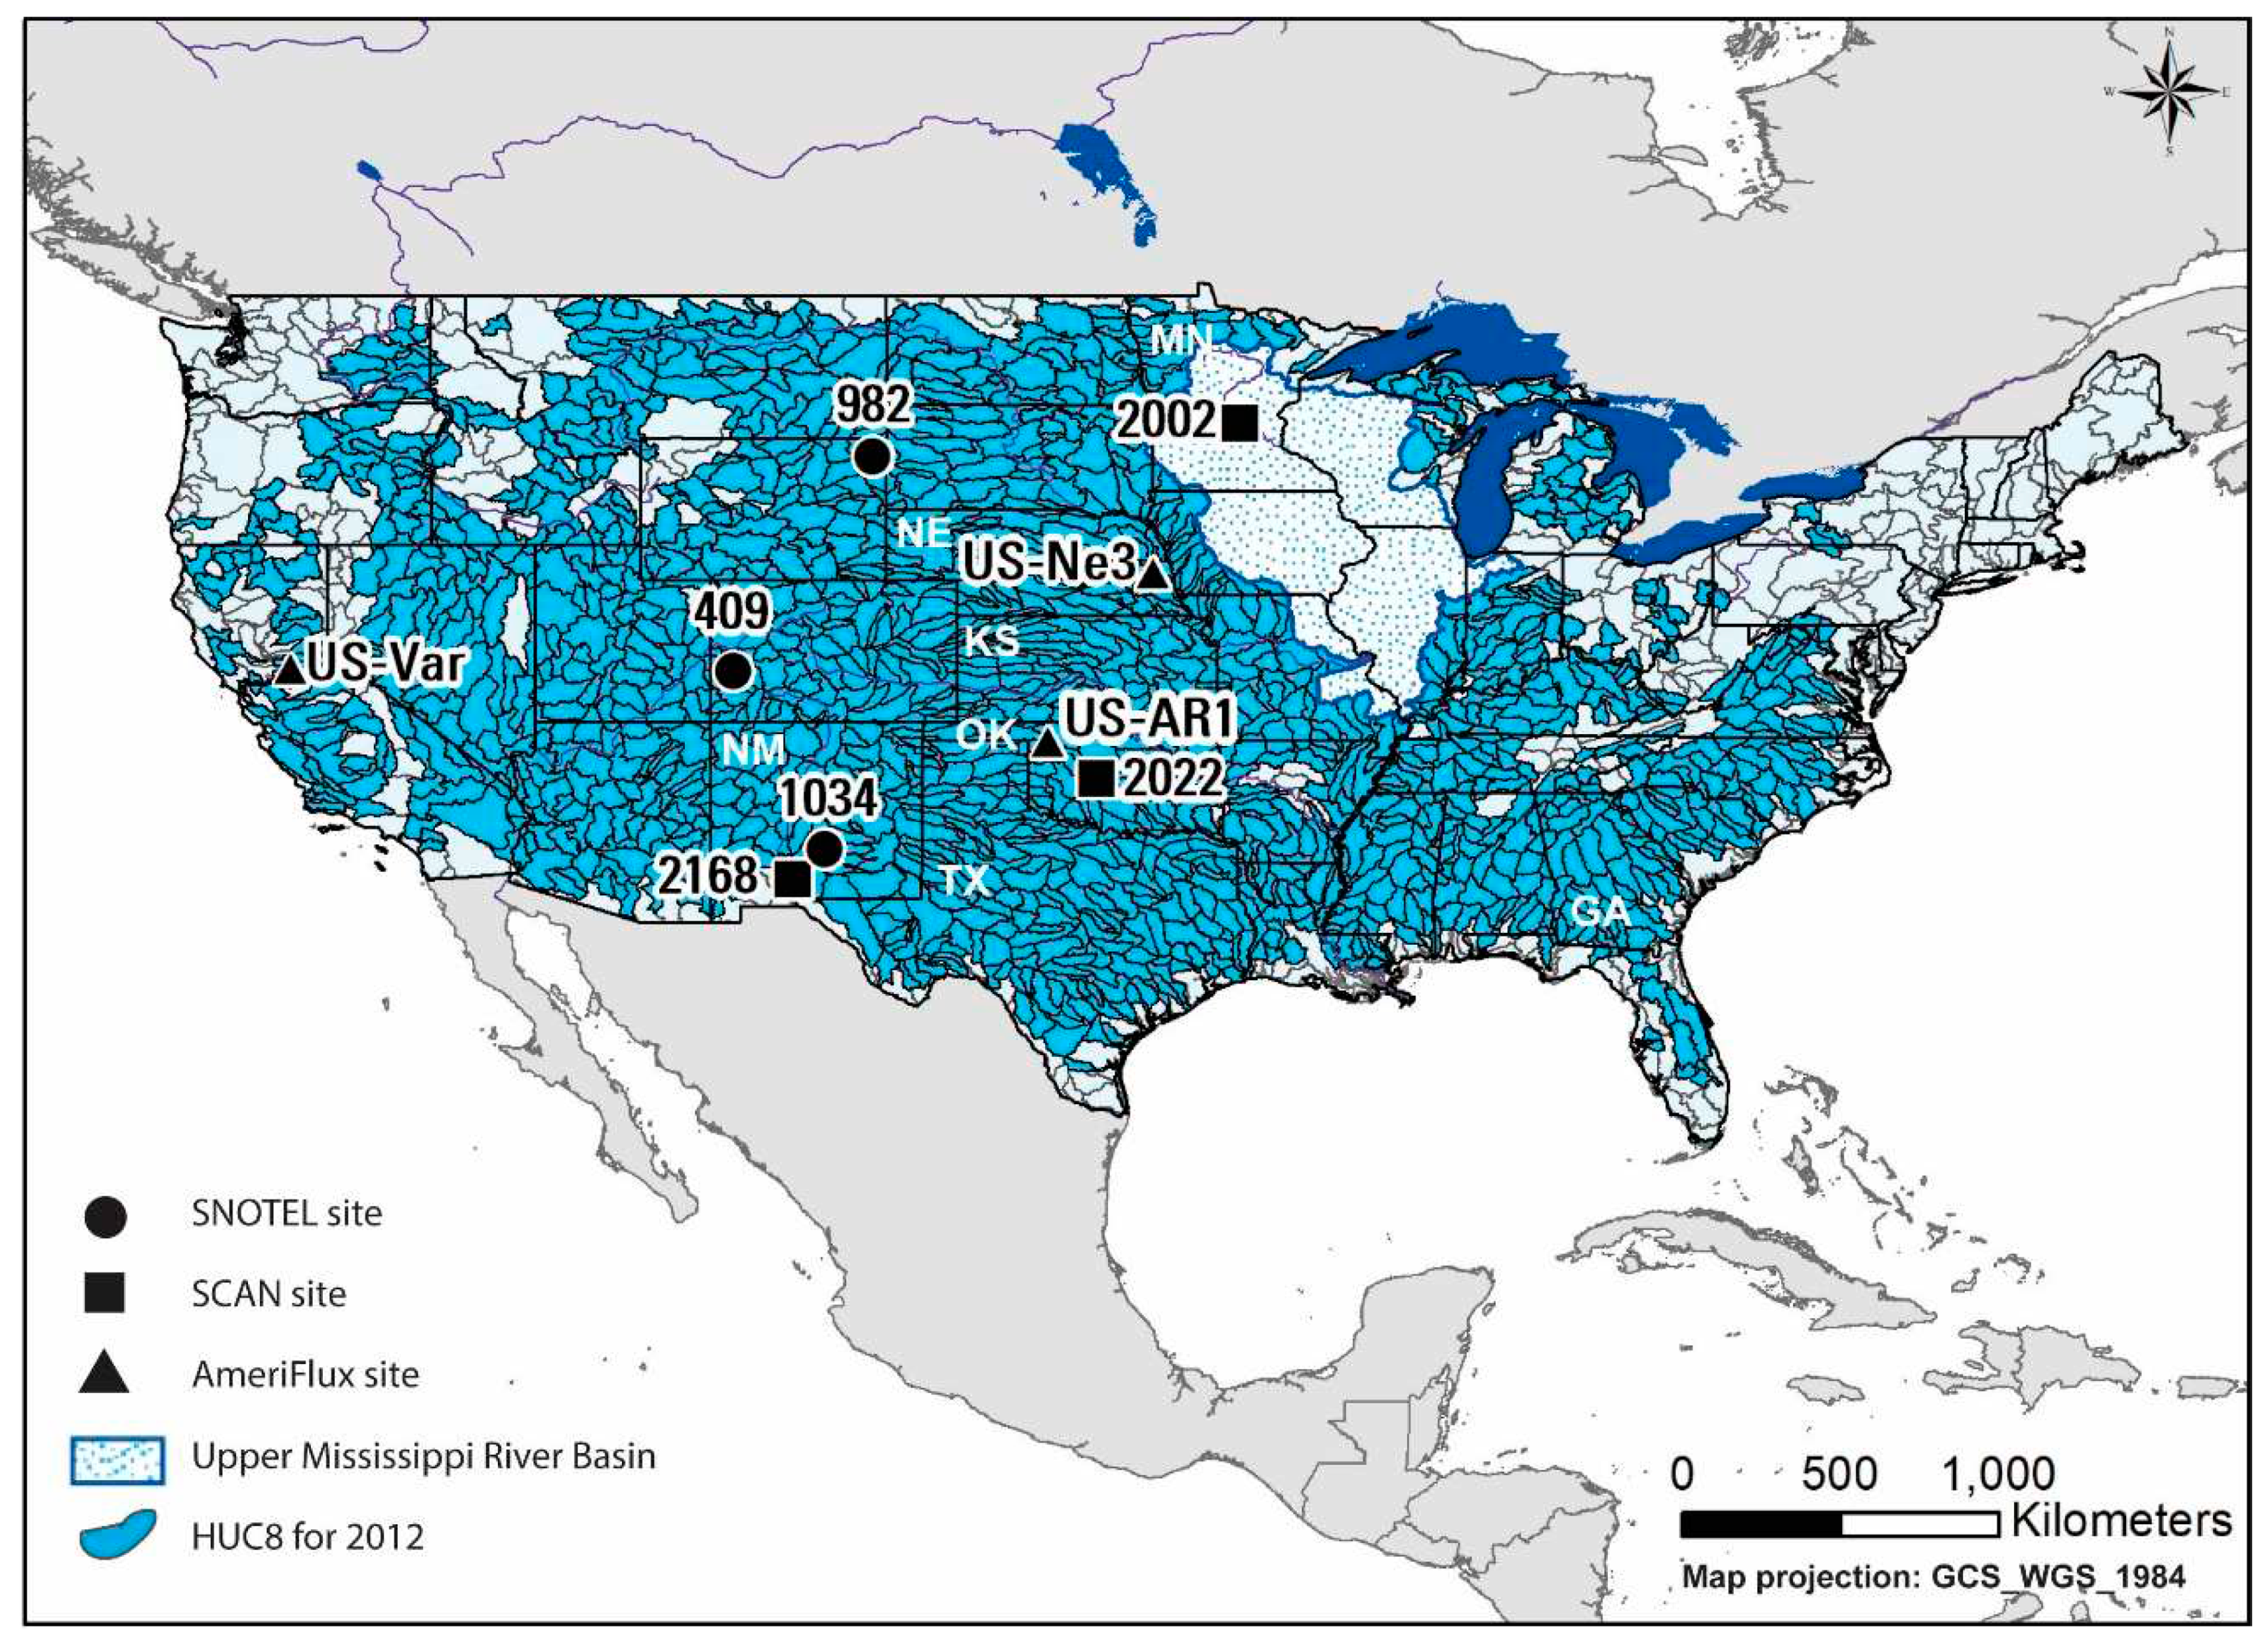
Figure 5.
VegET model input and output parameters for a pixel at the AmeriFlux station in Minnesota (US-Ro1) for 2018. (a) Normalized Difference Vegetation Index (NDVI) and precipitation; (b) soil moisture (SM), snowpack (Snowpack), surface runoff (srf), and deep drainage (dd); (c) actual ET (ETa), reference ET (ETo), and landscape water requirement (ETc).
Figure 5.
VegET model input and output parameters for a pixel at the AmeriFlux station in Minnesota (US-Ro1) for 2018. (a) Normalized Difference Vegetation Index (NDVI) and precipitation; (b) soil moisture (SM), snowpack (Snowpack), surface runoff (srf), and deep drainage (dd); (c) actual ET (ETa), reference ET (ETo), and landscape water requirement (ETc).
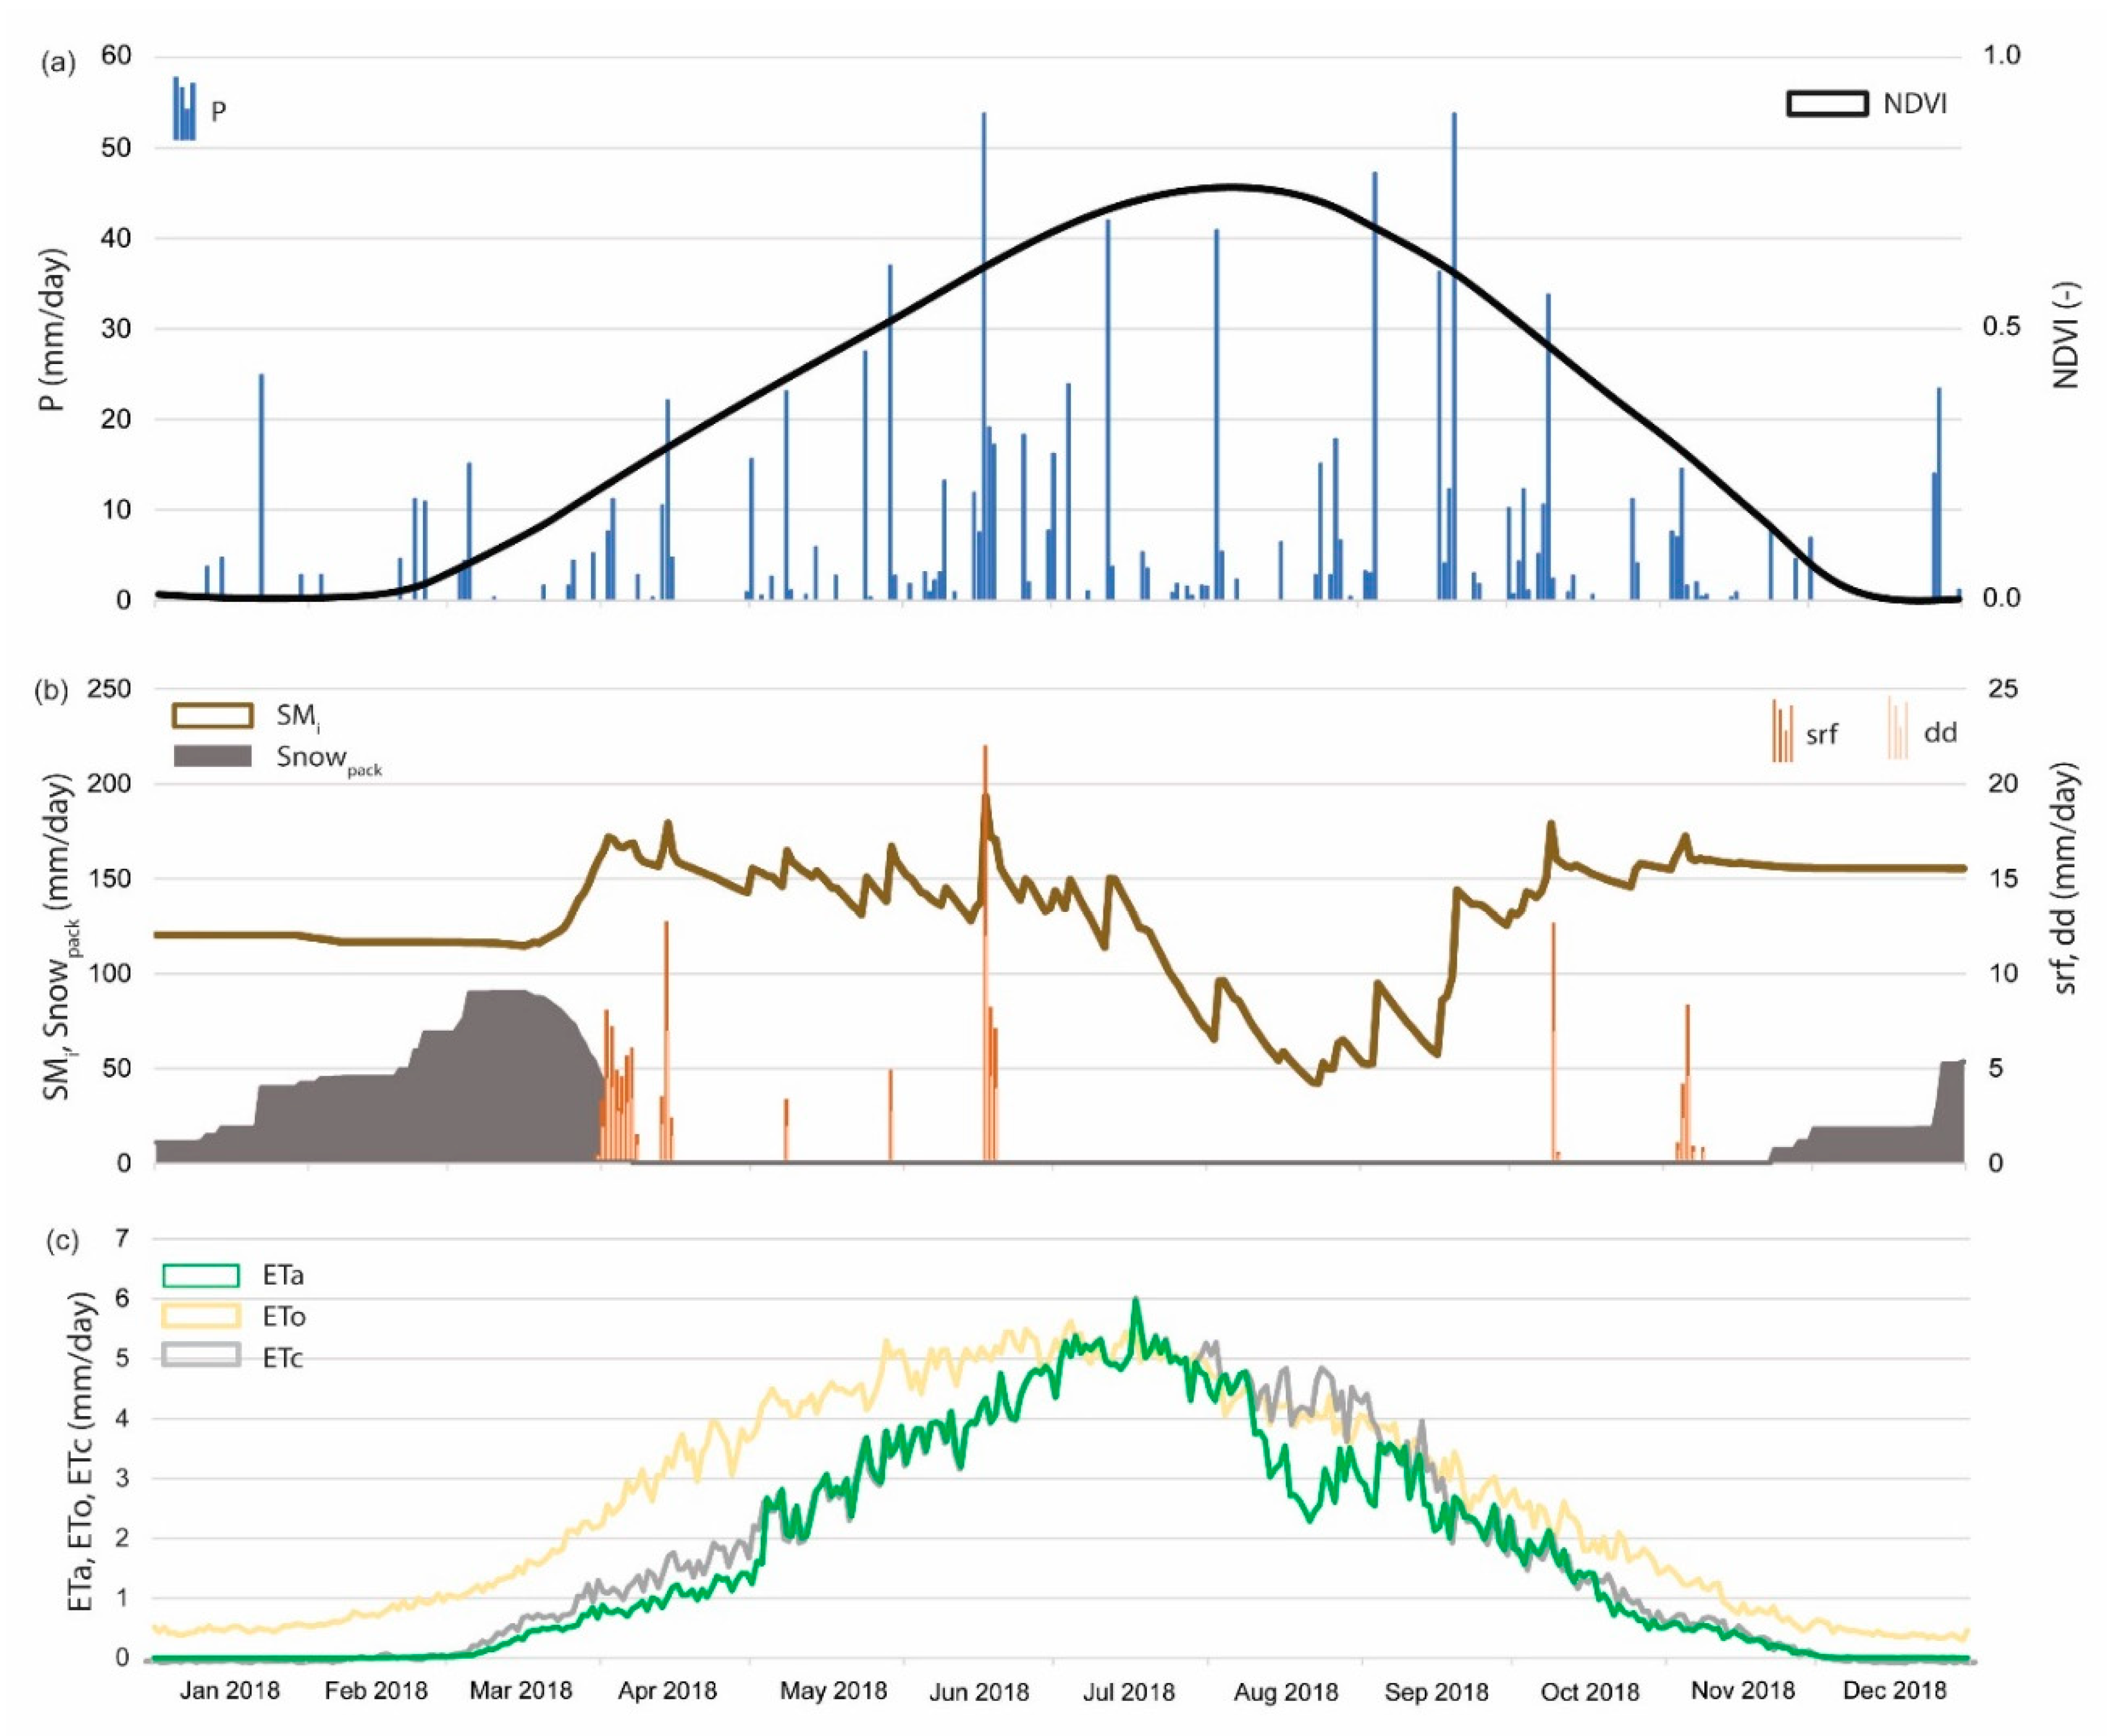
Figure 6.
VegET annual actual evapotranspiration (ETa) for the years (a) 2012, (b) 2016, and (c) 2018. Brown colors with low ETa dominate low-precipitation and sparsely vegetation regions in contrast with green and blue tones on well-vegetated and precipitation-rich regions.
Figure 6.
VegET annual actual evapotranspiration (ETa) for the years (a) 2012, (b) 2016, and (c) 2018. Brown colors with low ETa dominate low-precipitation and sparsely vegetation regions in contrast with green and blue tones on well-vegetated and precipitation-rich regions.
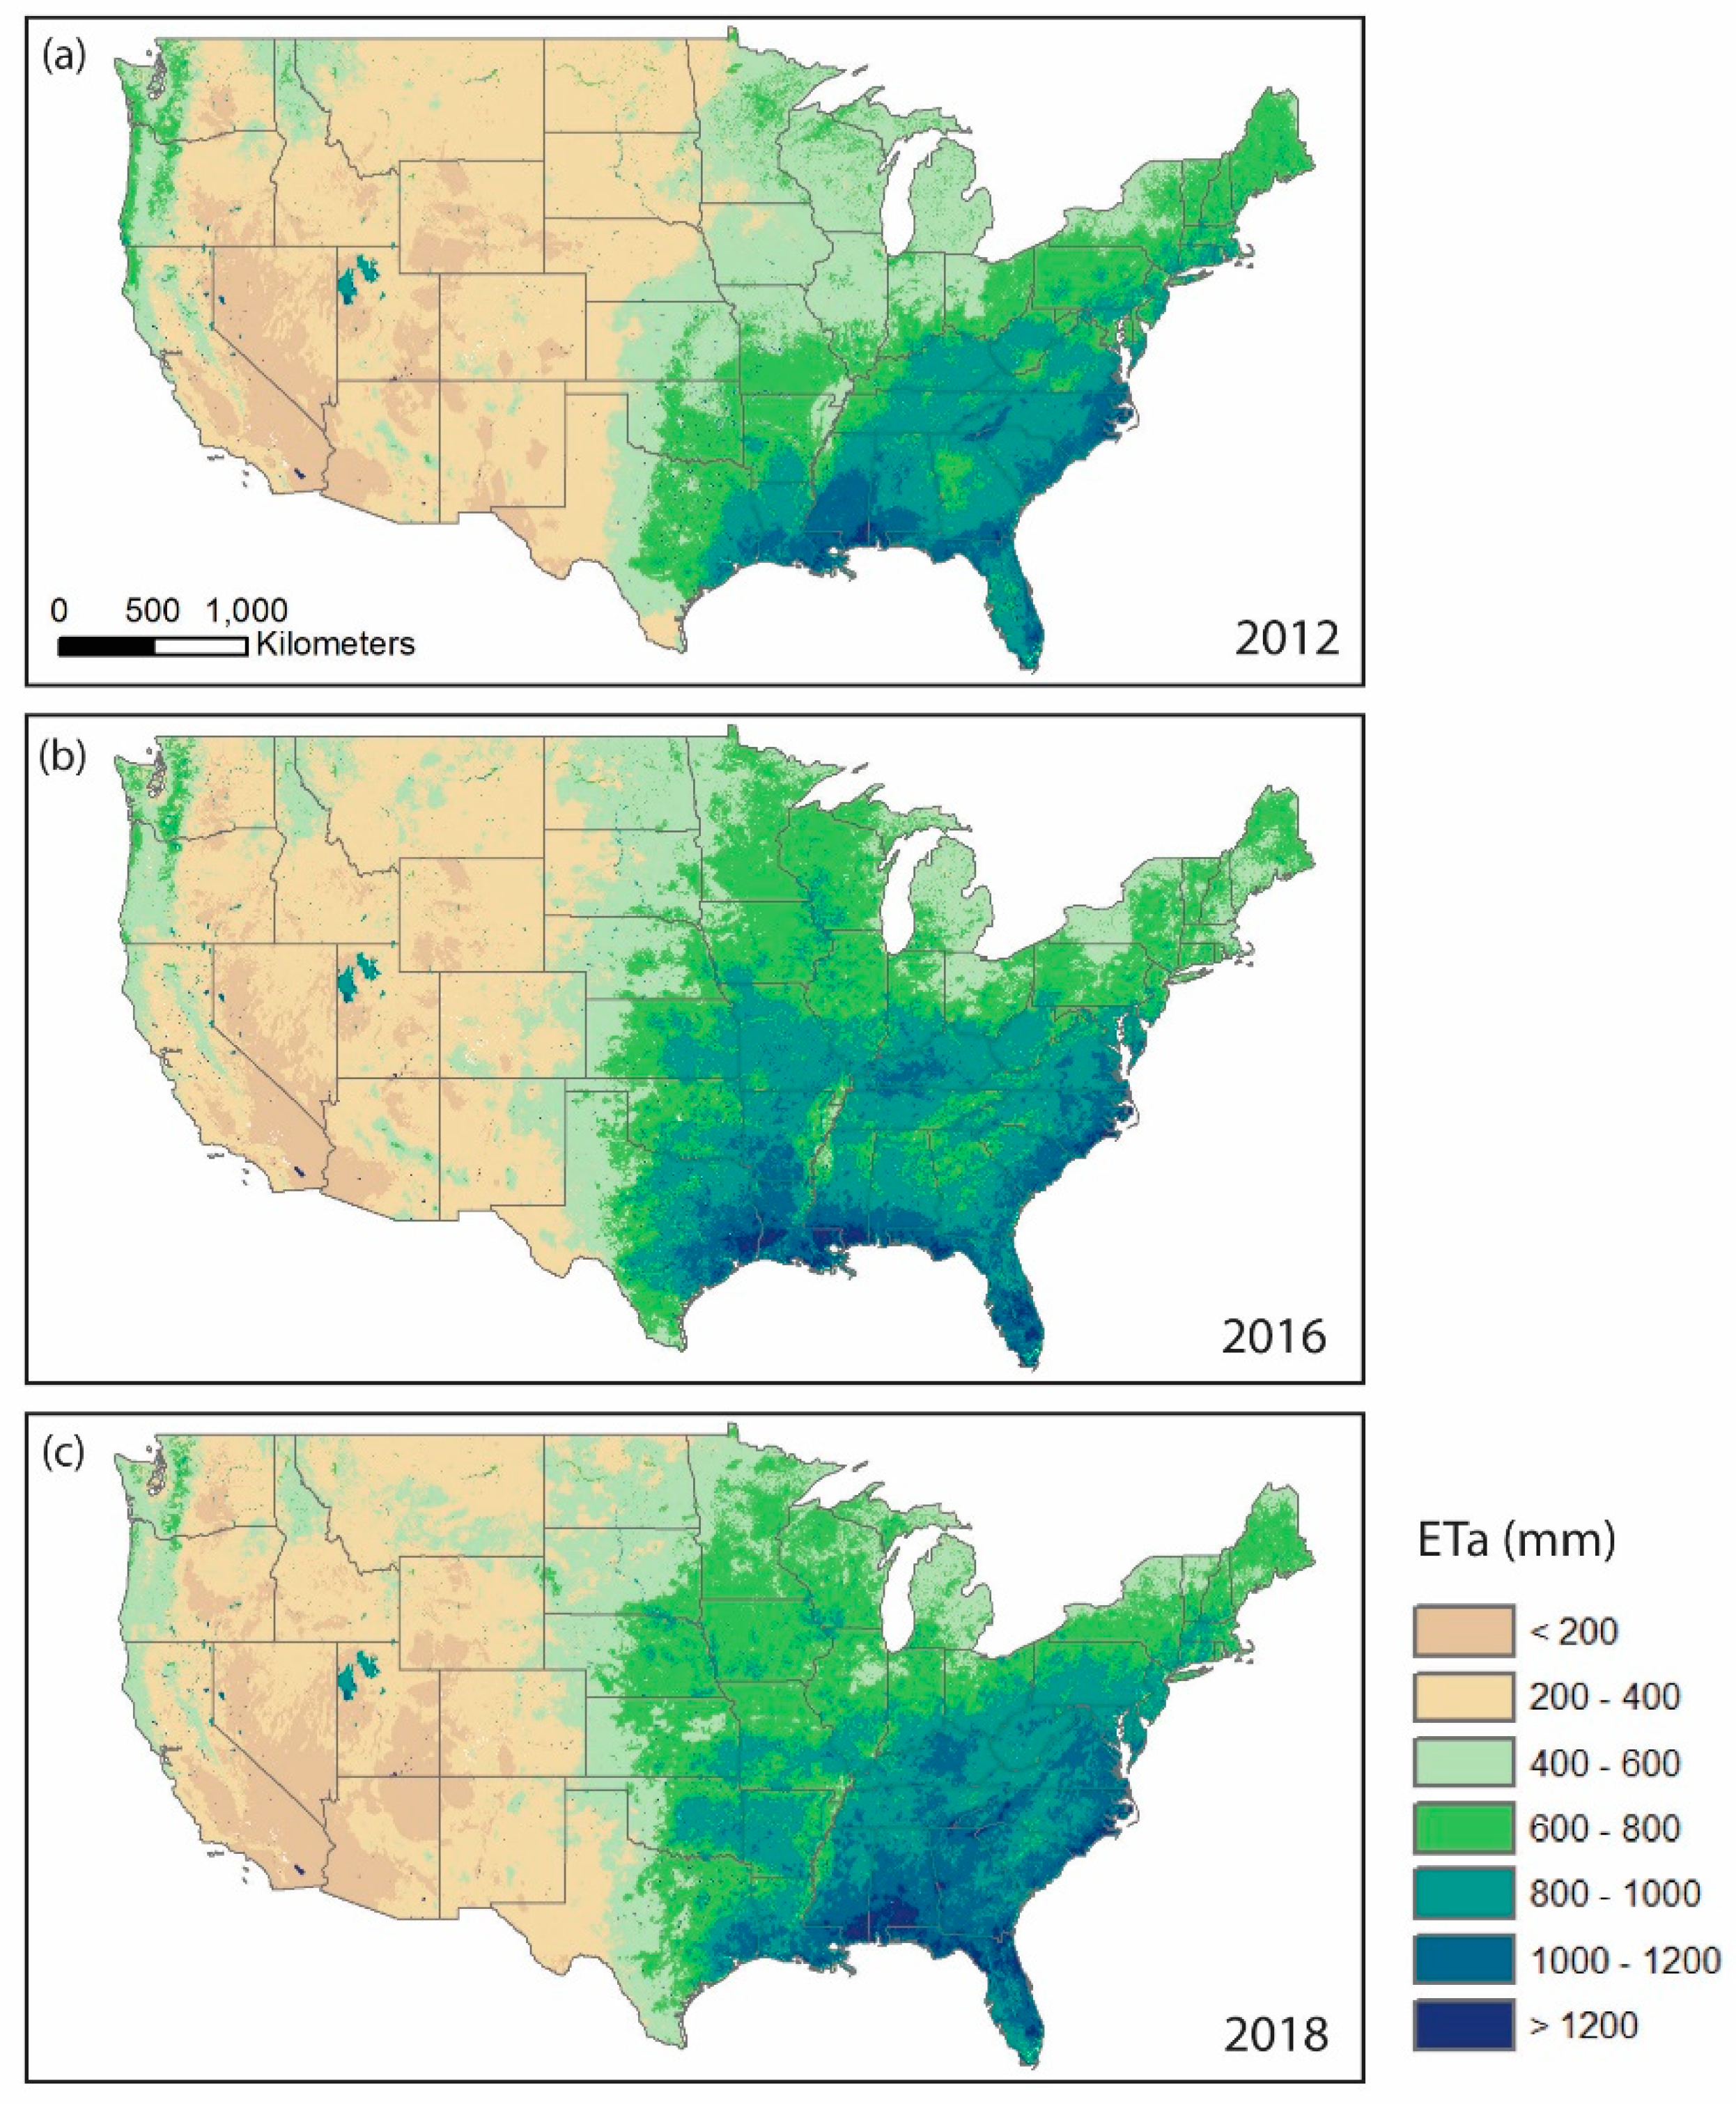
Figure 7.
VegET relative soil moisture as percentage of water holding capacity (WHC) for (a) 1 October 2017, (b) 1 January 2018, (c) 1 April 2018, and (d) 1 July 2018.
Figure 7.
VegET relative soil moisture as percentage of water holding capacity (WHC) for (a) 1 October 2017, (b) 1 January 2018, (c) 1 April 2018, and (d) 1 July 2018.
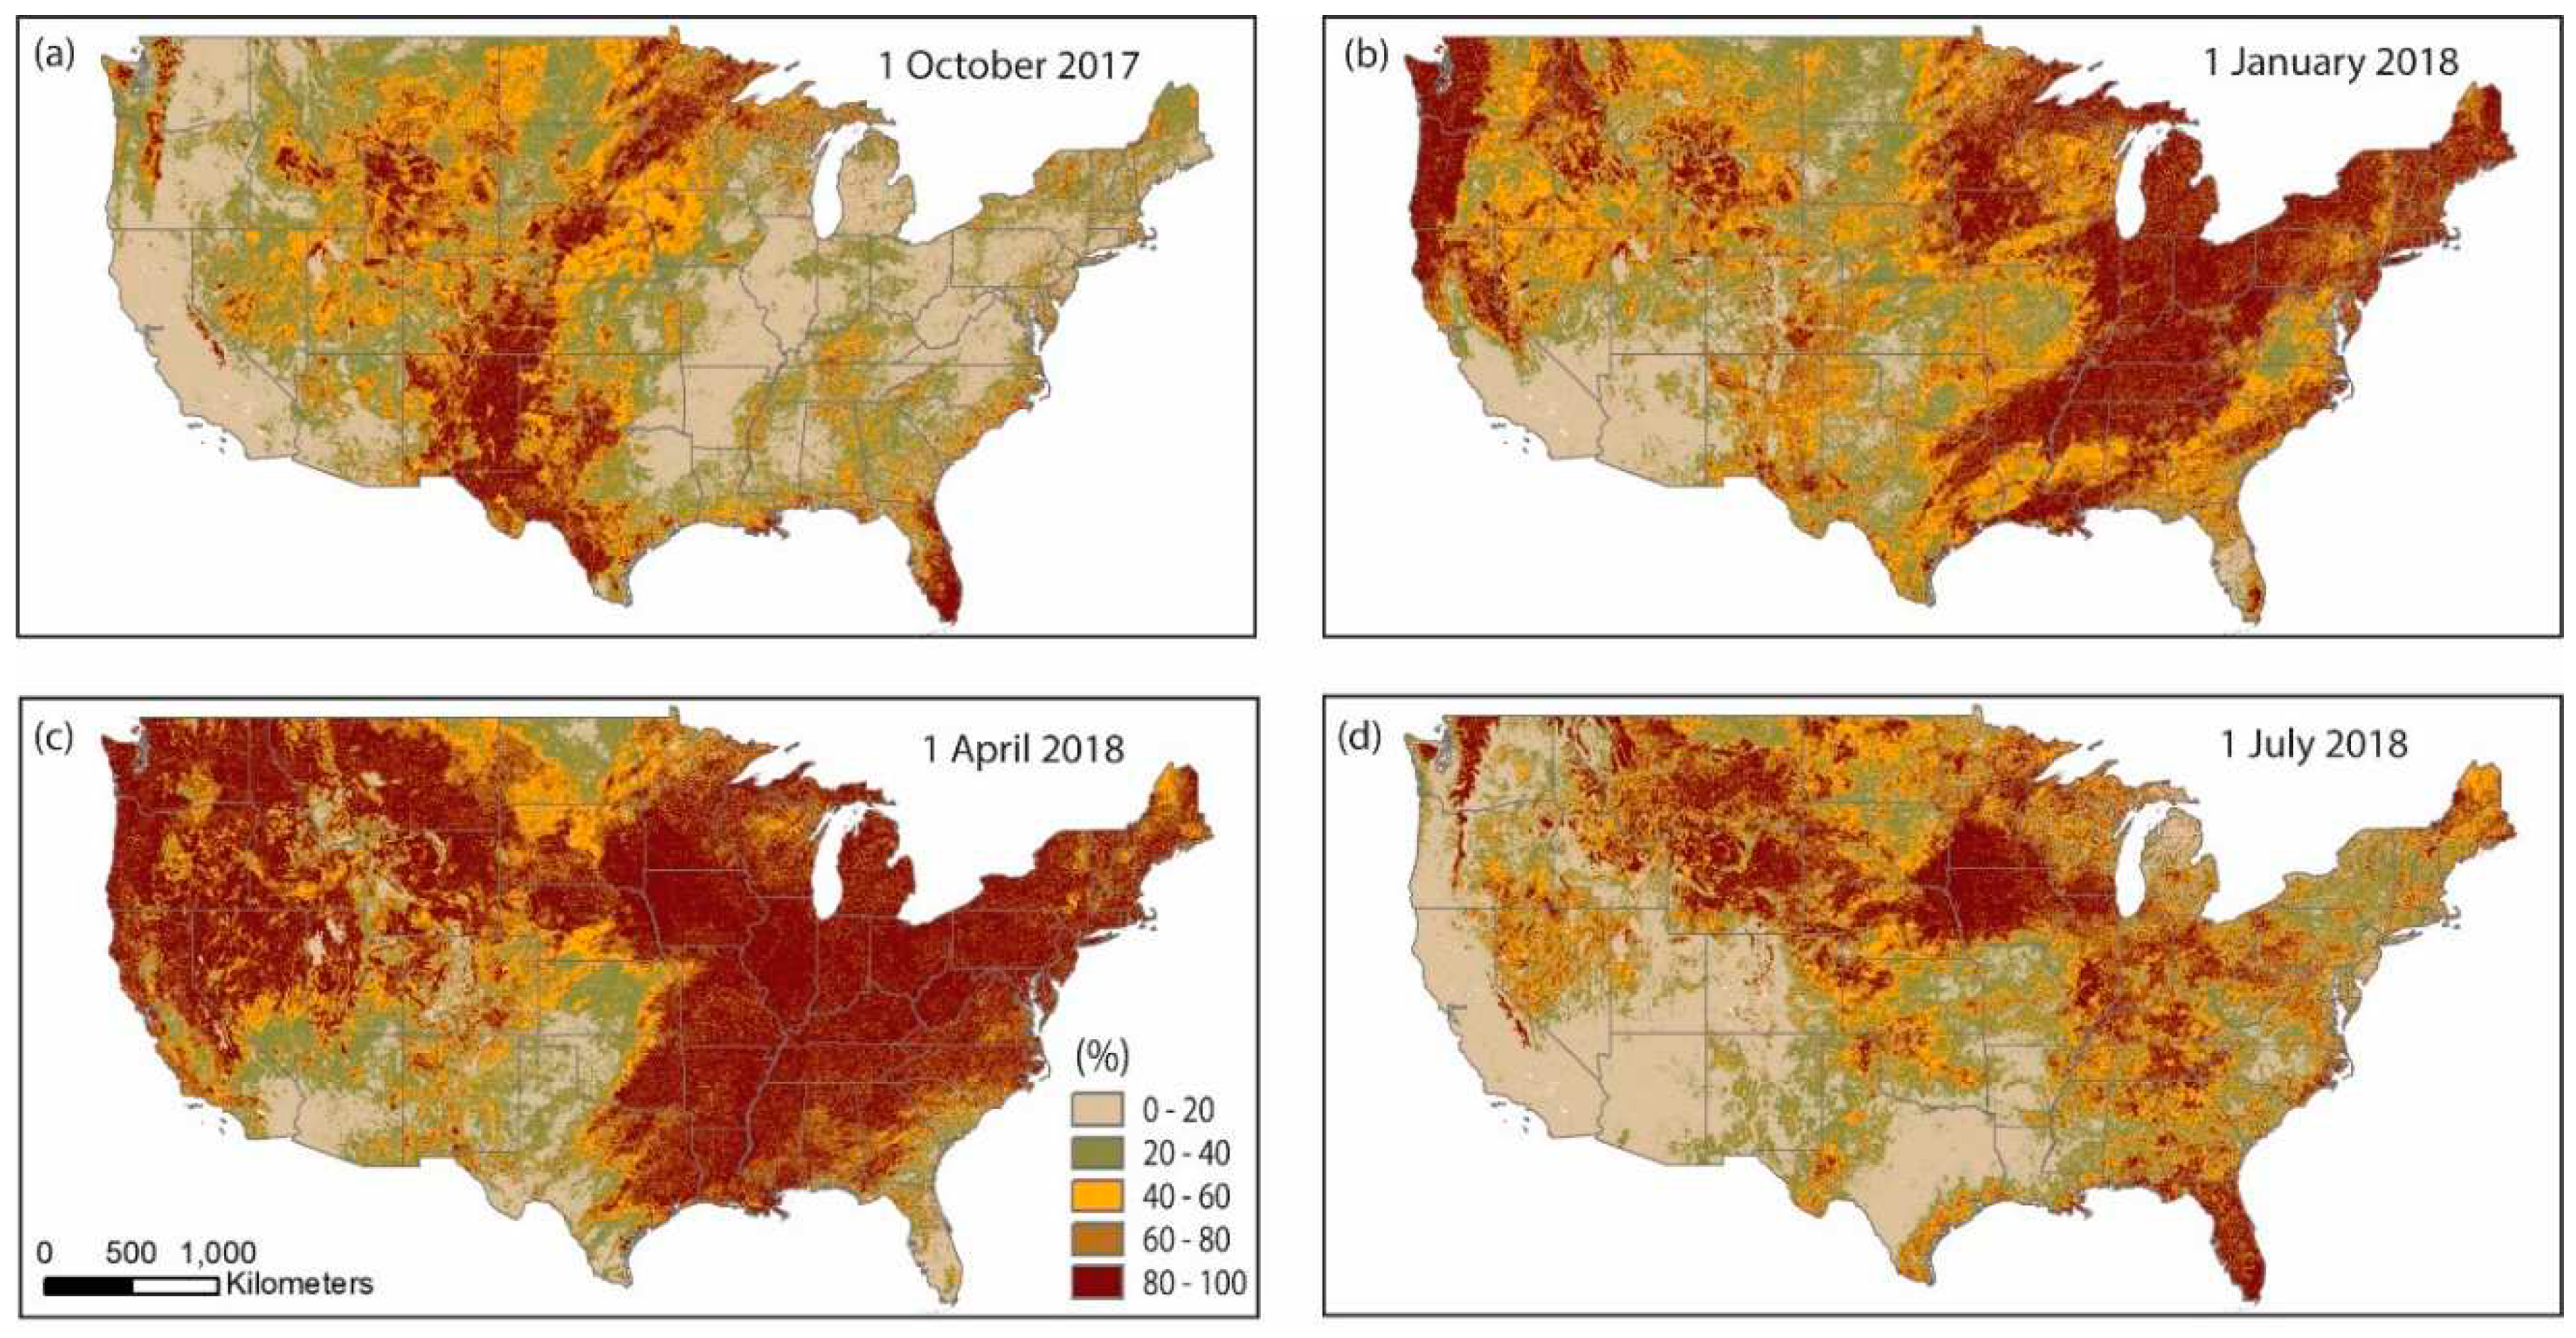
Figure 8.
VegET snowpack as snow water equivalent (SWE) (mm) for (a) 1 October 2017, (b) 1 January 2018, (c) 1 April 2018, and (d) 1 July 2018. October shows the least amount of snow spatial coverage with January showing the largest areal extent.
Figure 8.
VegET snowpack as snow water equivalent (SWE) (mm) for (a) 1 October 2017, (b) 1 January 2018, (c) 1 April 2018, and (d) 1 July 2018. October shows the least amount of snow spatial coverage with January showing the largest areal extent.
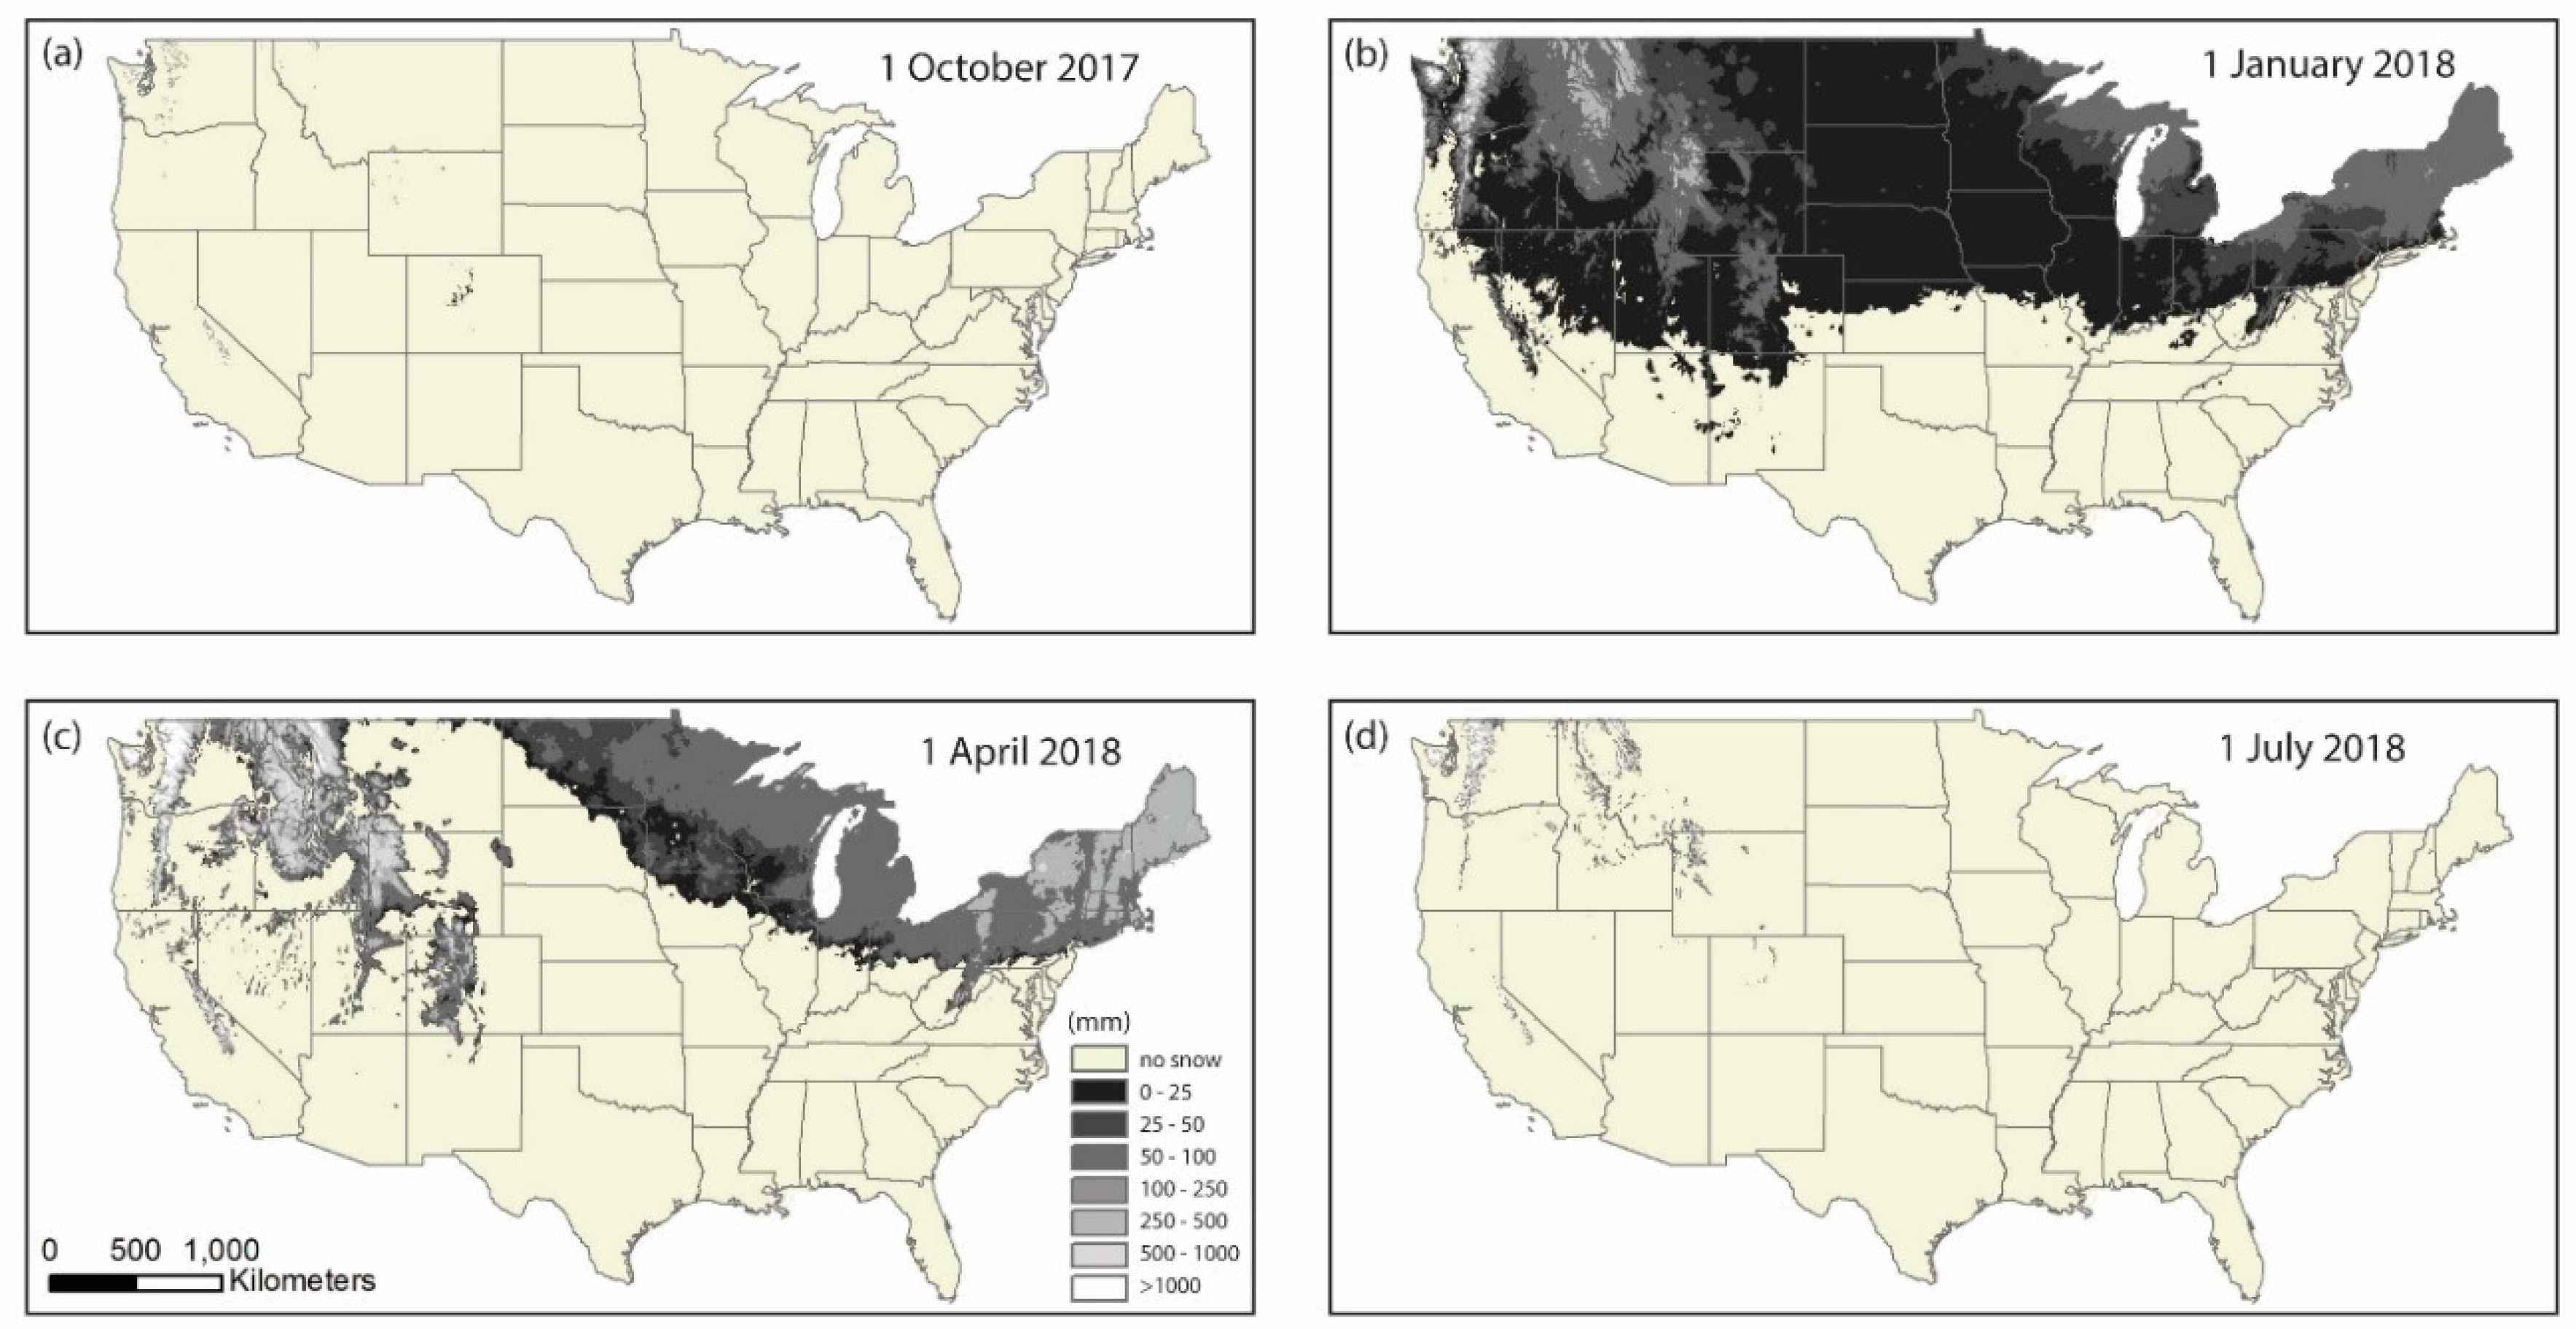
Figure 9.
Three Soil Climate Analysis Network (SCAN) sites showing daily simulated (VegET model) and observed soil moisture (SM) [45] along with precipitation for the growing season (May-September) in 2019. (a) Crescent Lake # 1, water holding capacity (WHC) = 70 mm; (b) Fort Reno #1, WHC=190 mm; and (c) Jornada Exp Range, WHC=140 mm. The maximum magnitude of the simulated SM corresponds to field capacity (FC) of the soil. The observed SM is not confined to a maximum of FC and thus could include gravity water between soil saturation (SAT) and FC. Temporal-pattern comparison is more meaningful than absolute magnitudes.
Figure 9.
Three Soil Climate Analysis Network (SCAN) sites showing daily simulated (VegET model) and observed soil moisture (SM) [45] along with precipitation for the growing season (May-September) in 2019. (a) Crescent Lake # 1, water holding capacity (WHC) = 70 mm; (b) Fort Reno #1, WHC=190 mm; and (c) Jornada Exp Range, WHC=140 mm. The maximum magnitude of the simulated SM corresponds to field capacity (FC) of the soil. The observed SM is not confined to a maximum of FC and thus could include gravity water between soil saturation (SAT) and FC. Temporal-pattern comparison is more meaningful than absolute magnitudes.
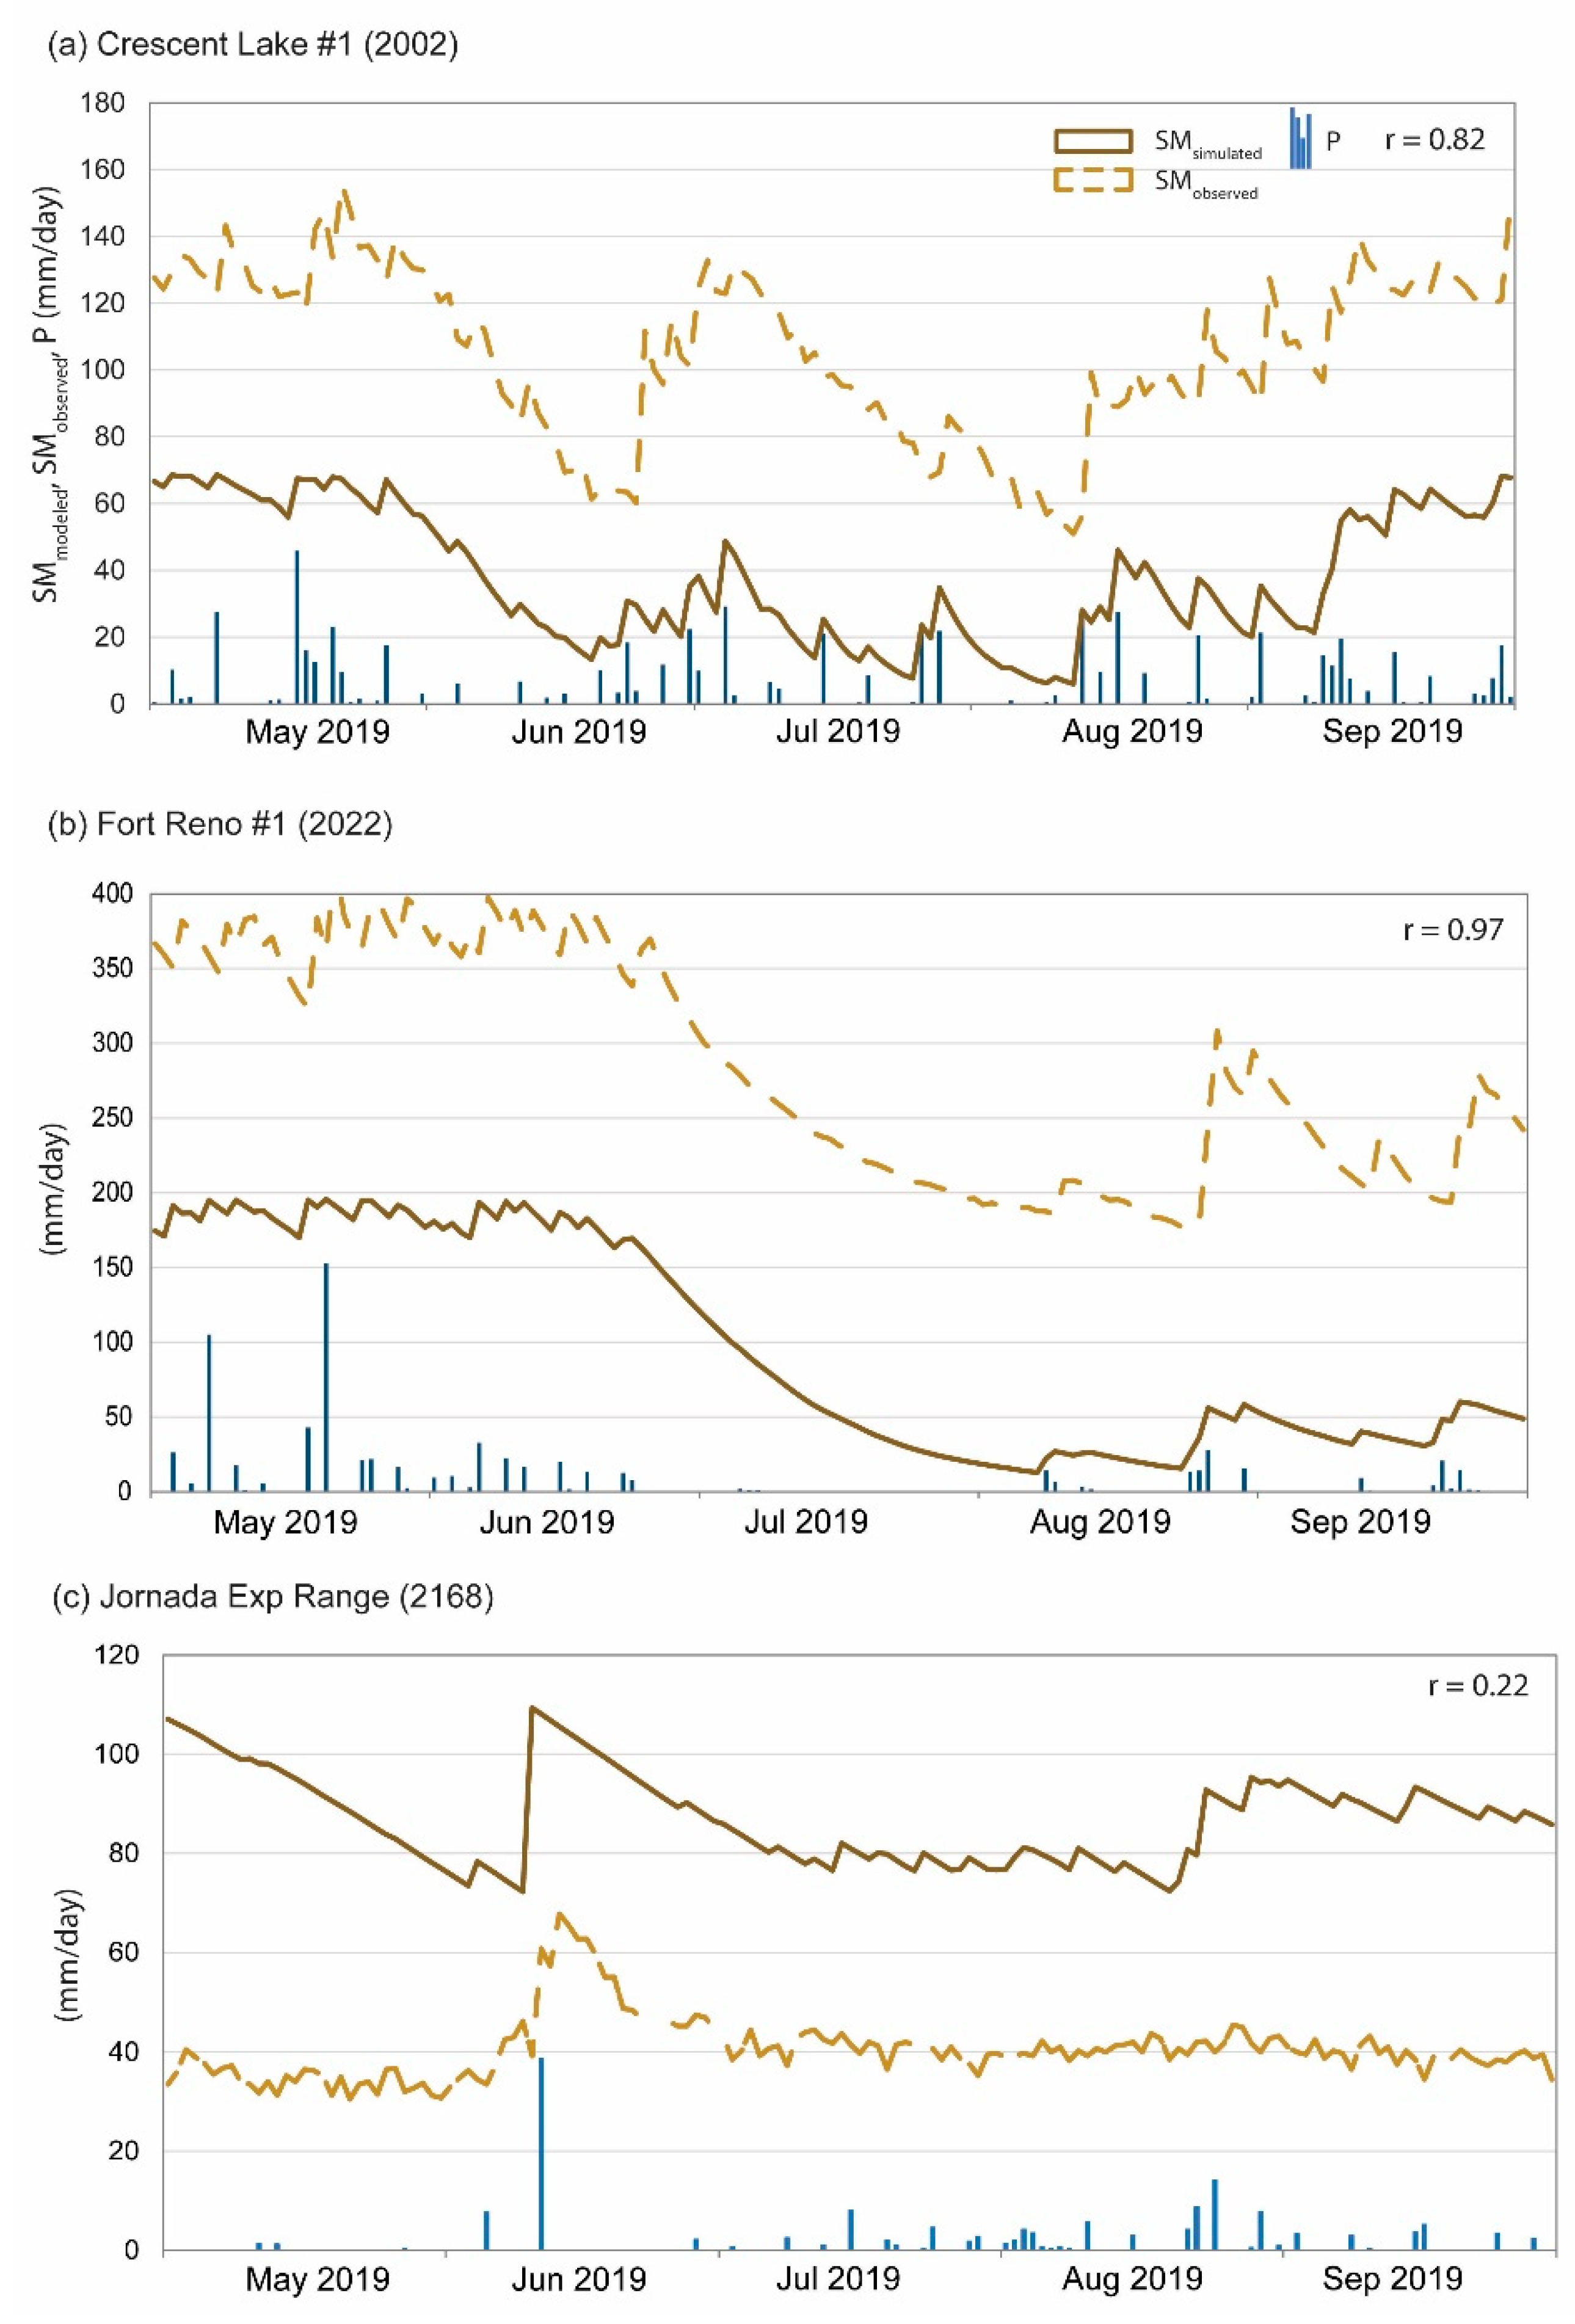
Figure 10.
SNOpack TELemetry (SNOTEL) sites showing daily observed [46] and simulated (VegET model) snowpack as snow water equivalent (SWE) (mm) for 2015/2016 to 2019/2020 at (a) Cole Canyon, (b) Columbine Pass, and (c) Sierra Blanca.
Figure 10.
SNOpack TELemetry (SNOTEL) sites showing daily observed [46] and simulated (VegET model) snowpack as snow water equivalent (SWE) (mm) for 2015/2016 to 2019/2020 at (a) Cole Canyon, (b) Columbine Pass, and (c) Sierra Blanca.
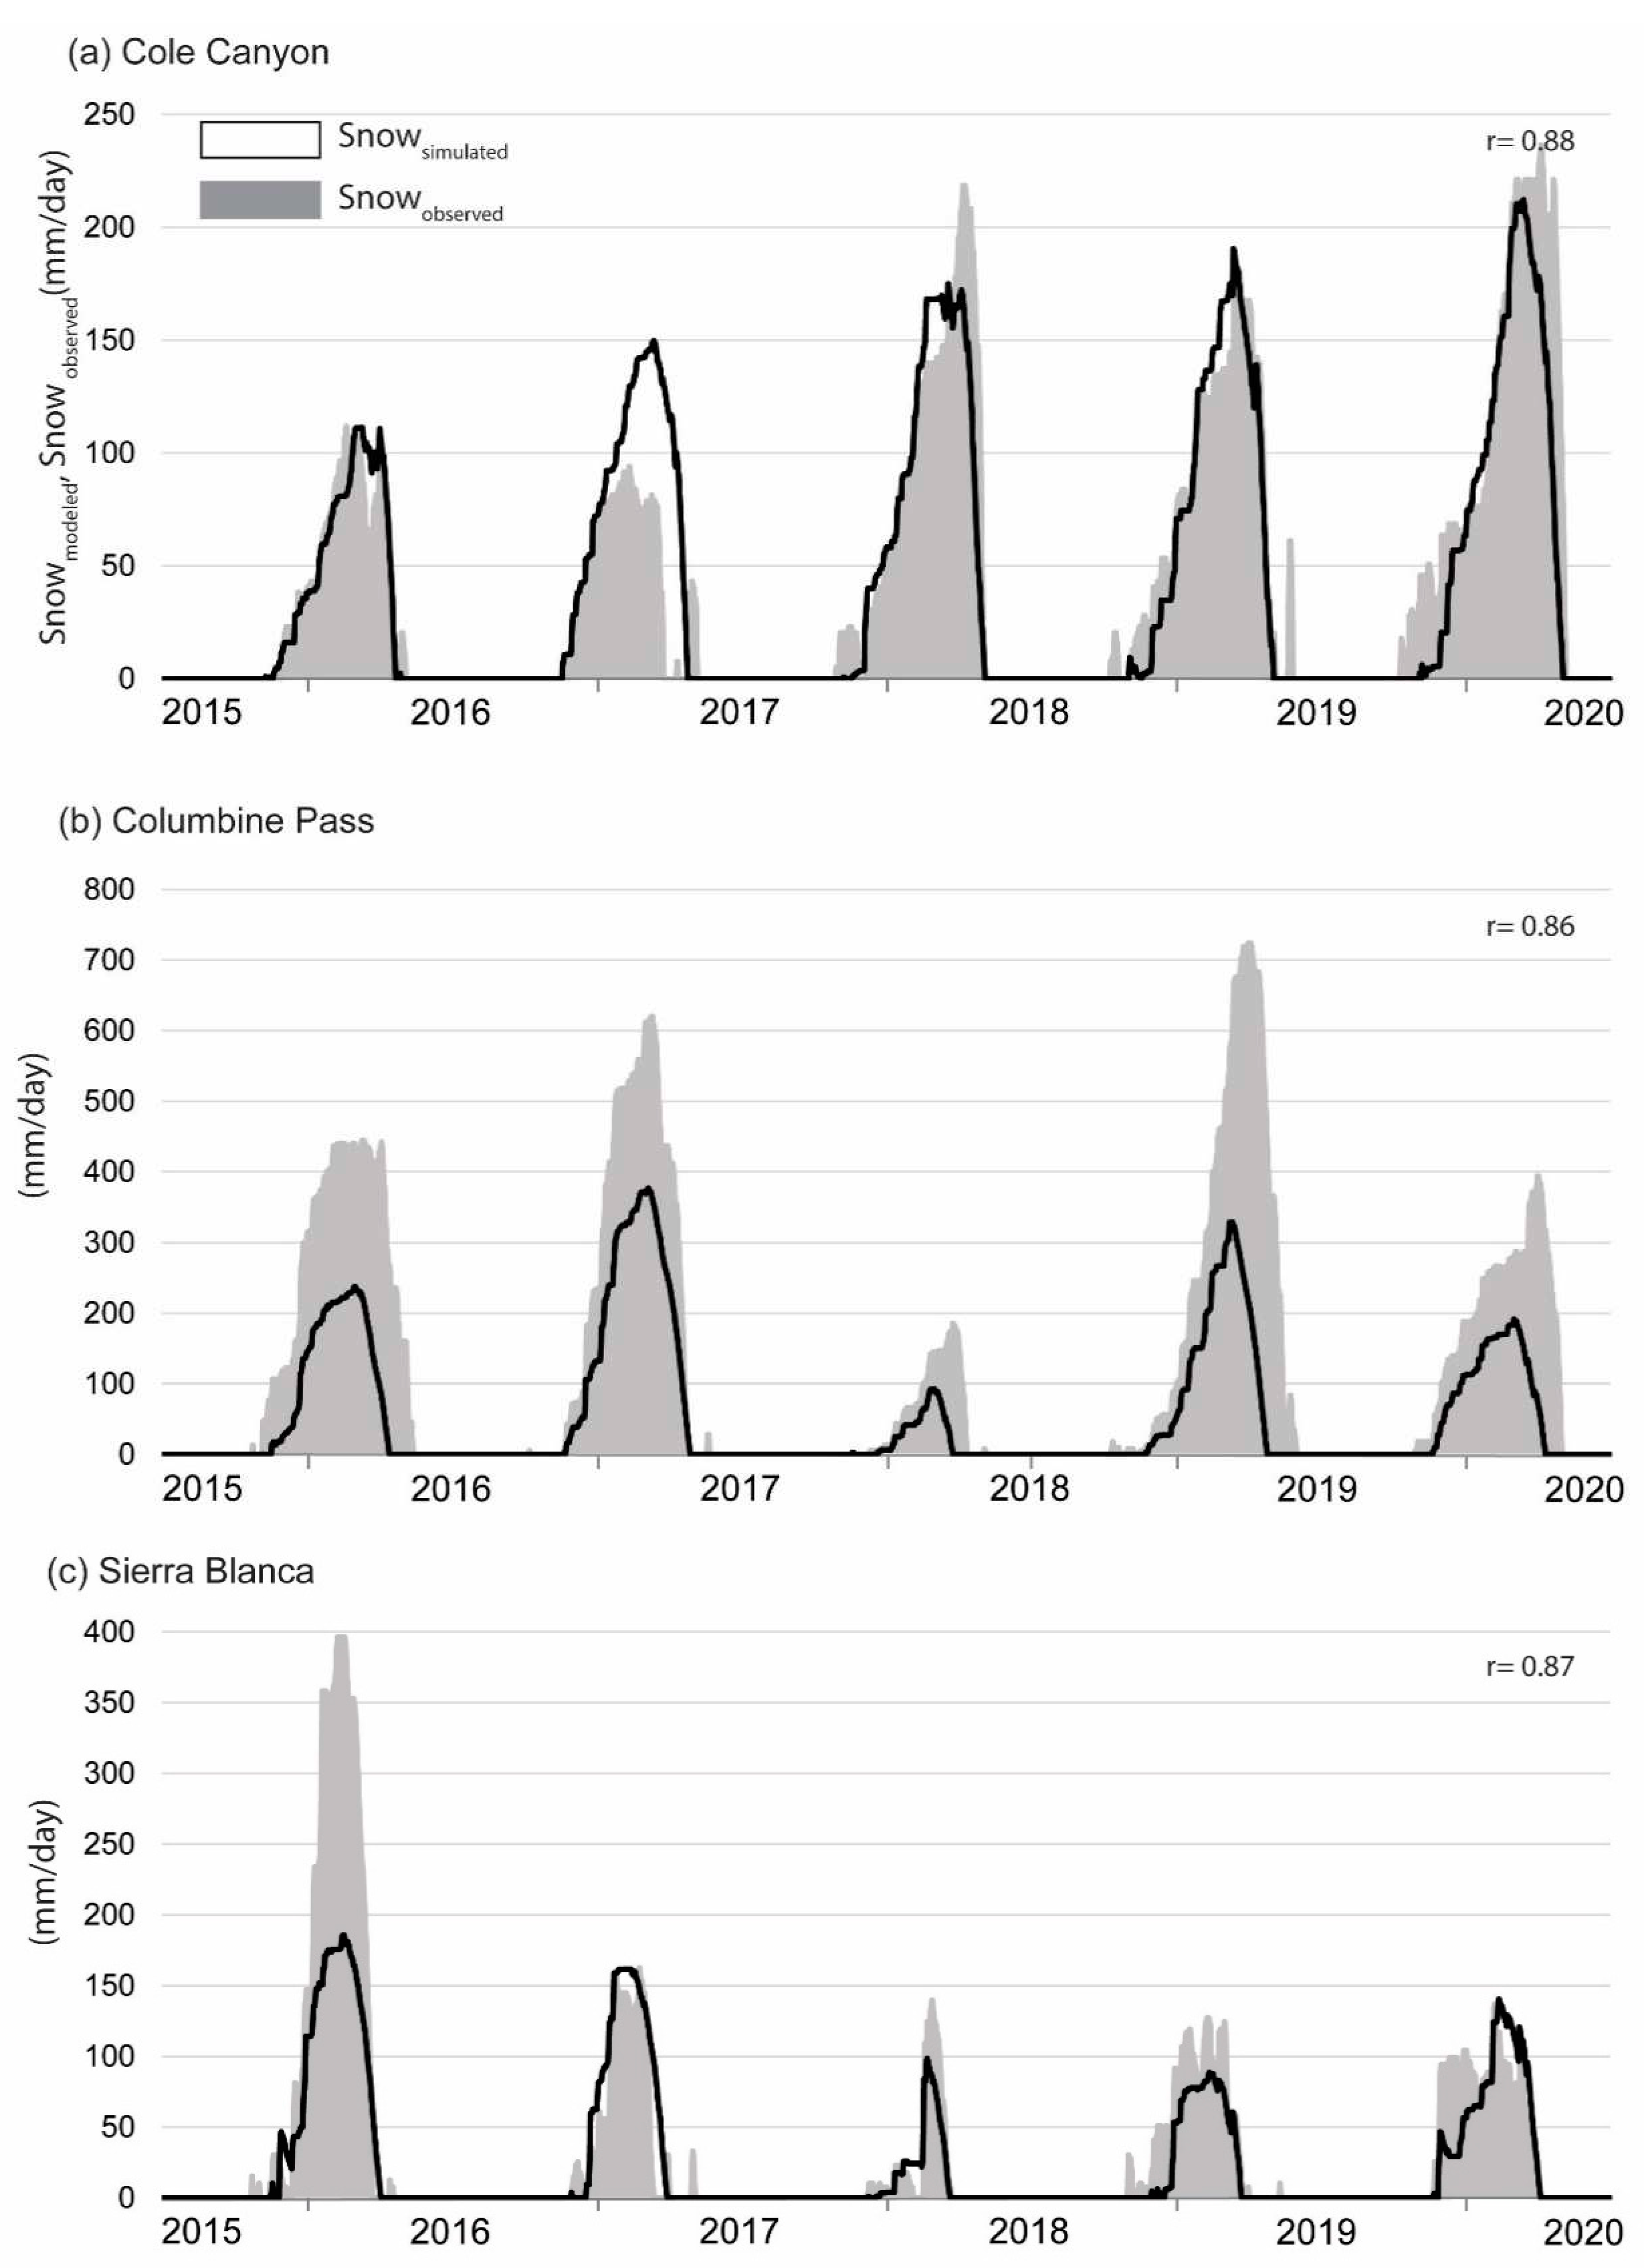
Figure 11.
Monthly traces of observed [48] and simulated (VegET) ETa time series at three eddy covariance (EC) flux sites during 2009 to 2012: (a) US-AR1 (grassland), (b) US-Ne3 (rainfed crop), and (c) US-Var (grassland). Daily data were aggregated to monthly for clarity of display and interpretation.
Figure 11.
Monthly traces of observed [48] and simulated (VegET) ETa time series at three eddy covariance (EC) flux sites during 2009 to 2012: (a) US-AR1 (grassland), (b) US-Ne3 (rainfed crop), and (c) US-Var (grassland). Daily data were aggregated to monthly for clarity of display and interpretation.

Figure 12.
Scatterplot showing the relationship between simulated (VegET) and observed (WaterWatch [49]) annual runoff at eight-digit hydrologic unit code (HUC8) scale for three water years (2012, 2016, 2018) using N number of watersheds across the conterminous United States.
Figure 12.
Scatterplot showing the relationship between simulated (VegET) and observed (WaterWatch [49]) annual runoff at eight-digit hydrologic unit code (HUC8) scale for three water years (2012, 2016, 2018) using N number of watersheds across the conterminous United States.
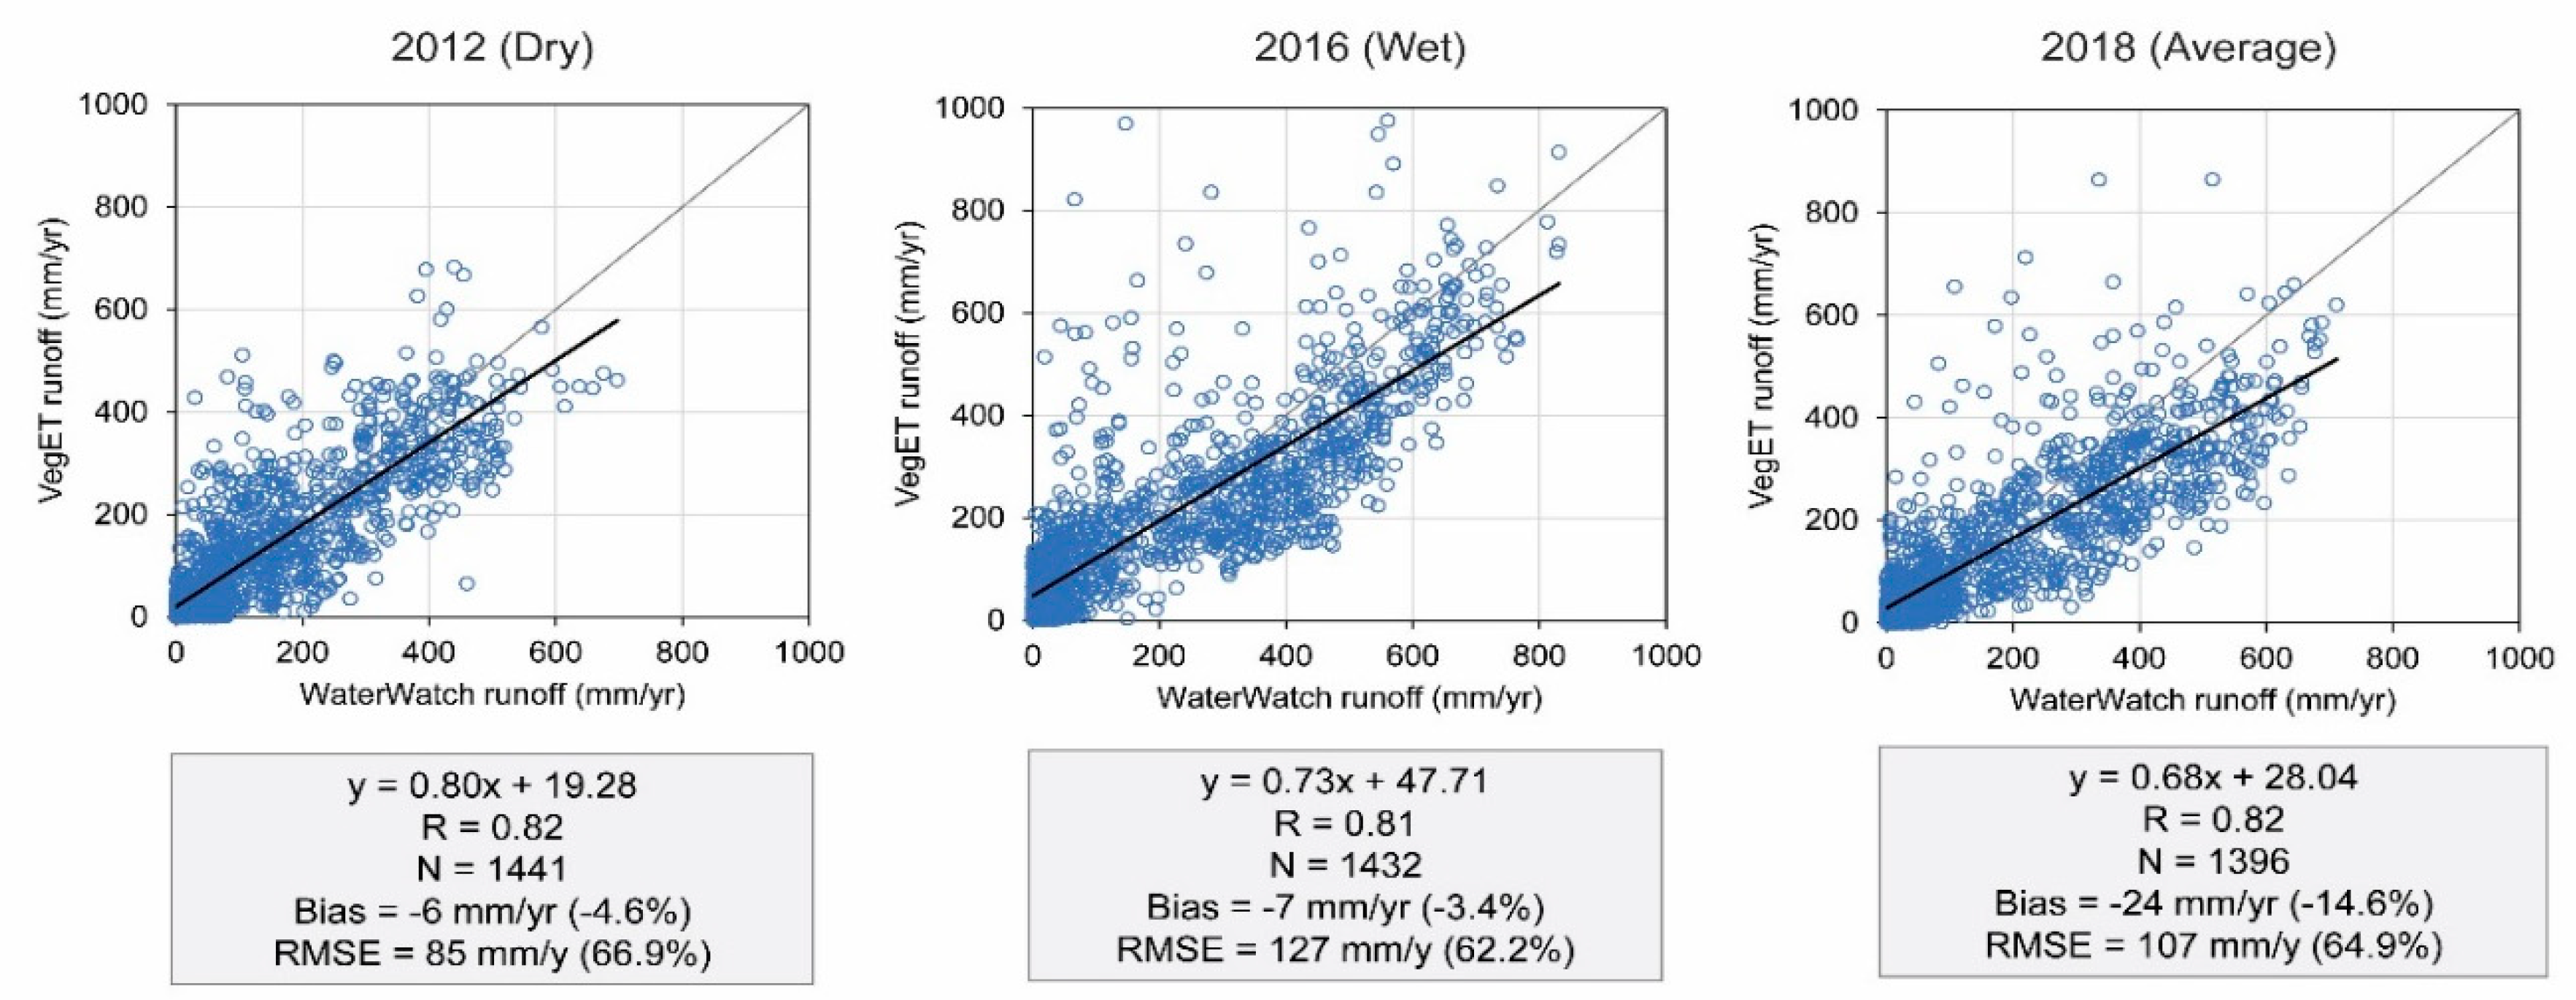
Figure 13.
Major water balance components for the Upper Mississippi River Basin for water year 2012 (a) precipitation (P) from gridMET [30], (b) actual evapotranspiration (ETa) from VegET, (c) surface runoff (R) from VegET, and (d) monthly P, ETa, and runoff (simulated R (VegET) and observed R (WaterWatch).
Figure 13.
Major water balance components for the Upper Mississippi River Basin for water year 2012 (a) precipitation (P) from gridMET [30], (b) actual evapotranspiration (ETa) from VegET, (c) surface runoff (R) from VegET, and (d) monthly P, ETa, and runoff (simulated R (VegET) and observed R (WaterWatch).
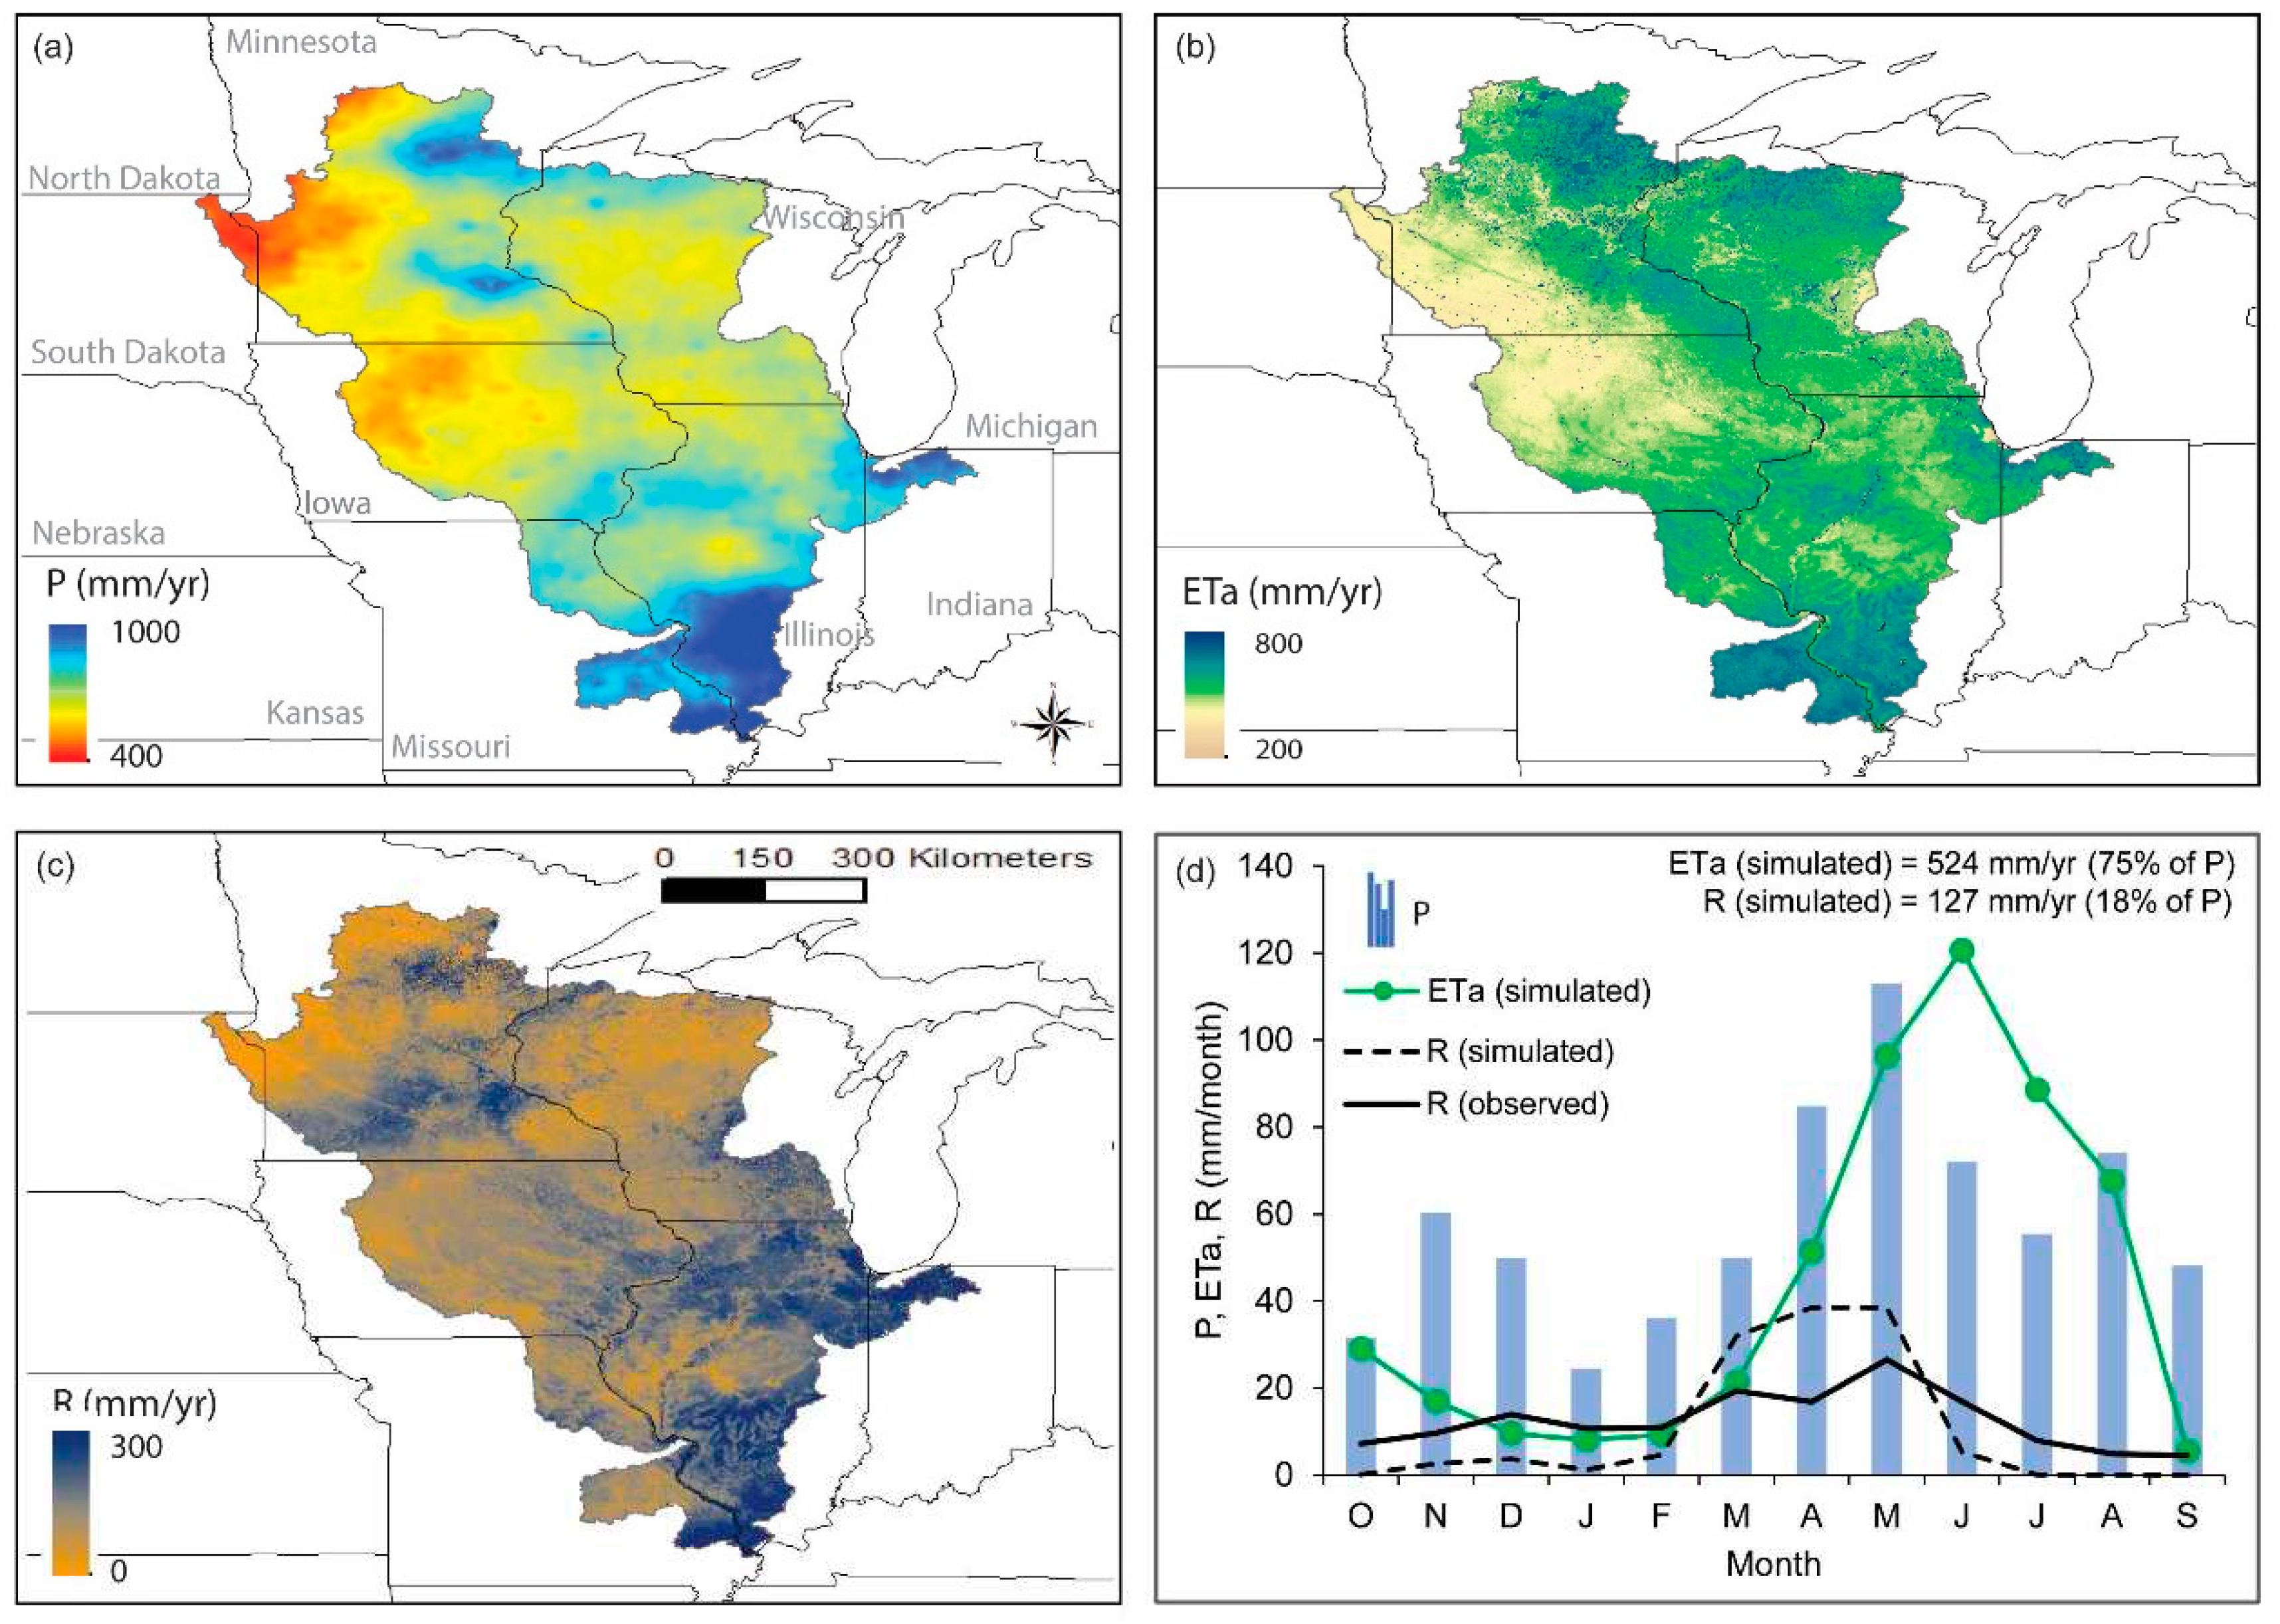
Figure 14.
Illustration of the Landscape Water Requirement Satisfaction Index (L-WRSI) concept using daily precipitation (P), reference ET (ETo), actual evapotranspiration (ETa), and landscape water requirement (ETc) for a pixel near the AmeriFlux Station (US-Ne3) for 2018. Seasonal (89%) and annual L-WRSI (85%) indicate some level of dryness during the growing season and through the year.
Figure 14.
Illustration of the Landscape Water Requirement Satisfaction Index (L-WRSI) concept using daily precipitation (P), reference ET (ETo), actual evapotranspiration (ETa), and landscape water requirement (ETc) for a pixel near the AmeriFlux Station (US-Ne3) for 2018. Seasonal (89%) and annual L-WRSI (85%) indicate some level of dryness during the growing season and through the year.
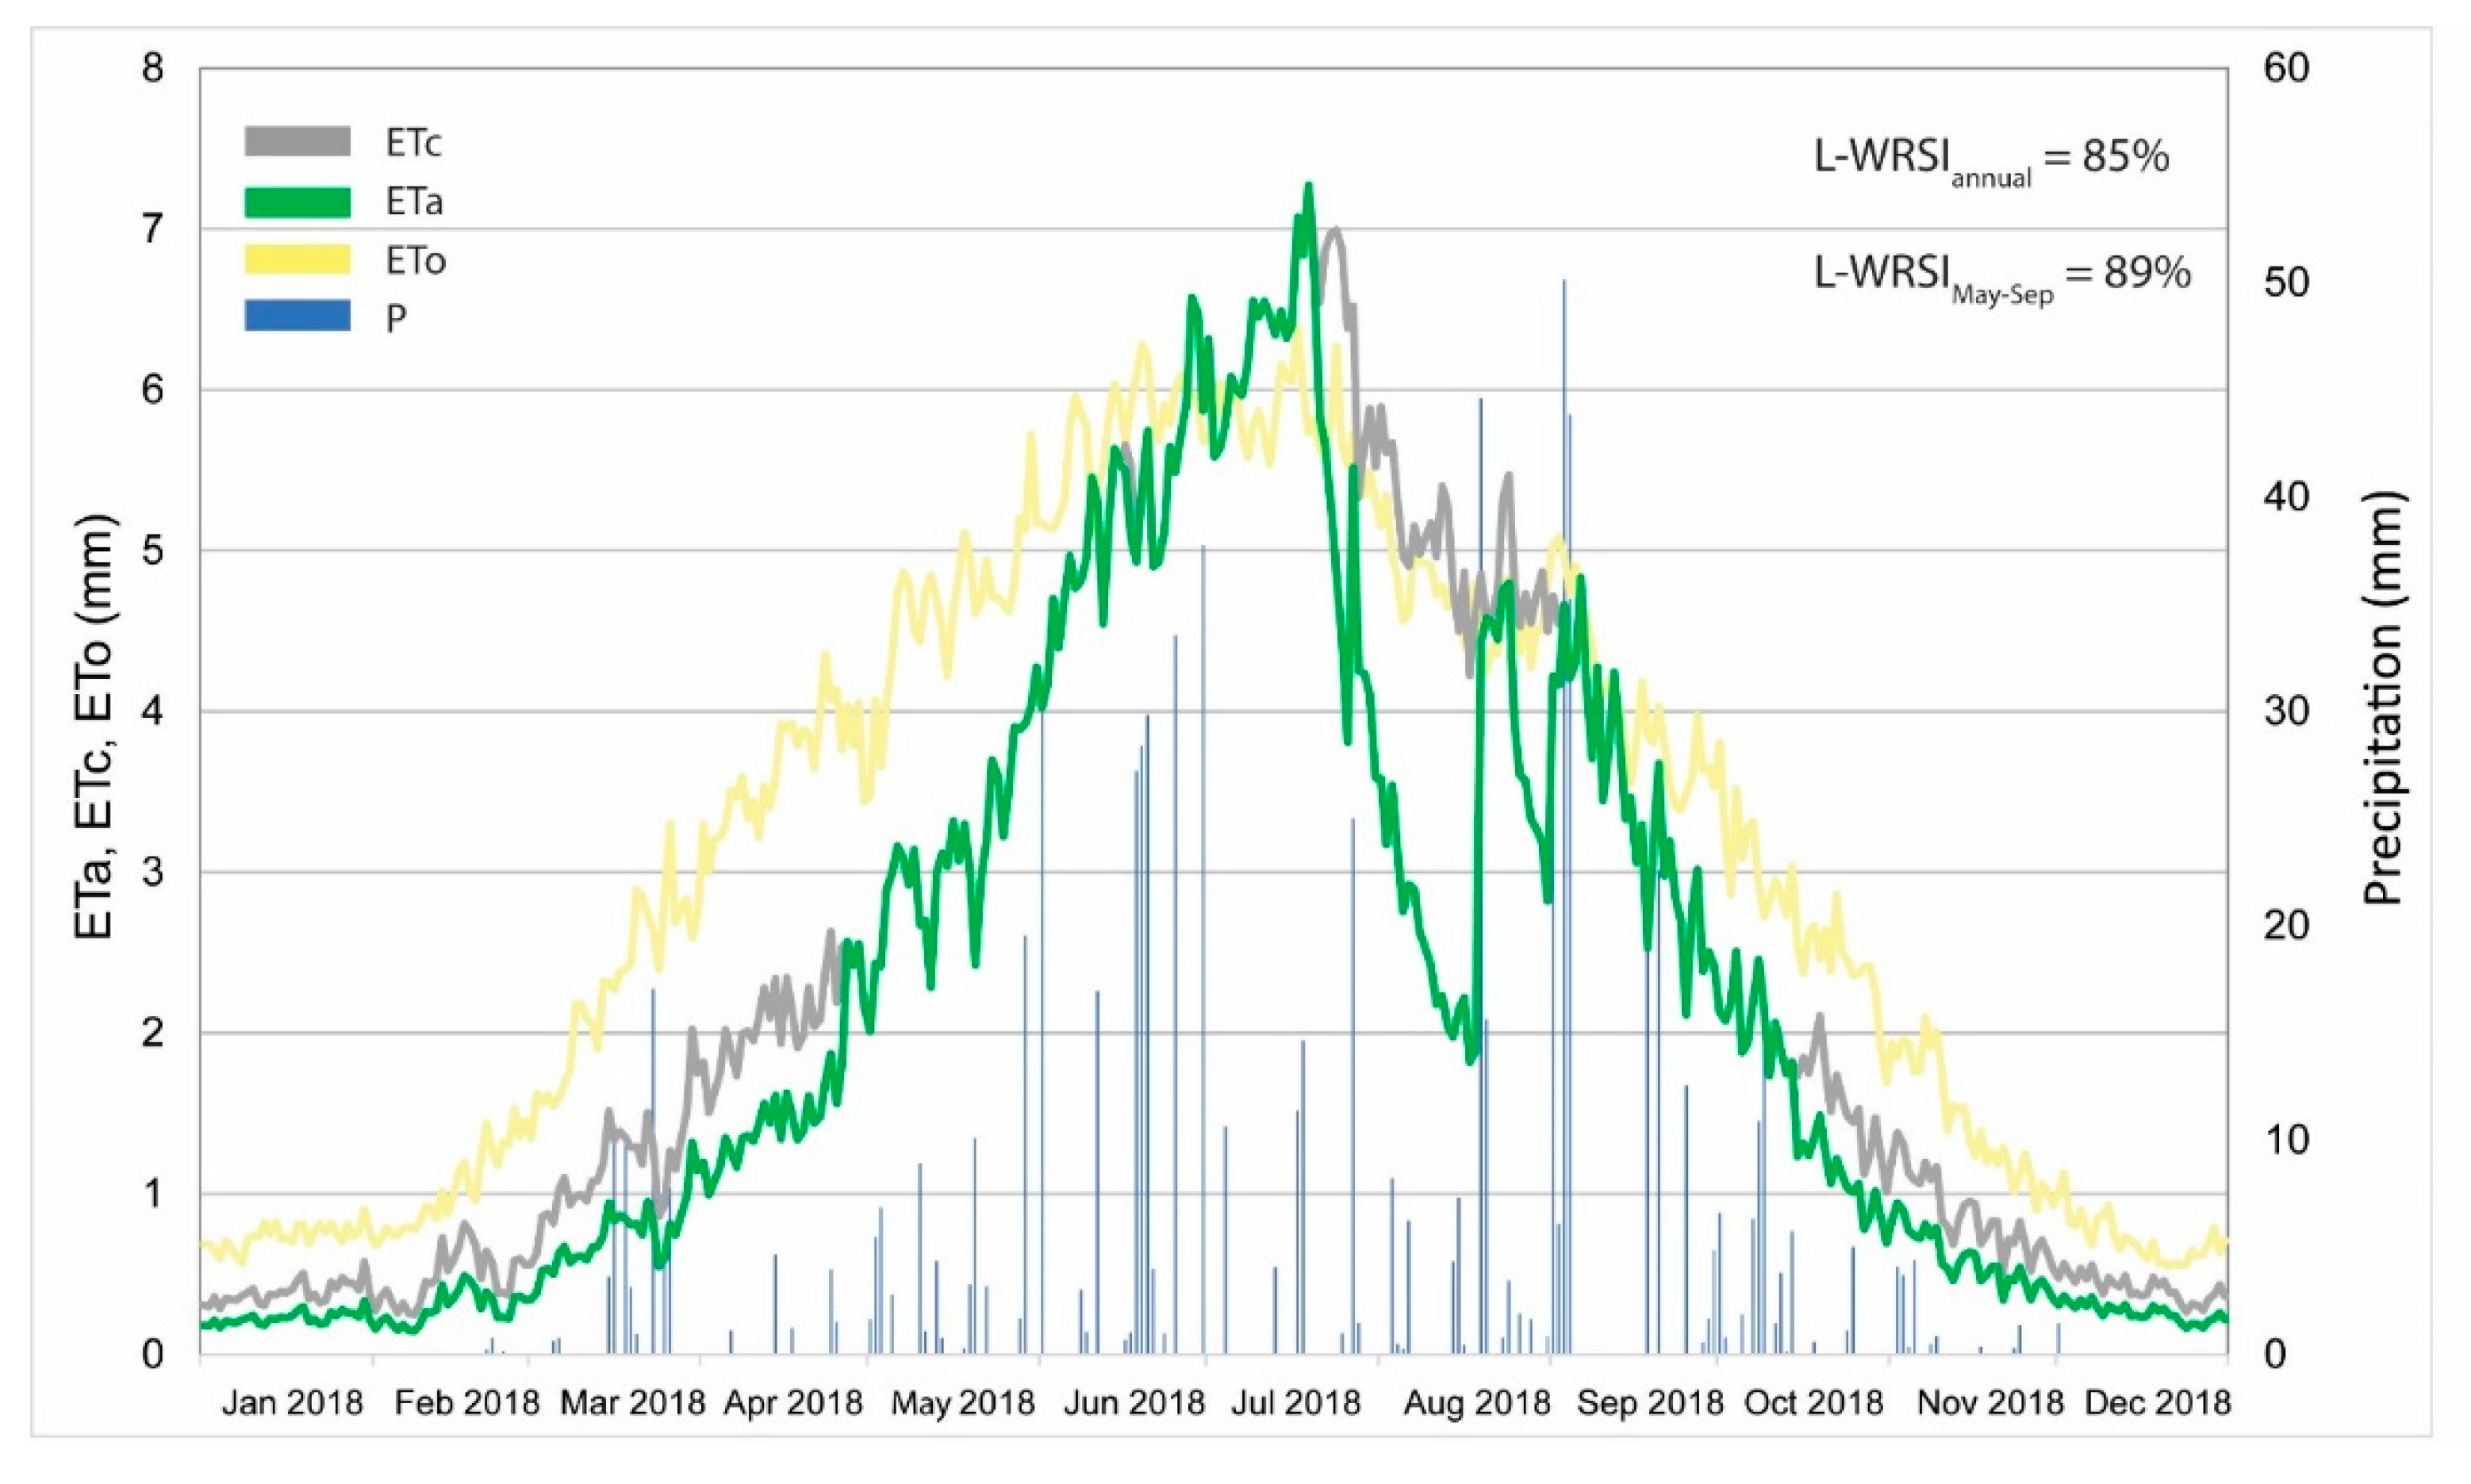
Figure 15.
Growing season (May–September) Landscape Water Requirement Satisfaction Index (L-WRSI) for the conterminous United States for (a) 2012, (b) 2016, and (c) 2018. Values close to 100 (green) show availability of enough precipitation to meet crop requirements during the growing season. L-WRSI < 50 (brown tones) indicate severe moisture deficit in the top 1-m root zone to meet the expected water requirement of the landscape. The index does not account for access to groundwater or irrigation water applications.
Figure 15.
Growing season (May–September) Landscape Water Requirement Satisfaction Index (L-WRSI) for the conterminous United States for (a) 2012, (b) 2016, and (c) 2018. Values close to 100 (green) show availability of enough precipitation to meet crop requirements during the growing season. L-WRSI < 50 (brown tones) indicate severe moisture deficit in the top 1-m root zone to meet the expected water requirement of the landscape. The index does not account for access to groundwater or irrigation water applications.
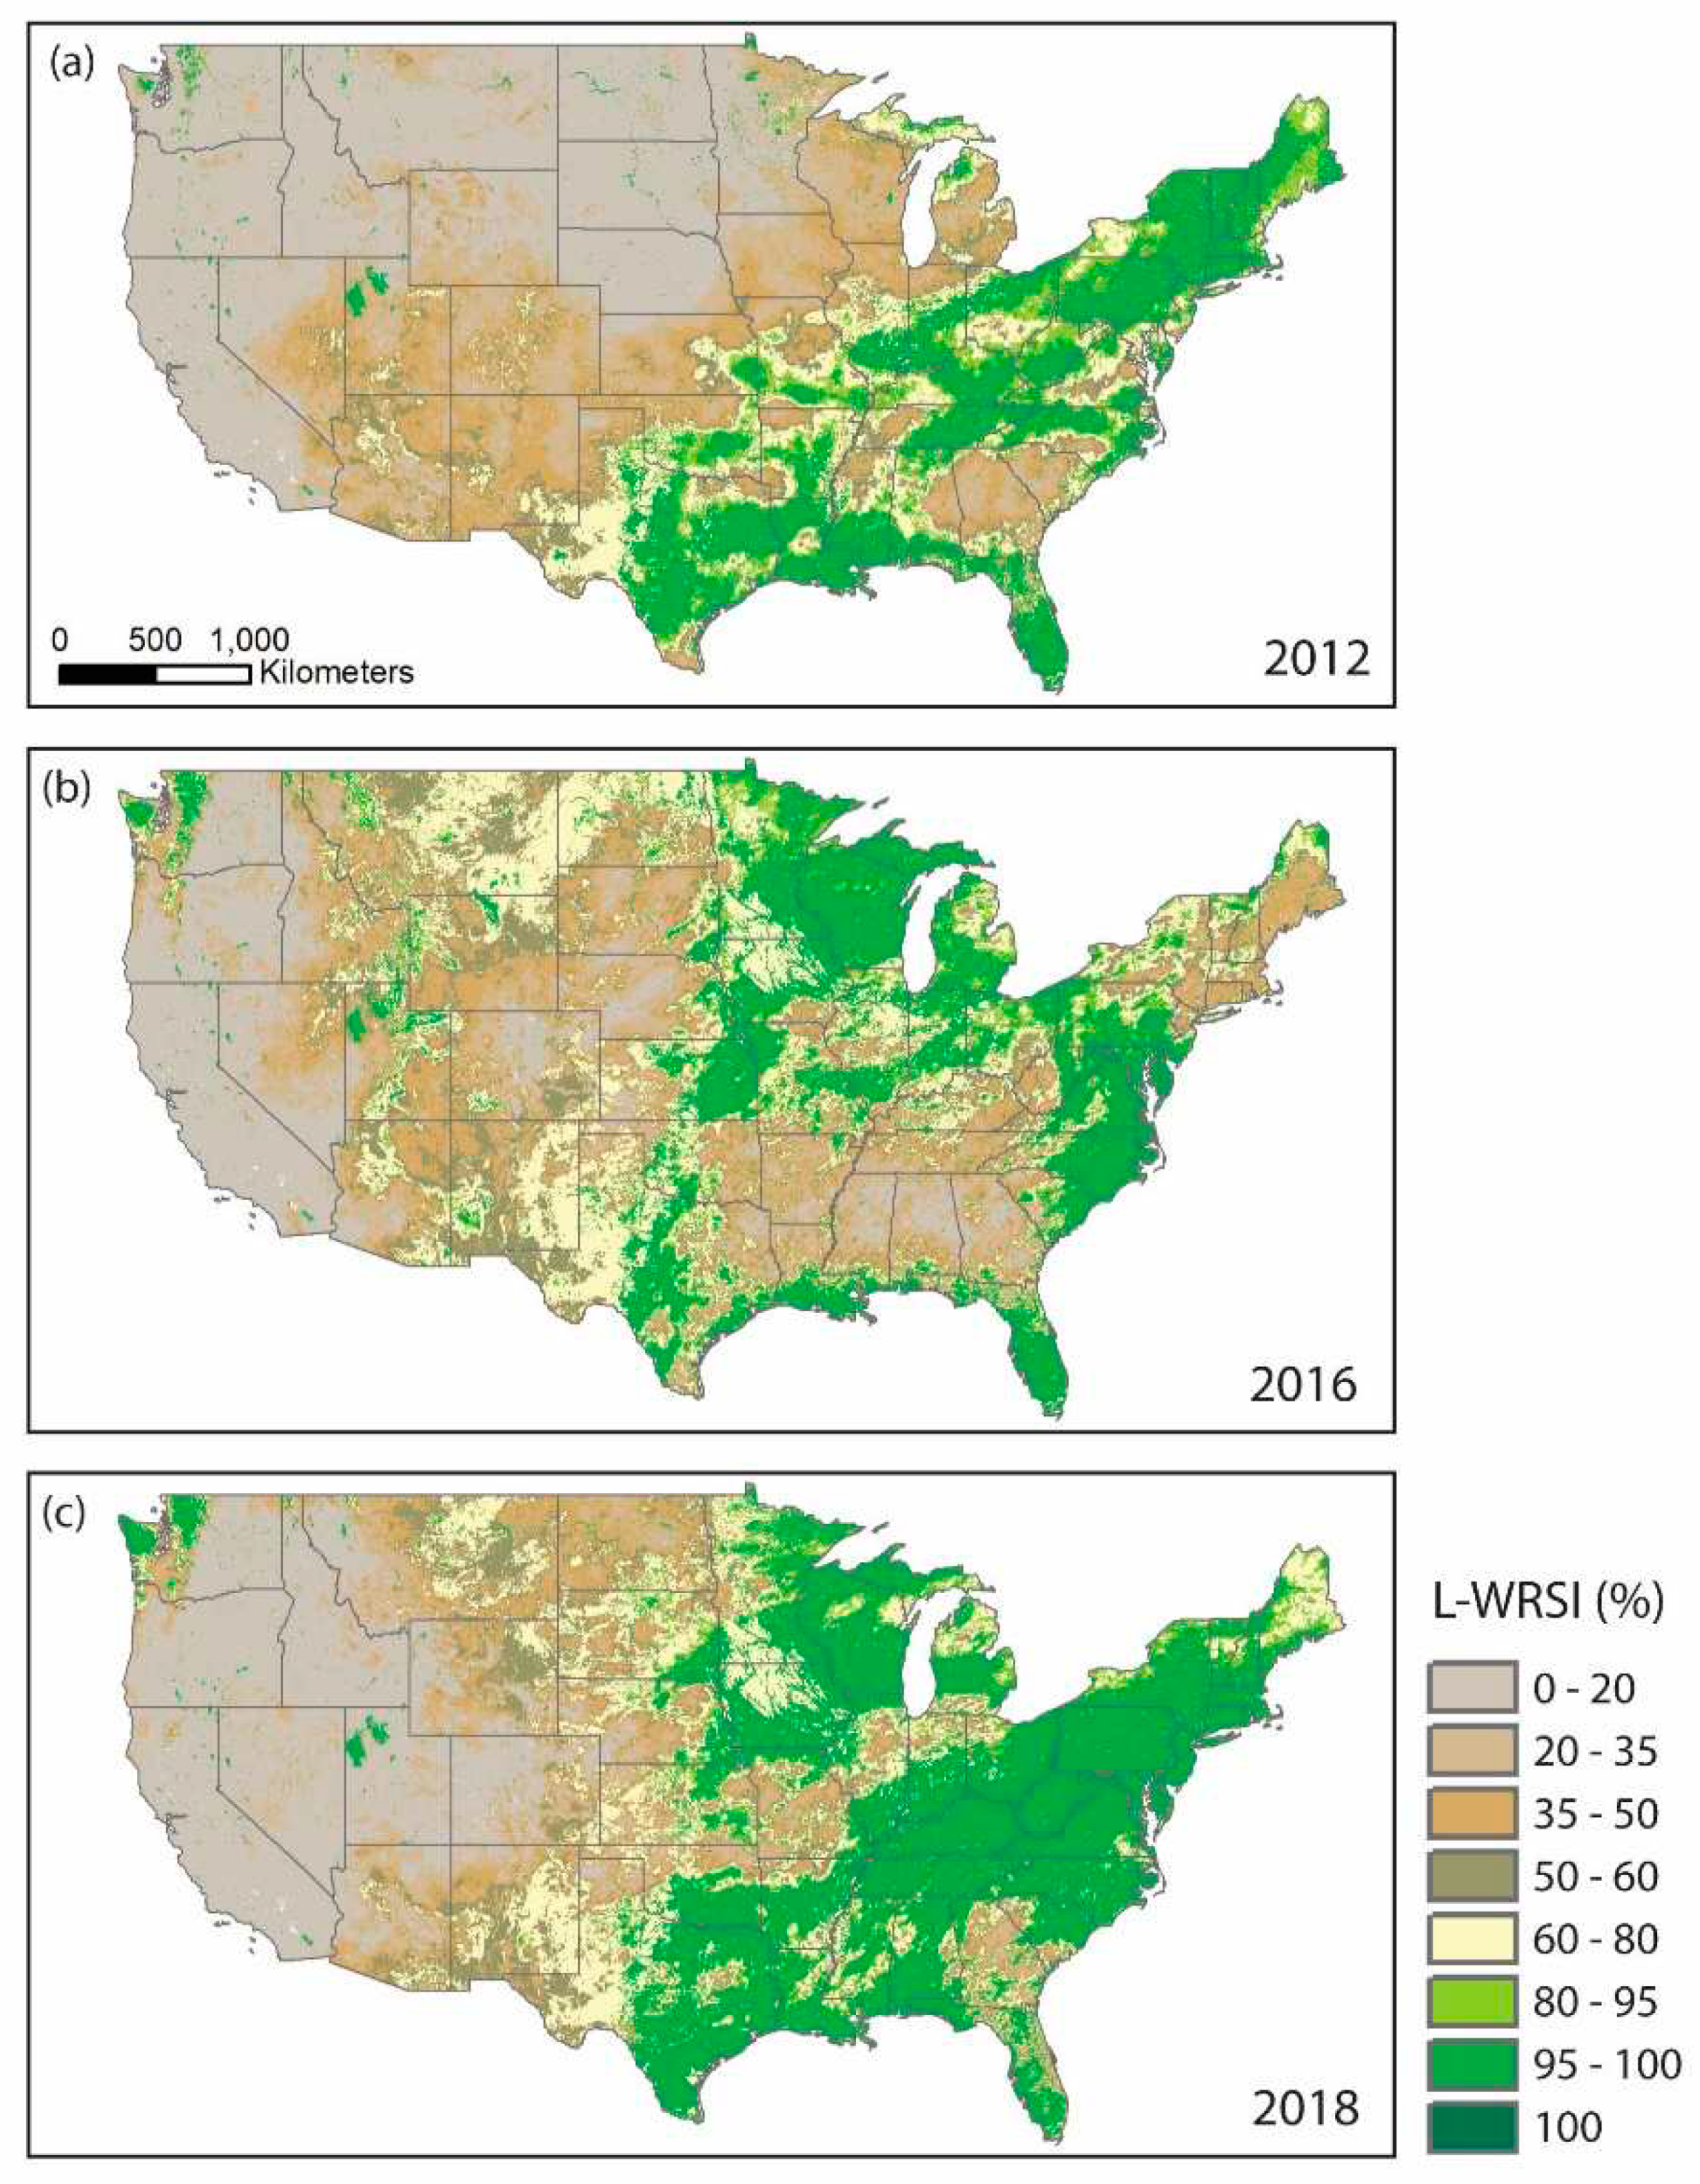
Figure 16.
Summary of seasonal Landscape Water Requirement Satisfaction Index (L-WRSI) for crop areas by four broad categories for the conterminous United States (CONUS). The rectangular charts illustrate the percentage of the CONUS area that falls within the classes of Good (L-WRSI > 95%), Fair (80-95%), Poor (50-80%), and Severe Damage (L-WRSI < 50%) for each year.
Figure 16.
Summary of seasonal Landscape Water Requirement Satisfaction Index (L-WRSI) for crop areas by four broad categories for the conterminous United States (CONUS). The rectangular charts illustrate the percentage of the CONUS area that falls within the classes of Good (L-WRSI > 95%), Fair (80-95%), Poor (50-80%), and Severe Damage (L-WRSI < 50%) for each year.

Figure 17.
Landscape Water Requirement Satisfaction Index (L-WRSI) distribution in the Greater Horn of Africa using 3-month moving total for ETa and ETc during 2018. L-WRSI spatial patterns reflect the growing season dynamics across the region.
Figure 17.
Landscape Water Requirement Satisfaction Index (L-WRSI) distribution in the Greater Horn of Africa using 3-month moving total for ETa and ETc during 2018. L-WRSI spatial patterns reflect the growing season dynamics across the region.
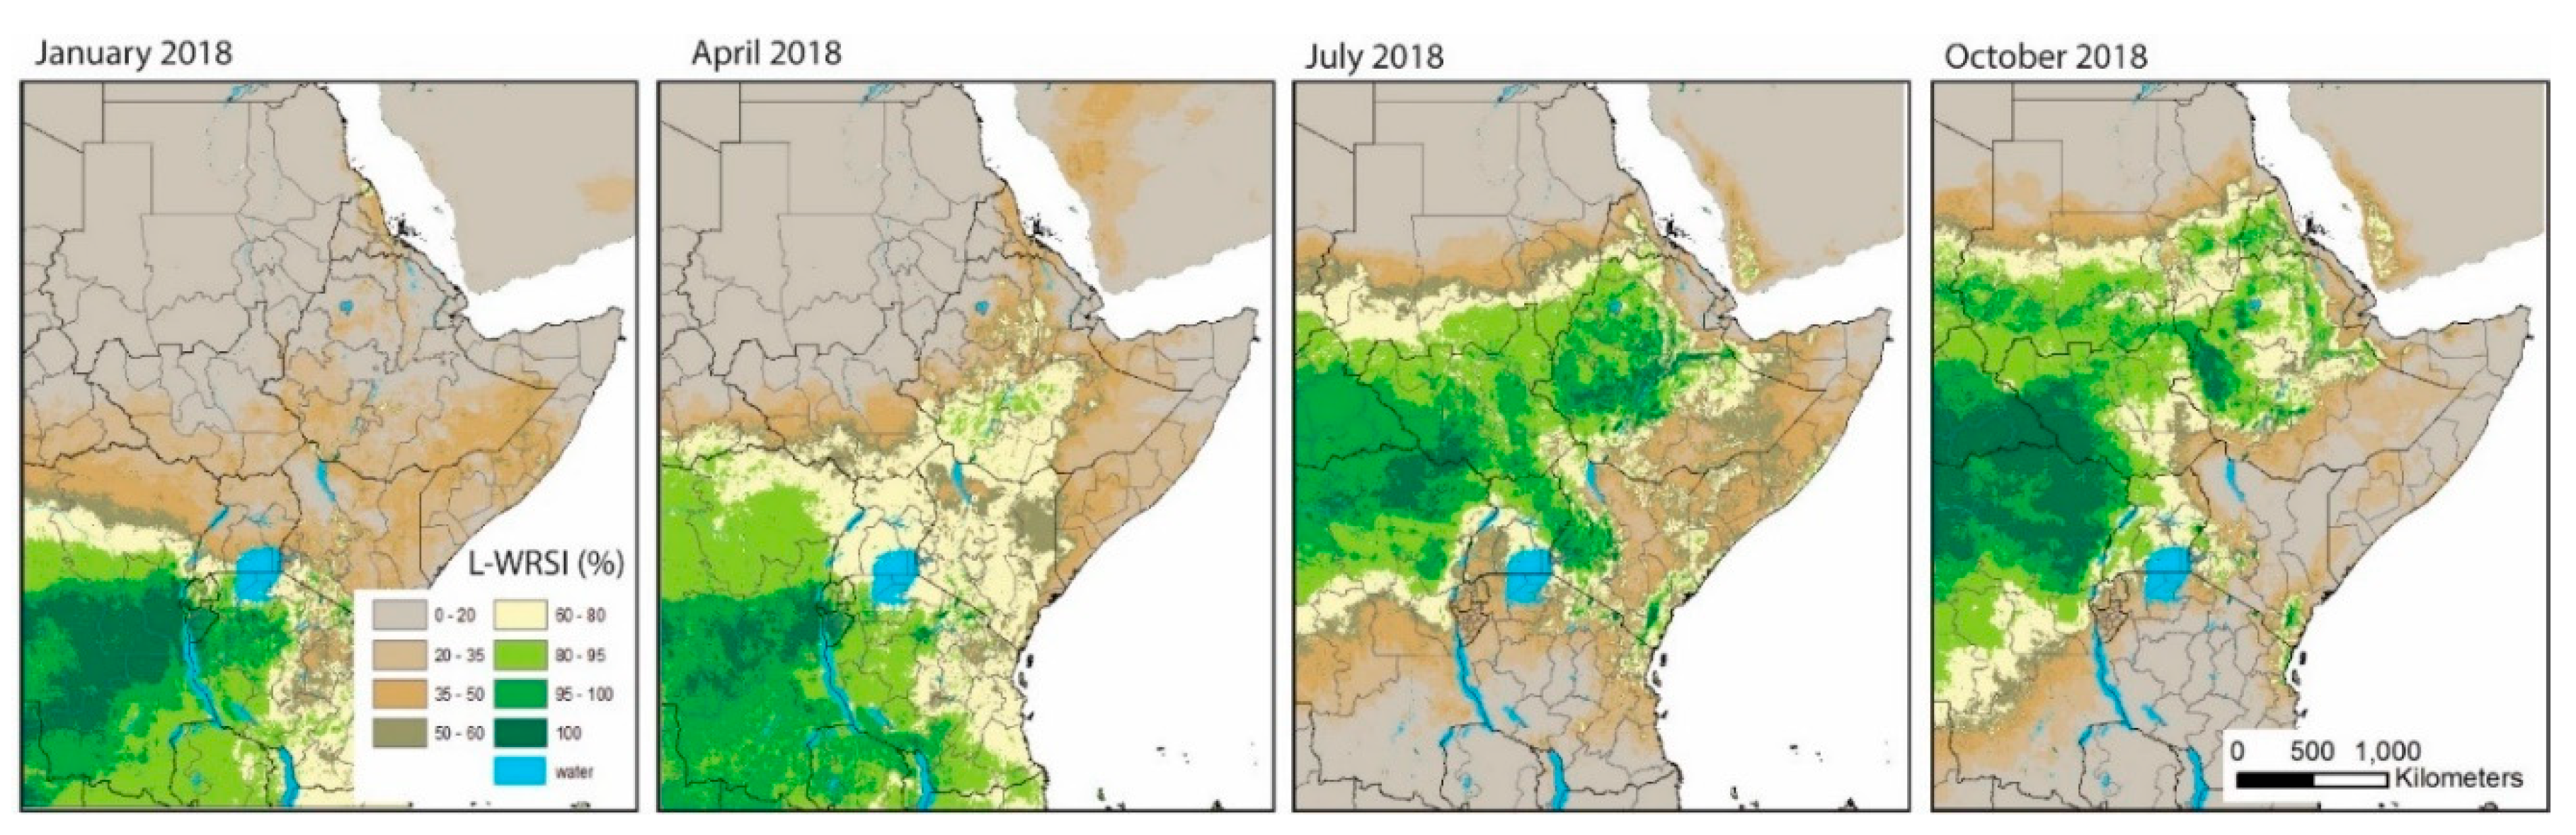

Table 1.
Characteristics of model inputs and parameters for the conterminous United States (CONUS).
| Parameters | Spatial resolution | Temporal resolution | Source |
| Precipitation | 4000 m | Daily, 1980–current | gridMET [30] |
| Land Surface Phenology | 1000 m | 16 days (Terra), 2003–2017* | MODIS NDVI [31] (MOD13A2.061) |
| Reference Evapotranspiration | 4000 m | Daily, 1981–2010* | gridMET [30] |
| Air Temperature | 4000 m | Daily, 1984–2017* | gridMET [30] |
| Soil Properties | 90 m | Static | gNATSGO [32,33] |
| Interception | 250 m | Static | MODIS VCF [34] (MOD44B.061) |
* Median climatology generated from the specified time period.
Table 2.
Characteristics of model inputs and parameters for the Greater Horn of Africa (GHA).
| Parameters | Spatial resolution | Temporal resolution | Reference |
| Precipitation | 0.05° | Daily; 1981 - current | CHIRPS [36] |
| Land Surface Phenology | 1000 m | Every 8 days (Aqua and Terra); 2003 – 2017* | MODIS NDVI [31] |
| Reference Evapotranspiration | 0.625°x0.5° | daily; 1981 - 2010* | NOAA ETo [37] |
| Air Temperature | 1000 m | Monthly; 1981 - 2010* | CHELSA [39] |
| Soil Properties | 250 m | Static | ISRIC [38] |
| Interception | 250 m | Static | MODIS VCF [34] |
* Median climatology generated from the specified time period.
Table 3.
Summary of the Soil Climate Analysis Network (SCAN) soil moisture sites [45] used for evaluation.
Table 3.
Summary of the Soil Climate Analysis Network (SCAN) soil moisture sites [45] used for evaluation.
| SITE ID | Name | State | Location (Latitude, Longitude in degrees) |
Time Period |
|---|---|---|---|---|
| 2002 | Crescent Lake #1 | Minnesota | 45.42˚, -93.95˚ | Oct 1993 to current |
| 2022 | Fort Reno #1 | Nebraska | 35.33˚, -98.02˚ | Nov 1998 to current |
| 2168 | Jornada Exp Range | New Mexico | 32.56˚, -106.70˚ | Oct 2009 to current |
Table 4.
Summary of the SNOpack TELemetry (SNOTEL) snow sites [46] used for evaluation.
Table 4.
Summary of the SNOpack TELemetry (SNOTEL) snow sites [46] used for evaluation.
| Site ID | Site Name | Elevation (m) | Location (Latitude, Longitude in degrees) |
Time Period |
|---|---|---|---|---|
| 982 | Cole Canyon | 5910 | 44.48˚, -104.42˚ | 2000 to current |
| 409 | Columbine Pass | 9171 | 38.42˚, -108.39˚ | 1985 to current |
| 1034 | Sierra Blanca | 10268 | 33.40˚, -105.80˚ | 2002 to current |
Table 5.
Summary of AmeriFlux EC sites [47] used for actual evapotranspiration (ETa) evaluation.
Table 5.
Summary of AmeriFlux EC sites [47] used for actual evapotranspiration (ETa) evaluation.
| Site ID | Name Name | Landcover | Location (Latitude, Longitude in degrees) | Time Period Available |
|---|---|---|---|---|
| US-AR1 | ARM USDA | Grassland | 36.43, -99.42 | 2003–2021 |
| US-Ne3 | Mead | Rainfed crop | 41.12, -96.44 | 2001–2020 |
| US-Var | Vaira Ranch - Ione | Grassland | 38.41, -120.95 | 2000–2014 |
Table 6.
Summary of runoff data source [49], spatial and temporal resolution, study years, and number of HUC8 watersheds applied for evaluation.
Table 6.
Summary of runoff data source [49], spatial and temporal resolution, study years, and number of HUC8 watersheds applied for evaluation.
| Spatial resolution | Temporal resolution |
Study years |
Number of HUC8s (R/P*<=0.40) |
|---|---|---|---|
| HUC8 scale | Water year (October 1–September 30) | 2012 (dry), 2016 (wet), 2018 (average) |
1762 (1441) 1762 (1432) 1762 (1396) |
*:R/P refer to the ratio of runoff (R) to precipitation filter for number of HUC8 watersheds in bracket.
Table 7.
Summary statistics of eight-digit hydrologic unit code (HUC8) annual runoff comparison between simulated (VegET) and observed (WaterWatch [49]) for three water years (2012, 2016, 2018), without filter and with filter (excluding HUC8s when runoff (R) and precipitation (P) ratio is greater than 0.40.
Table 7.
Summary statistics of eight-digit hydrologic unit code (HUC8) annual runoff comparison between simulated (VegET) and observed (WaterWatch [49]) for three water years (2012, 2016, 2018), without filter and with filter (excluding HUC8s when runoff (R) and precipitation (P) ratio is greater than 0.40.
| Statistics | Without Filter | With Filter (R/P<=0.40) | ||||
|---|---|---|---|---|---|---|
| 2012 | 2016 | 2018 | 2012 | 2016 | 2018 | |
| N (HUC8) | 1762 | 1762 | 1762 | 1441 | 1432 | 1396 |
| r (correlation coefficient) | 0.90 | 0.88 | 0.90 | 0.82 | 0.81 | 0.82 |
| WaterWatch runoff (mm/yr) | 216 | 297 | 267 | 128 | 205 | 165 |
| VegET runoff (mm/yr) | 173 | 253 | 203 | 122 | 198 | 141 |
| Bias (mm/yr) | -44 | -44 | -64 | -6 | -7 | -24 |
| Relative bias (%) | -20.2 | -14.8 | -23.9 | -4.6 | -3.4 | -14.6 |
| RMSE (mm/yr) | 144 | 163 | 157 | 85 | 127 | 107 |
| Relative RMSE (%) | 66.5 | 54.9 | 58.9 | 66.9 | 62.2 | 64.9 |
Disclaimer/Publisher’s Note: The statements, opinions and data contained in all publications are solely those of the individual author(s) and contributor(s) and not of MDPI and/or the editor(s). MDPI and/or the editor(s) disclaim responsibility for any injury to people or property resulting from any ideas, methods, instructions or products referred to in the content. |
© 2023 by the authors. Licensee MDPI, Basel, Switzerland. This article is an open access article distributed under the terms and conditions of the Creative Commons Attribution (CC BY) license (http://creativecommons.org/licenses/by/4.0/).
Copyright: This open access article is published under a Creative Commons CC BY 4.0 license, which permit the free download, distribution, and reuse, provided that the author and preprint are cited in any reuse.


