Submitted:
03 August 2023
Posted:
04 August 2023
You are already at the latest version
Abstract
Keywords:
1. Introduction
2. Results and Discussion
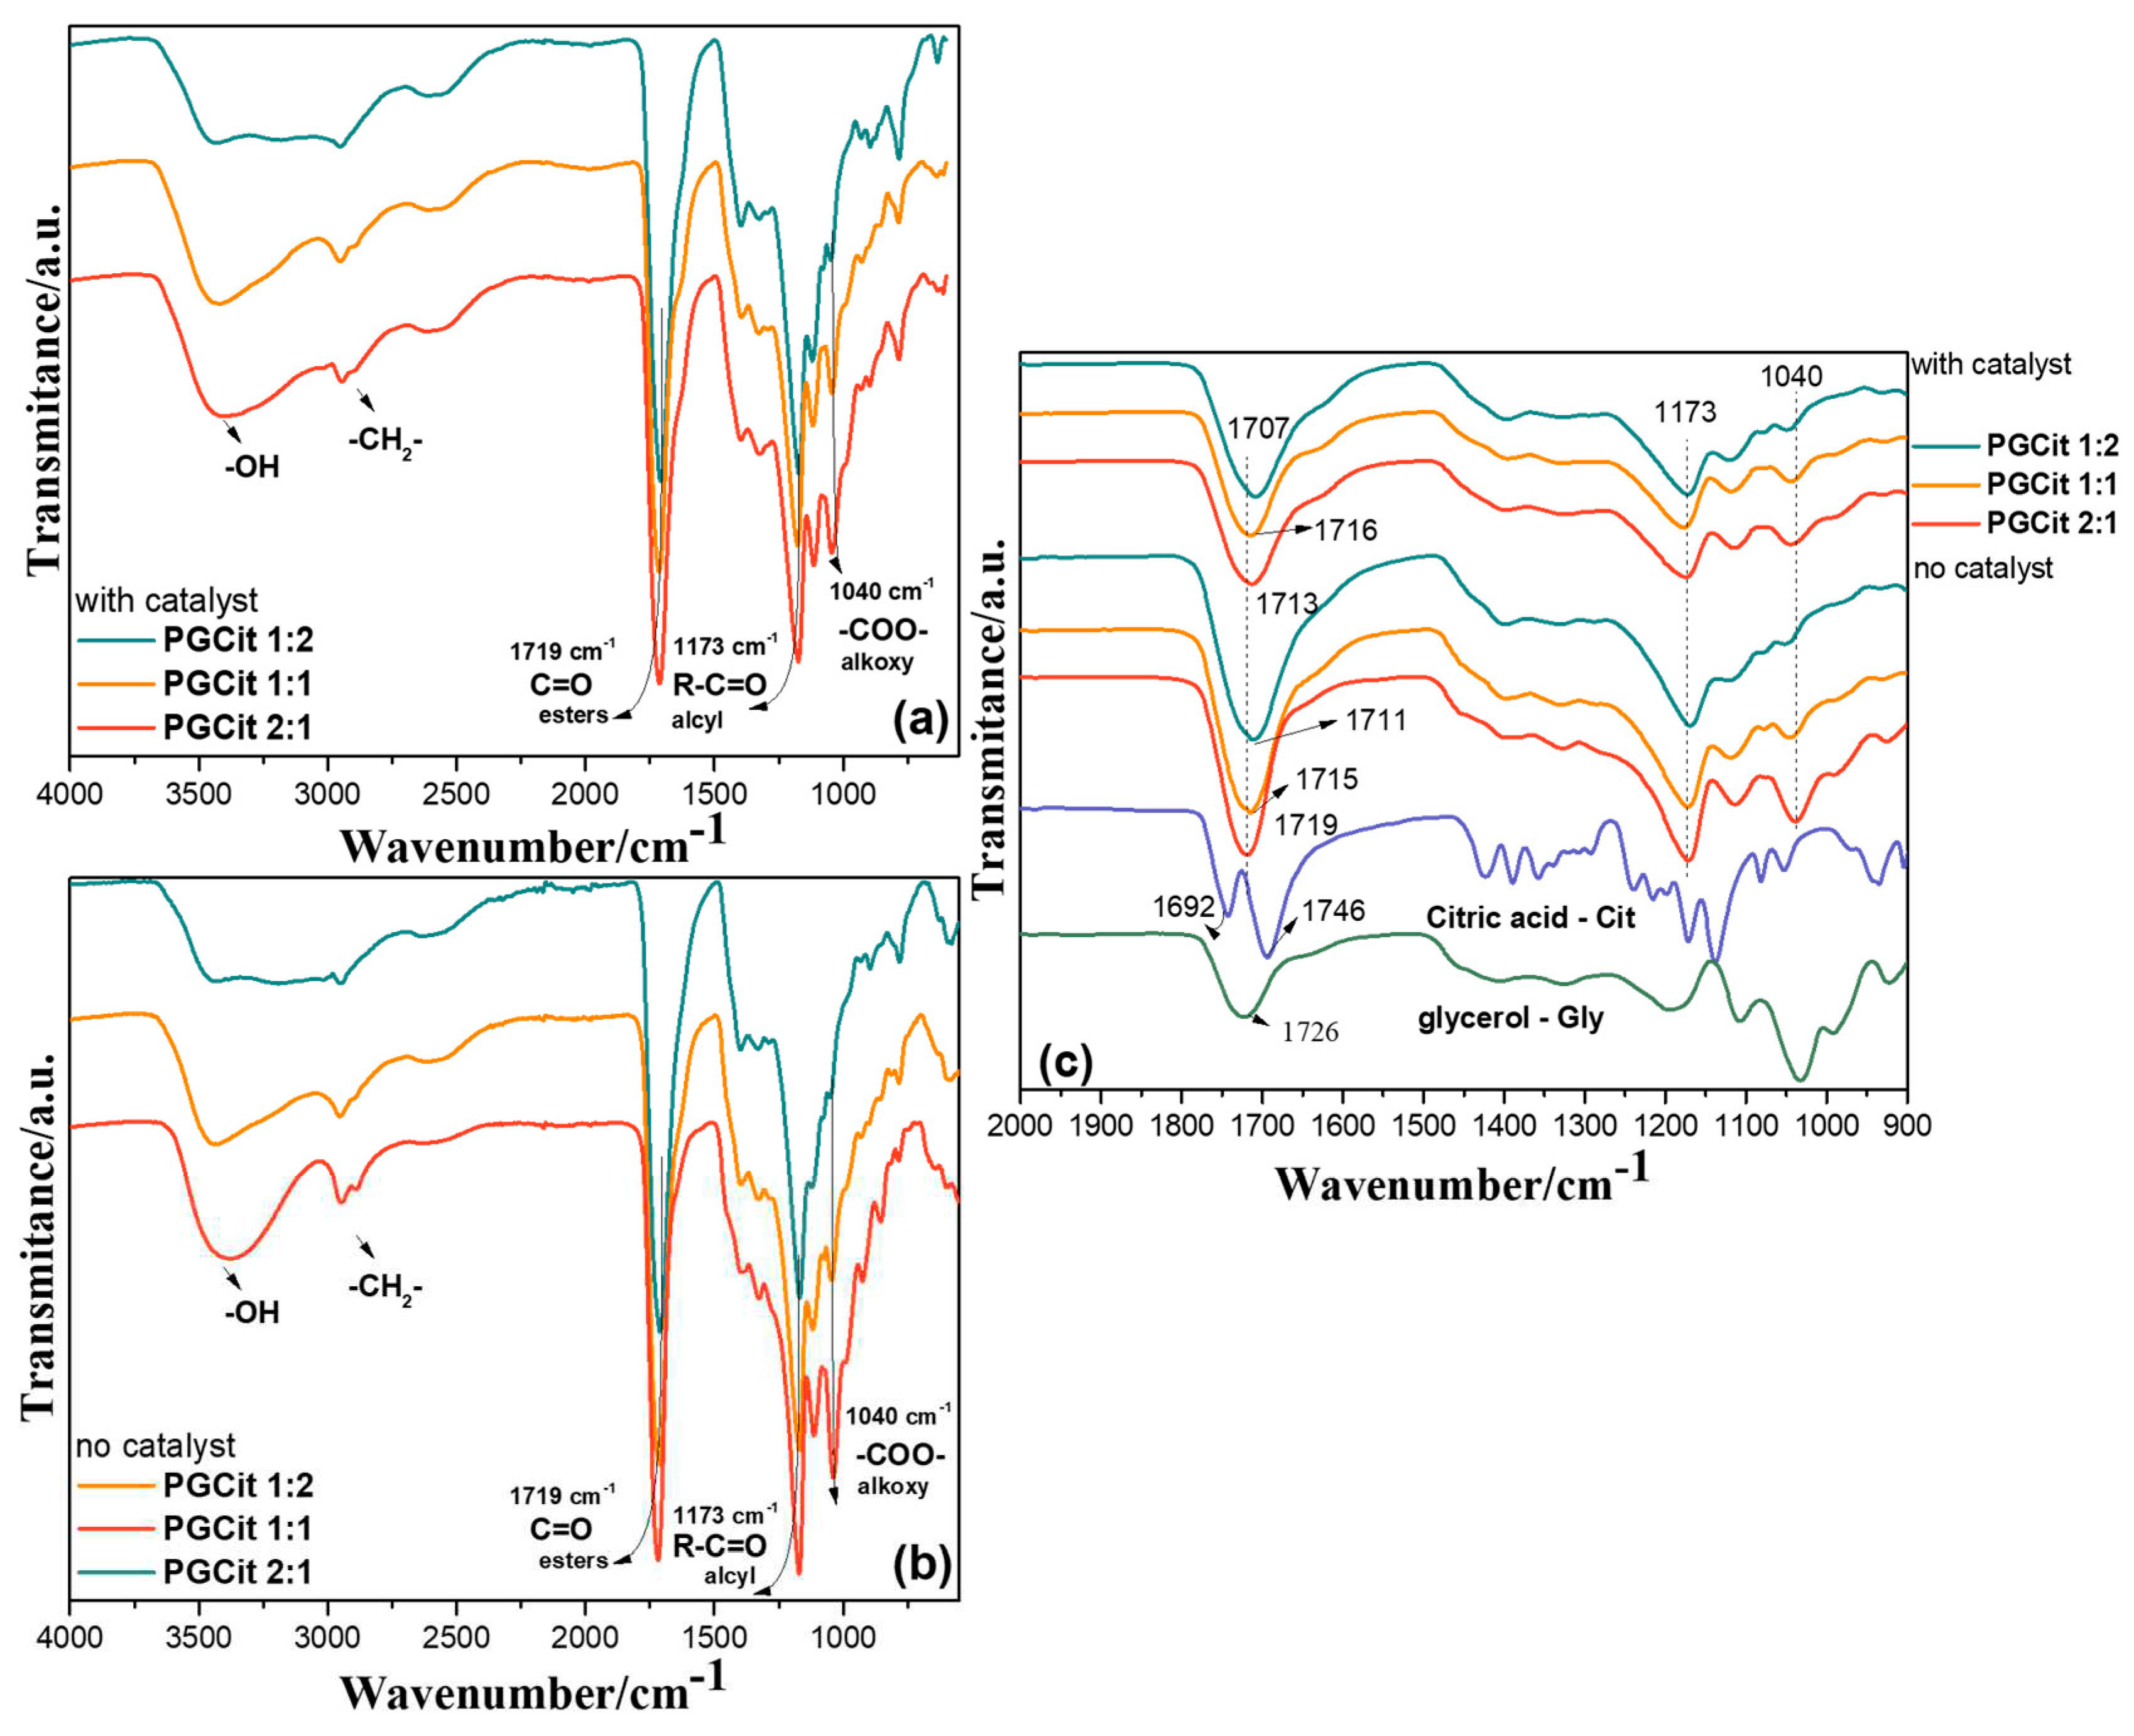
2.1. FTIR Analysis
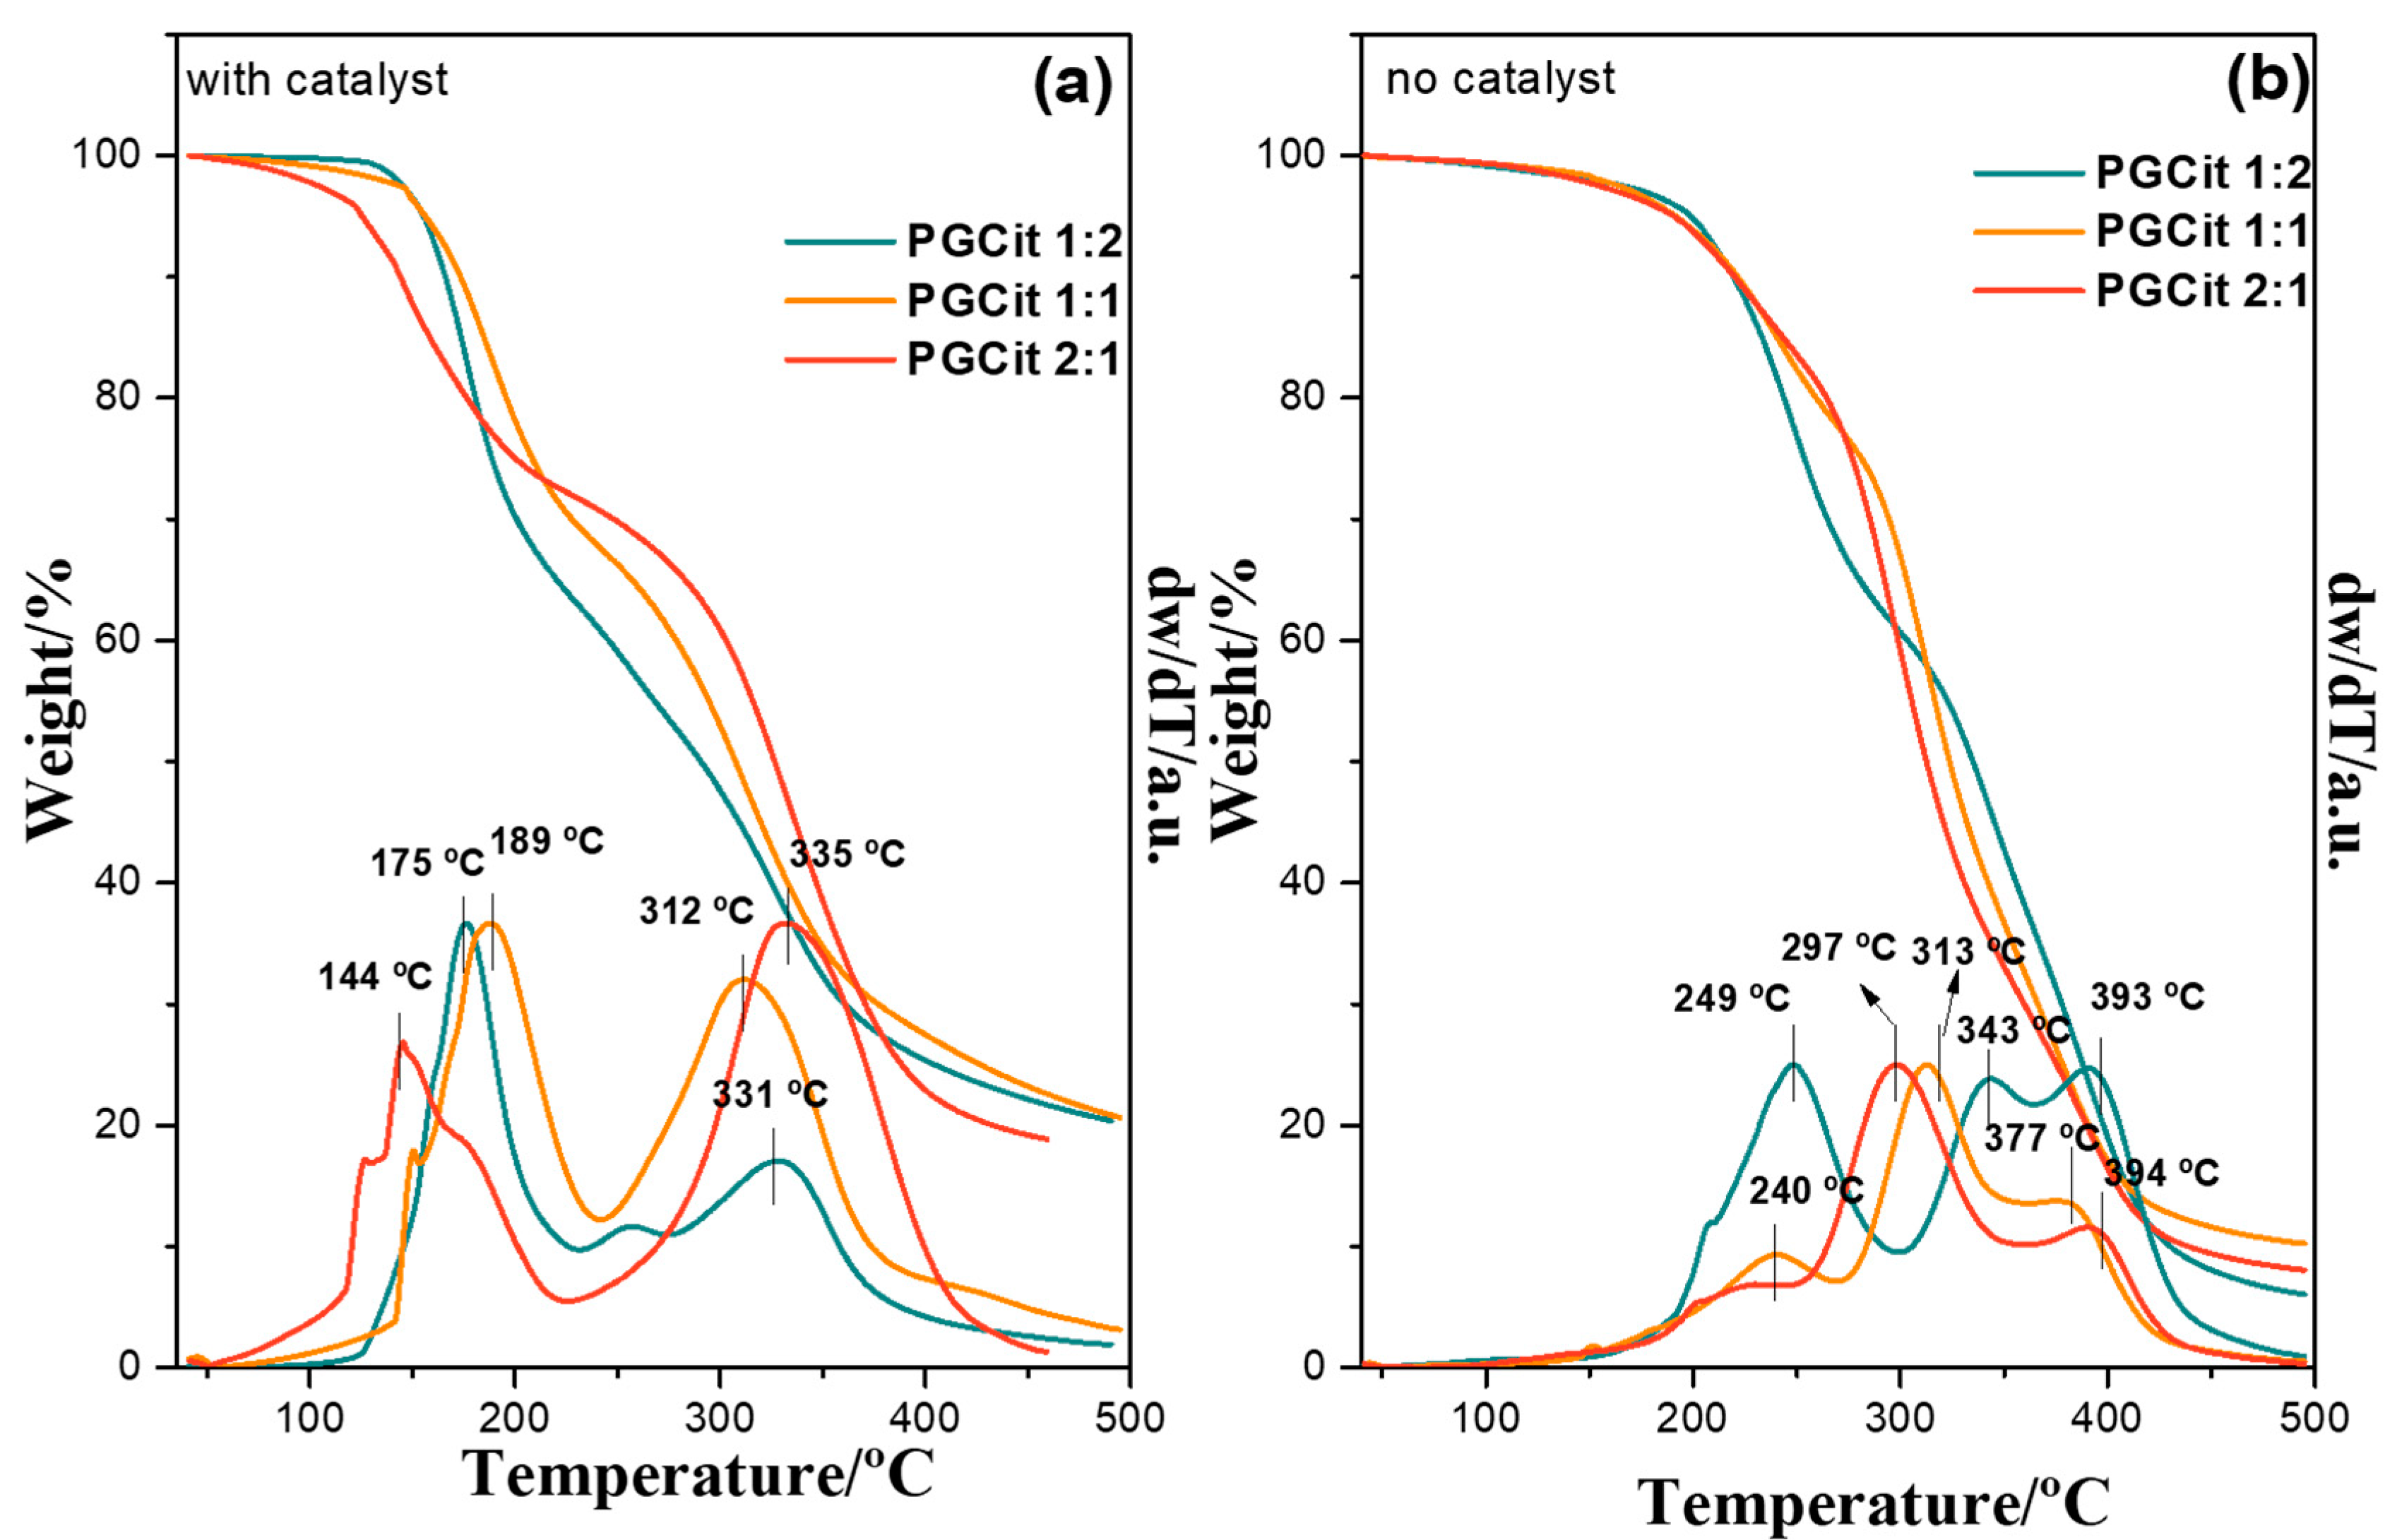
2.2. Termic Analysis
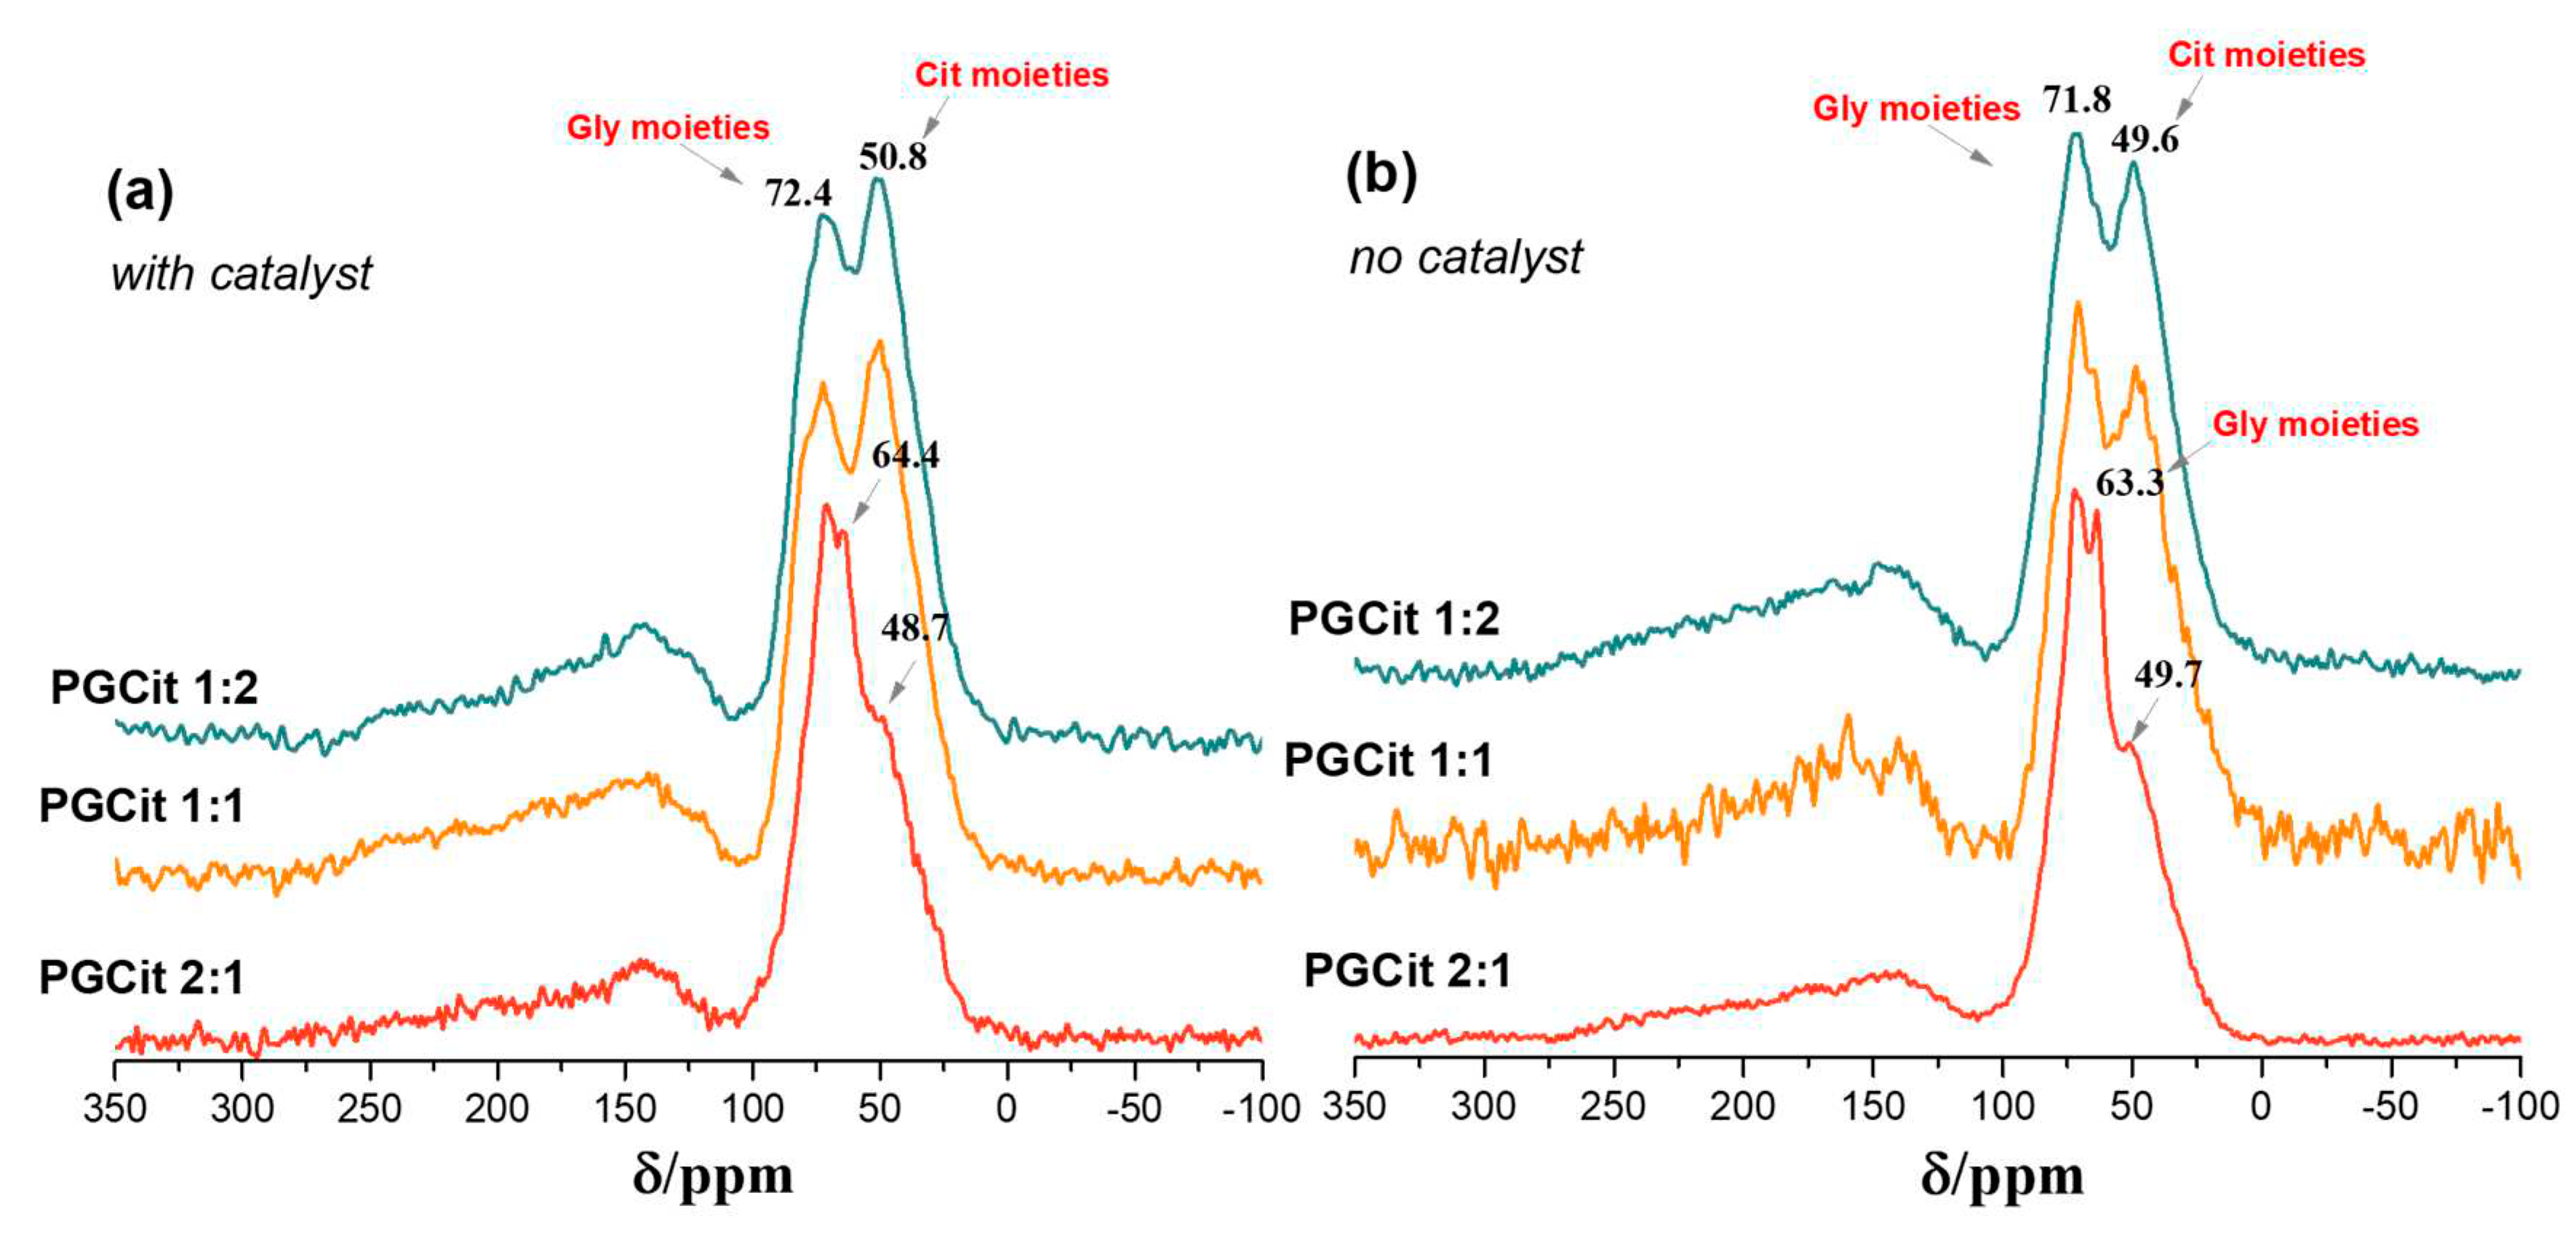
2.3. Polyesters Structures by NMR Analysis
3. Materials and Methods
3.1. Materials
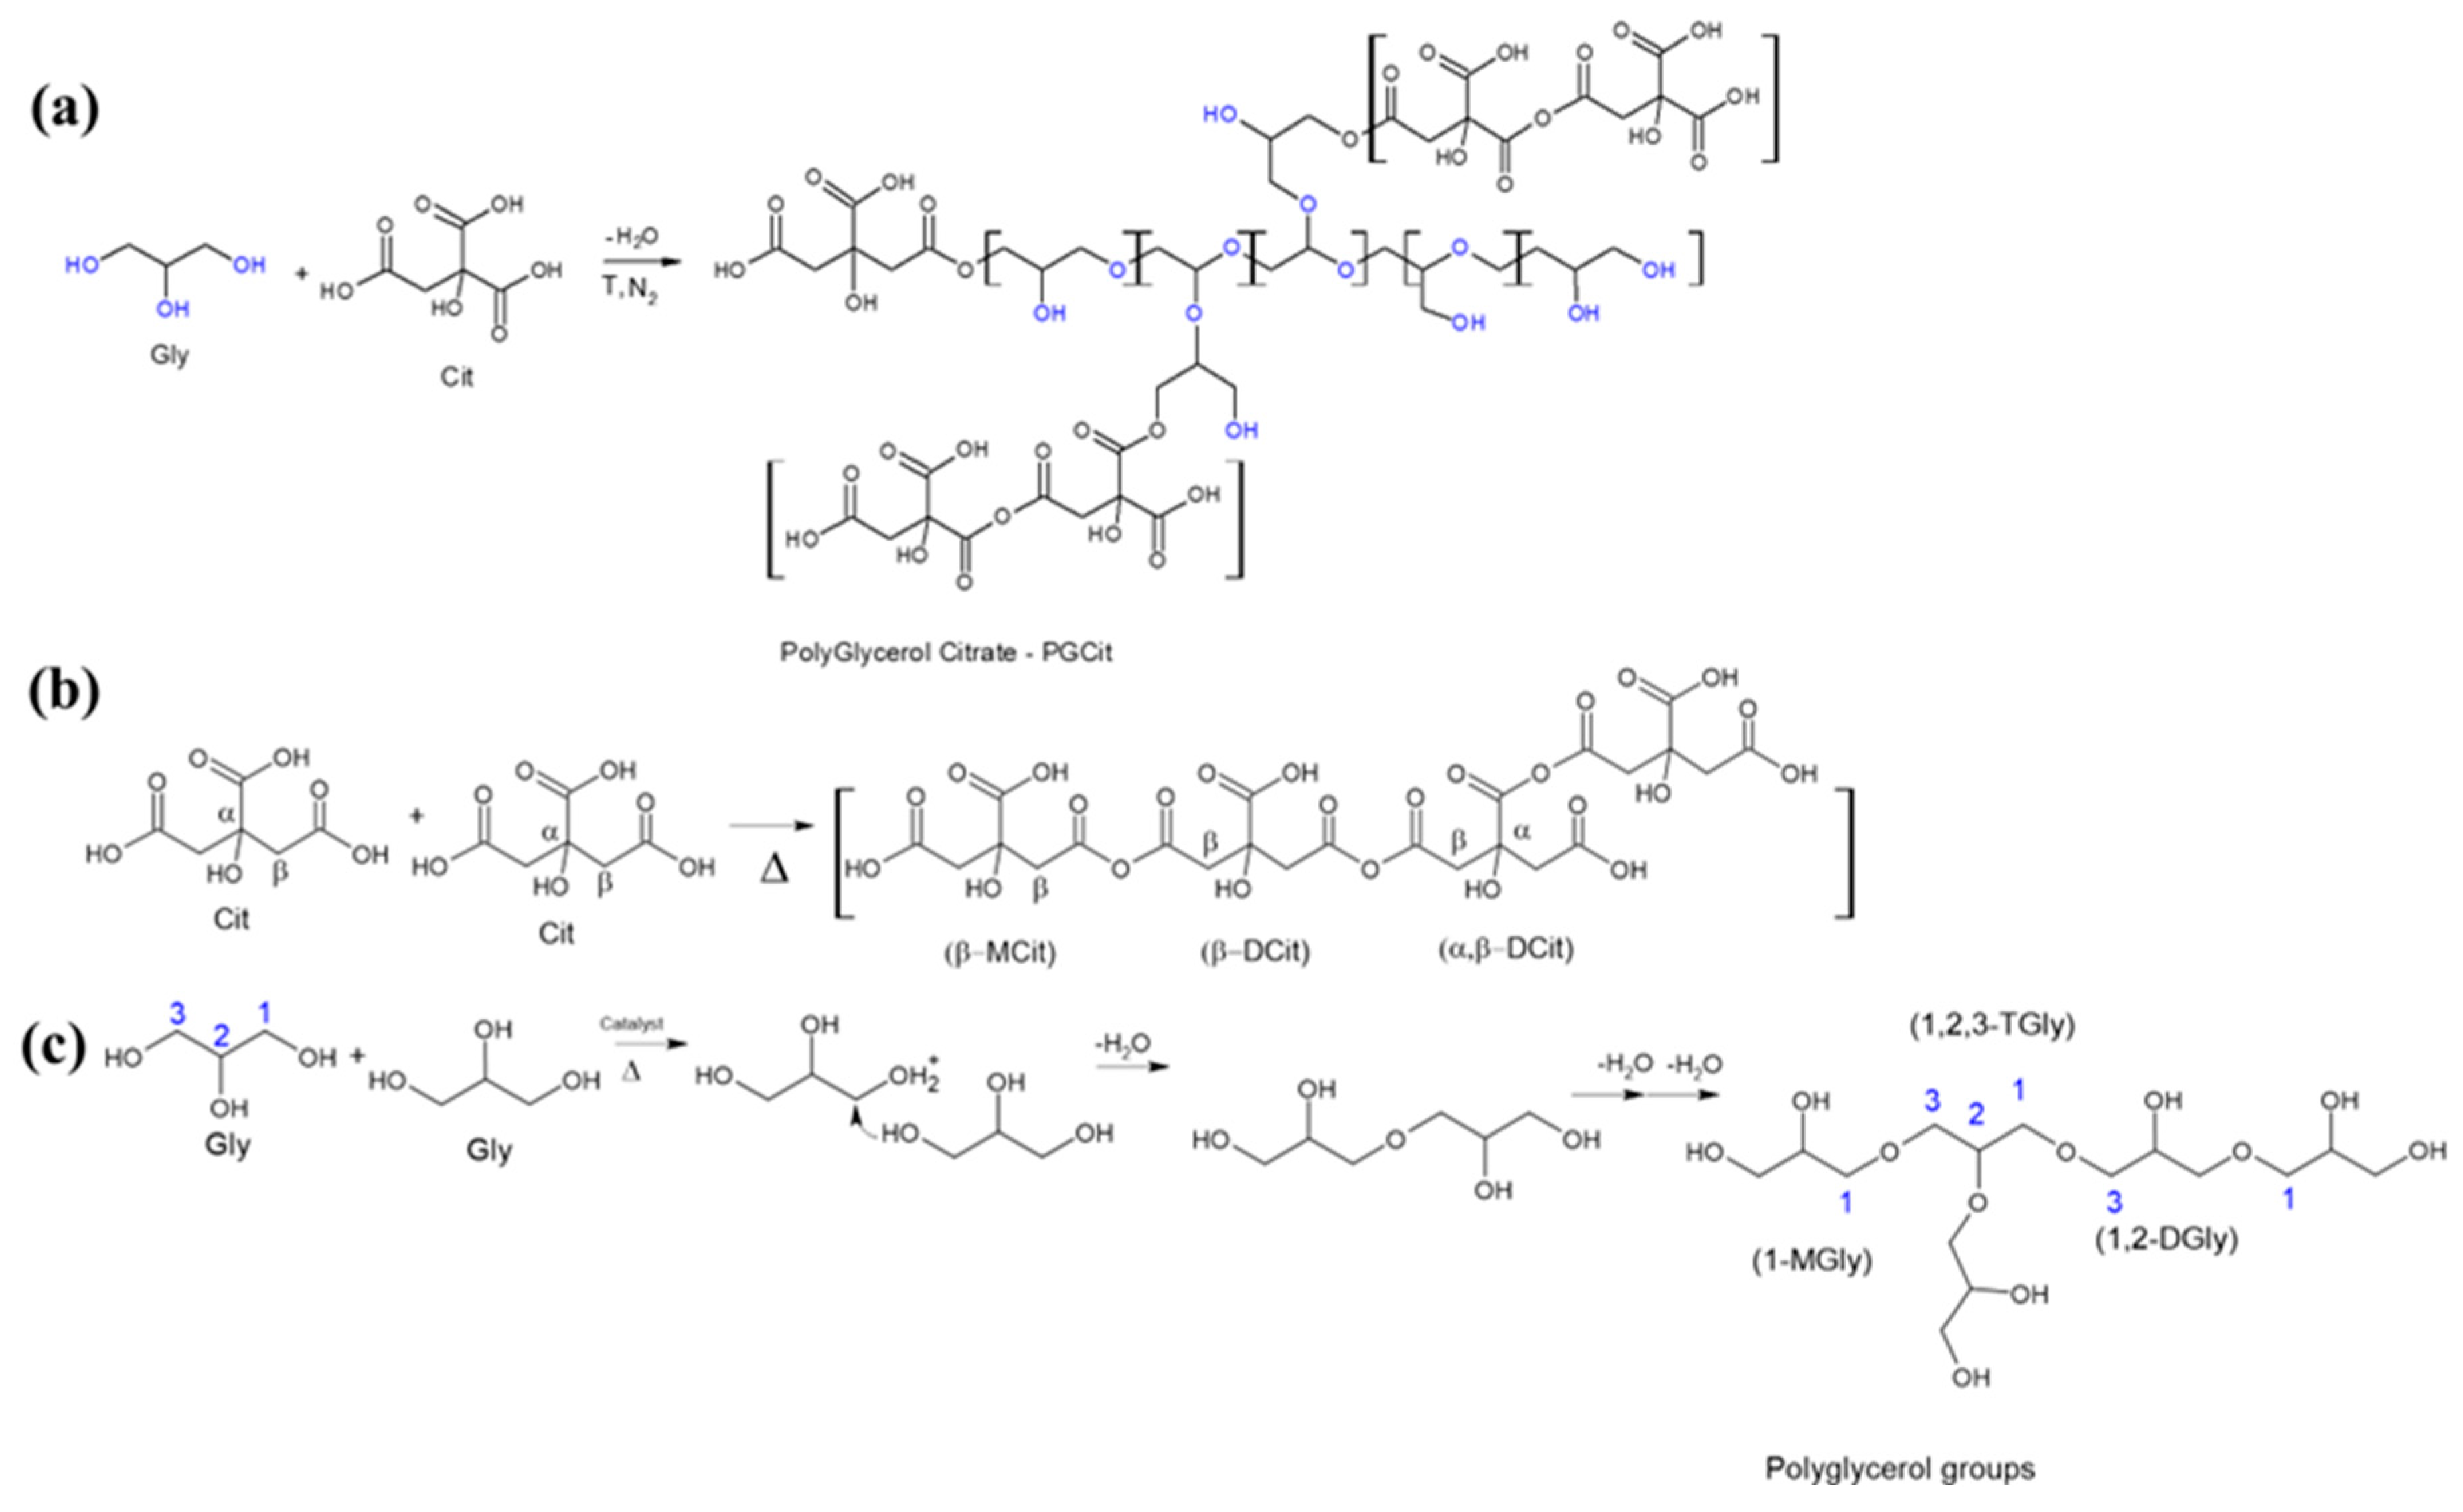
3.2. Materials Synthesis
3.3. Polymer Characterization
3.4. Preparation of PGCit-Coated Seeds
3.5. Germination Tests of Coated versus Non-Coated Soybean Seeds
5. Conclusions
Supplementary Materials
Author Contributions
Funding
Institutional Review Board Statement
Informed Consent Statement
Data Availability Statement
Acknowledgments
Conflicts of Interest
Sample Availability
References
- Javed, T.; Afzal, I.; Mauro, R.P. Seed Coating in Direct Seeded Rice: An Innovative and Sustainable Approach to Enhance Grain Yield and Weed Management under Submerged Conditions. Sustainability 2021, 13, 1–13. [Google Scholar] [CrossRef]
- Baroni, D.F.; Vieira, H.D. Coating Seeds with Fertilizer: A Promising Technique for Forage Crop Seeds. Ciencia Agrotecnologia 2020, 44, 1–11. [Google Scholar] [CrossRef]
- Accinelli, C.; Abbas, H.K.; Little, N.S.; Kotowicz, J.K.; Shier, W.T. Biological Control of Aflatoxin Production in Corn Using Non-Aflatoxigenic Aspergillus Flavus Administered as a Bioplastic-Based Seed Coating. Crop Protection 2018, 107, 87–92. [Google Scholar] [CrossRef]
- Alexandre Gonçalves Avelar, S.; Valéria de Sousa, F.; Fiss, G.; Baudet, L.; Teichert Peske, S. The Use of Film Coating on the Performance of Treated Corn Seed. 2012, 34, 1. [CrossRef]
- Clemente, M.; Rocha, R.J.; Iha, K.; Rocco, J.A.F.F. Development of Prepolymer Technology in the Synthesis of a Polyurethane Binder Used in Solid Rocket Fuels. Quim Nova 2014, 37, 982–988. [Google Scholar] [CrossRef]
- Zafar, F.; Ghosal, A.; Sharmin, E.; Chaturvedi, R.; Nishat, N. A Review on Cleaner Production of Polymeric and Nanocomposite Coatings Based on Waterborne Polyurethane Dispersions from Seed Oils. Prog Org Coat 2019, 131, 259–275. [Google Scholar] [CrossRef]
- Paravar, A.; Piri, R.; Balouchi, H.; Ma, Y. Microbial Seed Coating: An Attractive Tool for Sustainable Agriculture. Biotechnol. Rep. 2023, 37, e00781. [Google Scholar] [CrossRef]
- Bortoletto-Santos, R.; Guimarães, G.G.F.; Junior, V.R.; Da Cruz, D.F.; Polito, W.L.; Ribeiro, C. Biodegradable Oil-Based Polymeric Coatings on Urea Fertilizer: N Release Kinetic Transformations of Urea in Soil. Sci. Agric. 2020, 77. [Google Scholar] [CrossRef]
- International Energy Agency, I. Renewable Energy Market Update - Outlook for 2021 and 2022; 2021.
- Azerêdo, M.S.; Nunes, M.A.B.S.; Figueiredo, L.R.F.; Oliveira, J.E.; Tonoli, G.D.; de Barros, S.; Medeiros, E.S. Environmentally Friendly Adhesives Derived from Glycerol-Based Polymers. J. Adhes. Sci. Technol. 2022, 36, 98–108. [Google Scholar] [CrossRef]
- Mendonça, F.G.; Menezes, I.R.S.; Silva, I.F.; Lago, R.M. Multifunctional Glycerol/Citric Acid Crosslinked Polymer Hydrophilic Gel with Absorptive and Reducing Properties. New J. Chem. 2021, 45, 2410–2416. [Google Scholar] [CrossRef]
- Markets, R. Global Citric Acid Markets Report, 2011–2018 & 2019–2024. Cision 2019. [Google Scholar]
- Gadomska-Gajadhur, A.; Bandzerewicz, A.; Wrzecionek, M.; Ruśkowski, P. Biobased Poly(Glycerol Citrate) Synthesis Optimization via Design of Experiments. Polym Adv Technol 2021, 32, 3982–3994. [Google Scholar] [CrossRef]
- Wrzecionek, M.; Matyszczak, G.; Bandzerewicz, A.; Ruśkowski, P.; Gadomska-Gajadhur, A. Kinetics of Polycondensation of Citric Acid with Glycerol Based on a Genetic Algorithm. Org Process Res Dev 2021, 25, 271–281. [Google Scholar] [CrossRef]
- Wrzecionek, M.; Howis, J.; Ruskowski, P.; Gadomska-Gajadhur, A. Optimizing the Conditions of Pgsu Synthesis with Simplex Method. Chem. Process Eng. Inz. Chem. Proces. 2020, 41, 119–128. [Google Scholar] [CrossRef]
- Chandra Kumari, M.; Jaisankar, V. Synthesis and Characterisation of Poly (Glycerol-Co-Citrate)/ n-HAp Composite for Biomedical Applications. Mater Today Proc 2018, 5, 8824–8831. [Google Scholar] [CrossRef]
- Adeli, M.; Rasoulian, B.; Saadatmehr, F.; Zabihi, F. Hyperbranched Poly(Citric Acid) and Its Application as Anticancer Drug Delivery System. J Appl Polym Sci 2013, 129, 3665–3671. [Google Scholar] [CrossRef]
- Tisserat, B.; O’Kuru, R.H.; Hwang, H.; Mohamed, A.A.; Holser, R. Glycerol Citrate Polyesters Produced through Heating without Catalysis. J Appl Polym Sci 2012, 125, 3429–3437. [Google Scholar] [CrossRef]
- Anastas, P.; Eghbali, N. Green Chemistry: Principles and Practice. Chem Soc Rev 2010, 39, 301–312. [Google Scholar] [CrossRef]
- Sengupta, S.; Singh, A.; Dutta, K.; Sahu, R.P.; Kumar, S.; Goswami, C.; Chawla, S.; Goswami, L.; Bandyopadhyay, A. Branched/Hyperbranched Copolyesters from Poly(Vinyl Alcohol) and Citric Acid as Delivery Agents and Tissue Regeneration Scaffolds. Macromol Chem Phys 2021, 222. [Google Scholar] [CrossRef]
- Bodaghi, A.; Adeli, M.; Dadkhahtehrani, A.; Tu, Z. Synthesis of Polyglycerol-Citric Acid Nanoparticles as Biocompatible Vectors for Biomedical Applications. J Mol Liq 2017, 242, 53–58. [Google Scholar] [CrossRef]
- Pramanick, D.; Ray, T.T. Synthesis and Biodegradation of Copolyesters from Citric Acid and Glycerol. Polymer Bulletin 1988, 19, 365–370. [Google Scholar] [CrossRef]
- Zahlan, H.; Saeed, W.S.; Alrasheed, R.; Alandes, N.M.; Aouak, T. Synthesis of Poly (Citric Acid-Co-Glycerol) and Its Application as an Inhibitor of CaCO3 Deposition. Materials 2019, 12. [Google Scholar] [CrossRef] [PubMed]
- Berube, M.A.; Schorr, D.; Ball, R.J.; Landry, V.; Blanchet, P. Determination of In Situ Esterification Parameters of Citric Acid-Glycerol Based Polymers for Wood Impregnation. J Polym Environ 2018, 26, 970–979. [Google Scholar] [CrossRef]
- Valerio, O.; Misra, M.; Mohanty, A.K. Poly(Glycerol- Co-Diacids) Polyesters: From Glycerol Biorefinery to Sustainable Engineering Applications, A Review. ACS Sustain Chem Eng 2018, 6, 5681–5693. [Google Scholar] [CrossRef]
- Giroto, A.S.; do Valle, S.F.; Ribeiro, T.; Ribeiro, C.; Mattoso, L.H.C. Towards Urea and Glycerol Utilization as “Building Blocks” for Polyurethane Production: A Detailed Study about Reactivity and Structure for Environmentally Friendly Polymer Synthesis. React Funct Polym 2020, 153, 104629. [Google Scholar] [CrossRef]
- Halpern, J.M.; Urbanski, R.; Weinstock, A.K.; Iwig, D.F.; Mathers, R.T.; Von Recum, H.A. A Biodegradable Thermoset Polymer Made by Esterification of Citric Acid and Glycerol. J Biomed Mater Res A 2014, 102, 1467–1477. [Google Scholar] [CrossRef] [PubMed]
- Noordover, B.A.J.; Duchateau, R.; van Benthem, R.A.T.M.; Ming, W.; Koning, C.E. Enhancing the Functionality of Biobased Polyester Coating Resins through Modification with Citric Acid. Biomacromolecules 2007, 8, 3860–3870. [Google Scholar] [CrossRef]
- et al. , 2017.
- Maria, R.M.; Moraes, T.B.; Magon, C.J.; Venâncio, T.; Altei, W.F.; Andricopulo, A.D.; Colnago, L.A. Processing of High Resolution Magic Angle Spinning Spectra of Breast Cancer Cells by the Filter Diagonalization Method. Analyst 2012, 137, 4546–4551. [Google Scholar] [CrossRef]
- Duncan, T.M. 13C Chemical Shieldings in Solids. J Phys Chem Ref Data 1987, 16, 125–151. [Google Scholar] [CrossRef]
- Castro et al 2023.
- Nair, L.S.; Laurencin, C.T. Biodegradable Polymers as Biomaterials. Progress in Polymer Science (Oxford) 2007, 32, 762–798. [Google Scholar] [CrossRef]
- Shon, K.-J.; Kim, Y.; Colnago, L.A.; Opella, S.J. NMR Studies of the Structure and Dynamics of Membrane-Bound Bacteriophage Pf1 Coat Protein. Science (1979) 1991, 252, 1303–1305. [Google Scholar] [CrossRef]
- Leo, G.C.; Colnago, L.A.; Valentine, K.G.; Opella, S.J. Dynamics of Fd Coat Protein in Lipid Bilayers. Biochemistry 1987, 26, 854–862. [Google Scholar] [CrossRef]
- Bundy, J.G.; Osborn, D.; Weeks, J.M.; Lindon, J.C.; Nicholson, J.K. An NMR-Based Metabonomic Approach to the Investigation of Coelomic Fluid Biochemistry in Earthworms under Toxic Stress. FEBS Lett 2001, 500, 31–35. [Google Scholar] [CrossRef] [PubMed]
- Ma, Y.; Mou, Q.; Wang, D.; Zhu, X.; Yan, D. Dendritic Polymers for Theranostics. Theranostics 2016, 6, 930–947. [Google Scholar] [CrossRef] [PubMed]
- Scarsi, M.; Brandelero, R.P.H.; Deuner, C. Desempenho Germinativo de Sementes de Soja Revestidas Com Polímeros Hidrofílicos. COLLOQUIUM AGRARIAE 2020, 16, 48–59. [Google Scholar] [CrossRef]
- Hungria, M.; Nogueira, M.A.; Araujo, R.S. Soybean Seed Co-Inoculation with <I>Bradyrhizobium</I> Spp. and <I>Azospirillum Brasilense</I>: A New Biotechnological Tool to Improve Yield and Sustainability. Am J Plant Sci 2015, 06, 811–817. [Google Scholar] [CrossRef]
- Meneguzzo, M.R.R.; Meneghello, G.E.; Nadal, A.P.; Xavier, F.D.M.; Dellagostin, S.M.; Carvalho, I.R.; Gonçalves, V.P.; Lautenchleger, F.; Lângaro, N.C. Seedling Length and Soybean Seed Vigor. Ciencia Rural 2021, 51. [Google Scholar] [CrossRef]
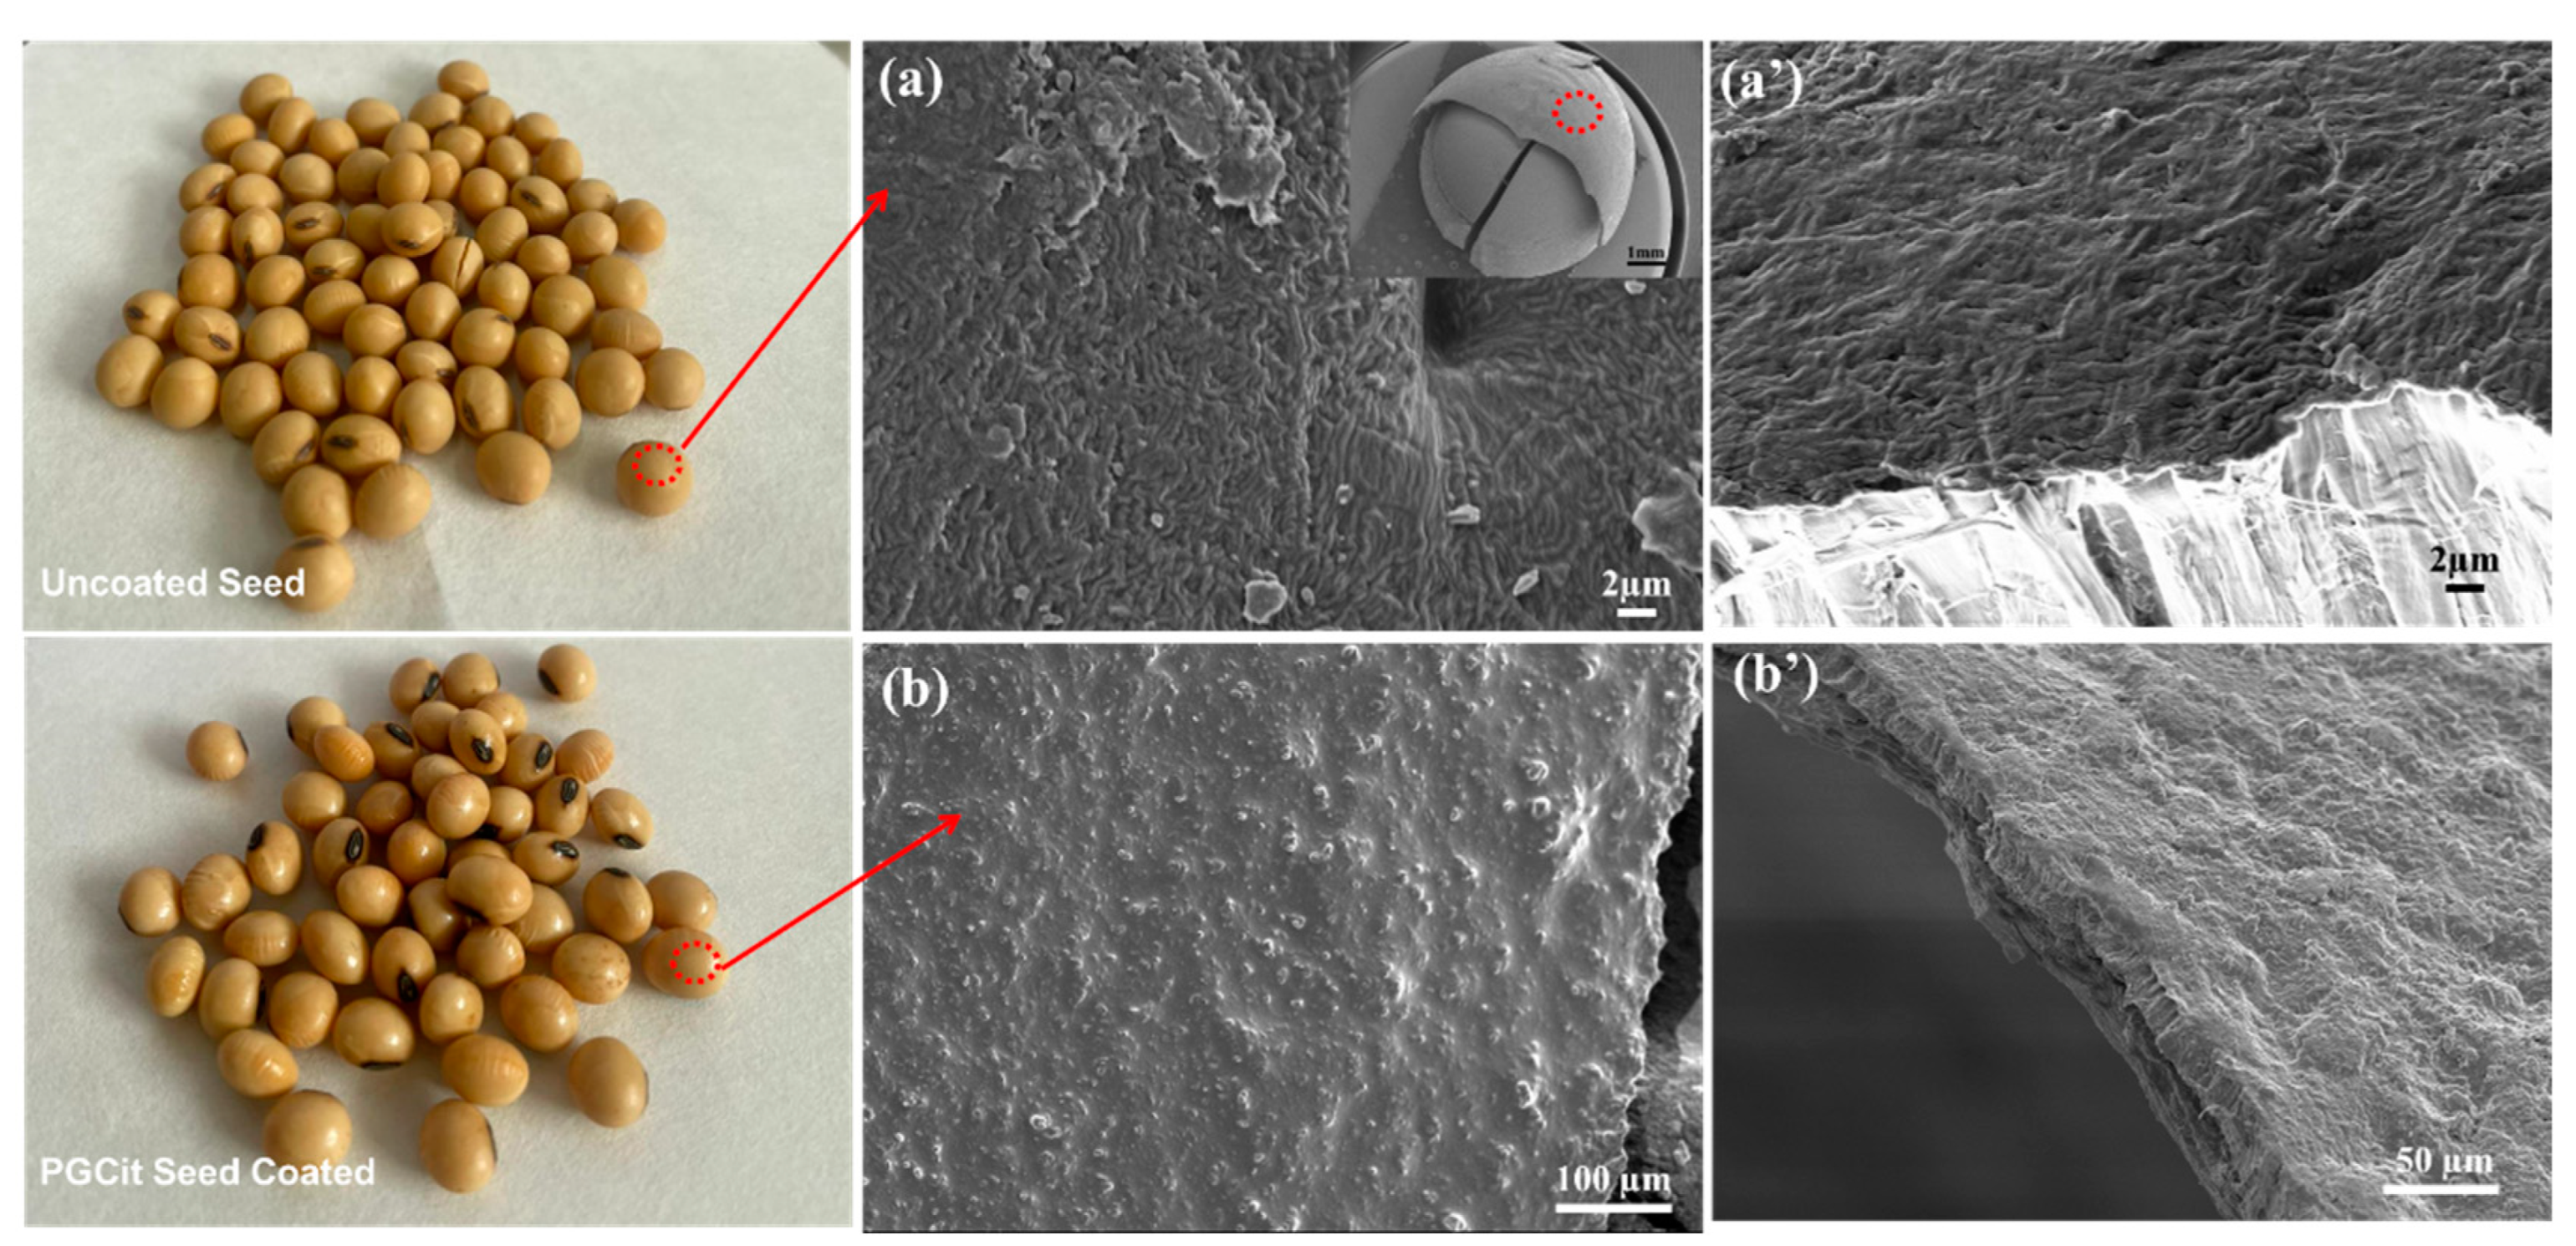
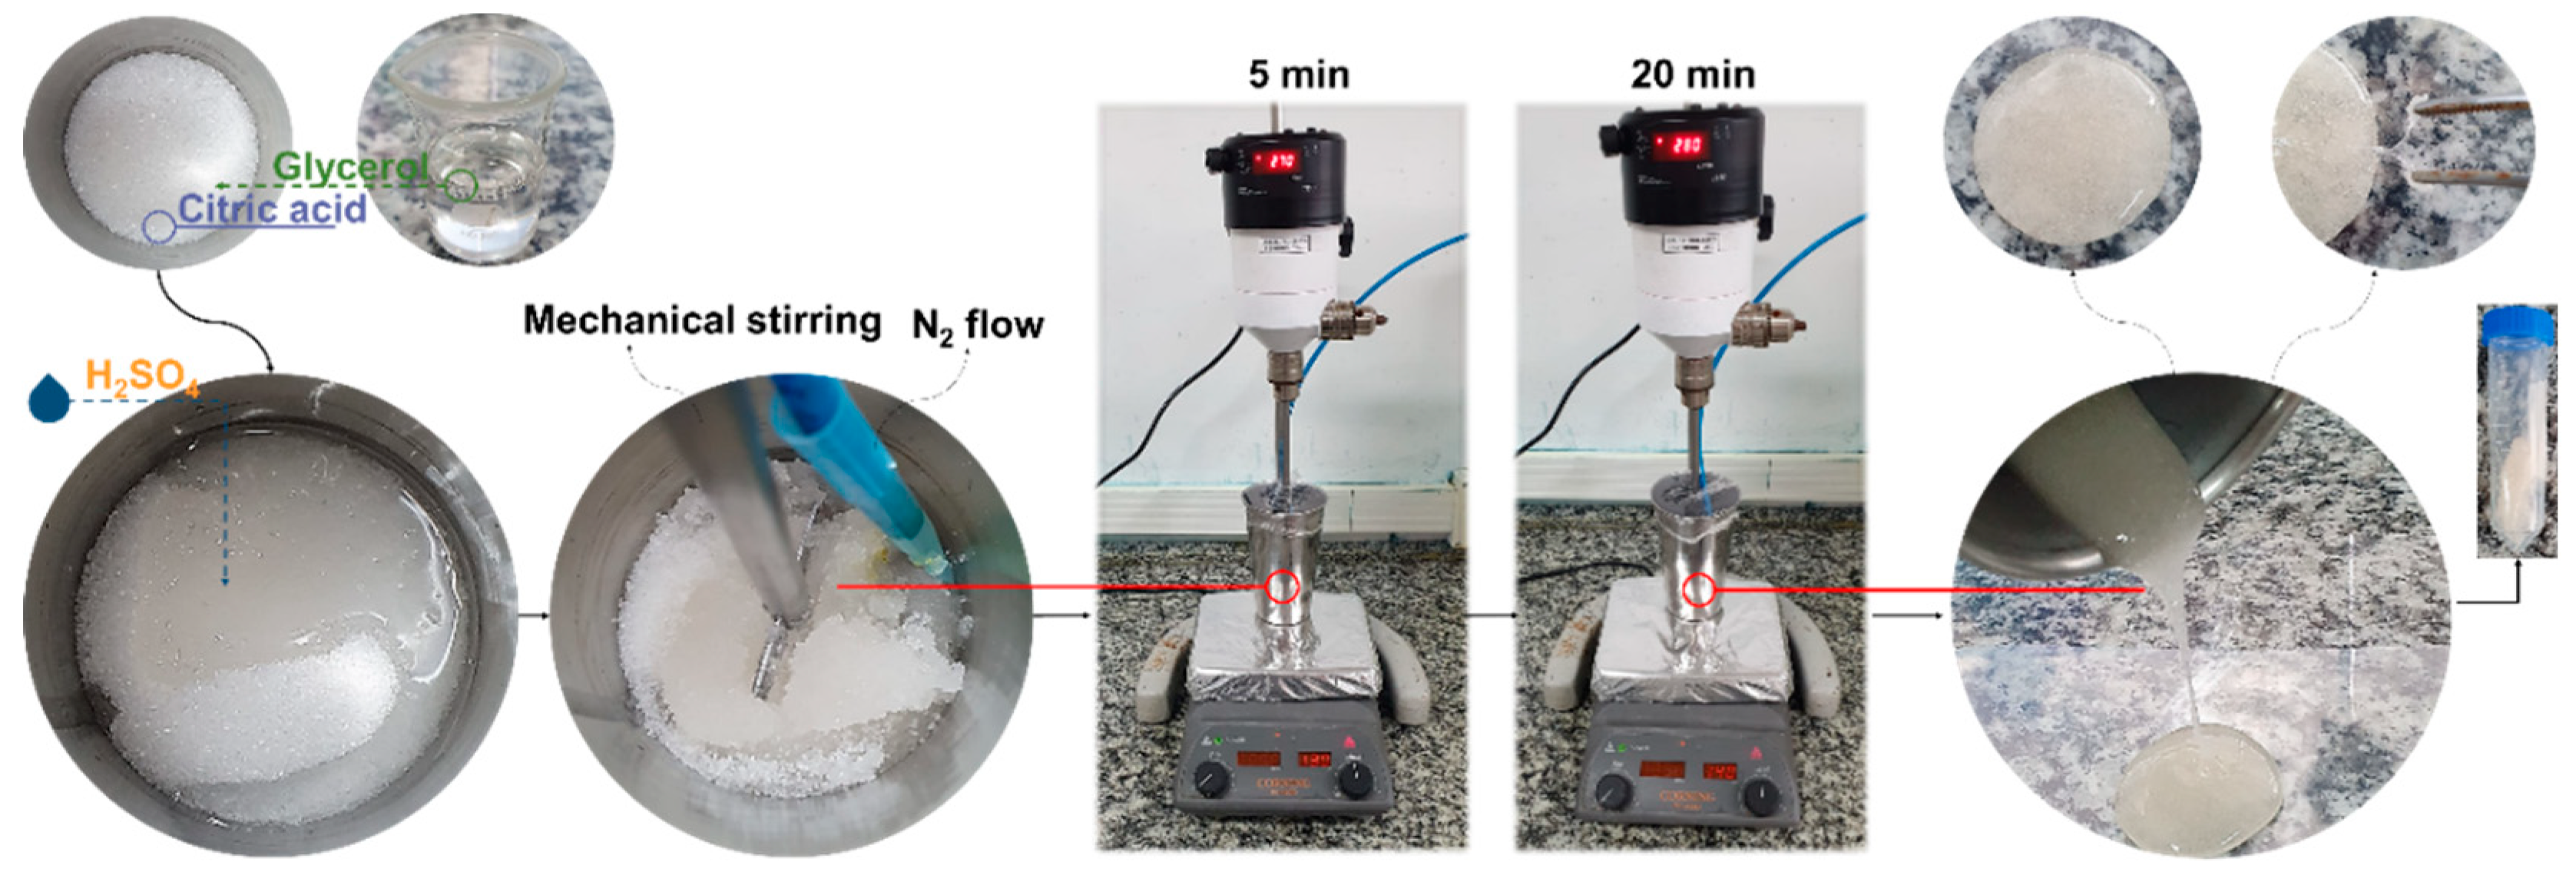

| Nomenclature | Molar ratio Gly:Cit | Glycerol | Citric acid | Catalyst (H2SO4) | ||
|---|---|---|---|---|---|---|
| (g) | (mol) | (g) | (mol) | (ml) | ||
| PGCit 1:2 | 1:2 | 9.59 | 0.104 | 40 | 0.208 | - |
| PGCit 1:1 | 1:1 | 9.59 | 0.104 | 20 | 0.104 | |
| PGCit 2:1 | 2:1 | 19.18 | 0.208 | 20 | 0.104 | |
| PGCit 1:2 | 1:2 | 9.59 | 0.104 | 40 | 0.208 | 0.24 |
| PGCit 1:1 | 1:1 | 9.59 | 0.104 | 20 | 0.104 | 0.12 |
| PGCit 2:1 | 2:1 | 19.18 | 0.208 | 20 | 0.104 | 0.12 |
Disclaimer/Publisher’s Note: The statements, opinions and data contained in all publications are solely those of the individual author(s) and contributor(s) and not of MDPI and/or the editor(s). MDPI and/or the editor(s) disclaim responsibility for any injury to people or property resulting from any ideas, methods, instructions or products referred to in the content. |
© 2023 by the authors. Licensee MDPI, Basel, Switzerland. This article is an open access article distributed under the terms and conditions of the Creative Commons Attribution (CC BY) license (http://creativecommons.org/licenses/by/4.0/).


