
Submitted:
01 August 2023
Posted:
02 August 2023
You are already at the latest version
Abstract
The emergence of new methodologies and tools for digitizing objects belonging to the Cultural Heritage (CH) changed the paradigms adopted so far. Traditionally, the process to acquire artifacts required specialized and often costly equipment tailored to specific purposes. However, the development of more generalized, adaptable, and affordable tools led to novel approaches. This manuscript provides a glimpse into the evolving landscape of custom-made tools for digital documentation, both hardware and software, and their transformative impact on the digitization techniques, built to meet requirements of specific case studies, including ancient drawings, manuscripts, paintings, and museum objects. The advent of self-built instruments has revolutionized the way professionals work today, by leveraging a new generation of low-cost, adaptable gears, leading to unprecedented flexibility and efficiency, while facilitating the capture of high-quality digital representations of objects with minimal damage and preserving their integrity. The outcomes of instruments and tools specifically produced for the contexts described in this paper highlight their potential for promoting interdisciplinary collaboration, facilitating scholarly research, enhancing conservation efforts, and fostering cultural exchange. Ultimately, this research contributes to illustrate how custom software, in combination with recent devices such as smartphones and 3D printers, underscores the importance of adopting these innovative approaches to generate an ecosystem of tools and methods able to preserve, document, and promote the richness of our collective past for future generations.
Keywords:
Artifacts digitization
; Paintings digitization
; Drawings digitization
; custom-made instruments
; 3D printing
; photometric stereo
; digital photogrammetry
; 2D capture instruments
; 3D capture instruments
1. Introduction
Hardware instruments played a key role in the activities of surveyors, architects, restorers, and other professionals involved in the Cultural Heritage (CH) documentation - particularly in the field of arts and architecture - with the aim of knowledge, conservation, communication, and re-use as design background, even dating back to ancient times. In Figure 1 is represented a portrait of the Italian architect Andrea Palladio, the author of the most widespread and famous architectural treatise of all time, The four books of the architecture [1], and surely one of the major artists of Renaissance around the world. The illustration showcases the architect together with the instruments essential to his craft, illustrating his expertise in selecting and employing them with precision for the purpose of the architectural project and survey.
Despite their operational importance and the extraordinary changes related to the IT introduction, the attention they received in recent time was very limited. The new instruments were generally simply accepted without any critical analysis of their advantages, limits, appropriate use, possibilities of new works and workflows enabling analysis previously impossible to do.
The established new workflows demonstrate minimal innovation within the process in where they are embedded, yielding limited benefits. The results remain experimental rather than creating an extensive accumulation of knowledge.
We can find the same scenario also in the field of the CH survey. The emergence of IT expanded the capabilities of survey equipment, with a growing emphasis on documenting ancient artifacts such as graphic works, paintings, sculptures, and archaeological findings, through the creation of more and more faithful 3D models using digital-based tools (e.g., laser scanners, digital cameras, etc.) employing new processes quickly improving over the years. If dedicated software grew up fostering increasingly advanced automatisms, the hardware backing computer applications changed as well, not only in the many possible ways to use it, but also in methods and techniques to produce it [2].
However, besides the possibility to capture data for the 3D model construction of the artefacts [3], the process for reality capture remains unchanged in the need of specialized operators (it’s true that the platea of operators is enlarged, but surveys dedicated to operations on CH lifecycle are minimally improved and knowledge of their methods and their effective use by CH operators remain a blue-sky desire). IT-based CH reality capture hardware instruments are usually designed for specific tasks and to be easily integrated in the software pipelines (the real novelty).
In this scenario the surveyor continues to rely on specialized specific instruments (e.g., no laser scanner currently exists that can capture objects of varying sizes with the appropriate resolution. The transition from scanning artifacts inscribed in a one-meter cube to objects as large as 100 meters long and 30 meters high, it is necessary to utilize at least three different types of laser scanners) and carry out 3D reality capture operations on the go remains nearly impractical.
On the other hand, well established instruments stayed in use as SLR cameras, which simply replaced the old film with CMOS image sensors, and related accessories (tripods, lamps, stands, etc.). The expansion of the possible uses of the cameras, their portability and their relative low-cost have certainly made it possible to exploit all the advantages of digitization, processes automation, and the use of data in the form of numerical files for non-contact surveying methods, but they have not brought limited advantages only in conducting a survey. On the fly survey requires that you always carry your camera along with your set of lenses and some linear measuring tool (such as a ruler or a metric wheel). High precision surveys require specific and expensive instrumentation such as the Phase One iXM Camera System [4]. Even with advancements in technology, the current general workflow still needs a process that closely resembles the traditional, non-digital approach.
To overcome this standoff, it’s nowadays a key point to explore, innovate, evaluate the new instruments, to bound accurately their capabilities, and evaluate accurately their proper utilization, which holds utmost significance for the fields of AH (Architectural Heritage), CH Archaeology, and their related activities. This aspect remains an uncharted objective in present-day research. Some research groups have found, analyzed, and measured the quality of the new instruments in certain uses, e.g., in 3D data capture of artifacts of all shapes and kinds the 3Dom group at the Bruno Kessler Foundation in Trento (Italy) conducted an excellent work of, Italy [5,6,7,8,9]. However, these analyses were essentially in the context of the evaluation of the performance of the single instrument and not in the study and verification of its ability to fit into a well-determined pipeline or to allow new workflows and uses. Furthermore, there is little literature on frames, rigs and stands designed for specific digitization techniques and easily replicable (a very isolated example is in [10]), a limited number of examples concern gigantic solutions (e.g., [11]), and the major parts of them are linked to topics outside of our interest [12]. A good number of studies can only be found on rotary table-based solutions for 3D object acquisition, as devices with stepper motors and controllers to drive the movement of the table as, for example, in [13,14], but this hardware usually requires complex management and programming skills. In addition, in recent time the scenario of survey instruments is potentially changing, thanks to the emergence of general-purpose versatile tools, usable by any professional or non-professional figure, applicable to various scenarios, enabling new ways of working and new workflows capable of changing the entire operation of reality data capture, either by introducing the possibility of on-the-fly surveys, simplifying the workflow of survey operations, and continuing to ensure qualitatively excellent and metrically accurate results. E.g., smartphones, with their multitude of sensors, i.e., GPS receivers, accelerometers, magnetometers, and gyroscopes, used for positioning, navigation, data recording and transmission could enable also on-the-fly processing and procedures, which were considered impossible to get until a few years ago. In recent years, smartphone camera technology has made formidable improvements regarding sensors quality and software performance, that still improve year after year, supported by flourishing of scientific research in the area. Recent smartphones, such as the Apple iPhone 14 and the Huawei Mate 50 Pro, bring levels of image resolution, sharpness, and colour accuracy sometime better than prosumer SLR cameras [15]. These camera sensors, jointly with adaptable software controls, are a clear example of versatility, as they became eclectically useful across different applications, showcasing the increasing generic nature of adaptable tools in the digital era [16,17]. However, the terrific improvement in the last years of smartphone cameras with the new ‘imaging at our fingertips’ allowing a change in the image documentation role, remains a potential solution. Smartphone cameras are not designed to be light-measuring devices, but to produce visually pleasing photographs exploiting a powerful processing (photofinishing) applied in the camera hardware. As well known, an aesthetically pleasing image does not serve the purpose of adequately documenting Heritage artifacts, as it lacks the necessary properties for tasks such as analysis, material identification, decay assessment, and evaluation of structural issues. Moreover, the in-camera processing complicates the process of extract the original state of the image (i.e., the RAW state) to use it as light measure. Without any further development for tools, the usefulness of images capture with those devices is limited and it is impossible to solve e.g., color-related problems, a central issue in the CH field [18].
On the other hand, specific physical accessories such as tripods, rigs and stands started to be easier to build and at lower costs, requiring less and less specialistic skills, and leading to new possibilities in customization and self-production, thanks to the diffusion and affordability of 3D printers. Additive manufacturing started to be adopted not exclusively in the industrial field, to produce prototypes, functional parts, customized products, and even complex geometries that are often difficult or too expensive to achieve with traditional manufacturing methods. 3D printing technology has also revolutionized the creation of hardware frames used to support and host cameras and smartphones for various purposes [19]. By leveraging their versatility and customization capabilities, most of these 3D printing systems, jointly with standard elements that you can buy in a warehouse retailer, offer a flexible and tailored solution to construct ad hoc hardware frames. E.g., in the photography-based reality capture this innovative approach not only enhances the functionality and stability of the devices but also enables their precise positioning and alignment necessary to capture images. The potential of generating custom, affordable on demand accessories introduces a transformative aspect to the digital imaging-based workflow [20,21]. This expansion extends well beyond existing boundaries, letting us explore innovative approaches for artifact surveys and adopt new methodologies that align with the lifecycle of CH. However, this new scenario, generating time savings, a wider users base, and better CH management, is minimally explored today.
During the last five years, our group [22] at the Department of Architecture, University of Bologna, experimented a new research path following the idea of developing streamlined workflows to enable real processes to better fill the requirement of the lifecycle, address unresolved problems, reduce the need for manual, repetitive tasks, and provide cost-effective solutions of the CH using generic instruments, self-produced accessories, ad hoc software solutions able to overcome the problems related to the use of general purpose devices. By doing so, the accessibility of IT-related techniques is increased, enabling a wider audience of users to benefit from shared procedures and results. This approach led to some novel perspectives in custom-building tools that can host cameras, smartphones, and light sources, enabling the controlled capture of high-quality photos of paintings, drawings, small architectural artifacts, and sculptures. In this paper the approach illustrating the designed and fabricated instruments is illustrated, together with the software allowing their right use and the related workflows in the case study of 3D digital virtual replicas of valuable ancient drawings, paintings, manuscripts, sculptures, and 3D artifacts preserved in museum collections.
We will focus on photography-based data acquisition instruments, where improvements can generate strong results and each progress is well supported - as said - by the great continuous technological progress and CH artefacts including ancient drawings, manuscripts, paintings, and museum objects. Since 2000, the research group has been involved in the development of methods, techniques and software and hardware tools to digitize e visualize in 2D and 3D these objects [23,24] allowing the construction of a solid theoretical and practical background about problems and solutions.
The variability in dimensions, materials, and optical properties of the investigated specimens allow to ensure that developed solutions were sufficiently general and robust, and, at same time, able to cover a large spectrum of type of objects.
In detail we investigated two different paths.
In this paper we present a critical overview of these new systems with the aim to show a new methodological and technical scenario on which to focus research on the coming years. To fully understand problems/solutions, the evolution of each instrument created will be illustrated, to allow the reader to easily understand the rationale of each specific choice. After this Introduction, the Materials and Methods section introduces the pipelines and both custom software then hardware tools. The Results section introduces the replicable outcomes on some real case studies in different scenarios where solutions developed were employed. The Conclusions section finalizes the paper, bringing into the discussion future perspectives on the novel paradigms on fabrication and design of tools.
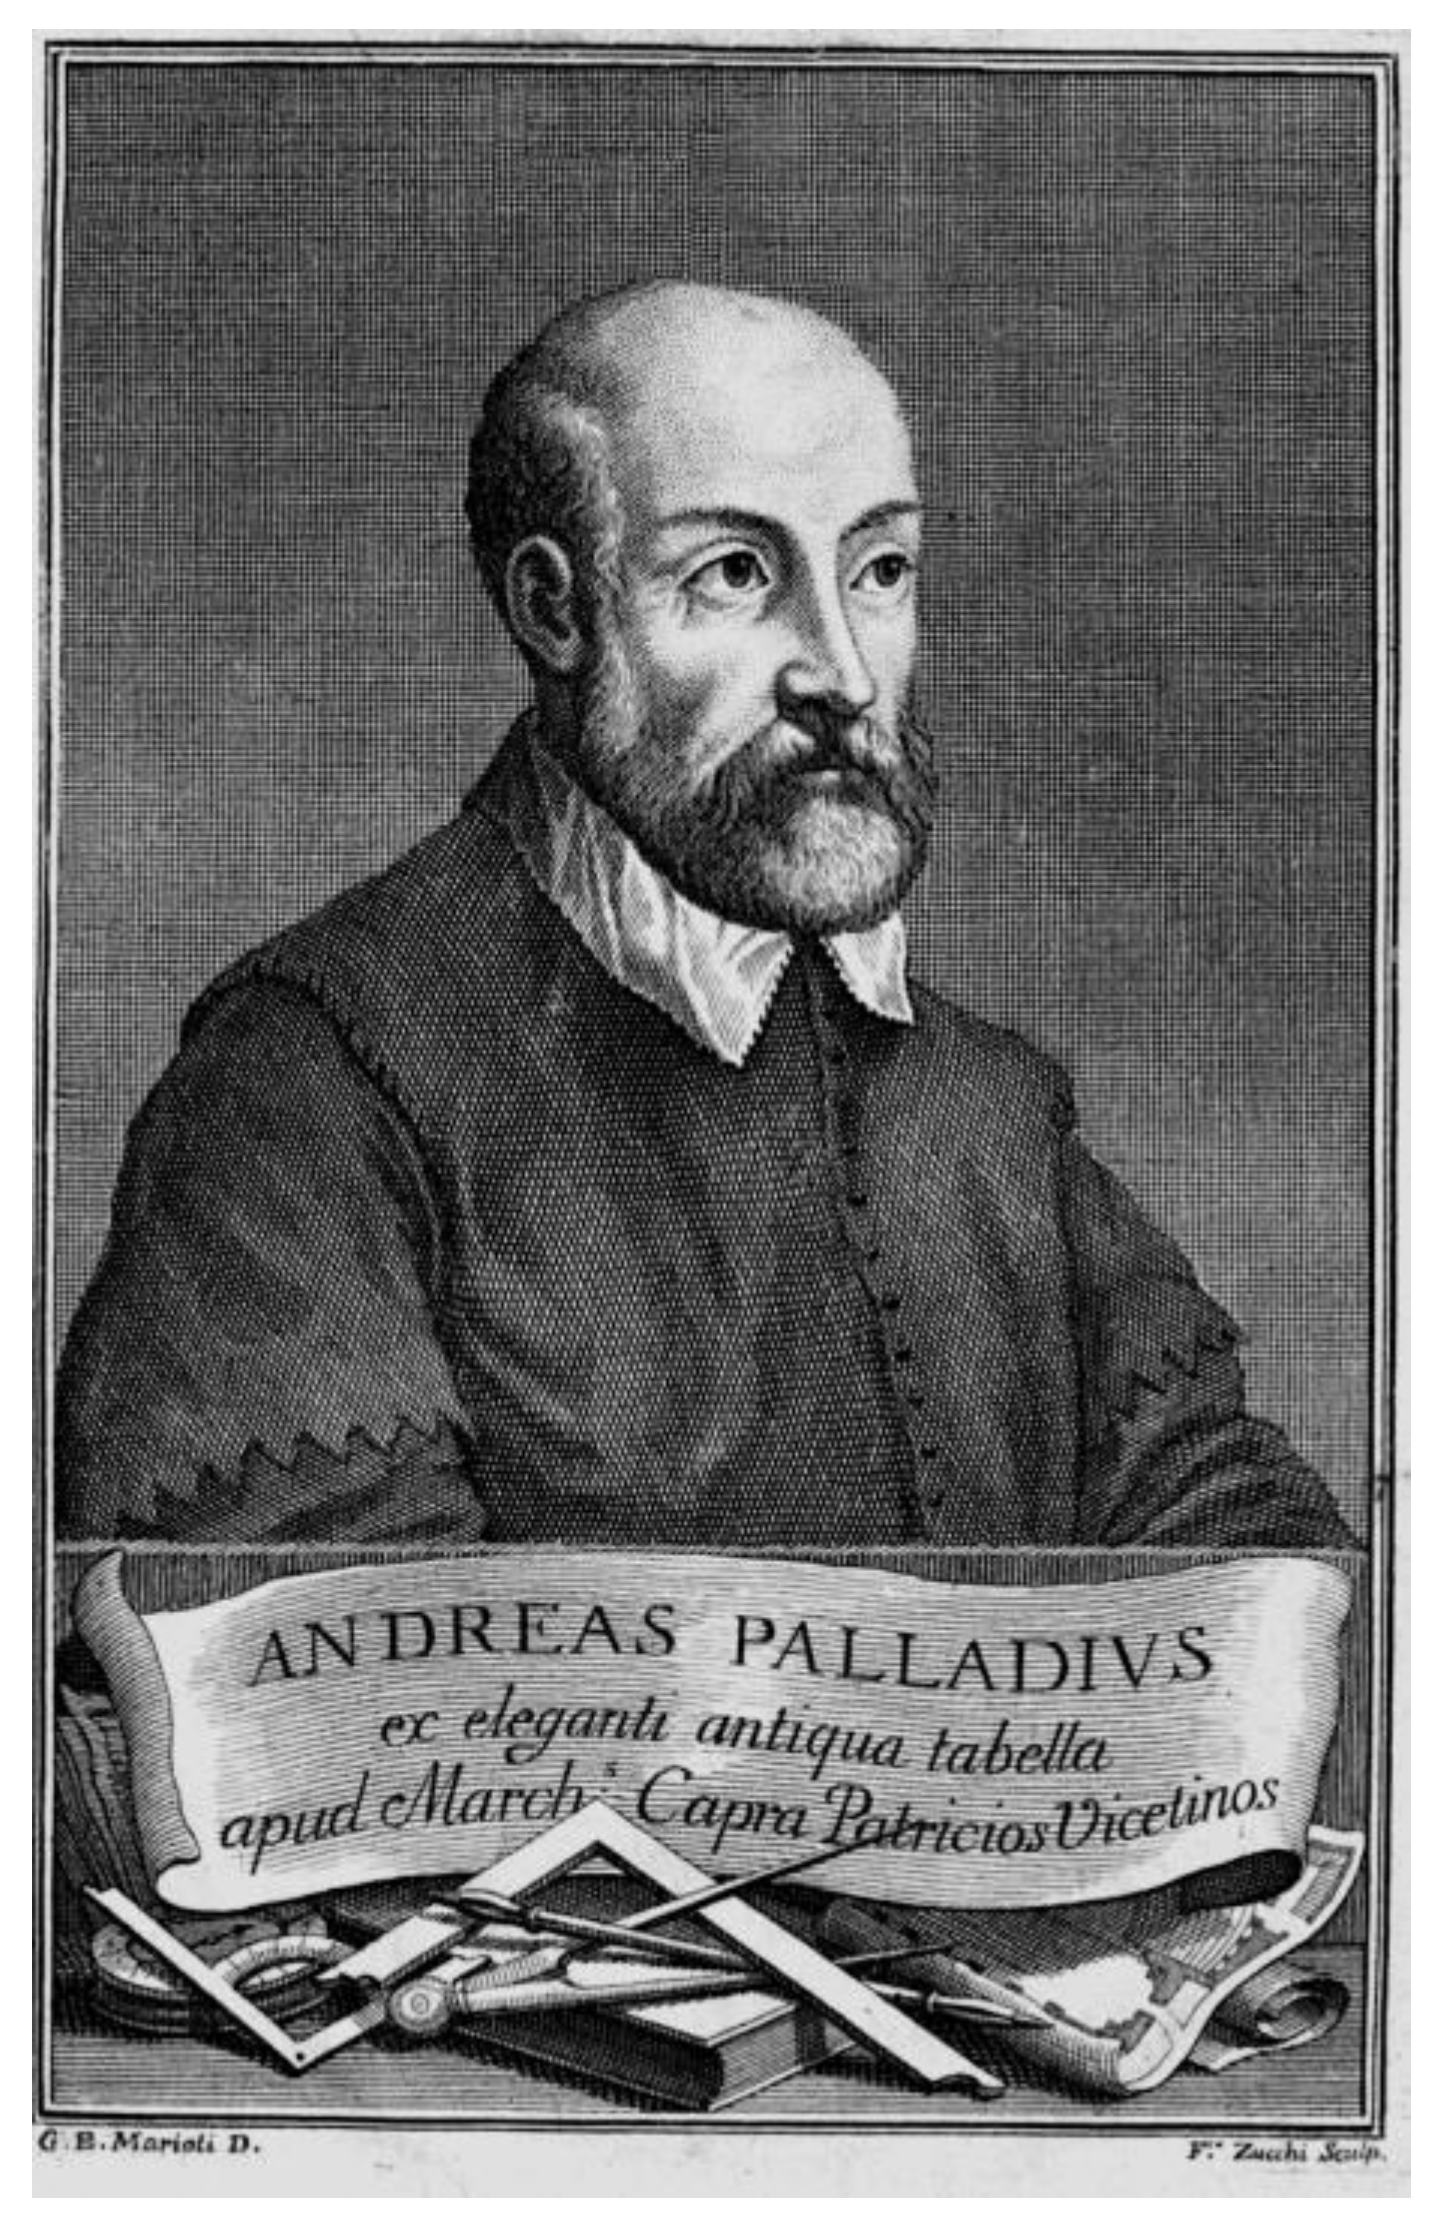
Figure 1.
Old engraving of Andrea Palladio in the collection of the Centro Internazionale di Studi di Architettura Andrea Palladio, in Vicenza, Italy (source: Wikimedia Foundation, public domain).
Figure 1.
Old engraving of Andrea Palladio in the collection of the Centro Internazionale di Studi di Architettura Andrea Palladio, in Vicenza, Italy (source: Wikimedia Foundation, public domain).
2. Materials and Methods
The digitalization process for paintings, drawings, small architectural artifacts, and sculptures through photography involves the use of various hardware tools, mostly digital cameras, and their accompanying accessories. The selection of the camera and of the add-on selection is based on the two possible goals: the highest precision possible or the effortless usage and portability, per the desired level of accuracy. Usually, the highest precision is reached through costly professional equipment, while a desired accuracy can be produced using more general devices, such as SLR cameras.
The operations with both type of devices may result in complex activities that must be carried out by trained operators, while CH artifacts are often studied by museum curators, art historian, restorers, who need digital models to improve and share their knowledge, without being experts in digital 3D reproductions or owners of expensive tools [25].
2.1. Pipelines
To meet the requirements of both the possible outputs it is necessary to implement similar workflows, with substantial differences depending only on whether the desired output is 2D or 3D. These can be summarized, in general, as follows:
- 2D.
-
2D imaging:
- Sensor resolution and color calibration,
- Image acquisition,
- Analog-to-digital conversion,
- Demosaicking,
- White balance,
- Color correction,
- Denoising and sharpening,
- 2D output to target color space and gamma encoding.
- 3D.
-
Photogrammetry:
- Sensor radiometric calibration,
- Image acquisition,
- Analog-to-digital conversion,
- Demosaicking,
- White balance,
- Color correction,
- Denoising and sharpening,
- 2D output to target color space and gamma encoding,
- Sensor calibration and orientation through self-calibration,
- Measurement introduction,
- Surfaces generation,
-
2D output:
- ∘
- Texturing,
- ∘
- Ortho-images production,
-
3D output:
- ∘
- Export of models towards 3D modeling applications.
- 3D.
-
Photometric stereo:
- Sensor resolution and color calibration,
- Image acquisition,
- Analog-to-digital conversion,
- Demosaicking,
- White balance,
- Color correction,
- Denoising and sharpening,
- 2D output to target color space and gamma encoding,
-
Maps extraction:
- ∘
- Diffusion map,
- ∘
- Normal map,
- ∘
- Specular map,
- Generation of mesh surfaces,
-
2D output:
- ∘
- Maps for shaders,
-
3D output:
- ∘
- Export of models towards 3D applications.
Challenges in acquiring 2D images lie in achieving the appropriate resolution and color accuracy to ensure their most accurate reproduction. In the case of 3D, additional requirements include images capable of leveraging common techniques such as photogrammetry for geometric surveying and photometric stereo [26,27,28,29,30,31] for primarily reconstructing the mesostructure, along with more recent advancements like Nerf [32,33,34,35]. These distinct pipelines require different equipment and software. The research presented here aims to illustrate the developed hardware kit and their developmental logic, tailored to meet the needs of various scenarios with the desired goals of highest accuracy or a desired accuracy but with an effortless usage and portability and the claim goal of the exploitation of the new technological possibilities.
The new equipment aims to overcome typical capture problem as the lack of control of lighting sources and interreflections in the environment, the safety of the surveyed objects, and the maintenance of the predetermined photometric, dimensional, and spatial quality requirements.
Basically, workflows used are unchanged, but journey, usability and efficiency are much improved. Moreover, as the devices are closely linked to the computer programs for image processing to achieve the desired outputs, the description of the new hardware equipment solutions will be preceded by the description of the developed software, needed to easily exploit the new instruments. Alongside these, the calibration methods for the entire solutions will be elucidated, as they are essential to ensure the required colorimetric, resolution, metric, and formal accuracies.
2.2. Developed software solutions
To make efficient the 2D and 3D pipelines developed around the newly developed surveying instruments, a couple of software solutions was developed:
- nLights, a photometric stereo solution designed to reconstruct maps and geometry [37].
SHAFT is a software managing the 2D imaging steps of RAW conversion, white balance, and color correction (CC) exploiting target-based techniques [38]. CC is necessary since camera sensors (both in traditional DSLR and smartphones) do not have the same spectral sensitivity as the cones in the human eye [39], leading to metamerism phenomena between the camera and the eye [40].
SHAFT adopts as targets the Calibrite ColorChecker Classic and Passport and it is basically organized in three steps: RAW image linearization; exposure equalization and white balance adjustment relative to the D4 patch of the ColorChecker; color correction in three phases: linear, polynomial, and successive approximations. The final images are rendered in the most common color spaces: sRGB, Display P3, AdobeRGB.
nLights is an automatic photometric stereo solution for reconstructing albedo maps, normals, heights, and specular reflections that describe the mesostructure and reflectance properties of flat or semi-flat artifacts such as drawings or paintings. Additionally, nLights provides a 3D geometric representation of the sheet's shape in the form of a 3D STL or OBJ geometric file, obtained from the depth map. All these data can be later used in the definition of shaders in the visualization final stage. nLights uses four/eight pictures of the artefacts with constant illumination from four/eight directions, approximately orthogonal to each other, while keeping the camera position fixed with the axis perpendicular to the surface of the drawing or painting.
Both these applications are implemented in the MATLAB programming environment.
In Figure 2 comparison charts on 2D and 3D pipelines are represented, with some highlights on the steps that are performed by the software solutions described above.
2.3. Developed equipment solutions
The developed custom-built equipment solutions refer to indoor acquisitions with controlled lighting and are designed to overcome the following common issues:
- lack of illuminants efficiency, with inconsistent or harmful lighting conditions leading to variations in image quality and accuracy.
- presence of erratic reflections and parasite light coming from outdoor.
- absence of planarity of the camera and the surface to be captured: without a correct planarity between the camera and the object's surface, there can be discrepancies in image resolution, affecting the clarity and details of the captured images.
- significant time required to set up the shooting stage: positioning lighting equipment, light-blocking screens, and cameras can be difficult to setup, time-consuming, increasing the overall time required for capturing images.
- too complex tools requiring specific expertise in their use or many human resources that may pose challenges for average users.
- costly and hard-to-find tools and spares: some hardware tools or setups may be expensive and not easily accessible, making it challenging to acquire them, as, e.g., in the Operation Night Watch project, by Rijksmuseum in Amsterdam [41].
The custom equipment solutions developed to minimize or solve these problems are:
- a set of very portable lights with known emissions and efficiency, to easily transport them and minimize the technical time required to set up the stage,
- a repro stand for artworks to be captured on a horizontal plane, like ancient drawings,
- a repro stand for artworks to be captured on a vertical plane, like paintings or frescoes,
- a calibrated roundtable and 3D test-field plate to capture small museum objects.
A. Portable lights - To avoid the lack of illuminants efficiency and too complex lighting systems to illuminate scenes, a new lighting system based on a series of single LED lights, characterized by limited dimensions and good portability. A custom prototype was built, consisting of sixteen or thirty-two Relio2 LED lights (four or eight on each side of the repro), featuring a correlated color temperature (CCT) of 4000° K, a brightness of 40,000 lux at 0.25 m, and a Color rendering index (CRI) > 95% [42]. The Spectral Power Distribution (SPD) of these illuminators highlights high chromatic consistency across all wavelengths and excellent color rendition even during the rendering phase, with no damaging UV or IR emissions (Figure 3). In Figure 5 the photometry and chromaticity diagrams for illuminants with these features are represented, showing how their performance is close to natural light. Relio2 illuminants were positioned and grouped with specifically designed and 3D printed supports to place lights at desired directions and inclinations.
These supports were crafted in ABS (acrylonitrile-butadiene-styrene) using a XYZprinting Da Vinci Pro 1.0 3D printer and 1.75 mm diameter black matte filament. The choice of ABS as preferred material, rather than other easier-to-print filaments, was driven by the need to prevent the supports from being damaged or deformed by the heat emitted by the illuminators (approximately 60°C each).
This solution is also economically affordable since it solves the problem of finding costly spare parts in case of damages during the working operations (Figure 4).
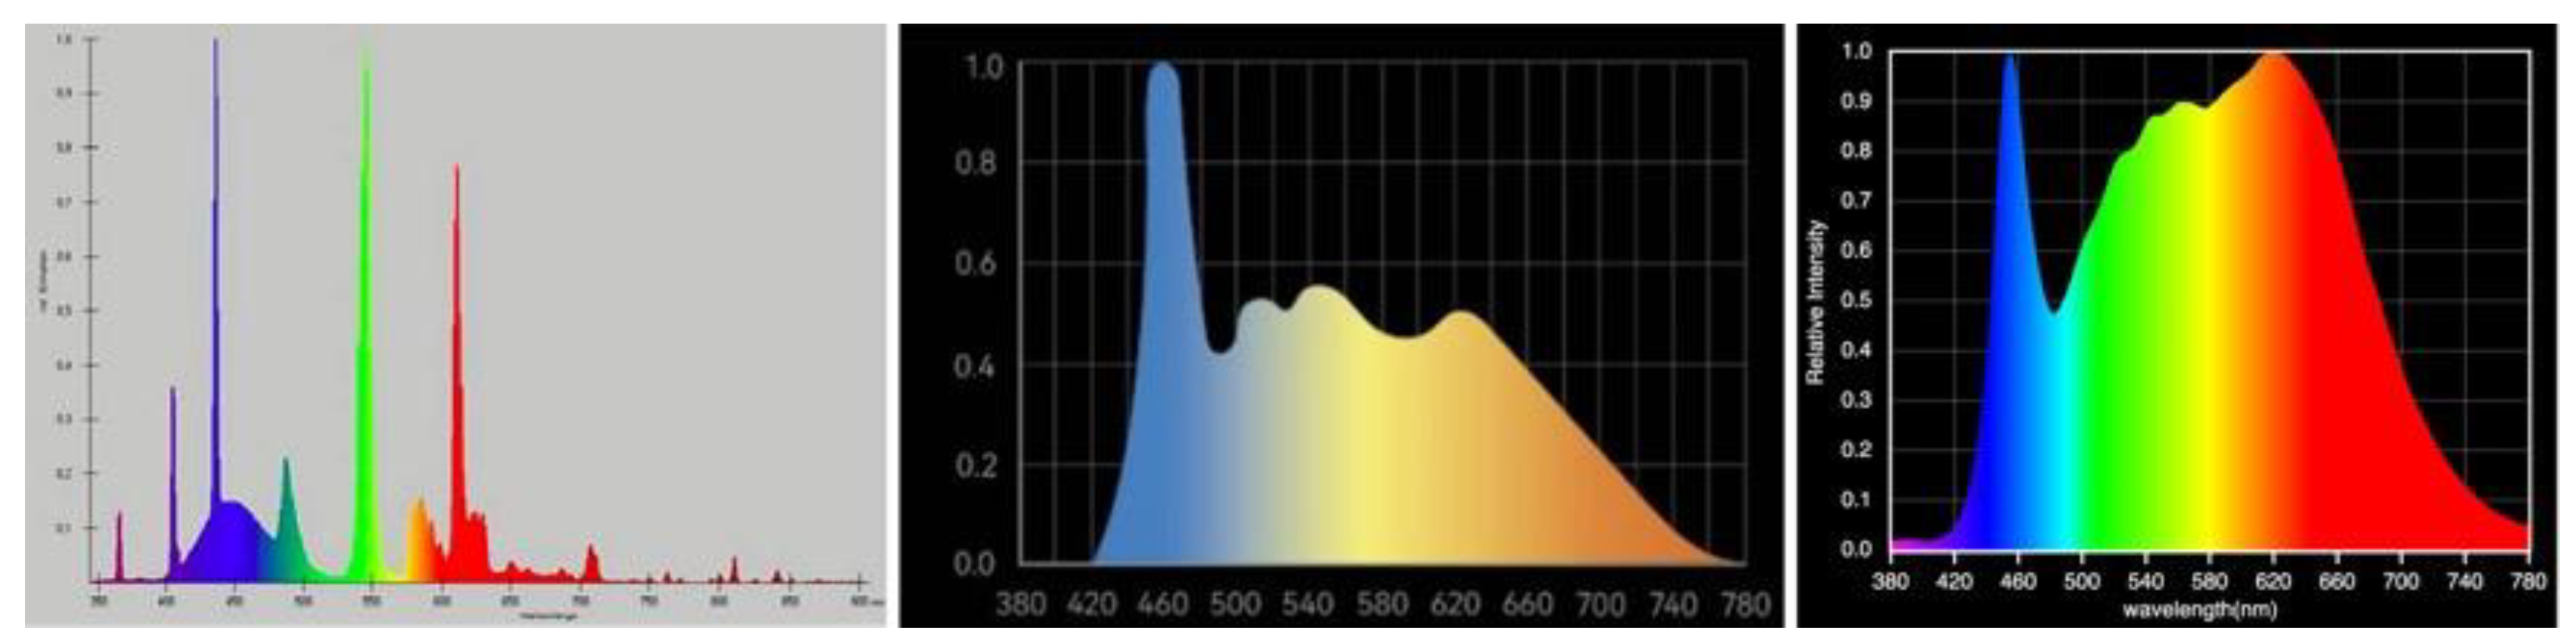
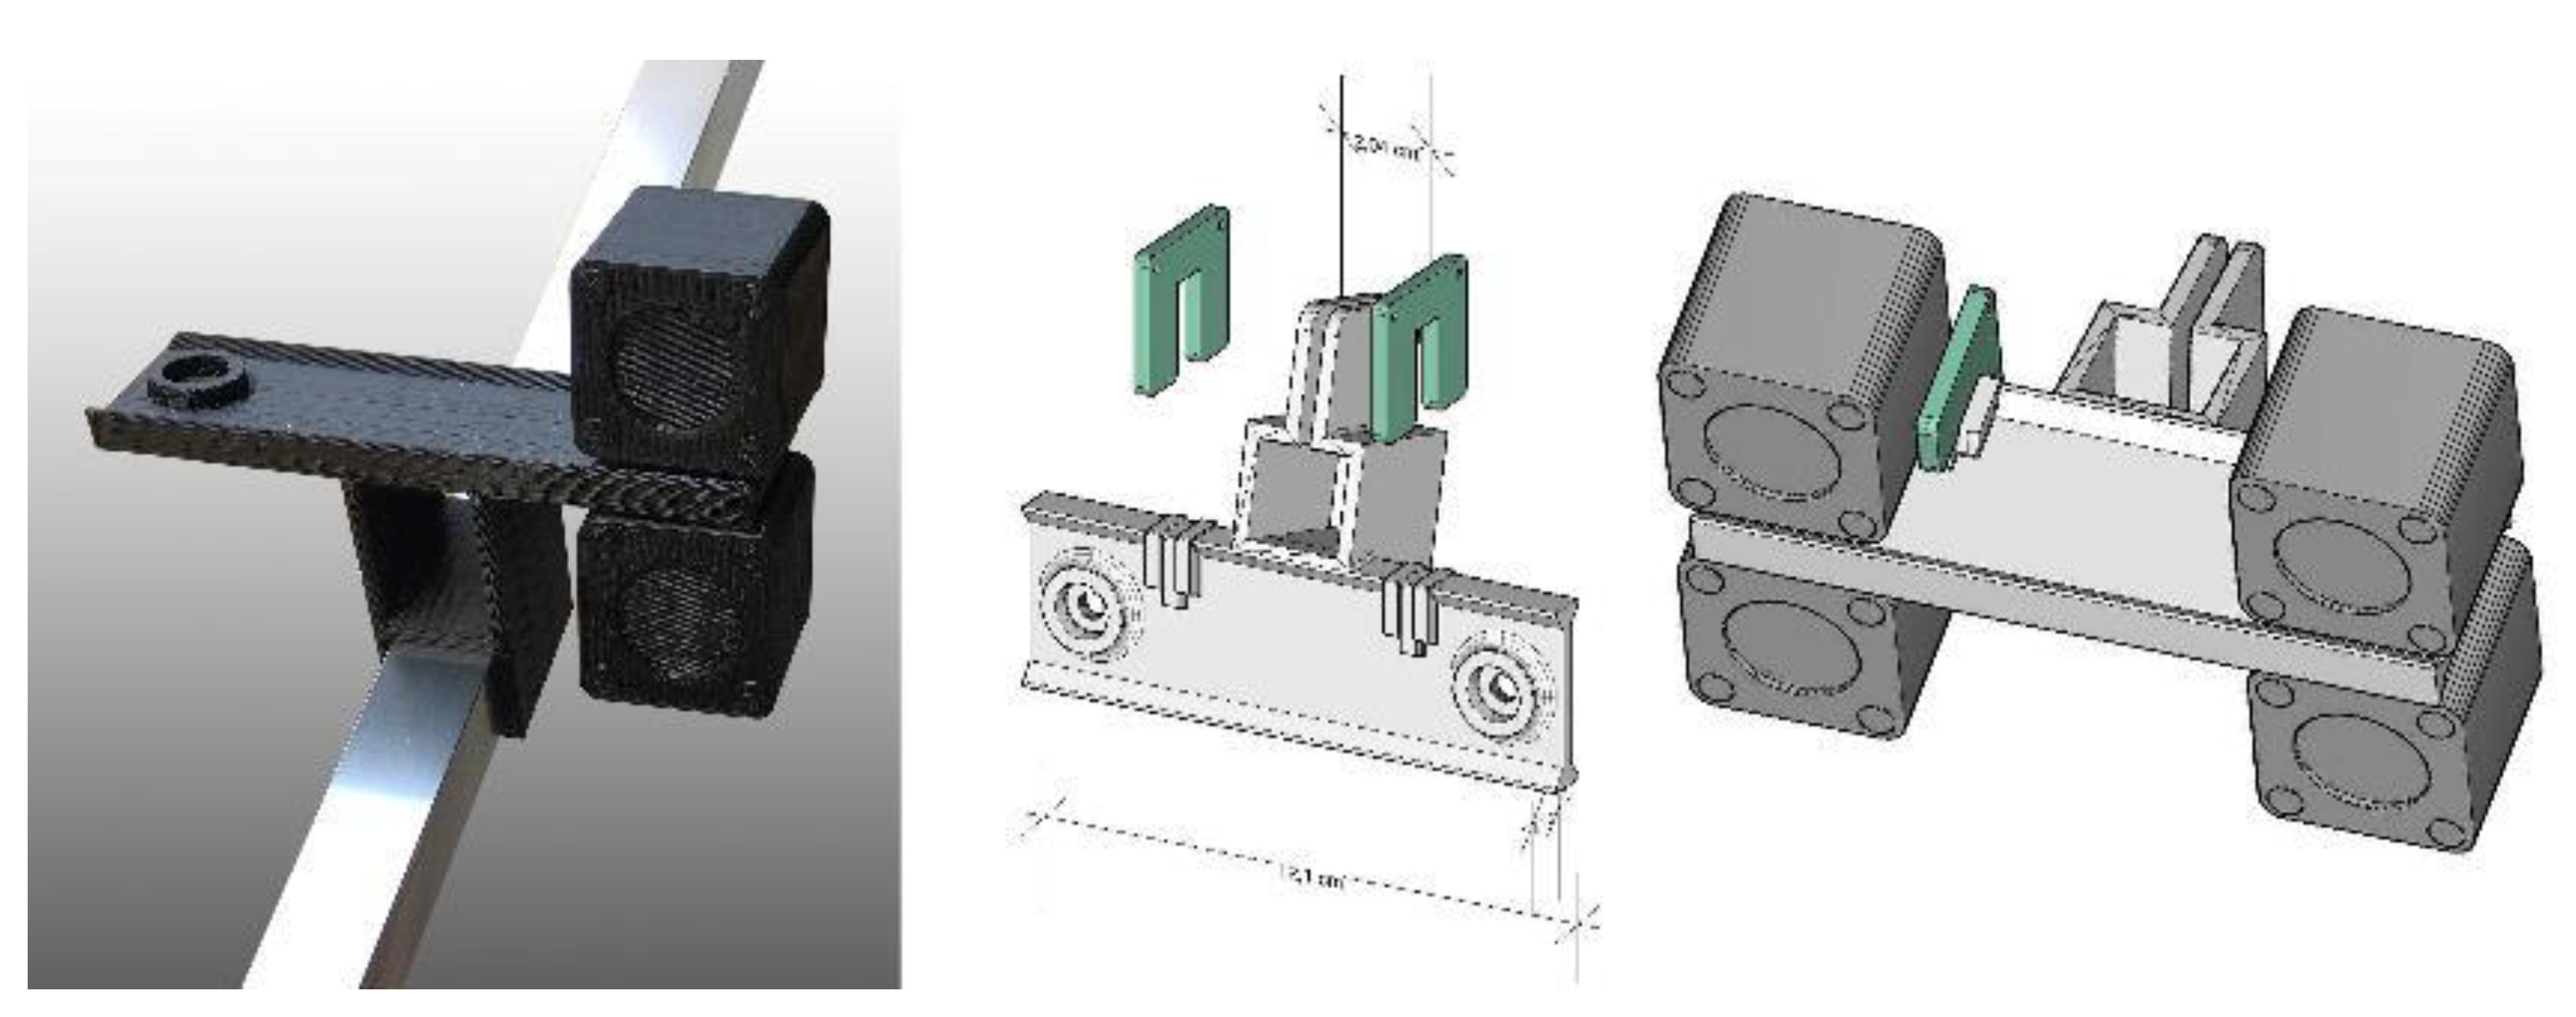
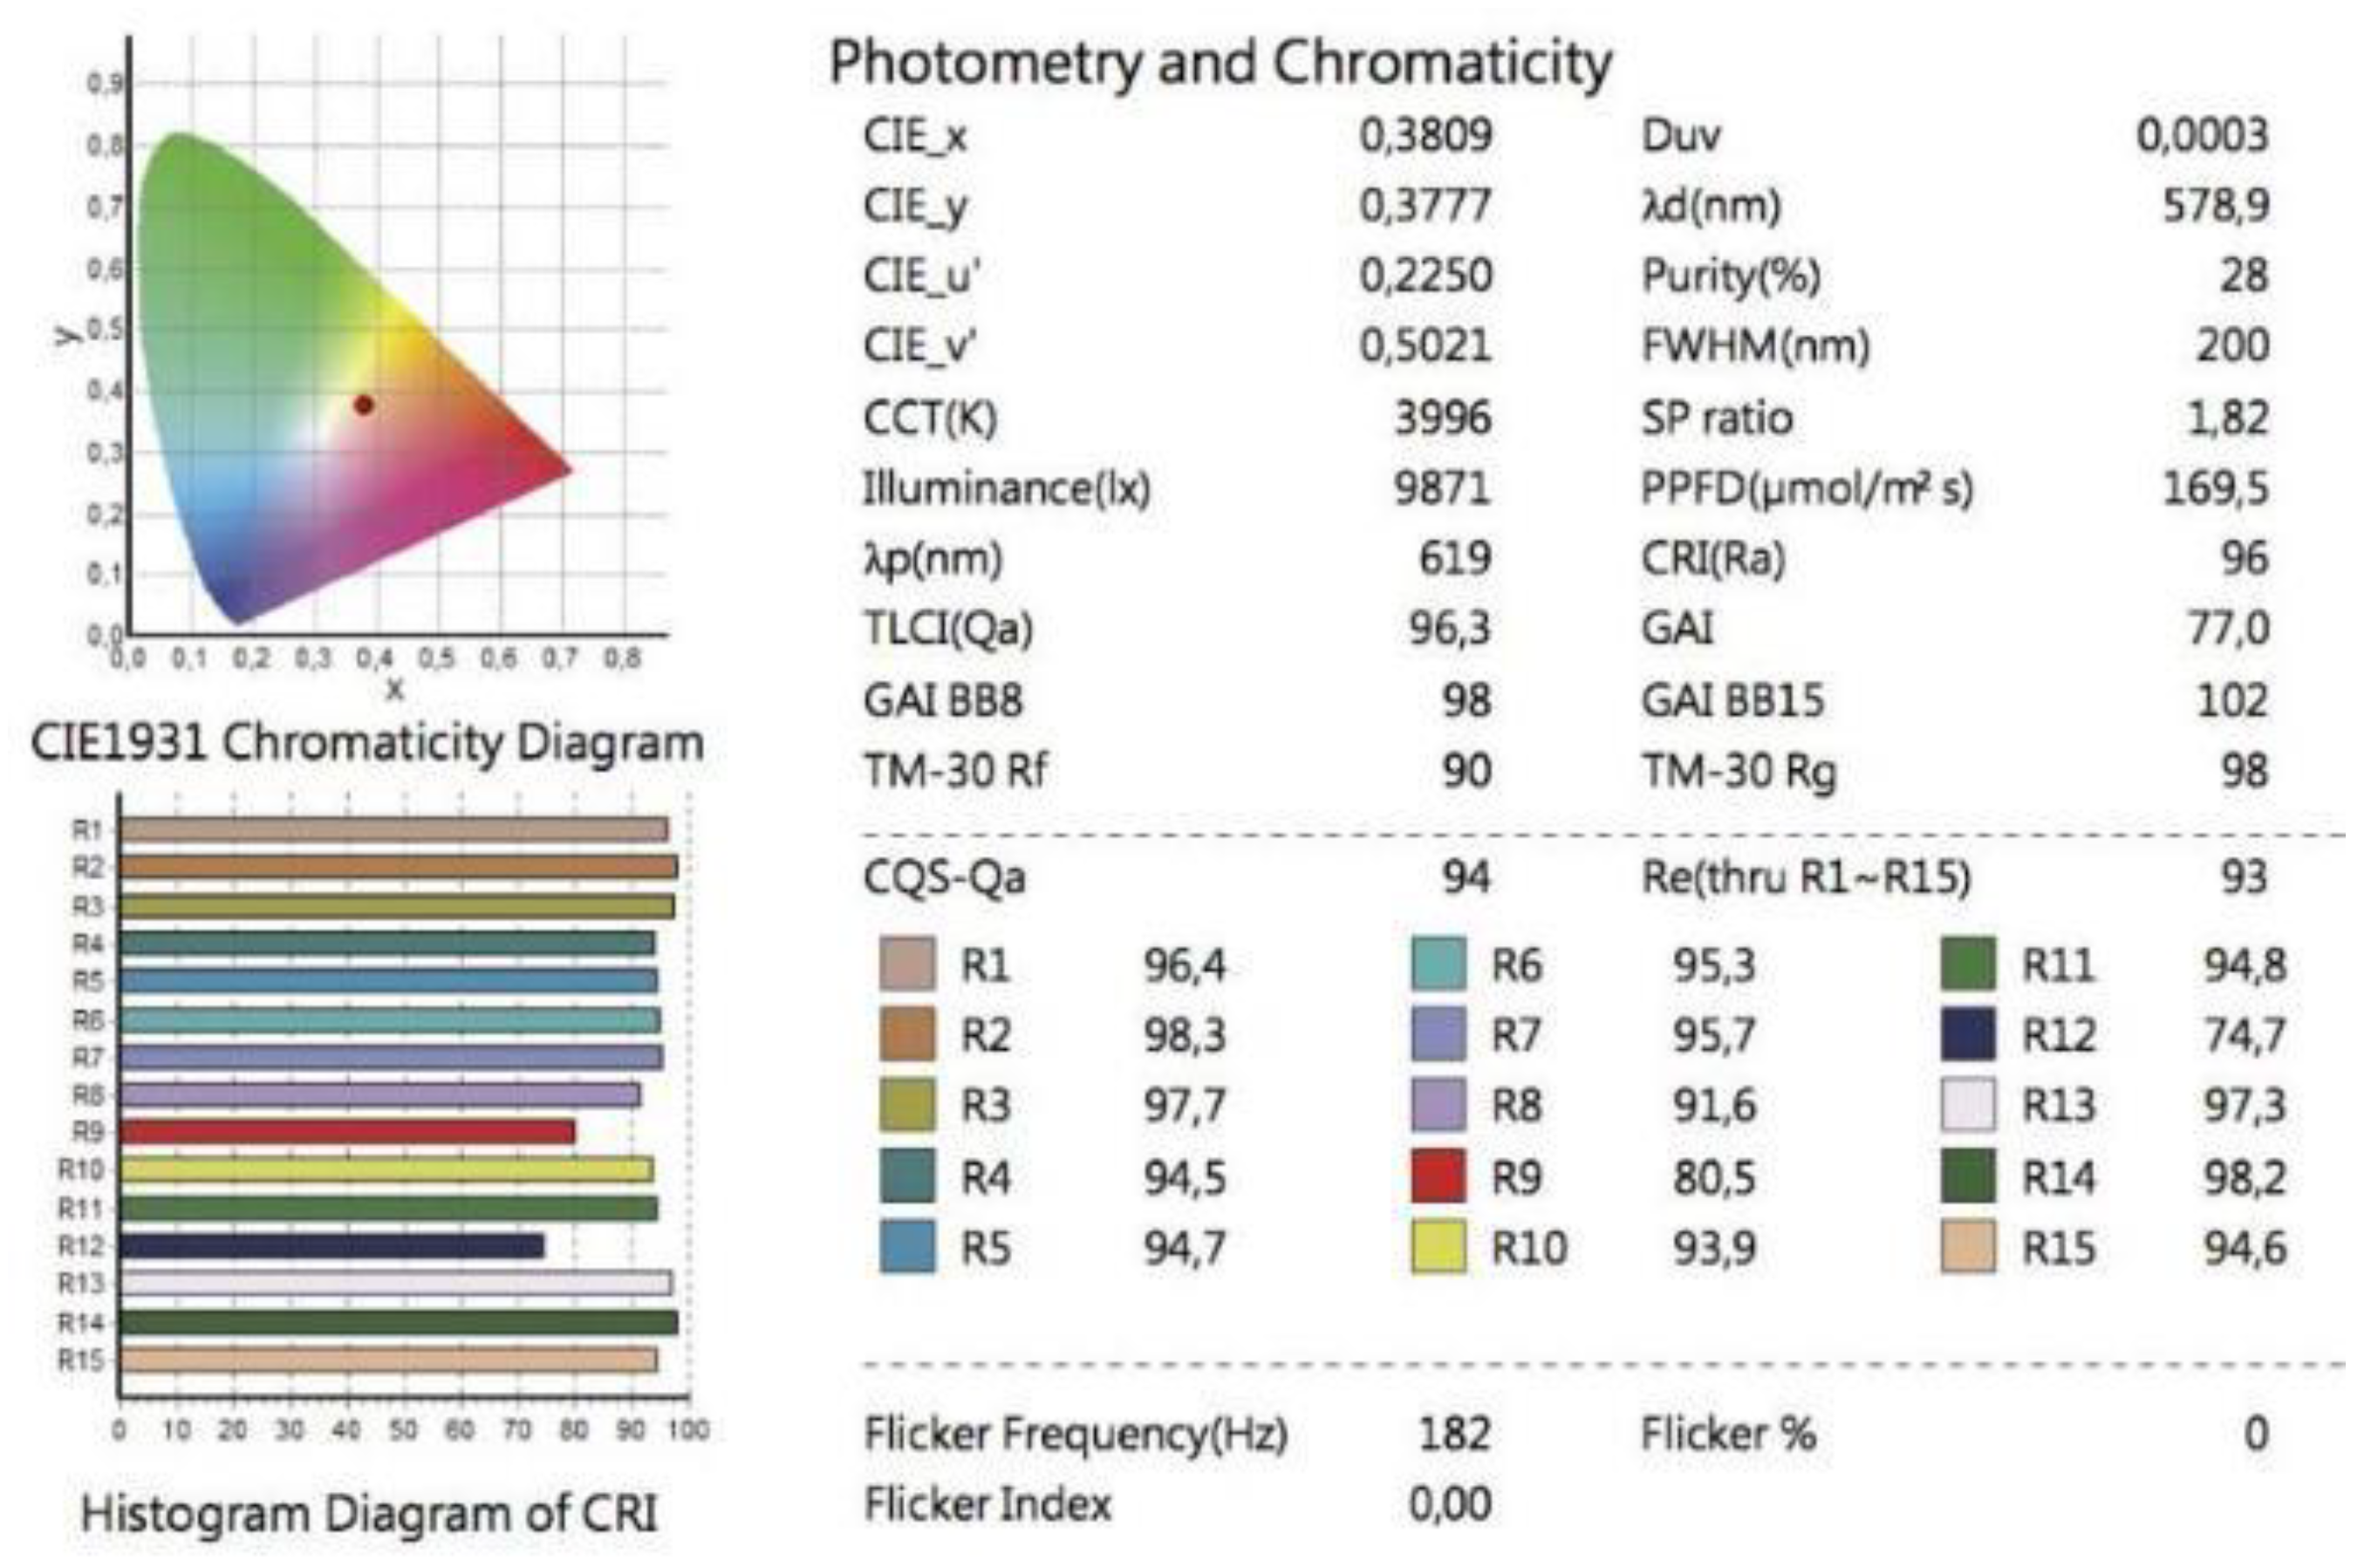
Figure 3.
Comparative SPD emission charts by producers, in which the continuous spectrum of visible light for each tested light is clearly highlighted (from left to right Osram, Godox and Relio2).
Figure 3.
Comparative SPD emission charts by producers, in which the continuous spectrum of visible light for each tested light is clearly highlighted (from left to right Osram, Godox and Relio2).
Figure 4.
3D printed components in ABS to support the Relio2 lights.
Figure 5.
The photometry and chromaticity diagrams for Relio2 lamps, with the histogram for CRI.
B. Repro stand for artworks to be captured on a horizontal plane –The stand was designed to express the following features:
- a stable structure to minimize blurring caused by oscillations and vibrations and lighting small movements that may cause potential non-uniformity of the light,
- a wide reproduction area capable of accommodating the open passe-partout containing the drawings to be captured ensuring a safety management of it and its planarity,
- the lighting system positioned on all four sides, equidistant from the center of the drawing to guarantee homogeneous illumination for the whole acquisition area,
- no interference between the light sources and the camera,
- easy portability within the locations where the drawings are usually stored.
The stand was designed separating the structure responsible for supporting the lighting system and housing the drawing, from the column that holds the camera, consisting in Manfrotto 809 Salon 230, 280 cm. height, equipped with a Manfrotto 410 geared head. To support four Relio2 lights on each side of the shooting surface, four detachable arms made of aluminum extruded profile were prepared. They were connected to the surface using two angled brackets secured with bolts. These supports were deliberately positioned in an asymmetrical manner to enable the opening of the passe-partout and to ensure the positioning of the lights at the same distance from the center of the acquisition plane (660 mm.). In Figure 6 the prototype is illustrated while Table 1 defines the nature of the (commercial or self-built) components used to assemble it. Additionally, alignment gauges were constructed to check the perfect positioning of the arm inclination and light height once assembled at the acquisition location. In Figure 7 the bill of custom-built components and the alignment gauge are reported. In the first prototype the lighting system was made of sixteen Relio2 LED positioned on all four sides, angled at 45° relative to the horizontal and equidistant from the center of the drawing to guarantee homogeneous illumination for the whole acquisition area.
Starting from a first version of the stand, to address problems like the absence of planarity of the camera and the surface to be captured and the system portability, progressive improvements were introduced over time.
Furthermore, the second prototype was built improving the safety of the artwork placed on the acquisition plane to better manage the issue that most part of the drawings to be acquire were enclosed in passe-partouts, often secured with strips of tape that allow the sheet to be flipped and viewed from both sides but not removed making difficult the acquisition of the back of the drawing due to the asymmetrical position with respect to main side of the sheet determined by these stripes. To solve this issue in the new setup the inclined arms that hold the illuminators were not directly fixed to the surface, but to an aluminum structure raised 20 mm. above the horizontal plane instead. The frame, made of 20x20 mm. aluminum profile with a thickness of 1 mm. and welded at the corners, was raised by four spacers to the four vertices. Each of them can be removed, allowing the structure to remain fixed in only three points. This guides the insertion of the drawing folder with great flexibility, positioning the drawing to be acquired directly beneath the camera. Also, a new, shorter column Lupo Repro 3, equipped with a Manfrotto 410 geared head, was adopted to disassemble it into segments no longer than two meters, making it transportable even in a medium-sized vehicle.
Another issue demanding for further solution development was the increasing of the number of the lights to better model reflections behavior. The new stand accommodated light sources inclined at two different angles, 15° and 45° relative to the acquisition surface, with the camera allowing a more accurate normal map and reflection map extraction.
To minimize the presence of erratic reflections and parasite light coming from outdoor various methods have been employed over time to darken the area around the prototypes: initially the acquisition stands required space-demanding darkening systems (Figure 8), while the latest prototype now features a guide atop the lamp-supporting arms, allowing a black curtain to slide and effectively block reflected light around the surface. This new solution has proven to be more practical both in terms of assembly time and light insulation. In Figure 9 the second acquisition prototype is illustrated while Table 2 defines the nature of the components that we used to assemble it (commercial or self-built). In Figure 10, the bill of custom-built components is illustrated.
C. Repro stand for artworks to be captured on a vertical plane - The solution for artworks to be captured vertically, such as paintings, was developed beginning from the Manfrotto 809 Salon 230, 280 cm. height, as main structure of the rig. A new structure made of square aluminum tubes measuring 20x20x1 mm. each mounted along the horizontal arm of the column is connected to the column through ABS nodes, forming a trapezoidal shape that links them to the column via aluminum and steel tension rods, to strengthen the structure (Figure 11). This new structure allows to accommodate inclined light sources at two different angles, 15° and 45° relative to the acquisition surface, with the camera now integrated into the lighting structure and positioned at its center. Due to the larger size of paintings when compared to drawings and the limited frame of each picture taken to get the needed resolution, once they need to be mosaicked together, the acquisition system had to be both vertically and horizontally movable, remaining parallel to the vertical plane of the painting to be acquired. The movement was ensured horizontally by wheels placed below the base and vertically exploiting the rack of the column. To ensure the parallelism of the arm to the painting plane and the control of the distance between the camera lens and the painting plane in different shots, two laser distance meters have been mounted on two brackets, one on the right and one on the left side.
Since the artwork cannot be often removed from the wall, and calibration panels or color checkerboard cannot be superimposed to the painting for safety reasons, in addition to the structure supporting the lights and camera it was necessary to build a separate stand to perform specifically the preliminary calibration procedures.
In Figure 12 the acquisition prototype for vertical surfaces is illustrated while Table 3 defines the nature of the components that we used to assemble it (commercial or self-built).
D. Calibrated roundtable and 3D test-field plate – The developed solution fixes the problems of the adoption of too complex tools requiring specific expertise in their use, also for technical operations such as calibration [43], as the sophisticated solutions presented in [24] (with stepper motors and controllers to drive the movement of the table). We decided to substitute complex rigs, difficult to fabricate for operators, with guidelines for a correct use instead and tools that can be fabricated directly by users, folding simple cardboard as indicated in an open-source free layout (Figure 13).
Furthermore, this simple solution better matches with the use of acquisition devices as smartphone cameras with the purpose of the effortless usage and portability, per the desired level of accuracy, and not the highest precision possible.
A rotating support was built to acquire small objects with a set of Ringed Automatically Detected (RAD) coded targets printed upon the acquisition circular flat surface, as well as on six regularly arranged cubes also textured with RAD targets to help alignment and scaling. These cubes are firmly connected to the rotating table profile by metal rods, radially placed along the circular plate’s thickness and rotating with it. For simpler calibration procedures, a 3D test-field plate hosting 150 RAD coded targets was also prepared, using 12-bit length coordinates, which can be easily plotted using a 600 dpi b/w printer on rigid paper sheet.
In Figure 13 both tools are illustrated.
2.4. Requirements for the acquisitions and calibration procedures
2.4.1. Requirements
Some requirements need to be considered as goals in the acquisition process using the introduced equipment. They can be basically listed as follows:
- Color: color accuracy must be estimated between 0 and 1.5 CIE ΔE00 [44].
- Resolution: the resolution of acquired artwork must be at least equal to 0.1 mm. (which means to acquire digital information at a 0.05 mm. magnitude, according to the Nyquist-Shannon’s sampling theorem [45])
- Time: it must be the less possible without compromising the quality of the acquisition itself
- Costs: the must be low, to improve the economic sustainability of the acquisitions
- Usability: it must be wide, to involve possible users not necessarily specifically prepared.
2.4.2. Calibration and assessment
Requirements are met when following strict procedures to calibrate tools, especially for color and resolution, and assess time, costs, and usability.
Color – The evaluation of color accuracy in image acquisition typically requires a validation effort, since there are many factors that can lead to inaccuracies: objective, subjective, technological, or simply due to carelessness or human approximation [46].
There are various formulas to evaluate visual color difference and the most used one is the CIELAB color difference, ΔE, calculated for each color patch of a reference color checkerboard. The overall color encoding performance is usually obtained by summing the statistical measurements of ΔE for the entire set of color samples contained in the targets. The color metric issued by CIE in 2000 was used, a formula that adopts the concept of measuring the Euclidean distance between the expected color and the measured color in the CIE color space, introducing correction factors to minimize the problem of non-perceptual uniformity of colors. The target-based characterization establishes the color relationship according to a set of color patches with available pre-measured spectral or colorimetric data by ISO17321 [47].
The Calibrite ColorChecker Classic, which has 24 standardized patches with known reflectance proved to be optimal in SHAFT, which evolved together with the hardware equipment. Before every acquisition the software solution can be used almost in real time to assess the quality of color restitution.
The evaluation of color accuracy, based on the color checker target and the rendered color space sRGB, is computed according to the following parameters: mean and maximum color difference relative to the mean ideal chroma in the ΔE00 color metric on the CIEXYZ chromaticity diagram; mean of absolute luminance; exposure error in f-stops measured by pixel levels of patches B4-E4, using gamma values measured rather than the standard value for the color space (i.e. in the case of sRGB 2.2). As reference term for the ΔE00 we used values <1,5. The ΔL00 mean of absolute luminance less than 1 is required; the exposure error in f-stops best results are obtained if it is less than 0.25 f-stops.
Resolution – The common solution to measure the detail preservation and meet the requirements at different spatial frequencies resides in the mentioned Modulation Transfer Function (MTF), a measure of how accurately an imaging device or system can reproduce a scene. The MTF quantifies the degree of attenuation with which the whole system (so also considering the custom frame) reproduces variations in luminous intensity based on its spatial frequency.
To calibrate the resolution, and assess planarity and check for vibrations, we use to take pictures of an ISO 12233:2000 test chart before each new acquisition. Table 4 illustrates the average overall response of the systems (both with horizontal and vertical acquisition planes) to an inclined edge, evaluated in three different Regions of Interest (ROIs) on the chart. The evaluation is based on rise distance (10-90% rise) and measured using MTF50 and MTF10 [48,49] at 1200 mm. from the ISO chart.
In Figure 14 an example of the application of the MTF evaluation workflow.
Camera calibration procedure
The first step in the data processing is the camera geometric calibration, to determine both the interior and the exterior orientation parameters, as well as the additional values. The most common set of additional parameters employed to compensate for systematic errors in digital cameras is the 8-term physical model originally formulated by Brown [50]. The Brown’s model includes the 3D position of the perspective center in image space (principal distance and principal point), as well as the three coefficients for radial and two for decentering distortion. The model can be extended by two further parameters to account for affinity and shear within the sensor system. The iPhone X camera calibration is carried out using the developed 3D test-field. It consisted of taking a set of 20 images using a tripod and a photo studio illumination set. It also included a set of convergent images (some of them rotated by 90°) with good intersection angles of the rays from the camera to the test-field [51,52].
The calibration process is performed twice using different techniques:
- Self-calibration in COLMAP. By default, COLMAP tries to refine the intrinsic camera parameters (except principal point) automatically during the reconstruction. Usually, these parameters should be better estimated than the ones obtained manually with a calibration pattern. This is true only if there are enough images in the dataset and the intrinsic camera parameters between multiple images is shared. Using the OpenCV model camera the following camera calibration parameters are calculated: f focal length; cx, cy principal point coordinates; K1, K2 radial distortion coefficients; P1, P2 tangential distortion coefficients;
- b. RAD coded target based geometric calibration in Agisoft Metashape. Every centre of RAD coded target is reconstructed by 8 rays and more to enhance the accuracy allowing to calculate the Brown’s camera model parameters: fx,fy focal length coordinates; cx, cy principal point coordinates, K1, K2, K3 radial distortion coefficients; P1, P2 = tangential distortion coefficients.
The performances of the photogrammetric pipeline is evaluated by a statistical analysis that considered the following parameters:
- number of oriented images;
- Bundle Adjustment (BA) (re-projection error);
- number of points collected in the dense point cloud;
- comparison of the dense point cloud to the ground truth of the object. The photogrammetric models were compared with the a reference SLR camera models using CloudCompare.
Time - To check time, we can compare time necessary for the acquisition as recorded over the years for the drawings we digitalized and keep it as a reference.
Costs - The technology used to build the prototypes progressively became cheaper and cheaper, i.e., stands accommodate upcoming different cameras and smartphones with few modifications, reducing development costs. The progressive affordability of 3D printers with increasing quality in both materials and mechanics has effectively allowed for good adaptability to specific contexts: if specific solutions are needed, the production costs for variations to the equipment have decreased over time. An example of this is the creation of arms to support the lighting fixtures in the vertical stands, which were made modular and removable with no extra costs when specific geometries, such as the frames of paintings, could intersect with the standard system creating problems.
Usability - The know-how necessary to manage the introduced ecosystem of tools became overtime easier to use and more automatic and friendly. This was assessed offering it to museum operators who started to use it proficiently with reduced training. In fact, following the Kirkpatrick’s Four-level Training Evaluation Model [53], the learners’ reactions to training were positively influenced by the easy setup of the developed tools, which took advantage of previous knowledge by users. We could evaluate what was learned to assess the impact on results: the combination of hardware and software solutions proved to be usable with few efforts also by people not involved in IT technologies and development.
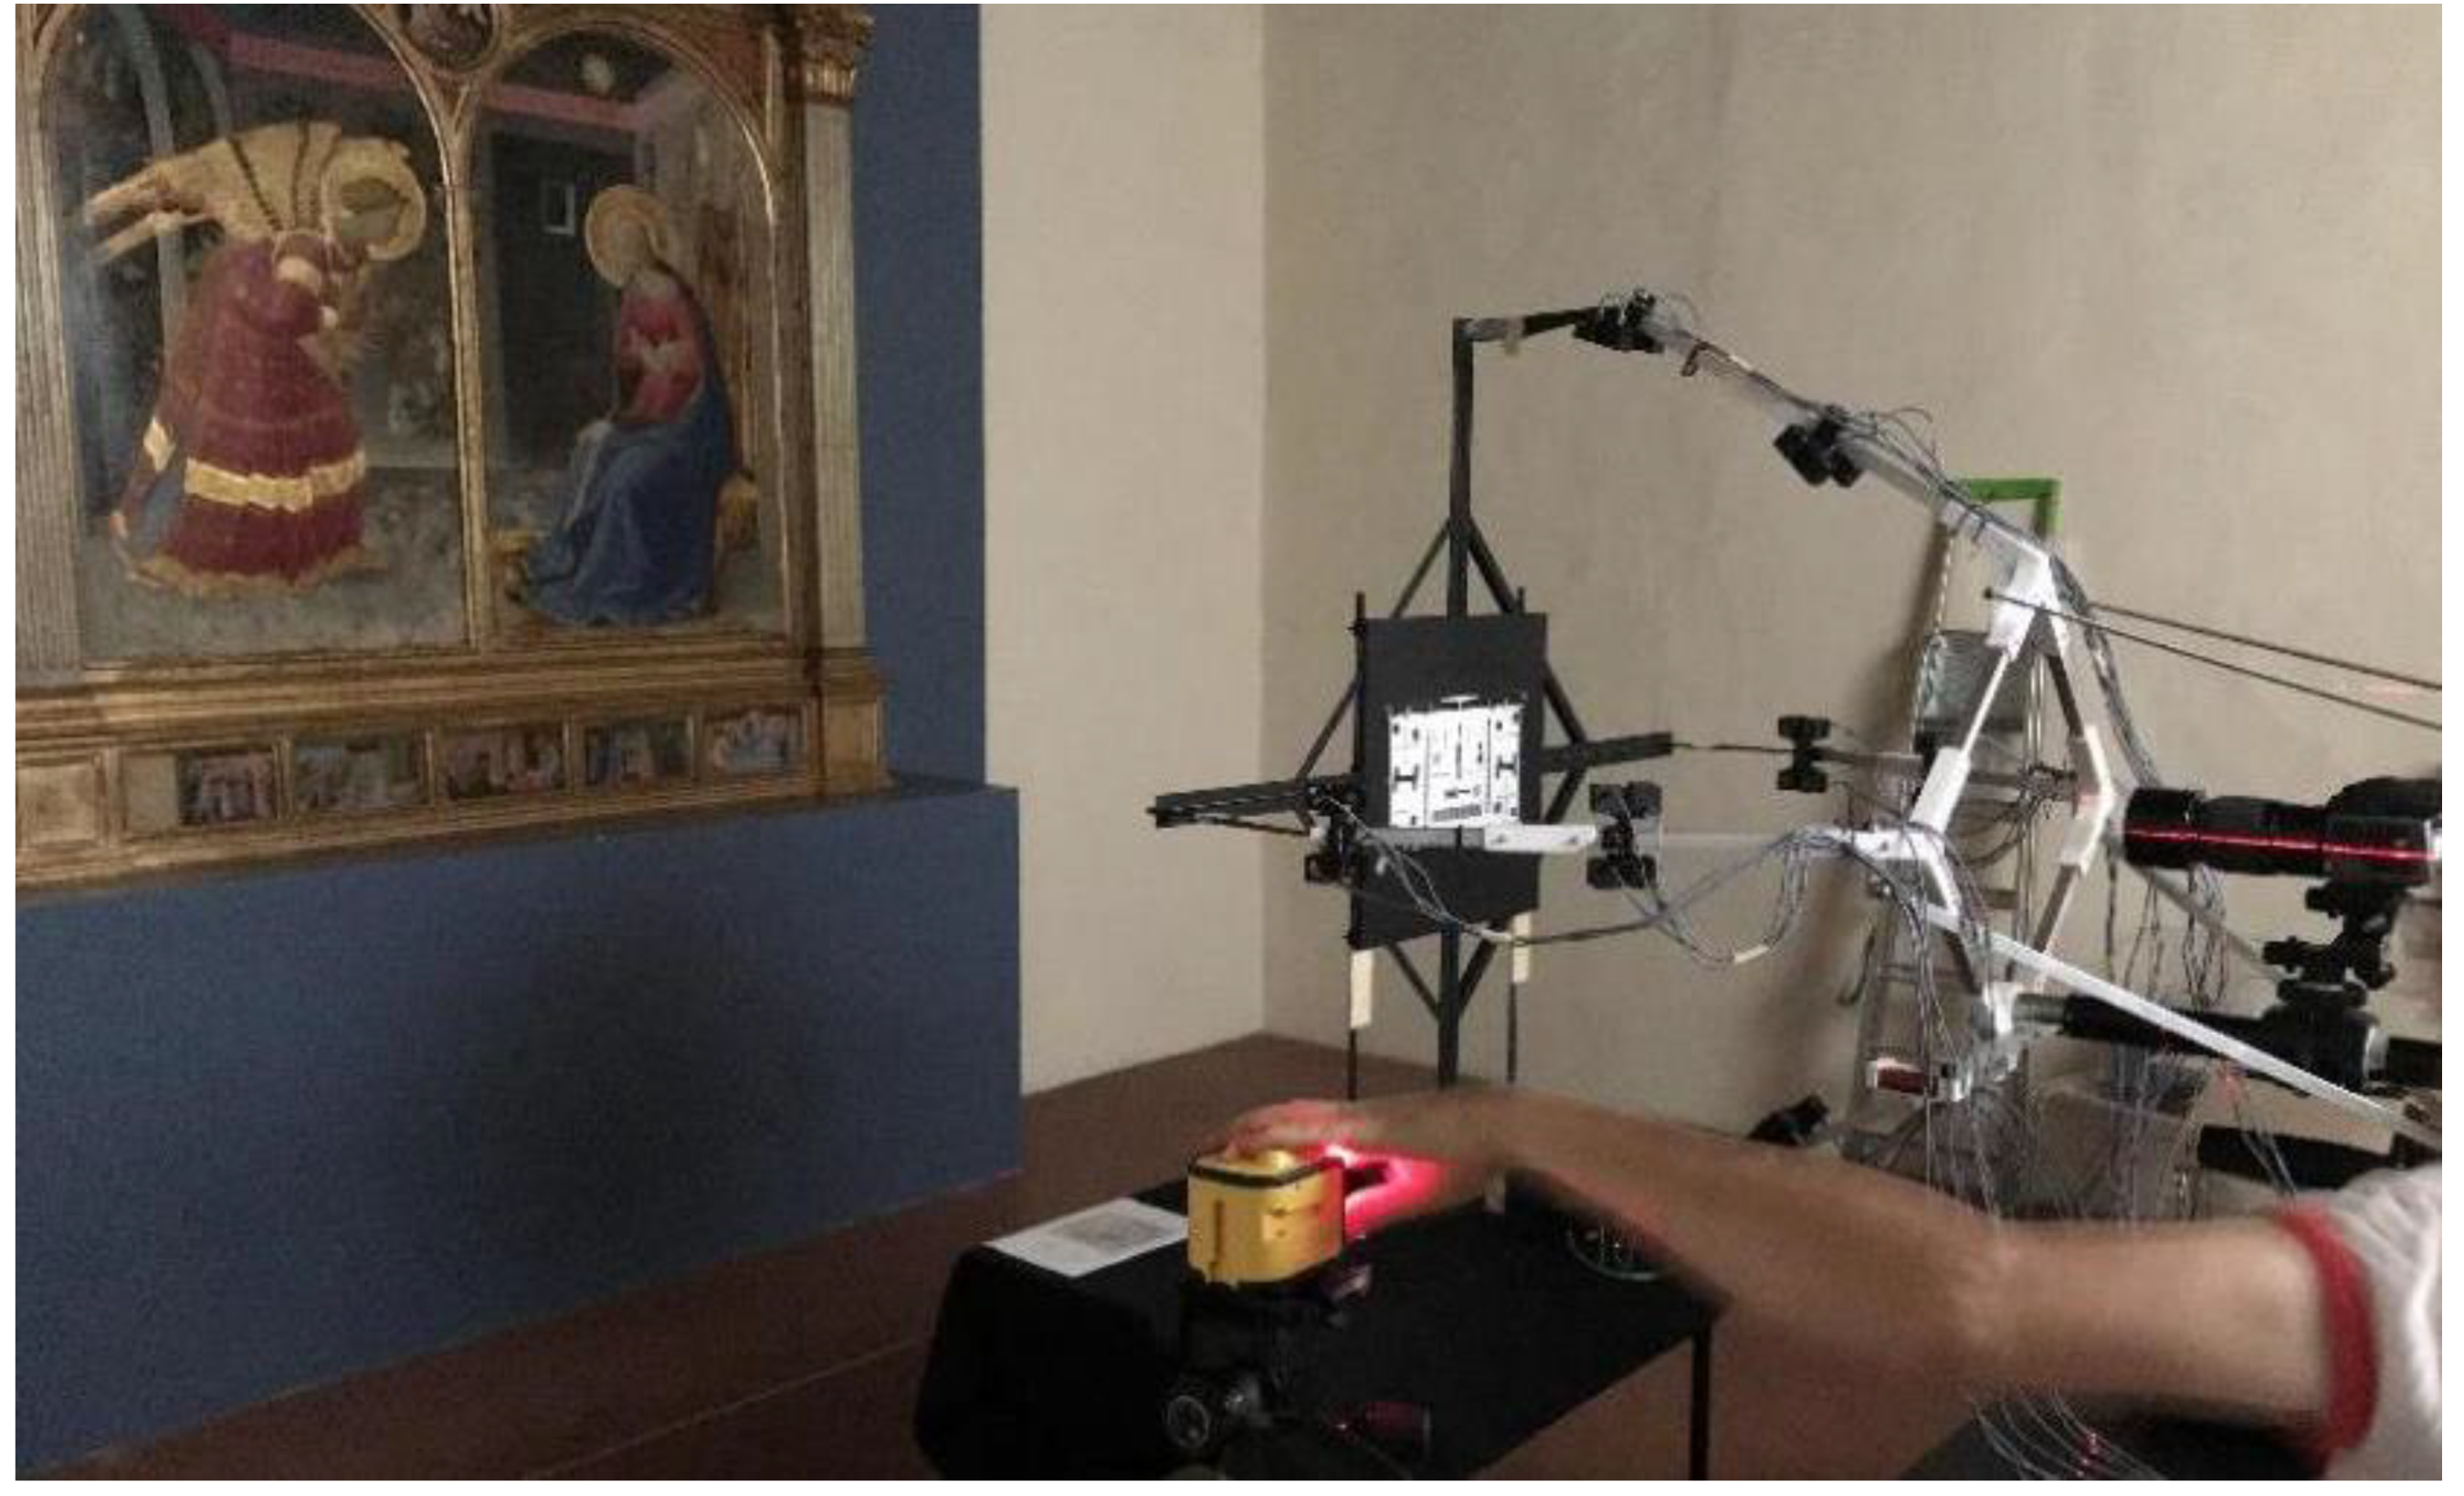
Figure 14.
MTF evaluation during the calibration step: a laser-leveled orientation to check planarity.
Figure 14.
MTF evaluation during the calibration step: a laser-leveled orientation to check planarity.
3. Results
Results produced by the designed and manufactured equipment and showcased in this manuscript fall into these categories:
- Volume of the acquisition area and on-field setup time for the acquisition set.
- Color accuracy of the different captures over time.
- Improvement in the quality of normal maps over time (by enhancing the prototype).
- Dimensional quality achieved using general-purpose devices (i.e., smartphone cameras) on 3D CH objects.
- Outcomes from the developed pipeline in different types of CH objects.
- Public and scientific successes of the outputs.
The equipment was used along projects including works on these case studies:
- Original drawings by Leonardo da Vinci (mostly around at the end of XV century with dimensions roughly like an A4 sheet), hosted and digitized in several locations such as Gallerie dell’Accademia in Venice, Le Gallerie degli Uffizi in Florence, Civico Gabinetto dei Disegni al Castello Sforzesco and Veneranda Biblioteca Ambrosiana, both in Milan.
- Manuscript no. 589 (XIV century, 273x187 mm.) titled Dante Alighieri, Commedia con rubriche volgari brevi e glosse dal Lana per le prime due cantiche, hosted and digitized at the Biblioteca Universitaria di Bologna (BUB).
- The Annunciation by Beato Angelico (c. 1430-32, 2380x2340 mm.) hosted and digitized at the Museum of the Basilica of Santa Maria delle Grazie in San Giovanni Valdarno.
- An embalmed Porcupinefish (Diodon Antennatus, 350x190x250 mm.) and a Globe by astronomer Horn d’Arturo (310x310x460 mm.), both hosted and digitized at the Sistema Museale di Ateneo (SMA) in Bologna.
3.1. Volume of the acquisition area and on-field setup time for the acquisition set
Over time a main goal of the stand design was their occupancy on-field and transportability, and the on-field setup time for the acquisition.
The occupancy of equipment determined a substantial decrement for the room necessary to perform the acquisitions: i.e., for (A) case studies, if in the first tests in 2014 about a 4 x 4 mt. was necessary to host all the equipment, now a smaller area is enough to guarantee a proper acquisition, i.e., about 1.5 x 1.2 x 1.6 mt. (Figure 15).
At the same time, transportability improved: the first prototypes needed a complex logistics in which a van vas usually necessary to move the components in the acquisition locations while the most recent prototype can easily be disassembled and carried with a common car. The reduction of complex operation to perform to setup the acquisition environment granted less time necessary for assembly too. In Table 5 are reported the enhancements in term of usability areas and time requires for assembly.
3.2. Color accuracy
The color accuracy results consist of the measurement of improvements in two different phases:
- Lighting system adoption and design
- On the field
- Relio2 LED lights were adopted as illuminators after the measurement of the color difference between values measured and values expected as ΔE00 mean. Table 6 summarizes the results of tests conducted at the Dept. of Architecture in Bologna by photographing a Calibrite ColorChecker Classic with the same camera (a Canon EOS 5D MkIII equipped with EF 100mm f/2.8 lens) to compare Relio2 lights to previous solutions adopted. The chart was photographed on a leveled stand, in a completely darkened room. Lights were positioned to illuminate in the most homogeneous way the horizontal surface. To determine the best performance in terms of color rendition, three different set of lamps were tested.
- In each acquisition campaign the color difference between values measured and values expected as CIE ΔE00 mean was measured to ensure the faithful color reproduction. Many camera devices were user over the years as part of the prototypes, as listed in Table 7, but we surveyed that using the same rig color accuracy is similar in all the different camera solution.
In Table 8 instead is presented the evolution of the statistical measures of ∆E00 and ∆L (the difference of lightness between values measured and values expected, as introduced in 2.4.2) considering stand prototypes’ improvement in features and building quality. Starting from 2014, when custom prototypes were still non-existent, ∆E00 and ∆L resulted in better and better values, following a linear progression that confirmed the quality of the enhancements introduced in the prototypes, estimated using the same SHAFT version to keep results comparable.
In the (D) case study the color accuracy of a DSLR camera and a smartphone (as shown in Table 9) were evaluated. Both devices were placed on tripods in front of the custom developed rotating roundtable. We compared the iPhone X values with those captured with the Nikon D5200 SLR camera, an excellent reference as it was the main camera on which the SHAFT was developed.
Results showed absolute comparability between the color acquisition obtained with the iPhone X smartphone and the Nikon D5200 camera.
The ΔE00 mean error values of SLR and smartphone camera are very close i.e., the color differences are indistinguishable (Table 10), while the ΔL values are practically identical.
3.3. Improvement in the quality of normal maps over time
With the introduction of a second row of light sources on the inclined arms of the repro stand prototype for the acquisition of horizontal and vertical artworks, nLight outperformed the previous results in the extraction of normal maps, reaching a better definition of shapes and optical properties of materials. In Figure 16 a comparison between a normal map extracted through photometric stereo techniques with 4 light sources (45° angled) and a map generated for the same subject with 4+4 light sources (45° + 15° angled). The reference case study is (C).
3.4. Dimensional quality achieved using general-purpose devices
The pipeline for 3D modeling with a photogrammetry approach was employed in (D) case study. The Porcupinefish featured highly specular skin, and tiny details, while the Globe by astronomer Horn d’Arturo presented a highly reflective regular surface and a considerable Fresnel effect (Figure 17).
The 3D test field device was used for smartphone calibration using RAD coded targets. Every center of RAD target is reconstructed by more than 8 rays to enhance the accuracy allowing to calculate camera model parameters: fx, fy focal length coordinates; cx, cy principal point coordinates, K1, K2, K3 radial distortion coefficients; P1, P2 = tangential distortion coefficients. Table 11 reports the calibration results.
Calibration results on the iPhone smartphone using the tool demonstrated the efficiency of the reconstruction process, achieving the same results on case studies (D) than those obtained using the geometric camera calibration process. In Table 12 results of camera calibrated vs. uncalibrated comparison for the iPhone X camera.
The accuracy evaluation of the 3D shape results was done using, as ground truth, the mentioned Nikon D5200 camera. In both models (reference and data comparison), the average Ground Sample Distance (GSD) of the images was approximately 1 mm. Table 13 provides a summary of the obtained results.
3.5. Visual outcomes from the developed pipeline in different types of CH objects
The case study (B) required the adoption of the introduced pipeline aimed at 3D modeling with photometric stereo, with the goal to replicate complex materials as parchment, different inks, and gold-foil on manuscript’s pages, as the result of the separation of specular, reflective, and diffuse behaviors of light affecting the parchment pages upon which miniated gold foil figures and inks were reproduced.
The camera we used is characterized in Table 14.
In Figure 18 are presented the results of the reproduction, compared to a traditional 2D picture, as replicated following the introduced pipelines and using the presented tools.
For the (C) case study, a painting surrounded by wooden frames, the photogrammetry and photometric stereo techniques were combined.
In Figure 19 is presented the acquisition plan to replicate the painting’s portions with the repro stand prototype for vertical acquisitions. A target resolution of 25 µm was planned, corresponding to a camera-to-painting’s-surface distance of 1120 mm. allowing a nominal resolution of 1182 ppi.
The area covered for each picture resulted in 500x375 mm. with a 20% useful overlapping area. The custom-built stand was moved accordingly to the plan along horizontal and vertical directions, while planar alignment during movements was granted by the estimation of rig/painting distance through stand-fixed laser distance meters.
In Table 15 cameras we used both for frame and painted surfaces are listed.
3.6. Public and scientific successes of the outputs
The equipment produced underwent rigorous testing during prominent exhibitions such as “Perfecto e Virtuale. L’Uomo Vitruviano di Leonardo” [54] in 2014 or “Leonardo in Vinci, at the origin of the genius”, open at Museo Leonardiano in Vinci in 2019 and visited by more than 140.000 people, or in the same year “Leonardo, drawing anatomy”, at Museum of Palazzo Poggi in Bologna (Italy), with more than 12.000 people attending and more than 100.000 when the same event lately moved to Vinci, rebranded as “Leonardo, drawing anatomy [Reloaded]” [55]. Another exhibition, “The Leonardo’s anatomic drawing at the time of Salvator Mundi” is open in Vinci (June 24th - September 23rd, 2023), hosting three more drawings by the genius we replicated with presented framework of tools [56].
A detailed description of this case study is in [37], while a result of the visual accuracy and detail reached in replicating materials is reported in Figure 20.
The results on the Annunciation were part of the exhibit “Masaccio e Angelico. Dialogo sulla verità nella pittura”, opened at the Museum of the Basilica of Santa Maria delle Grazie in San Giovanni Valdarno, from September 17, 2022, to February 5, 2023 [57]. 3D model, presented on a 4k touch screen and integrated by interactive captions in a guided tour, was actively part of the exhibit and it is now permanent installation at the museum. Also, the exhibit “Dall’Alma Mater al Mondo. Dante at the University of Bologna”, held in 2021 at the Biblioteca Universitaria di Bologna (BUB), hosted three replicas of pages belonging to the manuscript case study introduced in the Results section. All these exhibitions attracted a substantial number of visitors, with their feedback highlighting the replicas’ success in conveying the intricate details behind these artifacts.
The results of the application for methods and tools were also presented, after invitation, during many important events in well renowned museum institutions, such as two editions of the 2and3D Photography Conference organized by The Rijksmuseum in Amsterdam (2019 and 2021), and the two-day international academic Leonardo da Vinci’s Papers: Invention and Reconstruction, at the British Library in London, in May 2023.
4. Conclusions
This paper has presented the application of various custom-made tools aimed at addressing the challenges in the production of digital replicas of works of art, based both on photogrammetry and photometric stereo. The development team could rely on important technological partners, such as Hasselblad, FOWA and Relio, who encouraged the application of novel approaches, pushing the research beyond the established and adopted methods. However, it is important to acknowledge that the approaches proposed herein are not definitive solutions, but they rather represent possible paths to explore in the forthcoming years. The rapidly evolving landscape of technology, particularly with the advent of artificial intelligence (AI), brings forth new opportunities and complexities in the digitally based domain. It is evident that future developments in this field will heavily rely on embracing AI advancements, since it has the potential to revolutionize the way we approach and tackle the challenges in the digitalization of artworks. The road ahead requires a proactive approach, involving interdisciplinary efforts and the integration of multiple methodologies into the development of new tools and techniques. By recognizing the transformative impact of custom tools and embracing their potential, we can navigate the ever-changing digital landscape with adaptability and effectiveness. The journey in this field is both exciting and challenging, and it is our collective responsibility to stay at the vanguard of progress and contribute to shaping the future of the CH preservation.
Author Contributions
Conceptualization, S.G. and M.G.; methodology, S.G. and M.G.; equipment, G.B. and M.B.; investigation, G.B., M.B. M.G. and S.G.; data curation, S.G. and M.B.; writing—original draft preparation, S.G. and G.B.; writing—review and editing, S.G and M.G.; supervision, M.G. All authors have read and agreed to the published version of the manuscript.
Funding
This research received no external funding.
Data Availability Statement
Not applicable.
Acknowledgments
The authors would like to thank Fabrizio Ivan Apollonio, Andrea Ballabeni and Filippo Fantini for being pro-active parts during the development of the research. Authors also thank Alfredo Liverani for the support in the mechanical design of prototypes and their structural assessment, Davide Giaffreda and Davide Prati for the logistics and building support for physical devices.
Conflicts of Interest
The authors declare no conflict of interest.
References
- Palladio, A. The Four Books of Architecture; Domenico de’ Franceschi: Venice, 1570. [Google Scholar]
- Addison A., C.; Gaiani, M. Virtualized architectural heritage: new tools and techniques. IEEE MultiMedia 2000, 7, 26–31. [Google Scholar] [CrossRef]
- Bandiera, A.; Beraldin, J.A.; Gaiani, M. Nascita ed utilizzo delle tecniche digitali di 3D imaging, modellazione e visualizzazione per l’architettura e i beni culturali. Ikhnos 2011, 81–170. [Google Scholar]
- Phase One. Available online: https://www.phaseone.com/ (accessed on 25 July 2023).
- Nocerino, E.; Stathopoulou, E.K.; Rigon, S.; Remondino, F. Surface Reconstruction Assessment in Photogrammetric Applications. Sensors 2020, 20, 5863. [Google Scholar] [CrossRef] [PubMed]
- Matrone, F.; Grilli, E.; Martini, M.; Paolanti, M.; Pierdicca, R.; Remondino, F. Comparing Machine and Deep Learning Methods for Large 3D Heritage Semantic Segmentation. ISPRS Int. J. Geo-Inf. 2020, 9, 535. [Google Scholar] [CrossRef]
- Toschi, I.; Capra, A.; De Luca, L.; Beraldin, J.-A.; Cournoyer, L. On the evaluation of photogrammetric methods for dense 3D surface reconstruction in a metrological context. ISPRS Annals of the Photogrammetry, Remote Sensing and Spatial Information Sciences 2014, 2-5, 371–378. [Google Scholar] [CrossRef]
- Remondino, F.; Spera, M.G.; Nocerino, E.; Menna, F.; Nex, F.; Gonizzi-Barsanti, S. Dense image matching: comparisons and analyses. In Proceedings of the IEEE Conference Digital Heritage 2013, Marseille, France, 1 November 2013; Vol. 1, pp. 47–54. [Google Scholar]
- Farella, E.M.; Morelli, L.; Grilli, E.; Rigon, S.; Remondino, F. Handling critical aspects in massive photogrammetric digitization of museum assets. Int. Arch. Photogramm. Remote Sens. Spatial Inf. Sci. 2022, XLVI-2/W1-2022, 215–222. [Google Scholar] [CrossRef]
- Porter, S.; Roussel, M.; Soressi, M. A Simple Photogrammetry Rig for the Reliable Creation of 3D Artifact Models in the Field: Lithic Examples from the Early Upper Paleolithic Sequence of Les Cottés (France). Advances in Archaeological Practice 2016, 1, 71–86. [Google Scholar] [CrossRef]
- Sun, T.; Xu, Z.; Zhang, X.; Fanello, S.; Rhemann, C.; Debevec, P.; Tsai, Y.T.; Barron, J.T.; Ramamoorthi, R. Light stage super-resolution: continuous high-frequency relighting. ACM Trans. Graph. 2020, 39, 1–12. [Google Scholar] [CrossRef]
- Santos, P.; Ritz, M.; Tausch, R.; Schmedt, H.; Monroy, R.; De Stefano, A.; Posniak, O.; Fuhrmann, C.; Fellner, D. W. CultLab3D: on the verge of 3D mass digitization. In Proceedings of the Eurographics Workshop on Graphics and Cultural Heritage (GCH '14), Eurographics Association, Goslar, DEU, 6-8 October 2014; pp. 65–73. [Google Scholar]
- Menna, F.; Nocerino, E.; Morabito, D.; Farella, E.M.; Perini, M.; Remondino, F. An open source low-cost automatic system for image-based 3D digitization. Int. Arch. Photogramm. Remote Sens. Spat. Inf. Sci. 2017, XLII-2/W8, 155–162. [Google Scholar] [CrossRef]
- Gattet, E.; Devogelaere, J.; Raffin, R.; Bergerot, L.; Daniel, M.; Jockey, P.; De Luca, L. A versatile and low-cost 3D acquisition and processing pipeline for collecting mass of archaeological findings on the field. Int. Arch. Photogramm. Remote Sens. Spatial Inf. Sci. 2015, XL-5/W4, 299–305. [Google Scholar] [CrossRef]
- DXO. Available online: https://www.dxo.com/ (accessed on 25 July 2023).
- DXO mark. Available online: https://www.dxomark.com/disruptive-technologies-mobile-imaging-taking-smartphone-cameras-next-level (accessed on 25 July 2023).
- DXO mark. Available online: https://www.dxomark.com/multi-camera-smartphones-benefits-and-challenges/ (accessed on 25 July 2023).
- Gaiani, M.; Apollonio, F.I.; Ballabeni, A. Cultural and architectural heritage conservation and restoration: which colour? Coloration Technol. 2021, 137, 44–55. [Google Scholar] [CrossRef]
- Han, W.; Shin, J.; Ho Shin, J. Low-cost, open-source contact angle analyzer using a mobile phone, commercial tripods and 3D printed parts. HardwareX 2022, 12, 1175–1185. [Google Scholar] [CrossRef] [PubMed]
- Sylwan, S.; MacDonald, D.; Walter, J. Stereoscopic CG camera rigs and associated metadata for cinematic production. In Proceedings of the SPIE 7237, Stereoscopic Displays and Applications XX, 72370C, San Jose, California, USA, 14 February 2009. [Google Scholar]
- Lee, S. H.; Lee, S. J. Development of remote automatic panorama VR imaging rig systems using smartphones. Cluster Comput. 2018, 21, 1175–1185. [Google Scholar] [CrossRef]
- The working group at the Dept. of Architecture of the University of Bologna is composed by: Fabrizio I. Apollonio, Andrea Ballabeni, Giovanni Bacci, Filippo Fantini, Riccardo Foschi, Marco Gaiani, and Simone Garagnani.
- Apollonio, F.I.; Gaiani, M.; Garagnani, S. Visualization and Fruition of Cultural Heritage in the Knowledge-Intensive Society: New Paradigms of Interaction with Digital Replicas of Museum Objects, Drawings, and Manuscripts. In Handbook of Research on Implementing Digital Reality and Interactive Technologies to Achieve Society 5.0; Ugliotti, F.M., Osello, A., Eds.; IGI Global: Hershey, PA, 2022; pp. 471–495. [Google Scholar]
- Apollonio, F.I.; Fantini, F.; Garagnani, S.; Gaiani, M. A Photogrammetry-Based Workflow for the Accurate 3D Construction and Visualization of Museums Assets. Remote Sens. 2021, 13, 486. [Google Scholar] [CrossRef]
- Apollonio, F.I.; Foschi, R.; Gaiani, M.; Garagnani, S. How to Analyze, Preserve, and Communicate Leonardo’s Drawing? A Solution to Visualize in RTR Fine Art Graphics Established from “the Best Sense”. ACM Journal On Computing And Cultural Heritage 2021, 14(36), 1–30. [Google Scholar] [CrossRef]
- Ackermann, J.; Goesele, M. A Survey of Photometric Stereo Techniques. Foundations and Trends® in Computer Graphics and Vision 2015, 9, 149–254. [Google Scholar] [CrossRef]
- Horn, B. K. P. Obtaining shape from shading information. In The Psychology of Computer Vision; Winston, P. H., Ed.; McGraw-Hill: New York, USA, 1975; pp. 115–155. [Google Scholar]
- Horn, B. K. P.; Sjoberg, R.W. Calculating the reflectance map. Appl. Opt. 1979, 18, 1770–1779. [Google Scholar] [CrossRef]
- Ikeuchi, K.; Horn, B.K.P. An application of the photometric stereo method. In Proceedings of the 6th International Joint Conference on Artificial Intelligence, Tokyo, Japan, 20 August 1979. [Google Scholar]
- Silver, W.M. Determining shape and reflectance using multiple images; Doctoral Thesis. Massachusetts Institute of Technology: Cambridge, Massachusetts, 1980. [Google Scholar]
- Woodham, R.J. Photometric method for determining surface orientation from multiple images. Optical Engineerings 1980, 19, 139–144. [Google Scholar] [CrossRef]
- Mildenhall, B.; Srinivasan, P.P.; Tancik, M.; Barron, J.T.; Ramamoorthi, R.; Ng, R. Nerf: Representing scenes as neural radiance fields for view synthesis. Commun. ACM 2021, 65, 99–106. [Google Scholar] [CrossRef]
- Martin-Brualla, R.; Radwan, N.; Sajjadi, M.S.; Barron, J.T.; Dosovitskiy, A.; Duckworth, D. Nerf in the wild: Neural radiance fields for unconstrained photo collections. In Proceedings of the IEEE/CVF Conference on Computer Vision and Pattern Recognition, Nashville, TN, USA, 20–25 June 2021; pp. 7210–7219. [Google Scholar]
- Müller, T.; Evans, A.; Schied, C.; Keller, A. Instant neural graphics primitives with a multiresolution hash encoding. ACM Trans. Graph. ToG 2022, 41, 1–15. [Google Scholar] [CrossRef]
- Remondino, F.; Karami, A.; Yan, Z.; Mazzacca, G.; Rigon, S.; Qin, R. A Critical Analysis of NeRF-Based 3D Reconstruction. Remote Sens. 2023, 15, 3585. [Google Scholar] [CrossRef]
- Gaiani, M.; Ballabeni, A. SHAFT (SAT & HUE Adaptive Fine Tuning), a new automated solution for target-based color correction. Color Colorimetry Multidiscip. Contrib. 2018, 14, 69–80. [Google Scholar]
- Fantini, F.; Gaiani, M.; Garagnani, S. Knowledge and documentation of renaissance works of art: the replica of the “Annunciation” by Beato Angelico. Int. Arch. Photogramm. Remote Sens. Spatial Inf. Sci. 2023, XLVIII-M-2-2023, 527–534. [Google Scholar] [CrossRef]
- Hong, G.; Ronnier, M.L.; Rhodes, P.A. A Study of Digital Camera Colorimetric Characterization Based on Polynomial Modeling. Color Research and Application 2001, 26, 76–84. [Google Scholar] [CrossRef]
- Jiang, J.; Liu, D.; Gu, J.; Süsstrunk, S. What is the space of spectral sensitivity functions for digital color cameras? In Proceedings of the 2013 IEEE Workshop on Applications of Computer Vision (WACV), Los Alamitos, CA, 15-17 January 2013. [Google Scholar]
- Lyon, R.F. A Brief History of “Pixel”. In Proceedings of the SPIE Electronic Imaging 2006 - Digital Photography II, San Jose, California, USA, 15-19 January 2006. [Google Scholar]
- Operation Night Watch. Available online: https://www.rijksmuseum.nl/en/whats-on/exhibitions/operation-night-watch (accessed on 25 July 2023).
- Relio2 Available online:. Available online: https://www.relio.it/ (accessed on 25 July 2023).
- Beraldin, J.A.; Gaiani, M. Evaluating the performance of close-range 3D active vision systems for industrial design applications. In Proceedings of the SPIE Electronic Imaging 2005 - Videometrics VIII, San Jose, California, USA, 17 January 2005. [Google Scholar]
- ISO (2014) ISO/CIE 11664–6:2014 Colorimetry–Part 6: CIEDE2000 Colour-Difference Formula. International Organization for Standardization, Geneva, Switzerland.
- The Nyquist-Shannon sampling theorem is a fundamental concept in digital signal processing that establishes a crucial relationship between a signal's frequency range and the required sample rate to prevent aliasing, a form of distortion. According to this theorem, the sample rate must be at least twice the signal's bandwidth to effectively avoid aliasing distortion.
- Beretta, G.; Gaiani, M.; Rizzi, A. La riproduzione digitale del colore: una storia da quattro bit . Kritike, 2021, 2, 263–304. [Google Scholar]
- Standardization, I.O.F. Graphic Technology and Photography - Colour Characterisation of Digital Still Cameras (DSCs). ISO 17321-1: November 2012, International Organization for Standardization, Geneva, Switzerland. 20 November.
- Williams, D.R. Benchmarking of the ISO 12233 Slanted-edge Spatial Frequency Response (SFR) Plug-in. In Proceedings of the IS&T/PICS Image Processing, Image Quality, Image Capture, Systems Conference (PICS-98), Portland, Oregon, USA, May 1998; pp. 133–136. [Google Scholar]
- Burns, P.D. Slanted Edge MTF for Digital Camera and Scanner Analysis. In Proceedings of the IS&T/PICS Image Processing, Image Quality, Image Capture, Systems Conference (PICS-00), Portland, Oregon, USA, March 2000; pp. 135–138. [Google Scholar]
- Brown, D. C. Close-range camera calibration. Photogrammetric Engineering, 1971, 37, 855–866. [Google Scholar]
- Fryer, J.G. Camera calibration. In Close Range Photogrammetry and Machine Vision; Atkinson, K.B., Ed.; Chapter 6, Whittles Publishing, 2001; pp. 156–179. [Google Scholar]
- Remondino, F.; Fraser, C. S. Digital camera calibration methods: considerations and comparisons. ISPRS-Int. Arch. Photogramm. Remote Sens. Spat. Inf. Sci. 2006, 36, 266–272. [Google Scholar]
- Kirkpatrick, J.D.; Kirkpatrick, W.K. Kirkpatrick's Four Levels of Training Evaluation; Association for Talent Development: Alexandria, VA, 2016. [Google Scholar]
- Apollonio, F.I.; Clini, P.; Gaiani, M.; Perissa Torrini, A. The third dimension of Leonardo's Vitruvian Man. Disegnare Idee Immagini, 2015, 50, 48–59. [Google Scholar]
- Marani, P.C.; Barsanti, R.; Apollonio, F.I.; Gaiani, M. Leonardo, anatomia dei disegni [Reloaded]; Bologna University Press: Bologna, Italy, 2023; p. 112. [Google Scholar]
- Marani, P.C.; Barsanti, R.; Gaiani, M. Il Disegno Anatomico di Leonardo al tempo del Salvator Mundi; Bologna University Press: Bologna, Italy, 2023; p. 136. [Google Scholar]
- Strehlke, C.B. (Ed.) Masaccio e Angelico: dialogo sulla verità nella pittura; Magonza: Arezzo, Italy, 2022; p. 172. [Google Scholar]
Figure 2.
Comparison charts for 2D and 3D pipelines with the novel introduction of software applications that require specific hardware equipment to be used efficiently.
Figure 2.
Comparison charts for 2D and 3D pipelines with the novel introduction of software applications that require specific hardware equipment to be used efficiently.
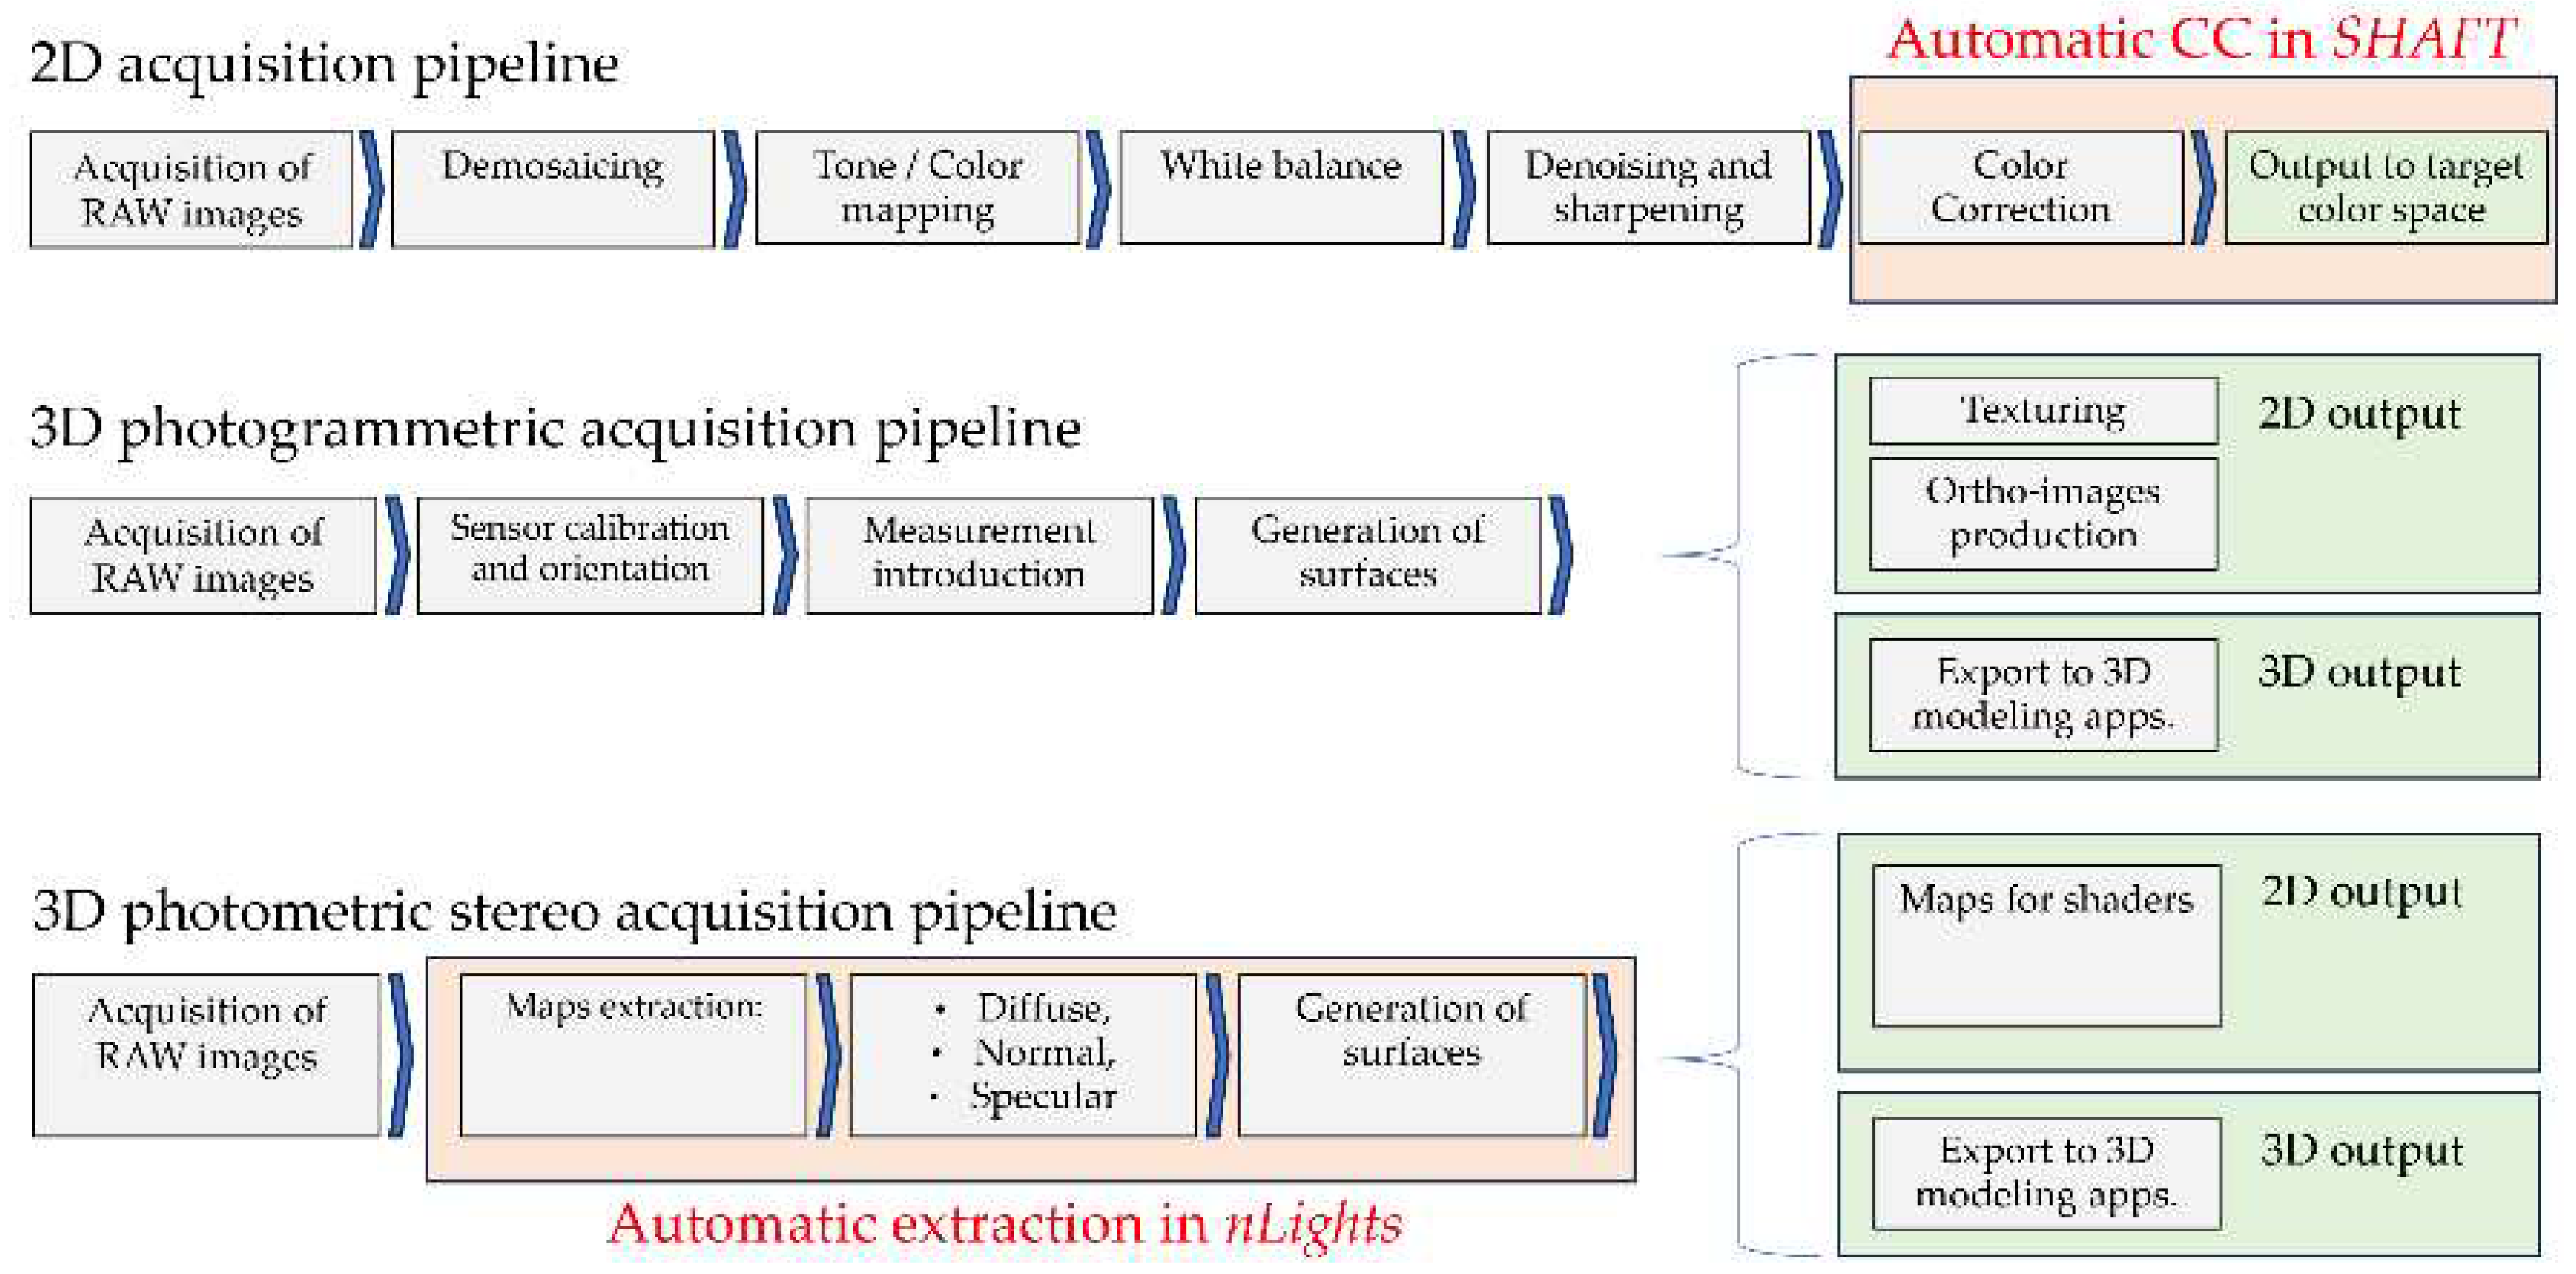
Figure 6.
The first prototype for horizontal acquisitions.
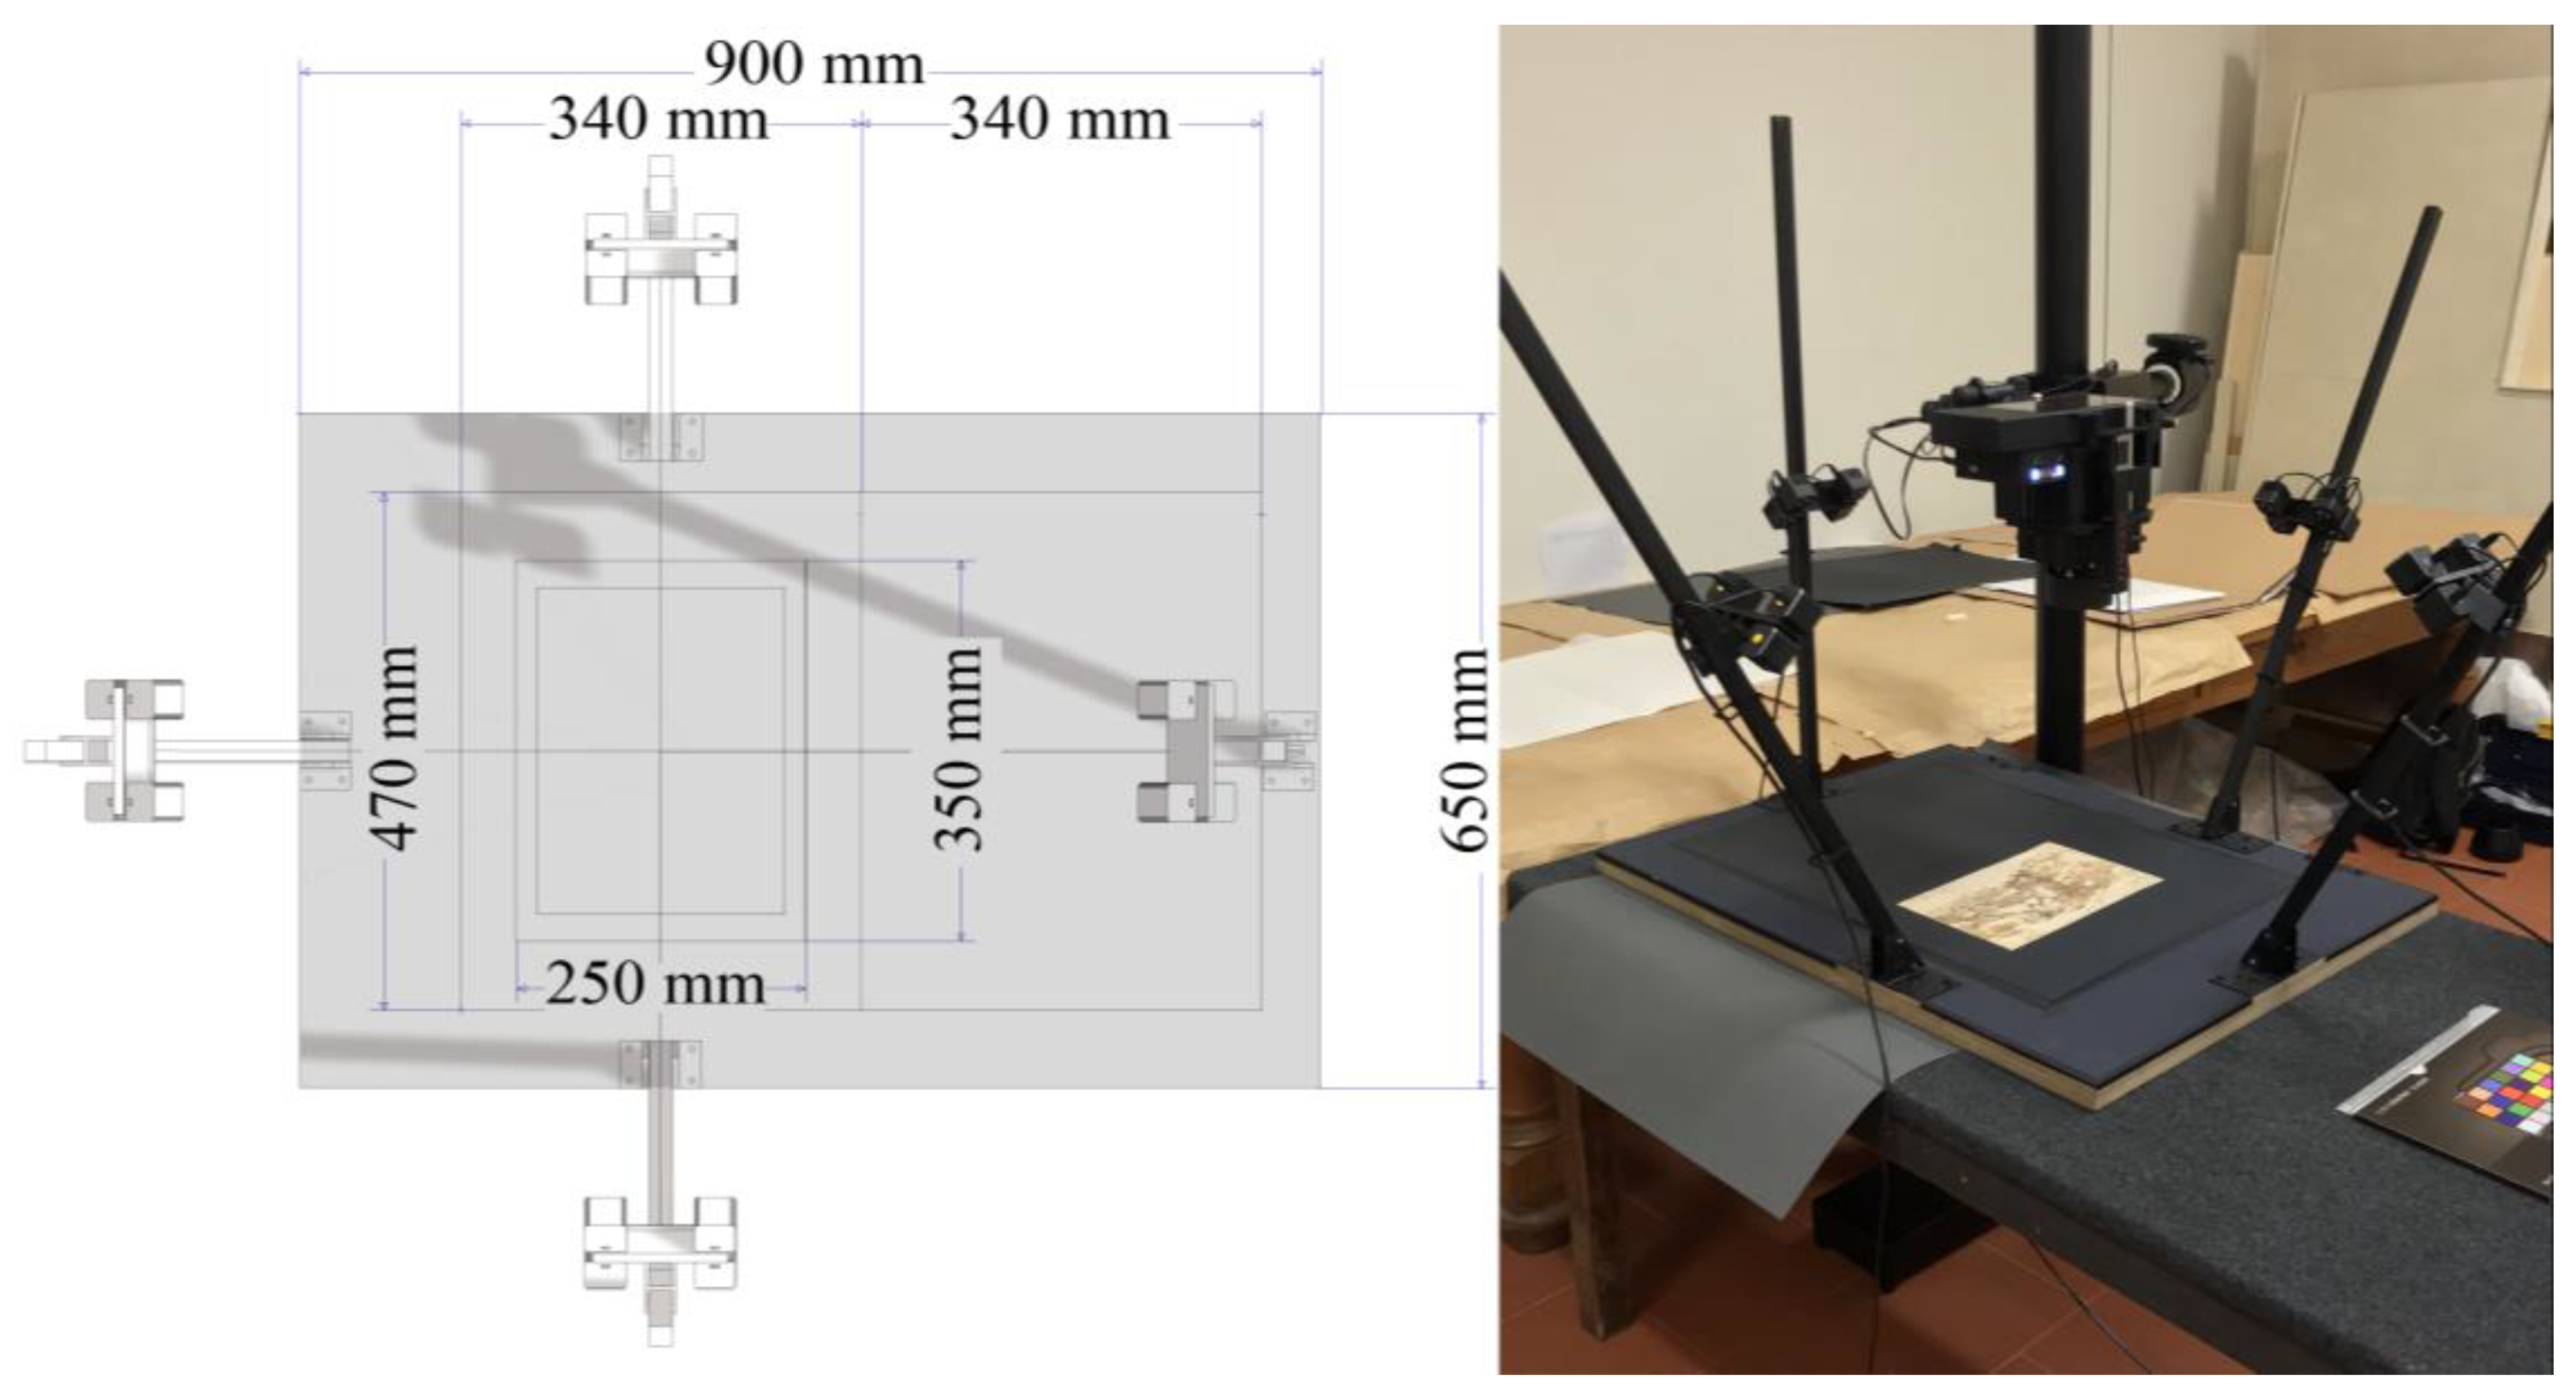
Figure 7.
The first prototype: the bill of the custom-built parts (annotations in mm., left) and the alignment gauge (right).
Figure 7.
The first prototype: the bill of the custom-built parts (annotations in mm., left) and the alignment gauge (right).
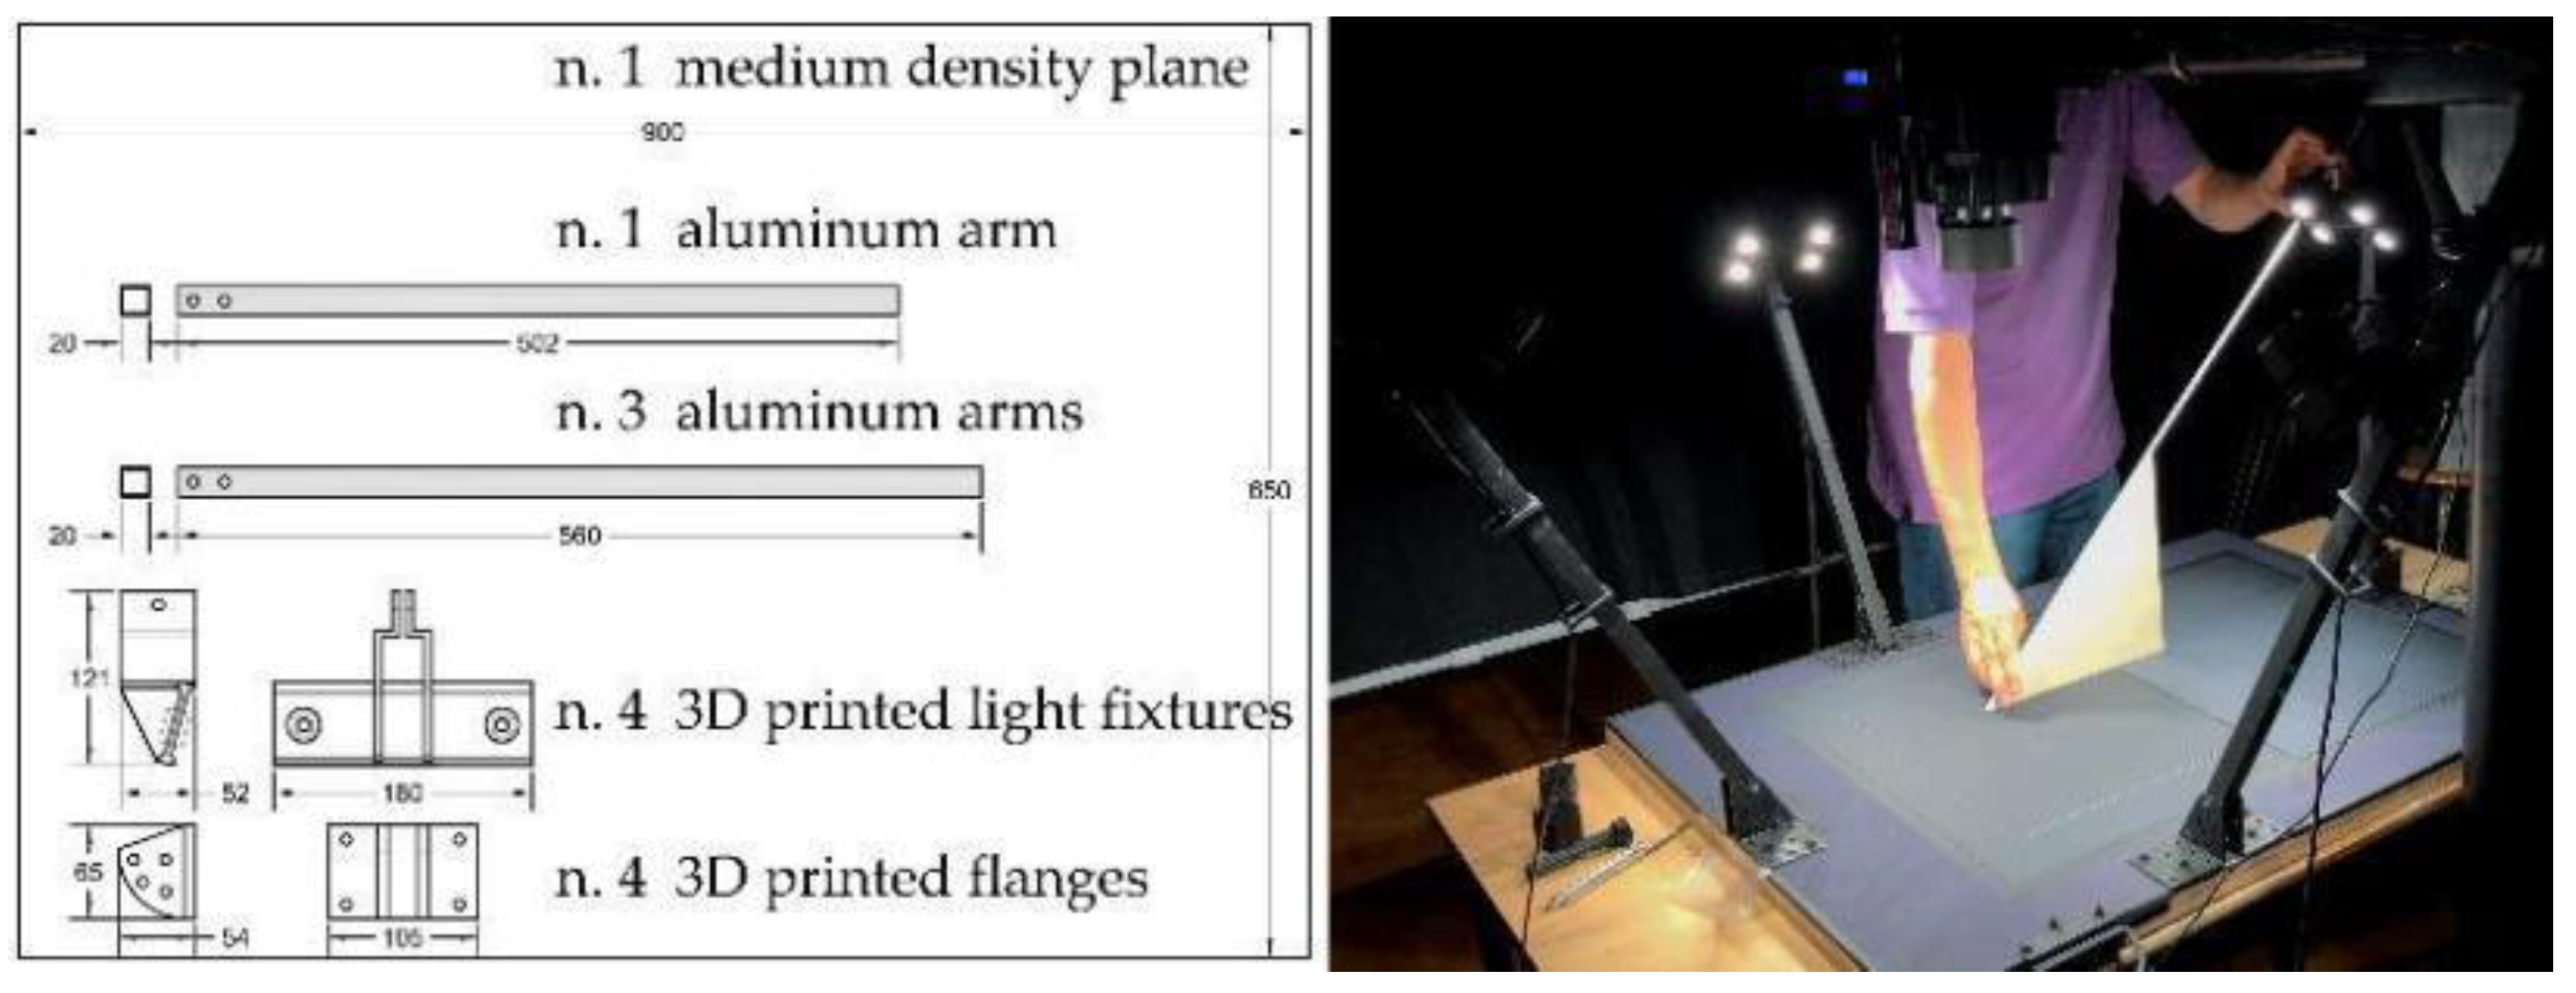
Figure 8.
The darkening system to minimize erratic reflections and parasite light as it progressed over the years: the latest version guarantees better covering and it can be easily assembled.
Figure 8.
The darkening system to minimize erratic reflections and parasite light as it progressed over the years: the latest version guarantees better covering and it can be easily assembled.
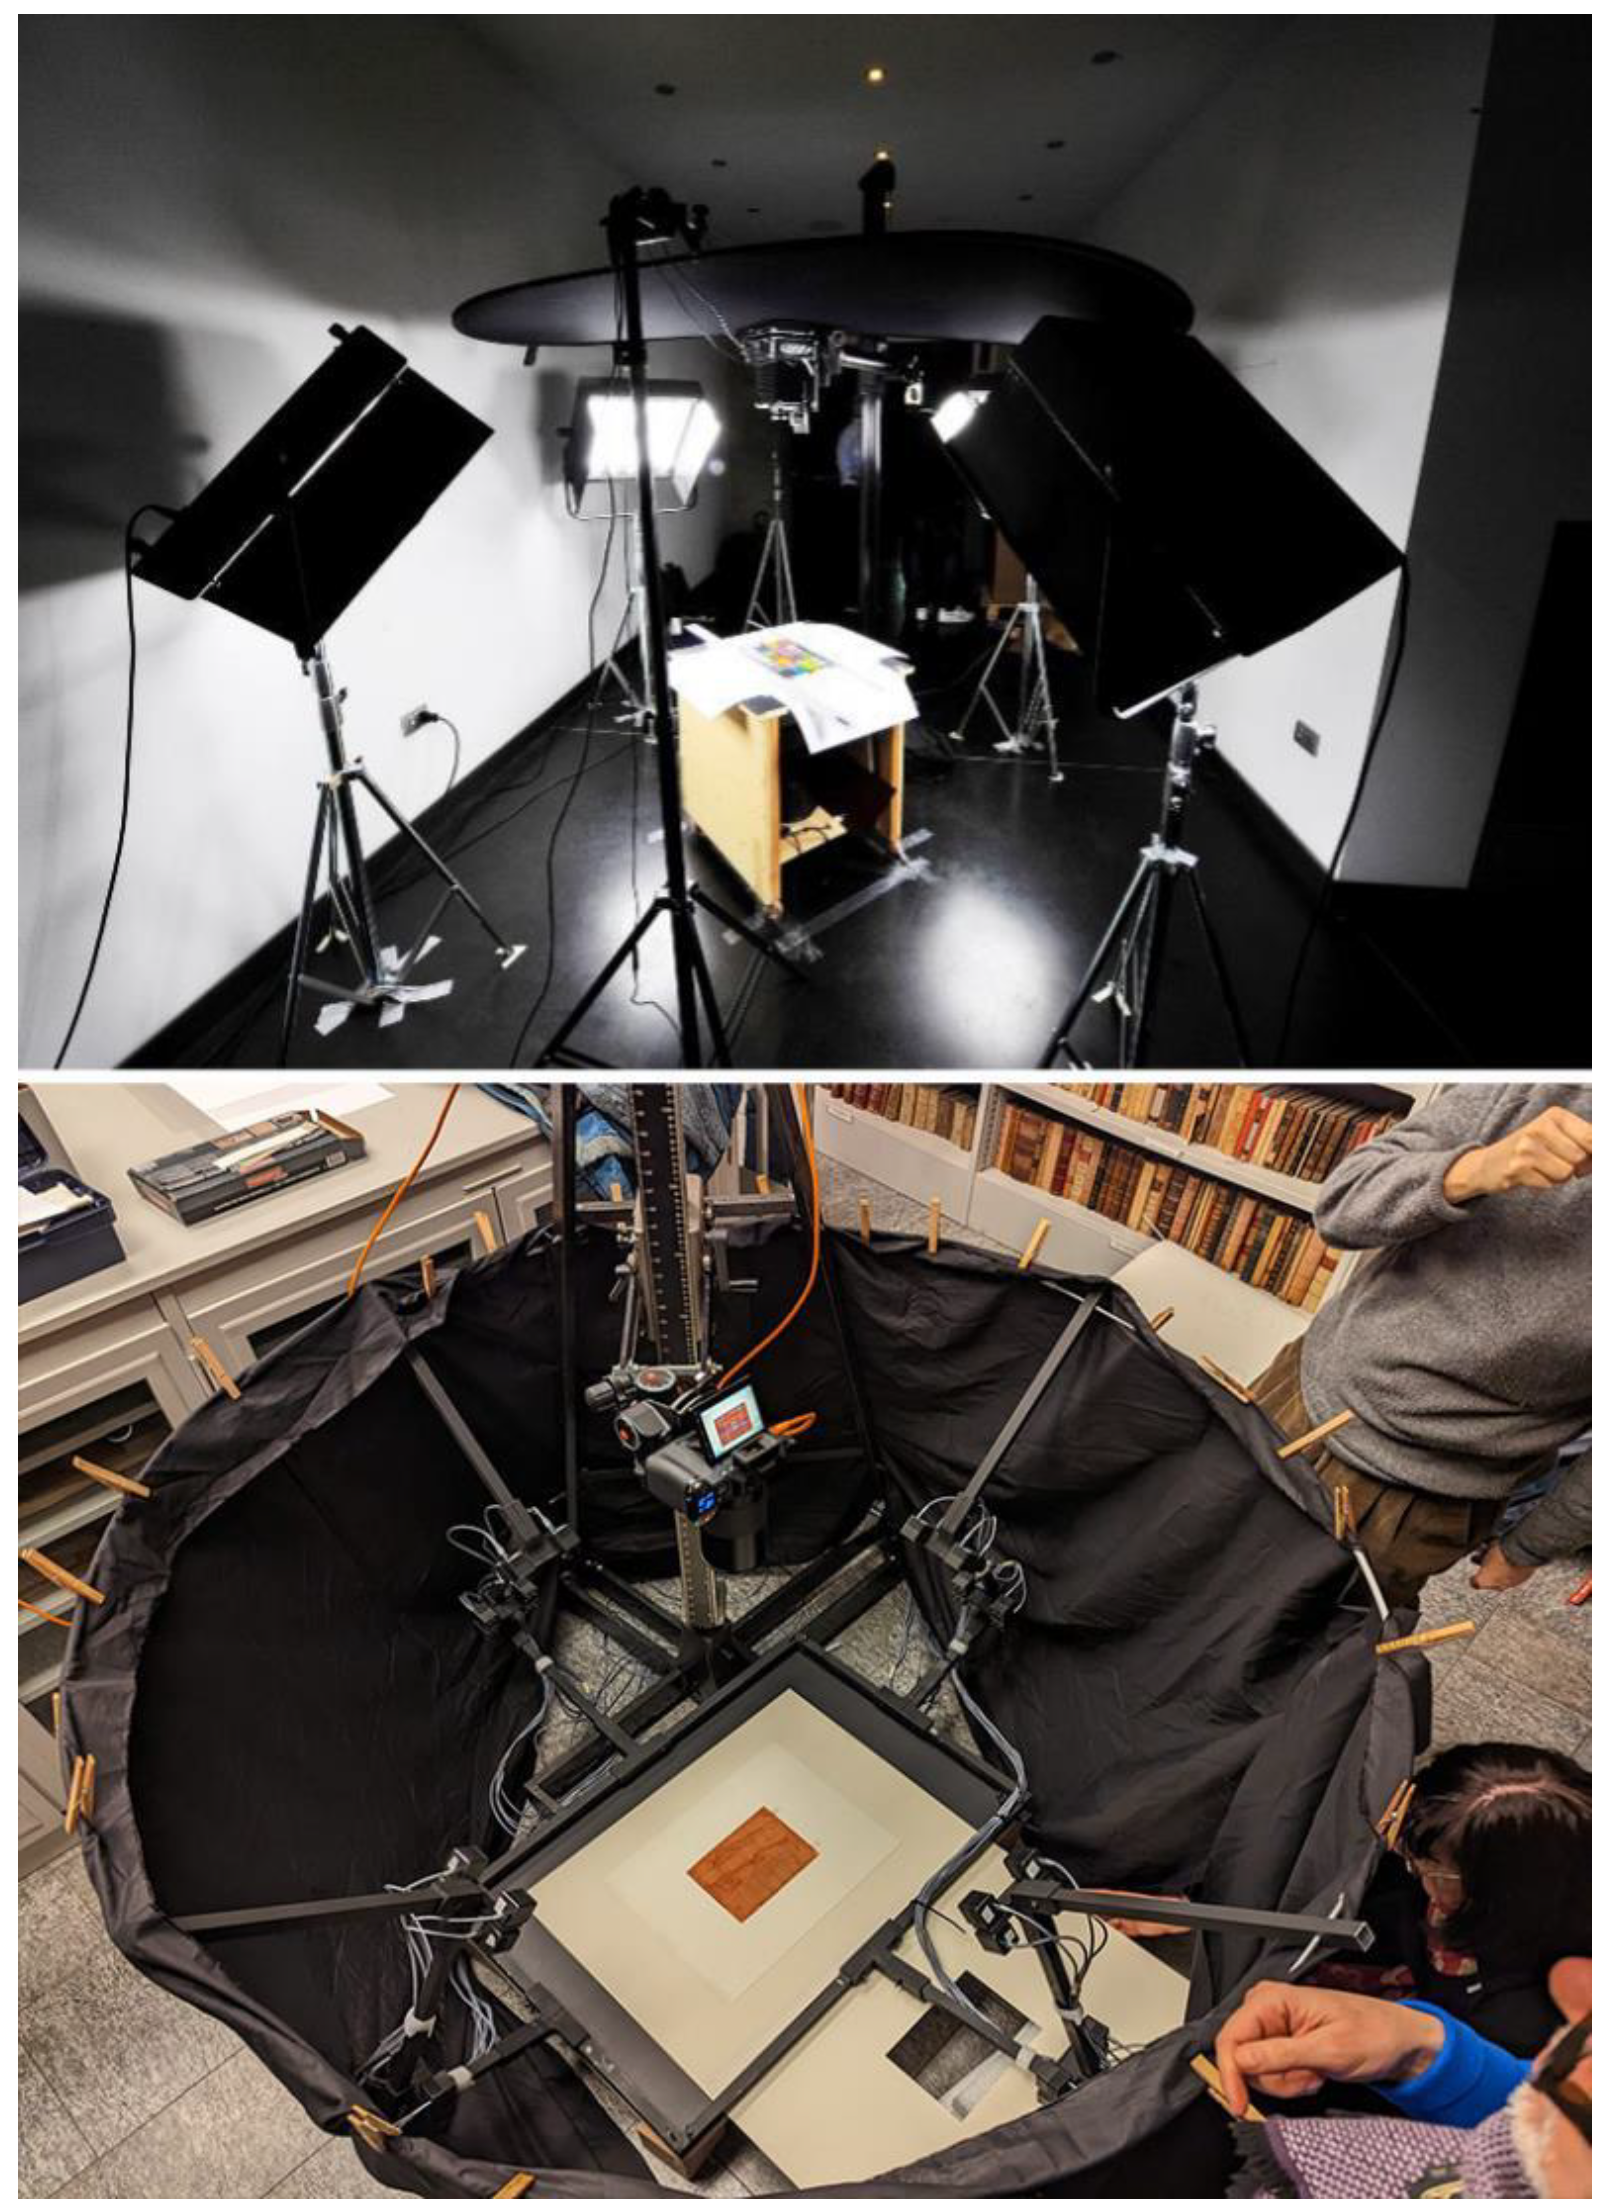
Figure 9.
The second improved prototype for horizontal acquisitions, with raised support to slide in larger drawings.
Figure 9.
The second improved prototype for horizontal acquisitions, with raised support to slide in larger drawings.
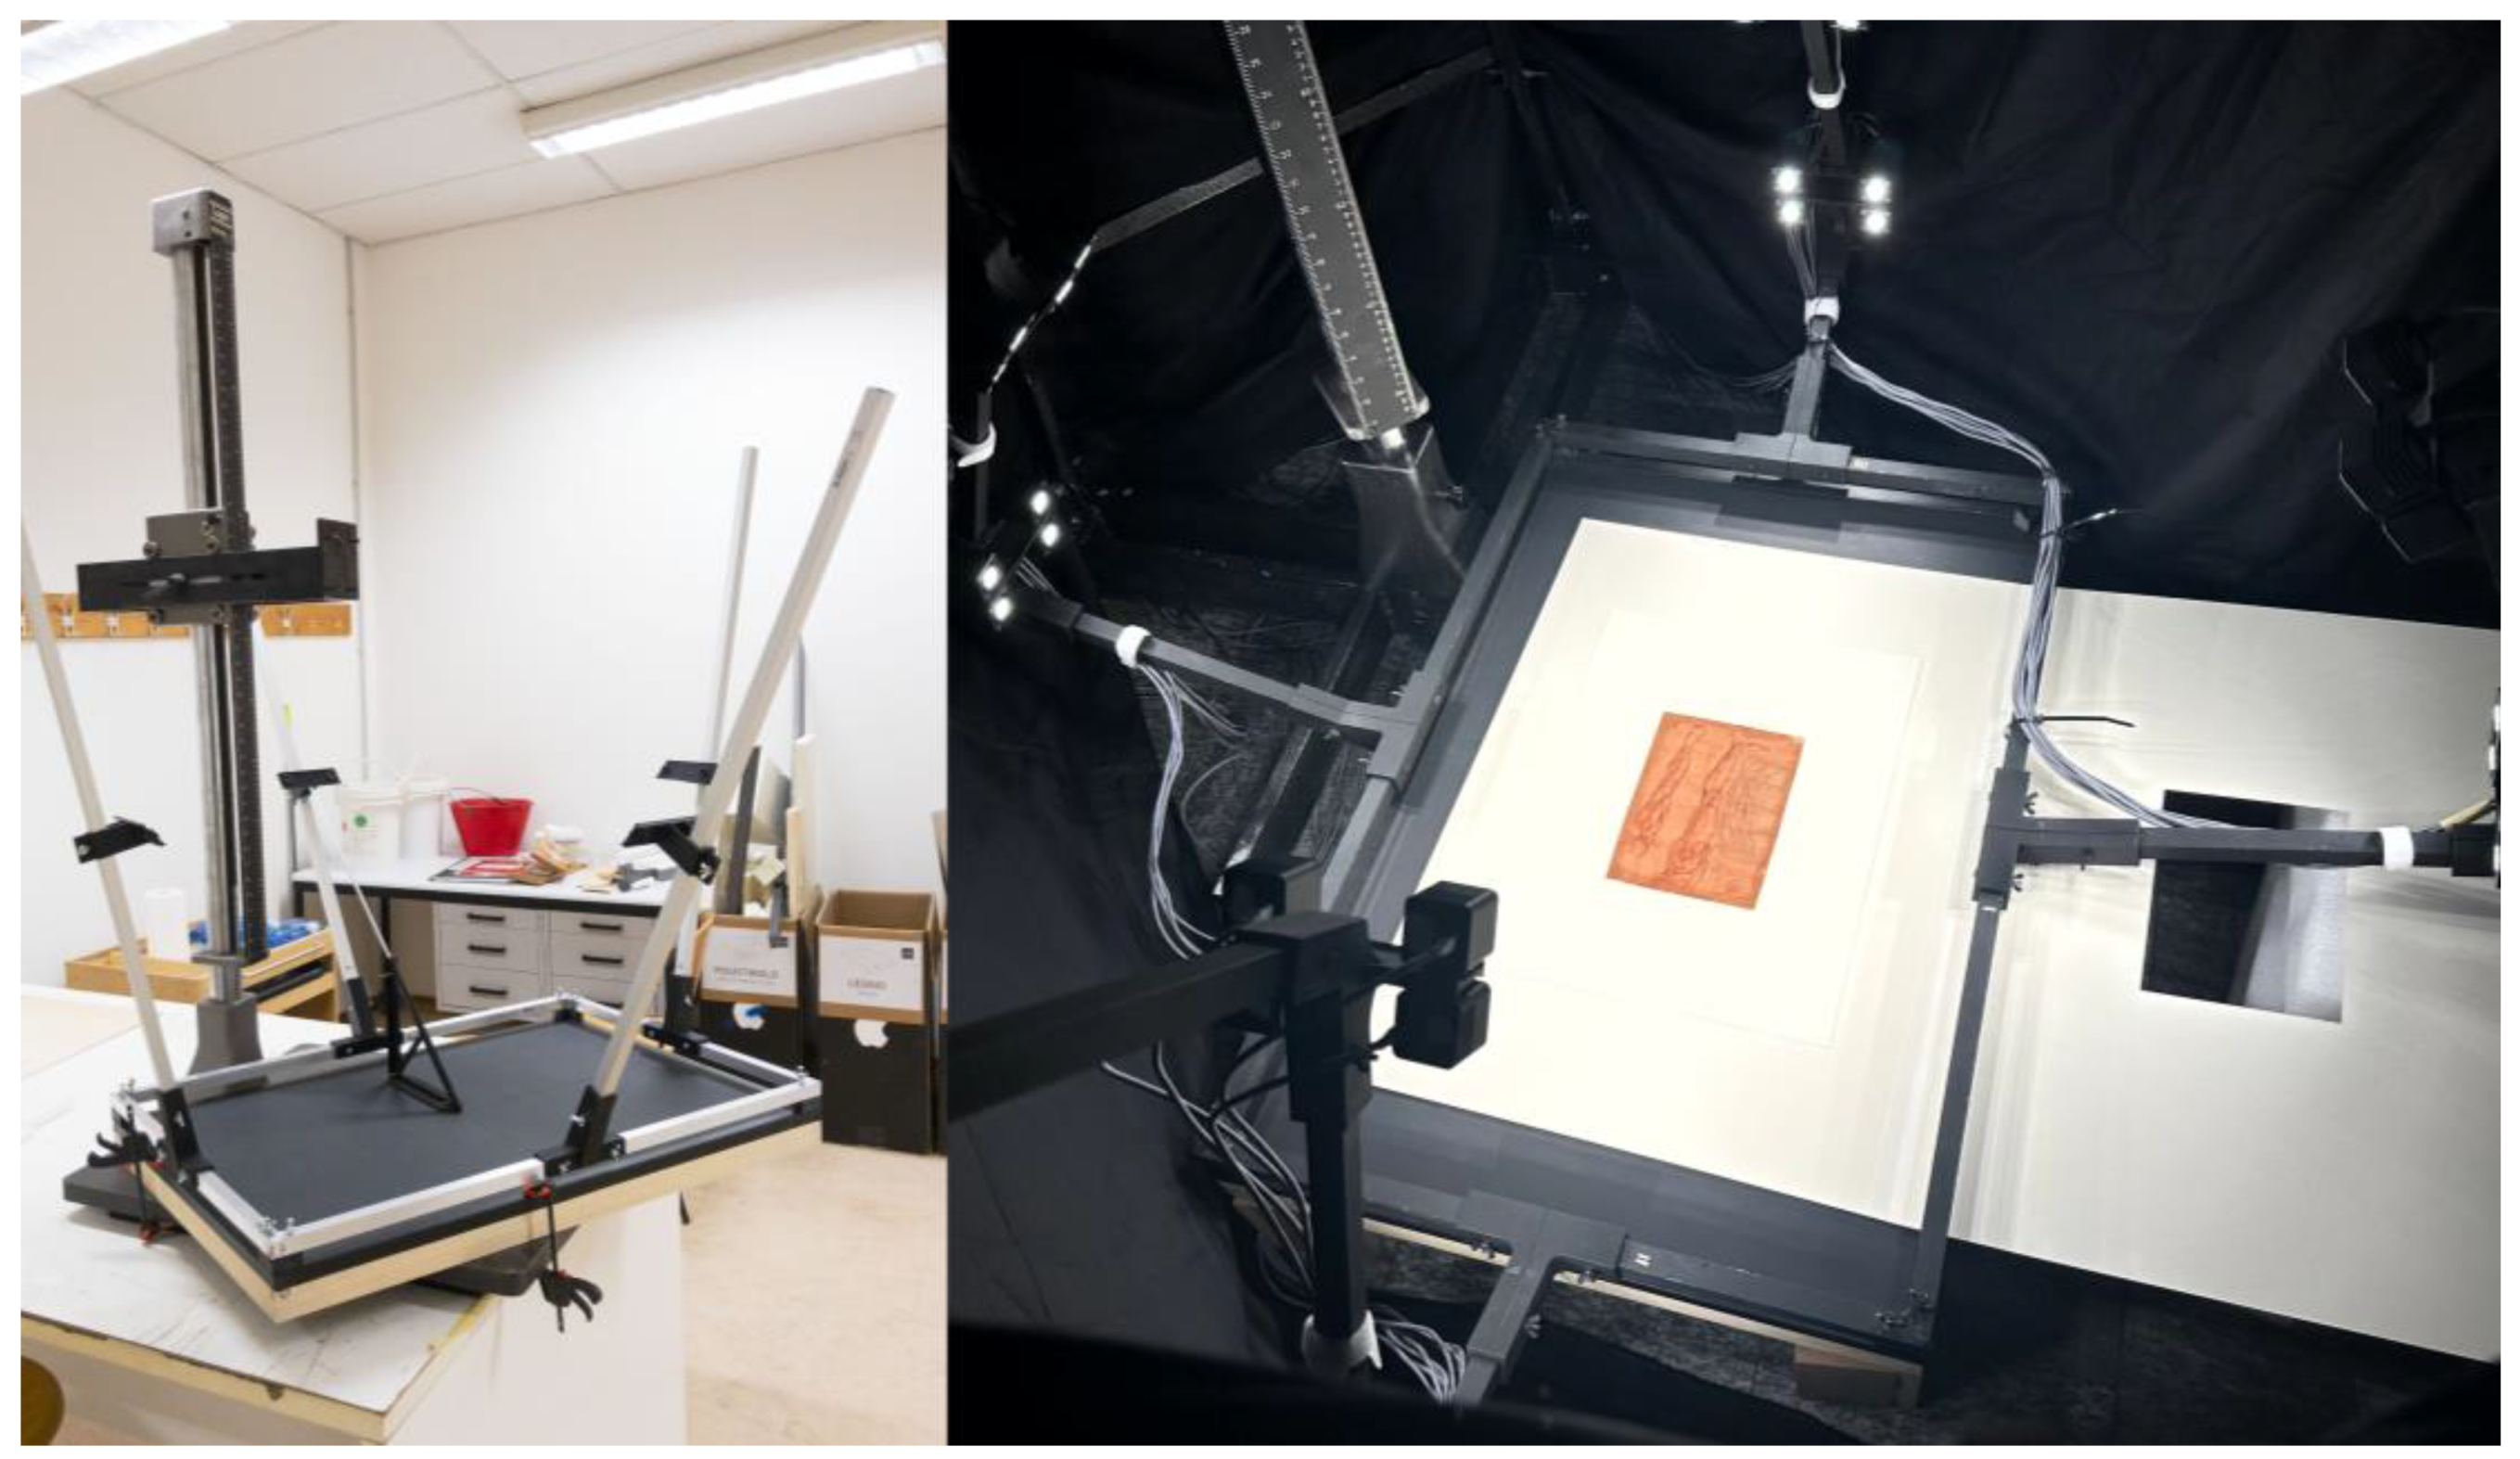
Figure 10.
The second improved prototype: the bill of the custom-built parts (annotations in mm.).
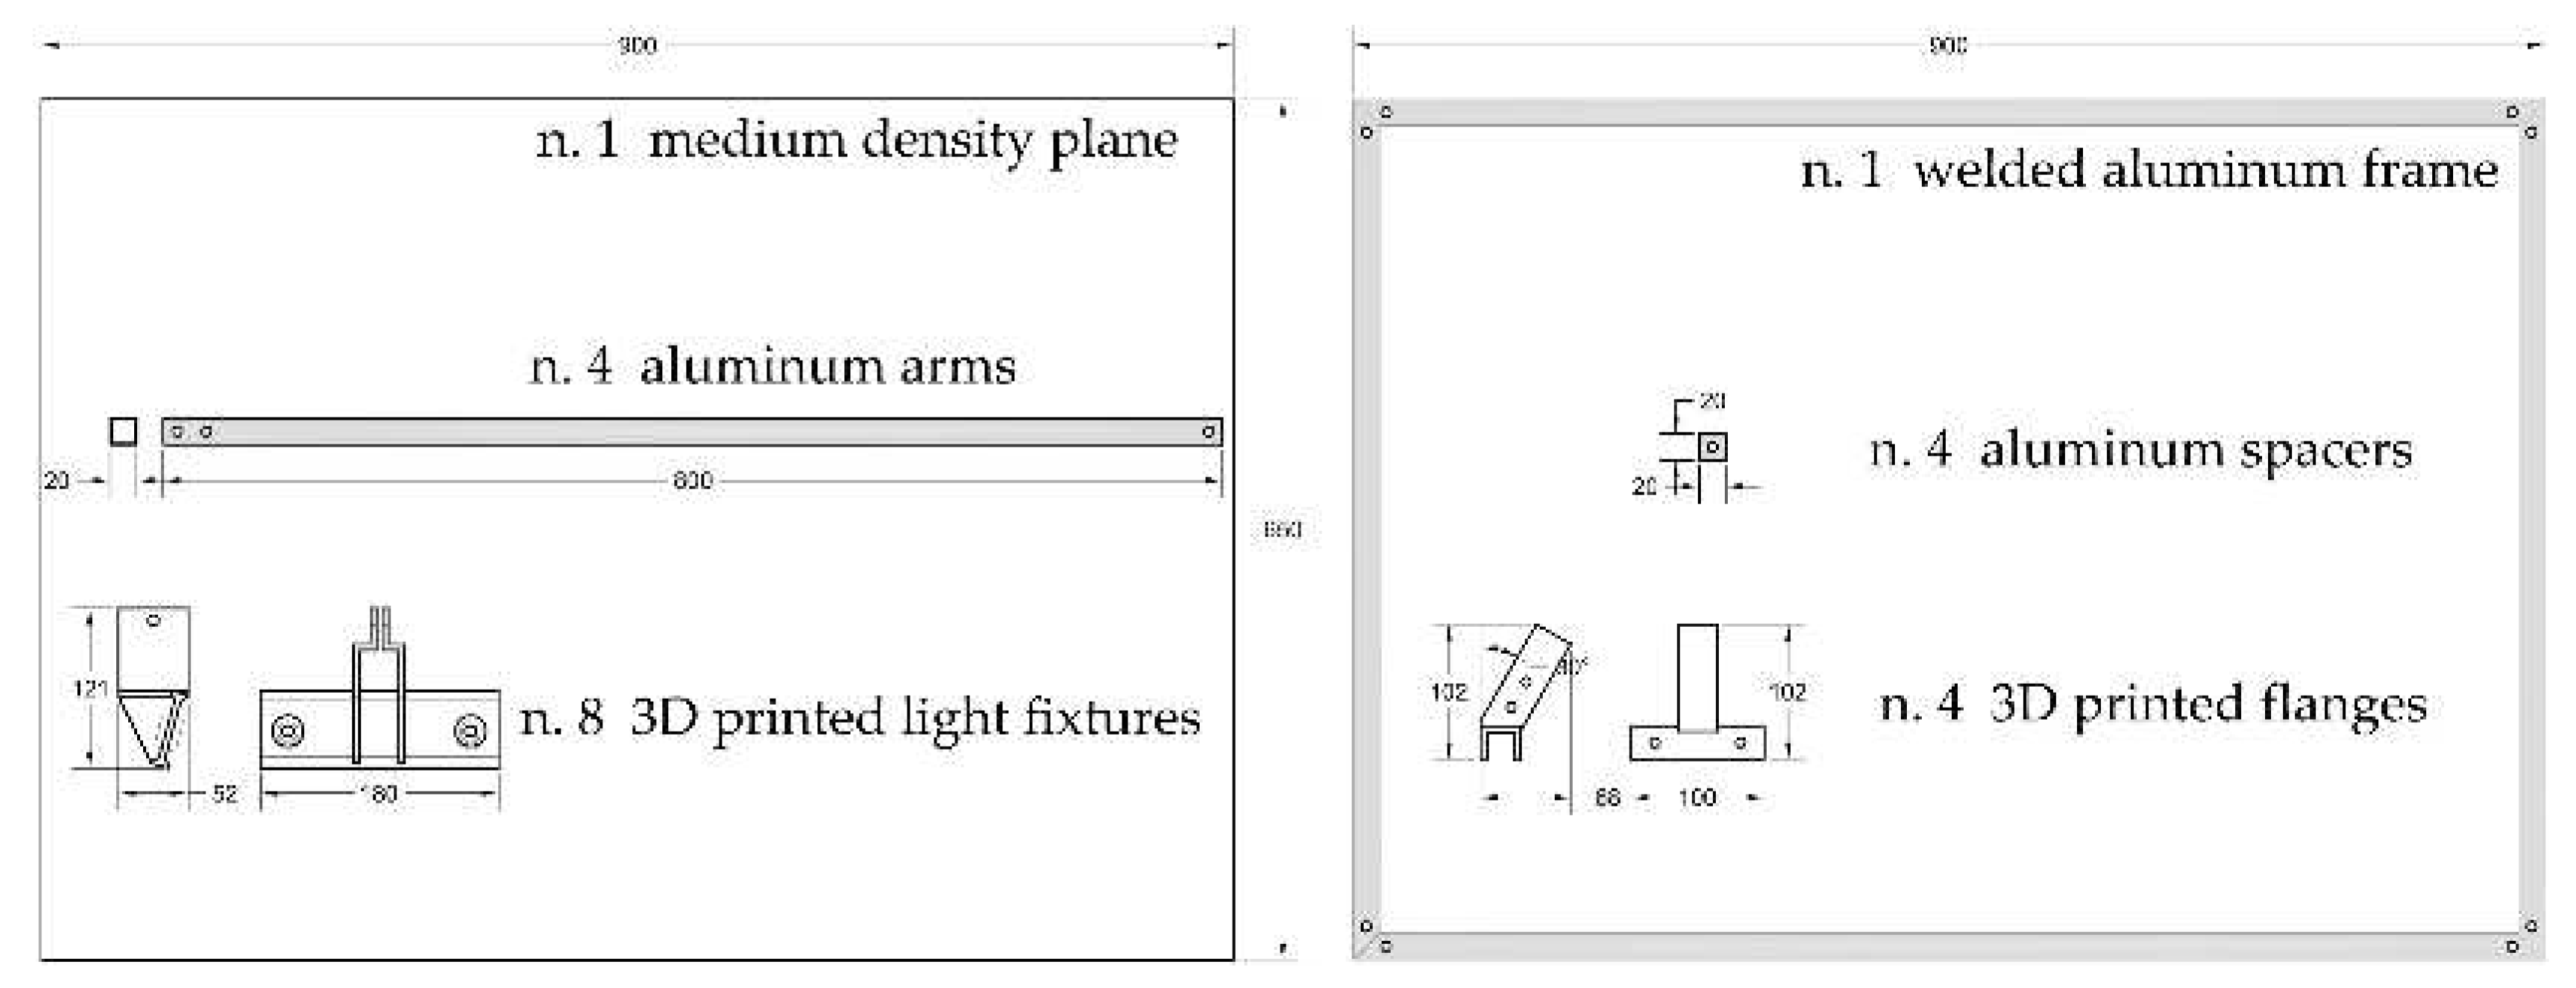
Figure 11.
The trapezoidal aluminum frame designed according to structural simulations performed with a FEM solver. On the left, internal forces influencing the structure when loaded with the whole wired lighting system and camera (some lower aluminum rods are excessively stressed), while on the right the same solution but strengthened by a couple of tie rods that increase resistance to load stress and vibrations (static simulation performed with Von Mises criteria).
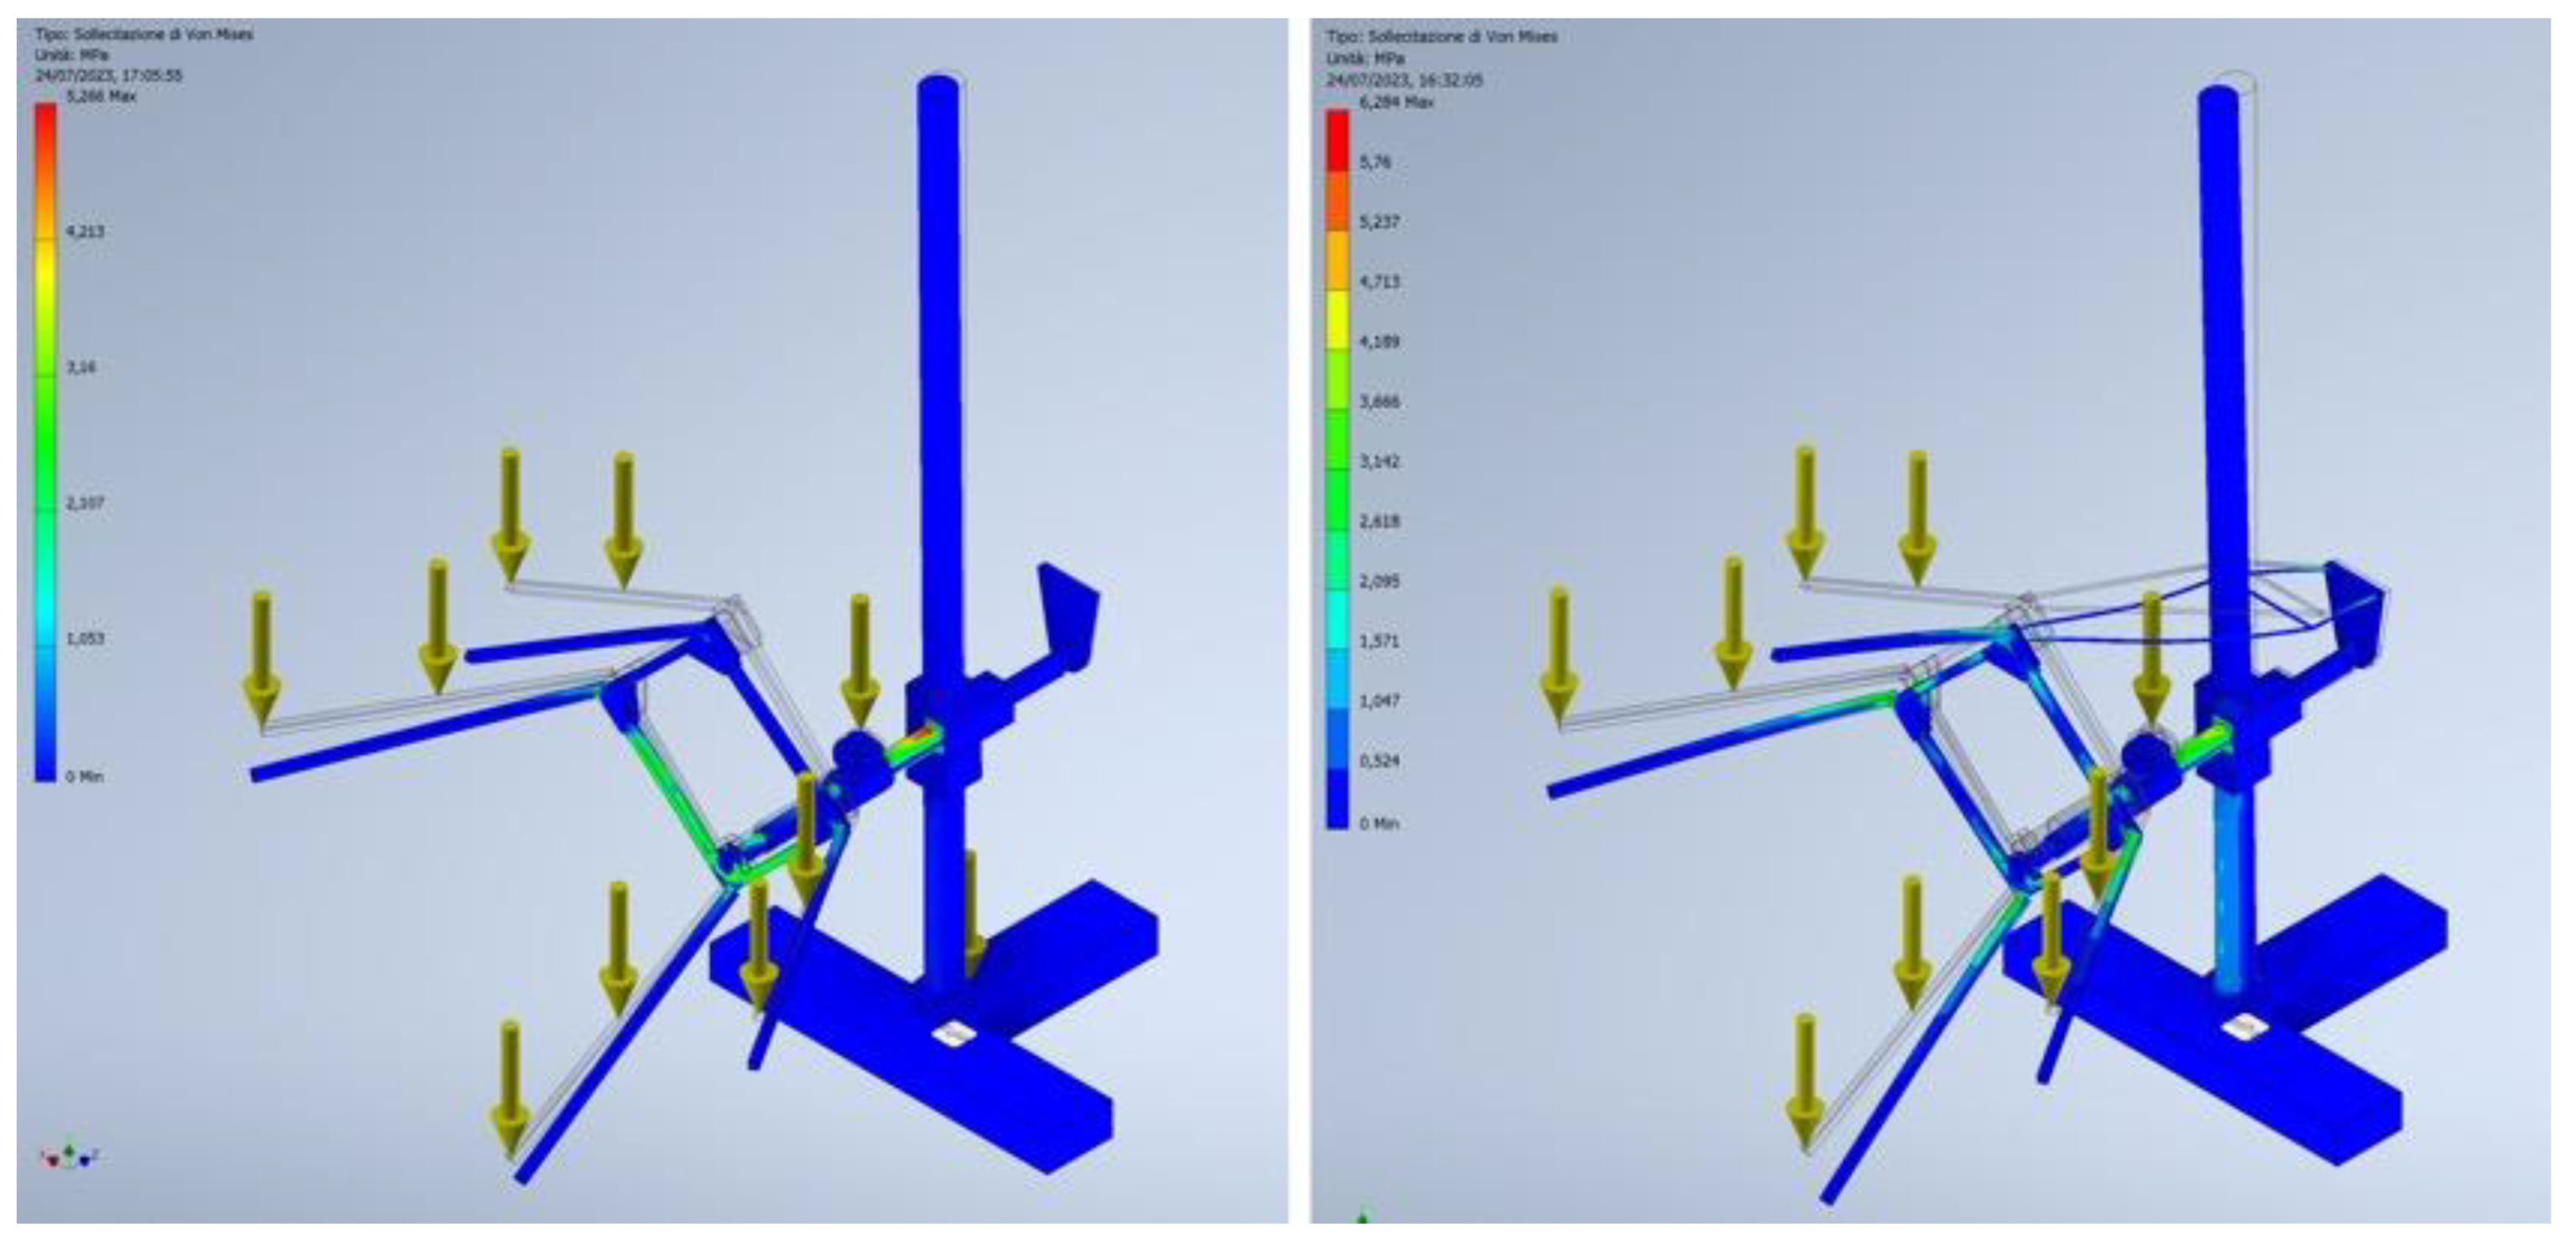
Figure 12.
The prototype custom stand for vertical acquisitions.
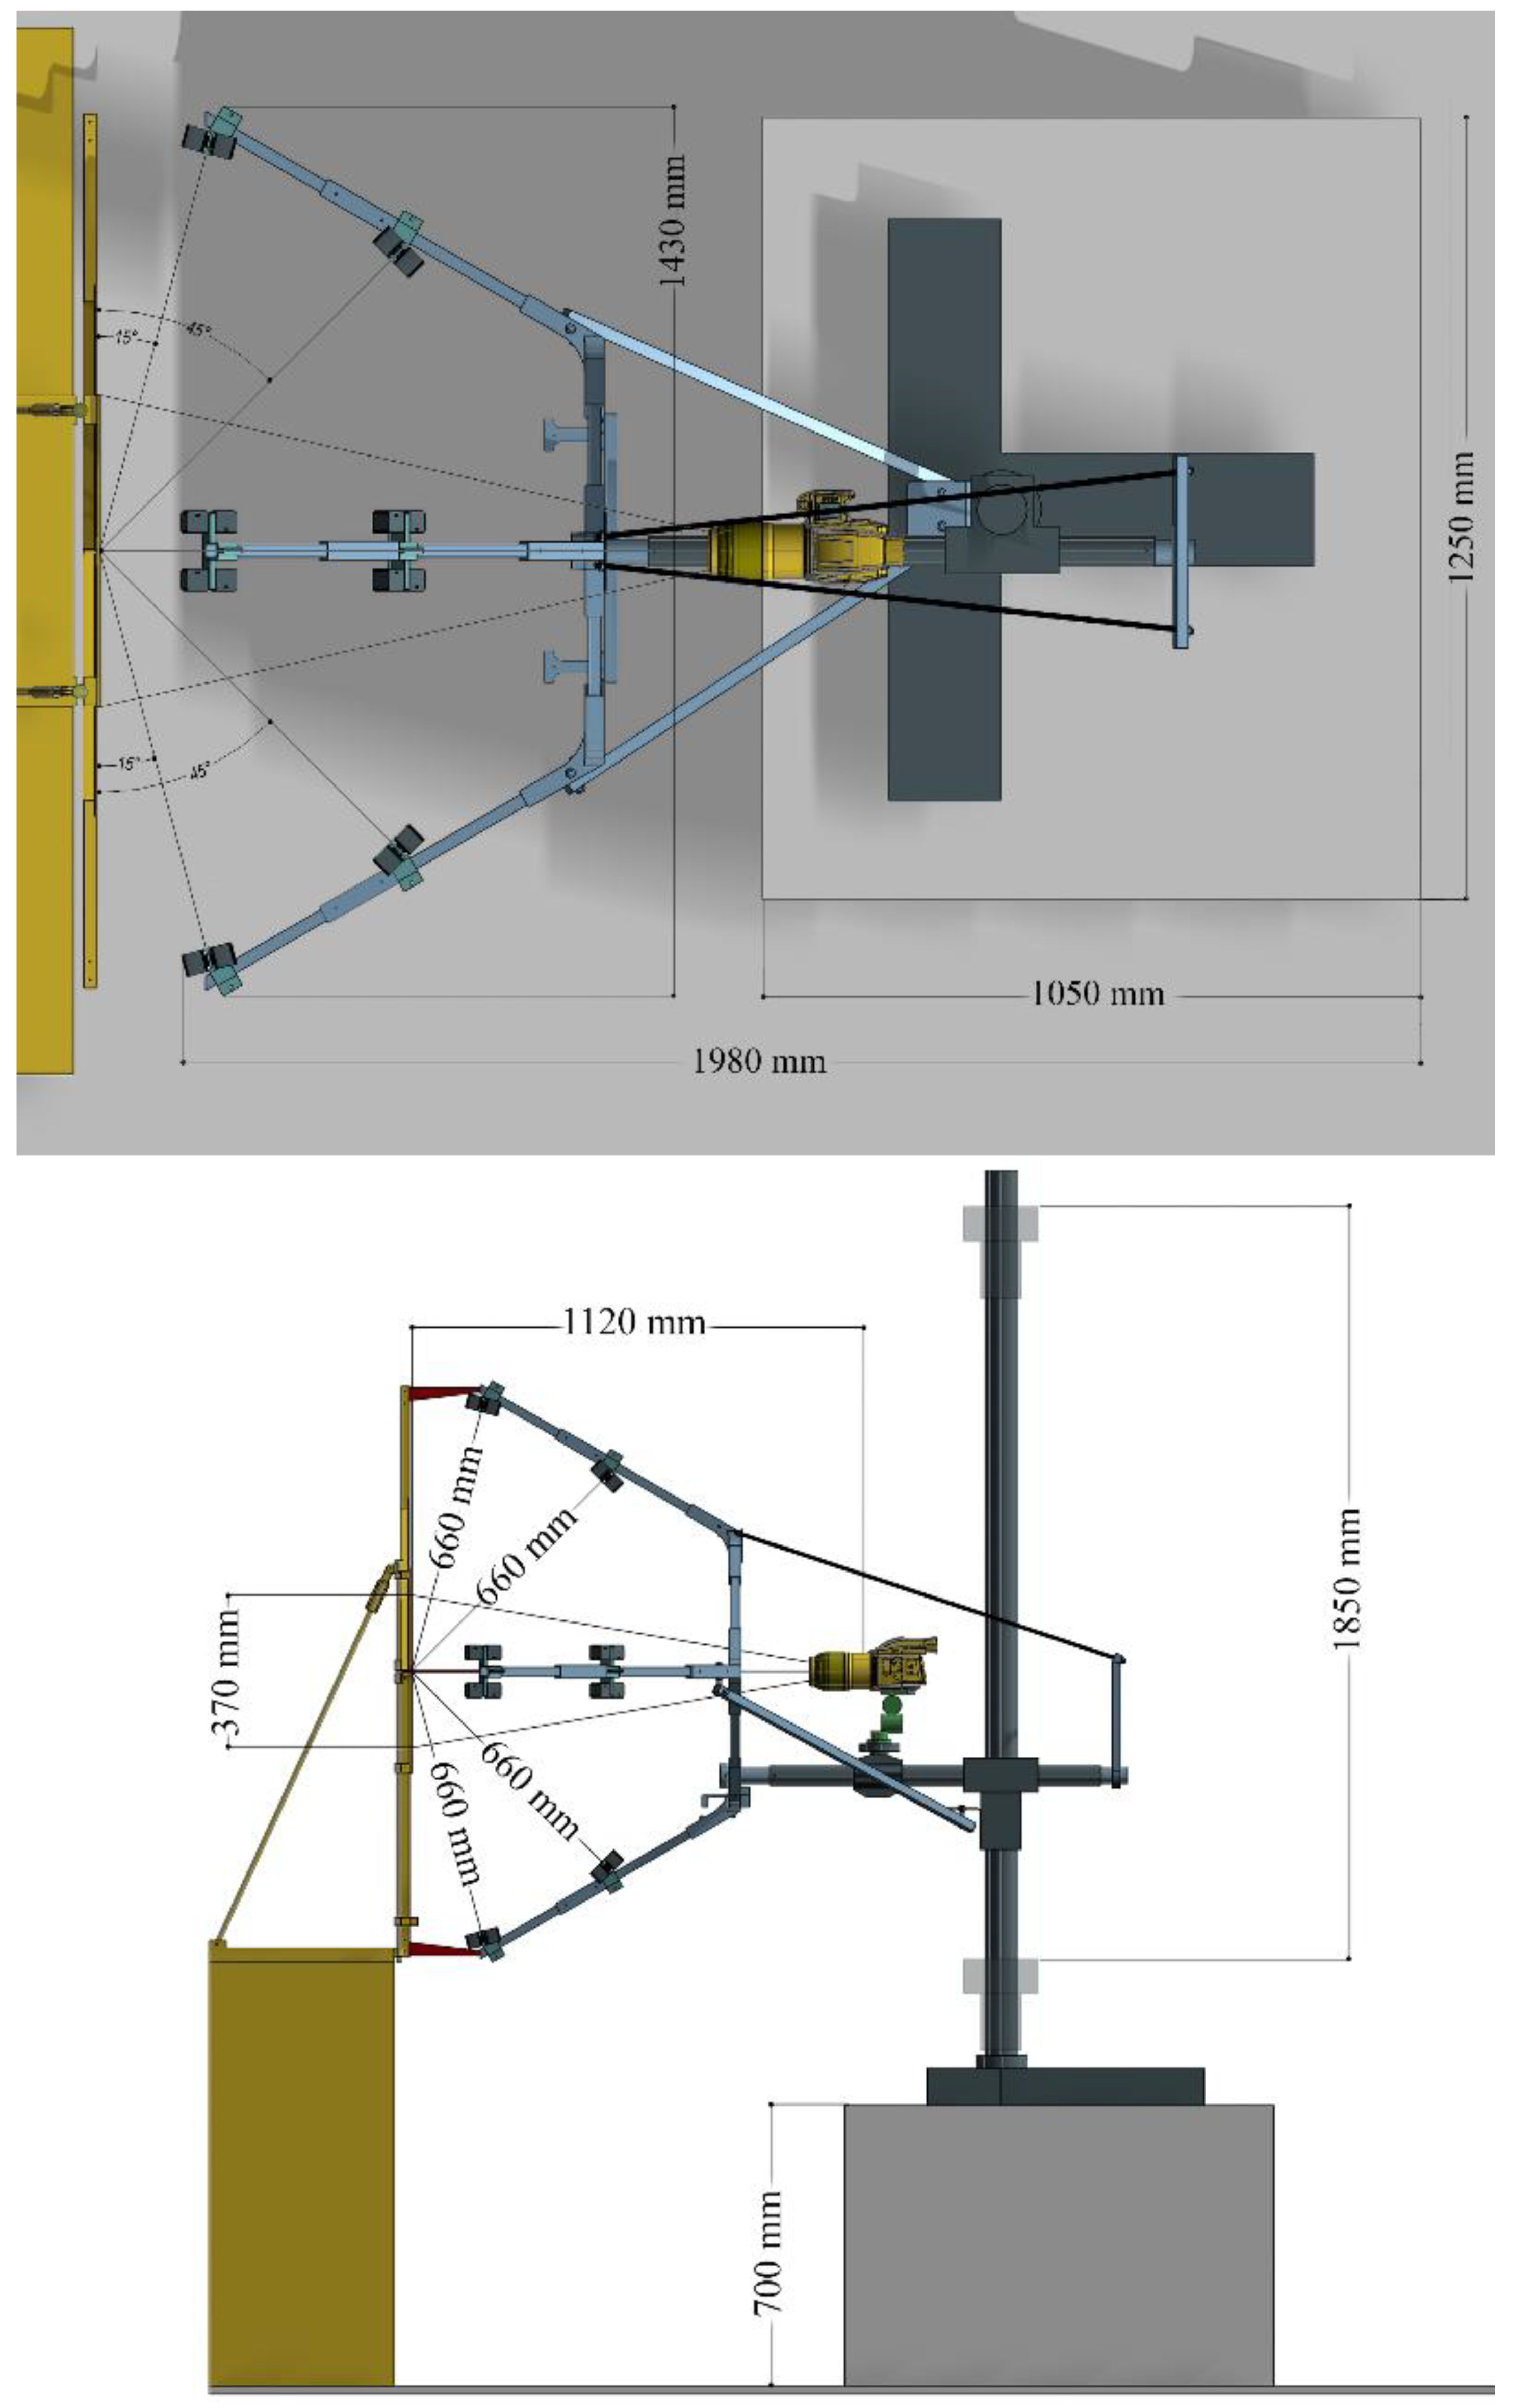
Figure 13.
Our calibrated roundtable and the 3D test-field plate to fold.
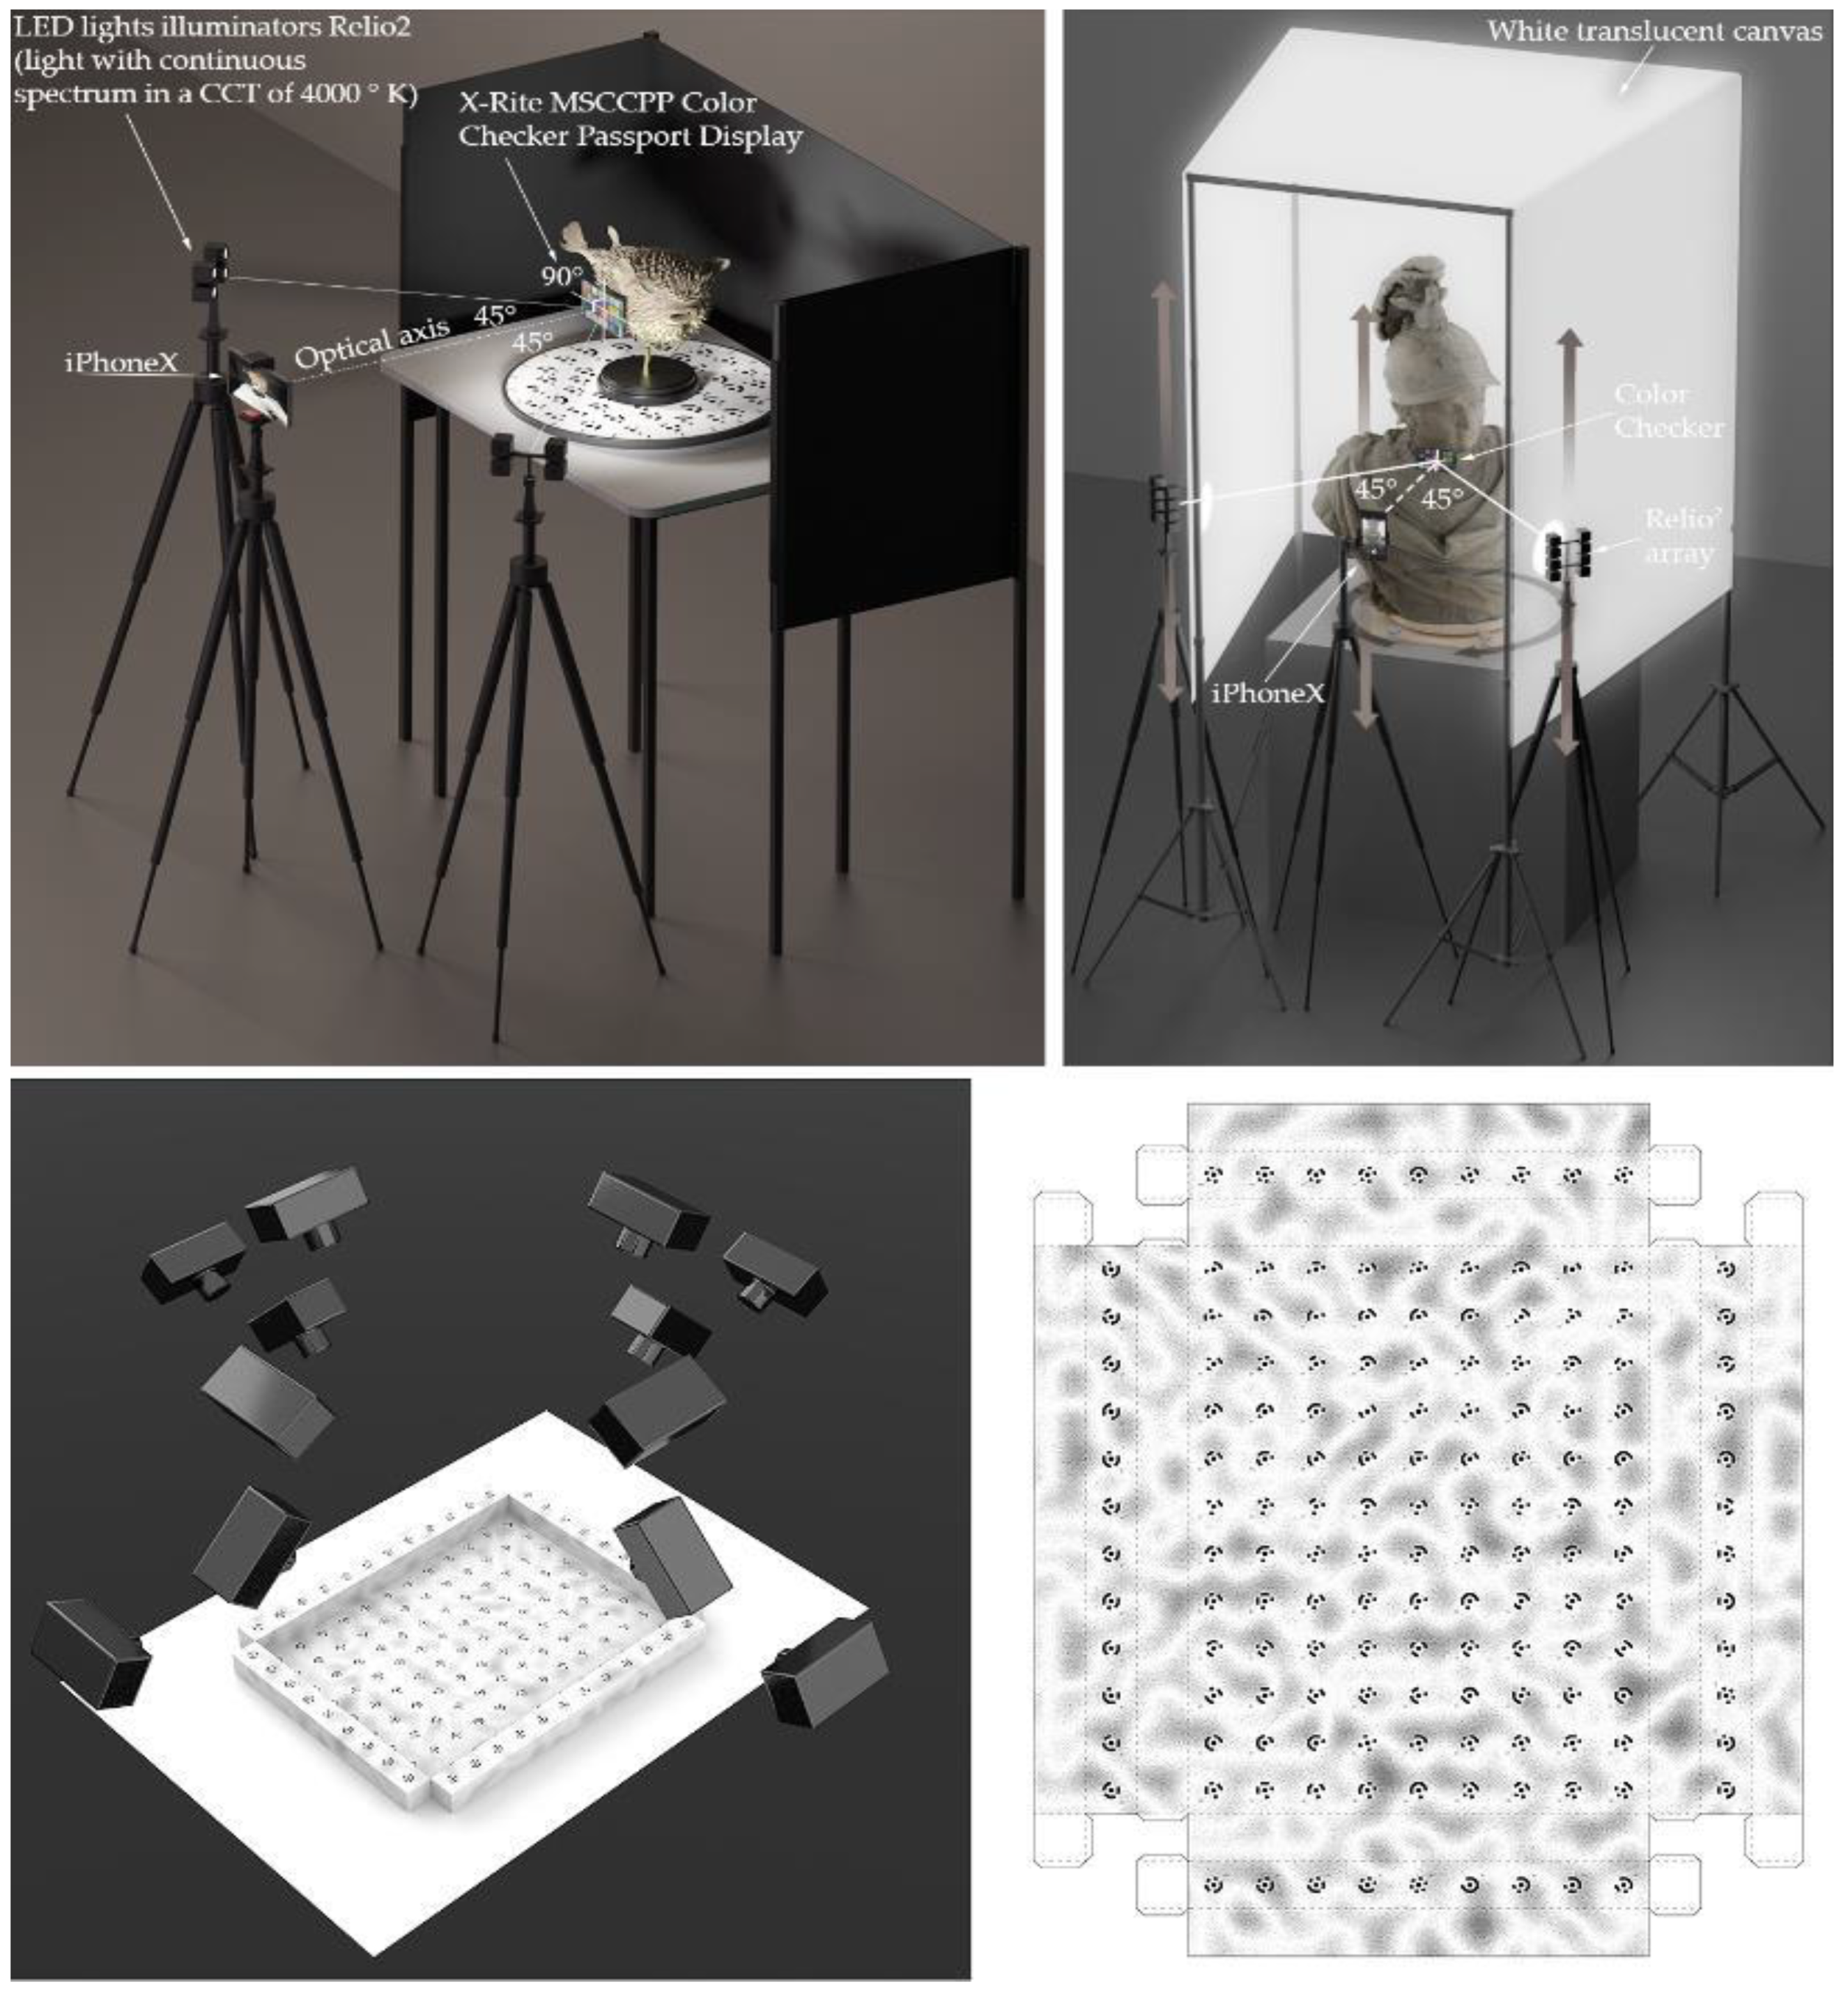
Figure 15.
The extension of the acquisition area as evolved over the years: in the top left, the huge space necessary in Venice (2014), in the top right an improvement in Florence (2018) and in the bottom, from left to right, Milan (2019 and 2022).
Figure 15.
The extension of the acquisition area as evolved over the years: in the top left, the huge space necessary in Venice (2014), in the top right an improvement in Florence (2018) and in the bottom, from left to right, Milan (2019 and 2022).
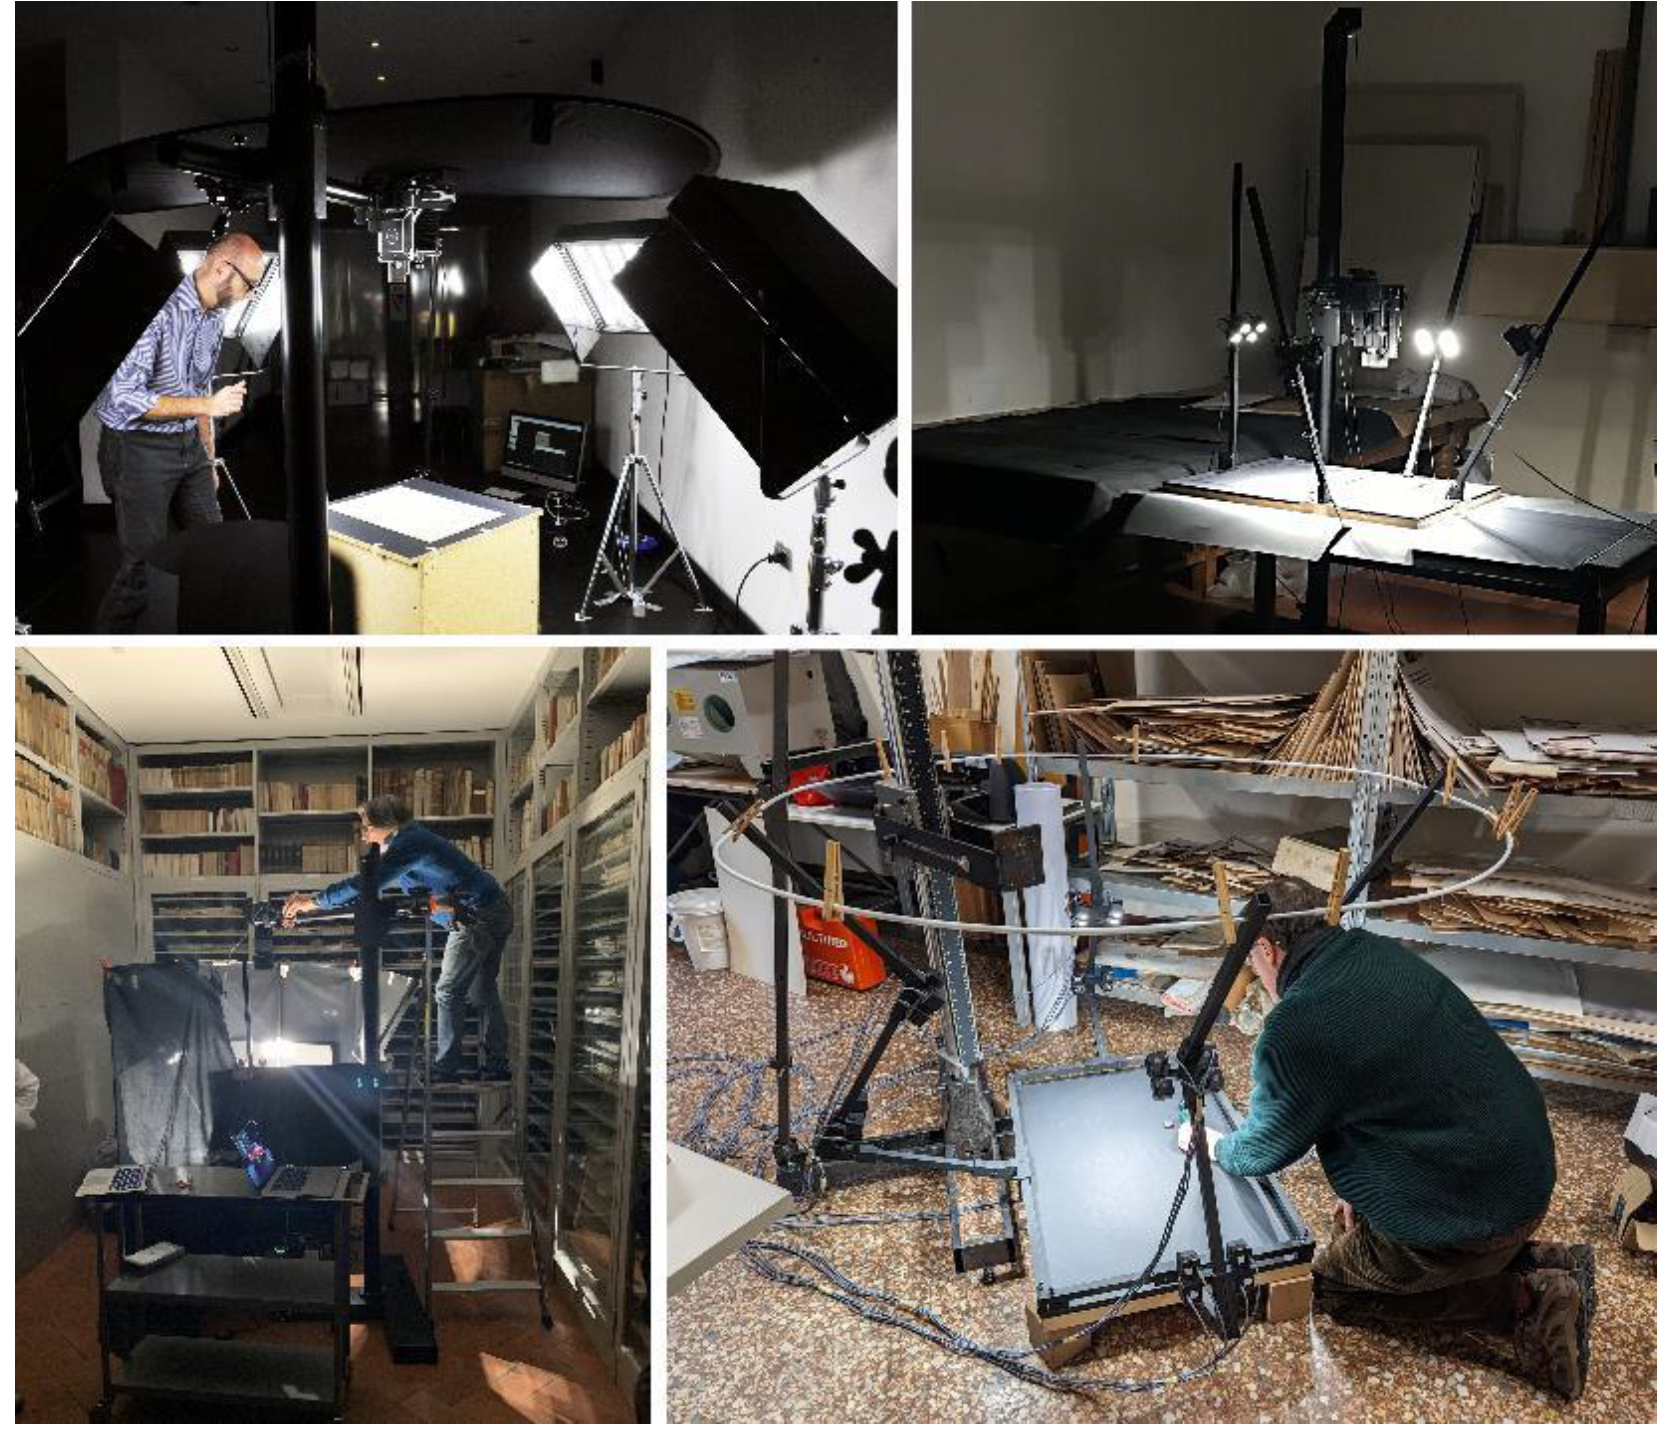
Figure 16.
Normal maps extracted automatically by nLights software: on the left, normal map from 4 pictures with 45° lights only, on the right, normal map from 8 pictures with 45° + 15° light sources on the same subject.
Figure 16.
Normal maps extracted automatically by nLights software: on the left, normal map from 4 pictures with 45° lights only, on the right, normal map from 8 pictures with 45° + 15° light sources on the same subject.
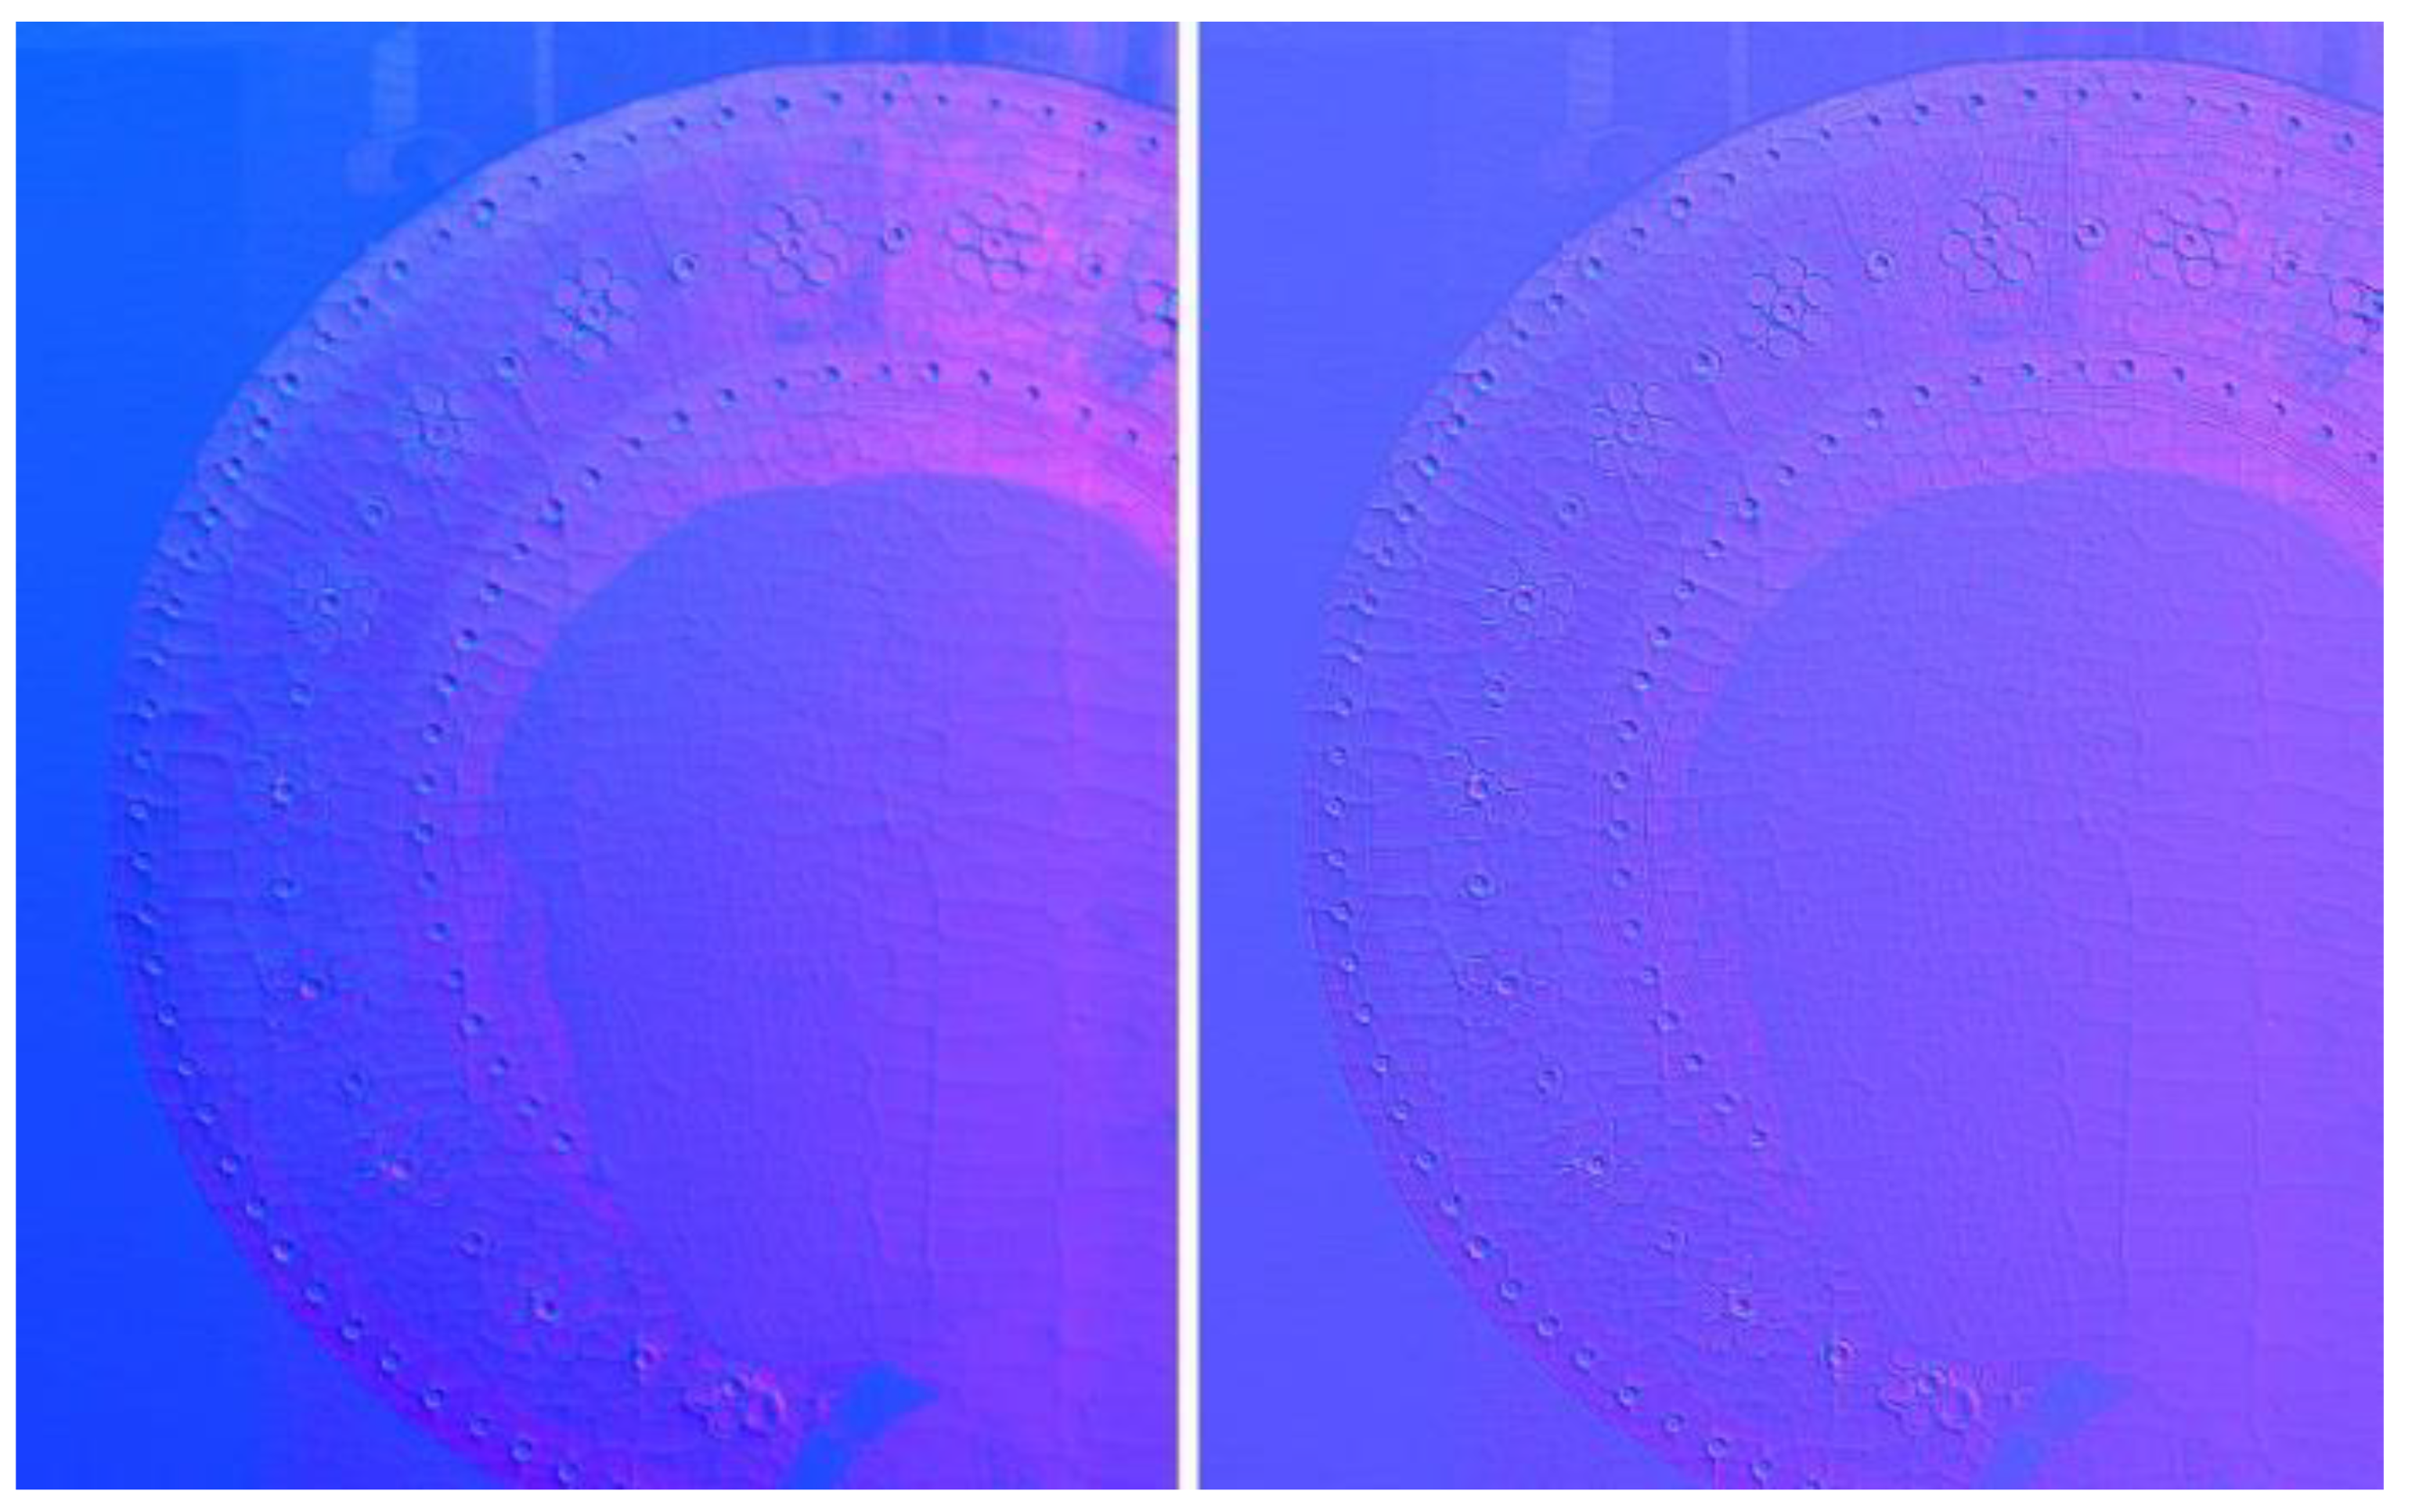
Figure 17.
The Porcupinefish (left) and the Globe by astronomer Horn d’Arturo (right) as reproduced using the developed tools (image courtesy by Filippo Fantini).
Figure 17.
The Porcupinefish (left) and the Globe by astronomer Horn d’Arturo (right) as reproduced using the developed tools (image courtesy by Filippo Fantini).
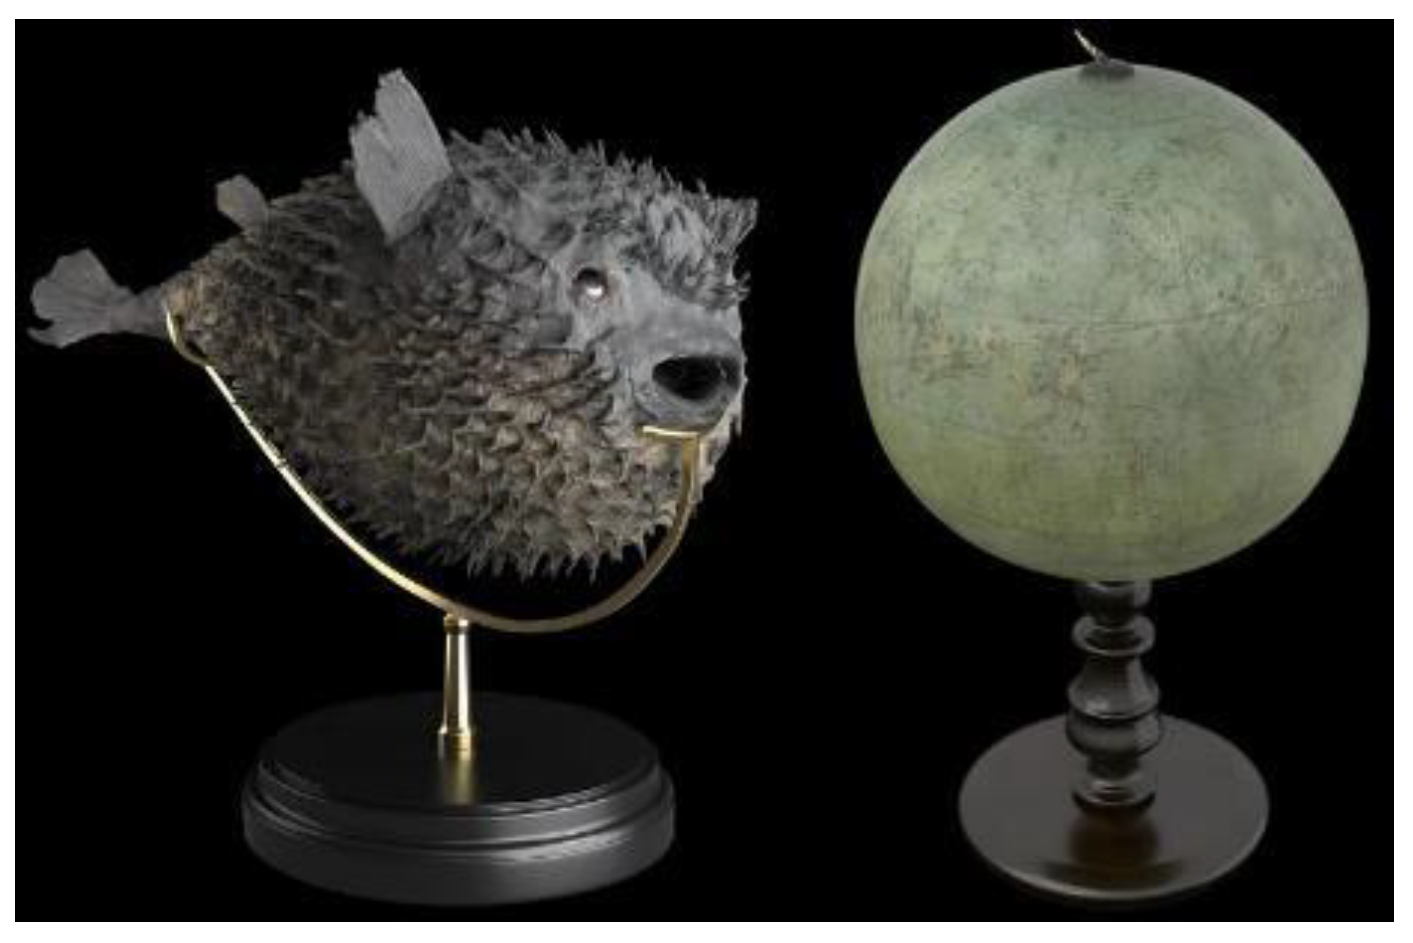
Figure 18.
Comparative results in the reproduction of parchments, inks, and gold foils: on the left a traditional, static 2D picture, on the right the 3D model generated, in which the whole geometry and the optical properties of each material are better replicated and dynamically visualized under different light directions.
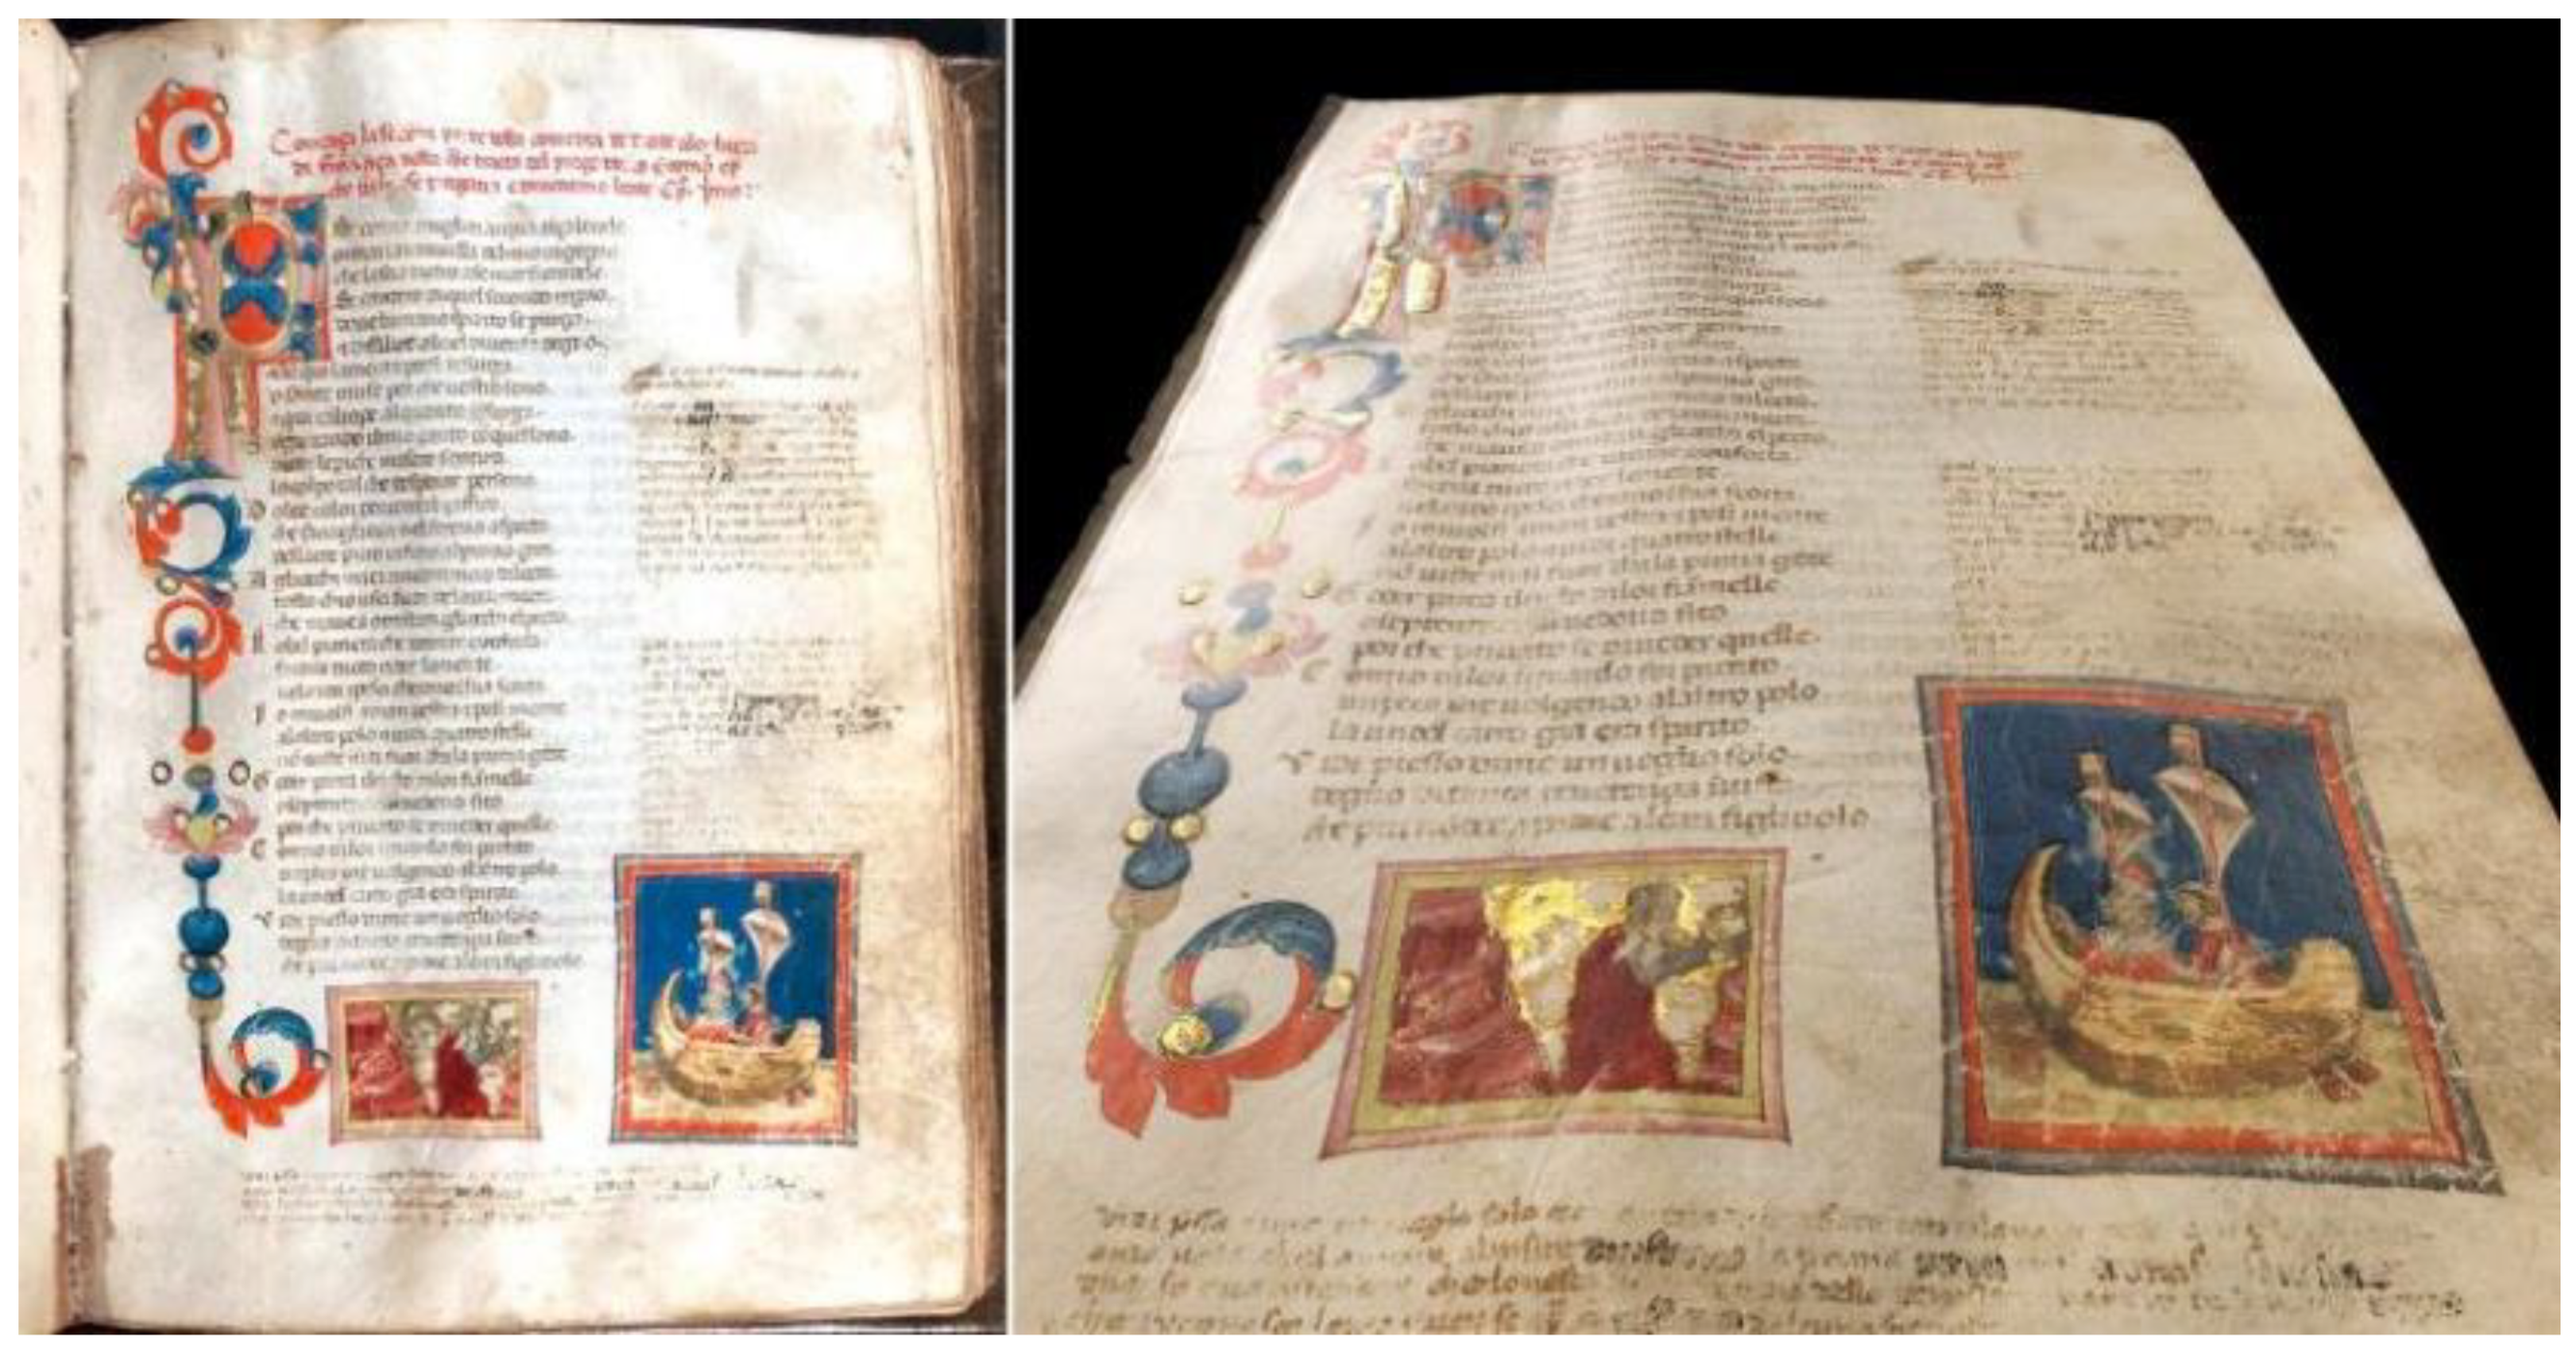
Figure 19.
The acquisition plan using the vertical movable rig, considering spaces and distances to reach the desired resolution according to the camera features.
Figure 19.
The acquisition plan using the vertical movable rig, considering spaces and distances to reach the desired resolution according to the camera features.
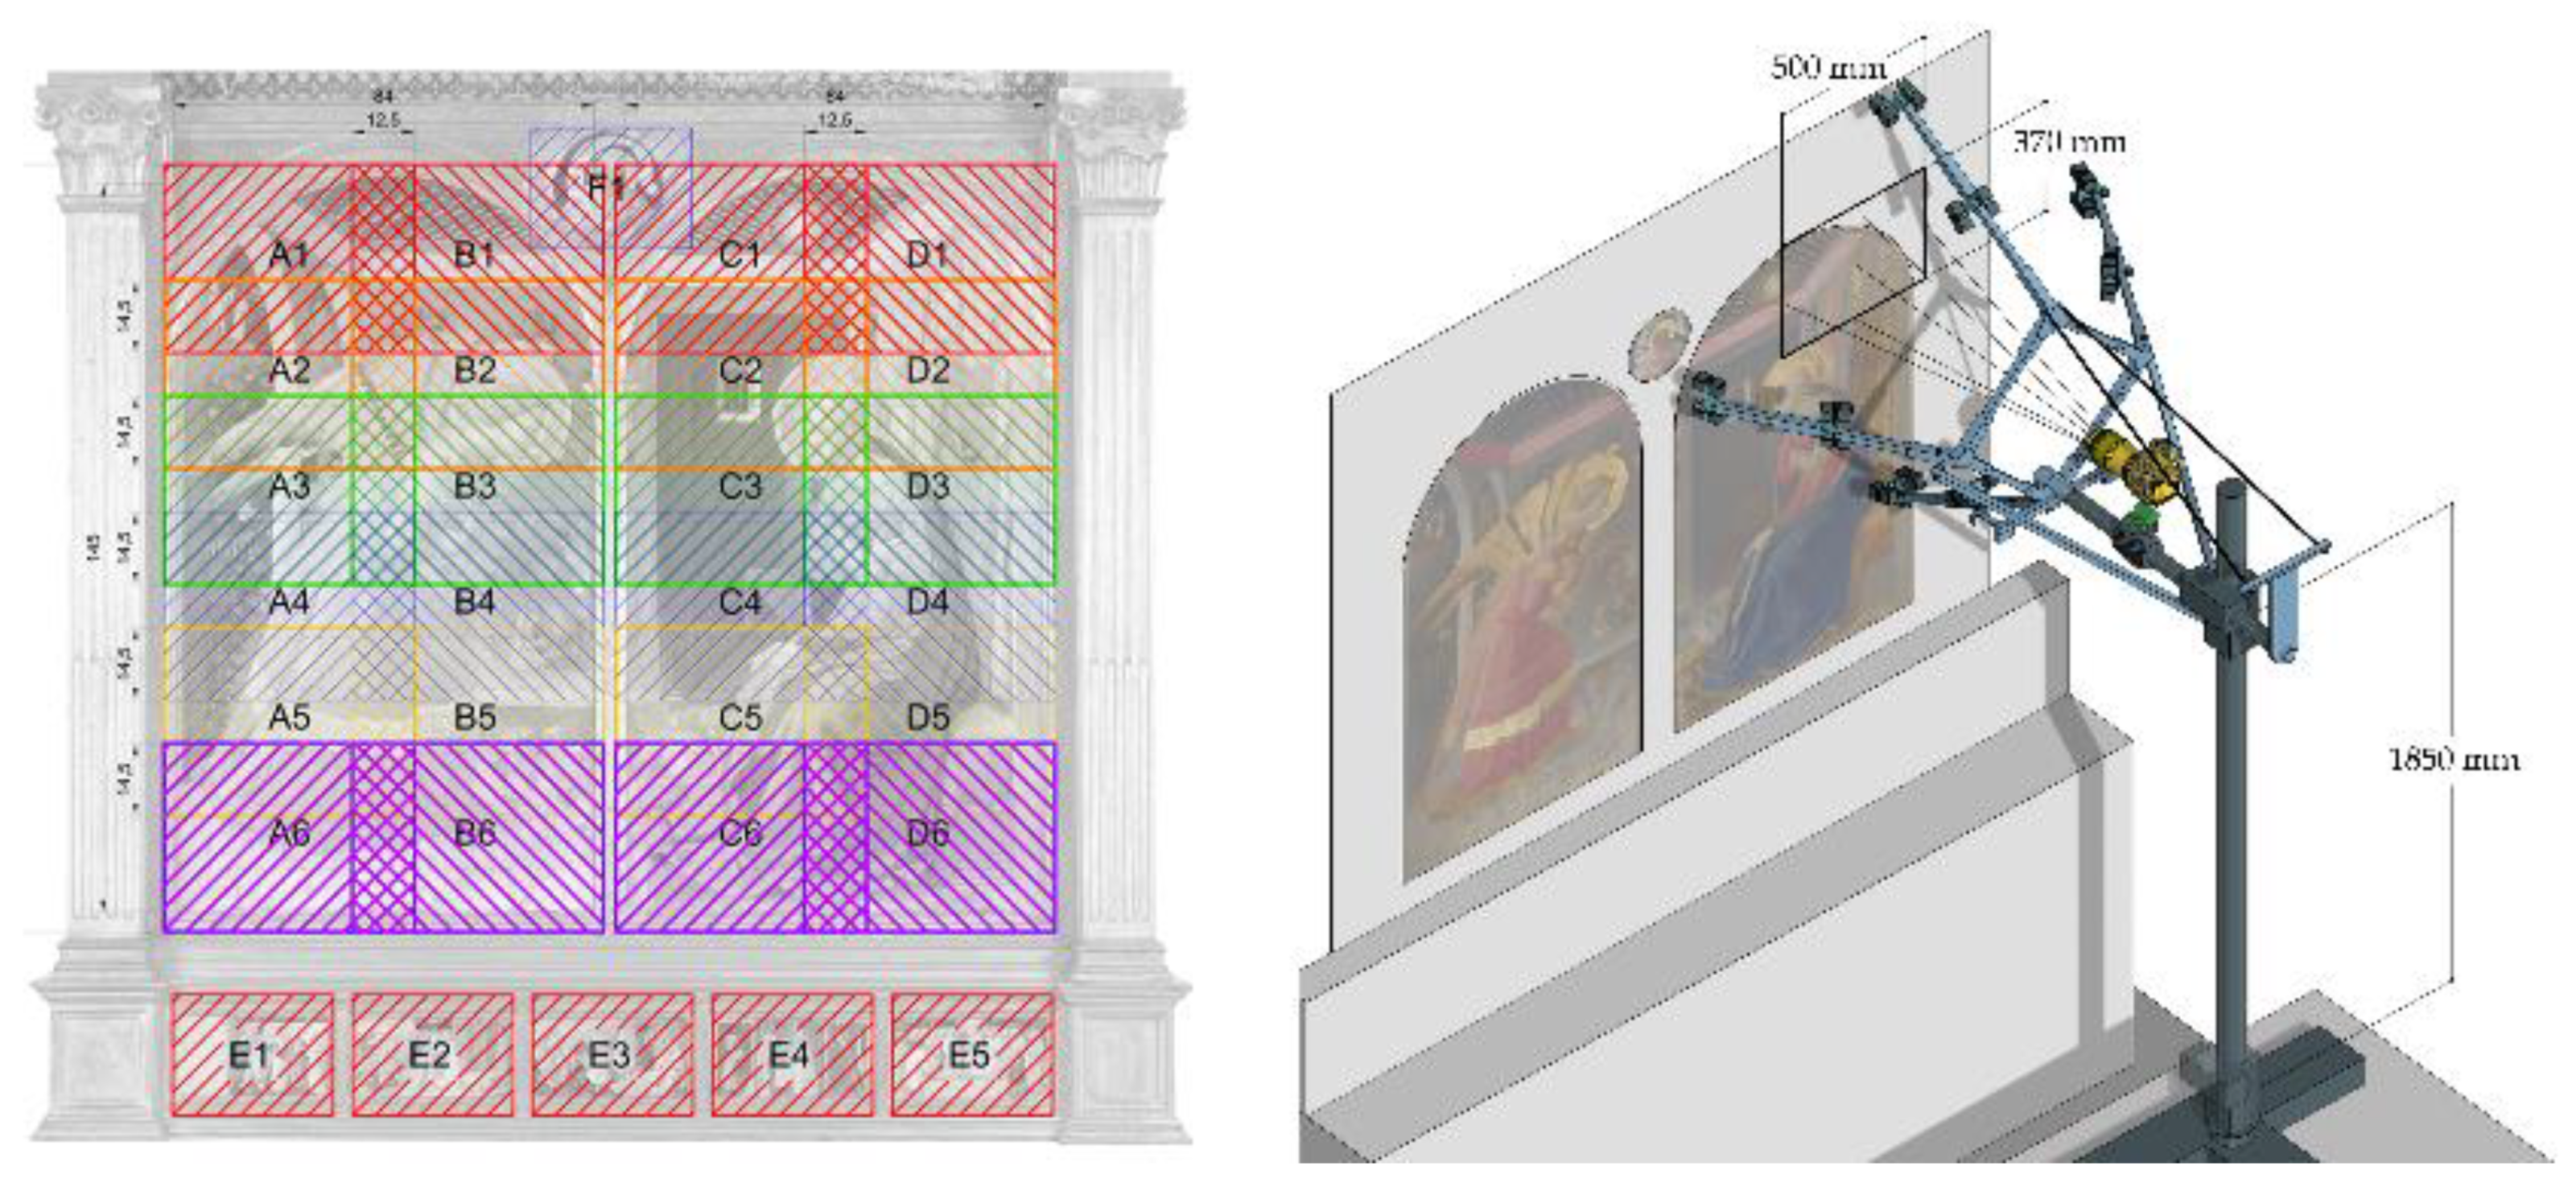
Figure 20.
The 3D visualization of the Annunciation: the combination of the different maps generated by nLights into a shader written in C# language script leads to a dynamic display of materials.
Figure 20.
The 3D visualization of the Annunciation: the combination of the different maps generated by nLights into a shader written in C# language script leads to a dynamic display of materials.
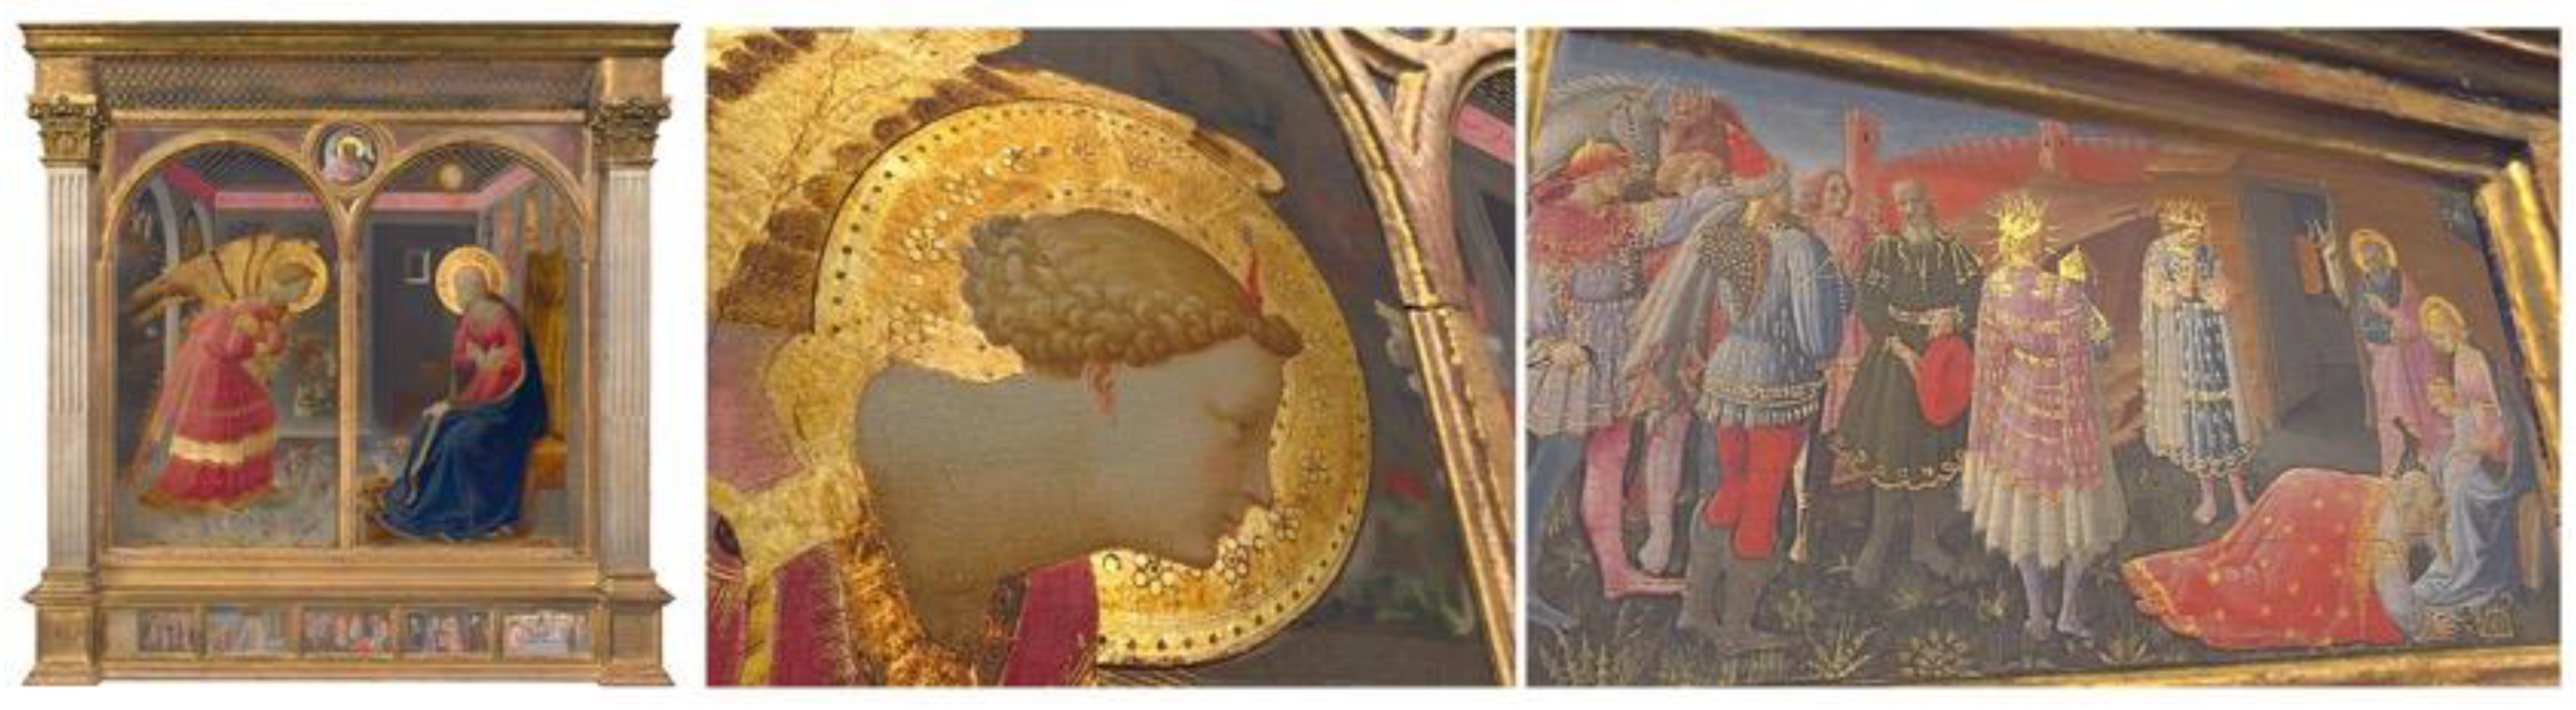

Table 1.
Components used to assemble the first prototype and their nature.
| Component | Commercial | Custom made |
|---|---|---|
| Camera system | Rencay DiRECT Camera System 24k3 camera equipped with a Rodenstock Apo Macro Sironar Digital 120 mm., f/5.6 lens. | - |
| Column stand | Manfrotto 809 Salon 230, 280 cm height, equipped with a Manfrotto 410 geared head | - |
| Light system | 16 Relio2 single LED lamps (gathered in 4 groups consisting in 4 lights each) | - |
| Light support | - | Custom 3D printed joints placed on four detachable arms using 20 x 20 x 1 mm. hollow aluminum extrusions |
| Flat acquisition surface | - | 900 x 650 x 32 mm. medium-density panels, with laser engraved reference system |
Table 2.
Components used to assemble the first prototype and their nature.
| Component | Commercial | Custom made |
|---|---|---|
| Camera system | Hasselblad H6D-400C multi-shot camera | - |
| Column stand | Lupo Repro 3, equipped with a Manfrotto 410 geared head | Modified with reinforced welded steel sheet base and made sturdier with additional bracing elements attached to the structure |
| Light system | 16 Relio2 single LED lamps (gathered in 4 groups consisting in 4 lights each) | - |
| Light support | - | Custom 3D printed joints placed on four detachable arms using 20 x 20 x 1 mm. hollow aluminum extrusions |
| Flat acquisition surface | - | 900 x 650 x 32 mm. medium-density panels, with laser engraved reference system |
| Darkening system | Introduced with a guide at the top of the arms to hold a black drape |
Table 3.
Components used to assemble the first prototype and their nature.
| Component | Commercial | Custom made |
|---|---|---|
| Camera system | Hasselblad H6D-400C multi-shot camera | - |
| Column stand | Manfrotto 809 Salon 230, 280 cm height, equipped with a Manfrotto 410 geared head | - |
| Light system | 32 Relio2 single LED lamps (gathered in 8 groups consisting in 4 lights each) | - |
| Light support | - | Custom 3D printed joints placed on four arms made of n. 12, 20 x 20 x 1 mm. hollow aluminum extrusions |
| Flat calibration surface | - | medium-density panel, with laser engraved reference system hosted on a vertical aluminum frame |
Table 4.
A general response of the systems to an inclined central edge.
| Value1 | Prototype for horizontal acquisitions | Prototype for vertical acquisitions |
|---|---|---|
| MTF50 | 0.1300 (Hasselblad H6D-400C) 0.119 (Hasselblad X2D-100C) |
0.165 (Hasselblad H6D-400C) 0.308 (Hasselblad X2D-100C) |
| MTF10 | 0.228 (Hasselblad H6D-400C) 0.119 (Hasselblad X2D-100C) |
0.277 (Hasselblad H6D-400C) 0.556 (Hasselblad X2D-100C) |
| Efficiency | 0.314 (Hasselblad H6D-400C) 0.475 (Hasselblad X2D-100C) |
0.662 (Hasselblad H6D-400C) 1.230 (Hasselblad X2D-100C) |
1 General value calculated in laboratory on a central area of an ISO 12233:2000 test chart after a comparison with values on both lateral sides to check planarity. Both cameras used were equipped with a 120 mm. Hasselblad lens set.
Table 5.
The linear evolution of the main sizes of prototypes and their usage area, with the time necessary to perform the acquisitions.
Table 5.
The linear evolution of the main sizes of prototypes and their usage area, with the time necessary to perform the acquisitions.
| Year | Prototype usability area (bounding box) |
Time required for acquisition operations |
|---|---|---|
| 2014 (Venice) | About 4 x 4 x 3 mt. | 14 hours |
| 2018 (Florence) | About 2.5 x 3 x 2.8 mt. | 7 hours |
| 2019 (Milan) | About 2.5 x 3 x 2.8 mt. | 6 hours |
| 2021 (Milan) | About 1.5 x 1.5 x 2.8 mt.. | 4.5 hours |
| 2022 (Milan) | About 1.5 x 1.2 x 1.6 mt. | 3 hours |
Table 6.
Results for the use of different light sources using hardware and software tools developed.
Table 6.
Results for the use of different light sources using hardware and software tools developed.
| Osram fluorescent lamps1 | Godox LED lamps2 | Relio2 LED lamps3 |
|---|---|---|
| ΔE00 mean = 1.47 | ΔE00 mean = 1.17 | ΔE00 mean = 1.05 |
| ΔE00 max = 3.5 | ΔE00 max = 3.3 | ΔE00 max = 2.5 |
1 Two Lunarea LF-A220 illuminators with six 55W Osram Studioline fluorescent lamps each, 5600° K CCT, Color Rendering Index (CRI) above 85%. 2 Two Godox SL150III VideoLight LED illuminators, 5600° K CCT, Color Rendering Index (CRI) above 96%. 3 16 Relio2 LED lamps in groups of four, at the four sides of the rectangular capturing area.
Table 7.
Features of the cameras used.
| Rencay DiRECT Camera System 24k3 | Hasselblad H6D-400C (Multishot) |
Hasselblad X2D-100C | |
|---|---|---|---|
| Sensor name | Kodak KLI | Sony | Sony |
| Sensor type | CCD trilinear RGB | CMOS | CMOS |
| Sensor diagonal (mm) | 138.23 mm | 66.64 mm | 54.78 mm |
| Sensor Size | 72 × 118 mm | 53.4 × 40.0 mm | 43.8 × 32.9 mm |
| Image resolution | 13000 × 8000 px | 11600 × 8700 px | 11656 × 8742 |
| Pixel size | 9 μm | 4.6 μm | 3.76 μm |
| Focal length | 135 mm | 120 mm | 120 mm |
Table 8.
The evolution of the color accuracy with the adoption of the custom-built systems.
| Year | Prototype | General results1 |
|---|---|---|
| 2014 | First prototype for ancient drawings (horizontal) | ∆E00 mean = 1,34 ∆L mean = 0,14 |
| 2018 | Second prototype for ancient drawings (horizontal) | ∆E00 mean = 1,31 ∆L mean = 0,19 |
| 2019 | Second prototype for ancient drawings (horizontal, darkened) | ∆E00 mean = 1,33 ∆L mean = 0,21 |
| 2021 | Second prototype for ancient drawings (horizontal, darkened) | ∆E00 mean = 0,95 ∆L mean = 0,19 |
| 2022 | Second prototype for ancient drawings (horizontal, darkened) | ∆E00 mean = 0,94 ∆L mean = 0,19 |
| 2022 | Prototype for vertical paintings | ∆E00 mean = 0,85 ∆L mean = 0,18 |
1 Color accuracy determined with the CIE ∆E00 formula, using a Calibrite ColorChecker Classic.
Table 9.
Features of the cameras used.
| Nikon D5200 | iPhone X | |
|---|---|---|
| Sensor name | Sony | Sony Exmor RS IMX315 |
| Sensor type | APS-C CMOS | CMOS |
| Sensor diagonal (mm) | 28.21 | 6.15 |
| Sensor Size | 23.5 × 15.6 mm | 4.92 × 3.69 mm |
| Image resolution | 6000 × 4000 px | 4032 × 3024 px |
| Pixel size | 3.9 µm | 1.22 µm |
| Focal length | 18 mm., equivalent to 28 mm on a full-frame camera | 4 mm., equivalent to 28 mm on a full-frame camera |
Table 10.
Apple iPhone X vs. Nikon D5200 - ΔE00 evaluation.
| iPhone X | Nikon D5200 | |||||||
|---|---|---|---|---|---|---|---|---|
| ΔE00 Mean | ΔE00 Max | ΔL | Exposure error (f-stops) | ΔE00 Mean | ΔE00 Max | ΔL | Exposure error (f-stops) | |
| Porcupinefish | 3,67 | 8,11 | 2,52 | -0,04 | 2,79 | 6,79 | 1,72 | -0,03 |
| Horn d’Arturo’s Globe | 3,05 | 7,38 | 2,02 | -0,10 | 2,47 | 6,43 | 1,43 | -0,01 |
Table 11.
iPhone X camera calibration results using Agisoft Metashape calibration procedure and self-calibration in COLMAP: number of images used = 20; camera stations = 20; ground resolution = 0.090 mm/pix.
Table 11.
iPhone X camera calibration results using Agisoft Metashape calibration procedure and self-calibration in COLMAP: number of images used = 20; camera stations = 20; ground resolution = 0.090 mm/pix.
| Metashape | Colmap | |
|---|---|---|
| Reprojection error (pixel) | 0.176576 | 0.56433 |
| RMS error (pixel) | 0,9740 | 0.89169 |
| Total Error control points | 0.09 mm | 0.08 mm |
| F (Focal lenght) | 3319.06123 | 3331,1384425 |
| Cx (Principal point (x)) | 24.15132 | 25.354289 |
| Cy (Principal point (y)) | -4.88879 | -5.603050 |
| Radial K1 | 0.22259 | 0.106672 |
| Radial K2 | -1.25532 | -0.330726 |
| Tangential P1 | -0,00076 | -0.001048 |
| Tangential P2 | -0,001925 | -0.000411 |
Table 12.
Camera calibrated vs. uncalibrated comparison for the iPhone X camera: focal length 4 mm (35 mm eq. 28mm), ISO 100 f-stop 1.8.
Table 12.
Camera calibrated vs. uncalibrated comparison for the iPhone X camera: focal length 4 mm (35 mm eq. 28mm), ISO 100 f-stop 1.8.
| Porcupinefish | Horn d’Arturo’s Globe | |||
|---|---|---|---|---|
| Uncalibrated | Calibrated | Uncalibrated | Calibrated | |
| Mean BA reprojection error (px) | 0.66088 | 0.65838 | 0.57023 | 0.57203 |
| Numb. oriented images | 141/141 | 141/141 | 76/76 | 76/76 |
| Observations | 220,568 | 219,749 | 222,170 | 116,293 |
| Points | 50,390 | 50,422 | 42,881 | 24,976 |
| No. 3D points dense matching | 1,815,027 | 1,769,016 | 1,541,992 | 715,654 |
| Mean BA reprojection error (px) | 0.66088 | 0.65838 | 0.57023 | 0.57203 |
Table 13.
iPhone X vs. Ground truth models comparison.
| Comparison | Mean error | Standard deviation | Percentage of samples within ± 1 σ | |
|---|---|---|---|---|
| Porcupinefish | ||||
| iPhone X - Nikon D5200 | 0.077 mm | 0.897 mm | 81.99 % | |
| Horn d’Arturo’s Globe | ||||
| iPhone X - Nikon D5200 | 1.030 mm | 0.891 mm | 82.83 % |
Table 14.
Features of the camera used.
| Canon EOS 5D Mark III | |
|---|---|
| Sensor name | Sony |
| Sensor type | CMOS |
| Sensor diagonal (mm) | 43.27 |
| Sensor Size | 36 × 24 mm Full Frame |
| Image resolution | 5760 × 3840 px |
| Pixel size | 6.25 µm |
| Focal length | 100 mm |
Table 15.
Features of the cameras used.
| Canon EOS 5D Mark III | Hasselblad H6D-400C (Multishot) |
|
|---|---|---|
| Sensor name | Sony | Sony |
| Sensor type | CMOS | CMOS |
| Sensor diagonal (mm) | 43.27 | 66.64 mm |
| Sensor Size | 36×24 mm Full Frame | 53.4×40.0 mm |
| Image resolution | 5760×3840 px | 11600×8700 px |
| Pixel size | 6.25 µm | 4.6 μm |
| Focal length | 100 mm | 120 mm |
Disclaimer/Publisher’s Note: The statements, opinions and data contained in all publications are solely those of the individual author(s) and contributor(s) and not of MDPI and/or the editor(s). MDPI and/or the editor(s) disclaim responsibility for any injury to people or property resulting from any ideas, methods, instructions, or products referred to in the content. |
© 2023 by the authors. Licensee MDPI, Basel, Switzerland. This article is an open access article distributed under the terms and conditions of the Creative Commons Attribution (CC BY) license (http://creativecommons.org/licenses/by/4.0/).
Copyright: This open access article is published under a Creative Commons CC BY 4.0 license, which permit the free download, distribution, and reuse, provided that the author and preprint are cited in any reuse.


