
Submitted:
31 July 2023
Posted:
02 August 2023
You are already at the latest version
Abstract
Recently, the Internet of Things (IoT) has attracted wide attention from many fields, especially healthcare, because of its large capacities of information perception and collection. In this paper, we present an IoT-based home telehealth system for providing smart healthcare management for individuals, especially older people. Each client node of the system is mainly composed of an electronic water meter that records the user's daily water usage and an unobtrusive sleep sensor that monitors the user's physiological parameters during sleep such as heart rate (HR), respiratory rate (RR), body movement (BM), and states on the bed or outside the bed. The sleep sensor senses the biosignals and states by a sensor matrix composed of 12 piezoelectric sensors. The collected data can be transmitted to a remote centralized cloud service by a wireless home gateway for analyzing the living pattern and rhythm of users. Furthermore, the periodic feedback of results can be provided to users themselves as well as their family and health advisers. In the present study, data collections from a total of 18 older subjects were made for one year to evaluate the effectiveness of the proposed system. By analyzing living pattern and rhythm, preliminary results indicate the effectiveness of the telehealth system and suggest the potential of the system regarding improvement of quality of life (QoL) of older people and promotion of their health.
Keywords:
IoT
; ubiquitous healthcare
; telehealth system
; daily water usage
; sleep monitoring
; solitary 16 deaths
; Node-RED
1. Introduction
The world is experiencing rapid rates of aging population, which is manifested by an increasing median age in the population of a country or a region due to declining fertility rates and/or rising life expectancies. The rapidly aging global population has led to a significant increase in the prevalence of chronic diseases, such as asthma, chronic obstructive pulmonary disease (COPD), diabetes, heart failure and hypertension, resulting in the rapidly increasing need for medical and welfare service resources. However, very low fertility rates in many countries and regions have resulted in serious shortage of doctors, nurses, and home caregivers. The situation has forced the medical community to resort to current advanced technologies to solve the shortage of medical and welfare service resources.
Telehealth (also called as telemedicine) is one of the most recent forms of medical and healthcare services. Its purpose is to provide clinical health care from a distance by way of using information and communication/telecommunication technology (ICT). Telehealth refers to a broader spectrum of remote healthcare services. Therefore, telehealth is considered as one of the ways to solve the problems mentioned above. As a result of technological progress with the goal of meeting the needs of older people, various health care/monitoring systems have been developed and applied over the past two decades. The solutions include telephone-based [1,2], video [3,4], web-based [5,6,7,8], and telemetry/remote monitoring [9,10,11,12,13]. These solutions and technologies have the potential to change the way that health care is currently delivered [9,13,14,15,16], and many are in use in the clinical settings, improving the diagnosis and treatment of diseases and establishing the new healthcare management ways for individuals and healthcare providers and administrators.
In the last few years, the “concept” of the Internet of Things (IoT) has attracted attention from many fields including healthcare. Many researchers have addressed the potential of the IoT in the healthcare field by considering various practical challenges [17,18,19,20,21,22,23,24]. For example, Dziak et al. designed an approach for constructing an IoT-based information system for healthcare applications [25]. Park et al. proposed an IoT system for remotely monitoring patients at home [26]. Guan et al. developed a remote health monitoring system for collecting older people’s electrocardiogram (ECG) and motion signals based on smart home gateway equipment [27]. Similar to the two systems mentioned above, Abdelgawad et al. also implemented an IoT-based health monitoring system to support active and assisted living with a goal of improving older people’s lifestyle [28]. In addition, Kumar et al. designed and developed a wristwatch-based wireless sensor platform for IoT wearable health monitoring [29]. Although these systems and methods related to the IoT are helpful to more deeply understand the nature of IoT and its characteristics in healthcare, there is still a need for more referable cases that can render the practice methods in detail to the readers in the healthcare field.
In addition to telehealth’s basic function of telehealth monitoring, if it has more useful values or functions, there will be more feasible practical applications. Considering that solitary deaths or deaths of isolation, respectively referred to as “kodokushi” or “koritsushi” in Japanese, have recently been recognized as a social issue of concern in Japan [30,31], more efforts are needed to reduce the number of solitary deaths, especially for older people who are living alone and have lack of social contact and connections. IoT technology can play an important role in preventing or reducing the number of solitary deaths because some features of this kind of technology, such as continuous, low-cost, long-term monitoring. To the best of our knowledge, there were few referable cases that introduced IoT for solving the social issue of solitary deaths.
In the present article, the authors propose a novel IoT-based telehealth monitoring system not only to monitor the healthcare of users but also to potentially reduce the number of solitary deaths. Considering that solitary deaths typically occur at home, we constructed a telehealth monitoring system based on an electronic water meter for measuring the daily water usage and an unobtrusive sleep monitoring device for collecting the vital signs of users at night such as heart rate (HR), respiratory rate (RR) and body movement (BM), resulting in 24-hour seamless monitoring of lifestyles for users.
2. Materials and Methods
2.1. System Design
A centralized cloud service is the core of the system and it is responsible for (i) collecting and storing the vital sign data from client devices and (ii) analyzing and visualizing the data for giving feedback to users. The systemic diagram of the proposed system is illustrated in Figure 1. Data collection and storage in this system were constructed on a CentOS server and were implemented by using Node-RED, which is an open-source fundamental programming tool for IoT. Node-RED is a visual programming tool built on top of the Node.js server-side framework, which recently became very popular in the development of IoT applications, due to its flexibility in quickly creating the prototypes of a software system. Node-RED is also an event-processing engine that already includes building function nodes for message transmission based on Message Queuing Telemetry Transport (MQTT) protocol and PostgreSQL connections, as well as the possibility of writing ad-hoc Javascript functions to process the incoming/outgoing data, thus greatly simplifying and accelerating the development process.
As shown in Figure 1, the developed cloud service acts as an MQTT broker for distributed sensors and devices: upon reception of an MQTT measurements message from a client, the central service collects the data for vital signs during sleep and water usage to store in the PostgreSQL database. By utilizing the timer trigger function of the database, various data analyses can be timely executed to generate further derived data, and then the lightweight data is uploaded in real time to Amazon Web Services (AWS) to give timely feedback for users, their family or caregivers, and/or their doctors. For example, as a part of the systemic functions, once an abnormal condition is judged and detected, the server will automatically trigger a response to notify the predefined contact of the user so they can make a timely or emergency response. Figure 2 shows the module flow built using Node-RED for collecting and storing bed sensor and electronic water meter data in local PostgreSQL database and remote AWS in real-time.
2.2. Distributed Sensors
As a typical IoT-based system, the distributed sensors constituted the edge nodes of the proposed telehealth monitoring system. As shown in Figure 3 and Figure 4, each of the edge nodes mainly consists of a sleep monitoring sensor and an electronic water meter. The sleep monitoring sensor (Anshin Hitsuji, NJI Corp., Japan) is mainly composed of 12 piezoelectric sensors and a control circuit with LAN communication function. The piezoelectric sensors are arranged in a matrix and sealed in a soft and durable plastics container with dimensions of 800 mm × 100 mm × 5 mm. When the sleep monitoring sensor is placed under the body or the mattress during sleep,HR, RR, and BM can be measured. Whether a person is lying on the bed or not can also be judged through sensing the changes of pressures from piezoelectric sensors. The accuracies of HR and RR measured using the sensor reach 96.9 ± 0.1 % and 90.5 ± 0.7 %, respectively [32]. As a result, the sleep monitoring sensor transmits the measured HR, RR, BM and states whether the user is lying on the bed or not as well as measured time to our remote cloud service.
The electronic water meters (EKDA13, Azbil Kimmon Corp., Japan) were adopted to measure daily water usage. Each meter is composed of 8-bit telegraphic communication output, LSI, LCD, and a lithium battery. The exterior is similar to the conventional home-used water meter, but unlike the latter, it can indicate the cumulative water usage and transmit the data to the telecommunication metering system wirelessly, once for each predefined time interval, e.g., every hour. In order to enable our wireless home gateway to receive the water usage data from the electronic water meters, we designed a transformation interface circuit to receive the data and further to transmit them to our cloud service. A 3G communication unit with a SIM card is connected to the gateway and is responsible for communicating with the remote cloud service. Finally, the collected data are stored in a PostgreSQL database on the cloud services. The electronic water meter adopted in this work, as well as its transformation communication interface between the home gateway and the water meter, are shown in Figure 4. The obtained water data consists of consumed water volume (unit: liters), measured time, and an id for distinguishing the water meters. For the purpose of transmitting the two types of raw data from the sleep monitoring sensor and water meter, the JavaScript object notation (JSON) is adopted to facilitate data transmission between the client home gateway and Node-RED on remote servers.
2.3. Subjects and Sensor Settings
18 local older people (11 males and 7 females, 77.2 ± 6.6 years old) were recruited for this study, 10 of whom were selected to install electronic water meters (see Figure 4) in their homes. The characteristics of the subjects are summarized in Table 1. Sleep monitoring devices (see Figure 3) were set under either their mattress or a thick bed quilt. The electronic water meter was installed to connect to the original water meter of each subject’s home in series to measure daily water usage. Home gateways with 3G communication units were also set up at each subject’s household. This study was approved by the Ethics Committee of Nihon University Following a detailed explanation of the investigation objective, informed consent was obtained from each subject or their household before data collection.
2.4. Data Collection and Evaluation
Based on the raw data, four aspects of data analysis were performed to assess the proposed system.
2.4.1. Long-term measurement of HR and RR
HR was recorded in seconds on a beat-by-beat basis and RR was recorded on a breath-by-breath basis during sleep. The averaged HR and RR of each subject every night were calculated to track long-term changes and corresponding trends.
2.4.2. Measurement of BM
The accumulative time and times of BM duration during sleep change with sleep duration time. In the present study, we used the average BM rate (BMR) to assess the frequency of BM during sleep. The BMR was defined as the number of BM every hour. The BMR is considered as an index related to the quality of sleep [33]. The average BMR was calculated for each subject every night.
2.4.3. Measurement of daily water usage
The daily water usage data of each subject or their household were collected every hour. To understand their daily water usage habits, the variation of daily water usage was first analyzed. By analysis, we can see the time distributions of daily living activities including cooking, washing, bathing, and using the toilet. Further, we drew the time distributions of averaged water usage over 24-hour based on the one-year data to analyze the variation of water usage for outlining the regular pattern of water usage.
3. Results
As a result, the measurements of three kinds of vital signs during sleep for all subjects as well as their daily water usage data were made stably for one year from April 2016. In total, about 400,000,000 records were gathered. The typical data obtained from two subjects for a one day are shown in Figure 5, where it can be seen that the HR, RR, and BM profiles of each subject during sleep and water usage distributions over 24 hours. The short bars on the vertical axes indicate the time and duration of BM. By comparing the results, the different trends of HR in the two subjects during sleep can be observed, the top one is relatively stable and the bottom one seems to be jitter. Different sleep habits can be seen, such as th top lasting about 9.5 hours while leaving the bed one time and the bottom obtained about 7.5 hours of sleep while leaving 3 times maybe for going to the toilet. The top one did not only record sleep at night, but it also recorded the nap activity of the subject. Through the two examples above, it can be seen that the different living habits of users can be recorded using the proposed system.
Figure 6 shows the daily water usage of two subjects over one year. The Y axis denotes the volume of the daily consumed water in liters (L). The local area is in summer from June to August every year, and therefore it can be seen that the water usage during this period is relatively more than other times. The blank periods denote no record or data loss.
In order to analyze subjects’ daily habits and living patterns using water, we used the water usage data for about one year to generate the histograms of the averaged water usage each hour for the 10 subjects whose homes were set up with electronic water meters. These results are shown in Figure 7.
Figure 8 shows the histograms of sleep duration, latency, averaged HR, averaged RR, accumulated time of body movements, and leaving times of the subject with ID 13 while sleeping at night for one year. In order to track the long-term changes of the physical conditions of the subjects, we drew the nightly averaged HR and RR as well as their standard deviations of subjects. A typical example is shown in Figure 9. In the figure, the vertical axis denotes HR (beat/min) and RR (breath/min). The curves and vertical bars with short horizontal lines at their upper and lower ends indicate the averaged values and standard deviations of detected HR and RR for the corresponding day.
Figure 10 shows the trends of HR, RR, and BM from the subject with ID 13 during sleep for four days using a web-based GUI.
4. Discussion
The goal of this study was to provide a solution that would allow older people to maintain their autonomy and to increase their quality of life (QoL) as well as being able to notify and contact the designated people in the case of an emergency so that solitary death can be avoided as much possible. The reliability of data measurement for the telehealth monitoring system is a crucial factor. Whether the system is effective depends on several major factors, including accurate, long-term measurements of vital signs, timely data analysis and feedback, and rapid response when an emergency is detected. For the telehealth monitoring system, data measurements and collections can be achieved unconstrainedly unlike wearable devices that need users to wear, like Fitbits and smartwatches. Wearable devices are designed to collect the data of users’ personal health, but their inconveniences are easy to forget to wear for users, especially older people. Therefore, the continuity of the long-term monitoring way proposed in the present article is ensured because of no requiring cumbersome operations and being not forgotten. Other types of measurement devices of vital signs, for example blood pressure monitors with Bluetooth communication [34] and wearable watch [35] are compatible to the proposed system, but they were not adopted in the current system due to their obtrusiveness and intrusiveness of usage.
Simple water usage data may not reflect the health conditions of users directly, but long-term information can be used to analyze and judge whether the daily living pattern of the users is regular or not because a regular life is generally important for everyone, espeically older people. For example, when no water usage over a certain time interval, e.g., 12 hours, for older people living alone and rarely leaving their home, it maybe means that they had suddenly suffered critical disease onset or a serious accident that made self-aid impossible. Therefore, the data can be used to detect some emergencies. Certainly, there are some limitations to this method because a relatively long time, for example, several hours, is usually required to detect an emergency, meaning that the method may be helpless for rescuing some critical patients due to serious diseases, such as heart attack and stroke.
Further data analysis and comparison based on the telehealth monitoring system can detect an abnormal state, living pattern and rhythm. For example, in Figure 7, it can be seen that the averaged water usage each hour between the subjects were significantly different, but most results clearly show water usage peaking twice in one day, i.e., two intervals of 7 to 12 o’clock and 16 to 20 o’clock. This reflects one aspect of subjects’ regular life, which is significant for their health. On the other hand, when an emergency was detected, a fast reaction from family members, relatives or assigned healthcare caregivers is necessary. This work was supported by the local city government to develop and evaluate a solution to maintain the autonomy of the local older people living alone or the older family needing support, e.g., regular visiting and cooking to improve their quality of life. Fast aging is a serious social problem in Japan, which is caused by current rapid aging and sub-replacement fertility. Based on the proposed telehealth monitoring system, older people can be monitored unobtrusively 24-hours a day but their privacy can also be protected as much as possible compared to other kinds of approaches, e.g., video monitoring systems [3,4]. The framework of the system is flexible and compatible with many other types of the collection methods of vital signs, such as infrared and doppler radar; thus, various telehealth monitoring systems can be rapidly derived and constructed to meet particular needs.
The proposed telehealth monitoring system is also helpful in preventing and quickly identifying solitary death (dying alone), which is an increasingly serious problem in Japan. According to the statistics [36] from the government of Japan, thousands of older people nationwide died alone every year. Solitary death results in high costs with regard to dealing with the remains and personal belongings of the person who died, which has very negative impact on their family and neighbors. The phenomenon of solitary death is mainly attributed to a decreasing proportion of older Japanese people who are living in multi-generational housing and are instead living alone [30,37]. Older people who live alone are more likely to lack social contacts with family and neighbors and are therefore more likely to die alone and remain undiscovered. By introducing the proposed telehealth monitoring system, the life rhythms and living patterns of the older people living alone can be recorded and analyzed. While remarkable changes are detected, early warning and decision support functions of this system can promptly notify their families and health advisors for acquiring further responses. The further work related to data analysis is still in progress and the results will be presented in the near future.
As mentioned above in Figure 6 and Figure 9, the whole procedure of data collection that lasted about one year suffered from data loss (several blank intervals) for several reasons below. First, the home gateway routers responsible for data communication were switched off accidentally by users. Second, data transmission units encountered troubles due to long-time communication overload. In addition, travelling away from home or hospitalization were also reasons for some data loss. Although there were several cases of data loss or blank periods, the time trend of daily water usage is clear and a changing of at-home activities can be identified using water usage. Because the continuity of the data is very important for predicting the risk of a potential disease or detecting an emergency state, we are currently working on resolving the problems mentioned above to maintain continuity of data, e.g., by detecting accidental interruption of power supply and by strengthening the load capacity of data transmission units.
In the present study we reported an IoT-based telehealth monitoring system that integrats the sleep monitoring sensors and electronic water meters based on Node-RED, which is an open-source integration framework for IoT-based application development. There are currently several alternative technologies or framework similar to Node-RED, such as Eclipse Kura and Flogo. Here, we gave an example of how to construct an IoT-based health monitoring system by using current popular IoT technologyies. We believe that more health monitoring system related to IoT will be constantly developed not only for older people and they will be helpful in strengthening people health and solving the shortage of doctors, nurses, and home caregivers. Moreover, it may be beneficial to construct a next-generation telemedicine system that can predict the levels of users’ health and the risks of some lifestyle-related diseases. Finally, the data that was collected from the sleeping sensor also has the potential to be used for the detection of many kinds of diseases such as cardiac arrhythmia, sleep apnea syndrome, and sleep disorders. Our research in to this area is still in progress and the results will be reported in the near future.
5. Conclusion
The increasing demand for home health care has resulted in the developments of various home telehealth monitoring systems based on IoT and ICT. By integrating an unconstrained sleep monitoring sensor and an electronic water meter, and connecting them with a centralized cloud service, we successfully constructed an IoT-based home telehealth monitoring system, which aims to monitor daily activities of users over the long term. Compared to the existing healthcare monitoring solutions, this system performs entirely unobtrusive measurements and provides continuous 24-hour monitoring. Our results demonstrate the validity of the proposed system for daily, unconstrained sleep monitoring and living activities; therefore, we consider it an ideal solution for long-term home healthcare monitoring. Finally, while users are living in their homes, sleep monitoring and water usage can be automatically, unconsciously recorded. This way demonstrates its convenience compared to monitoring methods based on traditional video/audio communication and/or wearable devices, and also suggests that the proposed unobtrusive telehealth monitoring system has great potential for supporting long-term home healthcare monitoring.
Author Contributions
Conceptualization, Z. Tang and L. Jiang; methodology, Z. Tang, and L. Jiang; software, Z. Tang; validation, Z. Tang and L. Jiang; data curation, L. Jiang; writing—original draft preparation, Z. Tang; writing—review and editing, X. Zhu, L. Jiang and M. Huang; visualization, L. Jiang; supervision, X. Zhu and M. Huang; project administration, Z. Tang. All authors have read and agreed to the published version of the manuscript.
Funding
This research was partially funded by grants-in-aid from the Koriyama Demonstration Experiment Project of Health Monitoring System 2016-2019, Koriyama City, Fukushima, Japan.
Institutional Review Board Statement
The study was conducted in accordance with the Declaration of Helsinki, and approved by the Ethics Committee of Southern TOHOKU Hospital, Fukushima, Japan.
Informed Consent Statement
Informed consent was obtained from all subjects involved in the study.
Data Availability Statement
Not applicable.
Acknowledgments
We thank Prof. Kaoru Sakatani for providing great support and Mr. Tadao Munakata, Mr. Katsuhiko Nishimaki, and Mr. Satoshi Maeda for their help in implementing Node-RED based data collection and AWS-based data analysis. We would also like to thank Dr. Lizhen Hu, Ms. Harumi Igarashi, Mr. Yuta Murayama, and Mr. Yutaka Sato for their advice and assistance during the course of this project.
Conflicts of Interest
The authors declare no conflict of interest.
References
- J. S. Grant et al.. Telephone Intervention With Family Caregivers of Stroke Survivors After Rehabilitation. Stroke 2002, 33, 2060–2065. [CrossRef]
- T. A. Badger et al.. Telephone-delivered health education and interpersonal counseling improve quality of life for Latinas with breast cancer and their supportive partners. Psycho-Oncology 2013, 22, 1035–1042. [CrossRef]
- P. T. Dick et al.. Participant satisfaction and comfort with multidisciplinary pediatric telemedicine consultations. Journal of Pediatric Surgery 1999, 34, 137 – 142. [CrossRef]
- D. Chan et al.. An Internet-based store-and-forward video home telehealth system for improving asthma outcomes in children. American Journal of Health-System Pharmacy 2003, 60, 1976–1981. [CrossRef]
- N. T. Artinian et al.. Pilot study of a Web-based compliance monitoring device for patients with congestive heart failure. Heart & Lung: The Journal of Acute and Critical Care 2003, 32, 226–233. [CrossRef]
- D. J. Wantland et al.. The effectiveness of Web-based vs. non-Web-based interventions: a meta-analysis of behavioral change outcomes. Journal of medical Internet research 2004, 6. [CrossRef]
- Lazakidou, A.A. Web-Based Applications in Healthcare and Biomedicine; Springer US, 2010.
- J. S. Dhillon et al.. Designing a web-based telehealth system for elderly people: An interview study in New Zealand. 2011 24th International Symposium on Computer-Based Medical Systems (CBMS), 2011.
- S. Ohta et al.. A health monitoring system for elderly people living alone. Journal of telemedicine and telecare 2002, 8, 151–156.
- DelliFraine, J.L.; Dansky, K. Home-based telehealth: a review and meta-analysis. Journal of telemedicine and telecare 2008, 14, 62–66. [CrossRef]
- Koch, S. Home telehealth–current state and future trends. International Journal of Medical Informatics 2006, 75, 565 – 576.
- X. Zhu et al.. Multimodality Sensor System for Long-Term Sleep Quality Monitoring. Telemedicine and e-Health 2010, 16, 244–253.
- L. Jiang et al.. Automatic sleep monitoring system for home healthcare. Proceedings of 2012 IEEE-EMBS International Conference on Biomedical and Health Informatics, 2012, pp. 894–897.
- Jaana, M.; Paré, G. Home telemonitoring of patients with diabetes: a systematic assessment of observed effects. Journal of Evaluation in Clinical Practice 2007, 13. [CrossRef]
- T. Tamura et al.. Preliminary study of a new home healthcare monitoring to prevent the recurrence of stroke. 2015 37th Annual International Conference of the IEEE Engineering in Medicine and Biology Society (EMBC), 2015, pp. 5489–5492.
- M. Weiner et al.. USing information technology to improve the health care of older adults. Annals of Internal Medicine 2003, 139, 430–436. [CrossRef]
- Hassanalieragh, M.; Page, A.; Soyata, T.; Sharma, G.; Aktas, M.; Mateos, G.; Kantarci, B.; Andreescu, S. Health monitoring and management using Internet-of-Things (IoT) sensing with cloud-based processing: Opportunities and challenges. 2015 IEEE international conference on services computing, 2015, pp. 285–292. [CrossRef]
- M. Hassanalieragh et al.. Health Monitoring and Management Using Internet-of-Things (IoT) Sensing with Cloud-Based Processing: Opportunities and Challenges. 2015 IEEE International Conference on Services Computing, 2015, pp. 285–292. [CrossRef]
- S. M. R. Islam et al.. The Internet of Things for Health Care: A Comprehensive Survey. IEEE Access 2015, 3, 678–708. [CrossRef]
- Y. YIN et al.. The internet of things in healthcare: An overview. Journal of Industrial Information Integration 2016, 1, 3 – 13.
- Scuro, C.; Sciammarella, P.F.; Lamonaca, F.; Olivito, R.S.; Carnì, D.L. IoT for Structural Health Monitoring. IEEE Instrumentation & Measurement Magazine 2018, 1094.
- Ruman, M.R.; Barua, A.; Rahman, W.; Jahan, K.R.; Roni, M.J.; Rahman, M.F. IoT based emergency health monitoring system. 2020 International Conference on Industry 4.0 Technology (I4Tech). IEEE, 2020, pp. 159–162.
- Siam, A.I.; Almaiah, M.A.; Al-Zahrani, A.; Elazm, A.A.; El Banby, G.M.; El-Shafai, W.; El-Samie, F.E.A.; El-Bahnasawy, N.A. Secure Health Monitoring Communication Systems Based on IoT and Cloud Computing for Medical Emergency Applications. Computational Intelligence and Neuroscience 2021, 2021. [CrossRef]
- Cao, S.; Lin, X.; Hu, K.; Wang, L.; Li, W.; Wang, M.; Le, Y. Cloud computing-based medical health monitoring IoT system design. Mobile Information Systems 2021, 2021. [CrossRef]
- D. Dziak et al.. IoT-Based Information System for Healthcare Application: Design Methodology Approach. Applied Sciences 2017, 7, 596.
- K. Park et al.. An IoT System for Remote Monitoring of Patients at Home. Applied Sciences 2017, 7, 260. [CrossRef]
- K. Guan et al.. A Remote Health Monitoring System for the Elderly Based on Smart Home Gateway. Journal of Healthcare Engineering 2017, 2017, 9 pages. [CrossRef]
- A. Abdelgawad et al.. IoT-Based Health Monitoring System for Active and Assisted Living. Smart Objects and Technologies for Social Good: Second International Conference, GOODTECHS 2016, Venice, Italy, 2017, pp. 11–20.
- Kumar, S.; Buckley, J.L.; Barton, J.; Pigeon, M.; Newberry, R.; Rodencal, M.; Hajzeraj, A.; Hannon, T.; Rogers, K.; Casey, D.; others. A wristwatch-based wireless sensor platform for IoT health monitoring applications. Sensors 2020, 20, 1675. [CrossRef]
- M. Nomura et al.. Isolation and unnatural death of elderly people in the aging Japanese society. Science & Justice 2016, 56, 80–83. [CrossRef]
- Nakazawa, E.; Yamamoto, K.; London, A.J.; Akabayashi, A. Solitary death and new lifestyles during and after COVID-19: wearable devices and public health ethics. BMC Medical Ethics 2021, 22, 1–10. [CrossRef]
- Z. Tang et al.. Preliminary Study of Sleep Quality Assessment for Elderly People Based on Unobtrusive Sleep Monitoring System. Transactions of Japanese Society for Medical and Biological Engineering 2017, 55Annual, 552–553.
- L. Lu et al.. Detection of body movements during sleep by monitoring of bed temperature. Physiological measurement 1999, 20, 137. [CrossRef]
- https://www.aandd.co.jp/adhome/products/me/ua767pbt-c.html, 2016 (accessed October 17, 2022).
- Y. Zheng et al.. Unobtrusive sensing and wearable devices for health informatics. IEEE Transactions on Biomedical Engineering 2014, 61, 1538–1554. [CrossRef]
- http://www8.cao.go.jp/kourei/whitepaper/w-2014/gaiyou/s1_2_6.html, 2014 (accessed October 17, 2022).
- S. Morita et al.. A Survey of Solitary Deaths in Japan for Shortening Postmortem Interval Until Discover. Prilozi 2015, 36, 47–51. [CrossRef]
Figure 1.
Systemic diagram of the proposed unobtrusive health monitoring system for home healthcare.
Figure 1.
Systemic diagram of the proposed unobtrusive health monitoring system for home healthcare.
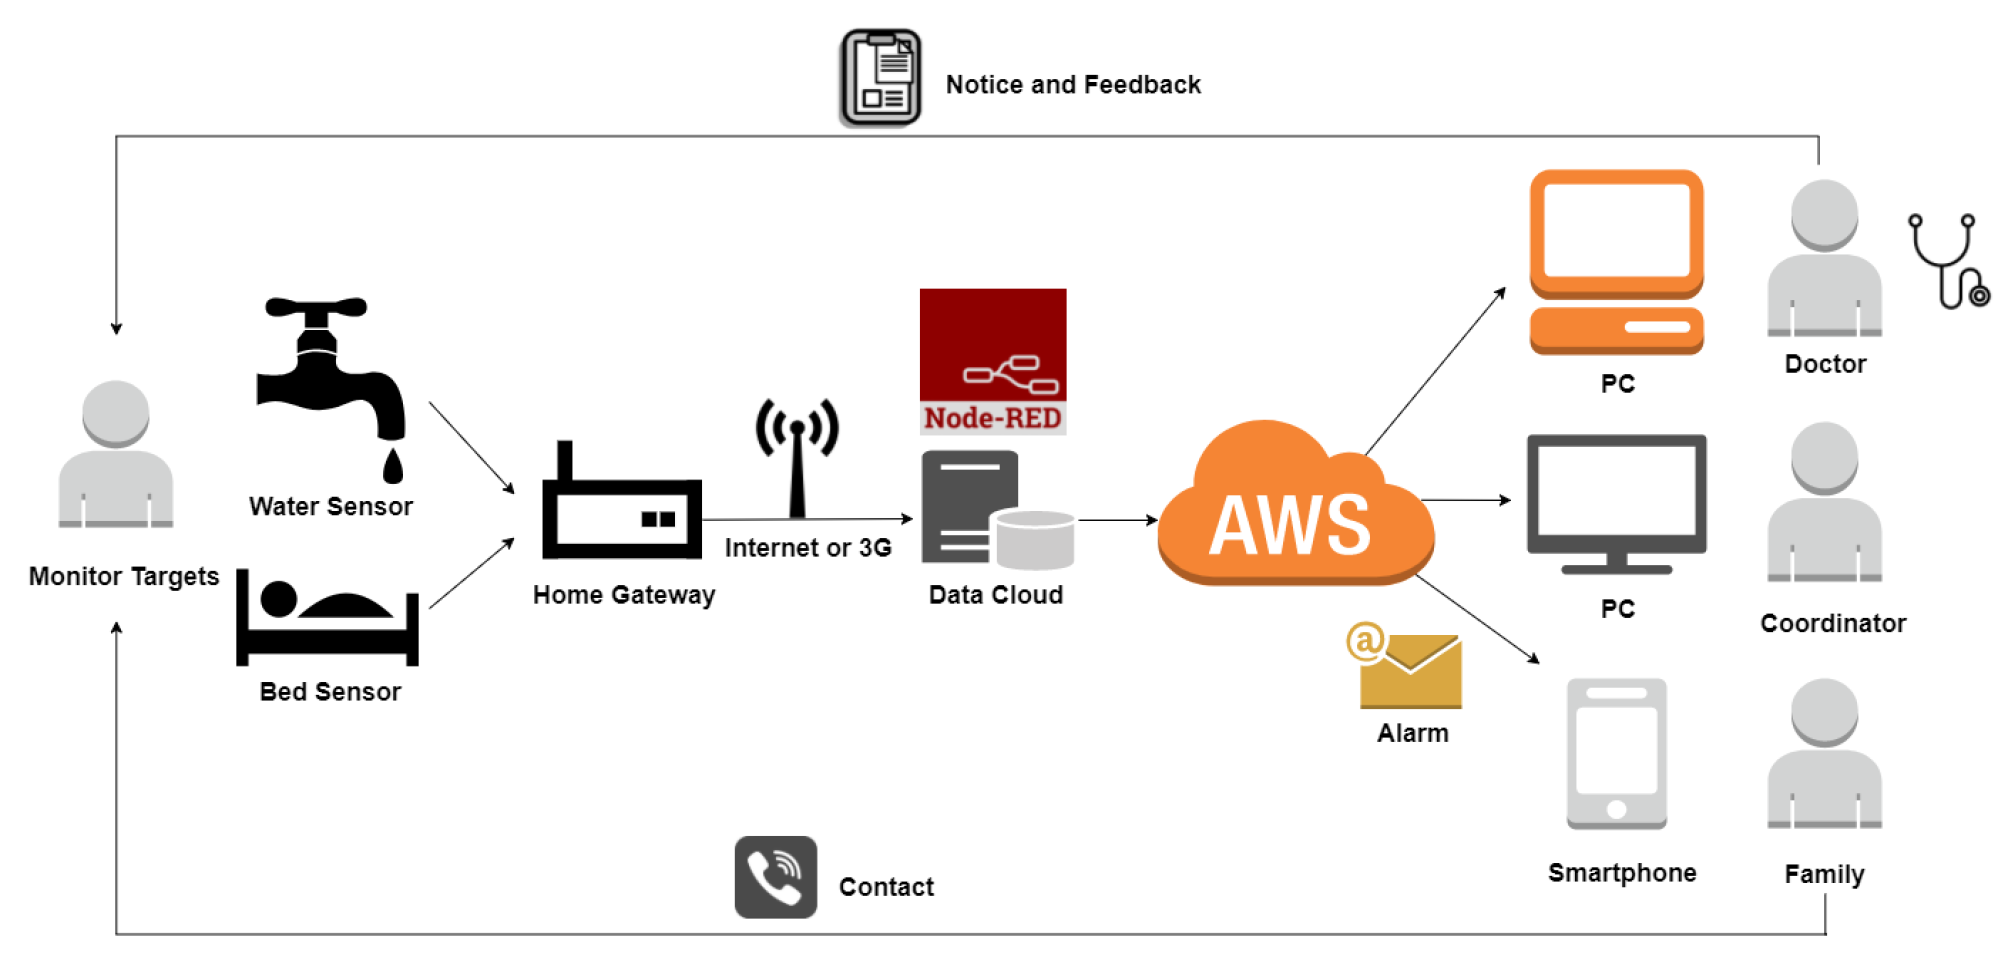
Figure 2.
The module flow built using Node-RED for data collection from the bed sensor and electronic water meter in real-time.
Figure 2.
The module flow built using Node-RED for data collection from the bed sensor and electronic water meter in real-time.
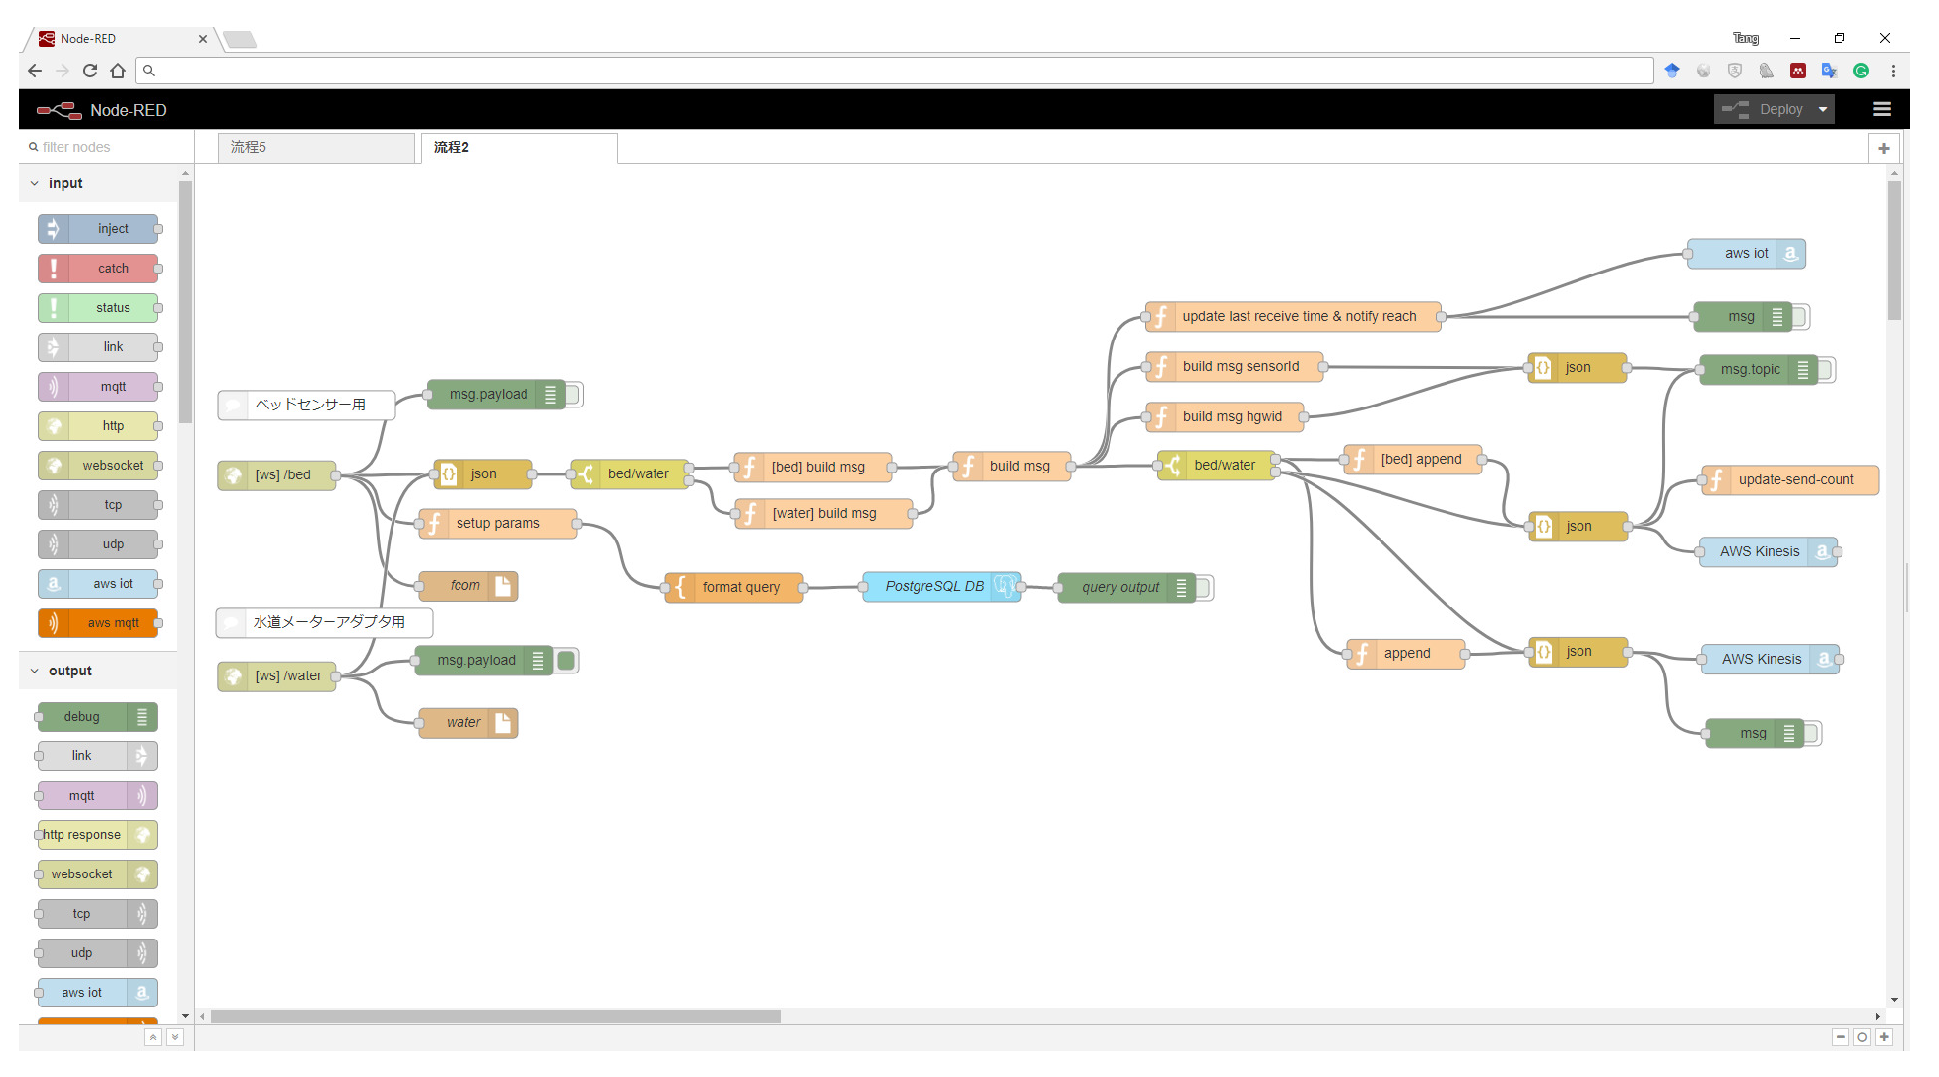
Figure 3.
The sleep monitoring sensor used in the research is mainly composed of 12 piezoelectric sensors as the upper image and a control circuit with LAN communication function as the bottom left image. The scenario of sleep monitoring sensor being placed on a bed is shown in the bottom right image.
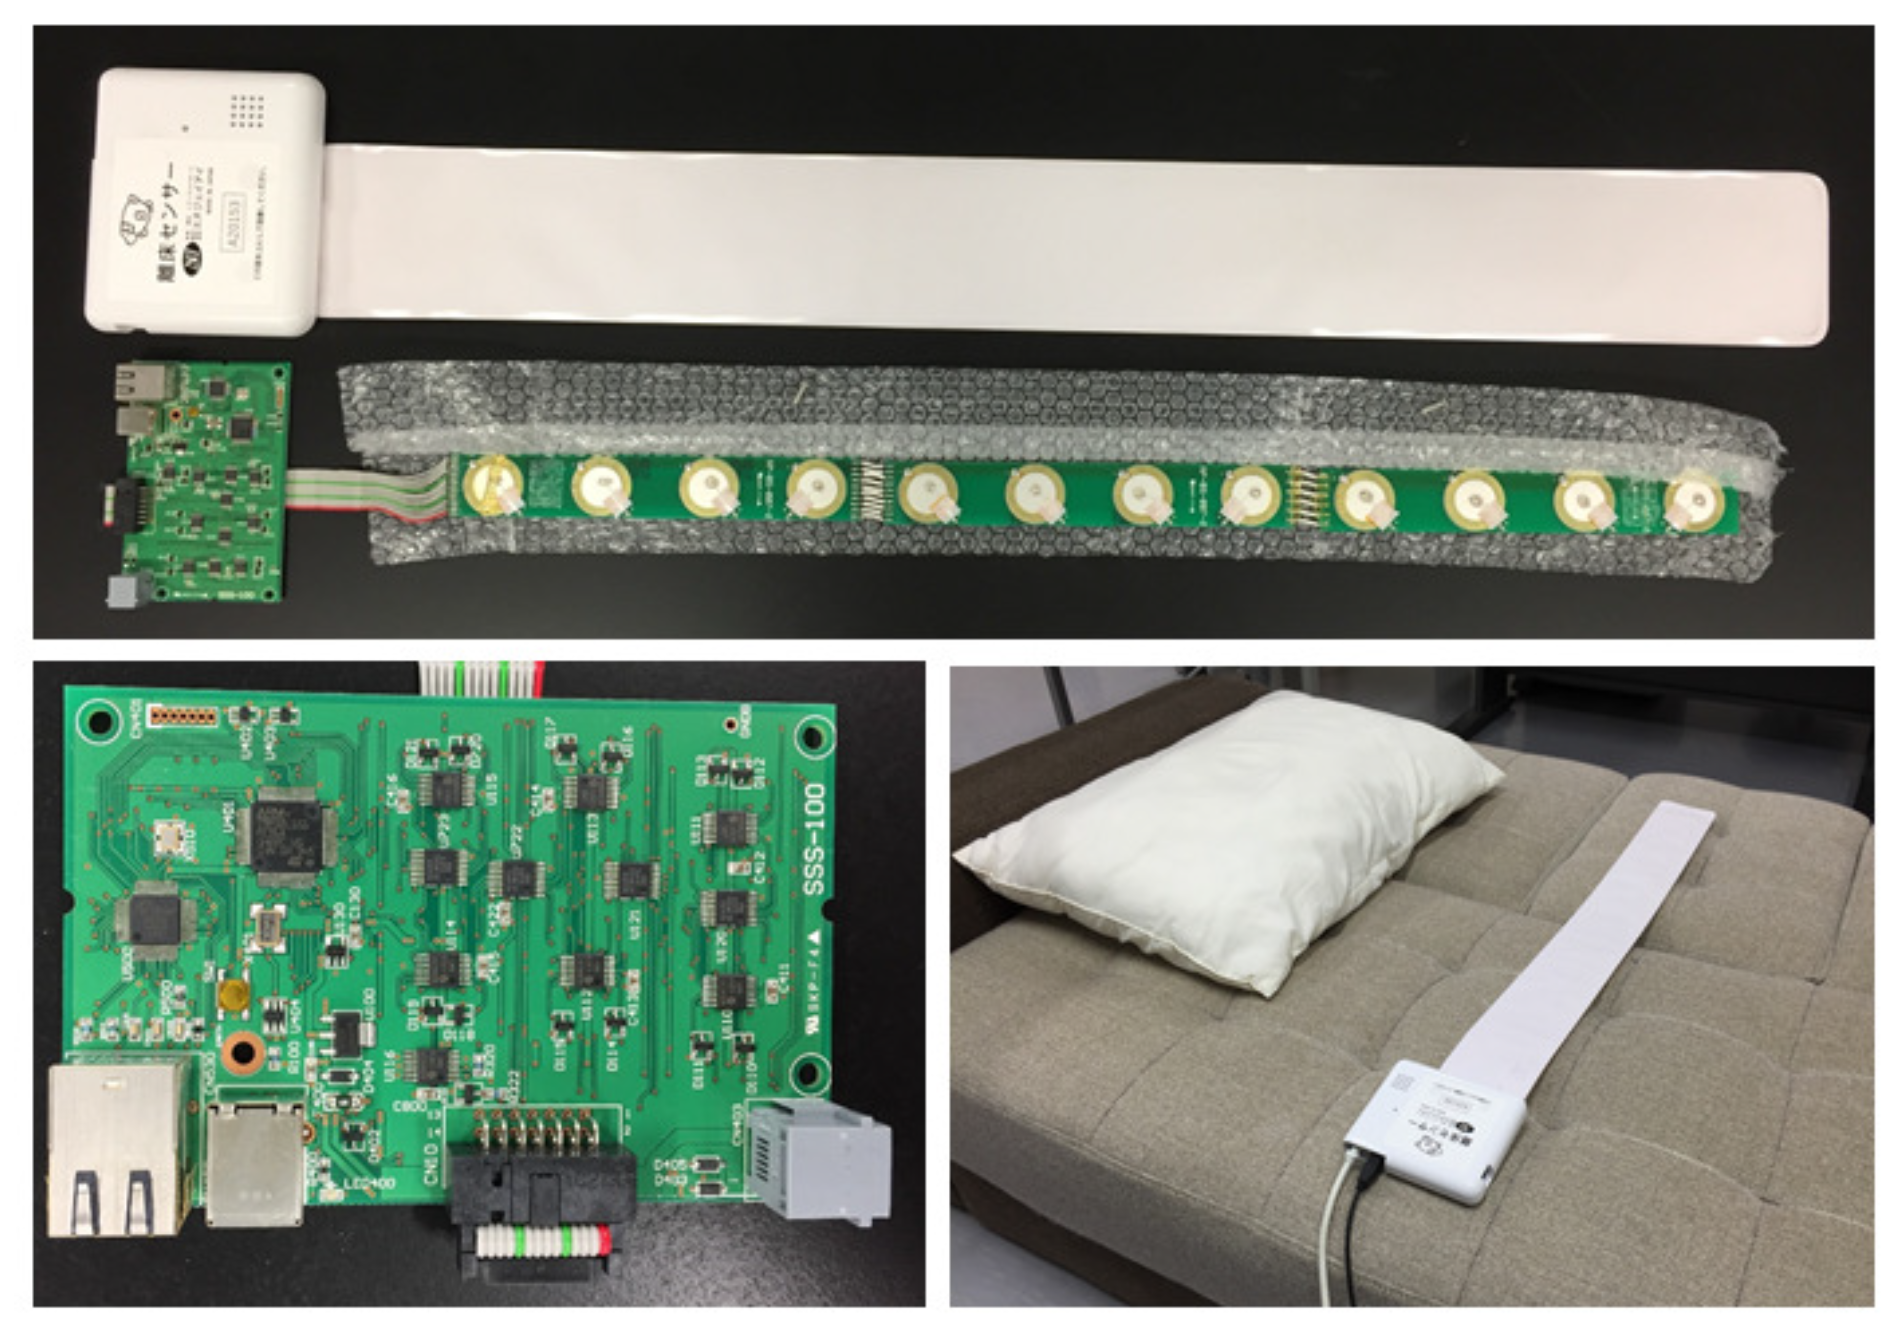
Figure 4.
The sleeping sensor (left) and water meter (right) used in the health monitoring system.
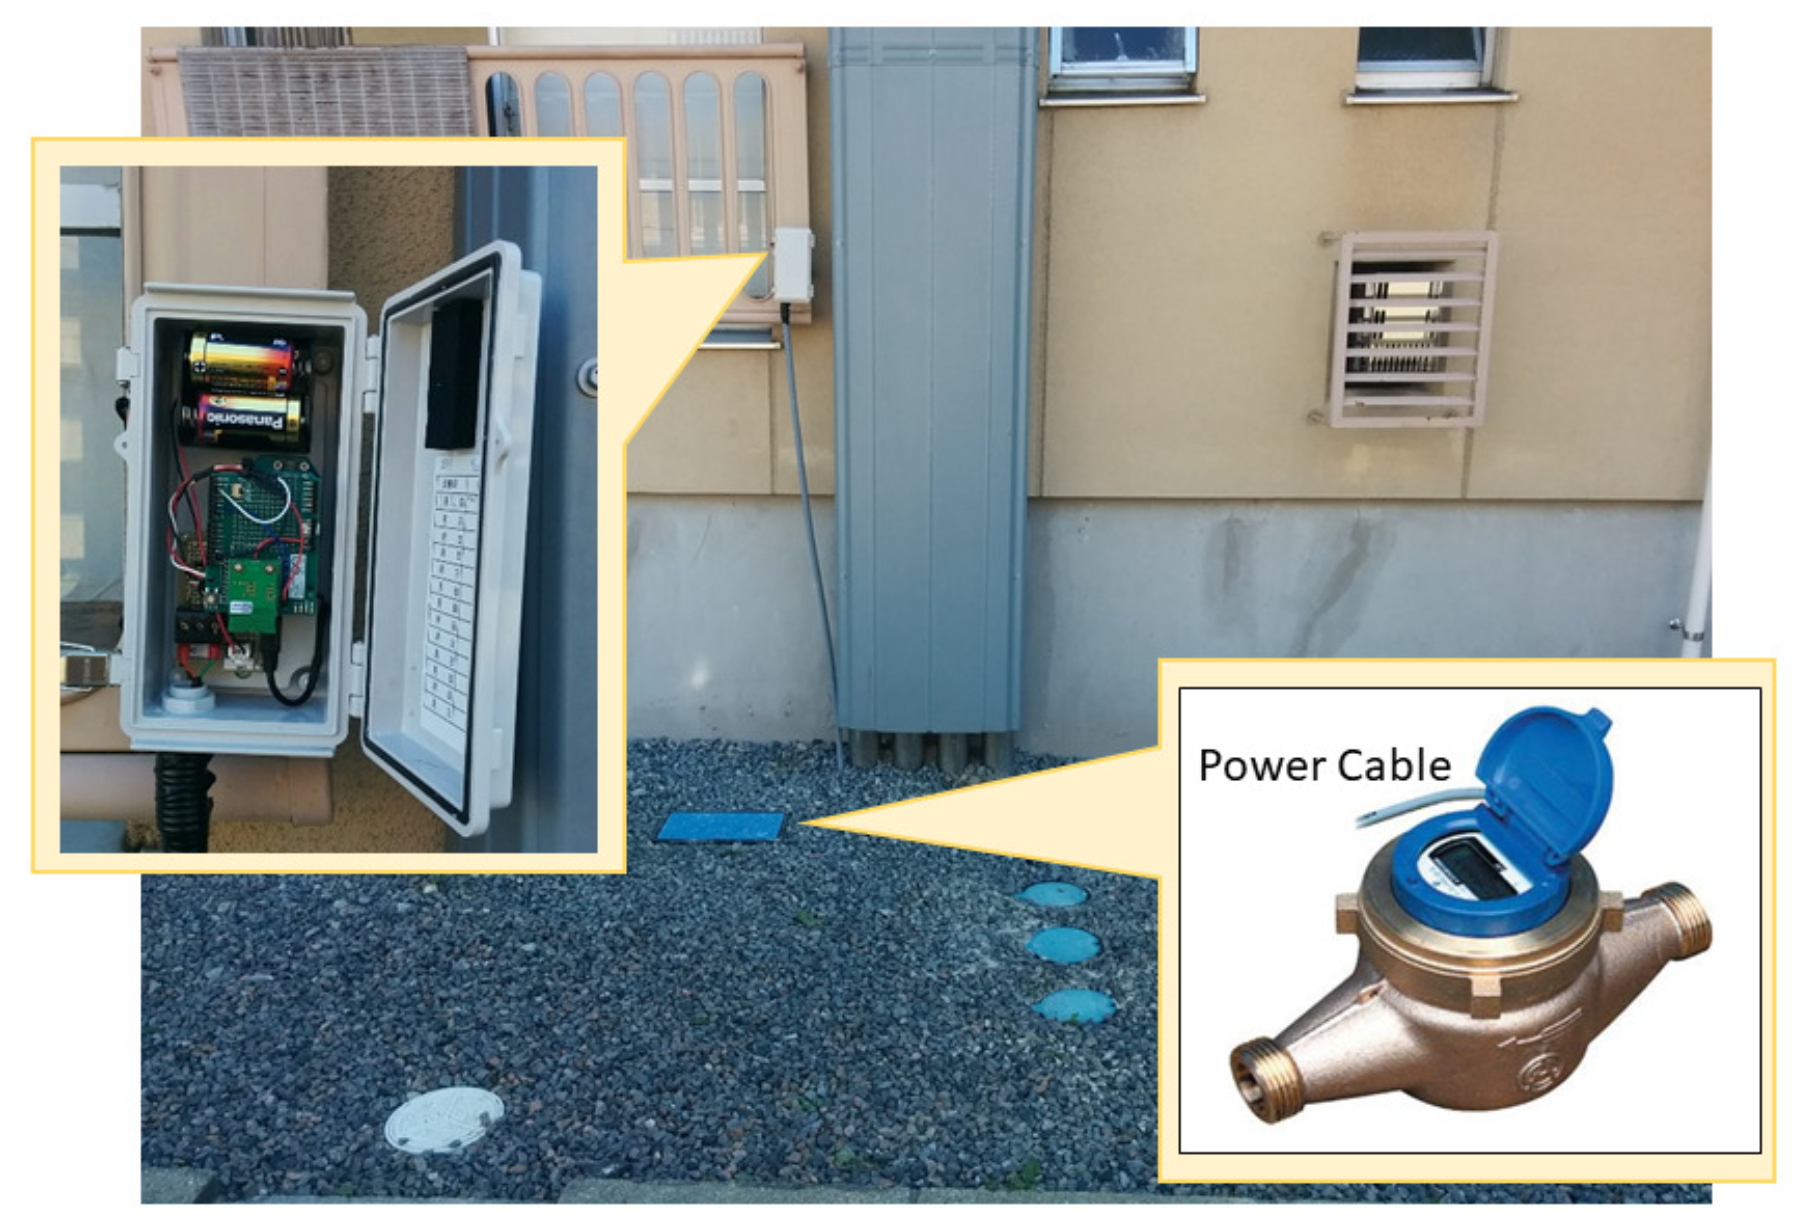
Figure 5.
Typical trends of HR, RR, BM, and water usage from two different subjects with time for one sleep cycle. Note that the measured time of data sent from water meters are not the same.
Figure 5.
Typical trends of HR, RR, BM, and water usage from two different subjects with time for one sleep cycle. Note that the measured time of data sent from water meters are not the same.
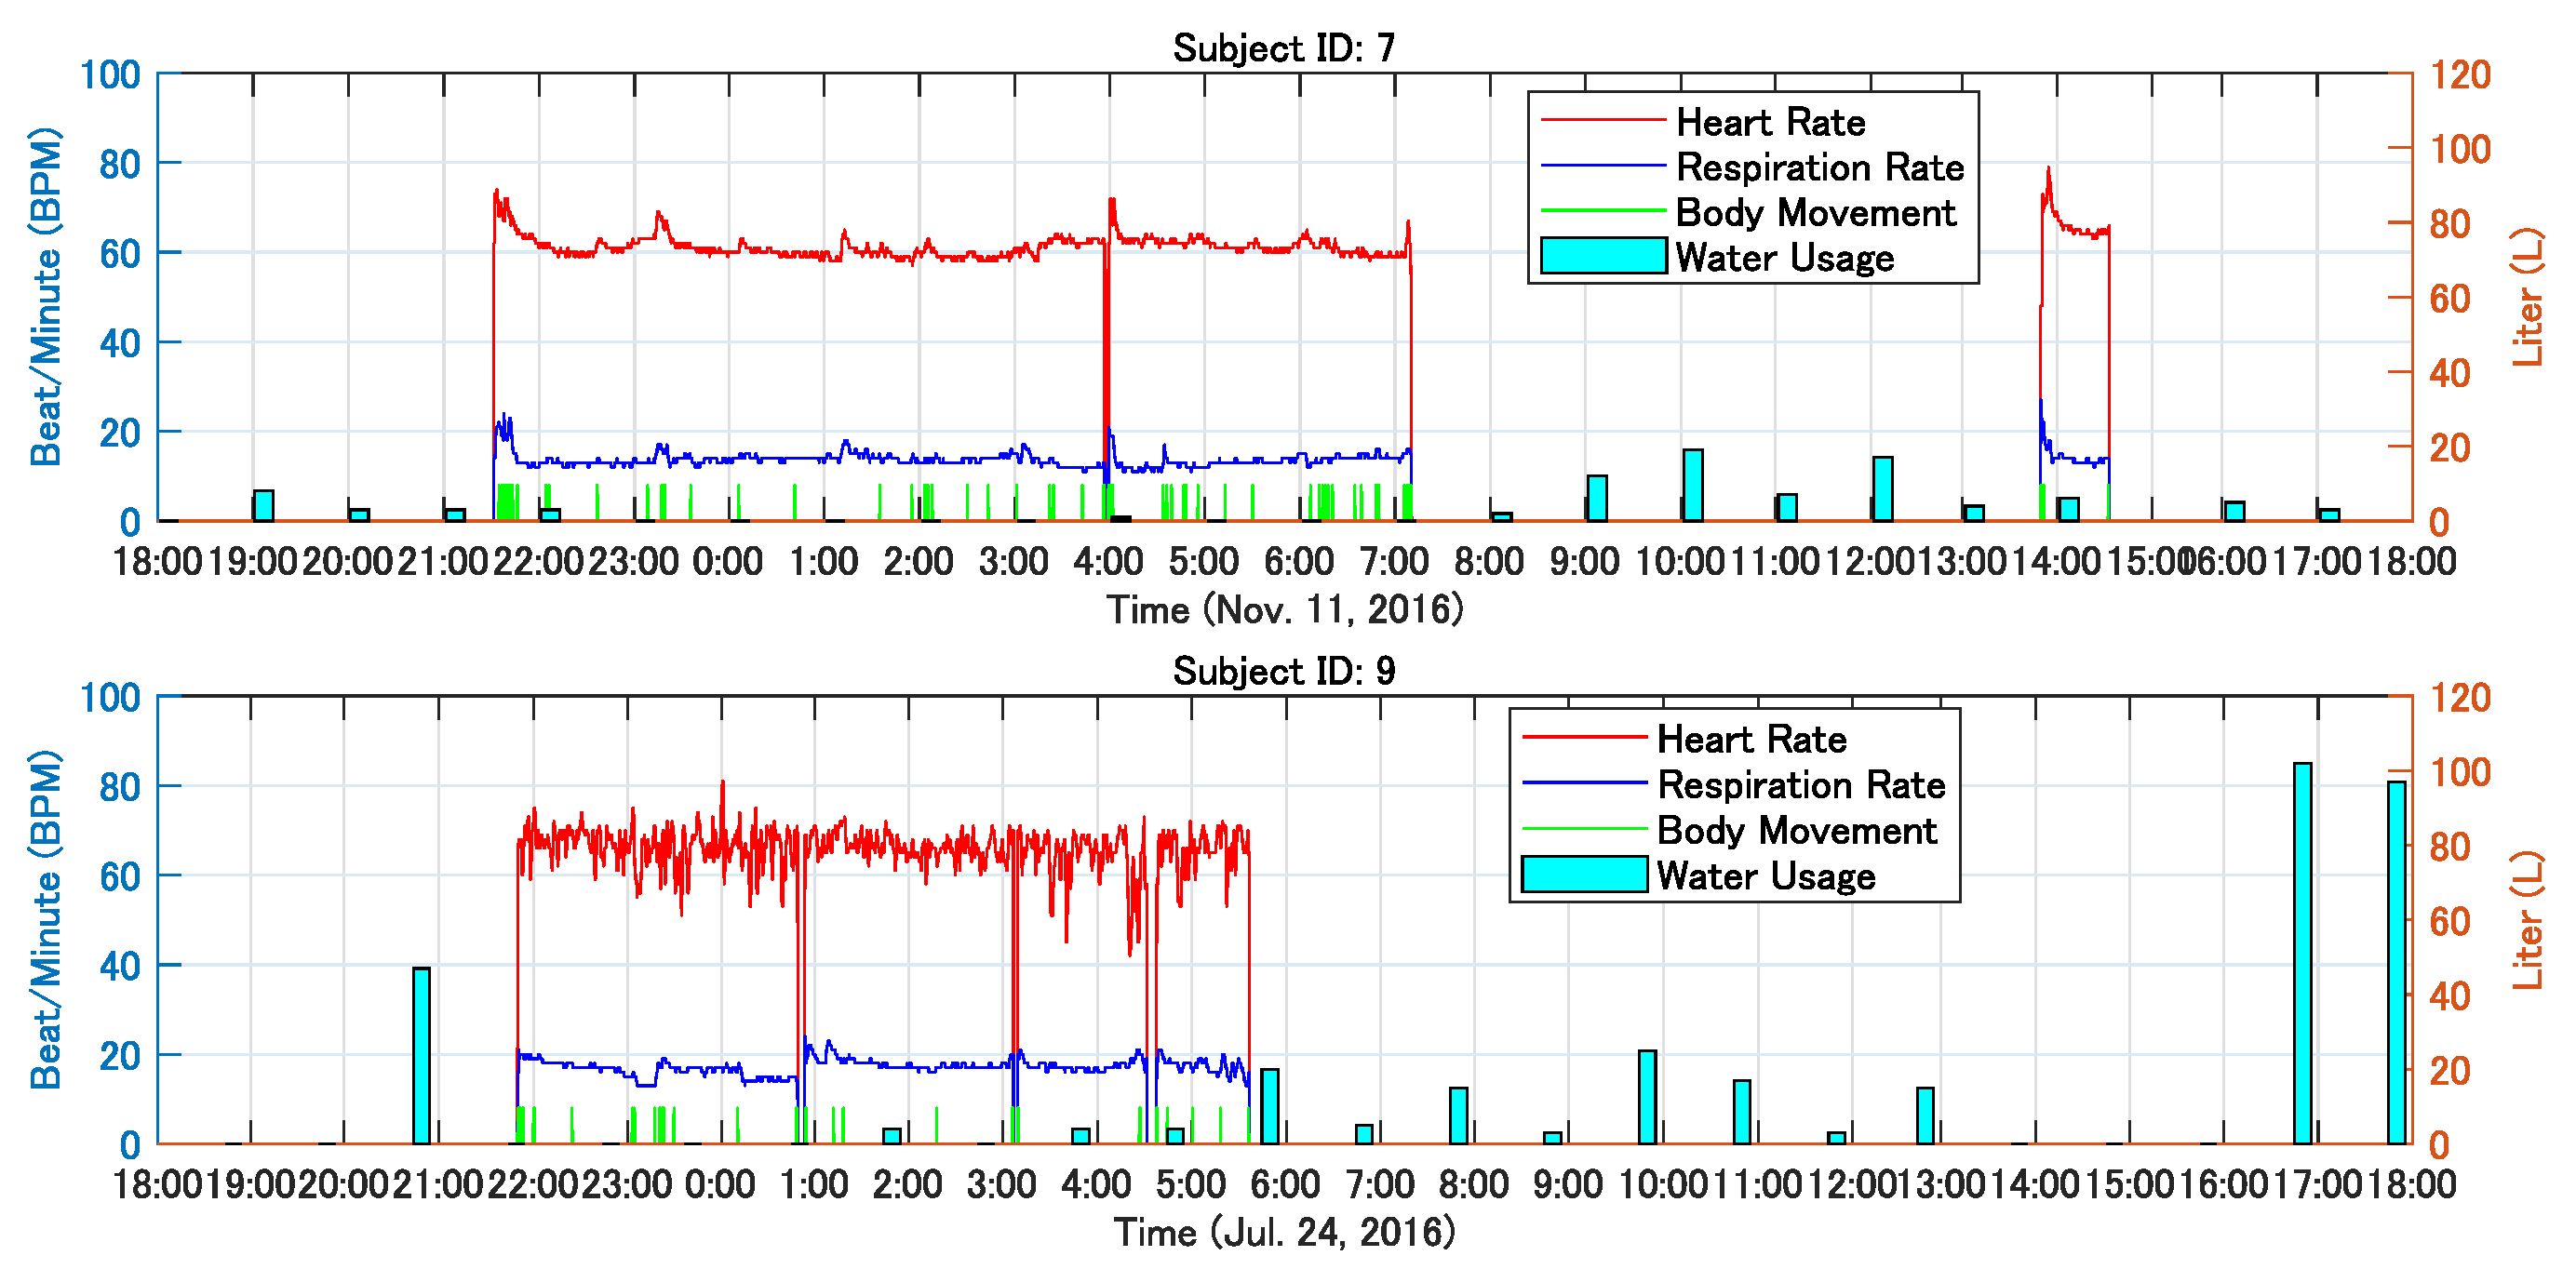
Figure 6.
Trends of the daily water usage from two subjects, respectively. X axis shows the period of about one year.
Figure 6.
Trends of the daily water usage from two subjects, respectively. X axis shows the period of about one year.
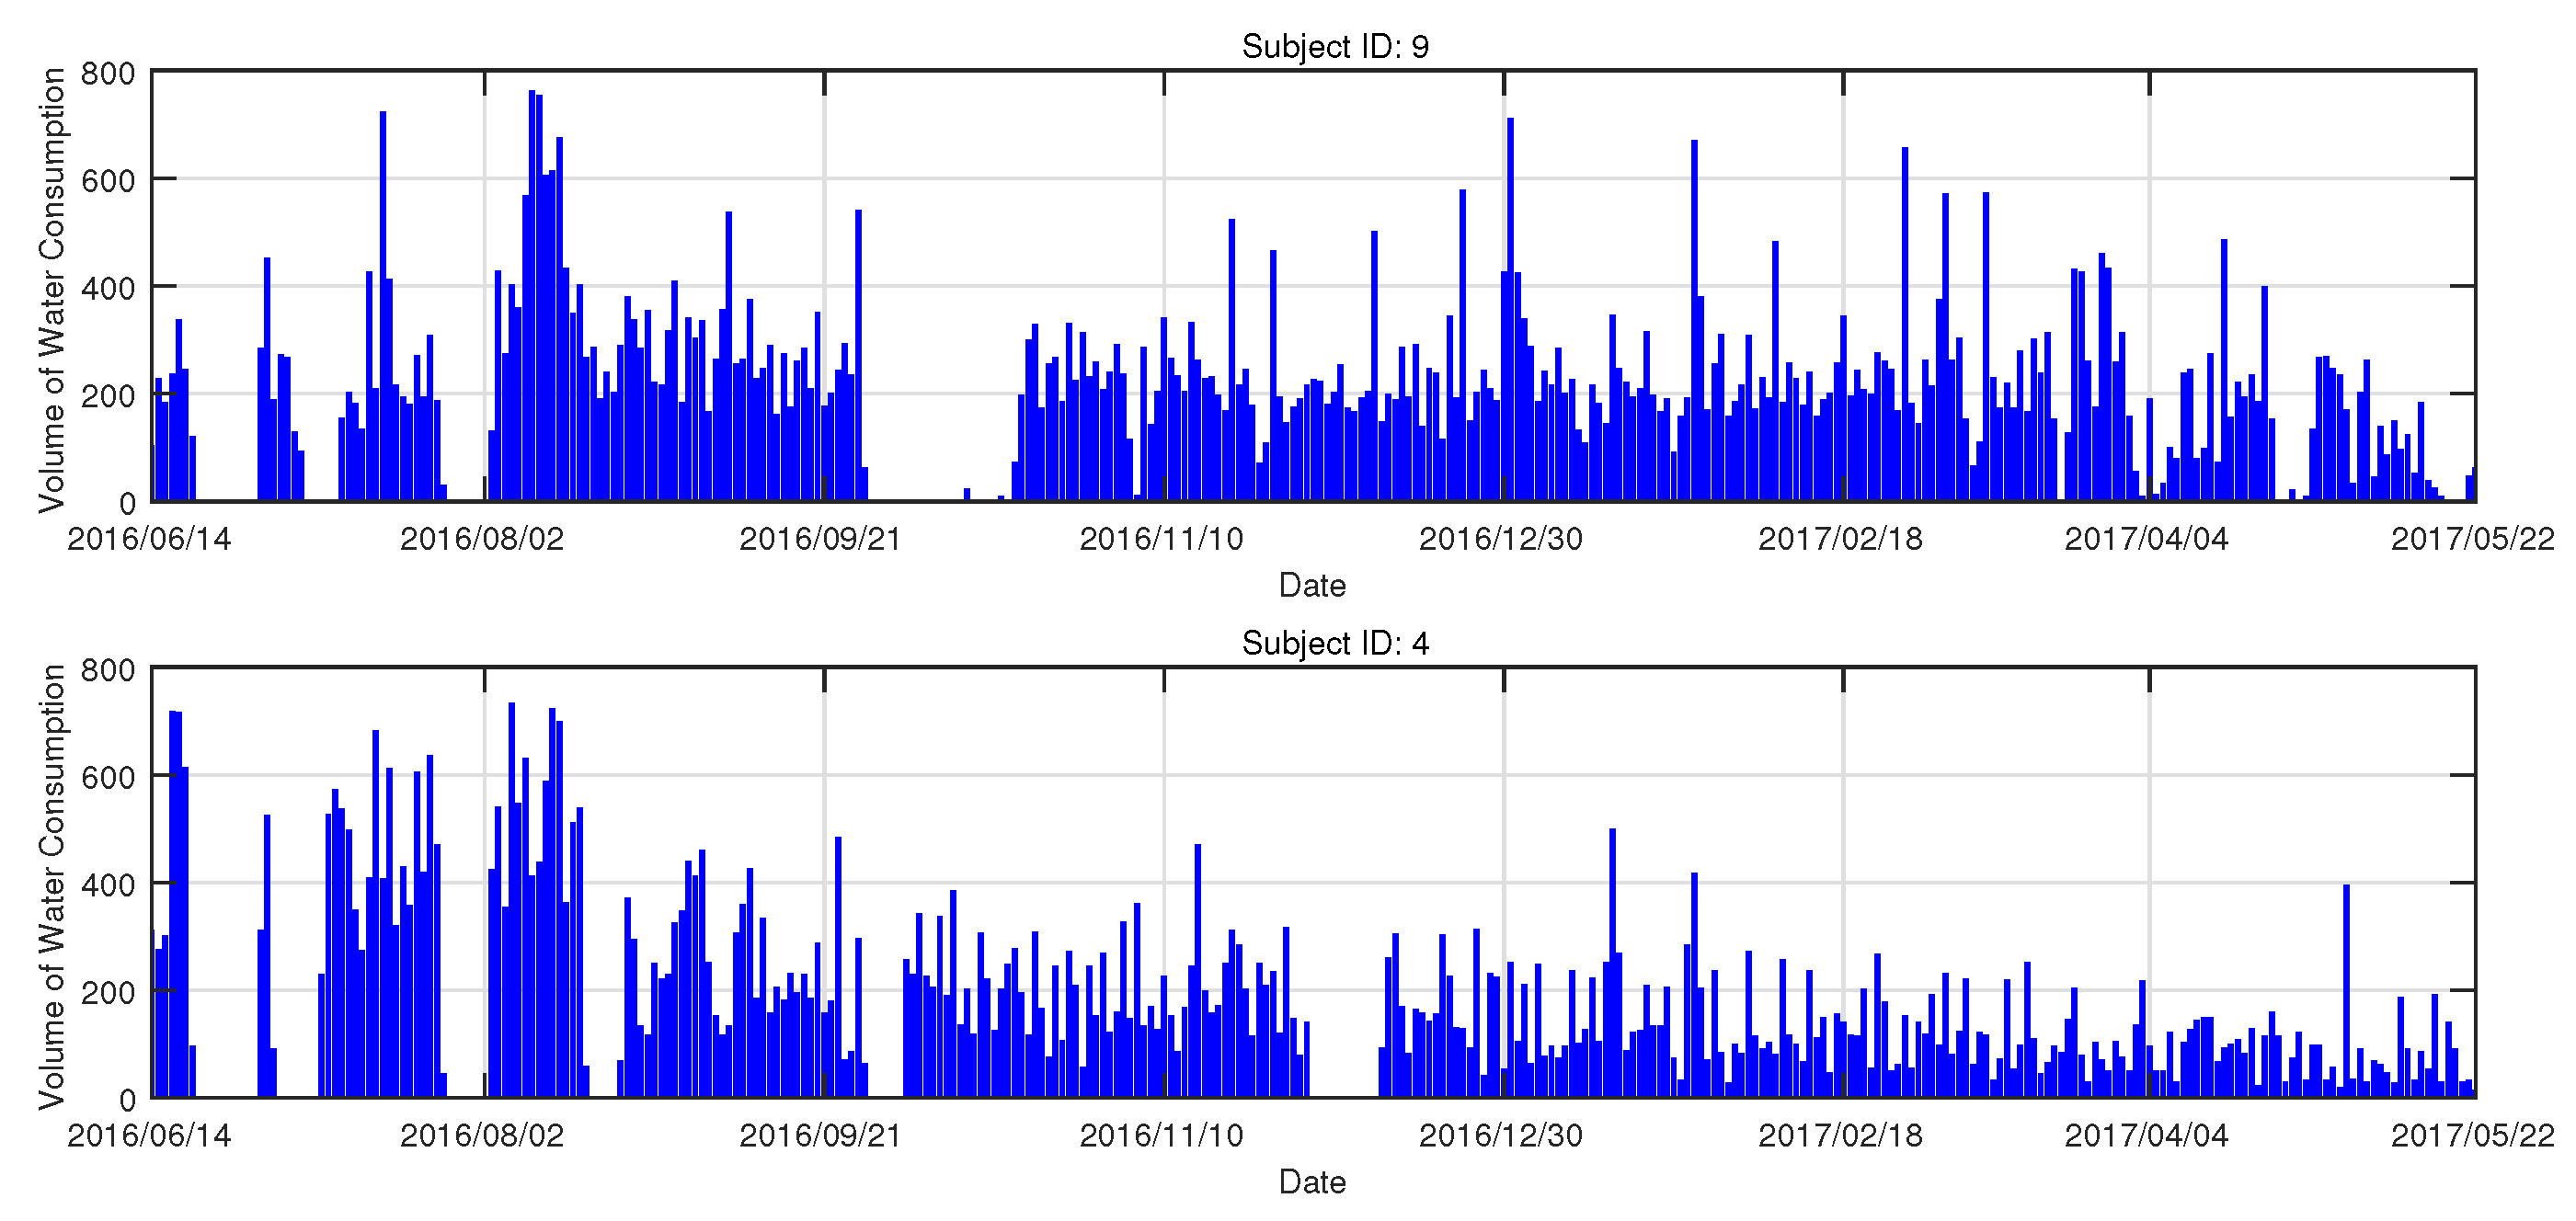
Figure 7.
The histograms of the averaged water usage per hour over one year for ten subjects whose homes were set up with electronic water meters. The subfigures of subjects with ID 2, 4, 5, 6, 8, 9, and 16, respectively, show the character of typical double peak water usage.
Figure 7.
The histograms of the averaged water usage per hour over one year for ten subjects whose homes were set up with electronic water meters. The subfigures of subjects with ID 2, 4, 5, 6, 8, 9, and 16, respectively, show the character of typical double peak water usage.
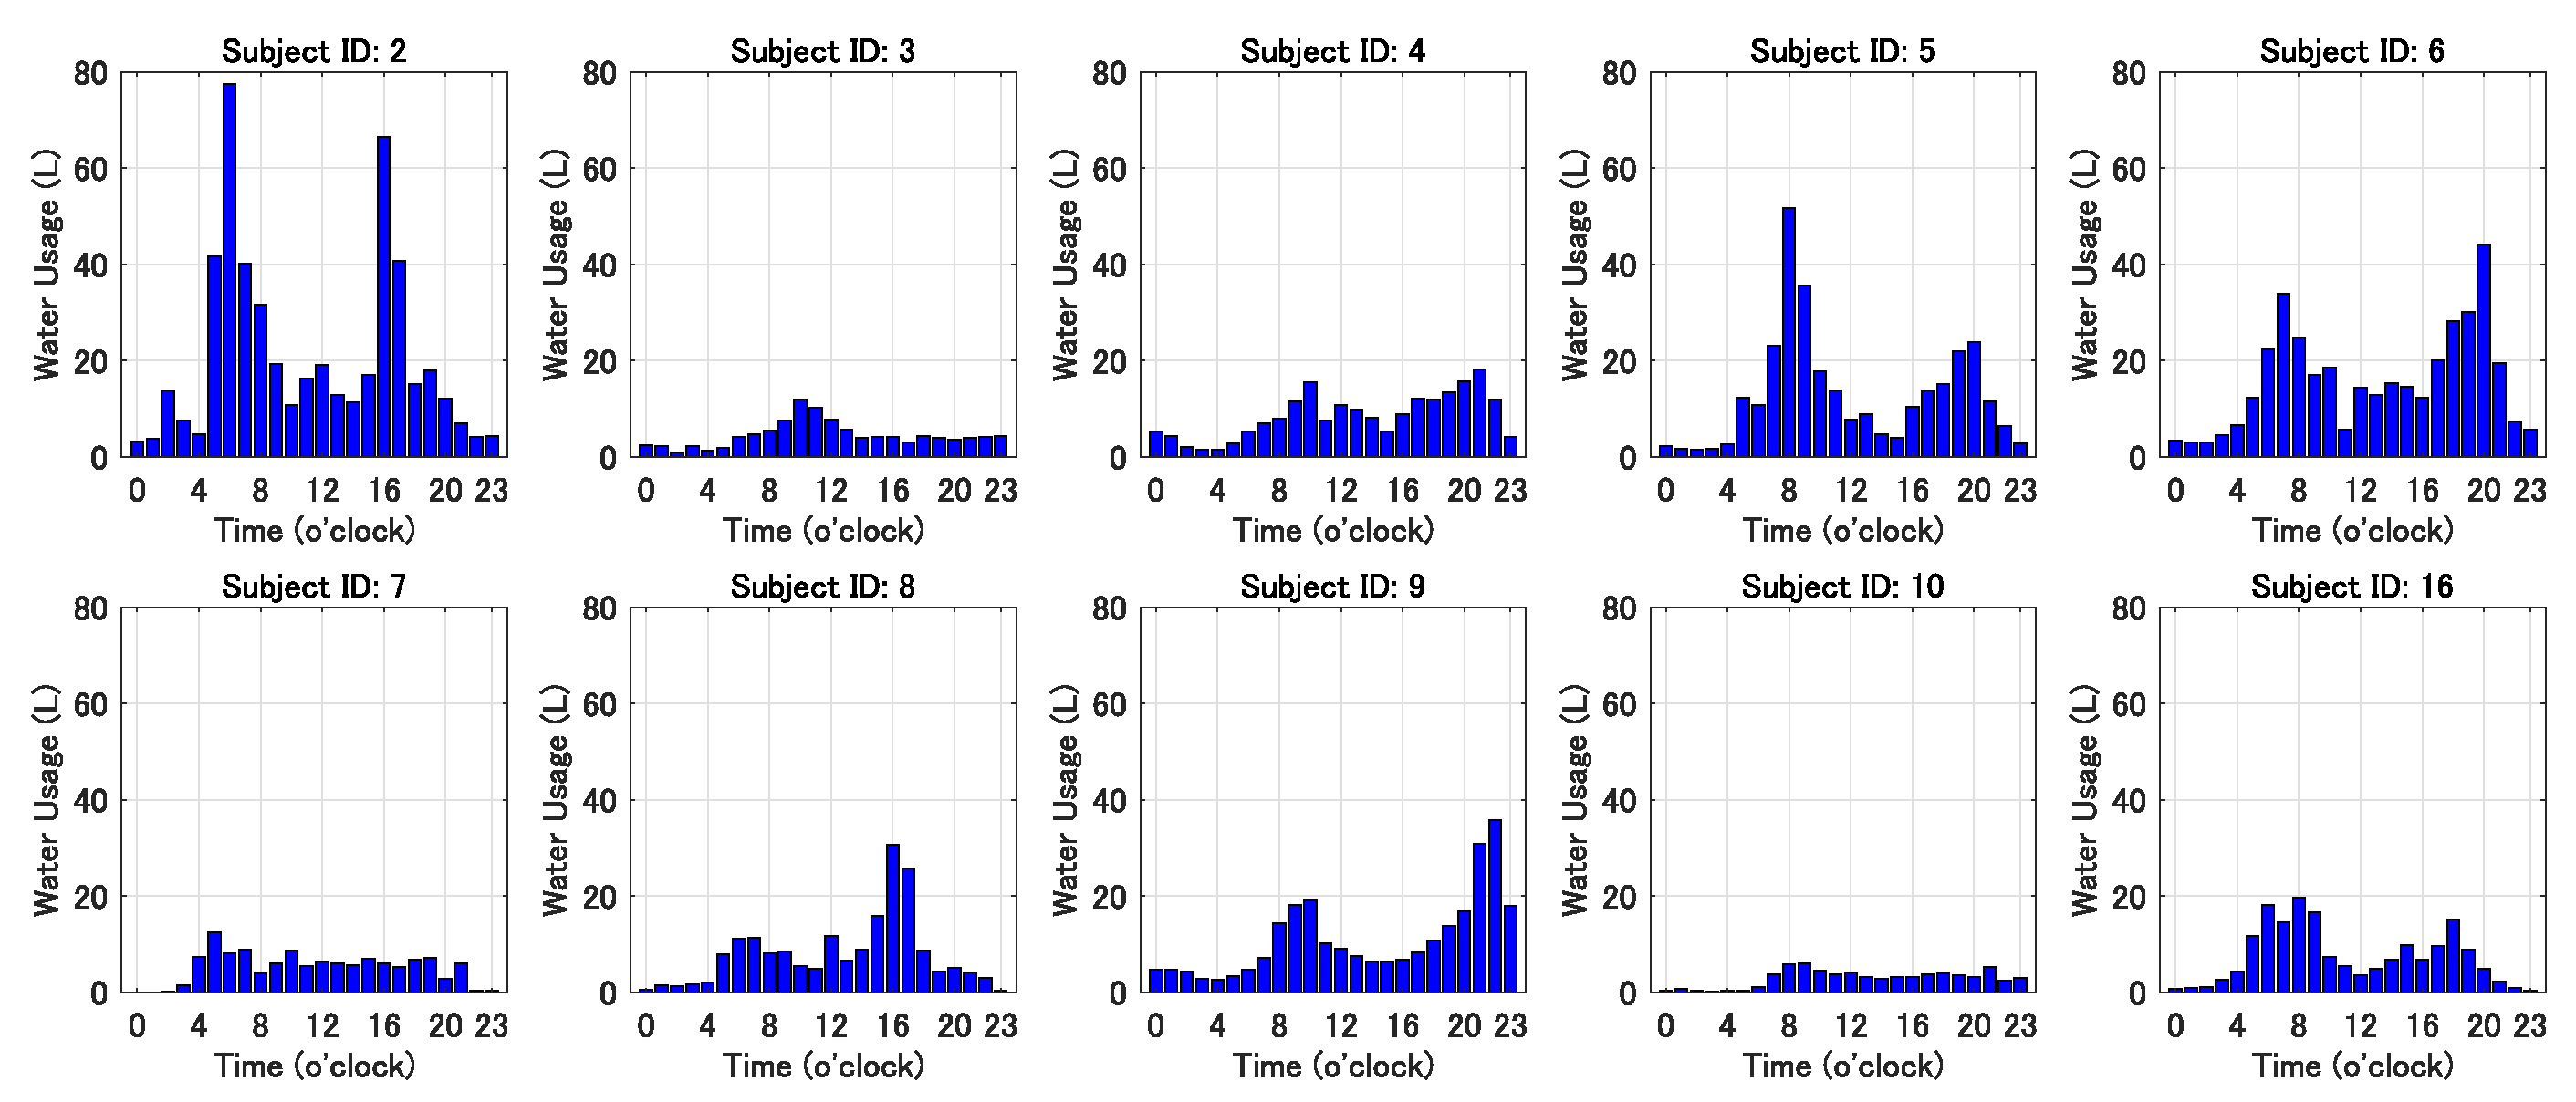
Figure 8.
The histograms of sleep duration, latency, average HR, average RR, the number of body movements, and leaving times of the subject with ID 13 each night for one year.
Figure 8.
The histograms of sleep duration, latency, average HR, average RR, the number of body movements, and leaving times of the subject with ID 13 each night for one year.
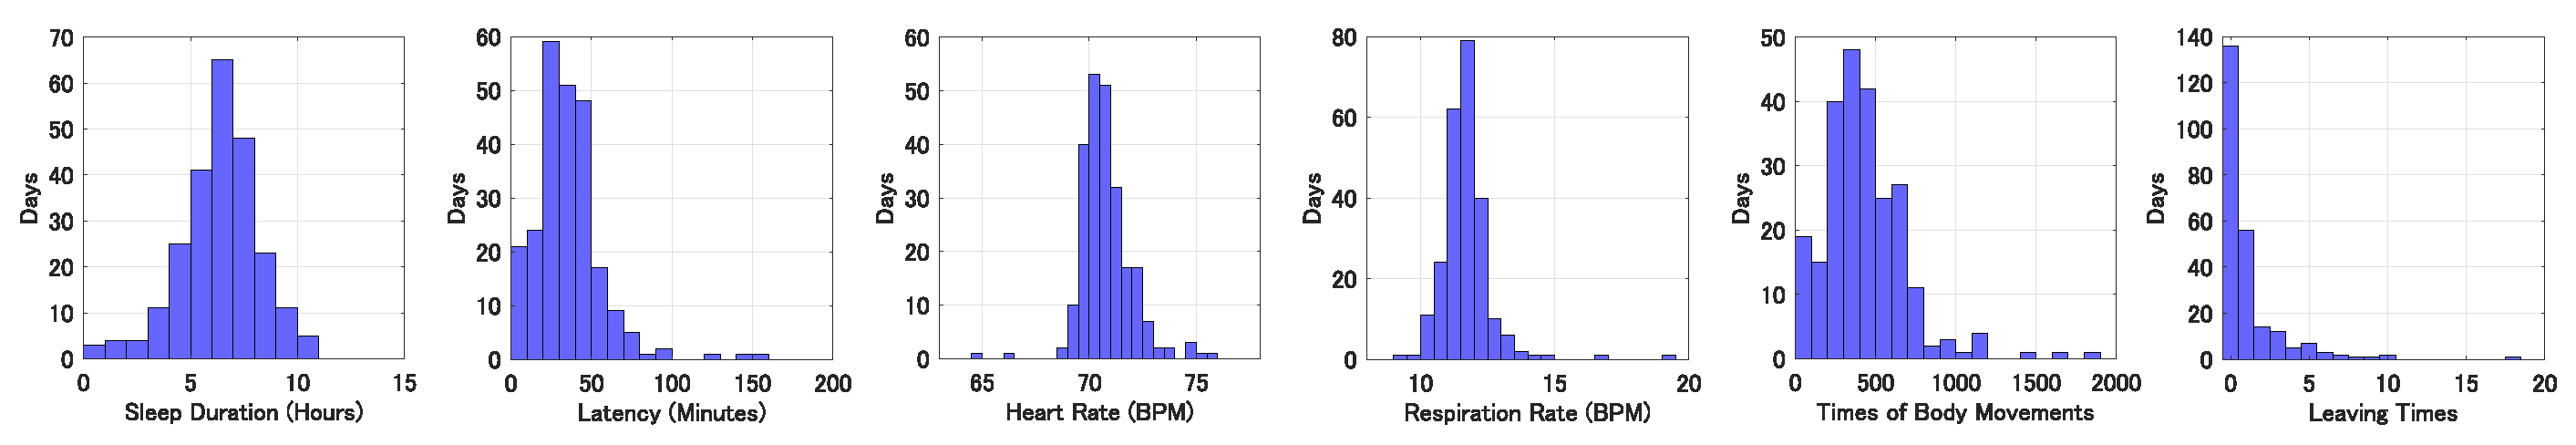
Figure 9.
The complete profiles of HR and RR from the subject with ID 13 for about one year. In this figure, the y axis denotes the HR (beat/min) and RR (breath/min). The curves and vertical bars with short horizontal lines at their upper and lower ends indicate the mean values and standard deviations of the detected HR and RR for the corresponding day. Note that the vertical lines stand for the loss of data.
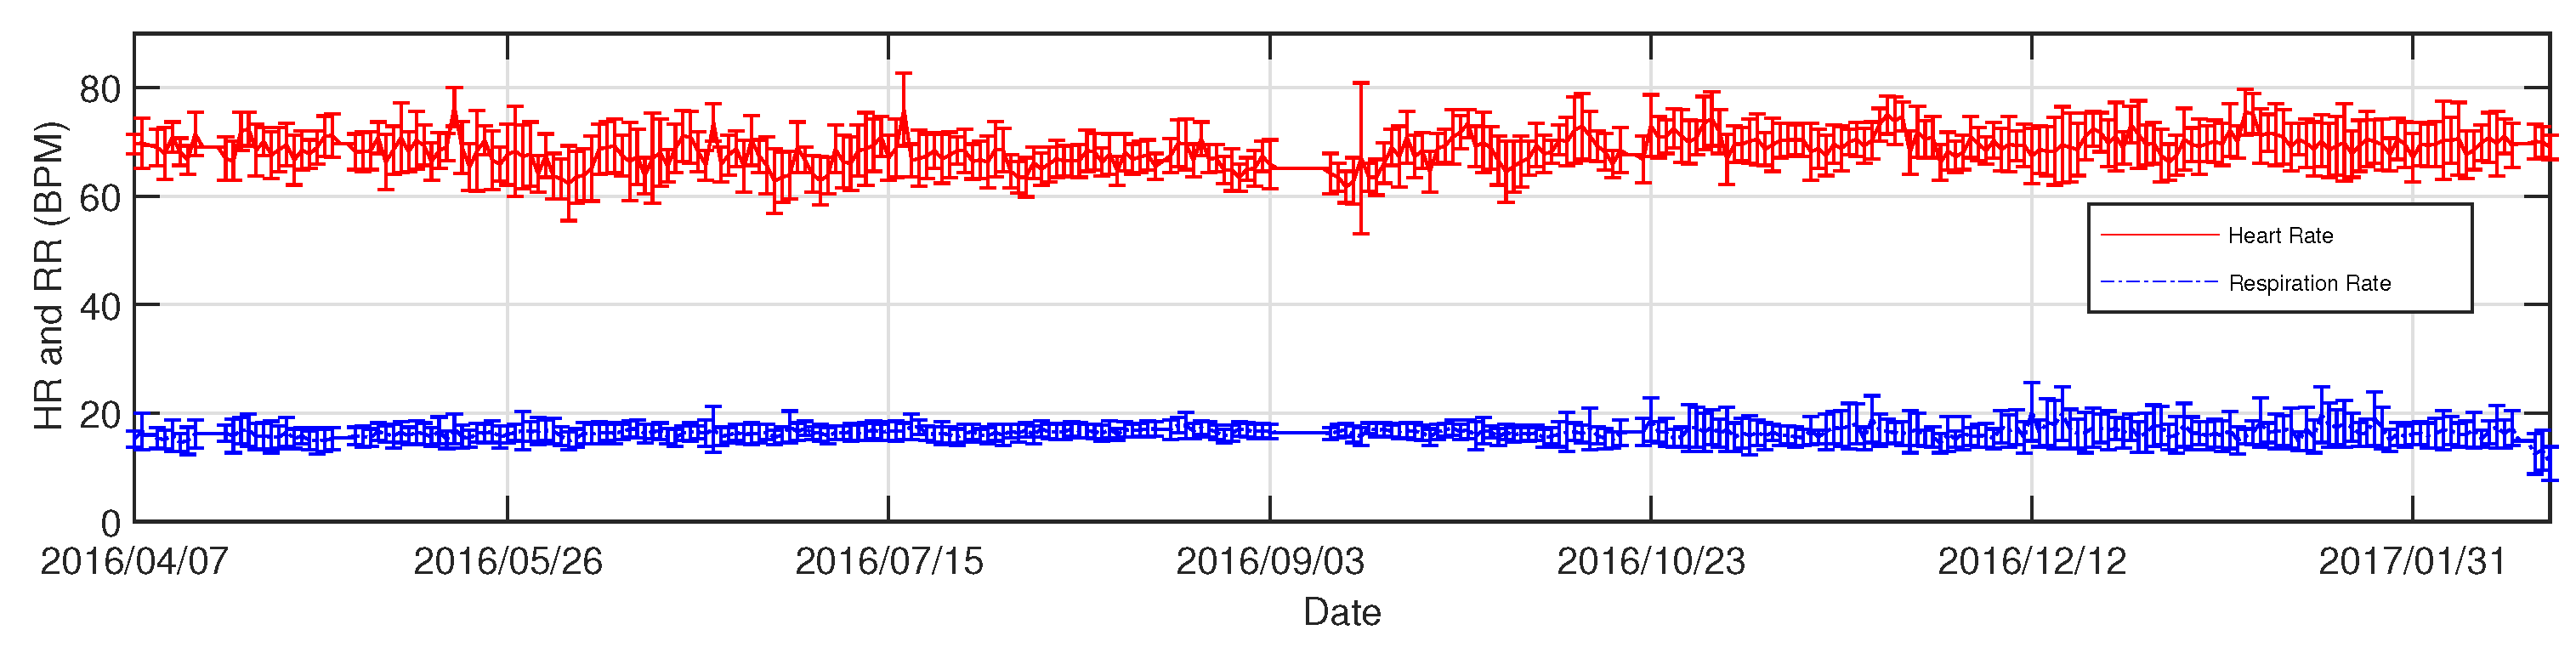
Figure 10.
The trends of HR, RR, and BM from the subject with ID 13 during sleep for four days are displayed in a web-based GUI.
Figure 10.
The trends of HR, RR, and BM from the subject with ID 13 during sleep for four days are displayed in a web-based GUI.
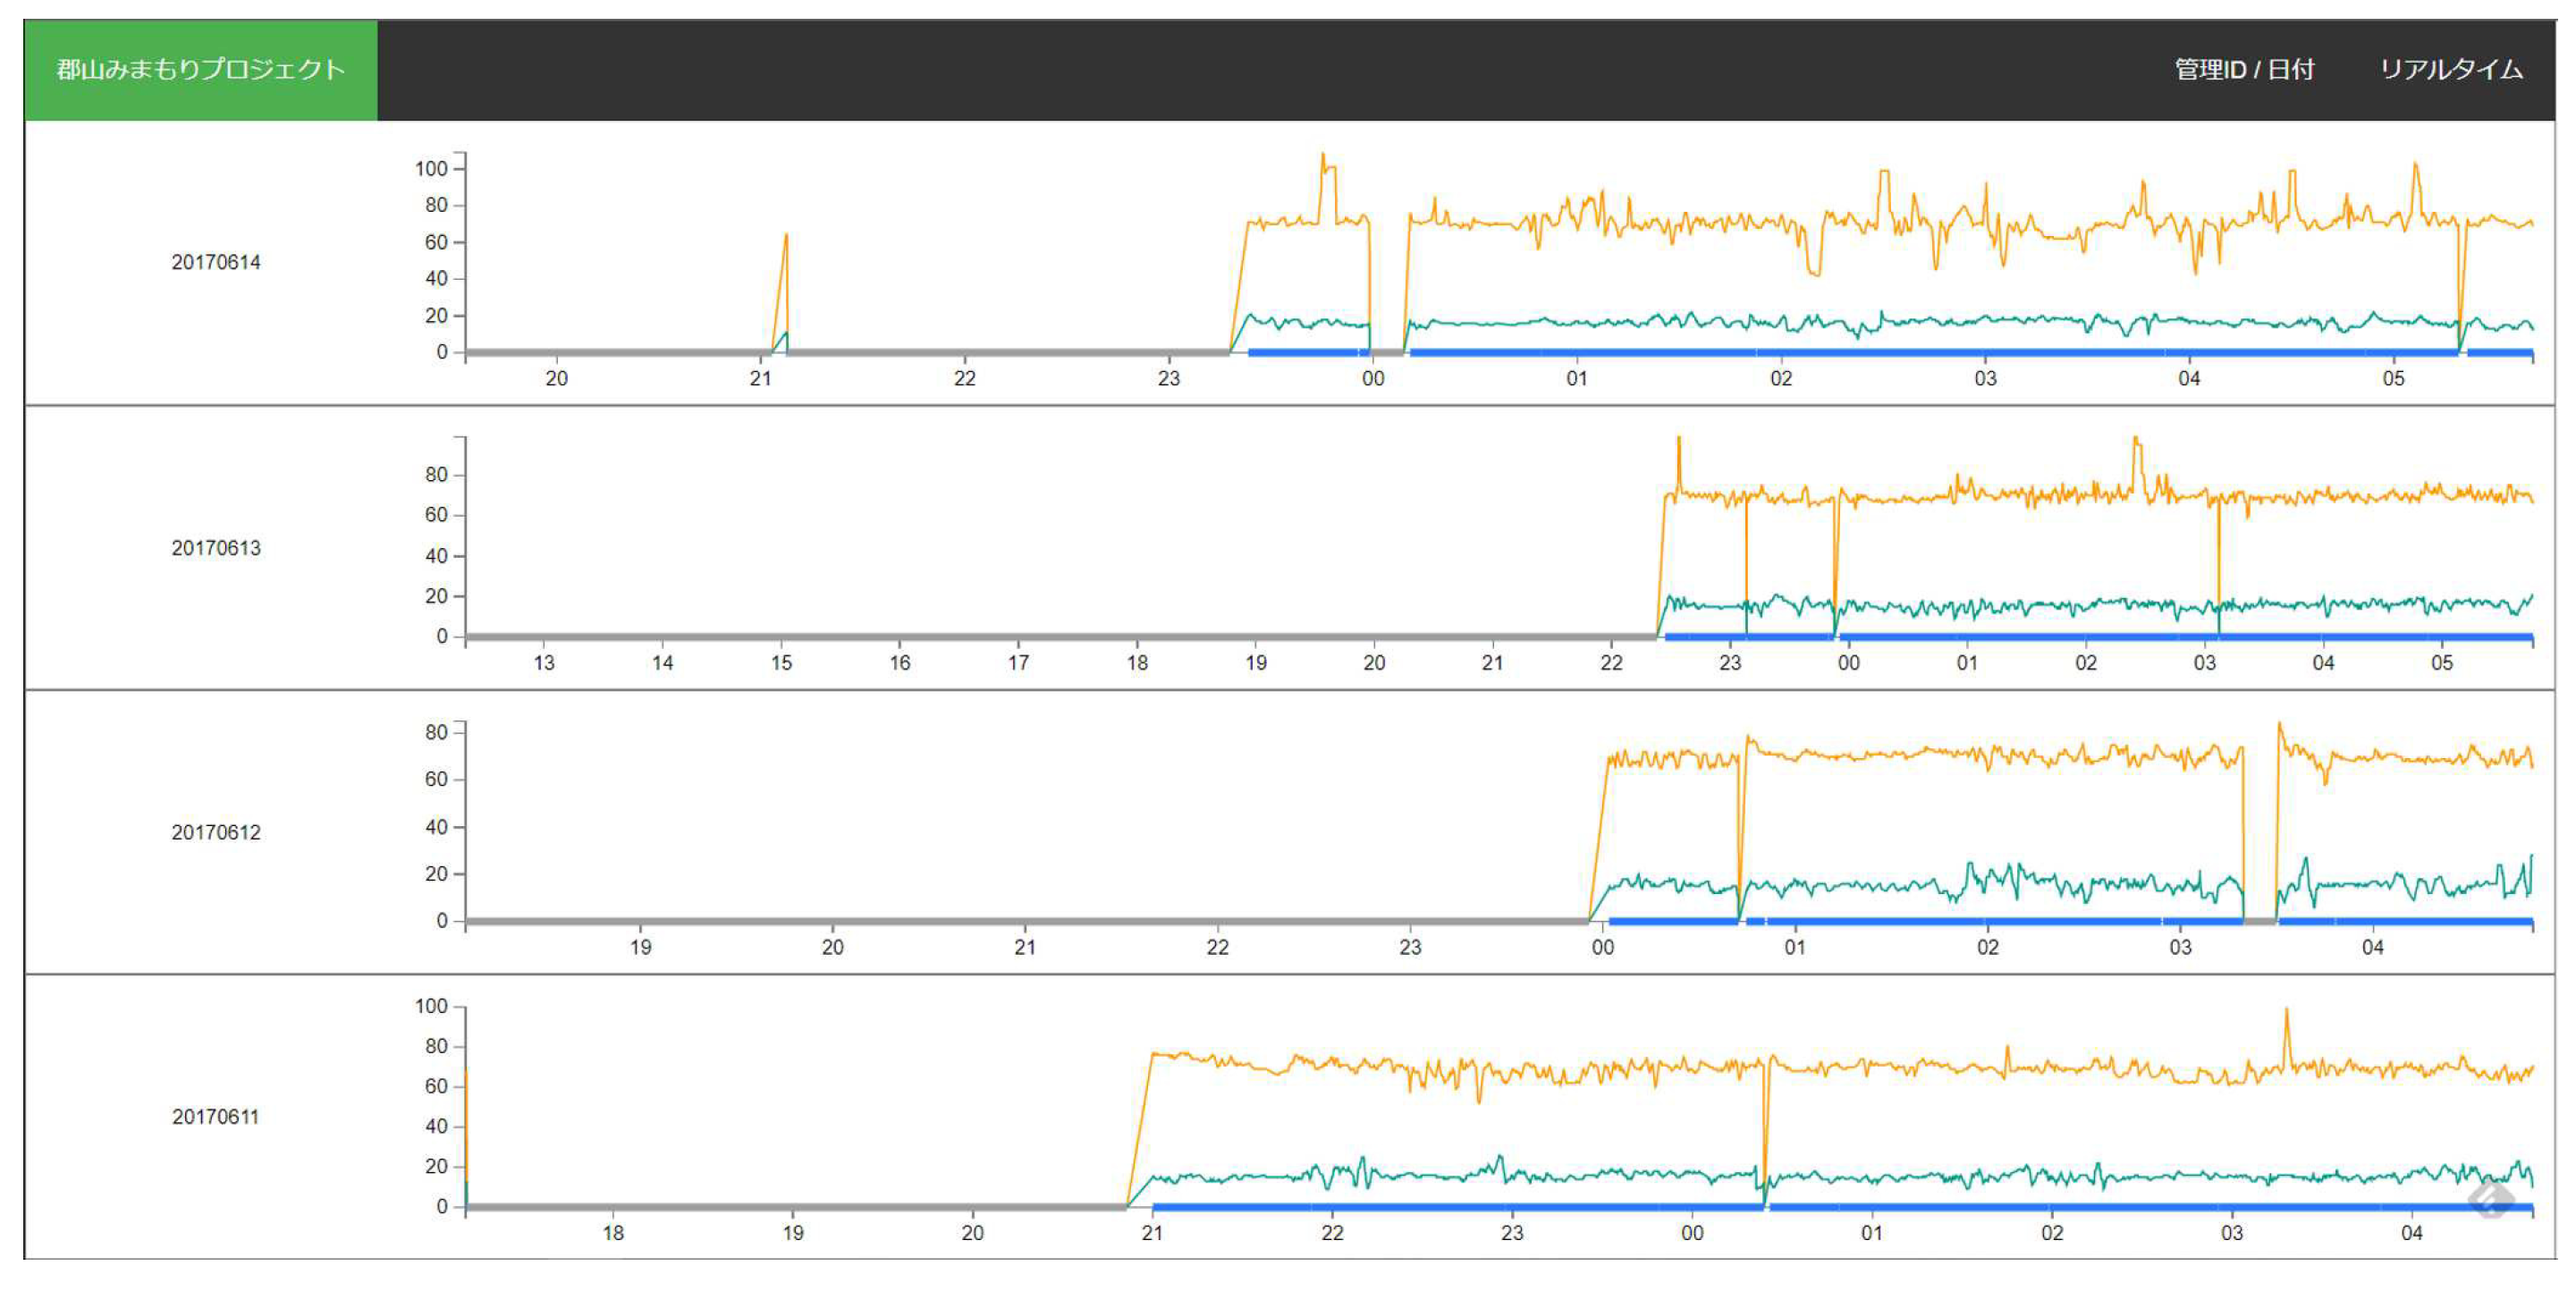

Table 1.
A summary of subjects
| Subject ID | Age | Sex | Living Alone | Water Meter |
|---|---|---|---|---|
| 1 | 68 | Male | No | No |
| 2 | 81 | Male | Yes | Yes |
| 3 | 77 | Male | No | Yes |
| 4 | 75 | Male | No | Yes |
| 5 | 77 | Male | No | Yes |
| 6 | 79 | Female | Yes | Yes |
| 7 | 86 | Male | Yes | Yes |
| 8 | 84 | Female | Yes | Yes |
| 9 | 86 | Female | Yes | Yes |
| 10 | 67 | Female | Yes | Yes |
| 11 | 65 | Male | No | No |
| 12 | 81 | Female | Yes | No |
| 13 | 67 | Male | - | No |
| 14 | 83 | Female | Yes | No |
| 15 | 81 | Male | No | No |
| 16 | 77 | Male | - | Yes |
| 17 | 79 | Male | - | No |
| 18 | 77 | Female | - | No |
Disclaimer/Publisher’s Note: The statements, opinions and data contained in all publications are solely those of the individual author(s) and contributor(s) and not of MDPI and/or the editor(s). MDPI and/or the editor(s) disclaim responsibility for any injury to people or property resulting from any ideas, methods, instructions or products referred to in the content. |
© 2023 by the authors. Licensee MDPI, Basel, Switzerland. This article is an open access article distributed under the terms and conditions of the Creative Commons Attribution (CC BY) license (http://creativecommons.org/licenses/by/4.0/).
Copyright: This open access article is published under a Creative Commons CC BY 4.0 license, which permit the free download, distribution, and reuse, provided that the author and preprint are cited in any reuse.


