Preprint
Article

Evidence for distinct mechanisms of immune suppression in EBV-positive and EBV-negative Hodgkin lymphoma

Altmetrics

Downloads

98

Views

32

Comments

0

A peer-reviewed article of this preprint also exists.

Submitted:

31 July 2023

Posted:

02 August 2023

You are already at the latest version

Alerts
Abstract
Epstein Barr Virus (EBV) has been recognized for its ability to transform B lymphocytes and for its association with different types of cancers including Hodgkin lymphoma. In addition, EBV may also modulate the microenvironment of HL. In this study, we aimed to investigate the prevalence of EBV among HL cases in Ethiopia and to assess the tissue cellular composition of EBV-related and EBV-unrelated cases. We constructed a tissue microarray (TMA) of 126 consecutive cases of classical HL (cHL) and nodular lymphocyte predominant HL (NLPHL) from a tertiary cancer centre, Tikur Anbessa Hospital, Addis Ababa, Ethiopia, and evaluated a panel of immunohistochemical markers. The quantification of immune cells was performed using HALO 2.3, a platform for image analysis from Indica Lab Inc. A total of 77/126 (61.1%) of HL cases expressed LMP1/EBER. Infiltration of CD8+, T-bet+ and FOXP3+ cells was higher in the microenvironment of EBV-related HL, with P values of <0.001, 0.006 and <0.001, respectively. In contrast, the expression of PD1 was higher in the microenvironment of EBV-unrelated HL cases (P = 0.001). Unlike in Western countries, the majority of HL cases in Ethiopia were associated with EBV. As FoxP3+ and PD1-expressing cells are thought to participate in down regulation of the immune response by different mechanisms, this finding highlights the previously unrecognized possibility that distinct immunosuppressive mechanisms may be ongoing within EBV positive and negative HL types. This may have important prognostic and therapeutic implications.
Keywords: 
Subject: Medicine and Pharmacology  -   Hematology

1. Introduction

Epstein Barr Virus (EBV) has been recognized for its ability to transform B lymphocytes and its association with different types of cancers such as Burkitt lymphoma (BL), Hodgkin lymphoma HL, nasal NK-T cell lymphoma, and B-cell NHL.[1,2] The time course of EBV acquisition differs in sub-Saharan Africa from that in developed countries. Seroprevalence is nearly universal throughout sub-Saharan Africa with acquisition in early childhood, in developed countries with acquisition later in life coincident with sexual activity.[3,4,5] Although the majority of the world’s population is infected with EBV, there are global variations in the incidence of EBV-associated cancers, perhaps resulting from host genetics, environmental factors, or viral genetic variation, with EBV having a striking and geographically unique association with BL and HL in sub-Saharan Africa.[6] In western countries, about 50% of all cases of cHL are EBV positive. In comparison, in developing countries the percentage in pediatric cHL is approaching 90-100%.[7,8,9,10,11,12] In sub-Saharan Africa, EBV has been detected at high rate among HL cases.[13] Similarly, a study comparing the epidemiological variation of EBV in HL for Kenyan and Japanese patients showed that EBV-encoded RNA was [14] found in 79% and 59% of the Kenyan and the Japanese cases, respectively.[15]
In recent years, the microenvironment has become a major focus of attention, having a potential role in the pathogenesis of HL with prognostic and therapeutic implications.[16,17] The HL microenvironment in the tumor tissue is rich with reactive inflammatory cells, including T-cells.[18] However, the immune cells present in the tumor do not impose an effective anti-tumor immune response, but may instead support the growth and proliferation of HRS cells.[19] The abundance and role of T-helper cells has continued to be a controversial topic in the microenvironment of HL. Some studies have suggested a Th-1 mediated response to be predominant.[18,20] Greaves et al. showed that the predominant T-lymphocyte in the microenvironment of HRS cells is of Th-1 subtype being activation marker-rich, cytokine-secretory and proliferative rather than being Th-2 and T-reg.[21] A recent study indicated that the majority of cytotoxic CD8+ T cells in EBV+ cHL are present due to a Th-1 response as Th-1 cells stimulate a cellular immune response.[22] Other studies have suggested a Th-2 polarization. [23,24] Immunosuppressive regulatory T cells (Treg) have also been identified in CHL tissue.[20] It has been suggested that a local accumulation of Th2 cells and Treg,[20,23] provide an explanation as to how HRS cells may escape anti-tumour immunity
Programmed cell death 1 (PD1), the immune checkpoint,[25] was found to be expressed on tumor infiltrating lymphocytes.[26] One of the immune escape mechanisms of CHL is the expression of PD-L1 on the HRS tumor cells.[27,28] However, studies on the PD1 expression in the microenvironment of cHL are scarce and conflicting.[27,29,30] Overall, the cellular infiltrate in cHL appears to play a decisive role in allowing the HRS cells to survive by providing an environment that suppresses cytotoxic immune responses.[31]
The aim of this study is to evaluate the EBV prevalence among HL cases in Ethiopia. The HL microenvironment has been studied using high throughput techniques in developed countries. Since the prevalence of EBV with HL is different between developed and resource-limited countries, this study aimed to determine the cellular component of the microenvironment of EBV-related and EBV-unrelated HL using IHC in patients from this Sub-Saharan African country.

2. Materials and Methods

Tissue blocks from 126 patients with HL were used in this study. A tissue microarray (TMA) was constructed.[32] Sections were prepared from the TMA and were stained with a panel of immune markers and the latent membrane protein 1 of EBV (LMP1), details about the monoclonal antibodies are presented in Table 1. In situ hybridization for EBV-encoded RNA [14] was carried out according to protocols previously described.[33] The stained immune cells were quantified using HALO image analysis software, details are described on the supplementary material.

Statistical analysis

The x2 and Fisher exact test were used to analyze the association of LMP1 and EBER expression with the binary and categorical variables related to the clinical data. To test the independent association of the clinical characteristic of cHL with EBV marker expression, the data was analyzed by logistic regression model. Descriptive statistics were conducted to analyze mean, standard deviation, and the minimum and maximum count of the immune cells in the microenvironment of HL. Wilcoxon mean rank test or paired sample T test was performed to compare between the proportion of immune cells. Correlations between different biomarker expression on the cells of the TME was determined by using the Spearman’s correlation test. Mann-Whitney test or independent sample T test were performed as appropriate to analyze the differences in mean ranks or means of immune cells proportions between the clinical features of HL. The differences in the proportion of immune cells in the microenvironment of HL between EBV+ and EBV- cases was analyzed using Mann-Whitney test or independent sample T test as appropriate for variables with binary outcomes and Kruskal Wallis test or One-Way ANOVA analysis was conducted for categorical variables. To determine the factors that were independently associated with the proportion of immune cells, all outcome variables with p value of ≤ 0.25 were entered in the linear regression model.

Ethical approval

Ethical clearance was obtained from Addis Ababa University College of Natural Sciences, College of Health Sciences institutional ethics review boards and ethical review boards of Armauer Hansen Research Institute. The research has been conducted in accordance with the principles stated in the Declaration of Helsinki.

3. Results

Detection of LMP1/EBER in tumor cells

The demographic and clinical features of HL cases included in this study were described elsewhere.[32] A total of 77/126 (61.1%) of HL cases expressed LMP1/EBER. EBV expression was higher in males, 64/91 (70.3%) than in females 13/31 (41.9%), P = 0.012. As shown in Figure 1a and Table S1, the expression of LMP1/EBER on HL tumor cells was higher in the pediatric population (≤14 years) and in younger adults (15-34 years), (P = 0.02). EBV was only detected in CHL. Among the two predominant cHL subtypes, LMP1/EBER was detected in 48/65 (73.8%) and 23/40 (57.5%) cases of the MCCHL and the NSCHL subtypes, respectively (Figure 1b, Table S1). The MCCHL subtype were highly associated with EBV with a P value of <0.001. As shown in Table SI, HL cases presented in all disease stages, the disease stage was not related to EBV.
Furthermore, logistic regression analysis was conducted to investigate the independent relationship of HL subtypes, age and sex with EBV. In this analysis, we found male gender and MCCHL subtype to be independently associated with EBV, Table 2.
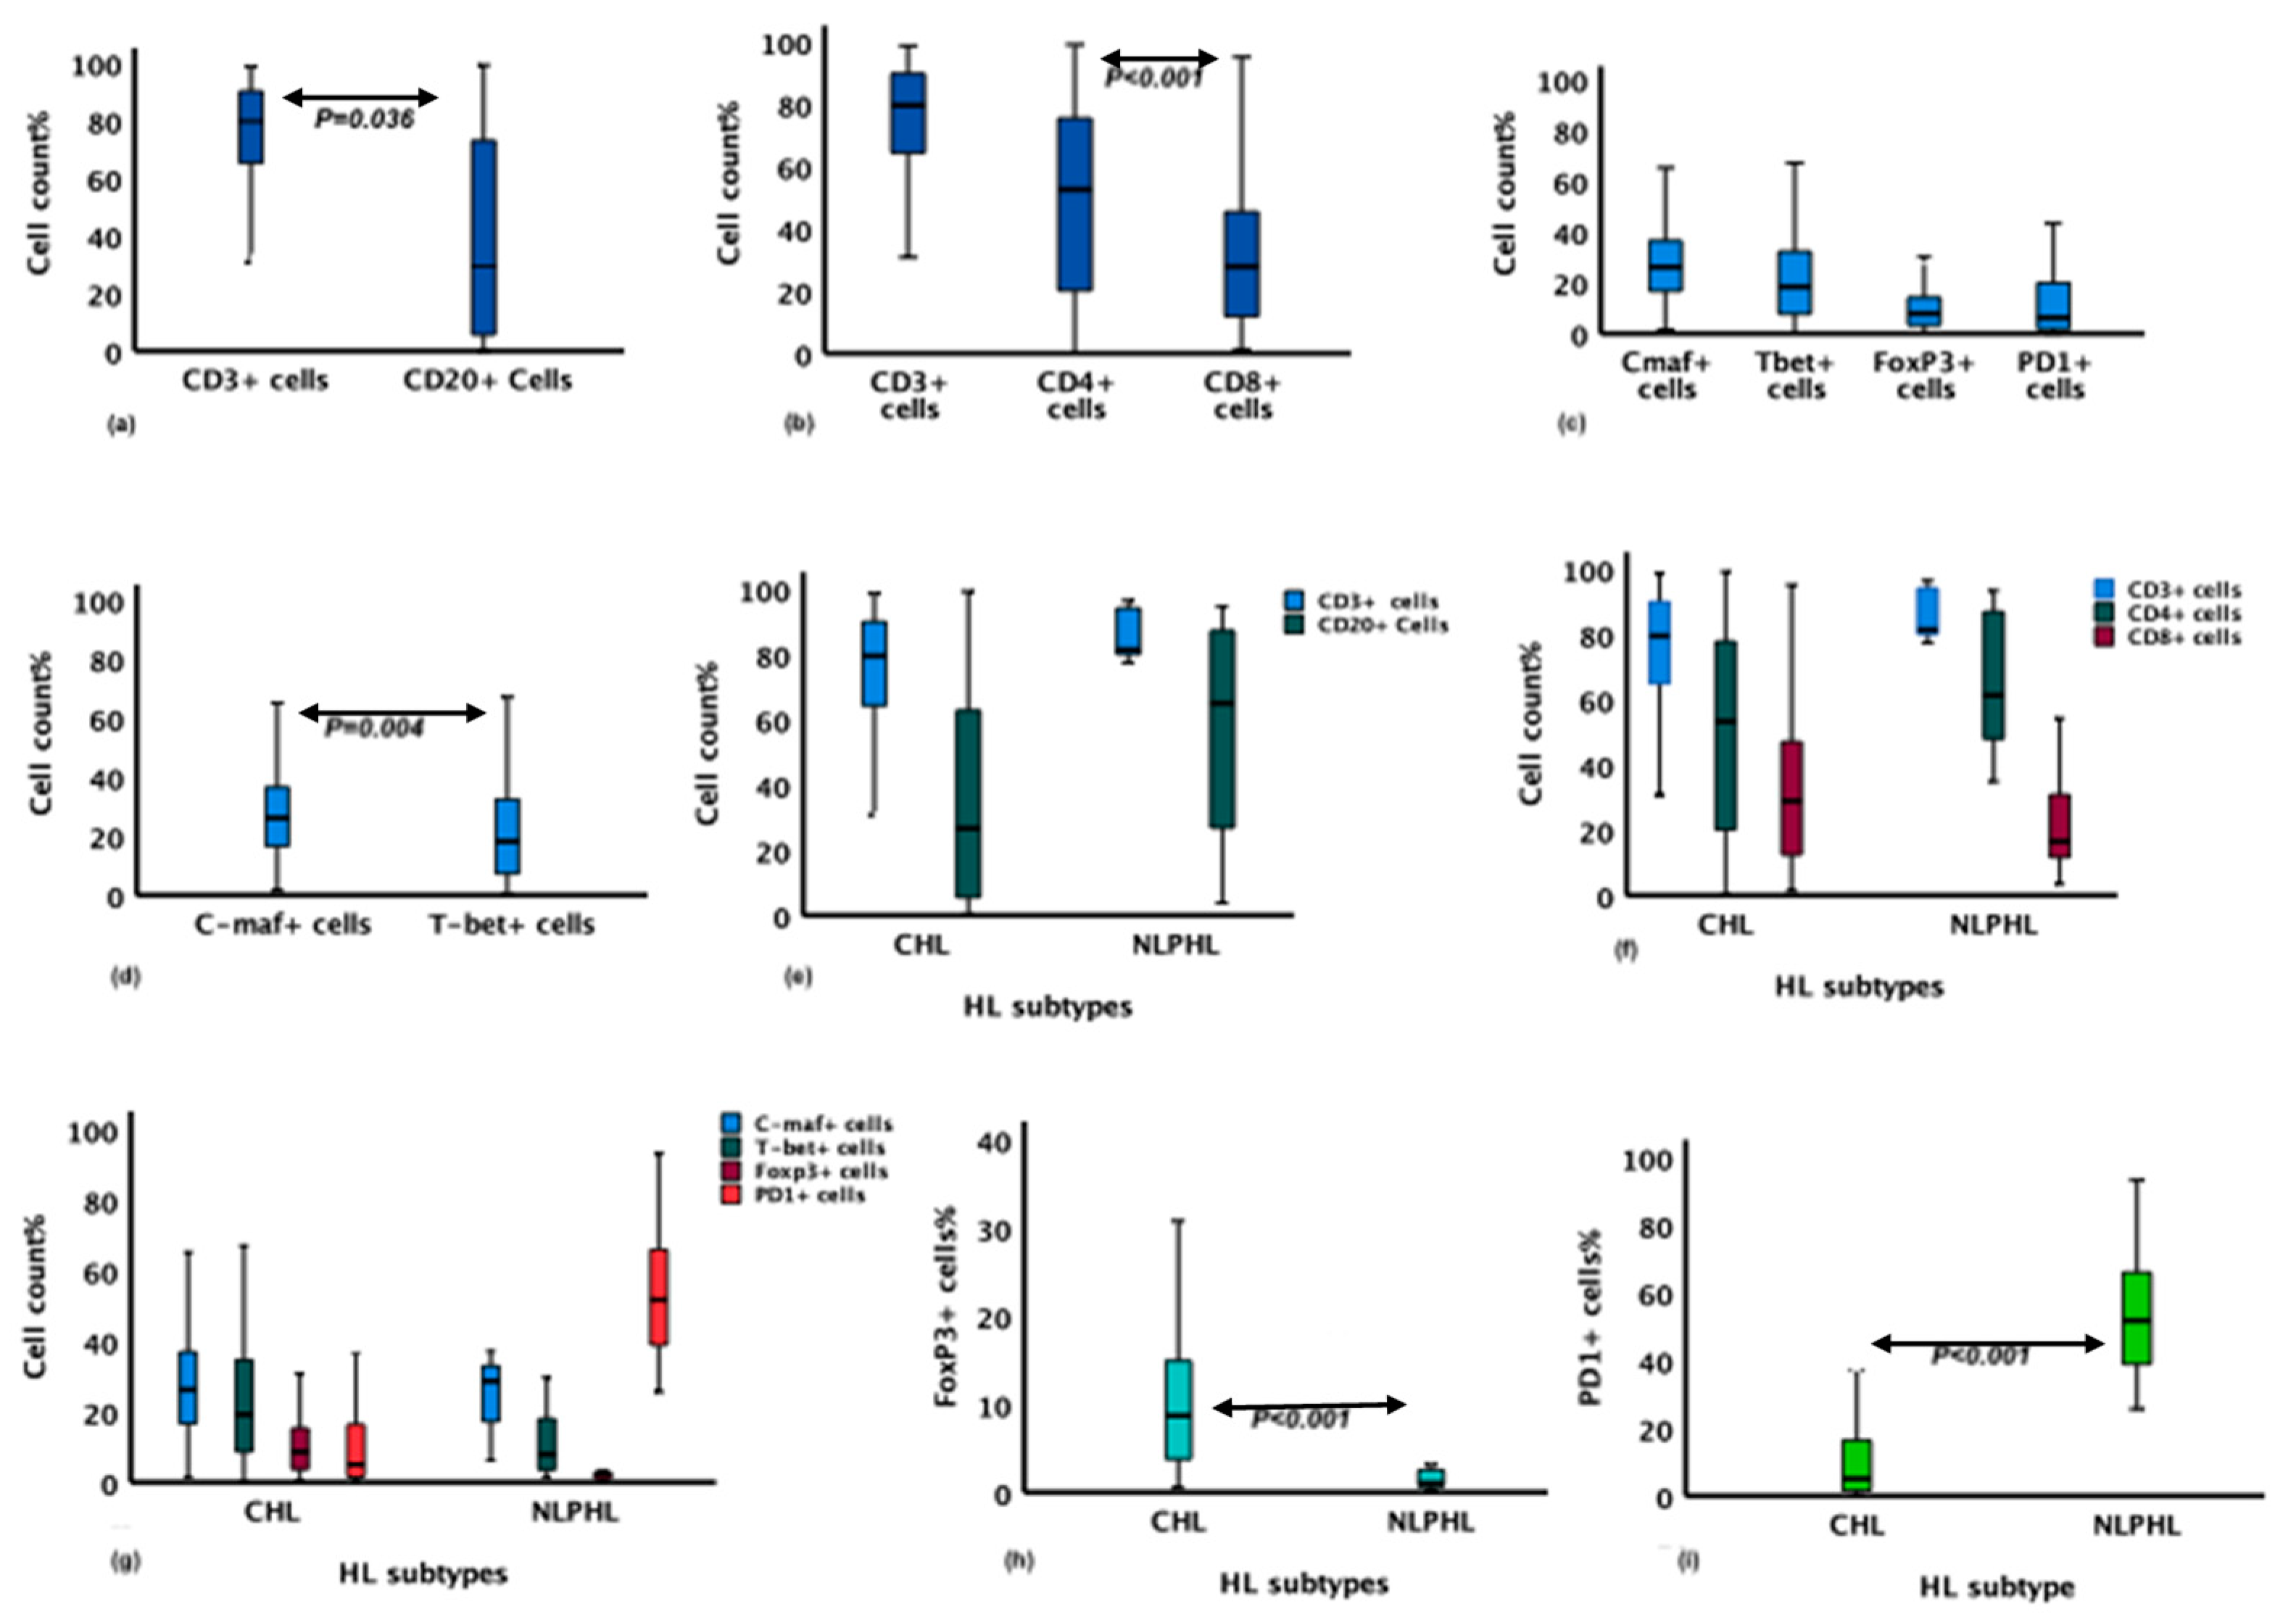
Detail descriptions about count, percentage, mean and median of cell biomarkers in the TME of total HL cases (the cHL and NLPHL) and the TME of cHL cases is presented in supplementary Table II. In the TME of the studied HL cases, the mean of cells expressing CD3 and CD20 was 79.6% and 29% of the total cells/mm2, respectively (Figure 2a and Table SIII). The proportion of CD4+ cells, which was 55.9% of the total cells, was higher than the proportion of CD8+ cells (27.9%) (P <0.001). The CD4:CD8 ratio was 2:1 (Figure 2b and Table SIII). Furthermore, the biomarkers FoxP3, T-bet and C-maf associated respectively with Treg, Th1 and Th2 CD4+ T-cells subsets were positive in 8.8 %, 18.7% and 24.4% of the total cells, respectively (Figure 2c). The proportion of cells expressing C-maf was higher than that of cells expressing T-bet, P = 0.004 (Figure 2d and Table SIII), 5% of the total cells in the TME expressed the programmed death 1 (PD1) biomarker.
A positive linear correlation was detected between the proportion of PD1+ cells and the proportion of CD4+ cells (P = <0.001) (Table SIV). The quantity of PD1+ cells was also positively correlated with that of C-maf + cells (P = 0.039). In contrast, PD1 expression level showed a negative correlation with FoxP3 expression level (P = 0.002). The number of FoxP3+ cells showed a positive correlation with the number of cells expressing CD8 and T-bet biomarkers with P values of 0.014 and 0.01, respectively. A positive correlation was observed between the expression of CD8 and T-bet biomarkers (P <0.001).

The association of the immune cells in the microenvironment of HL with clinicopathological features

The proportion of CD20+ and CD3+ cells was higher in the NLPHL type than in the cHL type (Figure 2e and Table SV). The proportion of CD4+ cells/mm2 was also higher in NLPHL cases compared to cHL, P = 0.19 (Figure 2f and Table SVB). The proportion of cells expressing CD8 was numerically higher in CHL cases compared to NLPHL, but the difference was not significant. CD4:CD8 ratio was higher in NLPHL with P value of 0.05. Moreover, FoxP3 expression was higher in CHL compared to NLPHL, P = <0.001 (Figure 2g & h). The cells in the TME of both HL types showed no differences in the expression of Th1 and Th2 biomarker, T-bet and C-maf (Figure 2g). The proportion of cells expressing the immune checkpoint marker PD1 was markedly higher in NLPHL (P <0.001) Figure 2i and Table SVB.
In a linear regression model, NLPHL was independently associated with a high proportion of PD1+ cell count compared to the CHL type. In contrast, the proportion of FoxP3+ cells was higher in the CHL compared to the NLPHL. Age and sex were not associated with CD3, CD4, FoxP3 or PD1 expression. However, the quantity of C-maf+ cells was higher among the elderly, P = 0.03. (Table SVI).

The proportion of immune cells in the microenvironment of EBV-related and EBV-unrelated HL

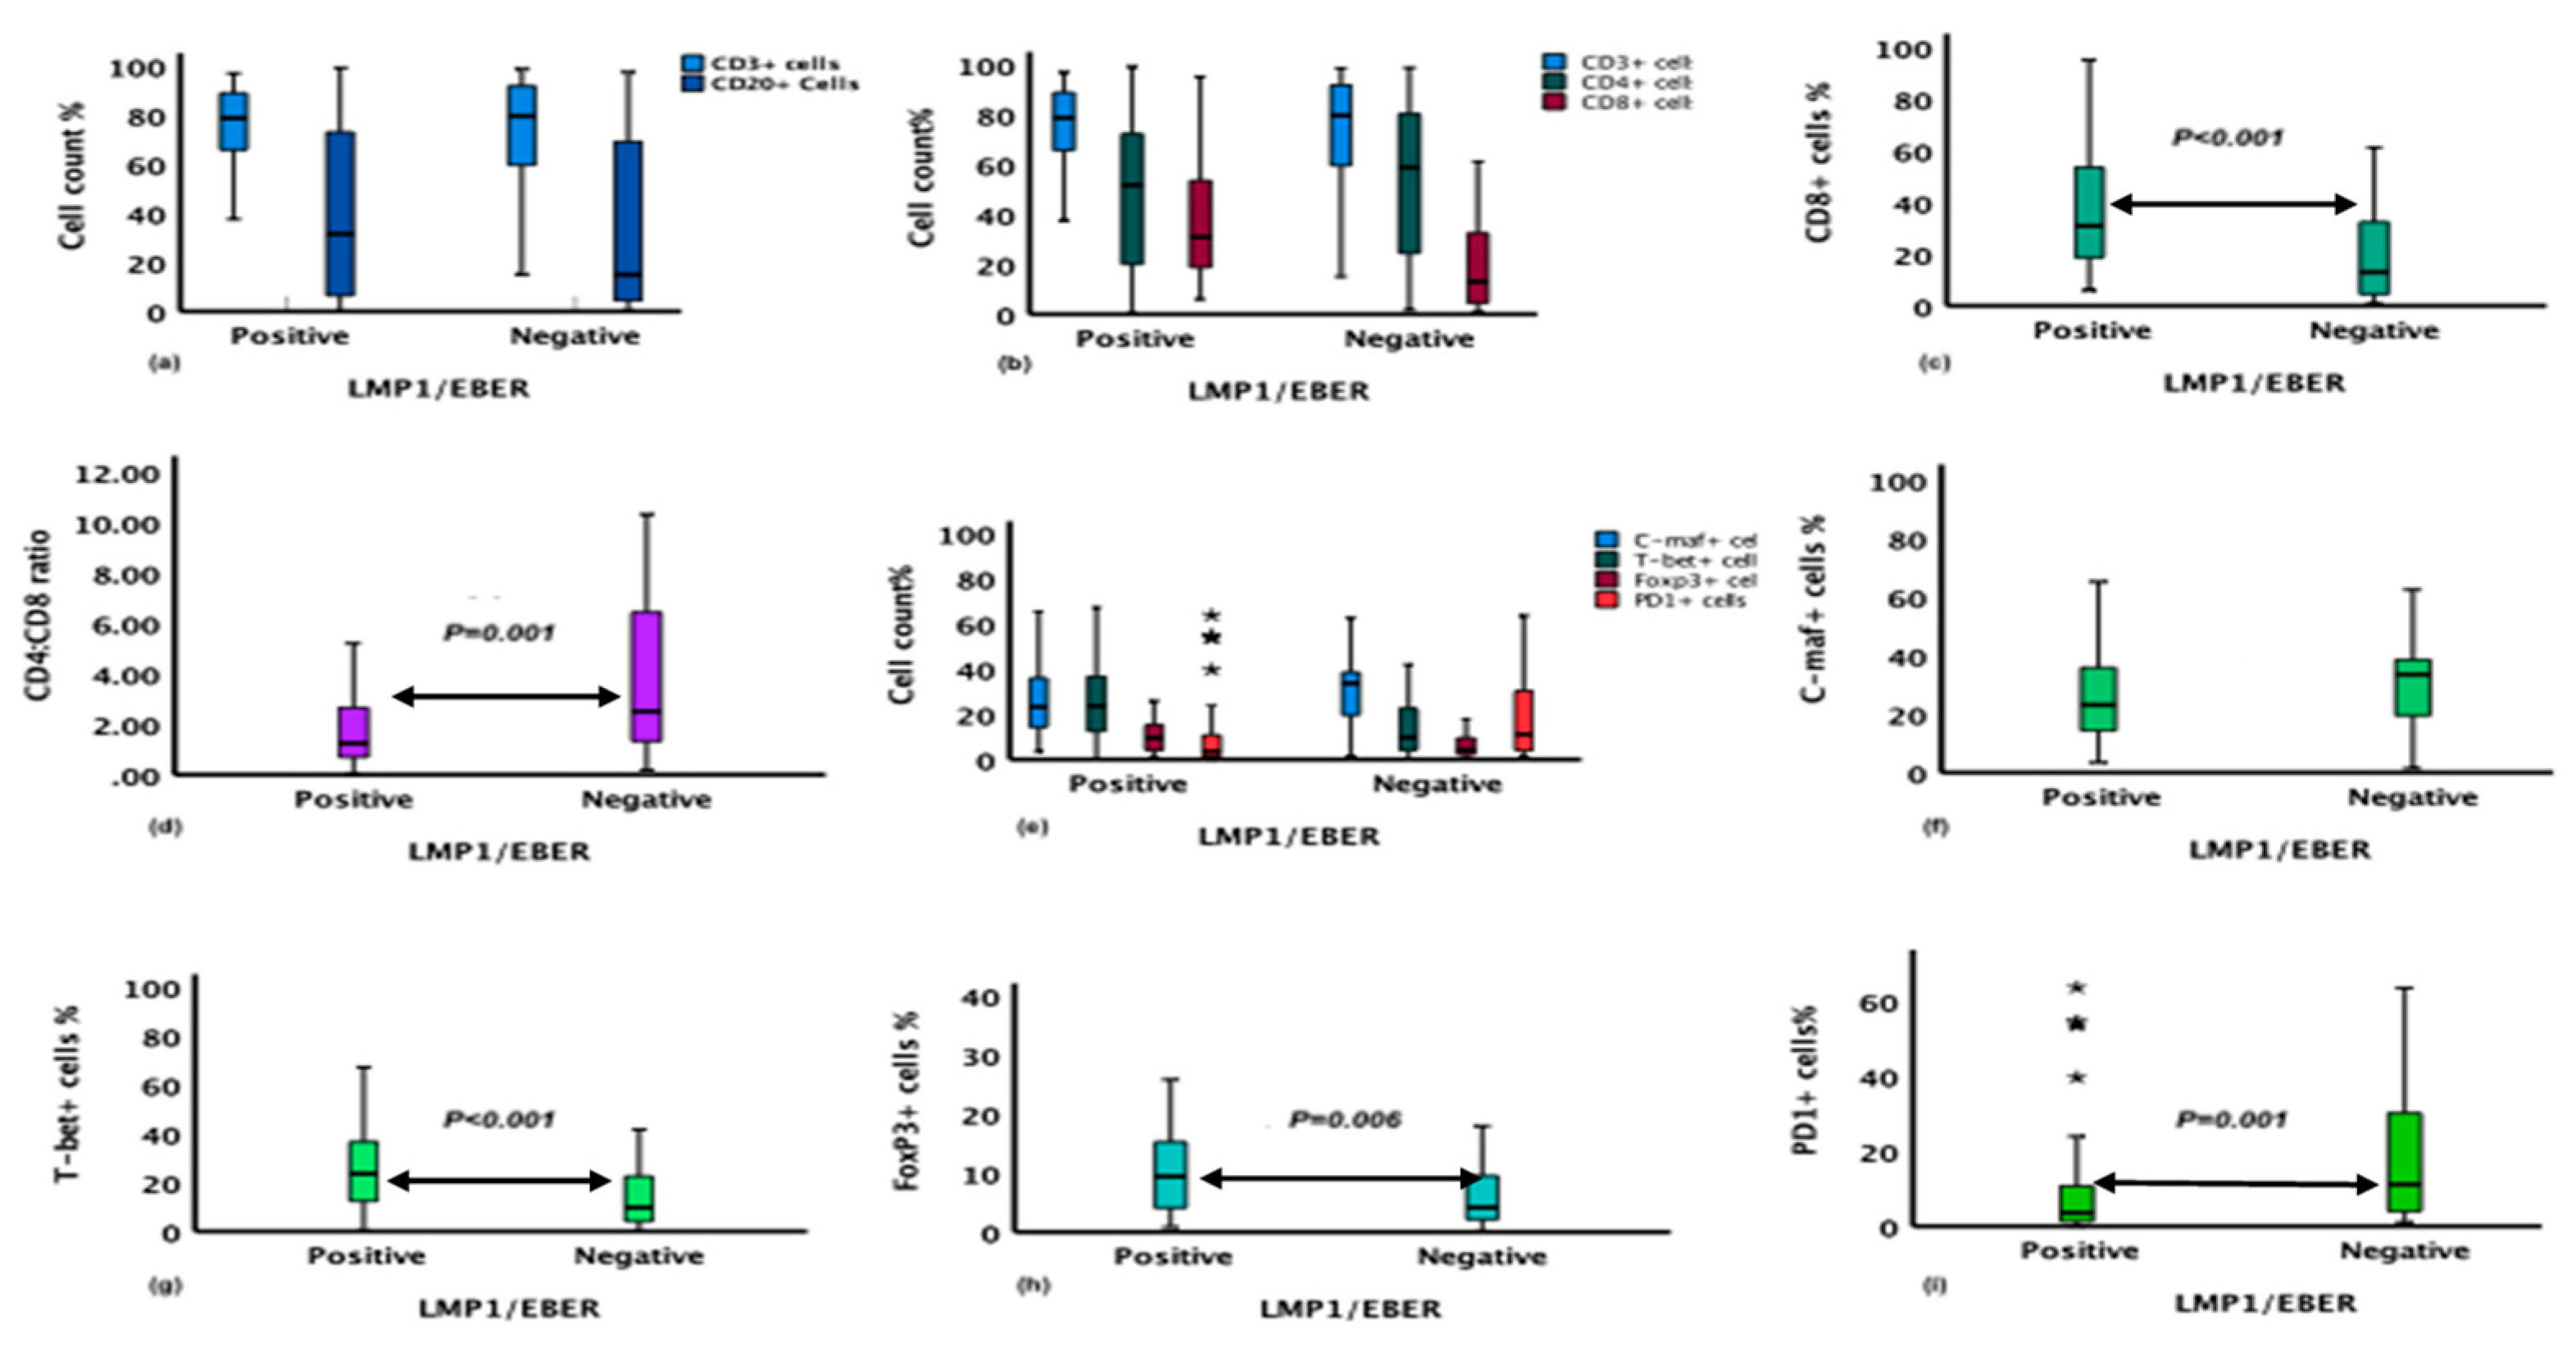
In the comparison of the proportion and types of immune cells of EBV-associated and EBV-negative CHL, HL cases with HIV infection were excluded. There were no differences in the proportion of CD20+, CD3+ and CD4+ cells (Figure 3a & b). However, the proportion of CD8+ cells in the TME of CHL was significantly associated with EBV infection; P <0.001 (Figure 3c and Table SVII). Accordingly, the ratio of CD4:CD8 was 3.4 (2-7) times higher in the EBV-unrelated cases, P = 0.001, Figure 3d. No differences in the proportion of C-maf+ cells between EBV-related and EBV-unrelated cases, Figure 3e & f. In contrast, the proportion of T-bet+ cells was significantly associated with EBV-related HL, P <0.001, Figure 3e & g. EBV-related HL was also associated with a higher proportion of cells expressing FoxP3, P = 0.006 (Figure 3e & h). In contrast, the expression of PD1 was higher in EBV-unrelated HL, P = 0.001. (Figure 3e & I, Table SVII). The proportion of T-cell subsets: CD8+, T-bet and FoxP3+ cells was independently associated with EBV-related cHL in a multivariate model, (Table SVIIC).
Linear regression analysis was conducted for cHL, age, sex and EBV infection to detect the independent association of these variables with the proportion of cell biomarkers in the TME of cHL cases. The biomarkers with a P value ≤ 0.25 (in Table SVII) were entered into the linear logistic regression model for multivariate analysis. EBV infection was independently associated with a high proportion of CD8+, FoxP3+ and T-bet+ cells. FoxP3 association with EBV was still apparent (0.03) after correcting for CD8 and T-bet in a linear logistic regression. In contrast, the proportion of PD1+ immune cells was higher among EBV-unrelated cases, P = 0.02, (Table 3). In addition, the quantity of FoxP3+ cells was higher among males, P = 0.03 (Table 3).

4. Discussion

The association of EBV with HL has been established. Although EBV seroprevalence was high in Sub-Saharan Africa countries, studies related to EBV association with HL is scarce. The goal of current study was to evaluate expression of EBV markers in HL and determine associations with epidemiological factors and immune biomarkers in the microenvironment of HL. EBV positivity highly age dependent, with the highest fraction in younger HL patients, with a preponderance among males. In this study, cHL cases in the group of children and young adults (age ≤24 years) were most often associated with EBV (80%). This finding is in consistence with results from Kenya and the Middle East [11,34] and in opposition to what has been reported from Western countries.[35,36] In contrast to the developed countries, EBV infection in developing countries acquired during the early age of life[37]. We found that male HL cases were more often associated with EBV, confirming previous finding.[36,38] The sex variation in EBV infection between males and females may either be due to a higher rate of HL among males, as has been reported previously or due to sex genetic variation.[39,40,41] Also, female hormones are reported to protect against EBV infection.[9] In the present series, the MCCHL subtype was more often associated with EBV infection, followed by NSCHL, while all NLPHL cases were negative for EBV. The expression of LMP1/EBER has been associated with different clinicopathological features of HL, such as sex, age, and HL subtypes.[36]
EBV has been considered a risk factor for several types of lymphoma, including HL. However, the prevalence of EBV with HL has shown different association patterns in developing and developed countries. In the current study, EBV was detected in 66.4%, in line with findings from other sub-Saharan countries.[6] In USA and Europe, 30%-50% of HL cases are associated with EBV,[9] while 60-100% of HL cases have been associated with EBV in Asian and African countries.[15] The prevalence and age variations in EBV infection between developed and developing countries are perhaps due to socioeconomic, hygiene, geographical and genetic differences.[6,42,43]
The expression of the biomarkers used in this study, T-cells and T-cell subsets, have been confirmed and reported previously in several studies. For instance, the transcription factor C-maf has been used as an identification marker for Th2 in several series.[44,45] The transcription factors, FoxP3, T-bet and C-maf predominantly have been expressed on T-reg, Th1 and Th2 cells in the TME of HL.[24] In addition T-bet and C-maf have been detected in the HRSc.[45] In the TME of HL (cHL & NLPHL), the frequency of CD4+ cells was two times higher than the CD8+ cells, also in line with earlier reports.[46,47] Daussy and co-workers have described the CD4:CD8 ratio in lymphoma; their study revealed that the CD4 cell population was higher than the CD8 cell population in HL, a result comparable to our findings. In contrast, the CD4:CD8 shows an inverted ratio in diffuse large B-cell lymphoma DLBCL.[48]
In the TME of both types of HL (the cHL and the NLPHL), the expression of T-reg, Th1 and Th2 biomarkers (the CD4+ cell subsets) showed a significant variation. Most cells in the CD4+ population were of the Th2 subset, followed by the Th1 and T-reg subsets. The abundance of C-maf+ cells in the TME could reflect the polarization of CD4+ cells to be differentiated into the Th2 subset. The TME of cHL is reported to be high in C-maf+ and FoxP3+ cells.[24] The tumor cells of HL release signals to manage the type and activities of cells in their microenvironment, ensuring their proliferation, existence and escape immune surveillance.[24] The T-reg transcription factor (FoxP3) expression was higher among the cHL subtypes. In contrast, the number of PD1-expressing cells was higher among NLPHL. Possibly, the quantity and type of CD4+ cell subsets in the TME of HL might differ depending on the presence of EBV infection. Male sex was associated with higher expression of FoxP3 expression, a finding similar to what has been reported previously.[49]
Our study shows that the type and proportion of immune cells in the TME are highly influenced by the presence of EBV in the tumor cells (LMP1/EBER) of the classical Hodgkin lymphoma (cHL) cases. The abundance of CD4+ cells was similar in the microenvironment of EBV-related and EBV-negative cHL cases, as reported previously.[50] In contrast, the CD8+ cell population was higher in the EBV-related HL group. Foxp3 and T-bet, the transcription factors of T-reg and Th1 cells, were expressed in high levels in the microenvironment of EBV-related HL. The abundance of CD8 and T-bet, the biomarkers of T-cells related to the cellular-mediated immune response was high in EBV-related cHL. However, it is possible that the concomitant recruitment of cytotoxic-T-cells and Th1 with T-reg cells in the TME of EBV-related HL, would suppress the cytotoxic activities of CD8+ T-cells and Th1 cells, thereby ensuring the persistence and proliferation of the HRSCs. In line with our finding, a recent study indicated that HL with EBV was dominated by CD8+ T-cells and a mileu rich inTh1 cytokines.[22,51] EBV infection has a role in altering the immune component of the microenvironment of HL. EBV might be involved in the genetic dysfunction of the tumor cells; LMP1 constitutively activates several signaling cascades and pathways in the tumor cells,[52,53] which can induce the production of cytokines and chemokines used for the recruitment of various type of immune cells.[54]
An interesting finding was that while the EBV-related cHL was rich in Foxp3+ cells, the TME of EBV-unrelated cHL was rich in PD1+ cells. The differential recruitment of the T-cells (Foxp3+ vs PD1+) with immune suppressive/regulatory activities shows a differential strategy of HRSCs to escape the immune surveillances in the presence or absence of EBV. The difference in the cells expressing Foxp3 between the EBV-related and EBV-unrelated TME is significant, a result contradicting what has been reported previously.[22] Similar to what was reported by Wu and coworkers, an association of T-reg cells with cHL has been detected in the current series of cases. Our finding regarding the recruitment of T-reg in high quantity in the TME of EBV-related HL is consistent with what reported from Brazil[55] and France[56] and contradicted with reports from Germany.[51] High PD1+ cells with EBV-related breast cancer has been reported.[57] No difference was reported by Duffield and coworkers in the abundance of PD1+ cells between the EBV-related and unrelated HL,[51] The difference between our studies is in the method used for scoring the immune cells signature and the larger sample size used for this study.
A strength of our study is that of using an image analysis platform to quantify the expression of biomarkers in the TME of HL. Since the HL cases were from a Sub-Saharan country, the high association of EBV with HL made it possible to compare the microenvironment of EBV-related and EBV-unrelated cases. Due to resource limitation, we didn’t conduct multicolor immunohistochemistry.

5. Conclusions

The prevalence of EBV was high among HL cases in Ethiopia. Male sex, children, and young adults, and the MCCHL were significantly associated with EBV infection. The cellular composition of the microenvironment in HL is highly affected by EBV infection, the type and abundance of cells in the ME of HL are determined by EBV infection. EBV-related and EBV-unrelated HL use FOXP3+ cells and PD-1+ cells respectively to escape immunosurveillance. The difference in the microenvironment between the two groups of HL may have clinical implications. In addition, investigating and understanding, the microenvironment of HL in general, and the microenvironment of EBV-related and EBV-unrelated HL, is utmost importance in the growing era of immunotherapy to target the microenvironment. Therefore, the underlying mechanisms of Hodgkin lymphoma biology must be fully understood to bring molecular and pathology data into a clinical context for the best individualized treatment for the patients.

Supplementary Materials

The following supporting information can be downloaded at the website of this paper posted on Preprints.org.

Author Contributions

Conceptualization, M.A., Y.B., R.H., B.P., M.J. and A.G.; methodology, Y.B. and A.G..; validation, M.A. and Y.B.; formal analysis, M.A. and M.J.; writing—original draft preparation, M.A., R.H., M.J. and B.P.; project administration, B.P.; funding acquisition, M.J. All authors have read and agreed to the published version of the manuscript.

Institutional Review Board Statement

Ethical clearance was obtained from Addis Ababa University College of Natural Sciences, College of Health Sciences institutional ethics review boards and ethical re-view boards of Armauer Hansen Research Institute. The research has been conducted in accordance with the principles stated in the Declaration of Helsinki.

Informed Consent Statement

Informed consent was obtained from all subjects involved in the study.

Acknowledgments

The authors acknowledge the pathology teams of TASH and Armauer Hansen Research Institute (AHRI), Ethiopia. We are grateful to Kristina Lövgren for her technical support.

Conflicts of Interest

The authors report no conflicts of interest in this work. Except for Mats Jerkeman has research support: Abbvie, AstraZeneca, BMS, Roche, Janssen, Gilead, Genmab, Incyte, BeiGene

References

  1. Thorley-Lawson, D.A.; Gross, A. Persistence of the Epstein–Barr virus and the origins of associated lymphomas. New England Journal of Medicine 2004, 350, 1328–1337. [Google Scholar] [CrossRef] [PubMed]
  2. Fitzmaurice, C.; Allen, C.; Barber, R.M.; Barregard, L.; Bhutta, Z.A.; Brenner, H.; Dicker, D.J.; Chimed-Orchir, O.; Dandona, R.; Dandona, L. Global, regional, and national cancer incidence, mortality, years of life lost, years lived with disability, and disability-adjusted life-years for 32 cancer groups, 1990 to 2015: a systematic analysis for the global burden of disease study. JAMA oncology 2017, 3, 524–548. [Google Scholar] [PubMed]
  3. Biggar, R.J.; Henle, W.; Fleisher, G.; Böcker, J.; Lennette, E.T.; Henle, G. Primary Epstein-Barr virus infections in African infants. I. Decline of maternal antibodies and time of infection. International journal of cancer 1978, 22, 239–243. [Google Scholar] [CrossRef]
  4. Cohen, J.I. Epstein–Barr virus infection. New England journal of medicine 2000, 343, 481–492. [Google Scholar] [CrossRef] [PubMed]
  5. Gopal, S.; Wood, W.A.; Lee, S.J.; Shea, T.C.; Naresh, K.N.; Kazembe, P.N.; Casper, C.; Hesseling, P.B.; Mitsuyasu, R.T. Meeting the challenge of hematologic malignancies in sub-Saharan Africa. Blood, The Journal of the American Society of Hematology 2012, 119, 5078–5087. [Google Scholar] [CrossRef]
  6. Chang, C.M.; Kelly, J.Y.; Mbulaiteye, S.M.; Hildesheim, A.; Bhatia, K. The extent of genetic diversity of Epstein-Barr virus and its geographic and disease patterns: a need for reappraisal. Virus research 2009, 143, 209–221. [Google Scholar] [CrossRef]
  7. Thomas, R.; Re, D.; Zander, T.; Wolf, J.; Diehl, V. Epidemiology and etiology of Hodgkin's lymphoma. Annals of oncology 2002, 13, 147–152. [Google Scholar] [CrossRef]
  8. Dinand, V.; Dawar, R.; Arya, L.S.; Unni, R.; Mohanty, B.; Singh, R. Hodgkin’s lymphoma in Indian children: prevalence and significance of Epstein–Barr virus detection in Hodgkin’s and Reed–Sternberg cells. European Journal of Cancer 2007, 43, 161–168. [Google Scholar] [CrossRef]
  9. Glaser, S.L.; Lin, R.J.; Stewart, S.L.; Ambinder, R.F.; Jarrett, R.F.; Brousset, P.; Pallesen, G.; Gulley, M.L.; Khan, G.; O'Grady, J. Epstein-Barr virus-associated Hodgkin's disease: epidemiologic characteristics in international data. International journal of cancer 1997, 70, 375–382. [Google Scholar] [CrossRef]
  10. Chang, K.C.; Chen, P.C.H.; Jones, D.; Su, I.J. Changing patterns in the frequency of Hodgkin lymphoma subtypes and Epstein–Barr virus association in Taiwan. Cancer science 2008, 99, 345–349. [Google Scholar] [CrossRef]
  11. Al-Salam, S.; John, A.; Daoud, S.; Chong, S.M.; Castella, A. Expression of Epstein–Barr virus in Hodgkin lymphoma in a population of United Arab Emirates nationals. Leukemia & lymphoma 2008, 49, 1769–1777. [Google Scholar]
  12. Castillo, J.J.; Beltran, B.E.; Miranda, R.N.; Paydas, S.; Winer, E.S.; Butera, J.N. Epstein-Barr virus–positive diffuse large B-cell lymphoma of the elderly: what we know so far. The Oncologist 2011, 16, 87–96. [Google Scholar] [CrossRef] [PubMed]
  13. Mwakigonja, A.R.; Kaaya, E.E.; Heiden, T.; Wannhoff, G.; Castro, J.; Pak, F.; Porwit, A.; Biberfeld, P. Tanzanian malignant lymphomas: WHO classification, presentation, ploidy, proliferation and HIV/EBV association. BMC Cancer 2010, 10, 344. [Google Scholar] [CrossRef] [PubMed]
  14. Swerdlow, S.H.; Campo, E.; Pileri, S.A.; Harris, N.L.; Stein, H.; Siebert, R.; Advani, R.; Ghielmini, M.; Salles, G.A.; Zelenetz, A.D.; et al. The 2016 revision of the World Health Organization classification of lymphoid neoplasms. Blood 2016, 127, 2375–2390. [Google Scholar] [CrossRef] [PubMed]
  15. Kusuda, M.; Toriyama, K.; Kamidigo, N.O.; Itakura, H. A comparison of epidemiologic, histologic, and virologic studies on Hodgkin's disease in western Kenya and Nagasaki, Japan. The American journal of tropical medicine and hygiene 1998, 59, 801–807. [Google Scholar] [CrossRef]
  16. Moskowitz, C.H.; Ribrag, V.; Michot, J.-M.; Martinelli, G.; Zinzani, P.L.; Gutierrez, M.; De Maeyer, G.; Jacob, A.G.; Giallella, K.; Anderson, J.W. PD-1 blockade with the monoclonal antibody pembrolizumab (MK-3475) in patients with classical Hodgkin lymphoma after brentuximab vedotin failure: preliminary results from a phase 1b study (KEYNOTE-013). Blood 2014, 124, 290. [Google Scholar] [CrossRef]
  17. Ansell, S.M.; Lesokhin, A.M.; Borrello, I.; Halwani, A.; Scott, E.C.; Gutierrez, M.; Schuster, S.J.; Millenson, M.M.; Cattry, D.; Freeman, G.J. PD-1 blockade with nivolumab in relapsed or refractory Hodgkin's lymphoma. New England Journal of Medicine 2015, 372, 311–319. [Google Scholar] [CrossRef]
  18. Steidl, C.; Connors, J.M.; Gascoyne, R.D. Molecular pathogenesis of Hodgkin's lymphoma: increasing evidence of the importance of the microenvironment. Journal of Clinical Oncology 2011, 29, 1812–1826. [Google Scholar] [CrossRef]
  19. Ansell, S. Novel agents in the therapy of Hodgkin lymphoma. American Society of Clinical Oncology Educational Book 2015, 35, e479–e482. [Google Scholar] [CrossRef]
  20. Marshall, N.A.; Christie, L.E.; Munro, L.R.; Culligan, D.J.; Johnston, P.W.; Barker, R.N.; Vickers, M.A. Immunosuppressive regulatory T cells are abundant in the reactive lymphocytes of Hodgkin lymphoma. Blood 2004, 103, 1755–1762. [Google Scholar] [CrossRef]
  21. Greaves, P.; Clear, A.; Owen, A.; Iqbal, S.; Lee, A.; Matthews, J.; Wilson, A.; Calaminici, M.; Gribben, J.G. Defining characteristics of classical Hodgkin lymphoma microenvironment T-helper cells. Blood, The Journal of the American Society of Hematology 2013, 122, 2856–2863. [Google Scholar] [CrossRef] [PubMed]
  22. Wu, R.; Sattarzadeh, A.; Rutgers, B.; Diepstra, A.; van den Berg, A.; Visser, L. The microenvironment of classical Hodgkin lymphoma: Heterogeneity by Epstein–Barr virus presence and location within the tumor. Blood cancer journal 2016, 6, e417–e417. [Google Scholar] [CrossRef] [PubMed]
  23. Poppema, S.; van den Berg, A. Interaction between host T cells and Reed–Sternberg cells in Hodgkin lymphomas, Seminars in cancer biology, Elsevier, 2000, pp 345-350.
  24. Schreck, S.; Friebel, D.; Buettner, M.; Distel, L.; Grabenbauer, G.; Young, L.S.; Niedobitek, G. Prognostic impact of tumour-infiltrating Th2 and regulatory T cells in classical Hodgkin lymphoma. Hematological oncology 2009, 27, 31–39. [Google Scholar] [CrossRef] [PubMed]
  25. Wherry, E.J.; Ha, S.-J.; Kaech, S.M.; Haining, W.N.; Sarkar, S.; Kalia, V.; Subramaniam, S.; Blattman, J.N.; Barber, D.L.; Ahmed, R. Molecular signature of CD8+ T cell exhaustion during chronic viral infection. Immunity 2007, 27, 670–684. [Google Scholar] [CrossRef] [PubMed]
  26. Ahmadzadeh, M.; Johnson, L.A.; Heemskerk, B.; Wunderlich, J.R.; Dudley, M.E.; White, D.E.; Rosenberg, S.A. Tumor antigen–specific CD8 T cells infiltrating the tumor express high levels of PD-1 and are functionally impaired. Blood, The Journal of the American Society of Hematology 2009, 114, 1537–1544. [Google Scholar]
  27. Yamamoto, R.; Nishikori, M.; Kitawaki, T.; Sakai, T.; Hishizawa, M.; Tashima, M.; Kondo, T.; Ohmori, K.; Kurata, M.; Hayashi, T. PD-1–PD-1 ligand interaction contributes to immunosuppressive microenvironment of Hodgkin lymphoma. Blood, The Journal of the American Society of Hematology 2008, 111, 3220–3224. [Google Scholar] [CrossRef]
  28. Nishimura, H.; Nose, M.; Hiai, H.; Minato, N.; Honjo, T. Development of lupus-like autoimmune diseases by disruption of the PD-1 gene encoding an ITIM motif-carrying immunoreceptor. Immunity 1999, 11, 141–151. [Google Scholar] [CrossRef]
  29. Carbone, A.; Gloghini, A.; Cabras, A.; Elia, G. Differentiating germinal center-derived lymphomas through their cellular microenvironment. American journal of hematology 2009, 84, 435–438. [Google Scholar] [CrossRef]
  30. Muenst, S.; Hoeller, S.; Dirnhofer, S.; Tzankov, A. Increased programmed death-1+ tumor-infiltrating lymphocytes in classical Hodgkin lymphoma substantiate reduced overall survival. Human pathology 2009, 40, 1715–1722. [Google Scholar] [CrossRef]
  31. Aldinucci, D.; Gloghini, A.; Pinto, A.; De Filippi, R.; Carbone, A. The classical Hodgkin's lymphoma microenvironment and its role in promoting tumour growth and immune escape. The Journal of Pathology: A Journal of the Pathological Society of Great Britain and Ireland 2010, 221, 248–263. [Google Scholar] [CrossRef]
  32. Adam, M.; Bekueretsion, Y.; Abubeker, A.; Tadesse, F.; Kwiecinska, A.; Howe, R.; Petros, B.; Jerkeman, M.; Gebremedhin, A. Clinical Characteristics and Histopathological Patterns of Hodgkin Lymphoma and Treatment Outcomes at a Tertiary Cancer Center in Ethiopia. JCO Global Oncology 2021, 7, 277–288. [Google Scholar] [CrossRef]
  33. Lee, D.; Xiong, S.; Xiong, W.C. General introduction to in situ hybridization protocol using nonradioactively labeled probes to detect mRNAs on tissue sections. Methods Mol Biol 2013, 1018, 165–174. [Google Scholar] [CrossRef] [PubMed]
  34. Weinreb, M.; Day, P.J.; Niggli, F.; Green, E.K.; Nyong'o, A.O.; Othieno-Abinya, N.A.; Riyat, M.S.; Raafat, F.; Mann, J.R. The consistent association between Epstein-Barr virus and Hodgkin's disease in children in Kenya. Blood 1996, 87, 3828–3836. [Google Scholar] [CrossRef] [PubMed]
  35. Enblad, G.; Sandvej, K.; Sundstrom, C.; Pallesen, G.; Glimelius, B. Epstein-Barr Virus Distribution in Hodgkin's Disease in an Unselected Swedish Population. Acta Oncologica 1999, 38, 425–429. [Google Scholar] [CrossRef] [PubMed]
  36. Trimèche, M.; Bonnet, C.; Korbi, S.; Boniver, J.; de Leval, L. Association between Epstein-Barr virus and Hodgkin's lymphoma in Belgium: a pathological and virological study. Leuk Lymphoma 2007, 48, 1323–1331. [Google Scholar] [CrossRef] [PubMed]
  37. Ferressini Gerpe, N.M.; Vistarop, A.G.; Moyano, A.; De Matteo, E.; Preciado, M.V.; Chabay, P.A. Distinctive EBV infection characteristics in children from a developing country. International Journal of Infectious Diseases 2020, 93, 139–145. [Google Scholar] [CrossRef] [PubMed]
  38. Keresztes, K.; Miltenyi, Z.; Bessenyei, B.; Beck, Z.; Szollosi, Z.; Nemes, Z.; Olah, E.; Illes, A. Association between the Epstein-Barr Virus and Hodgkin’s Lymphoma in the North-Eastern Part of Hungary: Effects on Therapy and Survival. Acta Haematologica 2006, 116, 101–107. [Google Scholar] [CrossRef] [PubMed]
  39. Cozen, W.; Katz, J.; Mack, T.M. Risk patterns of Hodgkin's disease in Los Angeles vary by cell type. Cancer Epidemiology and Prevention Biomarkers 1992, 1, 261–268. [Google Scholar]
  40. Cartwright, R.A.; Gurney, K.A.; Moorman, A.V. Sex ratios and the risks of haematological malignancies. British journal of haematology 2002, 118, 1071–1077. [Google Scholar] [CrossRef]
  41. Shenoy, P.; Maggioncalda, A.; Malik, N.; Flowers, C.R. Incidence patterns and outcomes for hodgkin lymphoma patients in the United States. Adv Hematol 2011, 2011, 725219. [Google Scholar] [CrossRef]
  42. Chang, K.L.; Albújar, P.F.; Chen, Y.-Y.; Johnson, R.M.; Weiss, L.M. High Prevalence of Epstein-Barr Virus in the Reed-Sternberg Cells of Hodgkin’s Disease Occurring in Peru. Blood 1993, 81, 496–501. [Google Scholar] [CrossRef] [PubMed]
  43. Glaser, S.L.; Jarrett, R.F. The epidemiology of Hodgkin's disease. Baillieres Clin Haematol 1996, 9, 401–416. [Google Scholar] [CrossRef] [PubMed]
  44. Nurieva, R.I.; Duong, J.; Kishikawa, H.; Dianzani, U.; Rojo, J.M.; Ho, I.; Flavell, R.A.; Dong, C. Transcriptional regulation of th2 differentiation by inducible costimulator. Immunity 2003, 18, 801–811. [Google Scholar] [CrossRef] [PubMed]
  45. Atayar, Ç.; van den Berg, A.; Blokzijl, T.; Boot, M.; Gascoyne, R.D.; Visser, L.; Poppema, S. Hodgkin’s lymphoma associated T-cells exhibit a transcription factor profile consistent with distinct lymphoid compartments. Journal of clinical pathology 2007, 60, 1092–1097. [Google Scholar] [CrossRef] [PubMed]
  46. Henry, M.; Buck, S.; Savaşan, S. Flow cytometry for assessment of the tumor microenvironment in pediatric Hodgkin lymphoma. Pediatric blood & cancer 2018, 65, e27307. [Google Scholar]
  47. Menéndez, V.; Solórzano, J.L.; Fernández, S.; Montalbán, C.; García, J.F. The Hodgkin Lymphoma Immune Microenvironment: Turning Bad News into Good. Cancers 2022, 14, 1360. [Google Scholar] [CrossRef]
  48. Daussy, C.; Damotte, D.; Molina, T.J.; Roussel, M.; Fest, T.; Varin, A.; Perrot, J.-Y.; Ouafi, L.; Merle-Béral, H.; Julia, P. CD4: CD8 T-cell ratio differs significantly in diffuse large B-cell lymphomas from other lymphoma subtypes independently from lymph node localization. Int Trends Immun 2013, 1, 45–48. [Google Scholar]
  49. Gunduz, E.; Sermet, S.; Musmul, A. Peripheral blood regulatory T cell levels are correlated with some poor prognostic markers in newly diagnosed lymphoma patients. Cytometry Part B: Clinical Cytometry 2016, 90, 449–454. [Google Scholar] [CrossRef]
  50. Chetaille, B.; Bertucci, F.; Finetti, P.; Esterni, B.; Stamatoullas, A.; Picquenot, J.M.; Copin, M.C.; Morschhauser, F.; Casasnovas, O.; Petrella, T. Molecular profiling of classical Hodgkin lymphoma tissues uncovers variations in the tumor microenvironment and correlations with EBV infection and outcome. Blood, The Journal of the American Society of Hematology 2009, 113, 2765–3775. [Google Scholar] [CrossRef]
  51. Duffield, A.S.; Ascierto, M.L.; Anders, R.A.; Taube, J.M.; Meeker, A.K.; Chen, S.; McMiller, T.L.; Phillips, N.A.; Xu, H.; Ogurtsova, A. Th17 immune microenvironment in Epstein-Barr virus–negative Hodgkin lymphoma: Implications for immunotherapy. Blood advances 2017, 1, 1324–1334. [Google Scholar] [CrossRef]
  52. Kieser, A.; Sterz, K.R. The Latent Membrane Protein 1 (LMP1). Curr Top Microbiol Immunol 2015, 391, 119–149. [Google Scholar] [CrossRef] [PubMed]
  53. Liao, C.; Zhou, Q.; Zhang, Z.; Wu, X.; Zhou, Z.; Li, B.; Peng, J.; Shen, L.; Li, D.; Luo, X.; et al. Epstein-Barr virus-encoded latent membrane protein 1 promotes extracellular vesicle secretion through syndecan-2 and synaptotagmin-like-4 in nasopharyngeal carcinoma cells. Cancer Sci 2020, 111, 857–868. [Google Scholar] [CrossRef] [PubMed]
  54. Kis, L.L.; Takahara, M.; Nagy, N.; Klein, G.; Klein, E. Cytokine mediated induction of the major Epstein–Barr virus (EBV)-encoded transforming protein, LMP-1. Immunology Letters 2006, 104, 83–88. [Google Scholar] [CrossRef] [PubMed]
  55. Assis, M.C.; Campos, A.H.; Oliveira, J.S.; Soares, F.A.; Silva, J.M.; Silva, P.B.; Penna, A.D.; Souza, E.M.; Baiocchi, O.C. Increased expression of CD4+ CD25+ FOXP3+ regulatory T cells correlates with Epstein–Barr virus and has no impact on survival in patients with classical Hodgkin lymphoma in Brazil. Medical oncology 2012, 29, 3614–3619. [Google Scholar] [CrossRef]
  56. Morales, O.; Mrizak, D.; François, V.; Mustapha, R.; Miroux, C.; Depil, S.; Decouvelaere, A.V.; Lionne-Huyghe, P.; Auriault, C.; de Launoit, Y. Epstein–Barr virus infection induces an increase of T regulatory type 1 cells in Hodgkin lymphoma patients. British journal of haematology 2014, 166, 875–890. [Google Scholar] [CrossRef]
  57. Zhang, W.-t.; Zhu, G.-l.; Xu, W.-q.; Zhang, W.; Wang, H.-z.; Wang, Y.-b.; Li, Y.-x. Association of PD-1/PD-L1 expression and Epstein-–Barr virus infection in patients with invasive breast cancer. Diagnostic Pathology 2022, 17, 61. [Google Scholar] [CrossRef]
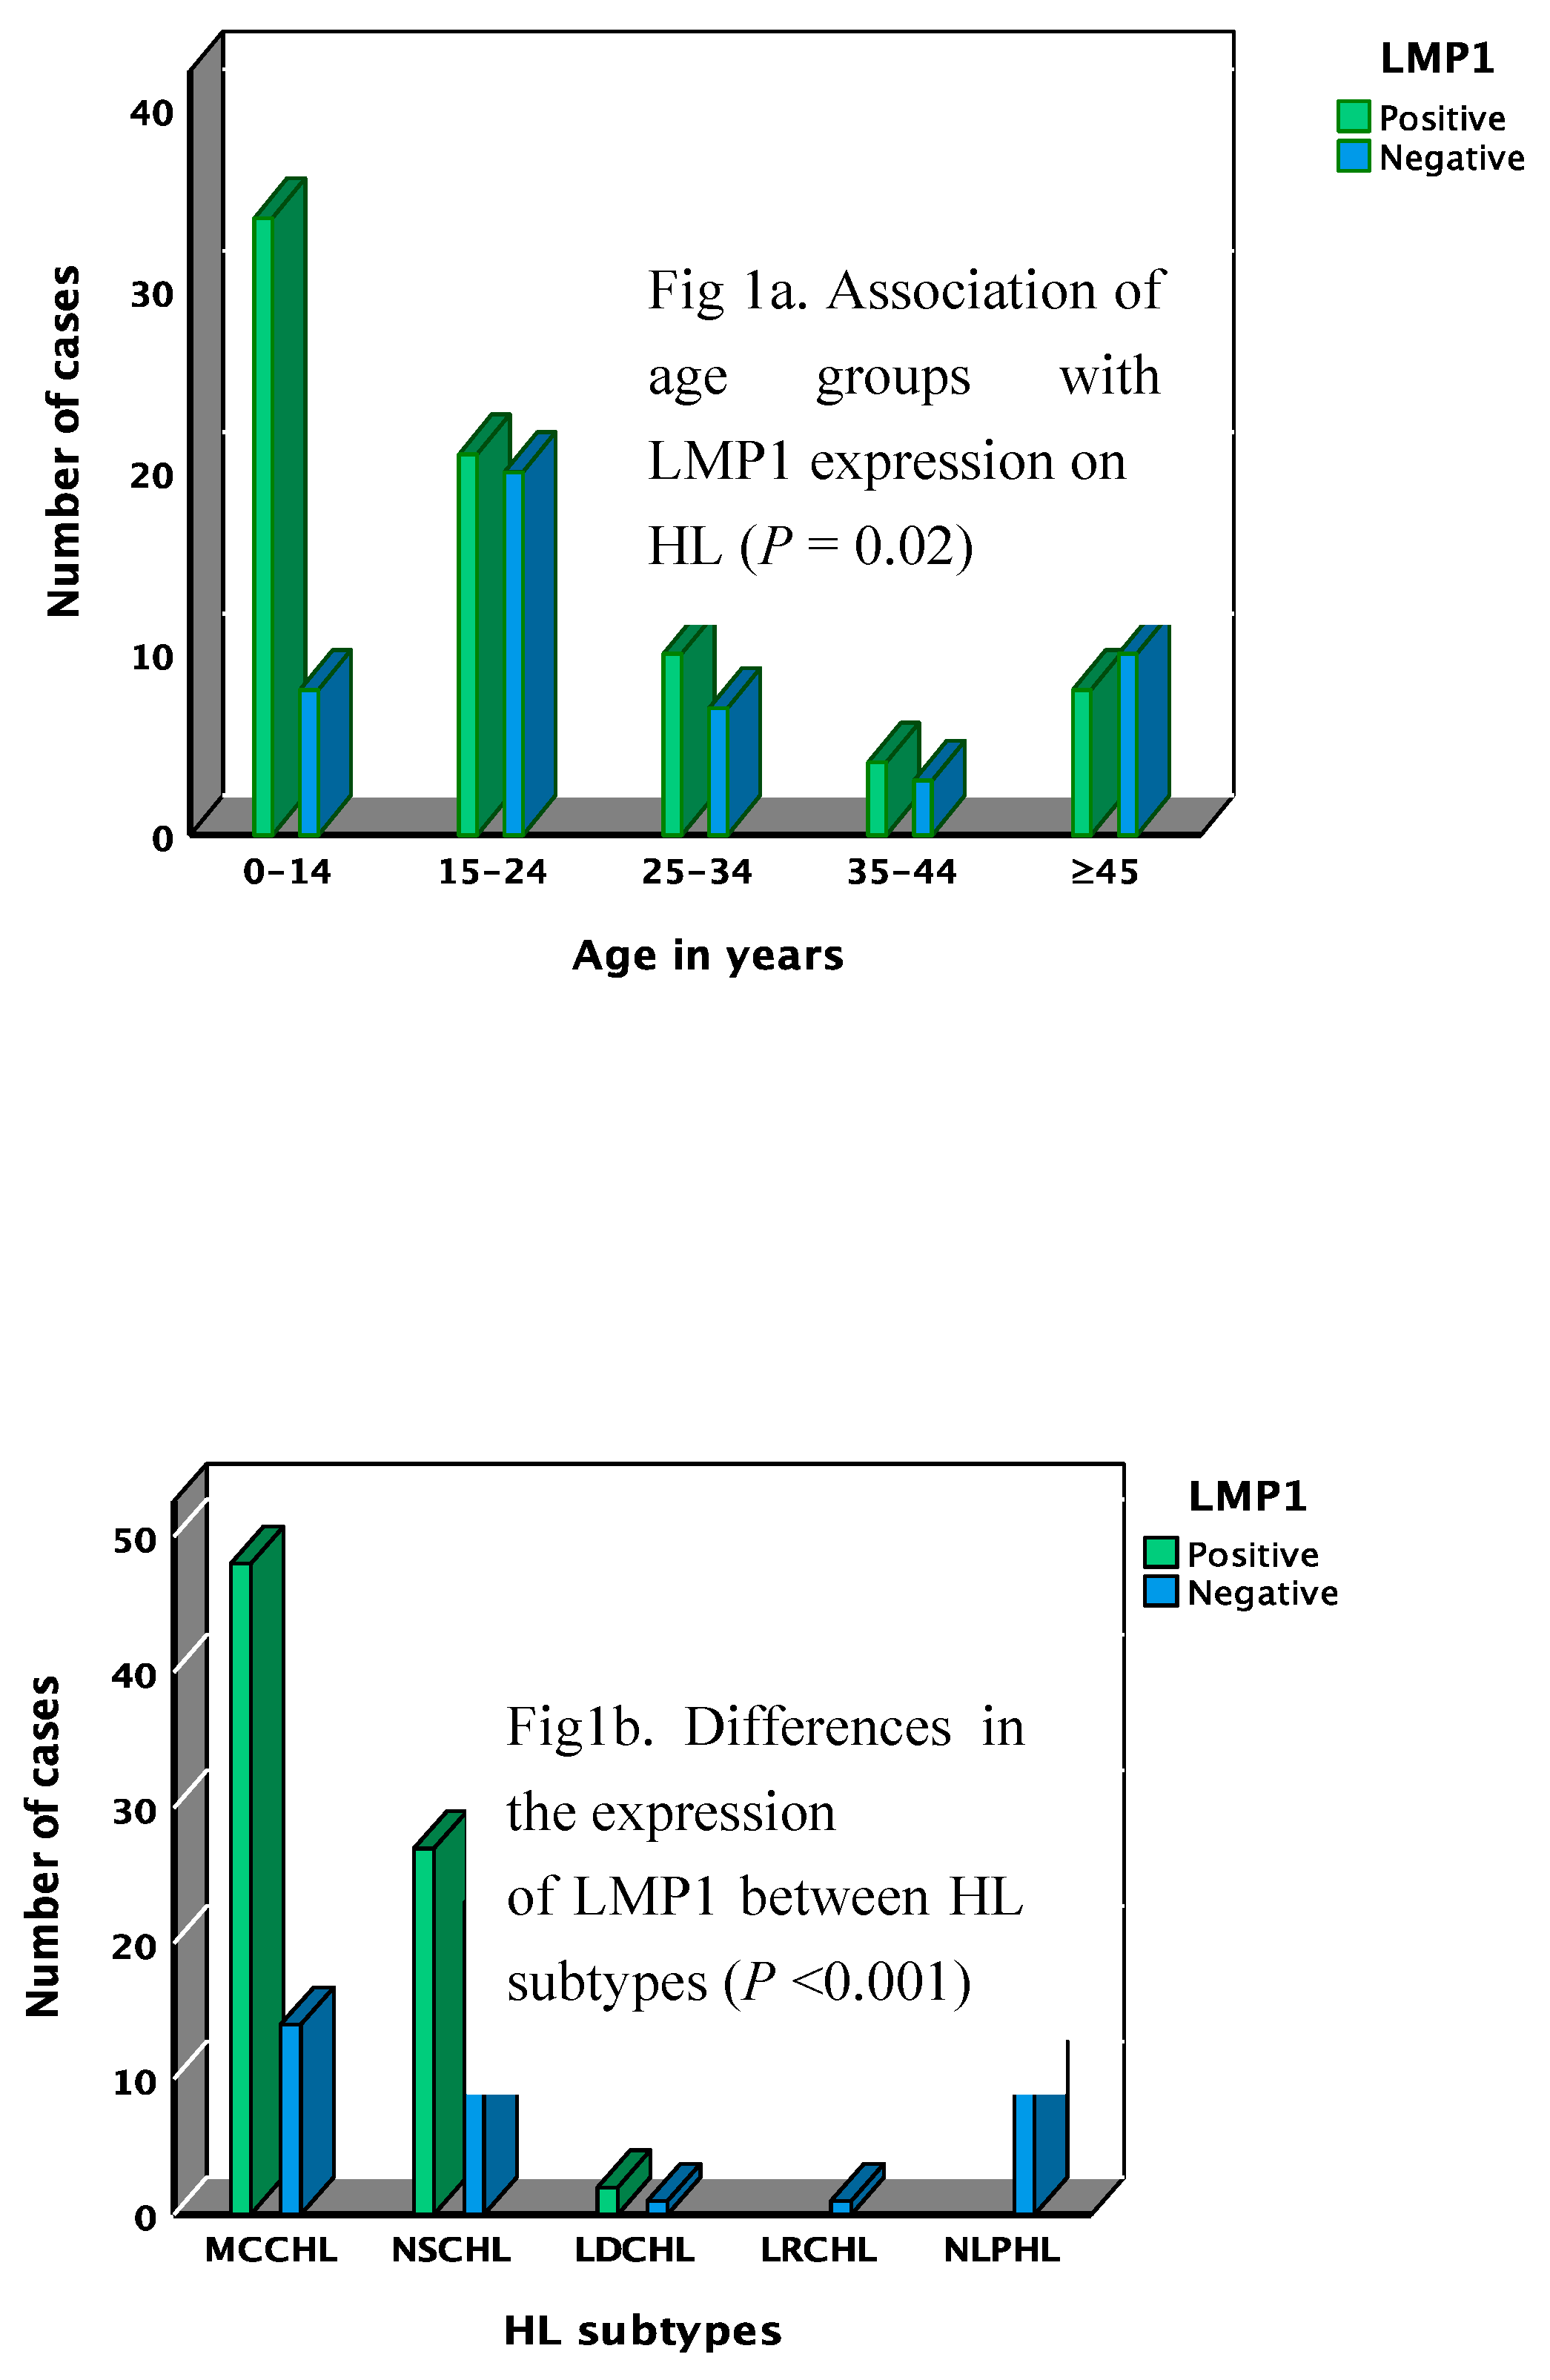
Figure 1. Image analysis quantification and phenotype characterization of the cell biomarkers in the TME of HL by IHC. a) Association of age groups with LMP1 expression on HL (P = 0.02). b) Differences in the expression.of LMP1 between HL subtypes (P <0.001).
Preprints 81083 g001
Figure 2. Mean differences of immune markers expression on the cells in the microenvironment of HL cases. Panel a through d represent data of all HL cases (cHL & NLPHL); (a) mean differences between CD3+ and CD20+ cells, (b) proportion of CD3, CD4, and CD8 and the mean difference between CD4+ and CD8+ cells, (c) proportion of T-cell subsets markers; C-maf, T-bet, FoxP3 and PD1, (d) mean difference between C-maf+ and T-bet+ cells. Panel e through i show differences of immune markers expression between cHL & NLPHL; .
Preprints 81083 g002
Figure 3. Mean differences of immune markers expression on the cells of the microenvironment (ME) of EBV-related and EBV-unrelated HL cases. (a) Proportion of CD3+ and CD20+ cells, (b) Proportion of CD3+, CD4+ and CD8+ cell, (c) Difference in CD8+ cells proportion in the ME of the two groups, (d) Difference between EBV-related and EBV-unrelated HL in CD4:CD8 ratio, (e) Proportion of C-maf+, T-bet+, FoxP3+ and PD1+ cells, (f) C-maf+ cells proportion in the ME of the two groups, (g) Difference in T-bet+ cells proportion between the two groups, (h) Difference in FoxP3+ cells proportion between the two groups, (i) Difference in PD1+ cells proportion in the ME between the two groups. P values are depicted where statistically significant. Data from panels f through i represent the same data from panel e but re-stratified by marker.
Preprints 81083 g003
Table 1. Characteristics of the primary antibody used in the study.
Antigen Clone Dilution Supplier Antigen-retrieval method
CD20cy L26 1:500 Agilent/DAKO PT-Link pH9
CD3 A0452 1:200 Agilent/DAKO PT-Link pH9
LMP1 CS1-4 1:100 CellMarque PT-Link pH9
CD4 4B12 1:60 Agilent/DAKO PT-Link pH9
CD8 C8/1244B 1:100 Agilent/DAKO PT-Link pH9
FoxP3 236A/E7 1:200 Abcam PT-Link pH9
T-bet EPR9302 1:500 Abcam PT-Link pH9
C-maf EPR16484 1:200 Abcam PT-Link pH9
PD-1 NAT105 1:100 CellMarque 2100 Retiever pH6
Table 2. EBV association with the age, sex, and HL subtypes of CHL cases.
EBV Marker/ Characteristics Wald x2(1) COR** (95% CI) P* Wald x2(1) Adj OR*** (95% CI), P*
N = 126
LMP1
Age 4.2 1.02 (1.001-1.06), 0.03 3.03 1.03 (0.9-1.05), 0.08
Sex 6.3 3 (1.3-7), 0.012 4.9 2.9 (1.1-7), 0.026
CHL subtypes§ 5.05 2 (1.09-3.6), 0.025 6.6 2.3 (1.2-4.2), 0.01
*Logistic regression, **COR: crude odds ratio, ***Adj OR: adjusted odds ratio, §CHL subtypes: MCCHL vs other subtypes.
Table 3. The association of clinical characteristics of HL with the expression of biomarkers in the TME of CHL.
Biomarker/HL characteristics Count/mm2 Perecent/mm2
Adj OR (95% CI), P* Adj OR (95%CI), P*
CD8
LMP1 2.3 (183-2625), 0.025 2.7 (2-21), 0.012
Sex -1.4 (-2310-397), 0.2 -1.5 (-18-2), 0.1
CHL subtype§ -1.3 (-1351-301), 0.2 -0.9 (-9-3), 0.4
FOXP3
LMP1 3 (237-1094), 0.003 2.1 (0.16-7), 0.04
Sex 2.2 (47-958), 0.03 2.3 (0.5-8), 0.026
CHL subtypes§ -0.9 (-414-148), 0.4 -0.3 (-2.6-1.9), 0.7
Age 1.8 (-1-27), 0.08 1.6 (-0.02-0.2), 0.1
T-bet
LMP1 3.5 (709-2578), <0.001 4 (7-21), <0.001
Age 2.3 (5-70), 0.021 2.5 (0.07-0.56), 0.014
PD1
LMP1 -2.3 (-2030-(-162)), 0.02 -2.3 (-15-(-1)), 0.02
Age 1.8 (-2-60), 0.07 1.2 (-0.1-0.4), 0.3
*Linear regression, §CHL subtypes: MCCHL vs other subtypes.
Disclaimer/Publisher’s Note: The statements, opinions and data contained in all publications are solely those of the individual author(s) and contributor(s) and not of MDPI and/or the editor(s). MDPI and/or the editor(s) disclaim responsibility for any injury to people or property resulting from any ideas, methods, instructions or products referred to in the content.
Copyright: This open access article is published under a Creative Commons CC BY 4.0 license, which permit the free download, distribution, and reuse, provided that the author and preprint are cited in any reuse.
Prerpints.org logo

Preprints.org is a free preprint server supported by MDPI in Basel, Switzerland.

Subscribe

© 2024 MDPI (Basel, Switzerland) unless otherwise stated