
Submitted:
28 July 2023
Posted:
01 August 2023
You are already at the latest version
Abstract
In this paper a more flexible extension of the Fréchet distribution is introduced. The new distribution is defined by means of the stochastic representation as the quotient of two independent random variables, a Fréchet distribution and the power of a random variable with uniform distribution in the interval (0,1). We will call this new extension the Slash Fréchet distribution and one of its main characteristics is that its tails are heavier than the Fréchet distribution. The general density of this distribution and some basic properties are determined. Its moments, skewness coefficients and kurtosis are calculated. In addition, the estimation of the model parameters is obtained by the method of moments and maximum likelihood. Finally, two applications with real data are performed by fitting the new model and comparing it with the Fréchet distribution.
Keywords:
Fréchet distribution
; Slash distribution
; kurtosis coefficient
; moment estimators
; maximum likelihood estimator
1. Introduction
The Fréchet distribution is named after the French mathematician Maurice Fréchet, who developed it in 1927 [1]. This model is also known as the inverse Weibull distribution and is a special case of the generalized distribution of extreme values. The Fréchet model is used to model maximum values in a data set, such as flood analysis, maximum rainfall, survival analysis, and river discharge in hydrology. More details on the Fréchet distribution can be found in Kotz and Nadarajah [2]. The probability density function of the Fréchet model (Fr) is defined as:
where and is the shape parameter, which we denote as . Properties of this distribution are presented below:
- , where is the cumulative distribution function of X.
- where is the quantile function of X.
- , is the r-th moment of X
Some extensions of the Fréchet distribution that are available in the literature are the exponentiated Frechet (EFr) (Nadarajah and Kotz [3]), Beta Frechet (BFr) (Nadarajah and Gupta [4]), Weibull- Fréchet (WFr) (A. Z. Afify et al. [5]) and Beta Generalized Exponentiated Fréchet (BGEFr) (M. M. Badr [6]), among others.
On the other hand, another important distribution for the development of this work is the Slash distribution, which is represented as the quotient between two independent random variables, a normal distribution and a uniform power (see Johnson et al. [7] ). Therefore, we say that X has a Slash (S) distribution if its stochastic representation is given by:
where and are independent random variables and is the kurtosis parameter. It will be denoted as and its density function has the following expression:
where is the lower incomplete gamma function.
Rogers and Tukey [8] introduce the Slash distribution as an alternative distribution to the standard normal distribution, but with heavier tails. Kadafar [9] proposes maximum likelihood estimators for location and scale parameters. Gómez, Quintana and Torres [10] and Gómez and Venegas [11] generalize the Slash distribution by introducing the family of Slash-elliptic distributions. Genc [12] discusses the symmetric case of a generalization of the Slash distribution. Reyes, Gómez and Bolfarine [13] propose a modification to the classical Slash distribution by changing the uniform distribution to an exponential distribution in its stochastic representation and Rojas, Bolfarine and Gómez [14] extend the Slash distribution by considering a random variable with Beta distribution in the denominator.
In this work, a new extension of the Fréchet (Fr) distribution is introduced, with the objective that this new family presents greater kurtosis than the Fr distribution and therefore, allows the modeling of positive data with atypical observations.
The paper is presented as follows. Section 2 shows the stochastic representation of the model, the density function, some basic properties, moments and the coefficient of skewness and kurtosis. In section 3, we obtain the parameter estimators by the method of moments (MM) and maximum likelihood (MV), ending with a simulation study to observe the asymptotic behavior of the MV estimators. In section 4, we show two illustrations on real data sets. In section 5 we provide some conclusions.
2. The Slash Fréchet Distribution
2.1. Density Function
Definition 1.
We will say that a random variable Y is Slash Fréchet distributed with shape parameter α and kurtosis parameter q, denoted by , if its stochastic representation is:
where and are independent random variables with and .
The following Proposition presents the density function of the SFr distribution.
Proposition 1.
Let , then the density function of Y is given by:
where , , , and is the upper incomplete gamma function.
Proof.
Using the stochastic representation given in (1) and using the random vector transformation method, it follows that
Then, , marginalizing with respect to the random variable W, we have that
and making the change of variable , the result is obtained. □
Corollary 1.
If , we will say that Y is canonical Slash Fréchet distributed and its density function is:
where is the upper incomplete gamma function and is denoted as .
Proof.
Making in Proposition (1), the result is obtained. □
On the left side of the Figure 1 the SFr and Fr distribution is shown for and different values of the parameter q, on the right side, a zoom of the graphical representation of the tails, in which it is observed that the lower the value of the parameter q, the density function of the SFr distribution presents greater kurtosis.
2.2. Properties
In this subsection we show some properties of the SFr distribution.
Proposition 2.
Let , then the cumulative distribution function (cdf) of Y is given by:
where , , and is the upper incomplete gamma function.
Proof.
Using the definition of CDF, we obtain
Considering the following change of variable: and developing the integral, the result is obtained. □
Figure 2 shows the graphical comparison of the cdf of the SFr model for () and different values of q, with the Fr distribution. It can be seen that for smaller values of the q parameter, the growth of the cdf in the SFr distribution is slower, which implies greater flexibility when working with data with high kurtosis.
Proposition 3.
Let , then the survival function and the hazard function of Y, respectively, are given by:
where , , .
Proof.
Using the definition of survival function and hazard function,
Substituting and , we get the result. □
Table 1 shows for different values of y for the mentioned models, in which it is observed that the SFr distribution presents heavier tails than the Fr distribution.
Figure 3 shows the survival function (left side) and the hazard function (right side) for and different values of q, compared to the Fr distribution. It can be seen that as the parameter q increases, the SFr distribution has heavier tails than the Fr distribution.
Proposition 4.
Let and , then .
Proof.
The marginal density function of Y is given by:
Considering the change of variable , the result is obtained. □
Proposition 5.
Let . If , then Y converges in distribution to the random variable
Proof.
Let and given in (1). First, the probability convergence of is studied. We have that, and if , then, , therefore, it is obtained that:
where if , therefore (See Lehmann [15]), where denotes convergence in probability.
Finally, applying Slutsky’s theorem [15] for we have that , where denotes convergence in distribution. □
2.3. Moments
Proposition 6.
Let , then the moment of order r of Y is given by:
Proof.
Using the stochastic representation given in (1) and considering that X and U are independent random variables, we have:
where , and , , are the moments of order r of and X respectively, where and . □
Corollary 2.
If , then it follows that
Proof.
Replacing in Proposition (6), the result is obtained. □
Corollary 3.
If , then the expectation and variance of Y are given by:
Proof.
Using and from Corollary (2), considering and , the result is obtained. □
Proposition 7.
Let , then the skewness coefficient of Y is given by:
where , .
Proof.
Using the definition of the standardized skewness coefficient
and substituting , and given in the Corollary (2) and , the result is obtained. □
The left side of the Figure 4 shows the behavior of the skewness coefficient as a function of the parameters and q, in which it is observed that as the value of q decreases, the value of the skewness coefficient increases. In addition, on the right side of the Figure 4, it is shown that when the parameter q tends to ∞, the value of the skewness coefficient of the SFr distribution tends to the value of the skewness coefficient of the Fr distribution.
Proposition 8.
Let , then the kurtosis coefficient of Y is given by:
where , .
Proof.
Using the definition of the standardized kurtosis coefficient
and substituting the expressions obtained in Corollary (2) and , the result is obtained. □
The left side of Figure 5 shows the behavior of the kurtosis coefficient as a function of the parameters and q, in which it is observed that as the value of q decreases, the kurtosis coefficient increases. Furthermore, on the right side of Figure 5 it is observed that when the parameter q tends to ∞, the value of the kurtosis coefficient of SFr distribution tends to the value of the kurtosis coefficient of Fr distribution.
3. Estimation
In this section we study two methods of estimating the parameters of the Slash Fréchet distribution. First, the method of moments and the maximum likelihood method are used and then a simulation study is performed using the maximum likelihood method.
3.1. Moment estimators
Proposition 9.
Let be a random sample of the random variable Y with distribution , then the moment estimators for can be obtained by numerically solving the following nonlinear system of equations:
where and are the first two sample moments of Y.
Proof.
Using the equations (8) and (9) in Corollary (2) and equating the sample moments to the population moments, we have
solving the equation (16) for q we obtain given in (14). Then, substituting into equation (17), we obtain the equation given in (15), which solving by numerical methods, using the "uniroot"function of the R software, we obtain and then, replacing in Equation (14) we obtain . □
3.2. Maximum likelihood estimators
Let , be a random sample of size n of a random variable Y with distribution , then the log-likelihood function for can be expressed as:
where .
Partially deriving the log-likelihood function with respect to and q and setting them equal to zero, we obtain the normal equations:
where,
3.3. Simulation study
In this section we study the behavior of the maximum likelihood estimators for the parameters and q. 1000 samples of size 50, 100, 150 and 200 were used for the Slash Fréchet distribution and in each one the parameters and q were estimated. In addition, the mean of the estimators ( and ), the mean of the standard errors () and the coverage percentage (C) were calculated. The results are shown in Table 2. Next, the algorithm used to generate random samples of is developed.
- Generate
- Compute
- Generate
- Compute
Table 2 shows that as the sample size increases, the mean of the standard errors decreases and the values of the estimators approach the values of the parameters and q, indicating that the estimators are consistent. On the other hand, the coverage percentages approach the nominal value with which they were constructed (95%).
4. Applications
In this section, two applications with real data are presented to compare the fit of the SFr distribution with the Fr model. The maximum likelihood method was used to obtain the estimators of the and q parameters and their estimation errors were calculated through the Hessian matrix. To compare the distributions, the Akaike information criterion (AIC), presented in Akaike [17] and the Bayesian information criterion (BIC) in Schwarz [18] were considered.
4.1. Application 1 (Patients with lung cancer)
The first data set corresponds to a study conducted by the US Veterans Administration, where the time elapsed between diagnosis and the start of the study (in months) of 137 patients with advanced lung cancer was recorded. This dataset where presented by Kalbfleisch [19] and are avalaible in the survival R package [16], labeled as veteran.
Table 3 presents the descriptive statistics for this dataset: sample mean, sample standard desviation, sample skewness () and sample kurtosis coefficient (), in which we highlight the high level of kurtosis of the data. On the other hand, Figure 6 shows a boxplot for the data, showing the possible existence of outliers.
Table 4 shows the results of the fit performed, comparing the SFr distribution with the Fréchet (Fr) distribution by means of the Akaike information criterion (AIC) and Bayesian criterion (BIC). It is concluded that the SFr distribution performs the best fit to this data set compared to the Fr distribution, because it has a lower value on the AIC and BIC criteria.
In Figure 7, the histogram of the data set of lung cancer patients fitted to the densities of the Fr and SFr distributions is presented. Note that the SFr model fit has heavier tails. Figure 8 illustrates qqplots, where it can be seen that the theoretical quantiles of the SFr model are close to the line compared to the Fr distribution.
4.2. Application 2 (Charity fundraising percentage data)
The second dataset consider on fundraising expenses as a percentage of total expenditures for a random sample of 60 charities from the United States. This dataset can be obtained in Devore [20]. Table 5 presents the descriptive summary of the data and Figure 1 shows a boxplot for the Charity fundraising percentage dataset, where atypical observations and high kurtosis can be seen.
Table 6 shows the results of the fit performed, which shows that the SFr distribution performs the best fit of this data set compared to the Fr model, because it has a lower value in the AIC and BIC criteria.
Figure 10 shows the histogram of the lymph node data set adjusted to the densities of the Fr and SFr distributions, where it is evident that the SFr distribution performs a better fit than the Fr model, specifically in the right tail of Figure 11. On the other hand, Figure 2 shows qqplots, where the good fit of the SFr distribution is visualized.
5. Conclusions
In this work, a new distribution is studied that is an extension of the Fréchet distribution, which showed greater flexibility in the modeling of the kurtosis coefficient.
When carrying out the study of the new Slash Fréchet distribution, it is concluded:
- A new extension of the Fréchet distribution with density function, cumulative distribution function, survival function and hazard function is obtained explicitly (closed) in terms of the incomplete gamma function.
- The moments, expectation and variance of this new distribution were obtained, obtaining closed expressions for all of them.
- Observing the skewness and kurtosis coefficients shows that the SFr model is more flexible than the Fr model. Furthermore, as shown in Table 1, the tails of the distribution become heavier when the parameter q is smaller.
- Analyzing the stochastic representation for the SFr model, it is observed that the SFr distribution is a scale mixture of the Fr and distribution.
- In the simulation study it was observed that as the sample size increases, the maximum likelihood estimators get closer to the parameter values, suggesting consistent and stable estimators.
- In applications with real data, it was observed that the SFr distribution performs better fits to the data, compared to the Fr model, because it has a lower value on the AIC and BIC criteria.
Author Contributions
Conceptualization, J.S.C and J.R ; methodology, M.A.R and J.R; software, J.S.C; validation, J.R and M.A.R; formal analysis, J.S.C, M.A.R and J.R; investigation, J.S.C, M.A.R and J.R; data curation, J.S.C.; writing—original draft preparation, J.S.C, M.A.R and J.R.; supervision, M.A.R and J.R. All authors have read and agreed to the published version of the manuscript.
Funding
The research of J.S.C, M.A.R and J.R was supported by SEMILLERO UA-2022 project, Chile.
Data Availability Statement
The data set used in Section 4 was duly referenced.
Conflicts of Interest
The authors declare no conflict of interest.
References
- Fréchet, M. Sur la loi de Probabilité de l’écart Maximum. Ann. Soc. Polon. Math. Cracovie 1927, 6, 93–116. [Google Scholar]
- Kotz, S.; Nadarajah, S. Extreme Value Distributions: Theory and Applications. Imperial College Press: London, UK, 2000. [Google Scholar]
- Nadarajah, S.; Kotz, S. The Exponentiated Fréchet distribution. Interstat Electron. J. 2003, 14, 1–7. [Google Scholar]
- Nadarajah, S.; Gupta, A. K. The Beta Fréchet distribution. Far East J. Theoret. Statist. 2004, 14, 15–24. [Google Scholar]
- Afify, AZ.; Yousof, HM.; Cordeiro, GM.; Ortega, E.M.M.; Nofal, Z.M. The Weibull Frechet distribution and its applications. Journal of Applied Statistics. 2016, 43, 2608–2626. [Google Scholar] [CrossRef]
- Badr, MM. Beta Generalized Exponentiated Fréchet Distribution with Applications. Open Physics. 2019, 17(1), 687–697. [Google Scholar] [CrossRef]
- Johnson, N.L.; Kotz, S.; Balakrishnan, N. Continuous Univariate Distributions., 2nd ed.; Wiley: New York, NY, USA, 1995; Volume 1. [Google Scholar]
- Rogers, WH.; Tukey, JW. Understanding some long-tailed symmetrical distributions. Statist. Neerl. 1972, 26, 211–226. [Google Scholar] [CrossRef]
- Kafadar, K. A biweight approach to the one-sample problem. J. Am. Stat. Assoc. 1982, 77, 416–424. [Google Scholar] [CrossRef]
- Gómez, HW.; Quintana, FA.; Torres, FJ. A new family of slash-distributions with elliptical contours. Stat. Probab. Lett. 2007, 77, 717–725. [Google Scholar] [CrossRef]
- Gómez, HW.; Venegas, O. Erratum to: A new family of slash-distributions with elliptical contours. Stat. Probab. Lett. 2008, 78, 2273–2274. [Google Scholar] [CrossRef]
- Genc, A.I. A Generalization of the Univariate Slash by a Scale-Mixture Exponential Power Distribution. Communications in Statistics - Simulation and Computation 2007, 36, 937–947. [Google Scholar] [CrossRef]
- Reyes, J.; Gómez, H. W.; Bolfarine, H. Modified slash distribution. Statistics. 2013, 47, 929–941. [Google Scholar] [CrossRef]
- Rojas, M.A.; Bolfarine, H.; Gómez, H. W. An extension of the slash-elliptical distribution. SORT. 2014, 38, 215–230. [Google Scholar]
- Lehmann, E.L. Elements of Large-Sample Theory; Springer: New York, NY, USA, 1999. [Google Scholar]
- R Core Team. R: A language and environment for statistical computing. Vienna, Austria, 2022. Available online: https://www.R-project.org/ (accessed on 2 January 2023).
- Akaike, H. A new look at the statistical model identification. IEEE Trans. Autom. Control. 1974, 19, 716–723. [Google Scholar] [CrossRef]
- Schwarz, G. Estimating the dimension of a model. Ann. Stat. 1978, 6, 461–464. [Google Scholar] [CrossRef]
- Kalbfleisch, J.D.; Prentice, R.L. The statistical analysis of failure time data; John Wiley and Sons: New York, NY, USA, 1980. [Google Scholar]
- Devore, J. Probability and Statistics for Engineering and the Sciences, 9th ed.; Cengage Learning: Boston, MA, USA, 2014. [Google Scholar]
Figure 1.
Graphical comparison of the density function of the Fréchet (Fr) and Slash Fréchet (SFr) distributions for fixed alpha () and different values of q.
Figure 1.
Graphical comparison of the density function of the Fréchet (Fr) and Slash Fréchet (SFr) distributions for fixed alpha () and different values of q.
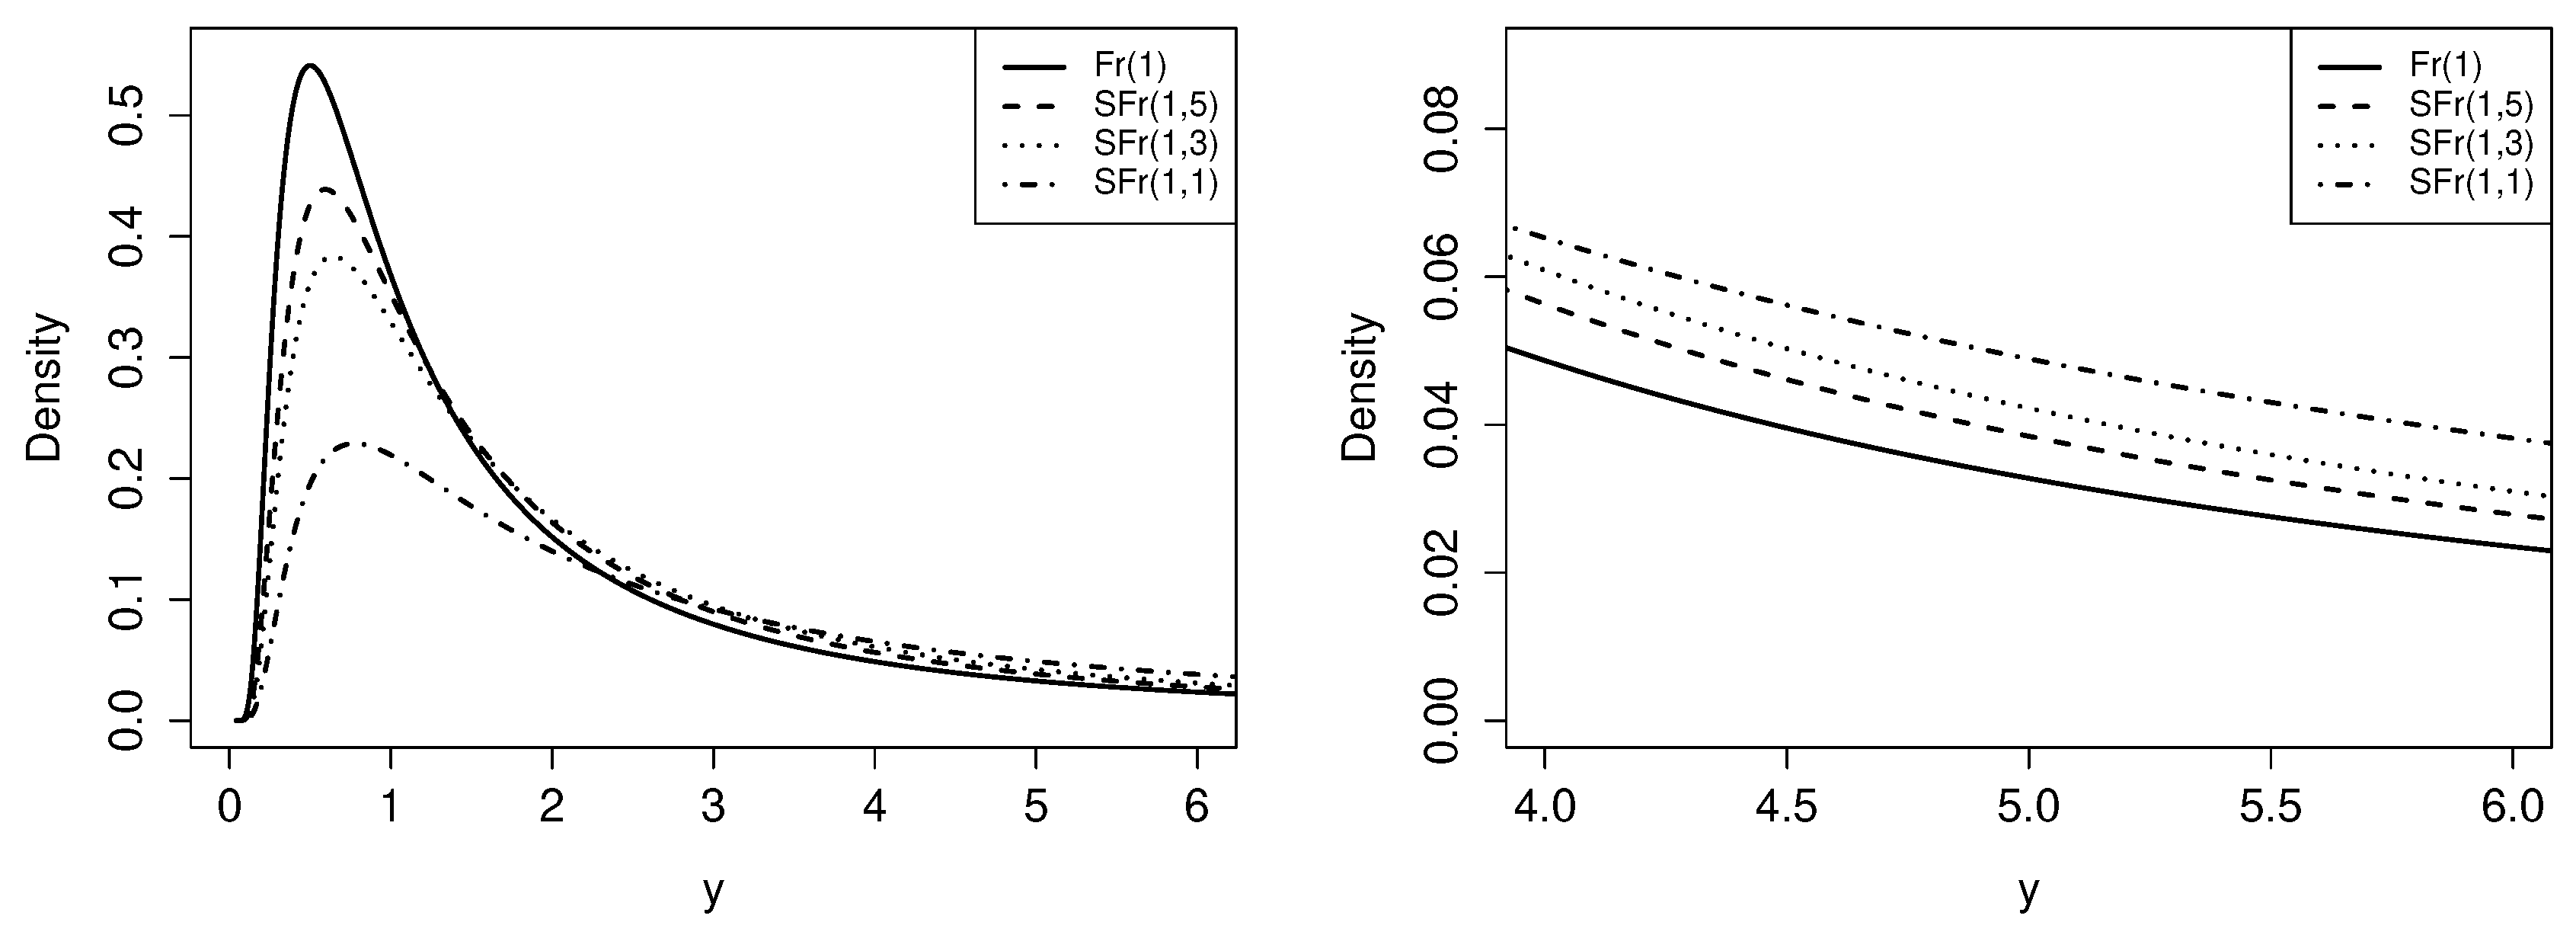
Figure 2.
Graphical comparison of the CDF between the Fréchet (Fr) and Slash Fréchet (SFr) distribution for fixed alpha () and different values of q.
Figure 2.
Graphical comparison of the CDF between the Fréchet (Fr) and Slash Fréchet (SFr) distribution for fixed alpha () and different values of q.
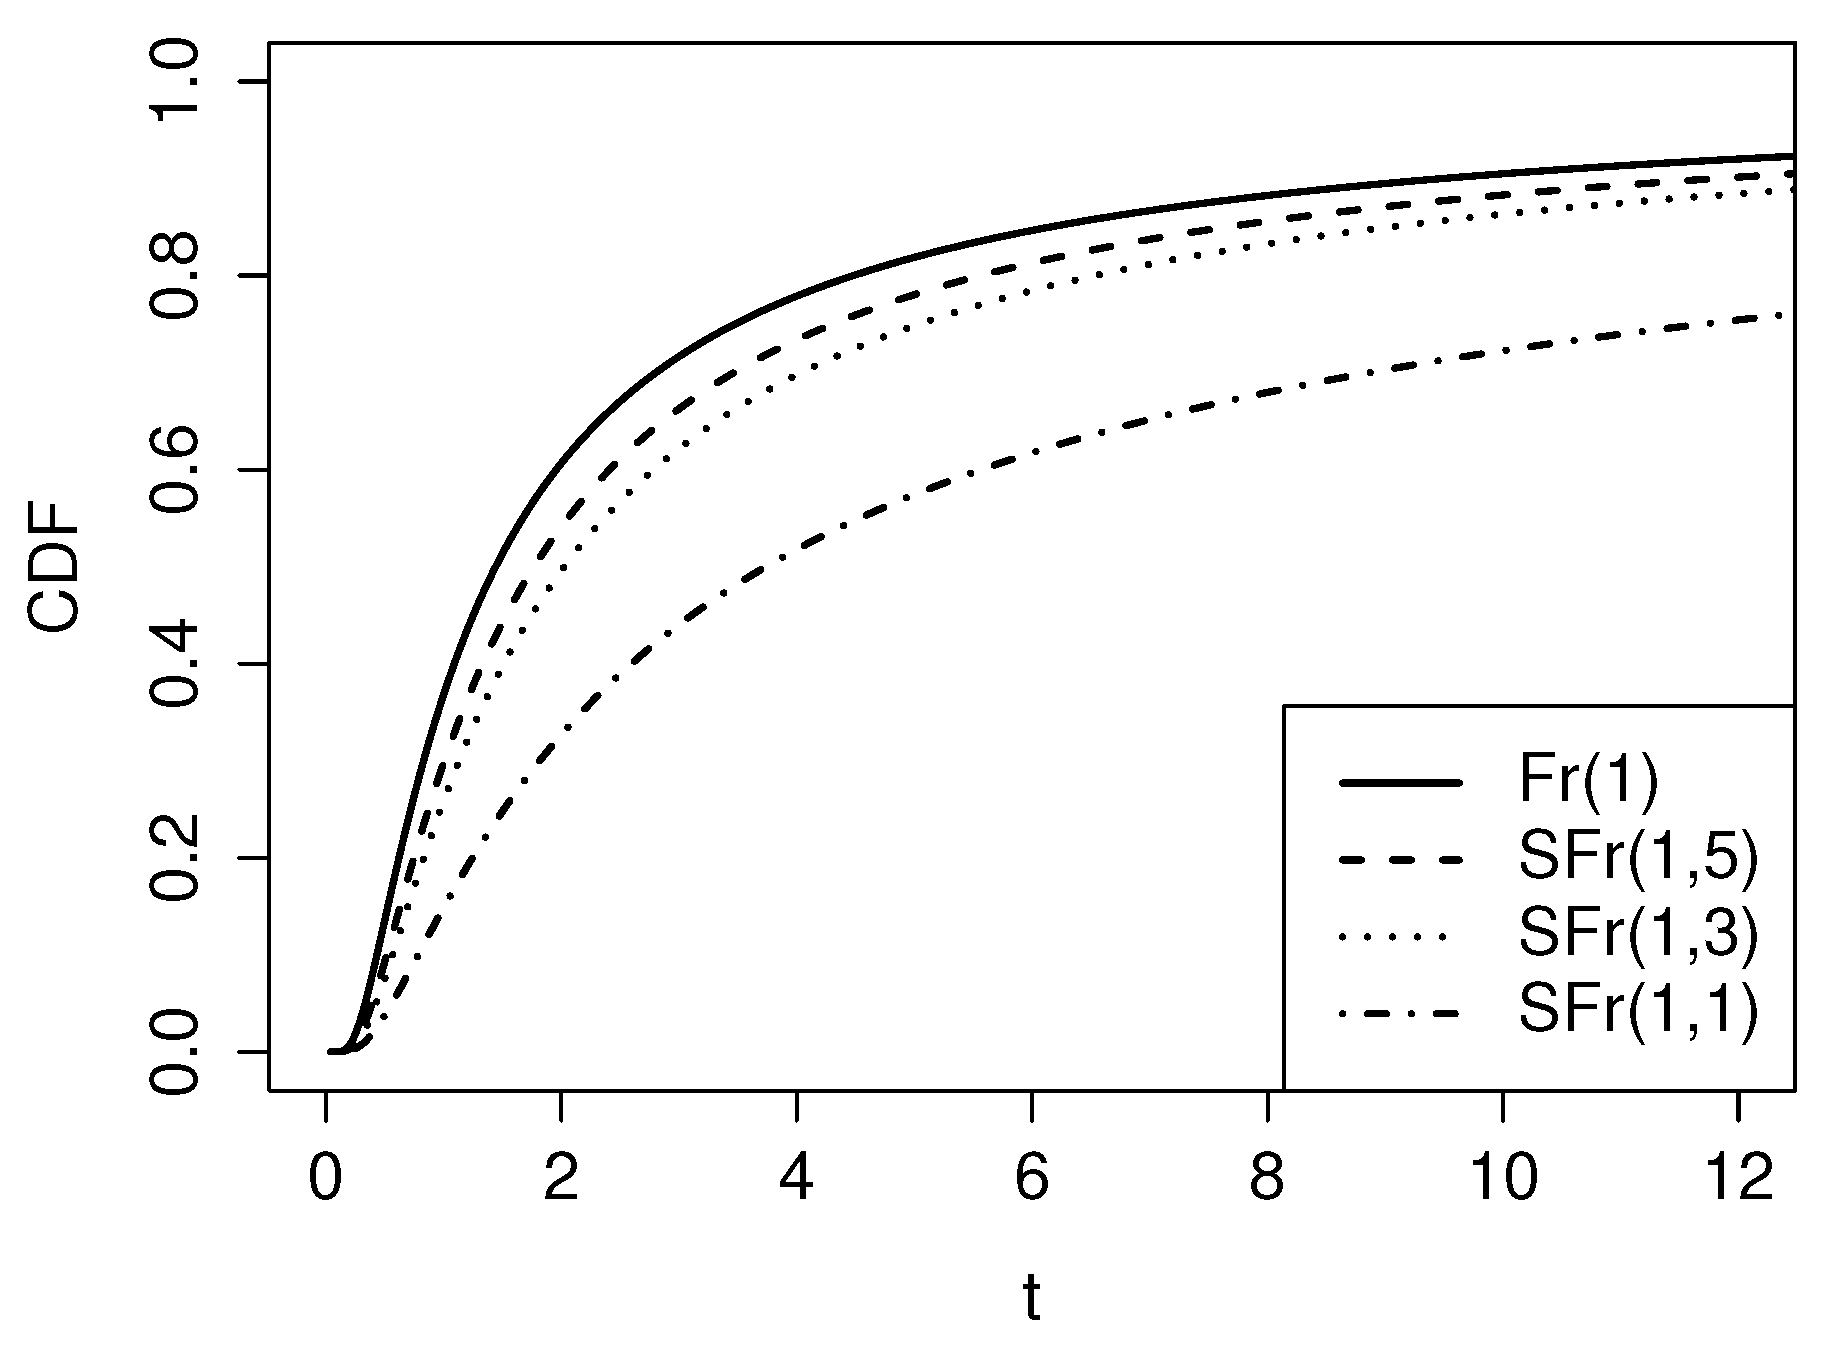
Figure 3.
Graphs of the survival function and hazard function for the SFr distribution with and different values of q.
Figure 3.
Graphs of the survival function and hazard function for the SFr distribution with and different values of q.
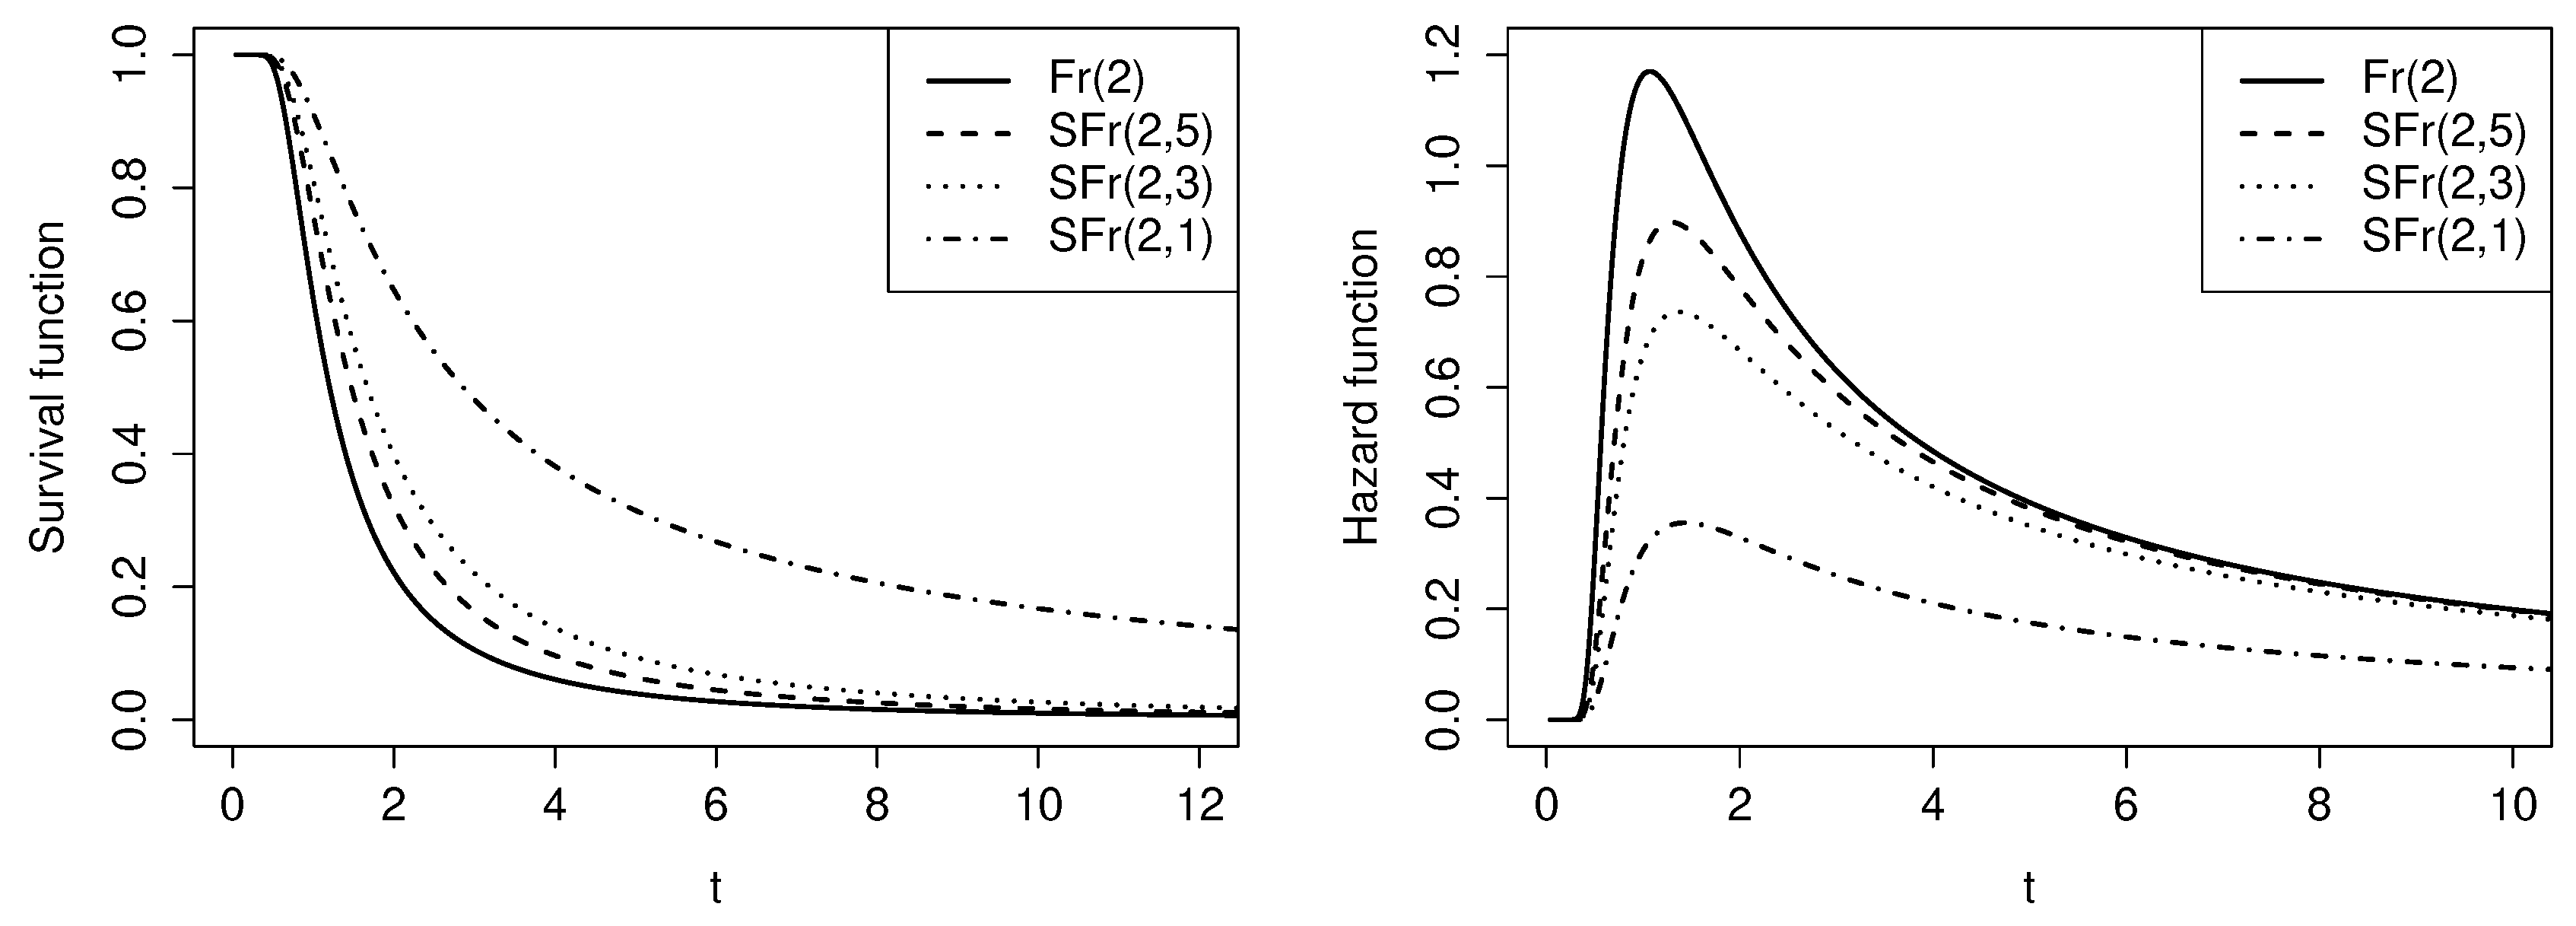
Figure 4.
Skewness coefficient plot for the SFr model (left side). Comparison of the skewness coefficient between SFr and Fr for different values of q (right side).
Figure 4.
Skewness coefficient plot for the SFr model (left side). Comparison of the skewness coefficient between SFr and Fr for different values of q (right side).
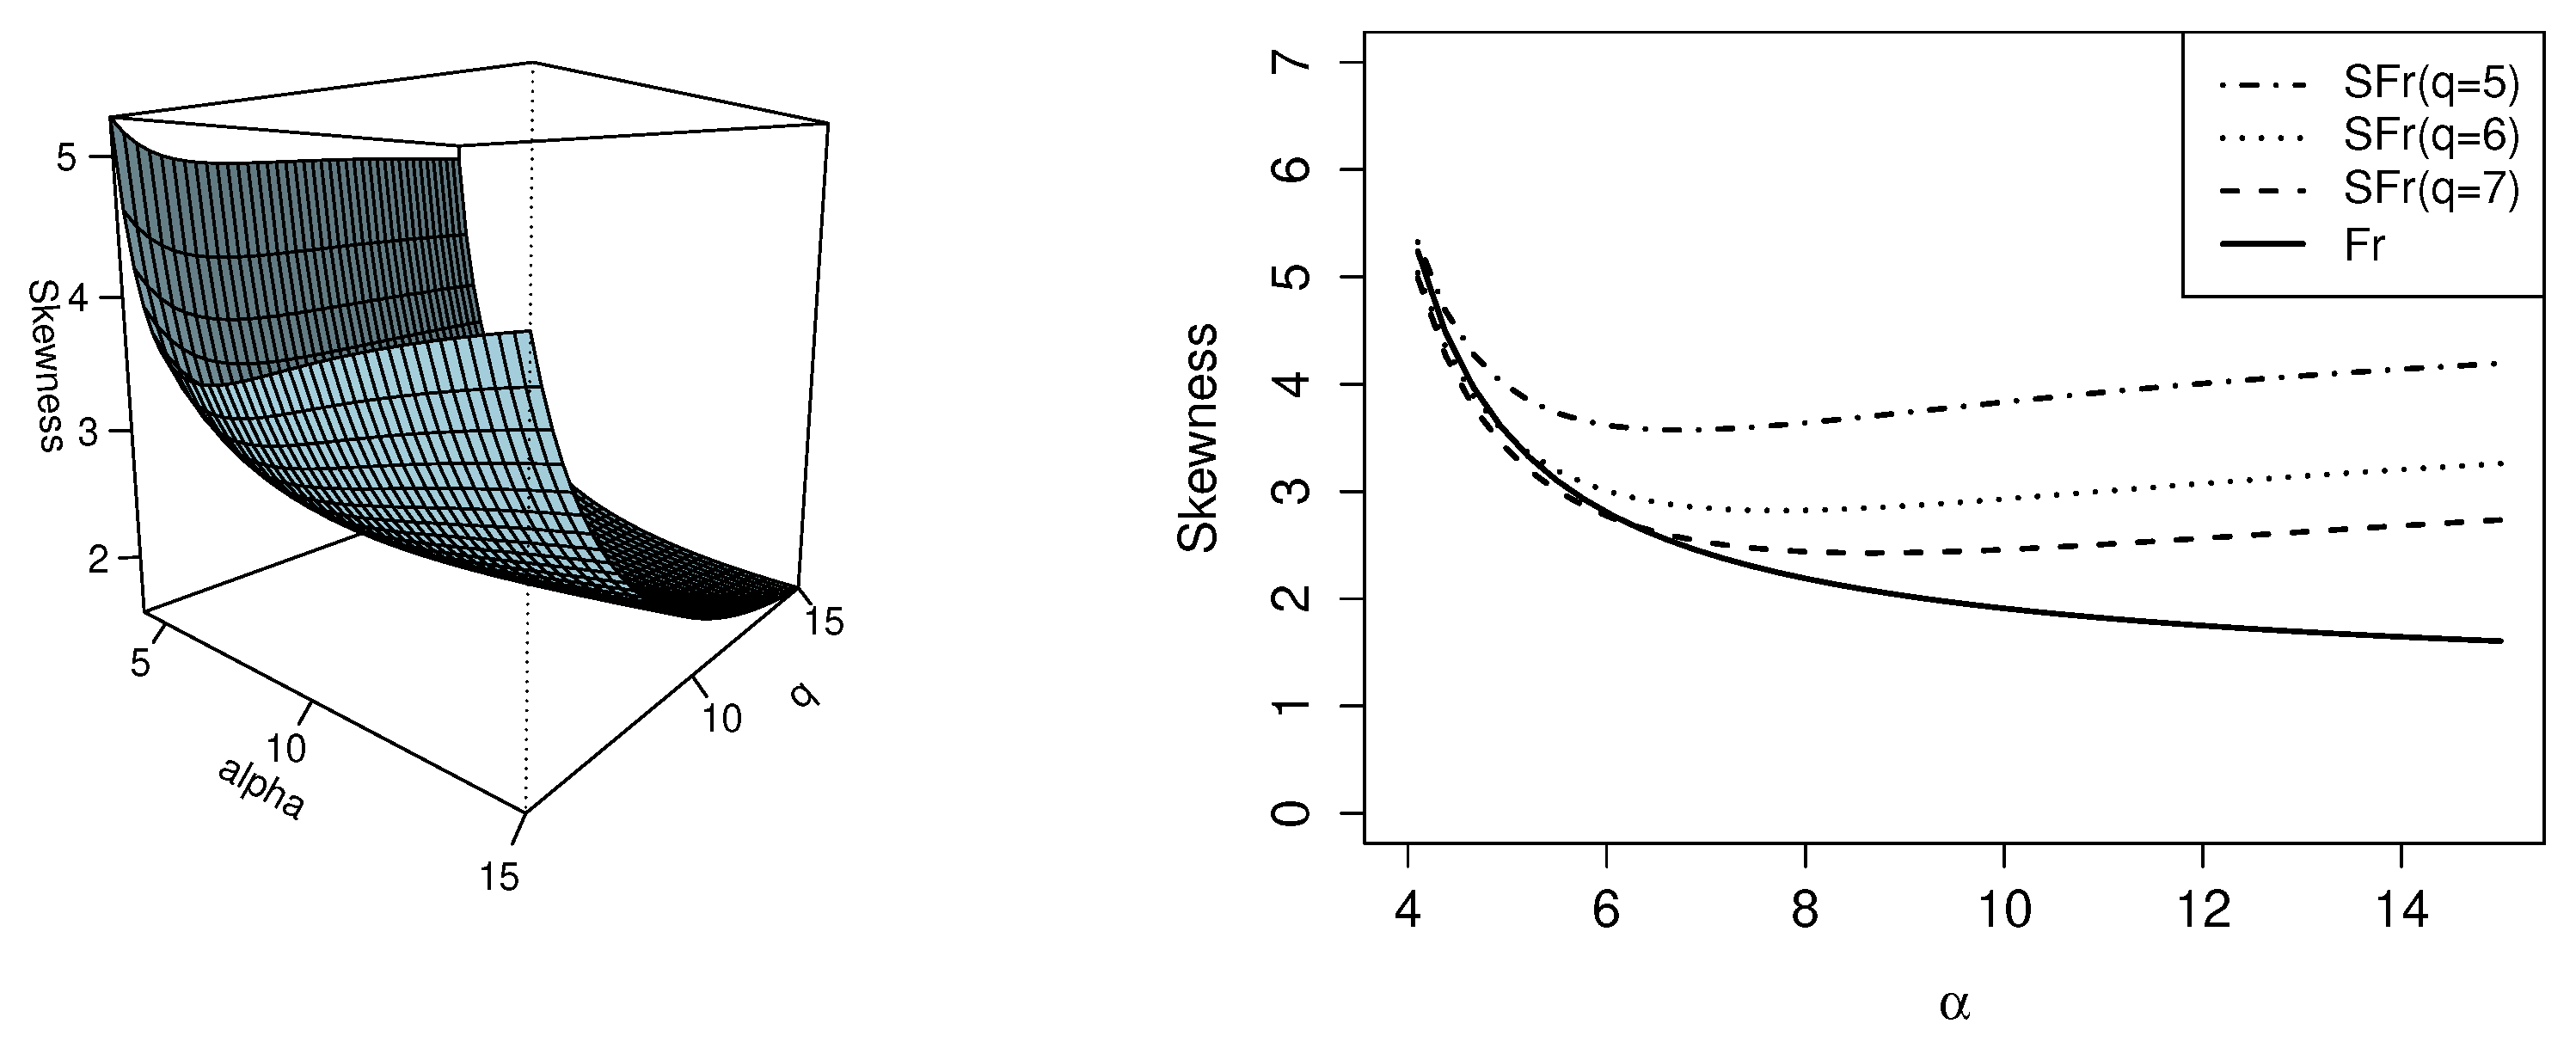
Figure 5.
Plot of the kurtosis coefficient for the SFr model (left side). Comparison of the kurtosis coefficient between the SFr and Fr models for different values of q (right side).
Figure 5.
Plot of the kurtosis coefficient for the SFr model (left side). Comparison of the kurtosis coefficient between the SFr and Fr models for different values of q (right side).
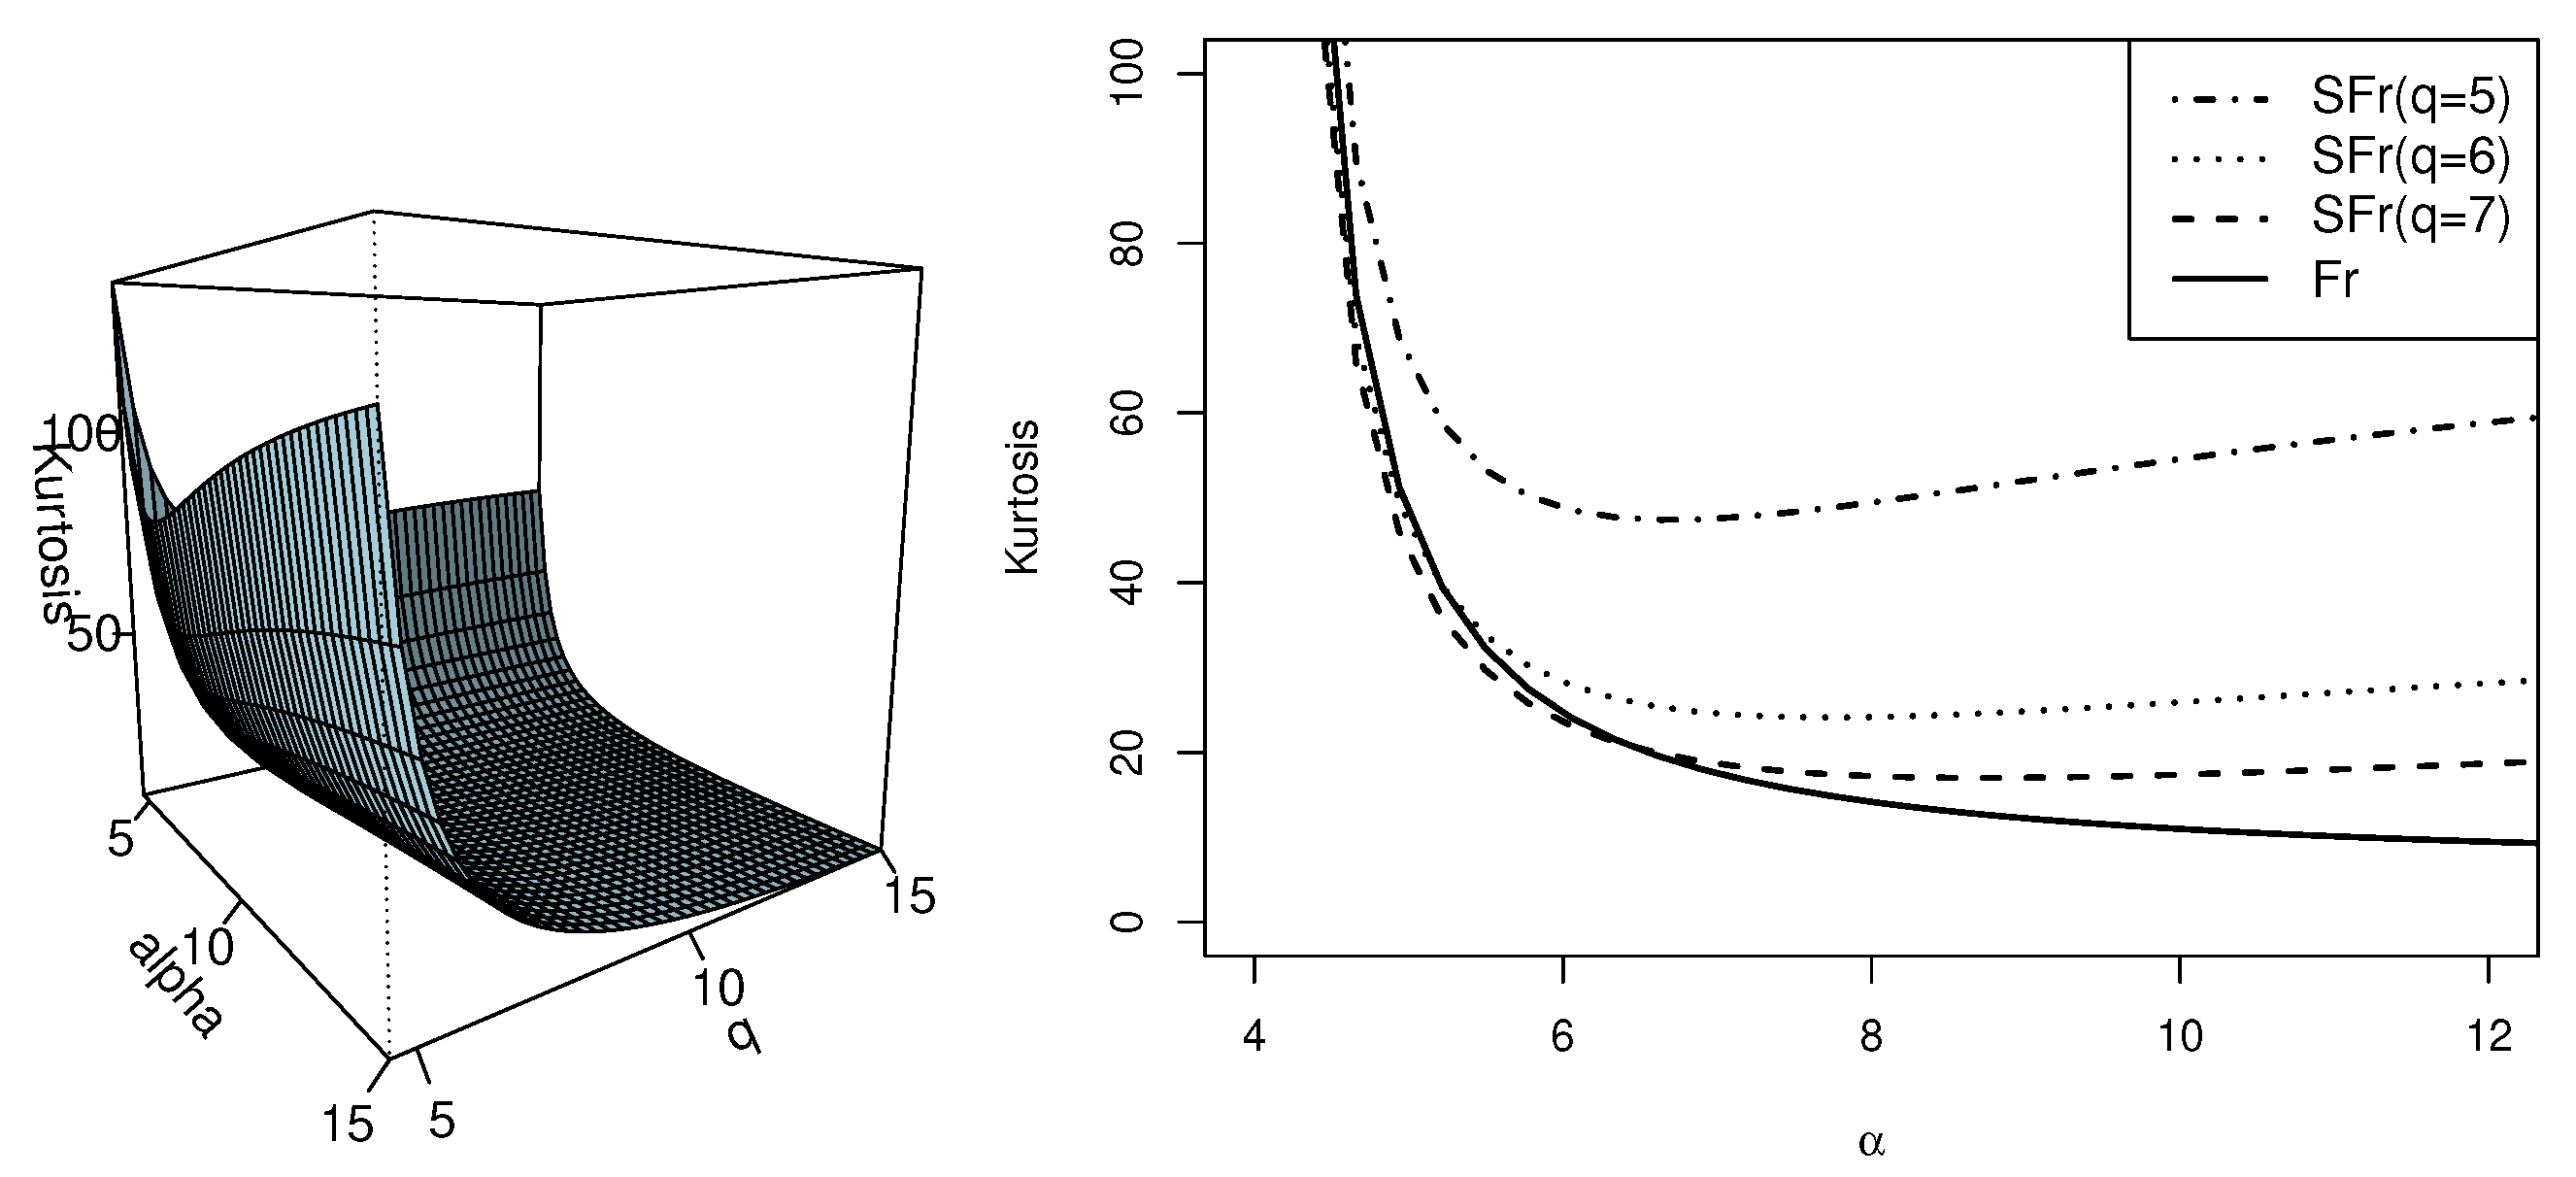
Figure 6.
Boxplot for patients with lung cancer dataset
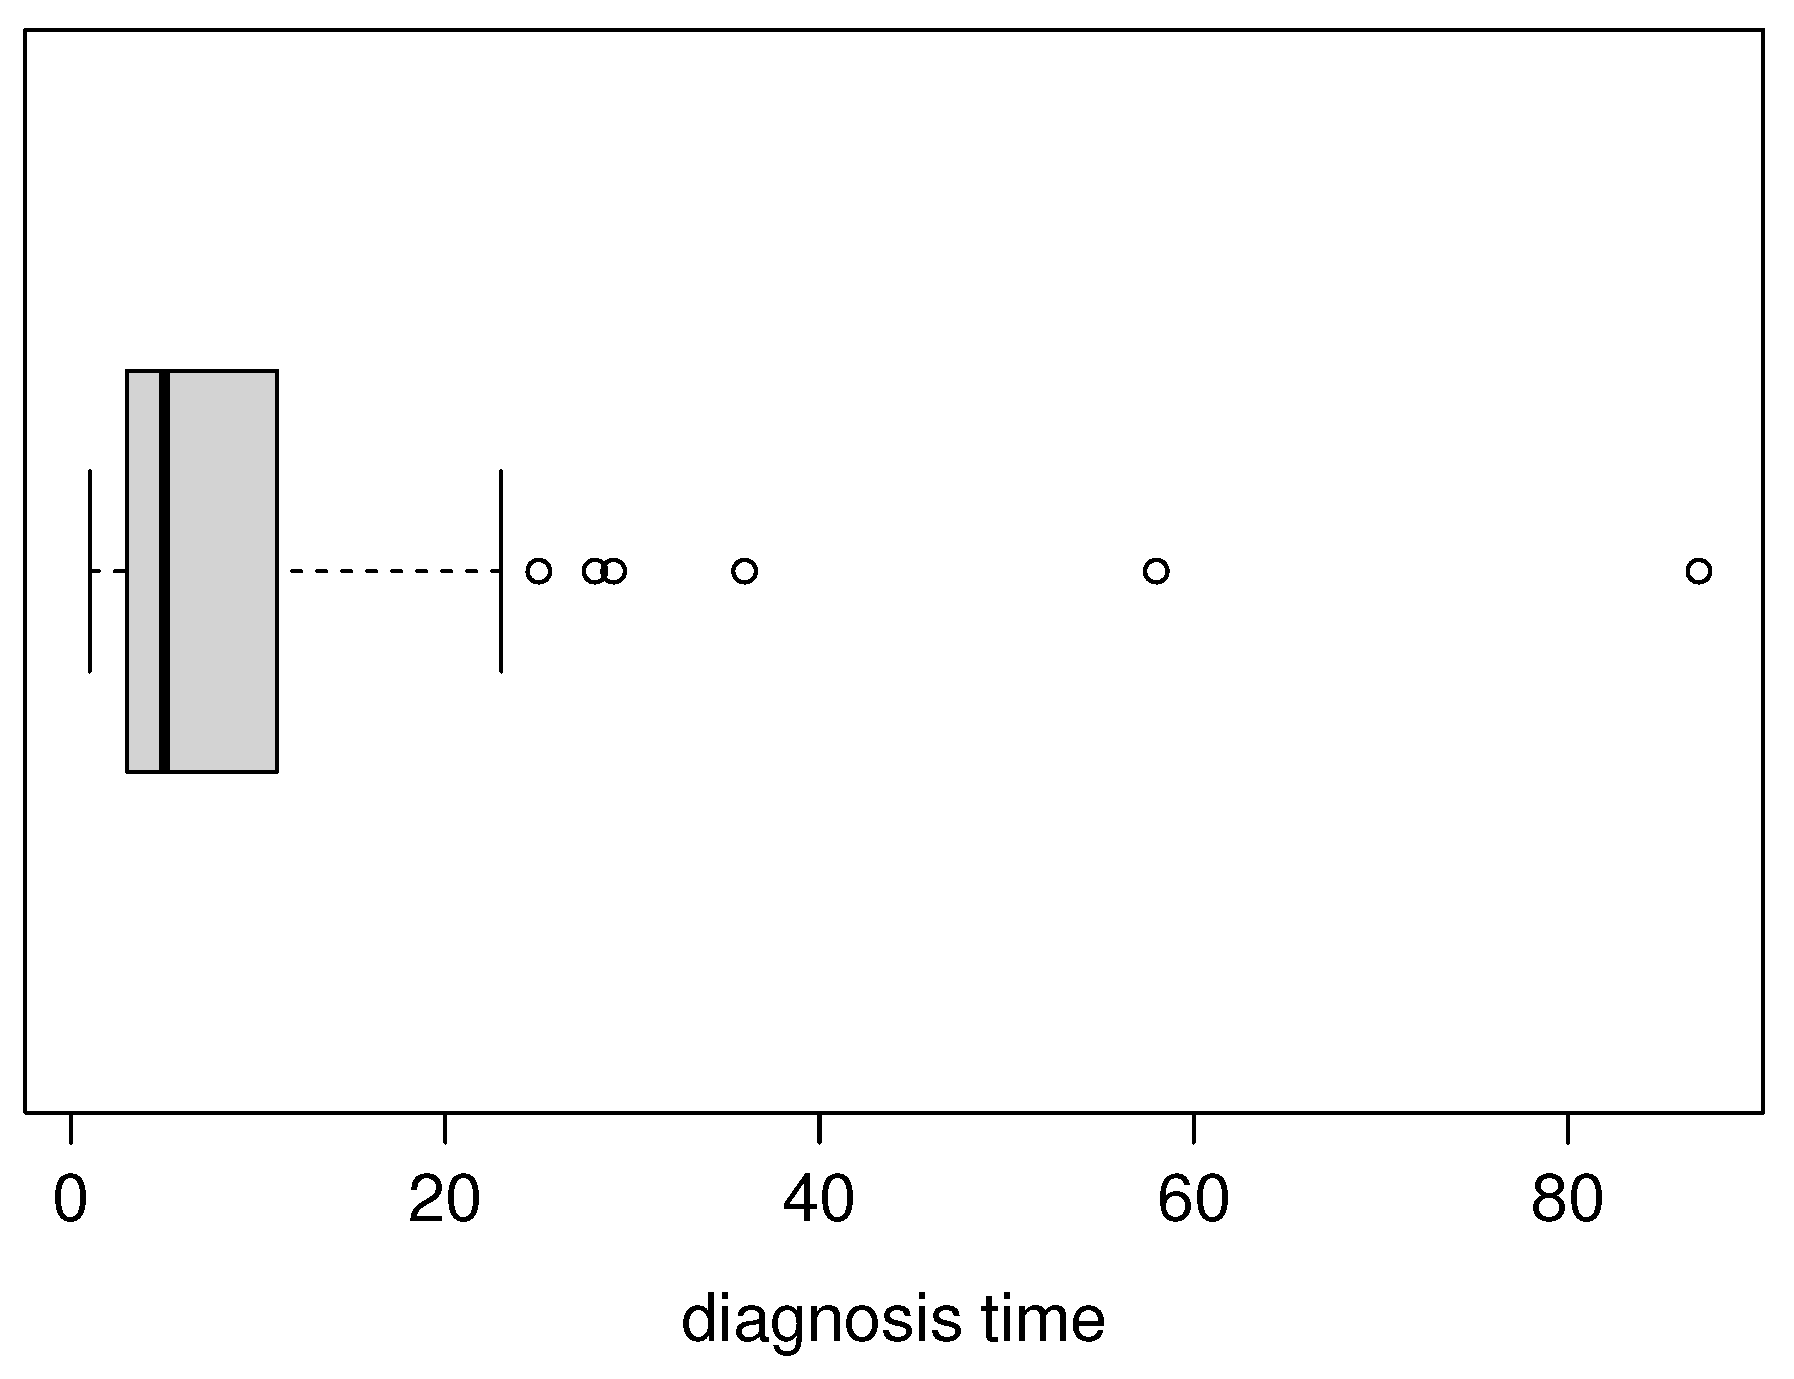
Figure 7.
Density adjusted for patients with lung cancer dataset in the Fr and SFr distributions
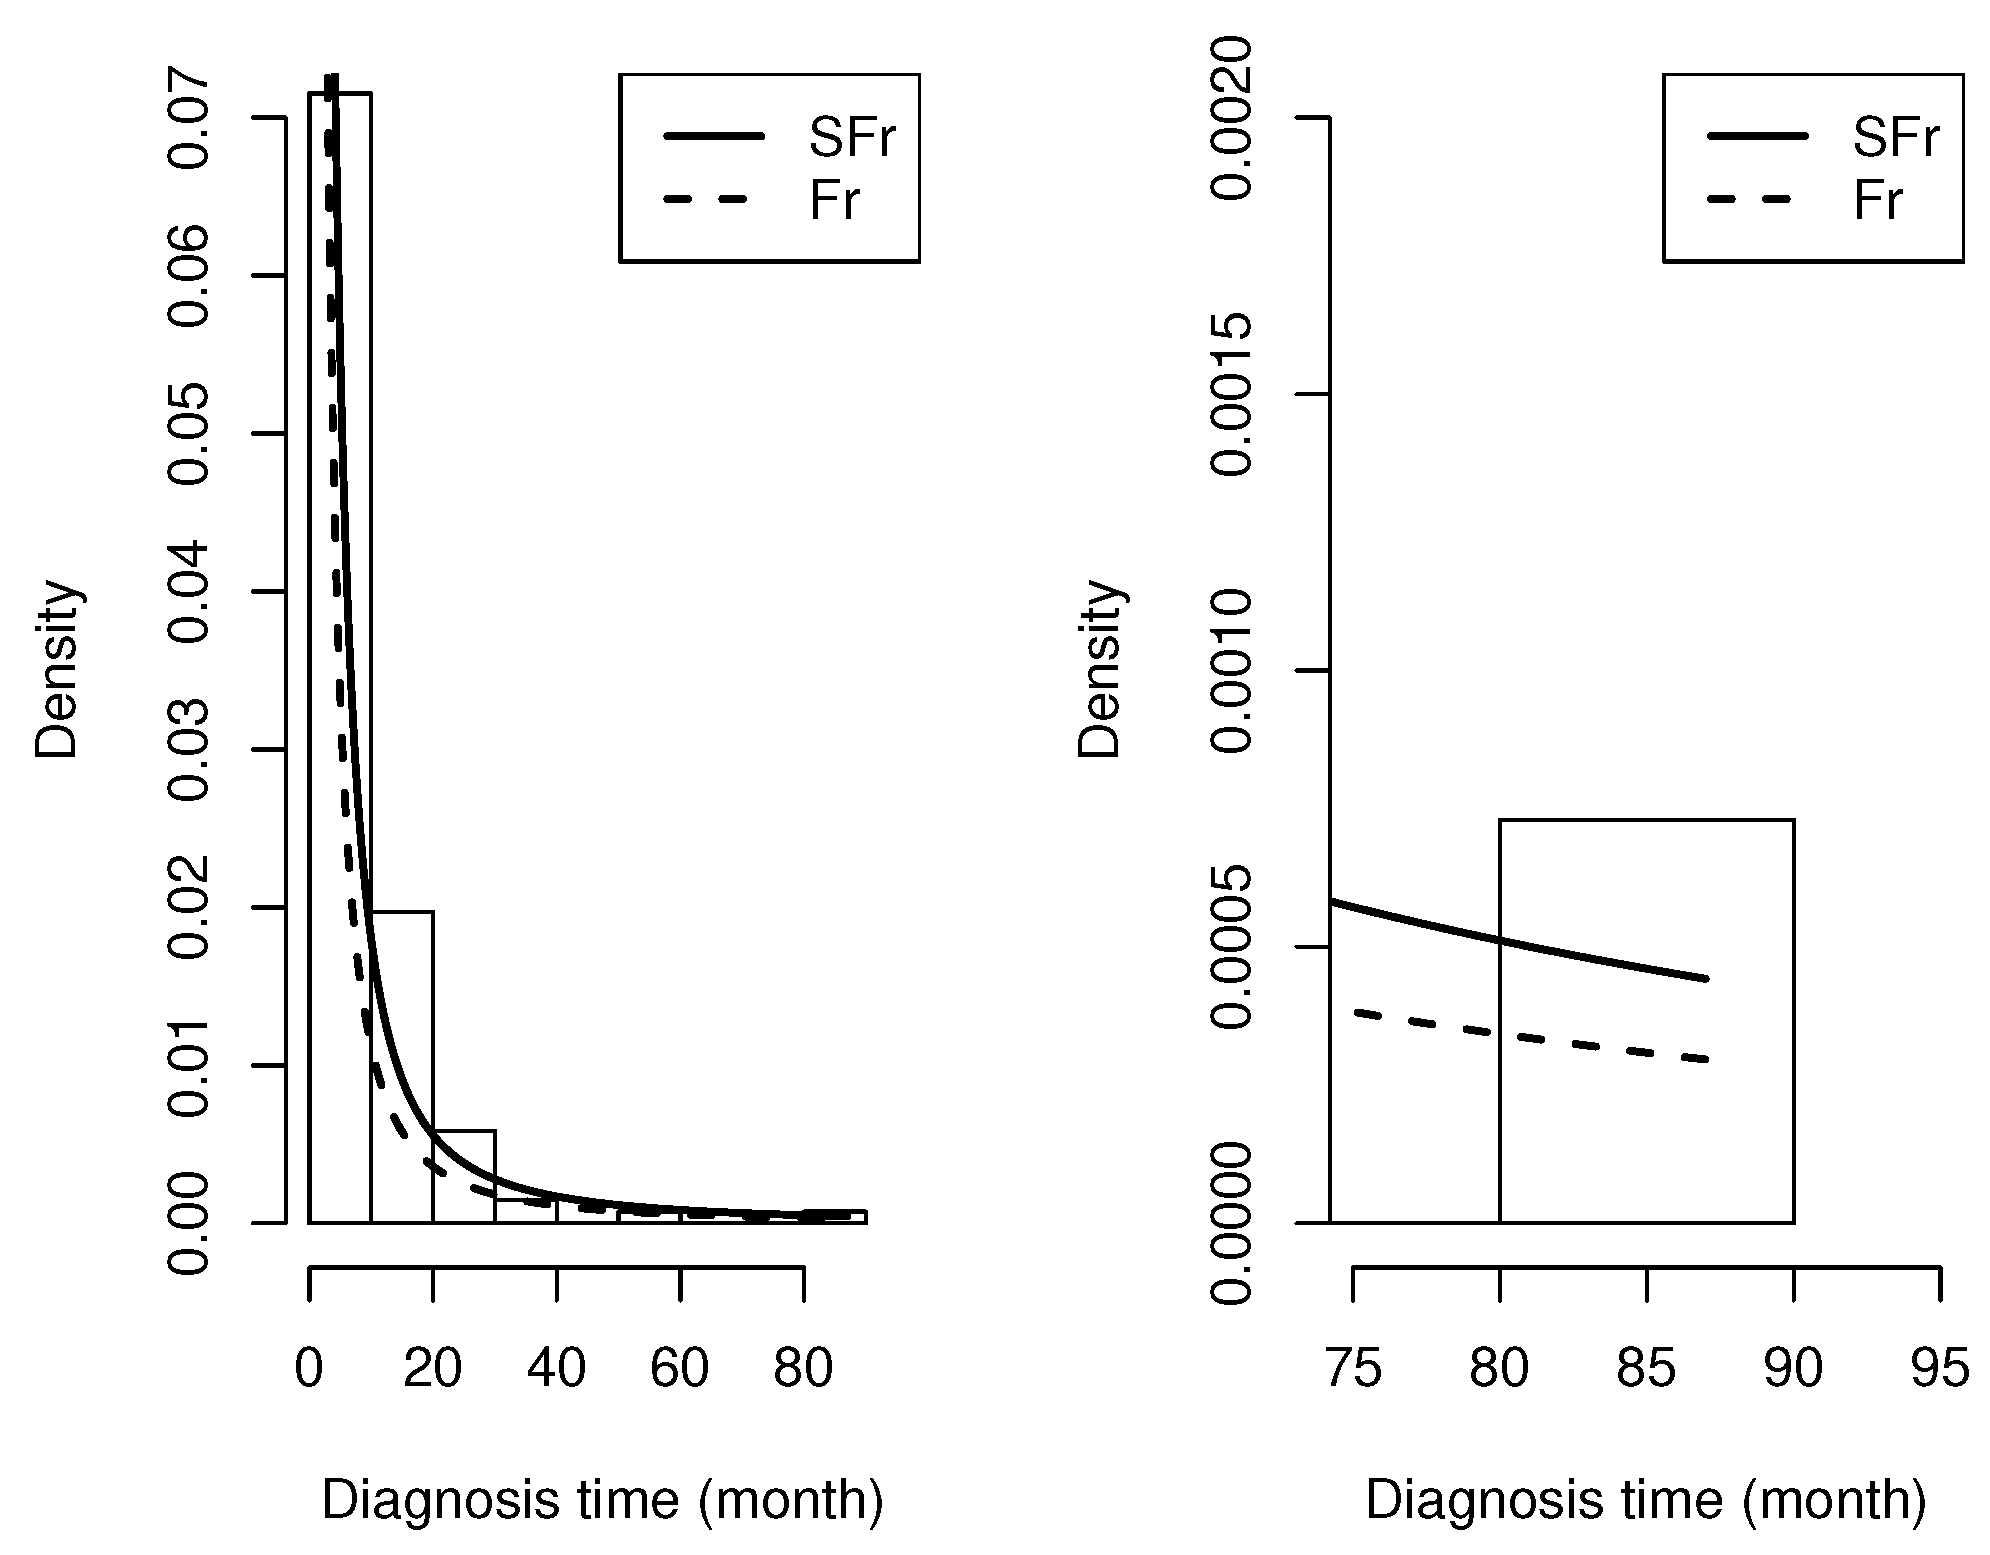
Figure 8.
QQ-plots for patients with lung cancer dataset: (a) Fr Model; (b) SFr model
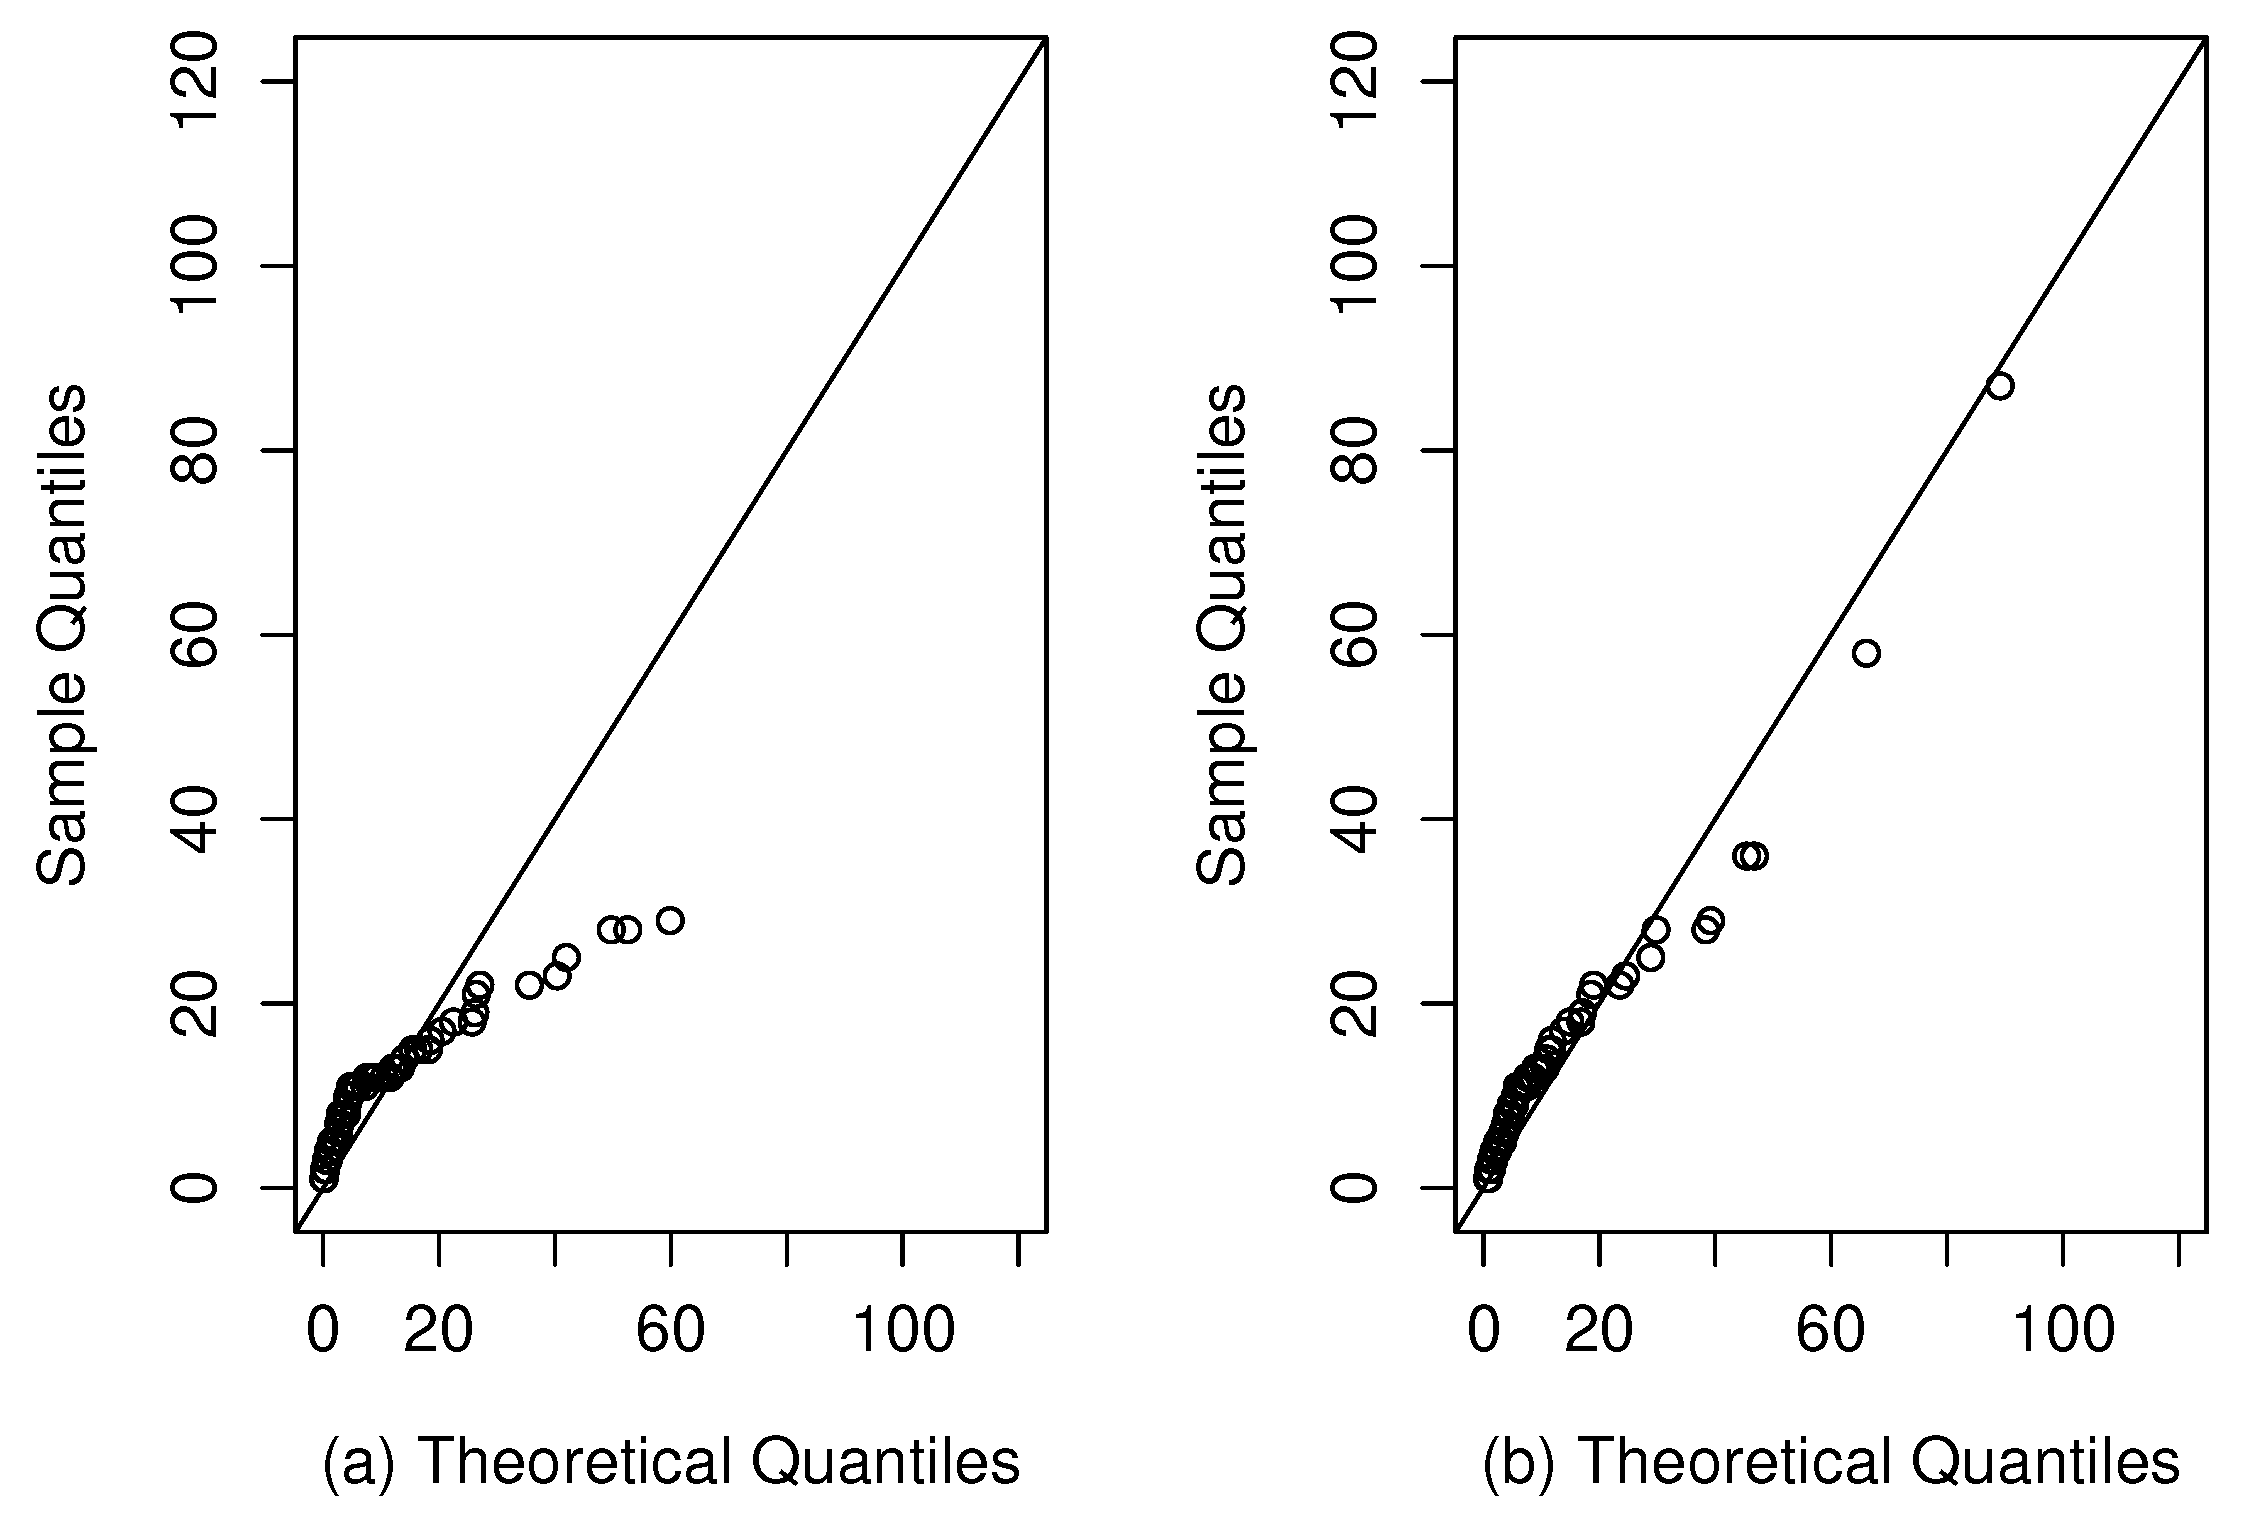
Figure 9.
Boxplot for charity fundraising percentage dataset
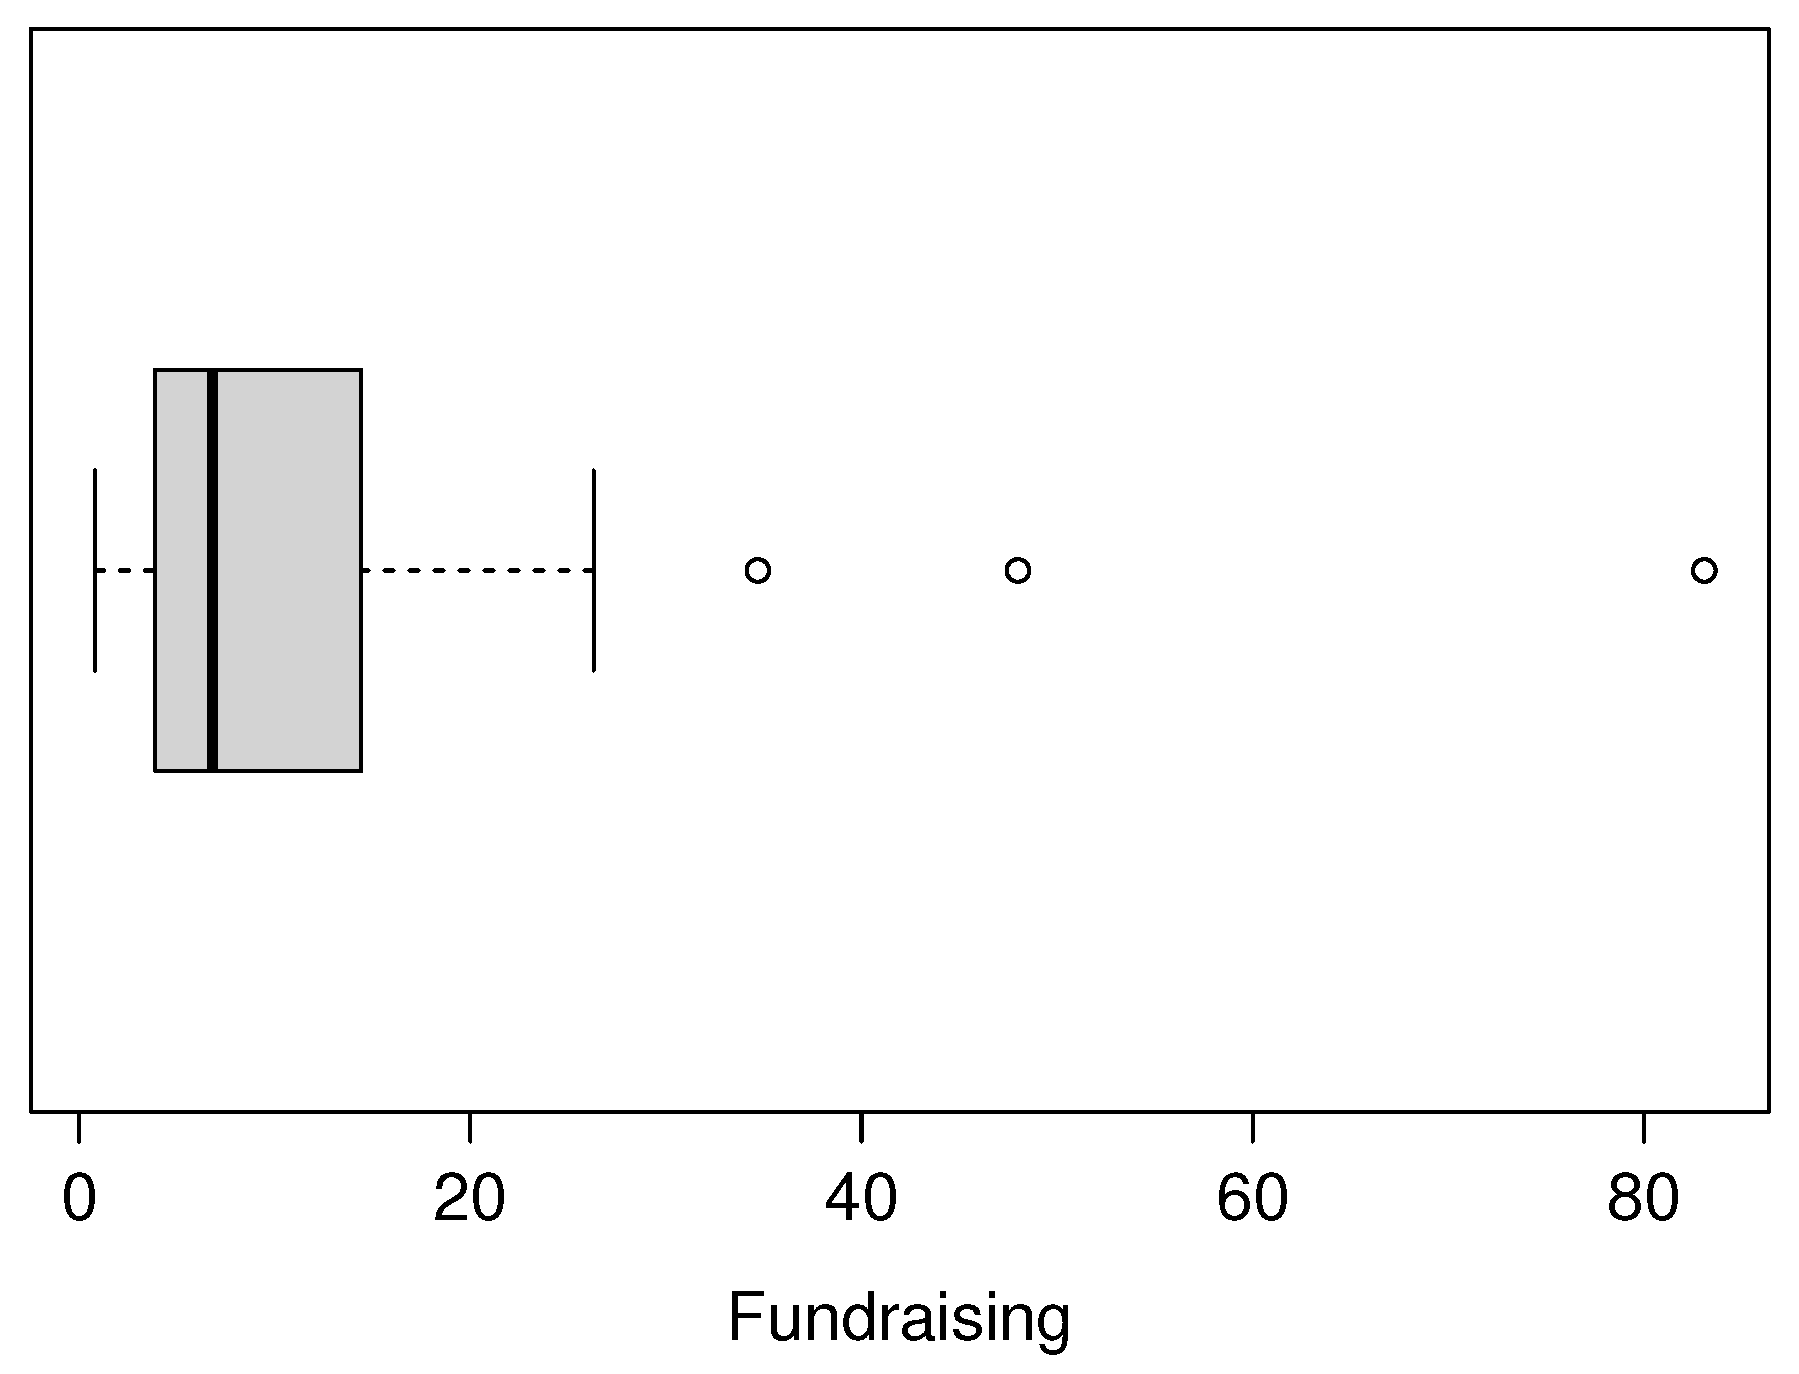
Figure 10.
Density adjusted for charity fundraising percentage dataset in the Fr and SFr distributions
Figure 10.
Density adjusted for charity fundraising percentage dataset in the Fr and SFr distributions
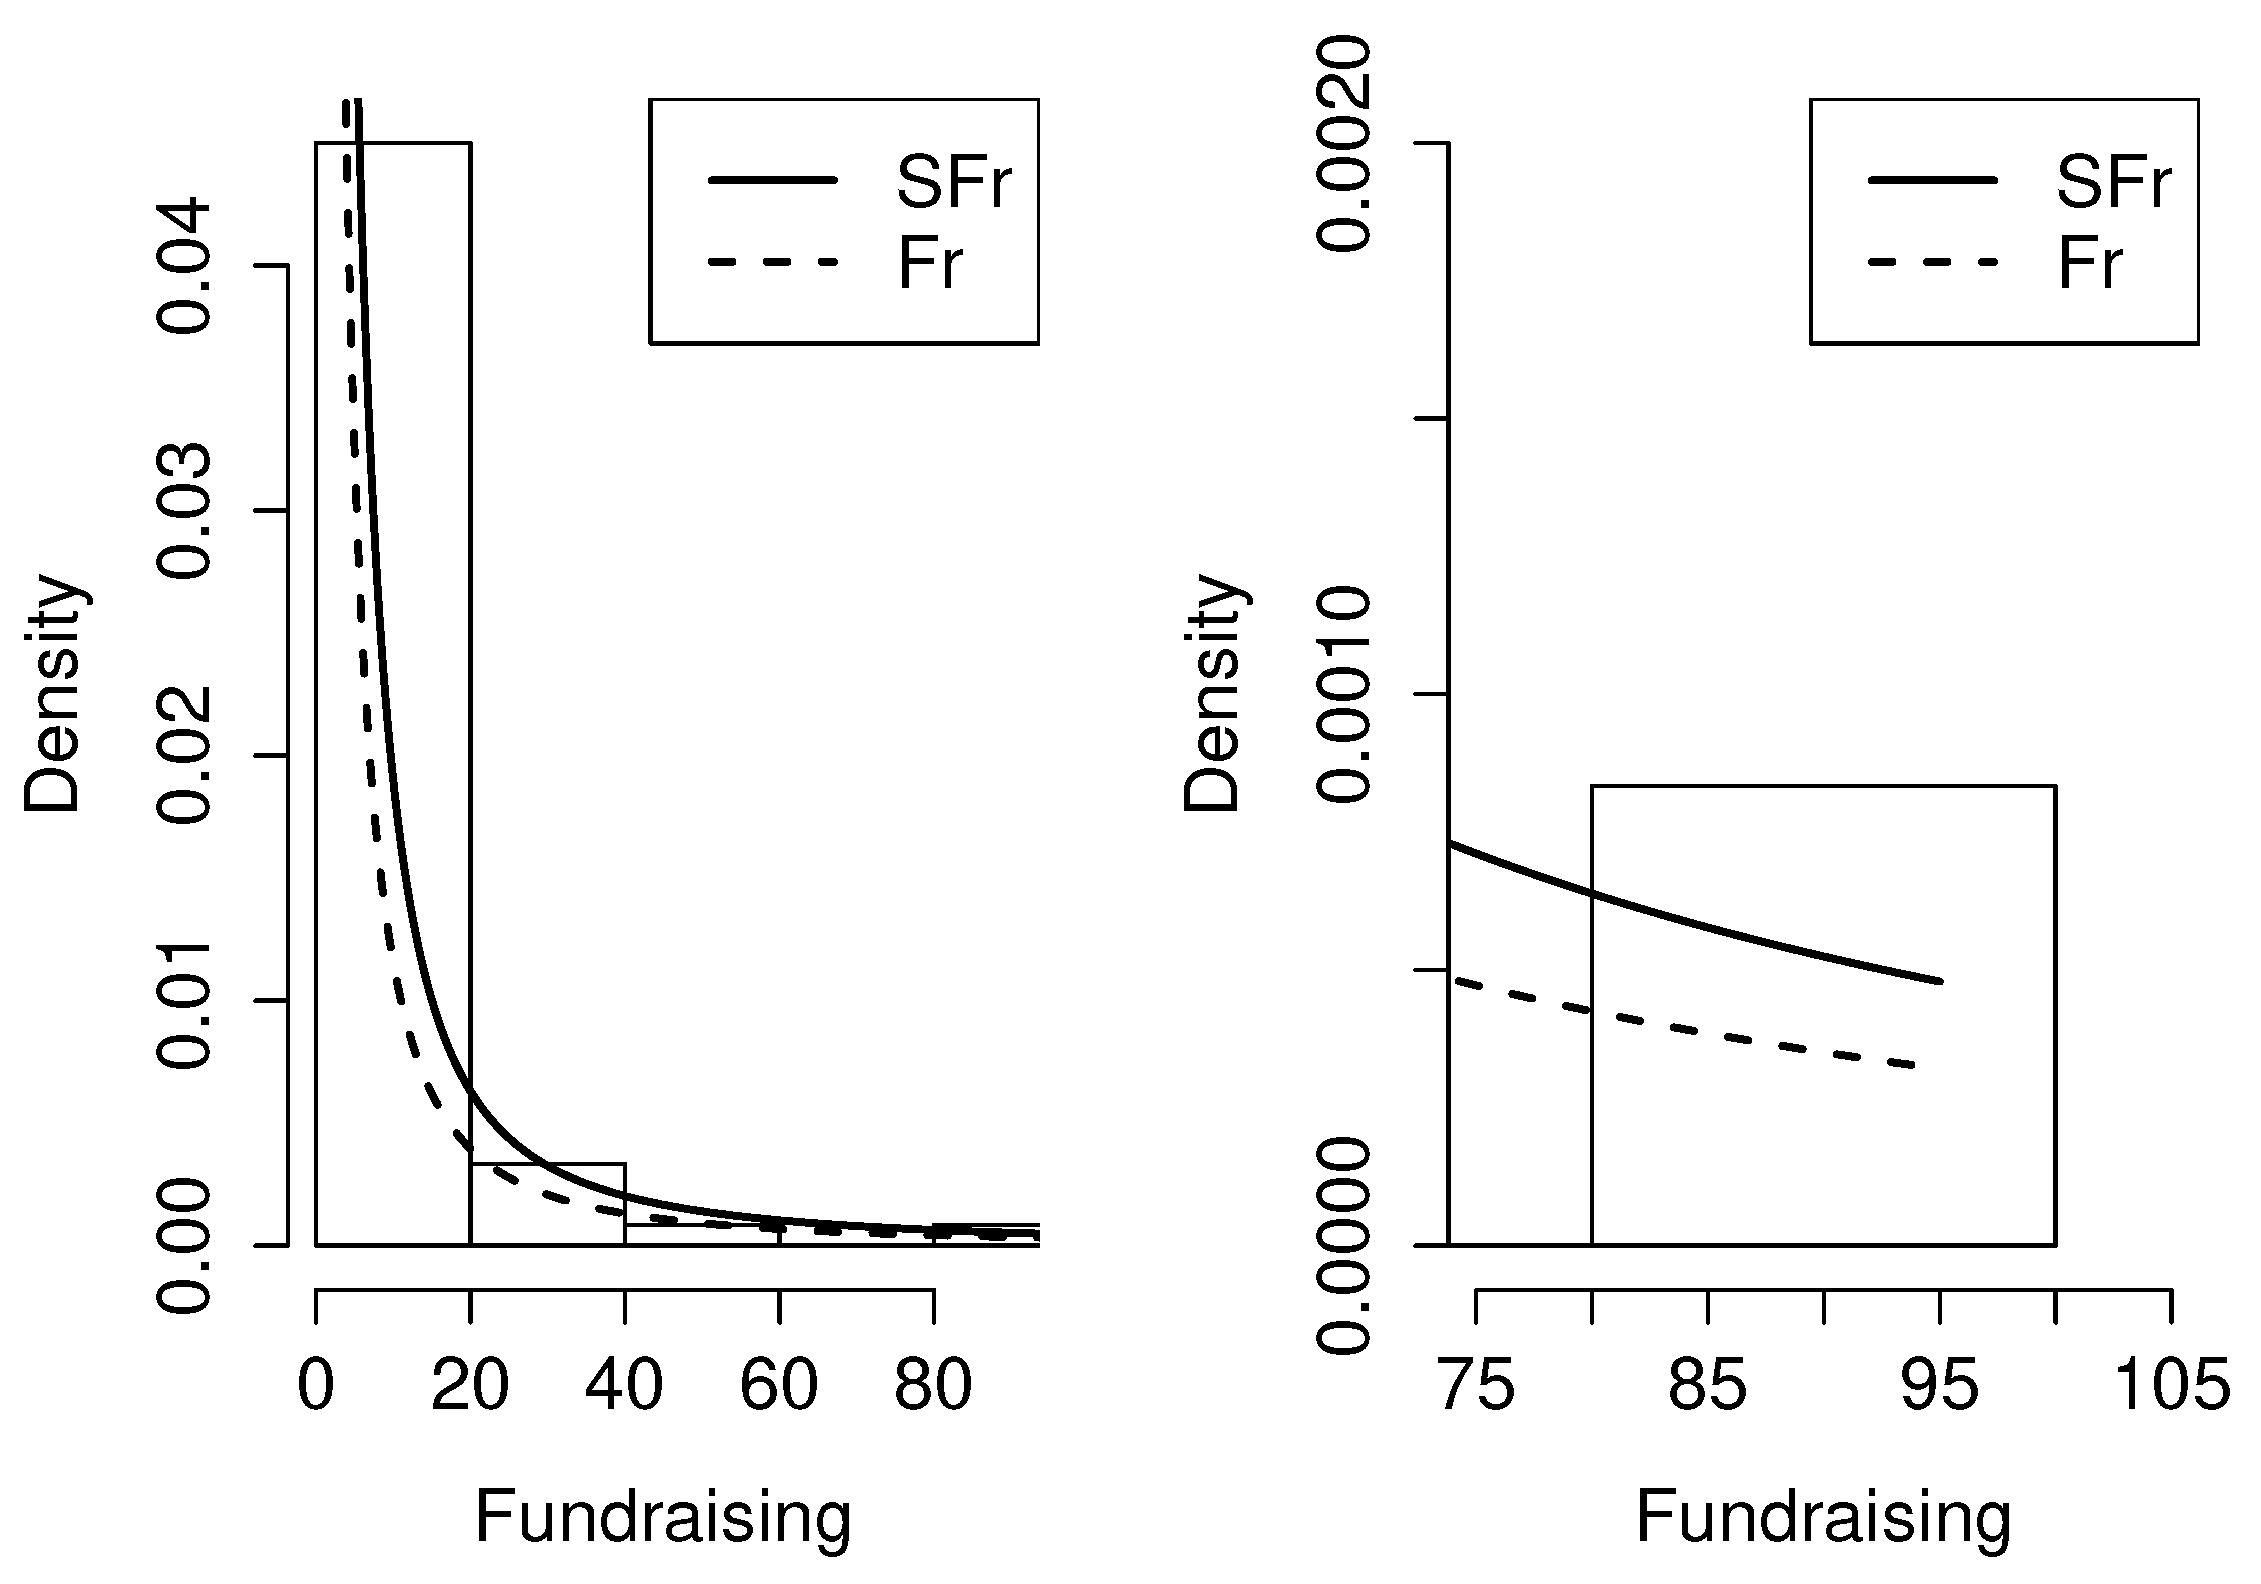
Figure 11.
QQ-plots for charity fundraising percentage dataset: (a) Fr Model; (b) SFr model
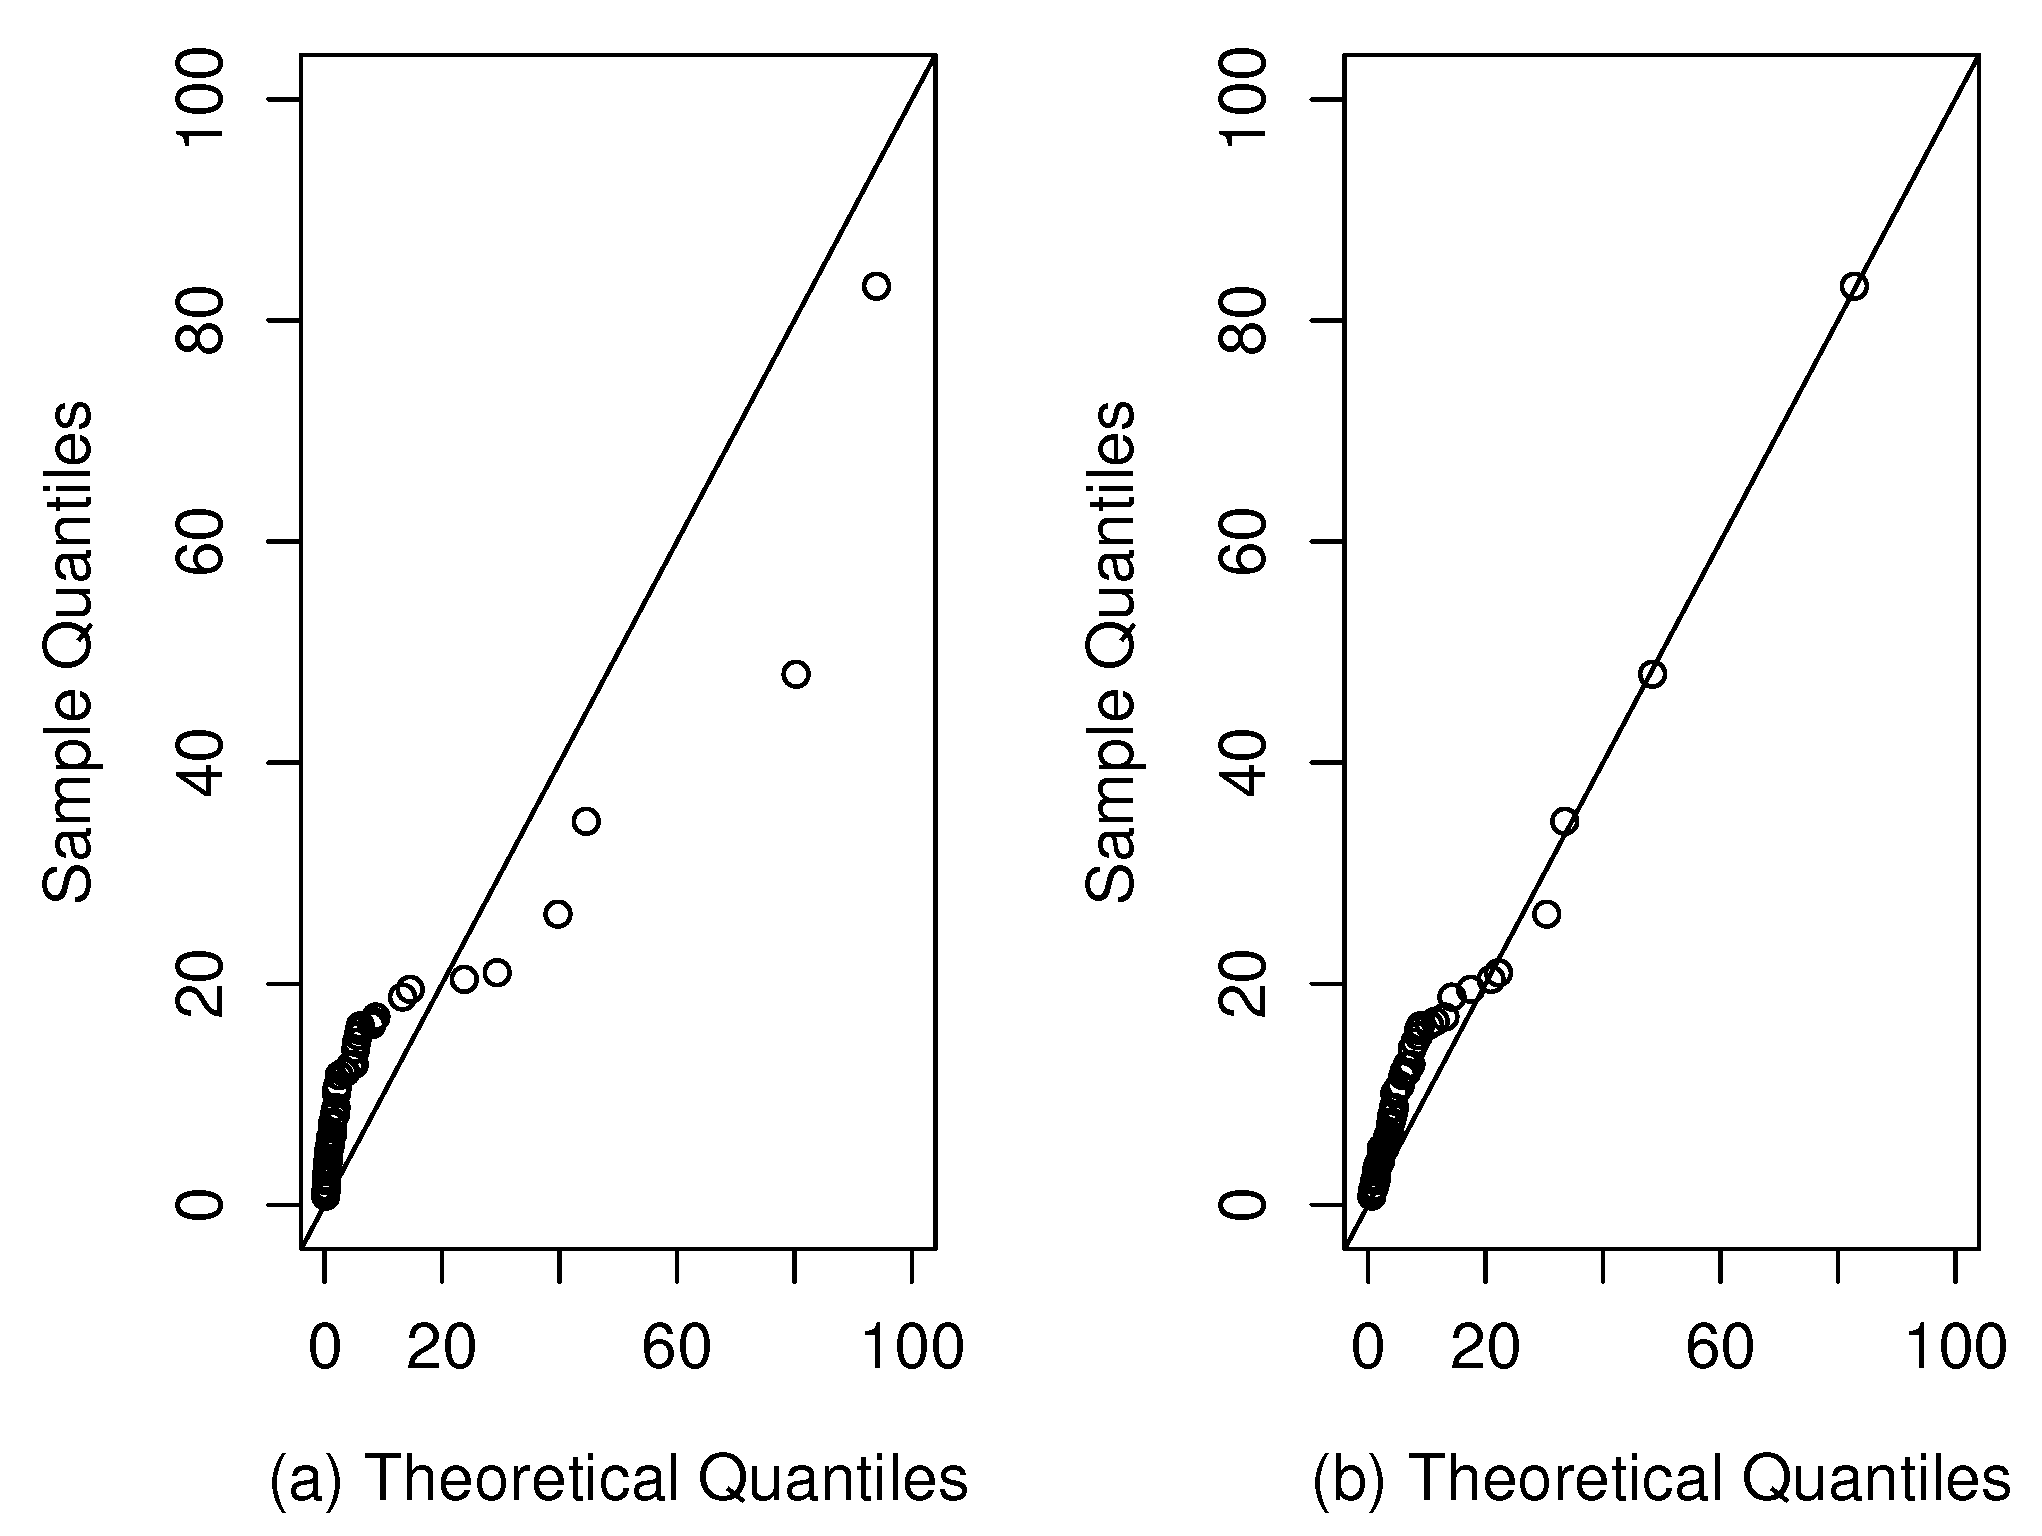

Table 1.
Comparison of values of the survival function between the SFr and Fr distribution for and q = 1, 3, 5, 10.
Table 1.
Comparison of values of the survival function between the SFr and Fr distribution for and q = 1, 3, 5, 10.
| Fr (1) | 0.0952 | 0.0869 | 0.0800 | 0.0740 | 0.0689 |
| SFr (1,10) | 0.1051 | 0.0960 | 0.0884 | 0.0819 | 0.0763 |
| SFr (1,5) | 0.1171 | 0.1070 | 0.0986 | 0.0914 | 0.0852 |
| SFr (1,3) | 0.1368 | 0.1253 | 0.1157 | 0.1074 | 0.1002 |
| SFr (1,1) | 0.2775 | 0.2605 | 0.2457 | 0.2327 | 0.2212 |
Table 2.
Simulation of 1000 samples for the model.
| n | q | |||||||
|---|---|---|---|---|---|---|---|---|
| 50 | 0.7 | 0.4 | 1.1209 | 1.3870 | 96.5 | 0.4100 | 0.0844 | 94.4 |
| 100 | 0.7 | 0.4 | 0.7432 | 0.1289 | 97.1 | 0.4053 | 0.0567 | 94.9 |
| 150 | 0.7 | 0.4 | 0.7308 | 0.1009 | 95.3 | 0.4042 | 0.0458 | 94.4 |
| 200 | 0.7 | 0.4 | 0.7161 | 0.0839 | 96.1 | 0.4021 | 0.0394 | 95.1 |
| 50 | 1 | 1 | 1.1150 | 0.2241 | 97.3 | 1.0370 | 0.2860 | 90.4 |
| 100 | 1 | 1 | 1.0430 | 0.1353 | 94.9 | 1.0121 | 0.1889 | 90.8 |
| 150 | 1 | 1 | 1.0285 | 0.1064 | 95.6 | 1.0108 | 0.1533 | 93.9 |
| 200 | 1 | 1 | 1.0210 | 0.0914 | 96.0 | 1.0075 | 0.1323 | 94.3 |
| 50 | 3 | 2 | 3.7003 | 1.3243 | 97.0 | 2.0456 | 0.4420 | 91.9 |
| 100 | 3 | 2 | 3.1583 | 0.5040 | 96.1 | 2.0189 | 0.3027 | 93.8 |
| 150 | 3 | 2 | 3.1007 | 0.3929 | 96.5 | 2.0187 | 0.2457 | 94.6 |
| 200 | 3 | 2 | 3.0830 | 0.3362 | 96.2 | 2.0124 | 0.2108 | 95.7 |
| 50 | 5 | 3 | 5.9049 | 1.7361 | 97.0 | 3.0661 | 0.6389 | 94.3 |
| 100 | 5 | 3 | 5.3485 | 0.9133 | 96.6 | 3.0195 | 0.4296 | 94.2 |
| 150 | 5 | 3 | 5.2374 | 0.7069 | 95.5 | 3.0075 | 0.3463 | 93.9 |
| 200 | 5 | 3 | 5.1495 | 0.5921 | 95.9 | 3.0113 | 0.3005 | 94.8 |
| 50 | 2 | 2.3 | 2.1506 | 0.3875 | 96.6 | 2.4482 | 0.7683 | 90.0 |
| 100 | 2 | 2.3 | 2.0779 | 0.2485 | 96.0 | 2.3636 | 0.4852 | 92.8 |
| 150 | 2 | 2.3 | 2.0598 | 0.1990 | 95.5 | 2.3433 | 0.3871 | 92.8 |
| 200 | 2 | 2.3 | 2.0286 | 0.1680 | 95.5 | 2.3235 | 0.3319 | 94.1 |
| 50 | 4.5 | 5 | 4.8453 | 0.8900 | 96.8 | 5.3049 | 1.6251 | 90.3 |
| 100 | 4.5 | 5 | 4.6788 | 0.5690 | 95.7 | 5.1323 | 1.0286 | 92.7 |
| 150 | 4.5 | 5 | 4.6371 | 0.4561 | 95.5 | 5.0908 | 0.8256 | 93.5 |
| 200 | 4.5 | 5 | 4.5660 | 0.3840 | 95.4 | 5.0484 | 0.7032 | 93.8 |
Table 3.
Descriptive statistics for patients with lung cancer dataset.
| n | S | |||
|---|---|---|---|---|
| 137 | 8.7737 | 10.6121 | 4.1055 | 26.3882 |
Table 4.
Estimates, SE in parenthesis, log-likelihood, AIC and BIC values for patients with lung cancer dataset.
Table 4.
Estimates, SE in parenthesis, log-likelihood, AIC and BIC values for patients with lung cancer dataset.
| Parameters | Fr | SFr |
|---|---|---|
| 0.7452 (0.0540) | 2.0245 (0.3805) | |
| q | - | 0.7382 (0.0812) |
| log-likelihood | -504.6068 | -444.1976 |
| AIC | 1011.214 | 892.3952 |
| BIC | 1014.134 | 898.2351 |
Table 5.
Descriptive statistics for charity fundraising percentage dataset.
| n | S | |||
|---|---|---|---|---|
| 60 | 10.8920 | 12.7410 | 3.6020 | 19.360 |
Table 6.
Estimates, SE in parenthesis, log-likelihood, AIC and BIC values for charity fundraising percentage dataset.
Table 6.
Estimates, SE in parenthesis, log-likelihood, AIC and BIC values for charity fundraising percentage dataset.
| Parameters | Fr | SFr |
|---|---|---|
| 0.6671 (0.0728) | 1.6317 (0.4089) | |
| q | - | 0.6880 (0.1163) |
| log-likelihood | -239.1086 | -213.5868 |
| AIC | 480.2171 | 431.1736 |
| BIC | 482.3115 | 435.3622 |
Disclaimer/Publisher’s Note: The statements, opinions and data contained in all publications are solely those of the individual author(s) and contributor(s) and not of MDPI and/or the editor(s). MDPI and/or the editor(s) disclaim responsibility for any injury to people or property resulting from any ideas, methods, instructions or products referred to in the content. |
© 2020 by the authors. Licensee MDPI, Basel, Switzerland. This article is an open access article distributed under the terms and conditions of the Creative Commons Attribution (CC BY) license (https://creativecommons.org/licenses/by/4.0/).
Copyright: This open access article is published under a Creative Commons CC BY 4.0 license, which permit the free download, distribution, and reuse, provided that the author and preprint are cited in any reuse.


