
Submitted:
01 July 2023
Posted:
14 July 2023
You are already at the latest version
Preprints on COVID-19 and SARS-CoV-2
Abstract
To control the COVID-19 pandemic, many countries implemented vaccination and imposed societal restrictions both at the national level and for international travel. As a check of the corona status, a COVID pass has been issued. A COVID pass could be obtained when fully vaccinated against COVID-19, having recovered from a documented COVID-19 episode, or a recent (24-48 hours) negative SARS-CoV-2 antigen test. A global analysis of SARS-CoV-2 immune status (determined by past infection and/or vaccination), vaccination rates, as well as societal restrictions in controlling the COVID-19 pandemic is presented.
Keywords:
COVID pass
; SARS-CoV-2 antigen test
; SARS-CoV-2 antibodies
; societal restrictions
Introduction
Coronavirus disease 2019 (COVID-19) is an infectious disease caused by severe acute respiratory syndrome coronavirus 2 (SARS-COV-2) [1]. On January 30, 2020 the World Health Organization (WHO) officially declared the SARS-COV-2 outbreak a Public Health Emergency of International Concern. About a month and a half later, on March 11 2020, this outbreak was formally declared a global pandemic [2,3]. The WHO urged countries to adopt strict social distancing and other (quarantine) measures to protect public health by preventing virus spread [4,5]. As of June 2022, SARS-COV-2 has over 500 million confirmed infections, including over 6 million deaths reported to WHO [6].
Handling the global COVID-19 crisis has been a multifactorial operation requiring the coordinated action of all levels of healthcare, government, pharmaceutical industries, and non-government organizations, preferably with international consultation and coordination [7]. Although the mechanisms of viral transmission, infection, and treatment were largely unknown during the early phases of the pandemic, action from physicians, scientists, and governments was urgently needed to prevent further spread. Every country had its unique approach to limit further infections, a common thread in the initial response were interventions such as school and workplace closures, cancellation of public events and gatherings, stay-at-home restrictions, face coverings, and (international and domestic) travel restrictions [7,8]. With time, the understanding of the virus grew, and with that also the development of (public) testing facilities and treatment. Within a year after the outbreak of the pandemic and the identification of the genomic structure of SARS-CoV-2, several highly effective vaccines were approved and used globally, as nearly 12 billion vaccine doses have been administered (dated June 2022; World Health Organization) [6,9,10,11].
The availability of an effective vaccine and fluctuation in number of infections made governments allow for changes in societal restrictions, increasing or decreasing the intensity of these restrictions depending on what was needed to control the virus. Many countries have introduced a ‘corona pass’, or COVID pass [12]. The precise conditions under which this pass could be obtained varied among countries, but mostly included being fully vaccinated against COVID-19, having recovered from a documented COVID-19 episode, or a recent (24-72 hours) negative SARS-CoV-2 antigen or PCR test [13]. Such a pass has allowed individuals to travel internationally, but often was also used on a national level, i.e., for access to indoor spaces such as bars and restaurants, theaters and museums, or other (large-scale) events [12,13,14].
As mentioned before, the world has displayed a diverse and fragmented approach to the preservation of public health and prevention of spread of COVID-19. In March 2021, Hale and colleagues introduced the Oxford COVID-19 Government Response Tracker (OxCGRT), a continuously updated, readily usable database on global policy measures [15]. Starting 1 January 2020, the data capture government policies related to closure and containment, health, and economic policies for 180+ countries or territories. Policy responses are recorded ordinal or continuous for 19 policy areas, capturing variation in the degree of response [15]. Ultimately, the sum of the policy areas is calculated, resulting in an overall Government Stringency Index (GSI). Important is to note that economic measures, such as governmental support, are not used in the index calculations [15]. The OxGRT enabled us to explore the empirical effect of policy responses on the spread of COVID-19 cases and vaccination status from a global viewpoint, with emphasis on the comparison between high, medium, and low-income countries or territories across the world.
Methods
This paper aims to provide a global analysis of societal restrictions, vaccination status, and use of the COVID pass, thereby covering a wide spectrum of income status between countries which were included. The data was collected and analyzed per continent, of which the selection of individual countries and territories was determined based on the coverage of the HDI and availability of data. In this research the following countries and territories analyzed: Africa: Egypt; Morocco; Nigeria; South Africa; Tunisia; Uganda; and Zambia. Asia: Azerbaijan; Bahrain; China; Cyprus; Georgia; India; Israel; Japan; Malaysia; Pakistan; Qatar; Saudi Arabia; South Korea; Taiwan; Thailand; Türkiye; United Arab Emirates; and Vietnam. In Europe: Belgium; Denmark; France; Hungary; Italy; Netherlands; Poland; Portugal; Spain; Sweden; and United Kingdom. America: Argentina; Brazil; Canada; Colombia; Mexico; and the United States.
For each country or territory the following parameters were obtained from https://ourworldindata.org/coronavirus: the peak infections per million people during the first wave, delta variant wave, and omicron B.1.1.529 variant wave; the maximum GSI of the entire pandemic and the GSI per March 2022; and vaccination rate (fully vaccinated) per 31 March 2022 [7]. Important is to note that there were differences in the time period during which the peak of each variants wave was reached, for the first wave dates ranged from March 2020 to September 2020, for the delta wave and omicron wave May 2021 to December 2021 and December 2021 to March 2022, respectively.
Government Stringency Index
The Government Stringency Index (GSI) is composed of nine individual components and includes school and workplace closures, cancellations of public events, restrictions on gathering sizes, closures of public transport, stay-at-home requirements, restrictions on internal movement and international travel, and public information campaigns. The individual components are aggregated into a single index which consists of a number ranging from 0–100 [15].
To determine whether a country or territory made use of a COVID pass and under what circumstances, functional publicly available data from the official national health institutes was used. If such information was not stated by the national institute, secondary sources were used.
The Human Development Index (HDI) was retrieved from Human Development Reports, namely https://hdr.undp.org/data-center/human-development-index and was based on the situation in 2020 [16]. The GDP per capita in US $ was retrieved from the data of The World Bank, namely https://data.worldbank.org/, and was based on 2020 [17]. Of this same source, the overall population density of a country (people per square kilometer of land area) was also determined [17].
Statistical analysis
The significance of differences in Government Stringency Index during the Wuhan and the omicron wave, as well as the impact of introducing a COVID pass on the number of COVID-19 cases was calculated by two-sided Student’s t test. Linear regression analysis was performed with GraphPad for https://www.graphpad.com/quickcalcs/linear1/
Results
In our study we have selected countries or territories from across the globe for which sufficient, reliable data were available. Figure 1 shows the geographical location of these countries or territories, color-coded by continent. For each country or territory, the cumulative registered number of COVID-19 cases and deaths since the beginning of the pandemic is indicated. The highest mortality, relative to the number of cases was observed in Georgia (Asia), Mexico (America), and Hungary (Europe). Asia and Africa show the greatest variation between countries or territories in the number of COVID-19 cases and deaths. Whether these differences are due to under-registration or under-reporting cannot be concluded from the available sources.

Table 1.
Demographics and burden of COVID-19. Countries or territories are listed in alphabetical order per continent. Population size per 2020 was obtained from https://www.worldometers.info/world-population/population-by-country/; for India from https://www.macrotrends.net/countries/IND/india/population. GDP is Gross Domestic Product per capita, expressed in US$; HDI is Human Development Index.
| Continent and Country or Territory | Population (as of 2020)[16,17] | Cases (cumulative per million people; March 31, 2022) | Deaths(cumula-tive per million people; March 31, 2022) | Vacci-nation rate (per March 31, 2022) | GDP per capita (US$)2020 | HDI |
| Asia | ||||||
| Azerbaijan | 10.1391.77 | 76.450 | 935 | 47.19 | 5083 | 756 |
| Bahrain | 1.701.575 | 376.128 | 998 | 69.56 | 19514 | 852 |
| China | 1.439.323.776 | 155 | 3 | 86.02 | 10370 | 761 |
| Cyprus | 1.207.359 | 475.863 | 1046 | 72.02 | 26372 | 887 |
| Georgia | 3.989.167 | 440.071 | 4470 | 31.59 | 4447 | 812 |
| India | 1.396.378.127 | 30.360 | 367 | 59.66 | 1811 | 645 |
| Israel | 8.655.535 | 413.196 | 1109 | 65.99 | 37488 | 919 |
| Japan | 126.476.461 | 52.547 | 226 | 79.86 | 34813 | 919 |
| Malaysia | 32.365.999 | 123.263 | 1029 | 78.74 | 10631 | 810 |
| Pakistan | 220.892.340 | 20.618 | 129 | 51.41 | 1446 | 557 |
| Qatar | 2.881.053 | 134.050 | 251 | 88.5 | 56026 | 848 |
| Saudi Arabia | 34.813.871 | 29.563 | 248 | 69.88 | 18691 | 854 |
| South Korea | 51.269.185 | 252.734 | 313 | 86.73 | 31327 | 916 |
| Taiwan | 23.816.775 | 969 | 36 | 76.66 | 28306 | 949 |
| Thailand | 69.799.978 | 50.222 | 349 | 71.8 | 6198 | 777 |
| Turkey | 84.339.067 | 173.963 | 1148 | 62.3 | 12038 | 820 |
| United Arab Emirates | 9.890.402 | 94.372 | 243 | 96.22 | 40438 | 890 |
| Vietnam | 97.338.579 | 96.471 | 423 | 79.15 | 2655 | 704 |
| Africa | ||||||
| Egypt | 102.334.404 | 4.552 | 220 | 30.89 | 4028 | 707 |
| Morocco | 36.910.560 | 31.053 | 428 | 32.56 | 2818 | 686 |
| Nigeria | 206.139.589 | 1.168 | 14 | 4.52 | 2396 | 539 |
| South Africa | 59.308.690 | 62.060 | 1669 | 29.81 | 5659 | 709 |
| Tunisia | 11.818.619 | 83.835 | 2292 | 53.2 | 3780 | 740 |
| Uganda | 45.741.007 | 3.468 | 76 | 17.01 | 891 | 544 |
| Zambia | 18.383.955 | 15.813 | 198 | 11.62 | 1273 | 584 |
| Europe | ||||||
| Belgium | 11.589.623 | 326.663 | 2638 | 78.52 | 45189 | 931 |
| Denmark | 5.792.202 | 519.331 | 963 | 82.5 | 56202 | 940 |
| France | 65.273.511 | 376.011 | 2097 | 77.84 | 35785 | 901 |
| Hungary | 9.660.351 | 185.528 | 4558 | 59.13 | 14368 | 854 |
| Italy | 60.461.826 | 246.758 | 2697 | 79.23 | 29359 | 892 |
| Netherlands | 17.134.872 | 446.569 | 1255 | 72.17 | 46345 | 944 |
| Poland | 37.846.611 | 149.482 | 2886 | 64.23 | 14660 | 880 |
| Portugal | 10.196.709 | 362.778 | 2097 | 92.6 | 19771 | 864 |
| Spain | 46.754.778 | 241.981 | 2149 | 86.09 | 24939 | 904 |
| Sweden | 10.099.265 | 235.250 | 1724 | 74.98 | 51539 | 945 |
| United Kingdom | 67.886.011 | 313.253 | 2846 | 72.49 | 43020 | 932 |
| America | ||||||
| United States | 331.002.651 | 237.189 | 2905 | 65.77 | 58203 | 926 |
| Canada | 37.742.154 | 90.526 | 977 | 81.92 | 42258 | 929 |
| Colombia | 50.882.891 | 117.294 | 2691 | 67.93 | 5892 | 767 |
| Brazil | 212.559.417 | 138.962 | 3064 | 75.1 | 8228 | 765 |
| Argentina | 45.195.774 | 198.529 | 2812 | 81.18 | 11334 | 845 |
| Mexico | 128.932.753 | 44.346 | 2532 | 61.19 | 8909 | 779 |
The total population of the countries and territories included in our study is 5.2 x 10⁹, which amounts to 65% of the world population. Although virtually all countries or territories have reported the number of COVID-19 confirmed cases and deaths, these may not truly reflect the actual numbers. This can be due to limited testing capacity, which results in a lower number of confirmed cases than the true number of infections. Also the number of confirmed deaths may be an underestimate of the true number of deaths caused by COVID-19 because of the use of varying protocols and the attribution of COVID-19 as the cause of death.
We find a significant positive correlation between the number of COVID-19 cases and the GDP per capita. The two outliers are China and Taiwan (indicated with blue symbols in Figure 2), which both show an (extremely) low number of COVID-19 cases while having a relatively high GDP per capita.
Prevention of SARS-CoV-2 infection by vaccination
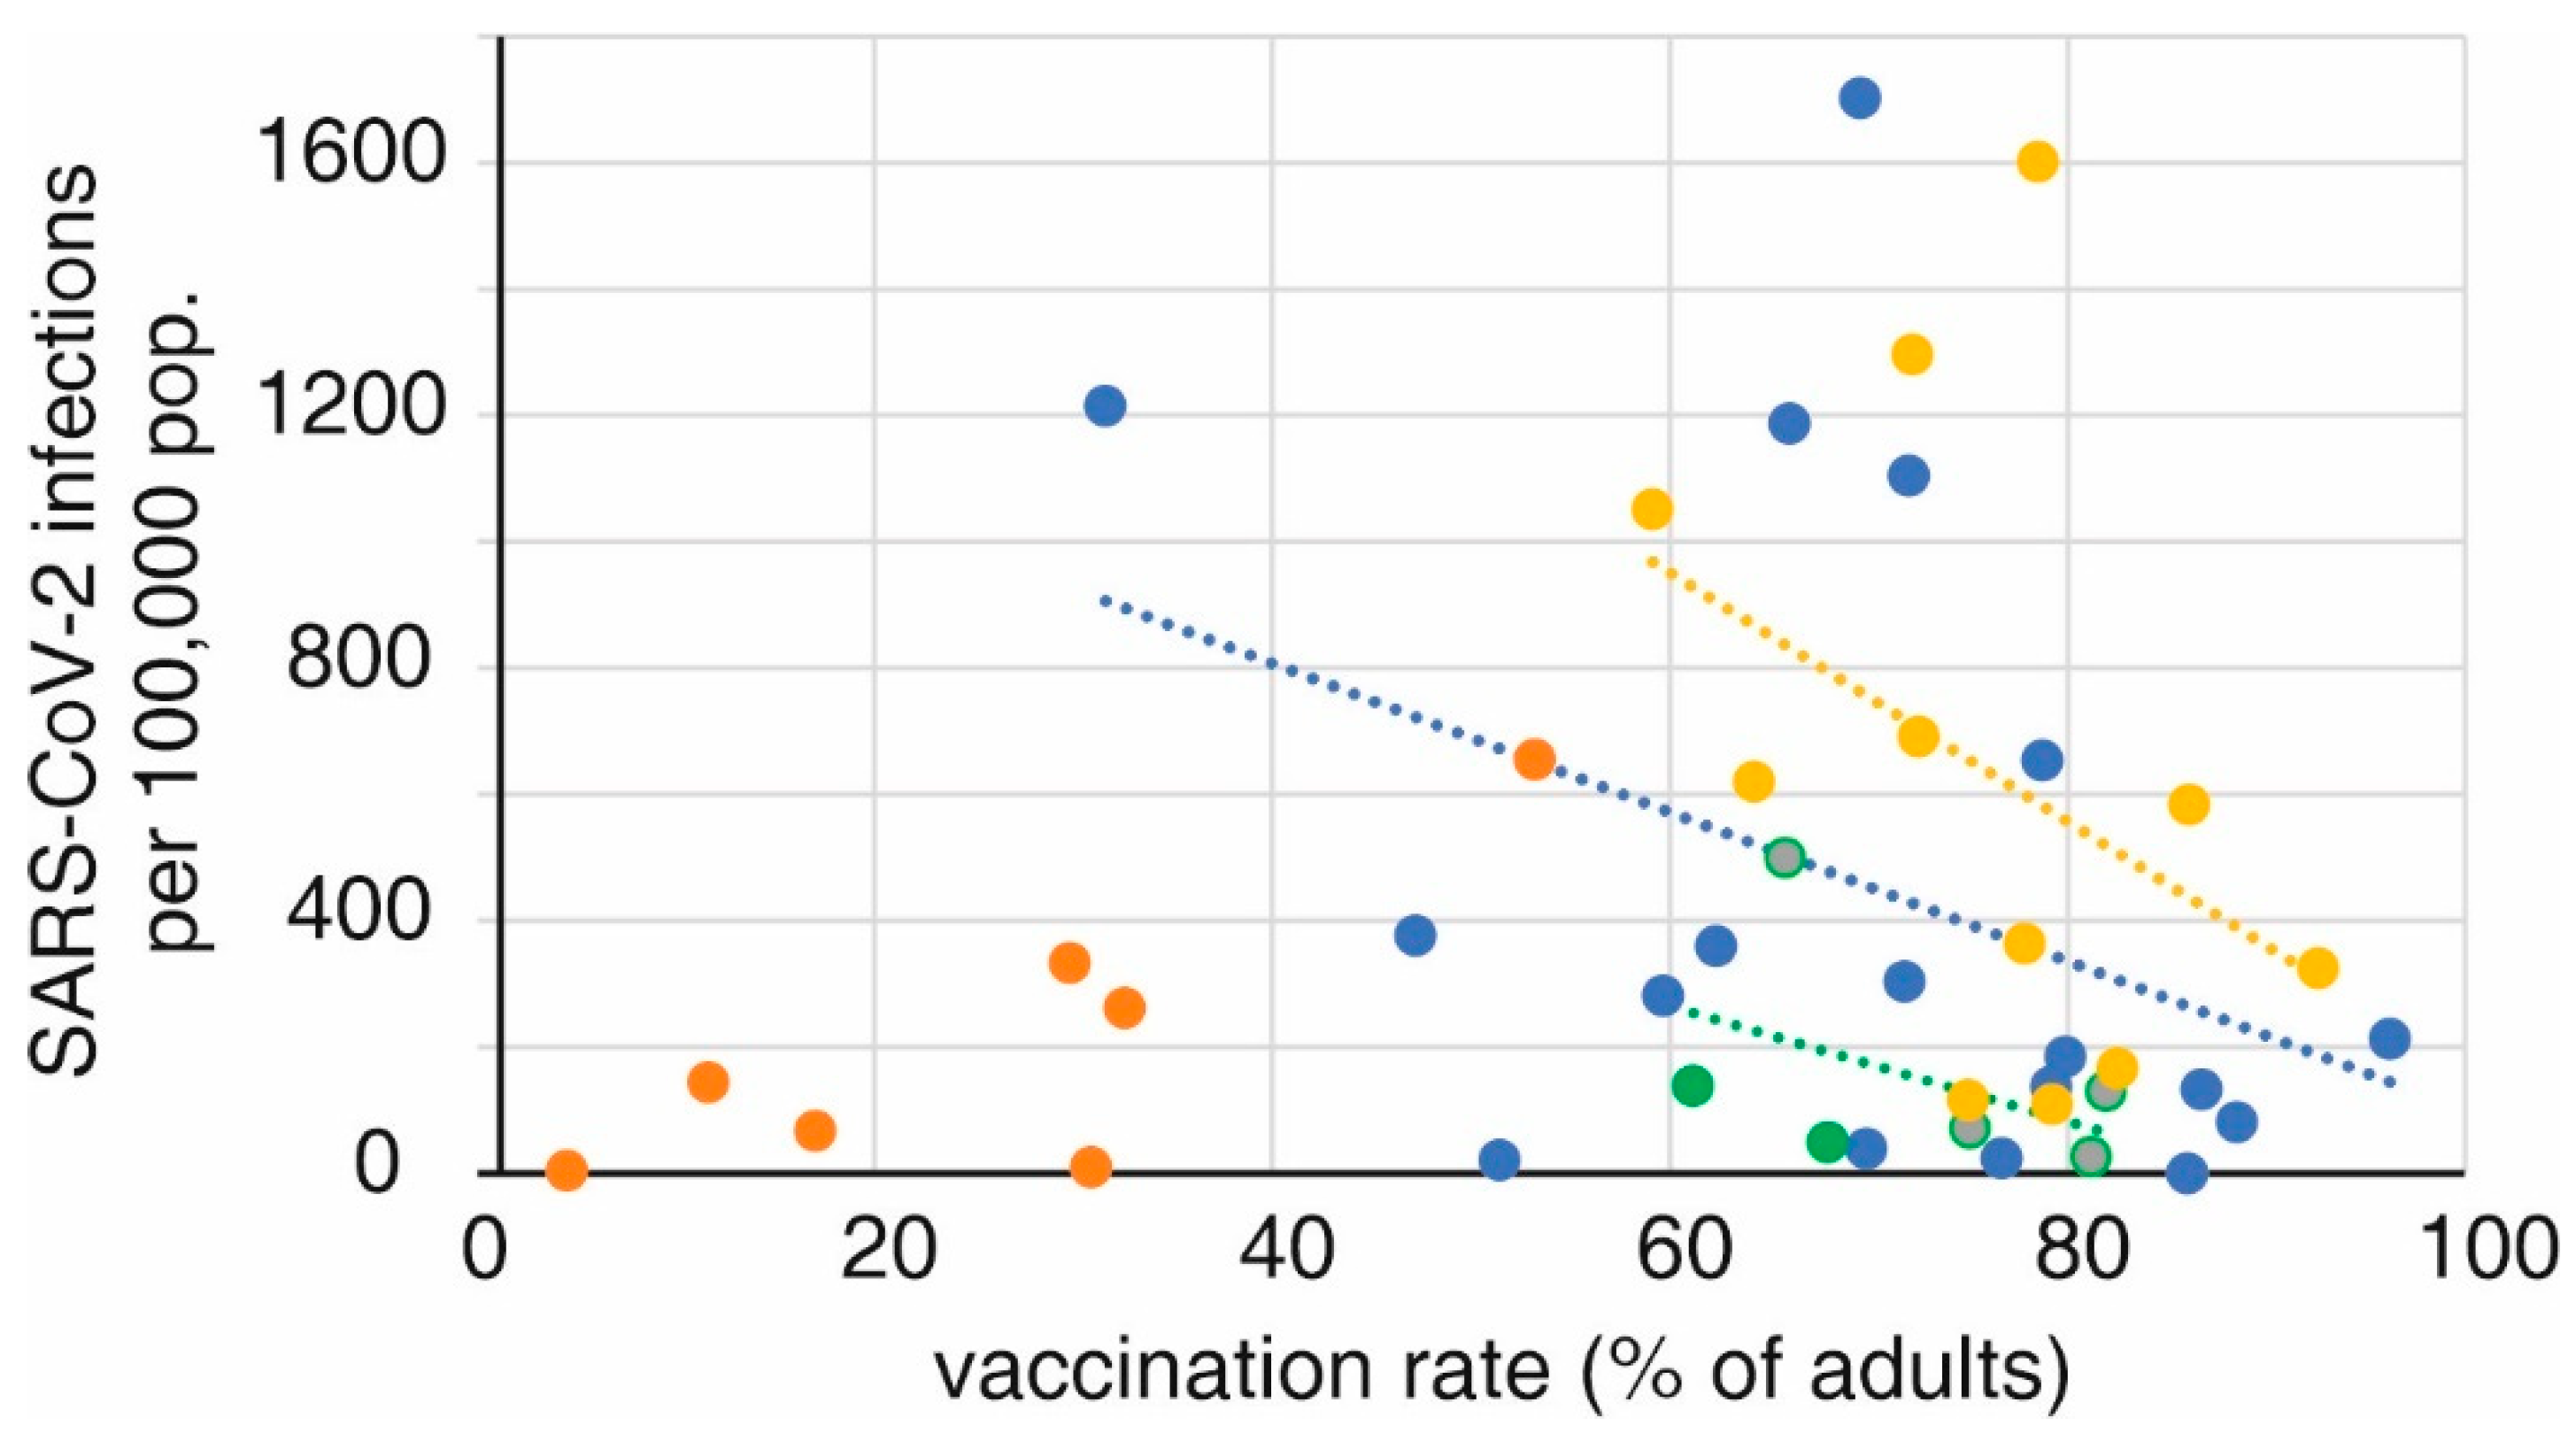
For each continent, a positive correlation was found between the adult vaccination rate and the number of reported infections during the period when the delta variant of SARS-CoV-2 was dominant. The exception are African countries, which have low vaccination rates but also report relatively few infections.
Our data on the effect of vaccination were analyzed by comparing overall vaccination rates per country and continent with the overall number of reported SARS-CoV-2 infections. It should be stressed that the impact of vaccination within a given country or territory would more clearly show the protective effect of vaccination (in terms of hospitalization, intensive care admission, and deaths), but this would preclude comparison between countries and continents.
Figure 3.
Correlation between vaccination rate and number of SARS-CoV-2 infections. Individual countries or territories are color-coded by continent: Asia blue, Europe yellow, the Americas green and Africa red. Linear regression lines are indicated as dotted lines in the color of the respective continent. The correlation coefficients R2 for linear regression were 0.137 (Asia), 0.138 (Europe), and 0.195 (America); p<0.01 in all cases. With the exception of Tunisia, all other African countries had vaccination rates below 40%. .
Societal restrictions
During the pandemic, virtually all countries have imposed, with varying degrees, societal restrictions. These restrictions were highest during the first period of the pandemic and gradually were lifted when vaccination had been implemented and when the omega strain became prevalent. We quantified the partial lifting of the restrictions by comparing the difference between the situation during the first wave (Wuhan) and omicron. The data shown in Figure 4 indicates that the European countries where most of the restrictions had ended by the time omicron became dominant, showed the highest number of infections. In Asia and America, where restrictions were still higher when omicron emerged, a lower number of infections occurred. It should be noted that the data in Figure 4 show omicron infections, as measured by PCR or an antigen (self) test, and not COVID-19 hospital admissions.
Introduction and effect of a COVID pass
In most countries or territories a COVID pass was introduced in 2021, ranging from January 2021 (Taiwan) to December 2021 (Tunisia, Japan and Georgia). For most countries or territories a COVID pass was issued when a person recovered from a documented COVID-19 episode or was fully vaccinated (depending on the particular SARS-CoV-2 vaccine used this meant 1 or 2 doses) or had tested negative in a SARS-CoV-2 PCR test or antigen test. A negative test result was valid for 24-72 hours. A COVID pass could give the carrier access to public places like bars, restaurants, and (movie) theaters and/or certain travel privileges such as travel by public transportation and across borders.
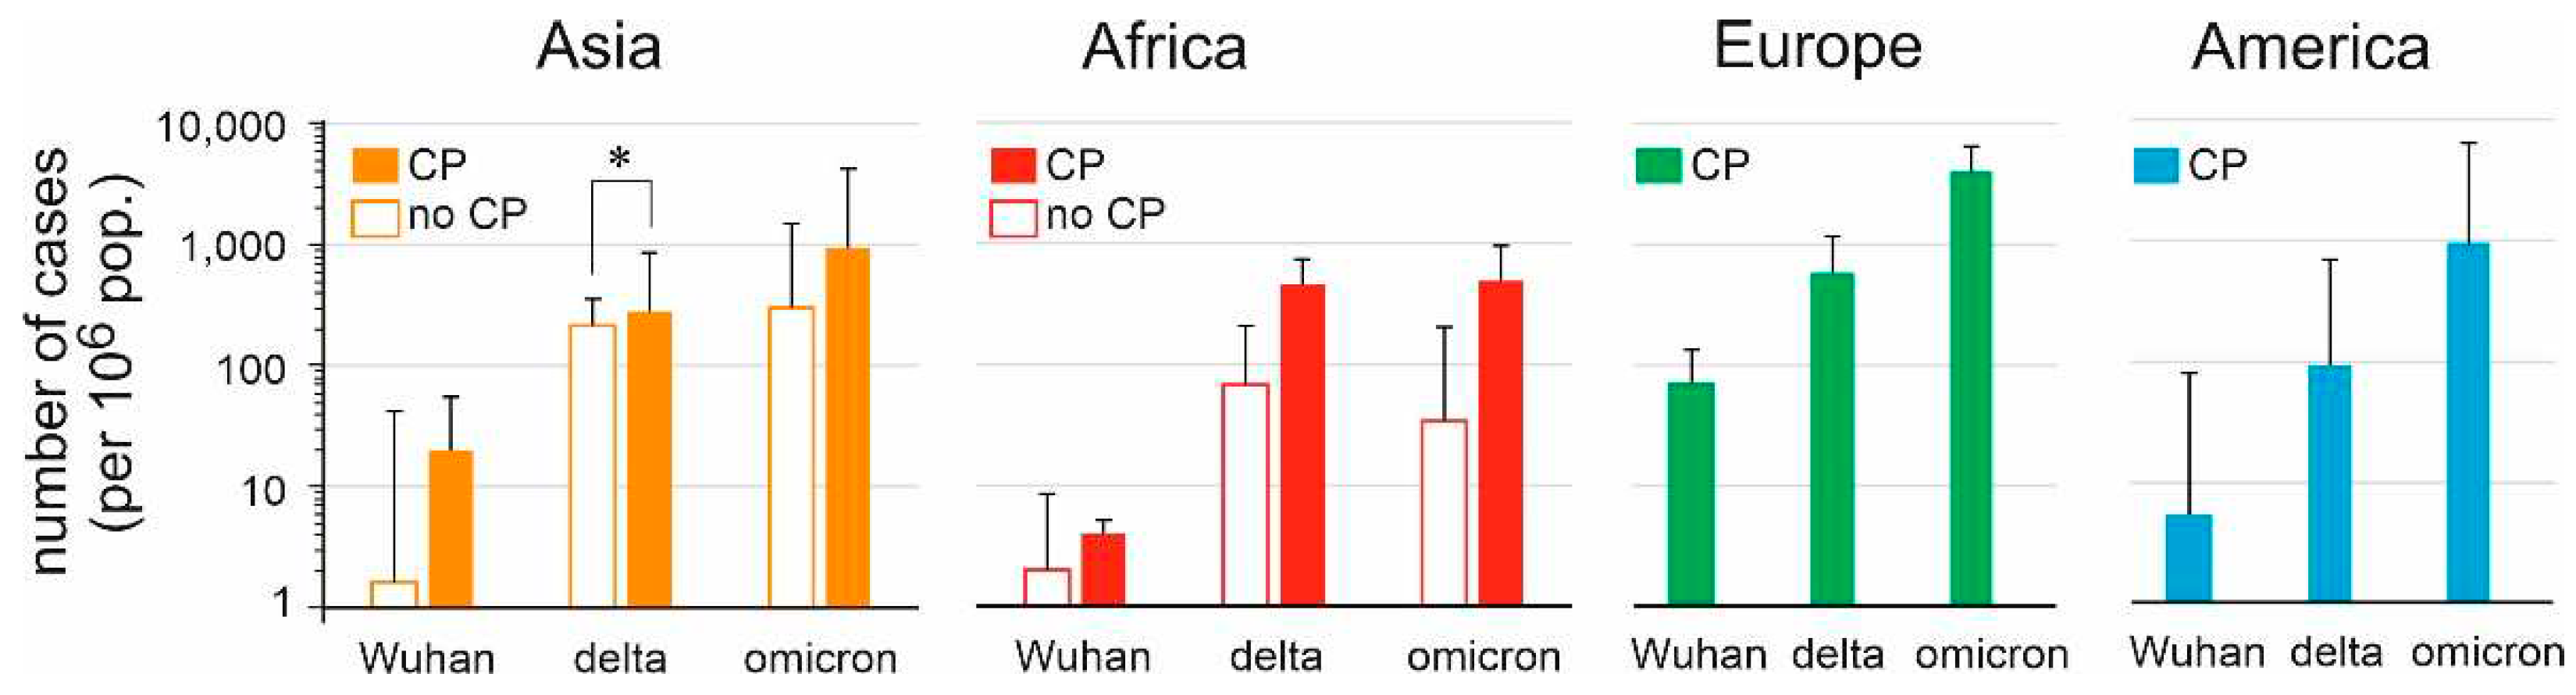
Apart from Asian countries and territories during the delta wave, no significant differences were found in the number of cases between countries that had introduced a COVID pass, and which hadn’t (Figure 5). A meaningful interpretation of these data however is hampered because data on the number of hospitalizations, as well as COVID deaths could not be compared. Furthermore, in many cases it was not clear when a COVID pass was introduced, under what conditions a COVID pass could be issued, and for which social or other public activities the COVID pass was required.
Discussion
The aim of this paper was to analyze the role of SARS-Cov-2 serological status in societal restrictions across the world. As a proxy for serological status, we used the vaccination rate in a given country. To do so, the effect of GDP, HDI and GSI differences on the impact of the different SARS-Cov-2 variants was approximated for several countries representative of their continent. The continent of Oceania was excluded from this research, mainly because in population size as well as income status it is dominated by Australia and New Zealand. Because of this heterogeneity it was impossible to select representative countries and territories. Australia and New Zealand, as well as Hong Kong and Singapore, started with a zero-COVID policy, resulting in relatively few infections and deaths as compared to the rest of the world [18,19]. During or after the omicron outbreak these countries shifted to a living-with-COVID policy, which resulted in a (temporary) increase in percent excess mortality [20].
At first glance it is counterintuitive to find a positive correlation between the GDP of a given country or territory and the number of SARS-CoV-2 infections [21]. It would be expected that the higher the GDP, the more advanced the health care system, higher vaccination rates, and the possibility to impose strict societal restrictions. On the other hand, the number of recorded infections (also) depends on the intensity and degree of testing [22,23]. Low-income countries will not have the medical infrastructure and/or the financial means to be able to afford elaborate testing for the virus. It was reported by medical experts that in Africa, the number of reported cases is an acute underestimation, which can be attributed to the poor African health systems, a lack of sufficient test kits, and inadequate laboratory capacity [24]. Several studies were performed on the number of COVID-19 cases that remain undetected. In October 2021, the WHO calculated that the number of actual cases in Africa was seven times higher than the detected numbers [25]. A similar study found that the actual number of cases in the European countries Italy, Portugal, and Switzerland was four times higher in April 2020 [26]. Furthermore, the WHO estimated that there were 2.74 times more SARS-CoV-2 deaths globally in 2020 and 2021 than reported [27]. It is expected that the number of undetected cases in European countries is lower in October 2021 than in April 2020, because countries had more time to anticipate in this time period. However, to draw valid conclusions about the number of undetected cases, data from the same period needs to be obtained. Furthermore, it is also still dependent on the willingness of people with symptoms to get tested or not [28].
The effect of the difference in Government Stringency Index (GSI) (maximal GSI-GSI April 2022) on the three virus variants shows that the higher this difference, the larger the number of omicron infections. For most countries, the maximal GSI was imposed during the first wave and during the delta wave, after which governments decided to loosen the restrictions in the summer of 2021, when infection rates decreased in most countries. This led to an explosion of omicron infections in late 2021 and early 2022 [29,30]. As mentioned above, the highest GSI rates were reached during either the first wave or the delta wave. A rebound effect as seen with omicron was not observed when the delta variant emerged.
Implementation and feasibility of strict societal restrictions differ for high-income and low-income countries. For instance, in a country like India, strict government policies may not lead to better compliance but can overwhelm the healthcare systems [31].
Relief of societal restrictions was associated with a surge in omicron infections, and the number of infections was highest in countries with the least restrictions. The high replication number of omicron could explain this effect [32,33]. For some countries, the strictness of the GSI was dependent on the vaccination status, meaning that vaccinated people were allowed more social contacts, including traveling [34,35]. Using a cut-off of a 20-percentage points difference in GSI, the countries with (temporary) relief of societal restrictions for vaccinees included Pakistan, South Africa, France, Denmark, Italy, and the United States. The available data do not allow us to conclude whether such a policy influenced the control of spread of SARS-CoV-2 in the population.
Regarding vaccination rate, regardless of the type of vaccine used, the vaccines offered better protection against the delta variant than against the omicron variant. This finding is reported in previous studies as well [36,37]. For each continent, a negative correlation was found between vaccination rate and rate of delta infections. For omicron infections this was not always the case. Furthermore, if a negative correlation was found between vaccination rate and omicron infections, this correlation was always found to be weaker than for the delta infections. However, as mentioned above, this effect could also be attributed to the intensity of the GSI during that wave. For most countries, the GSI was higher at the time of the delta wave than at the time of the omicron wave.
It is known that the omicron variant has a higher R0 than delta, and therefore the number of infections can be expected to be higher, irrespective of vaccination status or GSI [32,38,39]. On the other hand, omicron has a lower morbidity and mortality rate than delta, a finding confirmed on all continents [40,41,42,43,44]. Our analysis is restricted to the number of infections, and not hospitalization or COVID-19 related deaths. Analyzing hospitalization and COVID-19 related deaths would give a subjective view on the matter, because this is dependent on the quality of the healthcare system in a country.
The analyses show that the strongest trends, and thus the highest R2 values, were found in analyses related to the omicron variant. The most plausible explanation for this is the omicron wave being the last wave, with the most reliable data. Countries had more time to set up testing facilities and other infrastructure during the omicron variant than in an earlier phase of the pandemic. This implies that infection data is most reliable for the omicron variant.
In high-income countries, the potential effects of a COVID pass on spread of SARS-CoV-2 could not be determined because all countries included in the analysis implemented such a pass. Analysis and comparison of low- and middle-income countries did not show any effect of the COVID pass on infections. The COVID pass had different prerequisites and privileges across countries, and there is no clear overview for which activities a COVID pass was required, and over what time period it was required in each country.
There are several limitations to the present study. First of all, all the data was collected from the same source. This means that potential structural bias or mistakes in data collection would be present in all the data used in the study. Furthermore, for some countries it can be argued how reliable the published data is. All analyses were performed country-wise and not patient-wise. This means that the study did not use data from individual patients, and underlying conditions were not accounted for. For assessment of the vaccination rate, all types of vaccines were included, and no sub-analysis was performed on the differential efficacy of certain vaccine types. Furthermore, the present study considered what was at first established as fully vaccinated, which is at 2 doses, whereas now, fully vaccinated could also be considered 2 doses and an additional booster dose. The number of undetected cases is also a limitation to this study, especially in countries with high immigration rates where documented vaccination rates and infection rates might be deviant from the actual rates. For the COVID pass, it was very hard to find reliable sources, and within the different passes, there are different guidelines. Whereas some countries only used the COVID pass at the border to accept or deny people from entering the country, some countries also used it to accept or deny people from entering buildings or events. Furthermore, requirements for a valid COVID also differed per country.
A limitation of the analysis of the burden of COVID-19 at the country level is that minority groups (either because of socio-economic position, age, access to health care, or otherwise) could be disproportionally affected [45,46].
At a press conference in March 2023, the Director-General of the WHO, Dr Tedros Adhanom Ghebreyesus, indicated that he was confident that in 2023 COVID-19 will be over as a public health emergency of international concern [47] and on May 23, 2023, the official end of the pandemic was declared [48]. SARS-CoV-2 will remain endemic, infecting susceptible individuals in the populations worldwide. It can be expected that the current variant(s) of SARS-CoV-2 have or will obtain the characteristics of other beta coronaviruses such as HKU1 and OC43, causing mild upper respiratory tract infections during the winter season.
References
- Zhu N, Zhang D, Wang W, Li X, Yang B, Song J, Zhao X, Huang B, Shi W, Lu R, Niu P, Zhan F, Ma X, Wang D, Xu W, Wu G, Gao GF, Tan W; China Novel Coronavirus Investigating and Research Team. A Novel Coronavirus from Patients with Pneumonia in China, 2019. N Engl J Med. 2020 Feb 20;382(8):727-733. [CrossRef]
- Cucinotta D, Vanelli M. WHO Declares COVID-19 a Pandemic. Acta Biomed. 2020 Mar 19;91(1):157-160. [CrossRef]
- Sohrabi C, Alsafi Z, O'Neill N, Khan M, Kerwan A, Al-Jabir A, Iosifidis C, Agha R. World Health Organization declares global emergency: A review of the 2019 novel coronavirus (COVID-19). Int J Surg. 2020 Apr;76:71-76. [CrossRef]
- Hiscott J, Alexandridi M, Muscolini M, Tassone E, Palermo E, Soultsioti M, Zevini A. The global impact of the coronavirus pandemic. Cytokine Growth Factor Rev. 2020 Jun;53:1-9. [CrossRef]
- Shah SGS, Farrow A. A commentary on "World Health Organization declares global emergency: A review of the 2019 novel Coronavirus (COVID-19)". Int J Surg. 2020 Apr;76:128-129. [CrossRef]
- WHO Coronavirus (COVID-19) dashboard. (n.d.). WHO.int. Retrieved June 3, 2022, from https://covid19.who.int/.
- Ritchie H, Mathieu E, Rodés-Guirao L, Appel C, Giattino C, Ortiz-Ospina E, Hasell J, Macdonald B, Beltekian D, Max Roser M (2020) - "Coronavirus Pandemic (COVID-19)". Published online at OurWorldInData.org. Retrieved from: https://ourworldindata.org/coronavirus [assessed october 22,2022].
- Greer SL, King EJ, da Fonseca EM, Peralta-Santos A. The comparative politics of COVID-19: The need to understand government responses. Glob Public Health. 2020 Sep;15(9):1413-1416. [CrossRef]
- Khailany RA, Safdar M, Ozaslan M. Genomic characterization of a novel SARS-CoV-2. Gene Rep. 2020 Jun;19:100682. [CrossRef]
- Golob JL, Lugogo N, Lauring AS, Lok AS. SARS-CoV-2 vaccines: a triumph of science and collaboration. JCI Insight. 2021 ;6(9):e149187. 10 May. [CrossRef]
- Rijkers GT, Weterings N, Obregon-Henao A, Lepolder M, Dutt TS, van Overveld FJ, Henao-Tamayo M. Antigen Presentation of mRNA-Based and Virus-Vectored SARS-CoV-2 Vaccines. Vaccines (Basel). 2021;9(8):848. [CrossRef]
- Chen LH, Petersen E, Blumberg L, Piyaphanee W, Steffen R. COVID-19 health passes: current status and prospects for a global approach. J Travel Med. 2021 Oct 11;28(7):taab118. [CrossRef]
- Ward JK, Gauna F, Gagneux-Brunon A, Botelho-Nevers E, Cracowski JL, Khouri C, Launay O, Verger P, Peretti-Watel P. The French health pass holds lessons for manda-tory COVID-19 vaccination. Nat Med. 2022 Feb;28(2):232-235. [CrossRef]
- Wang B, Ping Y. A comparative analysis of COVID-19 vaccination certificates in 12 countries/regions around the world: Rationalising health policies for international travel and domestic social activities during the pandemic. Health Policy. 2022 Aug;126(8):755-762. [CrossRef]
- Hale T, Angrist N, Goldszmidt R, Kira B, Petherick A, Phillips T, Webster S, Cameron-Blake E, Hallas L, Majumdar S, Tatlow H. A global panel database of pandemic policies (Oxford COVID-19 Government Response Tracker). Nat Hum Behav. 2021;5(4):529-538. [CrossRef]
- Human Development Reports. https://hdr.undp.org/data-center/human-development-index [assessed June 23, 2023].
- The World Bank. https://data.worldbank.org/ [assessed June 23, 2023].
- Stobart A, Duckett S. Australia's Response to COVID-19. Health Econ Policy Law. 2022 Jan;17(1):95-106. [CrossRef]
- Alshammari TM, Alenzi KA, Alnofal FA, Fradees G, Altebainawi AF. Are countries' precautionary actions against COVID-19 effective? An assessment study of 175 countries worldwide. Saudi Pharm J. 2021 May;29(5):391-409. [CrossRef]
- Cao X, Li Y, Zi Y, Zhu Y. The shift of percent excess mortality from zero-COVID policy to living-with-COVID policy in Singapore, South Korea, Australia, New Zealand and Hong Kong SAR. Front Public Health. 2023 Mar 20;11:1085451. [CrossRef]
- Pardhan S, Drydakis N. Associating the Change in New COVID-19 Cases to GDP per Capita in 38 European Countries in the First Wave of the Pandemic. Front Public Health. 2021 Jan 20;8:582140. [CrossRef]
- Pettit SD, Jerome KR, Rouquié D, Mari B, Barbry P, Kanda Y, Matsumoto M, Hester S, Wehmas L, Botten JW, Bruce EA. 'All In': a pragmatic framework for COVID-19 testing and action on a global scale. EMBO Mol Med. 2020 Jun 8;12(6):e12634. [CrossRef]
- Gupta M, Wahl B, Adhikari B, Bar-Zeev N, Bhandari S, Coria A, Erchick DJ, Gupta N, Hariyani S, Kagucia EW, Killewo J, Limaye RJ, McCollum ED, Pandey R, Pomat WS, Rao KD, Santosham M, Sauer M, Wanyenze RK, Peters DH. The need for COVID-19 research in low- and middle-income countries. Glob Health Res Policy. 2020 Jul 1;5:33. [CrossRef]
- Dzinamarira T, Dzobo M, Chitungo I. COVID-19: A perspective on Africa's capacity and response. J Med Virol. 2020 Nov;92(11):2465-2472. [CrossRef]
- Burki, TK. Undetected COVID-19 cases in Africa. Lancet Respir Med. 2021 Dec;9(12):e121. [CrossRef]
- Català M, Pino D, Marchena M, Palacios P, Urdiales T, Cardona PJ, Alonso S, López-Codina D, Prats C, Alvarez-Lacalle E. Robust estimation of diagnostic rate and real incidence of COVID-19 for European policymakers. PLoS One. 2021 Jan 7;16(1):e0243701. [CrossRef]
- Msemburi W, Karlinsky A, Knutson V, Aleshin-Guendel S, Chatterji S, Wakefield J. The WHO estimates of excess mortality associated with the COVID-19 pandemic. Nature. 2023 Jan;613(7942):130-137. [CrossRef]
- Vandrevala T, Montague A, Terry P, Fielder MD. Willingness of the UK public to volunteer for testing in relation to the COVID-19 pandemic. BMC Public Health. 2022 Mar 22;22(1):565. [CrossRef]
- Taylor, L. Covid-19: Omicron drives weekly record high in global infections. BMJ. 2022;376:o66. [CrossRef]
- Willyard, C. What the Omicron wave is revealing about human immunity. Nature. 2022 Feb;602(7895):22-25. [CrossRef]
- Kishore K, Jaswal V, Pandey AK, Verma M, Koushal V. Utility of the Comprehensive Health and Stringency Indexes in Evaluating Government Responses for Containing the Spread of COVID-19 in India: Ecological Time-Series Study. JMIR Public Health Surveill. 2023 Feb 10;9:e38371. [CrossRef]
- Liu Y, Rocklöv J. The effective reproductive number of the Omicron variant of SARS-CoV-2 is several times relative to Delta. J Travel Med. 2022 ;29(3):taac037. 31 May. [CrossRef]
- Ren SY, Wang WB, Gao RD, Zhou AM. Omicron variant (B.1.1.529) of SARS-CoV-2: Mutation, infectivity, transmission, and vaccine resistance. World J Clin Cases. 2022 Jan 7;10(1):1-11. [CrossRef]
- Sharun K, Tiwari R, Dhama K, Rabaan AA, Alhumaid S. COVID-19 vaccination passport: prospects, scientific feasibility, and ethical concerns. Hum Vaccin Immunother. 2021 Nov 2;17(11):4108-4111. [CrossRef]
- Hall MA, Studdert DM. Privileges and Immunity Certification During the COVID-19 Pandemic. JAMA. 2020 Jun 9;323(22):2243-2244. [CrossRef]
- Andeweg SP, de Gier B, Eggink D, van den Ende C, van Maarseveen N, Ali L, Vlaemynck B, Schepers R, Hahné SJM, Reusken CBEM, de Melker HE, van den Hof S, Knol MJ. Protection of COVID-19 vaccination and previous infection against Omicron BA.1, BA.2 and Delta SARS-CoV-2 infections. Nat Commun. 2022 Aug 12;13(1):4738. [CrossRef]
- Keyel AC, Russell A, Plitnick J, Rowlands JV, Lamson DM, Rosenberg E, St George K. SARS-CoV-2 Vaccine Breakthrough by Omicron and Delta Variants, New York, USA. Emerg Infect Dis. 2022 Oct;28(10):1990-1998. [CrossRef]
- Du Z, Hong H, Wang S, Ma L, Liu C, Bai Y, Adam DC, Tian L, Wang L, Lau EHY, Cowling BJ. Reproduction Number of the Omicron Variant Triples That of the Delta Variant. Viruses. 2022 Apr 15;14(4):821. [CrossRef]
- Wang C, Liu B, Zhang S, Huang N, Zhao T, Lu QB, Cui F. Differences in incidence and fatality of COVID-19 by SARS-CoV-2 Omicron variant versus Delta variant in relation to vaccine coverage: A world-wide review. J Med Virol. 2023 Jan;95(1):e28118. [CrossRef]
- Ward IL, Bermingham C, Ayoubkhani D, Gethings OJ, Pouwels KB, Yates T, Khunti K, Hippisley-Cox J, Banerjee A, Walker AS, Nafilyan V. Risk of covid-19 related deaths for SARS-CoV-2 omicron (B.1.1.529) compared with delta (B.1.617.2): retrospective cohort study. BMJ. 2022 Aug 2;378:e070695. [CrossRef]
- Lorenzo-Redondo R, Ozer EA, Hultquist JF. Covid-19: is omicron less lethal than delta? BMJ. 2022 Aug 2;378:o1806. [CrossRef]
- Kim YY, Choe YJ, Kim J, Kim RK, Jang EJ, Lee H, Yi S, Lee S, Park YJ. Vaccine Effectiveness Against Severe Disease and Death for Patients With COVID-19 During the Delta-Dominant and Omicron-Emerging Periods: A K-COVE Study. J Korean Med Sci. 2023 Mar 20;38(11):e87. [CrossRef]
- Dobrowolska K, Brzdęk M, Zarębska-Michaluk D, Rzymski P, Rogalska M, Moniuszko-Malinowska A, Szymanek-Pasternak A, Jaroszewicz J, Dutkiewicz E, Kowalska J, Sikorska K, Flisiak R. Differences between the course of SARS-CoV-2 infections in the periods of the Delta and Omicron variants dominance in Poland. Pol Arch Intern Med. 2023 Jan 5:16403. [CrossRef]
- Intawong K, Chariyalertsak S, Chalom K, Wonghirundecha T, Kowatcharakul W, Ayood P, Thongprachum A, Chotirosniramit N, Noppakun K, Khwanngern K, Teacharak W, Piamanant P, Khammawan P. Reduction in severity and mortality in COVID-19 patients owing to heterologous third and fourth-dose vaccines during the periods of delta and omicron predominance in Thailand. Int J Infect Dis. 2023 Jan;126:31-38. [CrossRef]
- Mahmoudi J, Xiong C. How social distancing, mobility, and preventive policies affect COVID-19 outcomes: Big data-driven evidence from the District of Columbia-Maryland-Virginia (DMV) megaregion. PLoS One. 2022 Feb 17;17(2):e0263820. [CrossRef]
- Gambau B, Palomino JC, Rodríguez JG, Sebastian R. COVID-19 restrictions in the US: wage vulnerability by education, race and gender, Applied Economics, 2022, 54:25, 2900-2915. [CrossRef]
- World Health Organization. Virtual press conference on COVID-19 & Other Global Health Emergencies. 17 March, 2023. https://www.who.int/publications/m/item/virtual-press-conference-on-covid-19---otherglobal- health-emergencies.
- Harris, E. WHO Declares End of COVID-19 Global Health Emergency. JAMA. 2023 Jun 6;329(21):1817. [CrossRef]
Figure 1.
Overview of countries and territories included in this study, color coded by continent and indicated by their 3-letter abbreviation (https://www.iban.com/country-codes ). Countries or territories which have used a COVID pass are underlined. The number of COVID-19 cases (per 100.000) is indicated by proportional circles; inner circles represent the relative number of COVID-19 deaths (per 1,000.000).
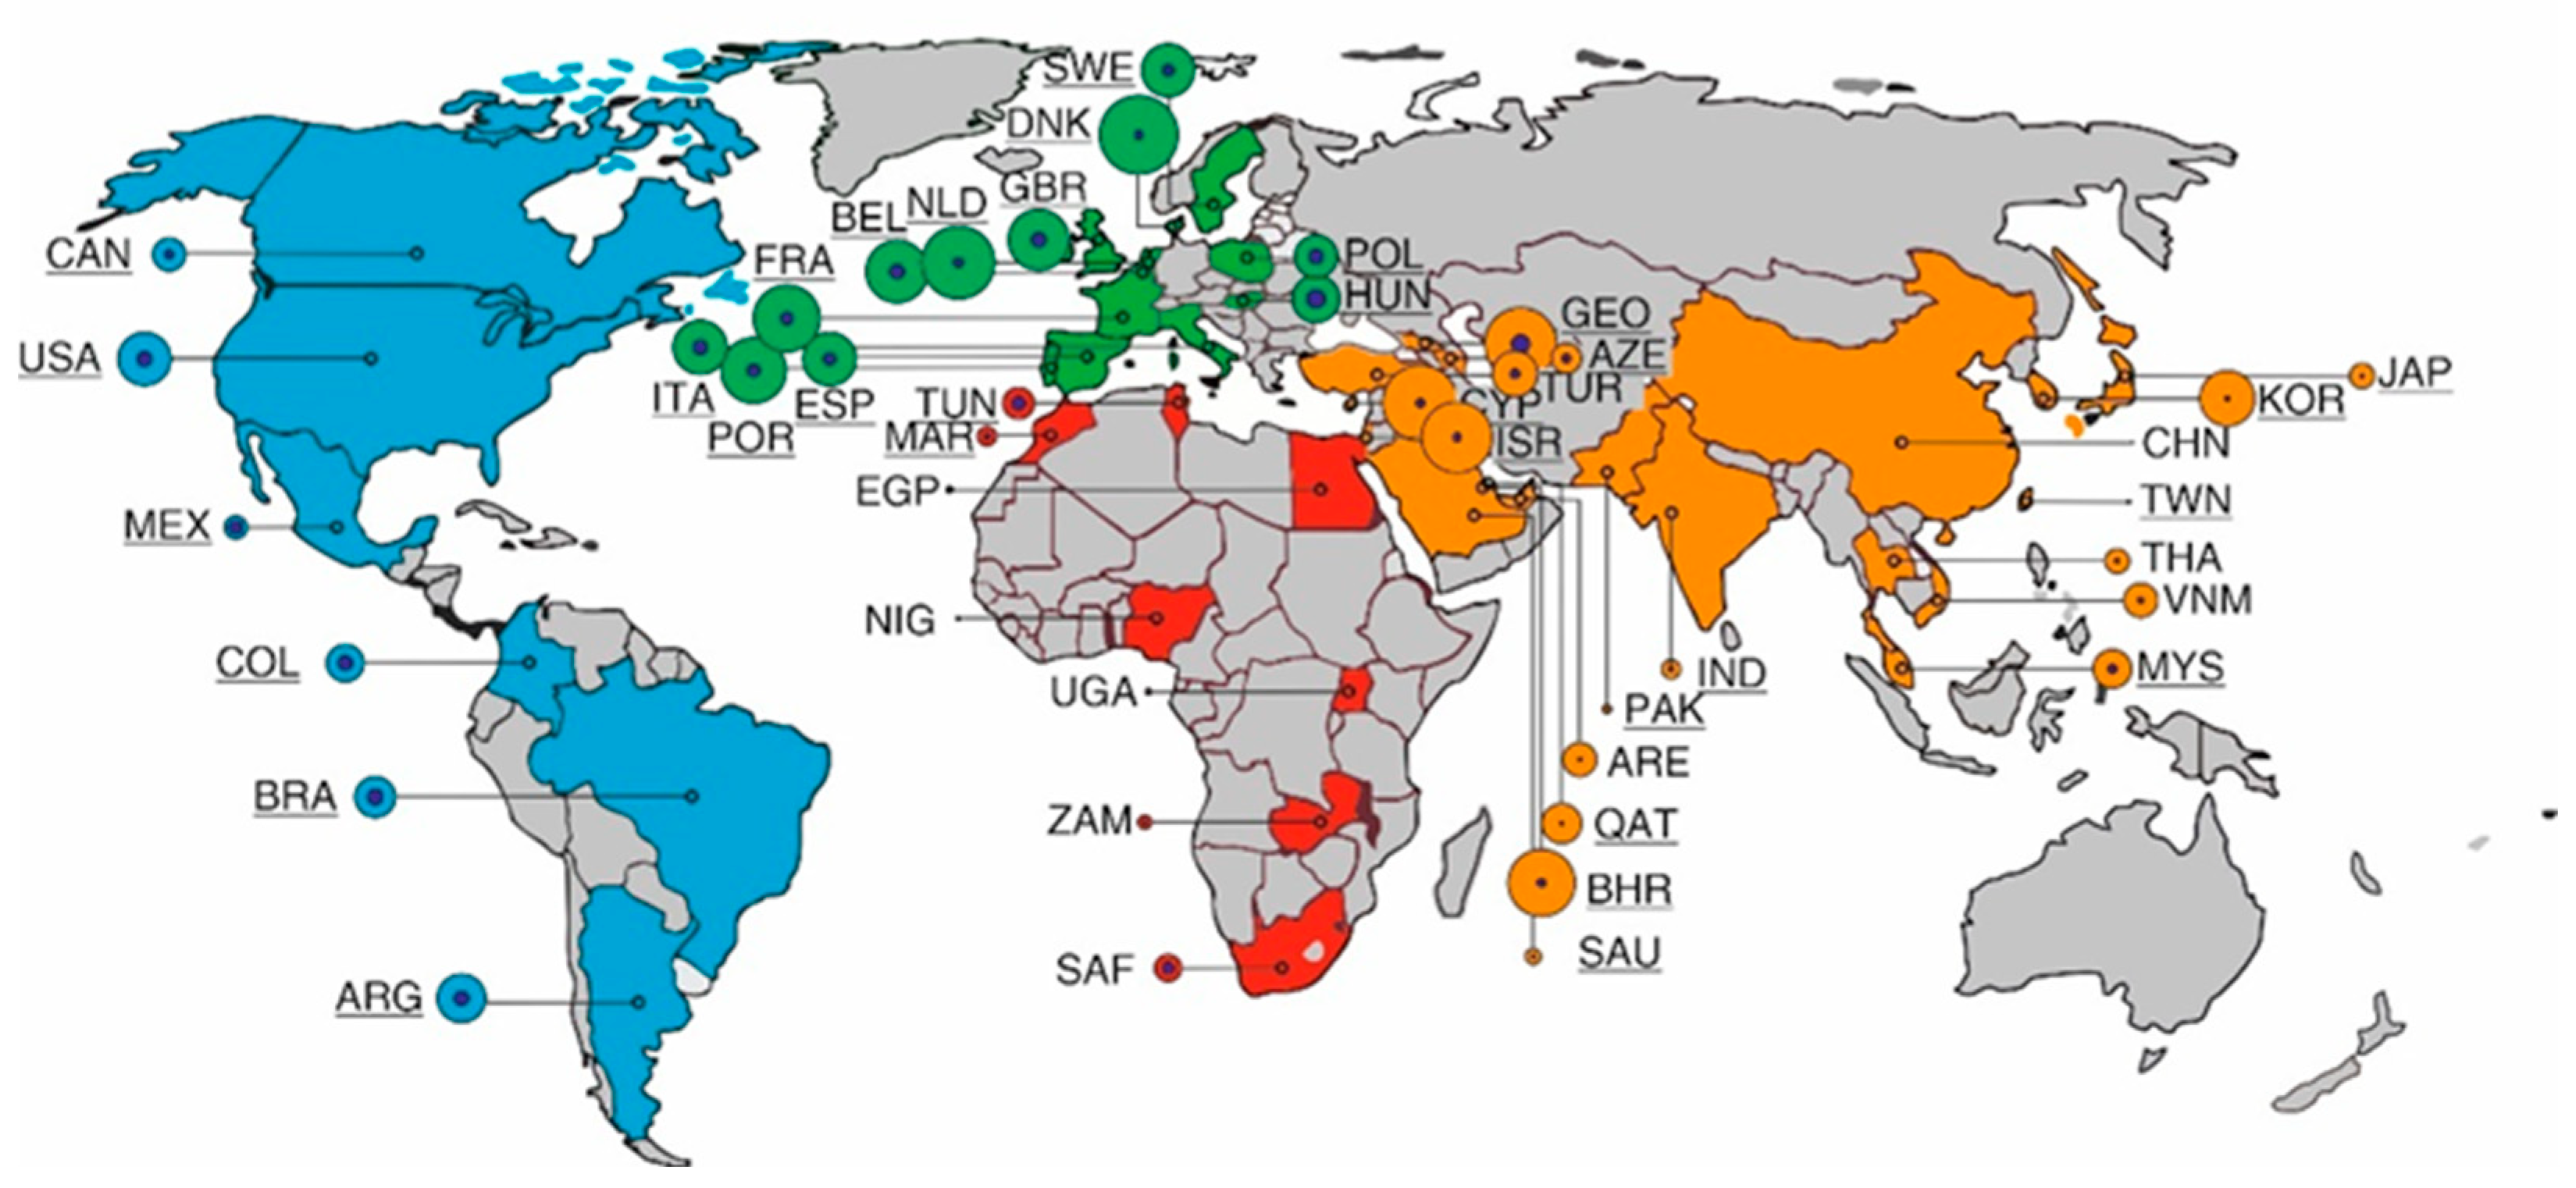
Figure 2.
Correlation between Gross Domestic Product and the (cumulative) number of COVID-19 cases. R2 = 0.3015, F=16.84, p < 0.01. China and Taiwan are indicated with blue symbols.
Figure 2.
Correlation between Gross Domestic Product and the (cumulative) number of COVID-19 cases. R2 = 0.3015, F=16.84, p < 0.01. China and Taiwan are indicated with blue symbols.
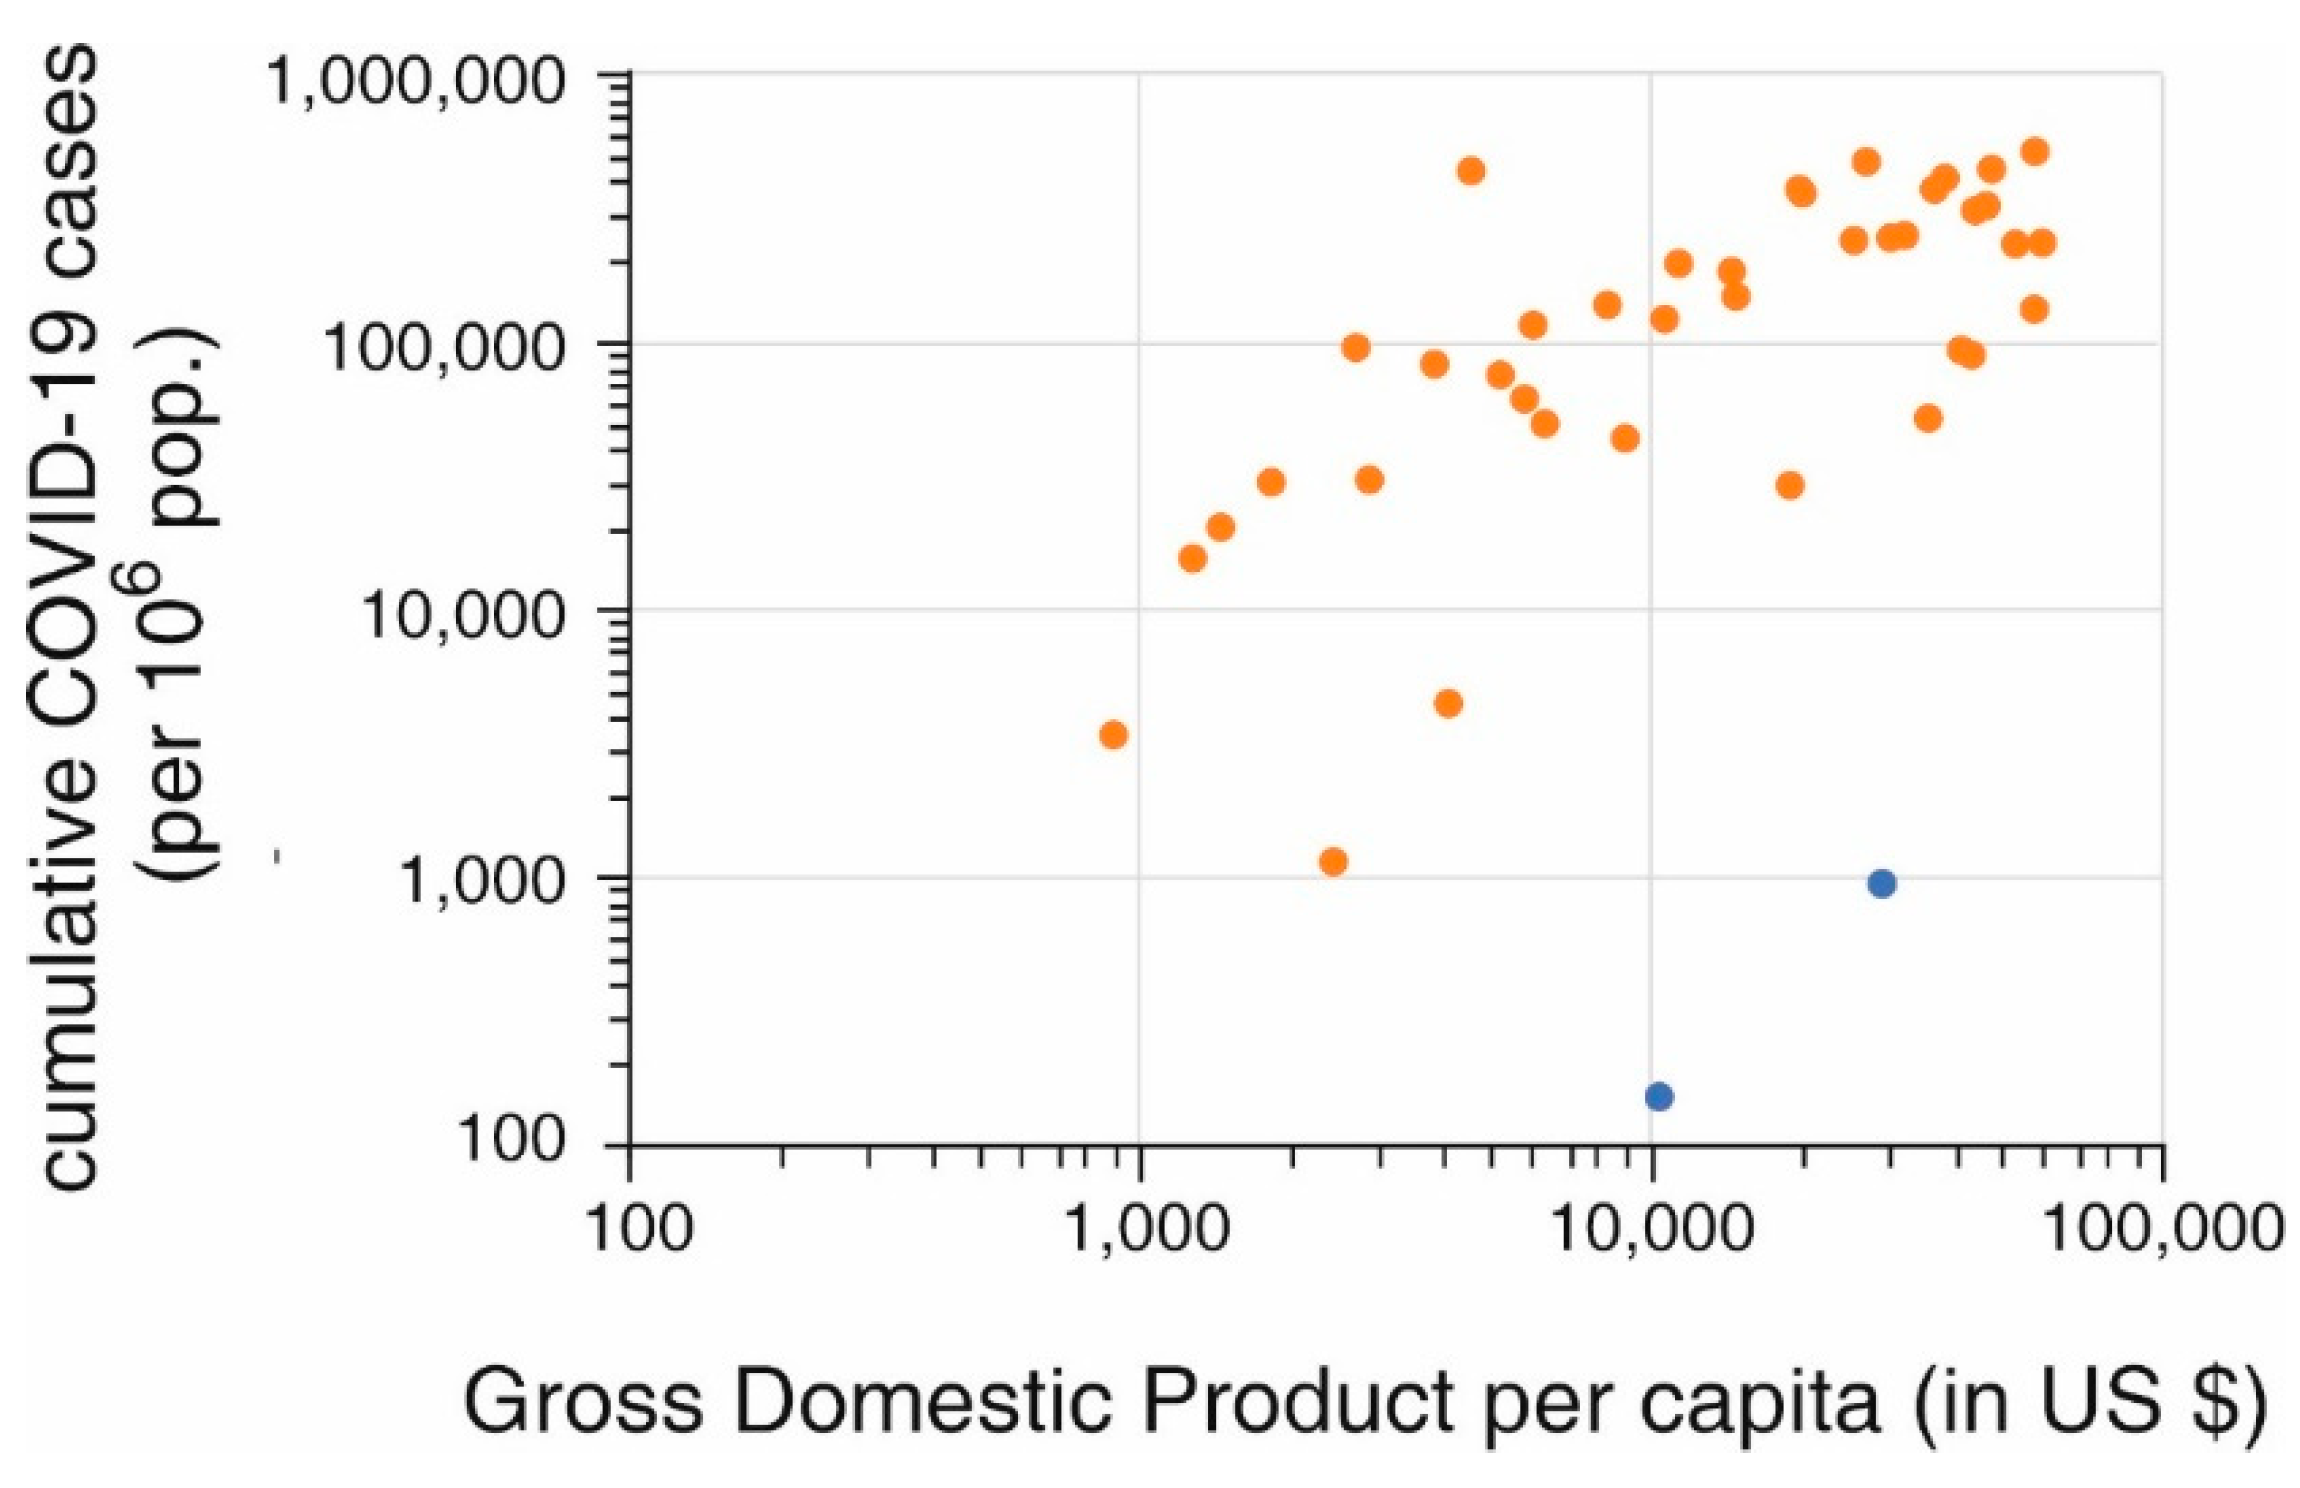
Figure 4.
Stringency index of societal restrictions during the period that the SARS-CoV-2 Wuhan strain was dominant (March 2020 to September 2020) as compared to the period when omicron was dominant (analyzed from December 2021 to March 2022) (plotted on the left Y-axis). Mean + S.D. of the countries or territories included per continent is shown. The number of omega infections per 106 population from December 2021 to March 2022 is shown (plotted on the right Y-axis). ** indicates significant difference (P < 0.01) in two-sided student’s t-test.
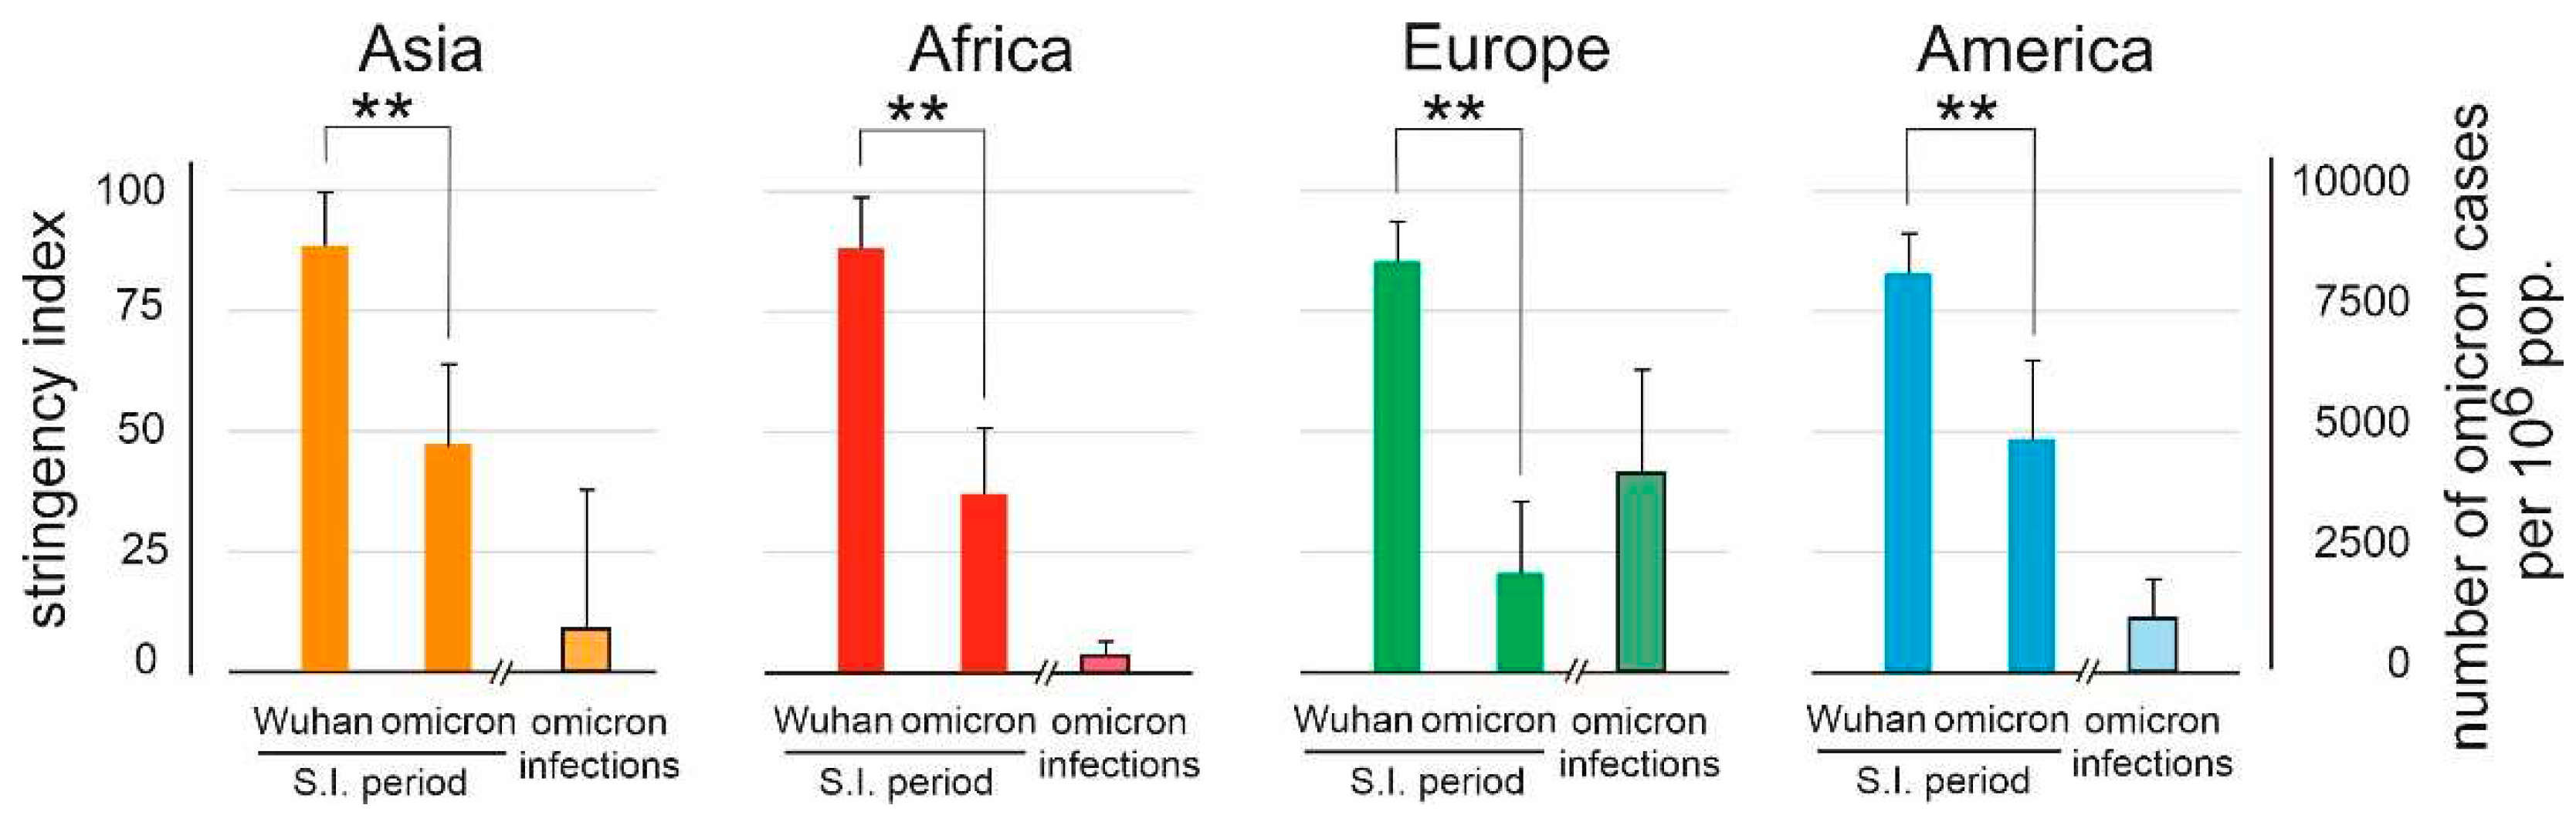
Figure 5.
Relation between implementation of a COVID pass (CP) and number of COVID-19 cases (expressed per 106 population) during the first wave of SARS-CoV-2 (Wuhan strain), the delta wave, and the omicron wave. Of the Asian countries or territories included in this study, 12/17 did use a CP, in Africa this was 2/7, while in Europa and the Americas each country used a CP of some sort. * indicates significant difference (P < 0.05) in two-sided student’s t-test.
Disclaimer/Publisher’s Note: The statements, opinions and data contained in all publications are solely those of the individual author(s) and contributor(s) and not of MDPI and/or the editor(s). MDPI and/or the editor(s) disclaim responsibility for any injury to people or property resulting from any ideas, methods, instructions or products referred to in the content. |
© 2023 by the authors. Licensee MDPI, Basel, Switzerland. This article is an open access article distributed under the terms and conditions of the Creative Commons Attribution (CC BY) license (http://creativecommons.org/licenses/by/4.0/).
Copyright: This open access article is published under a Creative Commons CC BY 4.0 license, which permit the free download, distribution, and reuse, provided that the author and preprint are cited in any reuse.


