Submitted:
12 July 2023
Posted:
13 July 2023
You are already at the latest version
Abstract
Enzalutamide is a drug used to treat PC. Docetaxel is a drug for chemotherapy for different cancers including prostate cancer (PC). The effectiveness of these drugs in treating castration-resistant prostate cancer (CRPC) is not consistent and thus, CRPC is still an incurable disease. Recent evidence showed that the bio-inhibitor of FABP5, dmrFABP5, suppressed the tumorigenicity and metastasis of the CRPC cells. In this work, we studied the possible synergic effect of dmrFABP5 combined with either Enzalutamide or Docetaxel on suppressing tumorigenicity of the PC cells. A highly significant synergic effect was observed when dmrFABP5 was used in combination with Enzalutamide on the androgen-responsive PC cells 22RV1. A highly significant synergic effect was also observed when dmrFABP5 was combined with Docetaxel on 22RV1 cells and on the highly malignant, androgen-receptor (AR)-negative DU145 cells. These combined applications exhibited a highly significant inhibitory action on the viability, migration, invasion and colony formation abilities of both 22RV1and DU145 cells. However, dmrFABP5 did not produce any suppression effect when used on FABP5-negative cell line LNCaP, although Enzalutamide can significantly suppress LNCaP cells as a single agent. Further investigations suggested that these synergistic effects were produced by interrupting the FABP5-related signal transduction pathway in PC cells.
Keywords:
dmrFABP5
; Prostate Cancer
; CRPC
; Enzalutamide
; Docetaxel
; Synergic effect.
1. Introduction
Despite the improvements in chemotherapeutic and anti-androgen therapies [1] in recent years, prostate cancer (PCa) remained to be the second most common cause of male cancer-related death in developed countries. Prostate cancer responds well to the treatments at the early stage, but in most cases, the cancer relapses and becomes castration-resistant in about 2 years after the initial treatment. The growth and dissemination of castration-resistant prostate cancer (CRPC) do not rely on male androgen stimulation anymore and respond poorly to further androgen deprivation therapy (ADT). Thus, CRPC is currently still an incurable disease. It is imperative to understand the molecular mechanisms involved in the conversion of the cancer cells from androgen-dependent to androgen-independent status and to find out new strategies to treat the aggressive CRPC [2]. It is well known that adenocarcinomas of the prostate need lipids as energy sources to fuel their development and expansion, and thus dysregulated lipid metabolism was well known to be associated with the onset and progression of prostate cancer cells [3,4]. In addition, to act as key signalling molecules in the pathways involved in the advancement of prostate cancer, the lipid-degrading products fatty acids are active participants in a variety of biological processes. FABP5 is a member of a family of intracellular lipid chaperones that transports fatty acids to its nuclear receptor PPARγ, resulting in an upregulation of proangiogenic protein vascular endothelial growth factor (VEGF), which can lead to the enhancement of the malignant progression of the CRPC cells [5,6]. In normal prostate cells, FABP5 is either not expressed or expressed at an extremely low level, but FABP5 expression is greatly increased in PCa cells. The increased level of FABP5 in prostate carcinomas correlated significantly with the degree of malignancy measured by Gleason scores. The highest level of FABP5 is expressed in most advanced, highly malignant carcinomas [7,8,9,10]. Previous study showed that the nuclear fatty acid receptor peroxisome proliferator-activated receptor gamma (PPARγ), which upregulates the expression of VEGF gene, was greatly increased in responding to the fatty acid stimulation and that this increase was significantly associated with a reduced patient survival [7,11].
An increased FABP5 expression was a strong factor to promote the malignant progression of the PCa cells [11,12,13]. Targeting the increased FABP5 was believed to be a novel strategy to suppress the malignant progression of the cancer cells [14]. Recently, a chemical FABP5 inhibitor named SB-FI-26 was developed and used to treat CRPC cells. The results from this experimental treatment showed that SB-FI-26 produced a 9-fold suppression in the primary tumour mass and a 50% suppression of the tumour metastasis in the experimental nude mouse model [15,16,17]. Shortly after the finding that SB-FI-26 could suppress CRPC cells, a more potent FABP5 bio-inhibitor was developed and named dmrFABP5 which was a recombinant protein developed by mutating 2 of the 3 amino acids in the fatty acid-binding motif of the FABP5 cDNA. An experimental treatment study showed that dmrFABP5 produced a 14-fold reduction in the primary tumour mass and a 100% of tumour metastasis suppression in nude mouse model cells. Further studies showed that SB-FI-26 suppressed the tumorigenicity by competitively inhibiting the cellular fatty acid-uptake and hence disrupting the FABP5- PPARγ-VEGF signalling transduction pathway in CRPC cells. However, the molecular mechanisms on how dmrFABP5 suppressed the cancer cells was not fully understood and the recent evidence showed that it was involved in promoting apoptosis of the cancer cells [11,12,15,18].
Docetaxel is a chemotherapeutic agent used as a standard treatment for CRPC [19,20]. It targets the microtubule, disrupts cell cycle division, and promotes apoptosis [21]. Docetaxel plays a significant role in the increased level of acetylation in α-tubulins which could lead to a reduction in VEGF level and an increase in apoptosis [22,23]. Docetaxel also downregulates AR expression through targeting tubulin [21]. Apart from the effect on microtubule formation, docetaxel can suppress Bcl-2 expression and increase the level of Bax proteins and hence to break the balance of promoting and suppressing apoptosis [24,25]. Although docetaxel was often used for clinical treatment, the resistance to this drug frequently developed in PCa cells [20]. ADT, through using AR inhibitor enzalutamide, on the other hand, is a second-generation of anti-androgen that is used to treat CRPC [26,27]. Despite the widespread application of the latest generation of inhibitors such as enzalutamide, resistance to the treatment still developed [28,29,30]. The enzalutamide resistance was related to the AR splicing variants, particularly AR-V7 [31,32,33,34]. Investigations on PCa samples and cell lines revealed that some cancer cells expressed V-7, which lacked the ligand-binding domain (LBD). Therefore, enzalutamide could not bind to AR-V7 and thus, lost the treatment effect [31,32,35,36,37].
Treatments with docetaxel and enzalutamide suppressed the cancer cells through targeting different mechanisms, but resistance to both separate treatments is inevitable [19,20,31,38]. At the present stage, it was not clear whether combination treatment could improve the antitumor activity or reduce docetaxel and enzalutamide resistance by minimising the side effects associated with chemotherapy and ADT [37,39,40,41]. It is interesting to know whether dmrFABP5 could produce a synergic effect on docetaxel or enzalutamide. In this study, we intend to investigate the complicated relationship between different combinations with these compounds to find out the best way for suppressing the malignant progression of the CRPC cells.
1. Materials and Methods
1.1. Cell lines and Culture
There are a number of well-characterised PCa cell lines used widely in new drug functional studies [42]. In this work, we used the following 3 cell lines: DU145, 22RV1 and LNCaP. DU145 is a highly malignant PCa cell line established from a brain metastasis. DU145 does not express AR but expresses a very high level of FABP5. 22RV1 is a moderately malignant cell line established from an original prostate carcinoma. This cell line expresses moderately high levels of both AR and FABP5. LNCaP is a weakly malignant cell line established from a lymph node adjacent to an original carcinoma, it does not express FABP5, but it can express AR [9,13,43,44]. All the cell lines were each cultured in RPMI 1640 (Gibco-Thermo Fisher Scientific, UK) supplemented with L-glutamine 5mL (20Mm), 10% FBS (Gibco-Thermo Scientific, UK), 100 units/mL of penicillin/streptomycin (PEN-STREP), (Sigma, UK) and incubated in a 37°C incubator with a humidity atmosphere and a 5% CO2. The medium was changed every 3 days and the cell grew as a monolayer culture. The cultured cells were subjected to STR profile analysis every 3 years to ensure their true authenticity.
1.1. Expression of dmrFABP5 in Escherichia coli cells
The processes employed to produce dmrFABP5 were similar to those reported previously [15]. A single colony was selected from a selective antibiotic LB agar plate, inoculated into 10 ml of LB medium with 50 μg/ml ampicillin in a 50 ml flask, and then incubated at 37°C with 230 rpm shaking for the duration of the overnight incubation. The overnight bacterial culture (10 ml) was transferred into a flask with 250 ml of prewarmed medium and ampicillin, and it was cultured at 37 °C with constant shaking until the OD600 reached 0.6. By incorporating IPTG (isopropylthiogalactoside) (Sigma) to a final concentration of 1 mM, the expression of the recombinant protein was stimulated. The largest amount of protein was produced during the additional 4 hours after the IPTG induction. Centrifugation at 4000 g for 30 min was used to collect the cells, and pellets were kept at 20°C until next experiment.
1.1. DmrFABP5 protein purification
Using a Ni-NTAcFastStartkit (Qiagen), 6-His-tagged proteins were purified in their native condition. The cell pellets were suspended in 10 ml of Lysis Buffer (pH 8.0), incubated at room temperature for 60 minutes, and then centrifuged at 14,000 g for 30 minutes at 4 °C. The recombinant protein-containing supernatant was extracted from the debris, collected, and put onto a Ni-NTA column that was conjugated a 6-His antibody. The recombinant protein attached to the 6- His-tagged antibody was eluted after three washes with 4 ml of Washing Buffer (pH 8.0). As previously explained [15], each of the two eluted fractions was collected, and the protein in the eluted fractions was subjected to SDS-PAGE and Western blot analysis to establish their validity (Data not shown).
1.1. Drug preparations and treatment plans
Docetaxel and enzalutamide were purchased from MedChem Express (MCE, UK), and were dissolved in DMSO to prepare a stock solution. To avoid repetitive freezing, drugs were diluted by DMSO and aliquoted in the -80 freezer. Cells were treated with each single agent with different dilutions to find out its half inhibitory concentration that inhibits the cell growth by 50% (IC50). The combination treatment groups for the in vitro assays were performed by combining the IC50 of every single agent.
1.1. Cell Viability and Combination Index assays (CI)
DU145 cell was plated at 5000 cells/well in a 96-well plate while 22RV1 and LNCaP cells were plated at 10,000 cells/well and treated with each drug alone, to test the cell viability and determine the IC50. The controls were treated with DMSO for docetaxel and enzalutamide experiments; PBS was used to treat the control in the dmrFABP5 experiment. For DU145 and 22RV1, dmrFABP5 concentrations used were 0.05µM to 20µM, docetaxel concentrations were 0.001nM to 200nM, and enzalutamide were 1µM to 100 µM. For LNCaP, the concentrations ranged from 0.001µM to 100 µM. Then, cells were incubated with each drug was used singly or in combination with dmrFABP5 for 72h with different concentrations. The cell viability was tested by Presto Blue HS (Invitrogen), and the results were assessed according to the cell viability% of the control. The synergic interaction was evaluated according to Chou- Talalay by using CompuSyn to calculate the combination index (CI). The values <0.9 were appointed to be synergic [45].
1.1. Invasion Assays
The invasion abilities were assessed using Boyden Chamber in a 24- well plate containing 8 µM pore membranes. DU145, 22RV1 and LNCaP were seeded in the upper compartment with DMSO 0.1% for the control group; cells were treated with dmrFABP5 at doses of 5, 10 and 20 µM, respectively; docetaxel at doses of 3, 4 and 2.5 nM, respectively; enzalutamide at doses of 100 and 10 µM, respectively, for DU145 and 22RV1. But for LNCaP, the dose was100 nM alone or in combination. In lower compartment, 500 µL serum-free RPMI 1640 media was added for the chemoattractant; In upper compartment, 500 µL complete RPMI 1640 supplemented with 10% FBS with 100 units of penicillin/streptomycin. Cells with invasion abilities were able to invade through Matrigel pores.
1.1. Wound Healing Assay
Ibidi culture insets in u-dish were used to assess the migration and wound closure ability. The combination treatment time points were evaluated according to the aggressiveness of the cells. DU145 was evaluated in h0, h12, and 24h. For 22RV1 and LNCaP, the time points were at h0, h24, h48, and h72. The combination treatment methods were as those described previously.
1.1. Soft agar colony formation assay
The soft agar assay is a method for testing the tumorigenicity of cells in vitro. The experiment was carried out on 6-well plates that had been pre-coated with 2ml of 1 per cent (w/v) low melting agarose in regular culture media and hardened for 10 minutes in the refrigerator. DU145, 22RV1 and LNCaP cells were grown to 60-80% confluence in a median flask, then collected and suspended in RPMI complete culture medium as previously described. The cells were sown in triplicates into 0.5 percent agar in regular culture media on top of a bed of first layer cells per dish and left in the refrigerator for 10 minutes until hardened. DU145, 22RV1 and LNCaP were seeded at 60,000 cells per well, for three weeks, the 6-well plates were incubated at 37°C with 5% CO2 in an incubator. After one week of incubation, the plates were filled with roughly 250 µl of medium alone or medium containing the treatments with single agent or in combination of compounds to avoid drying out and guarantee the cells received adequate nutrients and treatment. Plates were treated with MTT at a concentration of 0.5 mg/ml after 3 weeks of growth and incubated for 4 hours at 37°C with 5% CO2 in the incubator. The Gel Count (Oxford Optronix, UK) was used to count colonies with diameters of more than 250µm for DU145 and 22RV1 and more than 150µm for LNCaP.
1.1. Western Blot
1X PBS was used to wash the cells twice. The cells were harvested by lysis buffer containing protease inhibitors. Cell lysates were centrifuged at 13,000 rpm for 15 minutes at 4°C and the proteins then were collected, and concentration was calculated using Bradford assay (Quick Start Bradford Protein Assay, Bio-Rad). Proteins were loaded for analysis using (Mini Protein Gels, Bio-Rad) and then were transferred to PVDF membrane (Millipore). The membrane was incubated using blocking buffer (5% TBS-T in skimmed milk) for one hour, then washed three times by TBS-T for 15 minutes. The membrane then was incubated with primary antibody against AR (1:400), VEGF (1:1000), PPARγ (1:200), p-PPARγ (1:500), Sp1 (1:1000), Bcl-2 (1:500), Bax (1:500), acetylated α Tubulin (1:300), β-actin (1:5000) overnight at 4°C. Membranes were washed three times with T-BST for 15 minutes, then were incubated with secondary antibodies Polyclonal Rabbit Anti-Mouse IgG-HRP (1:10,000) or Polyclonal Swan Anti-Rabbit IgG-HRP (1:10,000) for two hours at room temperature. The bands on the membrane then were visualized by Immobilon ECL Ultra Western HRP Substrate, Merk (cat# WBULS0500), using ChemiDoc Imaging System. Western blot bands were quantified using ImageJ 1.48.
1.1. Statistical analysis
Each experiment was conducted in triplicate. GraphPad Prism 9 was used for the analysis of the student’s t-test. Each experiment was performed in triplicates and the data were presented as mean ± SE; Student’s t-test was used to compare the means. *P<0.05, **P<0.001, ***P<0.0001, ****P<0.00001. C=Control, dmr=dmrFABP5, Doc=Docetaxel, ENZ= Enzalutamide, Comb=Combination of both dmr and DOC or dmr and ENZ. The control was compared with each treatment group and each single agent was compared with the combination groups. The synergic interaction was evaluated according to Chou- Talalay by using CompuSyn to calculate combination index (CI). The values of <0.9 were appointed to be synergic [45].
1. Results
1.1. Compound concentrations used to achieve 50% growth inhibition of PCa cells (IC50)
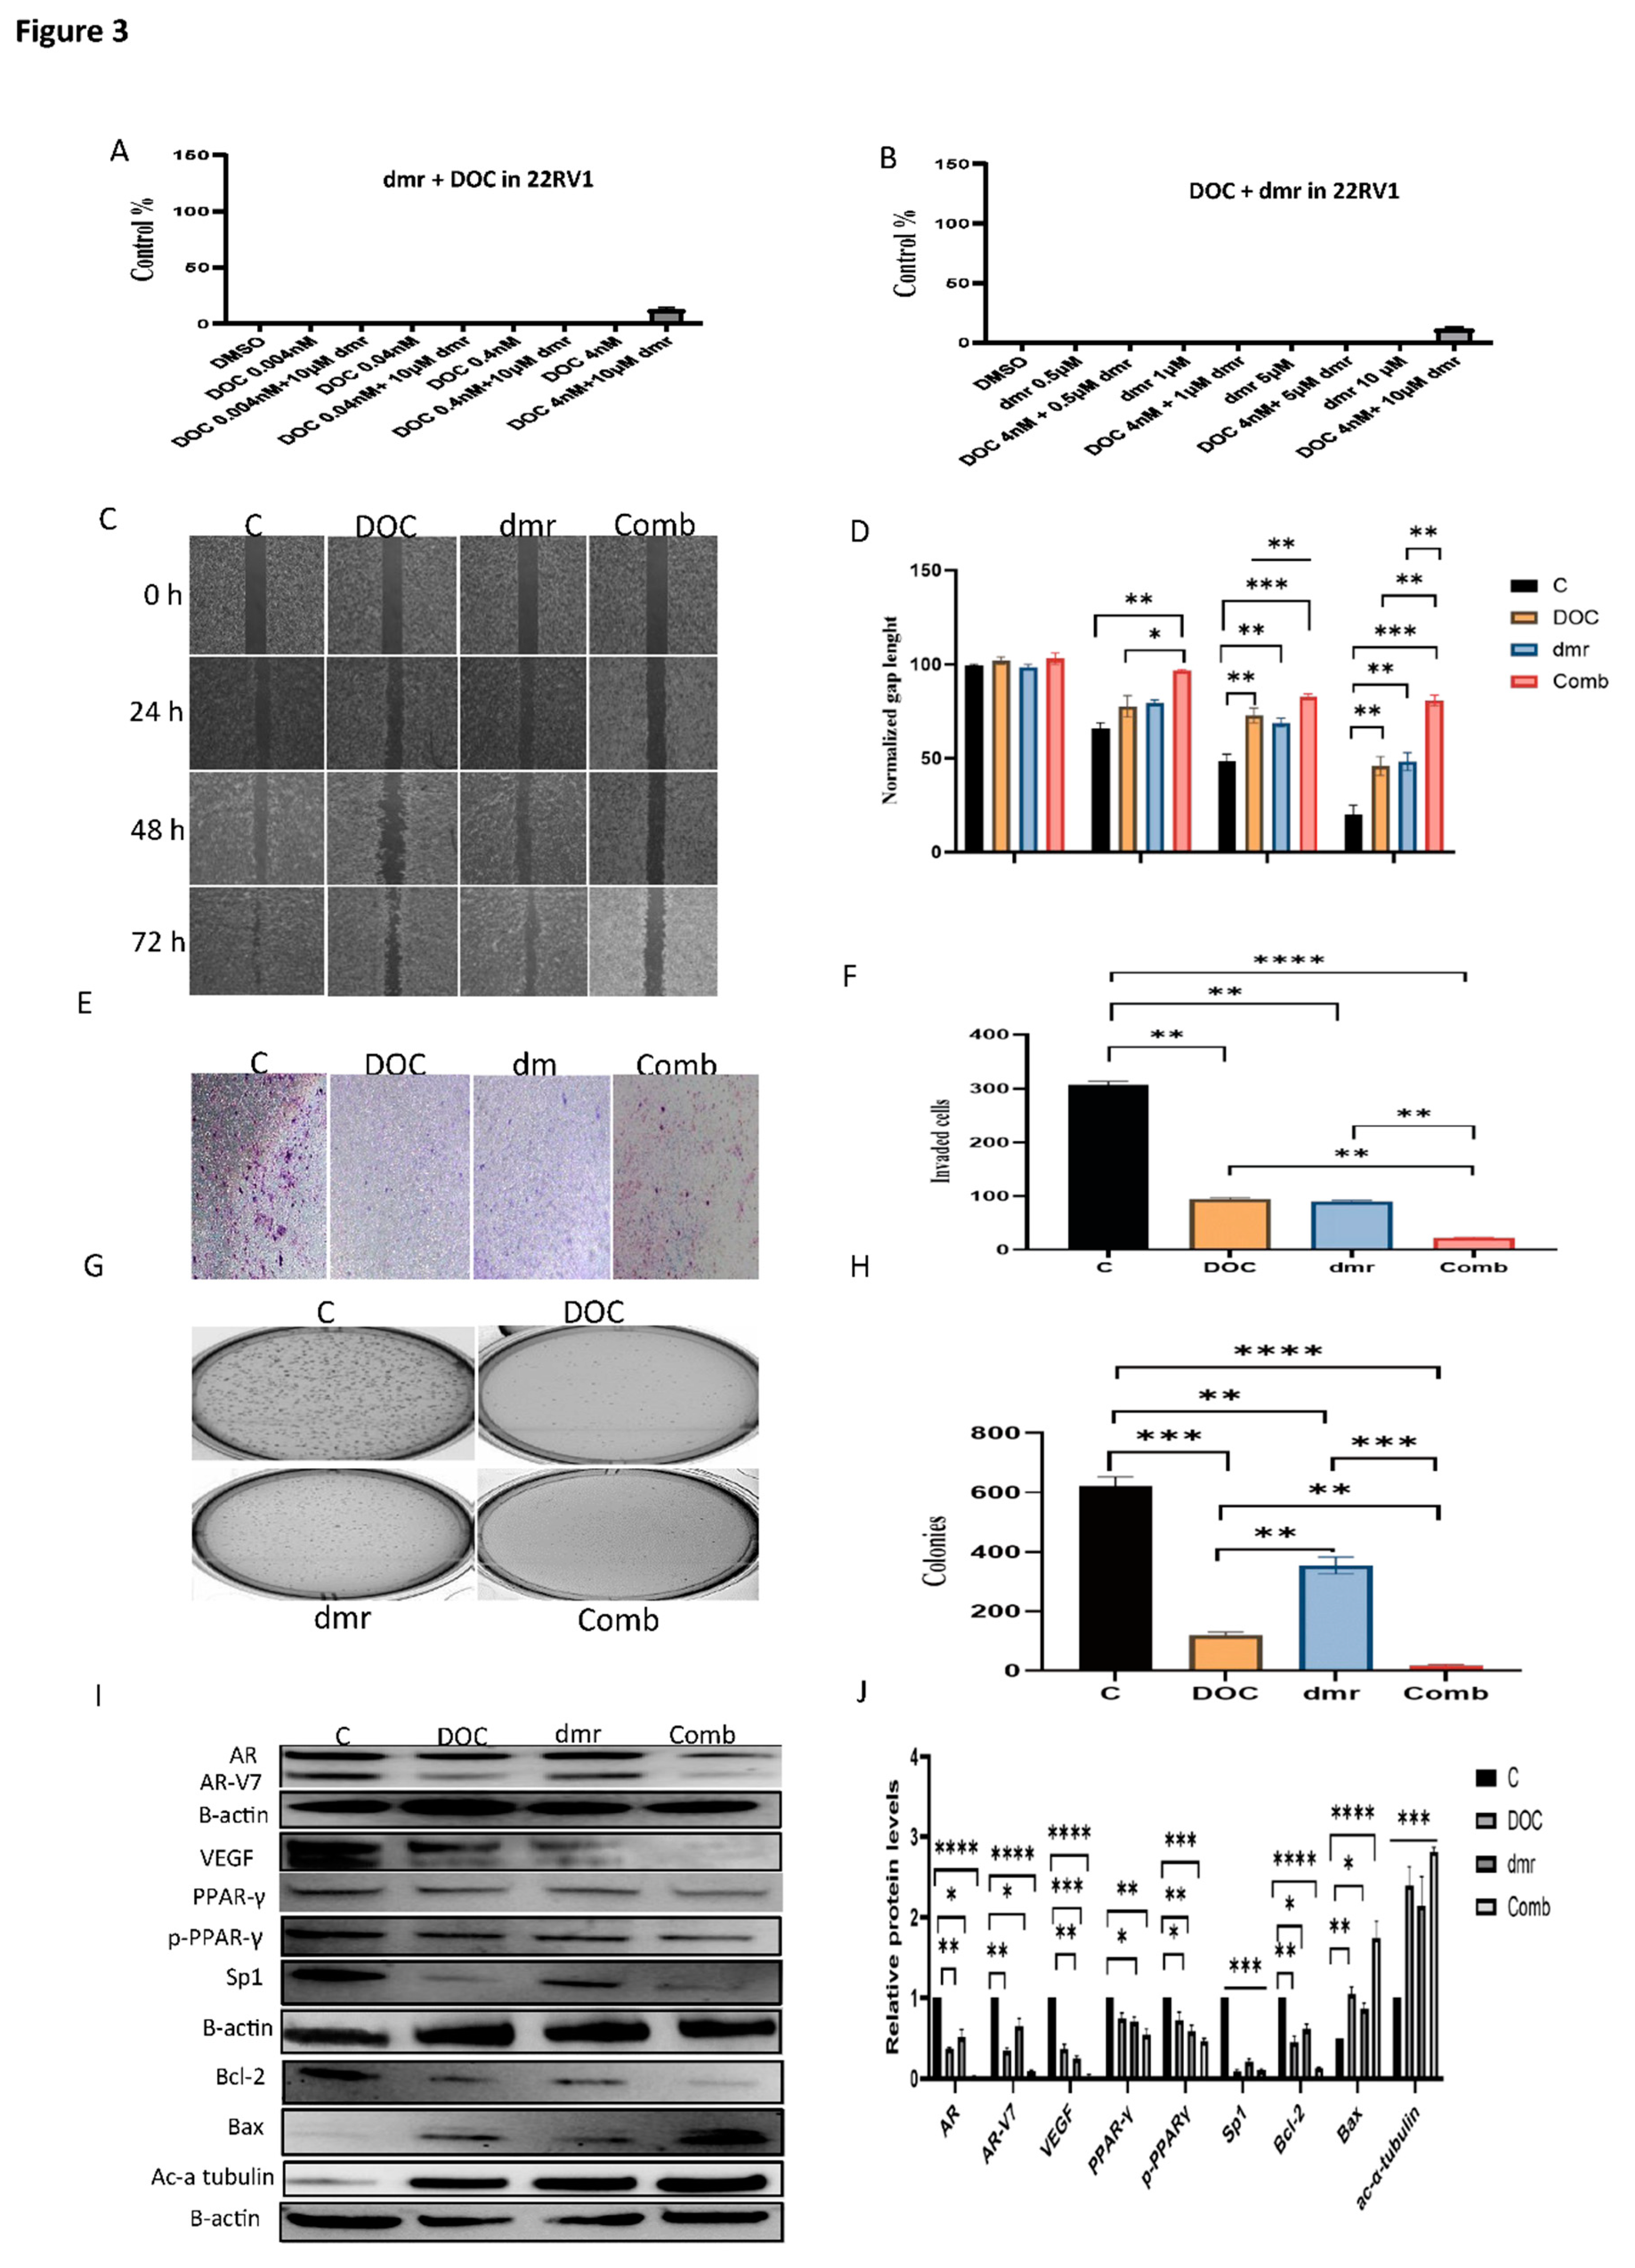
Different IC50 concentrations of the 3 compounds used to treat the PCa cell lines in this experiment were shown in Figure 1. The IC50 concentrations of docetaxel in DU145, 22RV1 and LNCaP cells were shown in A, B, and C, respectively. They were 3nM, 4nM, and 2.2nM, respectively. The IC50 of enzalutamide was not achieved in DU145 and 22RV1 cells, since no significant inhibition on these cells was detected (D, E). In LNCaP cells, the IC50 concentration of enzalutamide was at 97nM (F). The IC50 concentrations of dmrFABP5 in Du145 and 22RV1 cells were 5µM and 12µM, respectively, as shown in G and H. The IC50 concentration of dmrFABP5 in the FABP5-negative LNCaP cells was not achieved, since dmrFABP5 did not exhibit an inhibition effect in this cell line.
1.1. The combination effect assessment and maximum suppression of dmrFABP5 in combination with docetaxel in PCa cell lines
The treatment of dmrFABP5 combined with docetaxel in DU145 was shown in Figure 2. DmrFABP5 synergistically enhanced docetaxel suppression effect on DU145 cells. As shown in A, synergic effect was found when combined dmrFABP5 at 5µM as a fixed concentration and combined with docetaxel at different concentrations as 3, 0.3, and 0.03nM, with CI of 0.00714, 0.38970 and 0.6585 respectively, which produced suppression by 89%, 66% and 58%, respectively while 51%, 46% and 29% for docetaxel alone (Table 1A-a). No synergic interaction in the combination of dmrFABP5 with docetaxel at 0.003nM. Similar synergistic effect shown in B were found when used a fixed concentration of docetaxel at 3nM and combined with dmrFABP5 at different concentrations at 5, 1, 0.5 µM and CI value of 0.00445, 0.16393 and 0.22815, that produced inhibition by 86%, 60% and 48% respectively, whereas 52%, 38% and 30% for dmrFABP5 alone. No synergic enhancement when 3nM of docetaxel combined with 0.1 µM of dmrFABP5. These combinations produced a maximum suppression (CI= 0.00445) of the combination of both compound IC50s as shown in Table1A-b.
Table 1A. Combination Index analysis of the bioassays using different combination ratios of dmrFABP5 combined with docetaxel on DU145. A-a: Fixed dose of dmrFABP5 combined with different doses of docetaxel. A-b: Fixed dose of docetaxel combined with different doses of dmrFABP5. Fraction affected (Fa) and the combination index (CI) values were calculated using COMPUSYN software, and the data is considered to be synergic if CI < 0.9.
Table 1B. Combination Index analysis using different doses of dmrFABP5 combined with a fixed dose of docetaxel on 22RV1. A-a: Fixed dose of dmrFABP5 combined with different doses of docetaxel. A-b: Fixed dose of docetaxel combined with different doses of dmrFABP5. The Fa and the CI values were calculated using COMPUSYN software, the data considered as to be synergic if CI < 0.9.
Table 1C. Combination Index analysis using different doses of dmrFABP5 combined with enzalutamide on 22RV1. C-a: Fixed dose of dmrFABP5 combined with different doses of enzalutamide. C-b: Fixed dose of enzalutamide combined with different doses of dmrFABP5. The Fa and CI values were calculated using COMPUSYN software, and the data considered to be synergic if CI < 0.9.
Table A-a. Fixed concentration of dmrFABP5 combined with different concentrations of docetaxel.
Table 1A. Combination Index assay (CI) analysis for dmrFABP5 combined with docetaxel in DU-145 cell line.
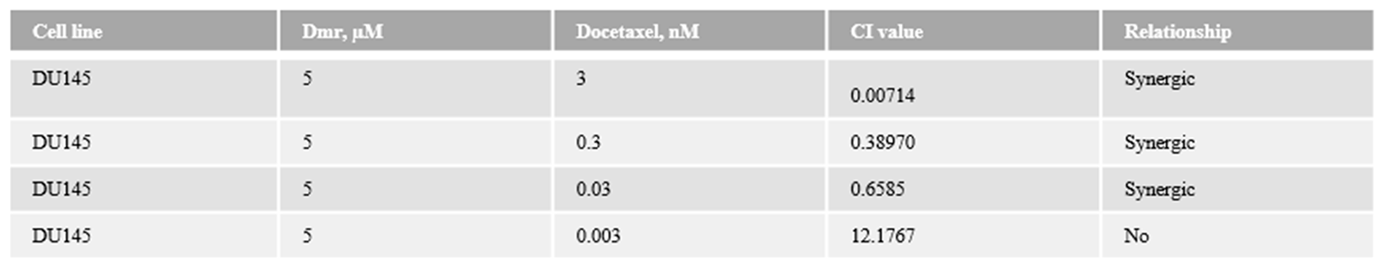
Table A-b. Fixed concentration of docetaxel combined with different concentrations of dmrFABP5.
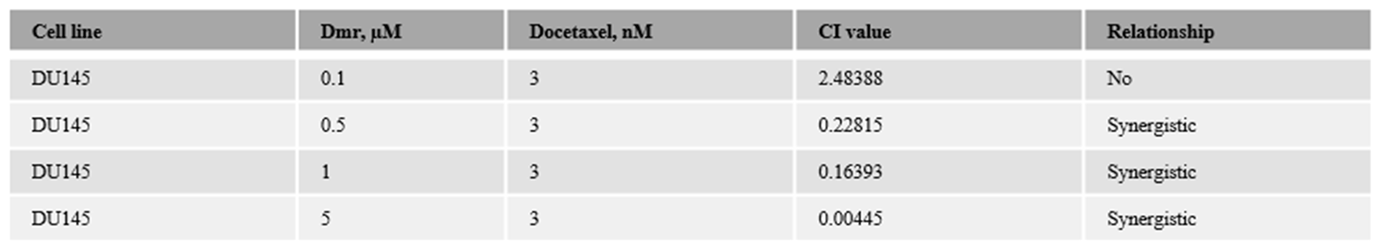
Table 1B Combination Index assay (CI)analysis for dmrFABP5 combined with docetaxel in 22RV1 cell line.
Table B-a. Fixed concentration of dmrFABP5 combined with different concentrations of docetaxel.
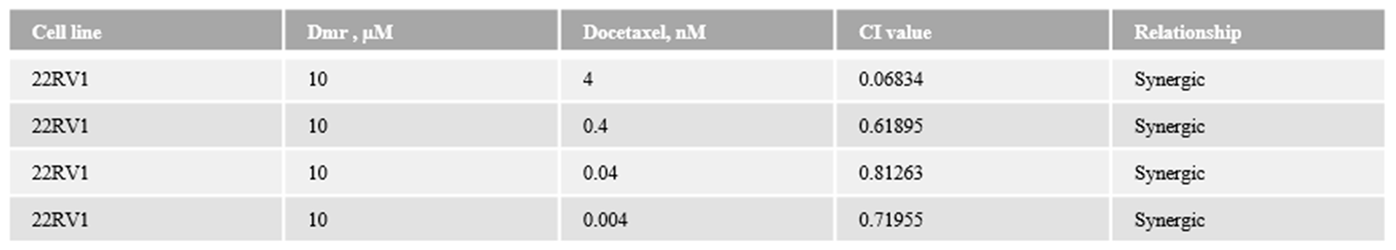
Table B-b. Fixed concentration of docetaxel combined with different concentrations of dmrFABP5.
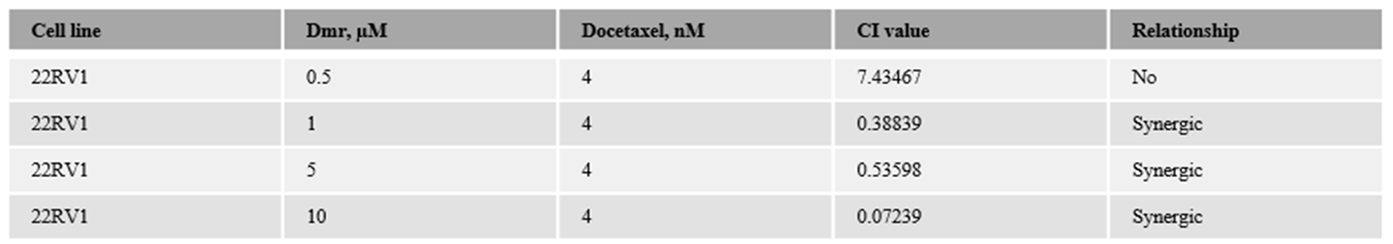
Table 1C. Combination Index assay (CI)analysis for dmrFABP5 combined with enzalutamide in 22RV1 cell line.
Table C-a. Fixed concentration of dmrFABP5 combined with different concentrations of enzalutamide.
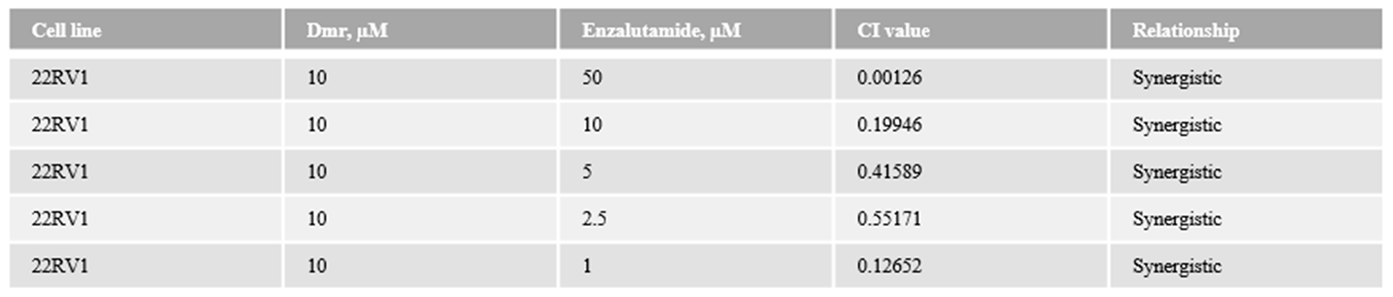
Table C-b. Fixed concentration of enzalutamide combined with different concentrations of dmrFABP5.
Further synergic interaction of the same compounds in 22RV1 cells was shown in Figure 3. When a fixed dmrFABP5 at 10 µM combined with 4, 0.4, 0.04 and 0.004nM as indicated in A, the CI values were 0.06834, 0.61895, 0.81263 and 0.71955 respectively (Table 1B-a) by 92%, 78%, 53% and 52% respectively. Another synergistic effect was found in B, when a fixed dose of docetaxel was used at 4 nM in combination with different doses of dmrFABP5 at 10, 5, and 1 µM respectively, and CI values of 0.07329, 0.53598, 0.38839, by 93%, 69% and 67% while 53%, 49% and 36%,respectively for dmrFABP5 alone. The maximum suppression was found when combined two compounds IC50 (CI= 0.06834). No synergic effect when combined dmrFABP5 at 0.5 µM with 4nM of docetaxel (CI= 7.43467).
Both compounds were used to treat LNCaP, no synergistic interaction as shown in Figure 4. When a fixed dmrFABP5 at 20 µM mixed with many doses of docetaxel at 20, 2, 0.2 and 0.02nM as indicated in A, produced inhibition of 61%, 47%, 32% and 15% respectively while 63%, 51%, 33% and 14%, respectively for docetaxel alone. Similar effect when a fixed docetaxel at 2nM and combined with dmrFABP5 at 20, 10, 5, 1 µM shown in B, with suppressive effect by 45%, 42%, 44% and 47% respectively whereas 6%, 5%, 3% and 5% respectively for dmrFABP5 alone and CI= 1.12612, 1.12903, 1.28156 and 1.00286 respectively.
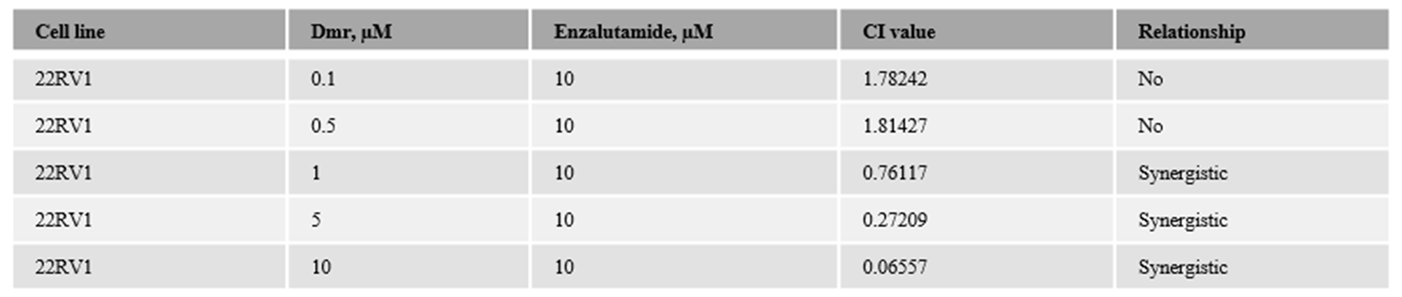
Figure 3.
Synergistic effect of dmrFABP5 on the tumor-suppression activity of docetaxel in 22RV-1 cells and the effect on expression levels of relevant regulators. A), the effect on cell viability produced by the fixed dose of dmrFABP5 combined with different doses of docetaxel. B), the effect on cell viability produced by the fixed dose of docetaxel combined with different doses of dmrFABP5. C), the effect of dmrFABP5 combined with docetaxel on cell migration ability and, D) its quantitative assessment. E), the effect of dmrFABP5 combined with docetaxel on the cell invasion and, F) the quantitative assessment on its relative levels. G), the effect of dmrFABP5 combined with docetaxel on cell anchorage-independent growth and, H) the quantitative assessment on cell colony numbers. I) the effect of dmrFABP5 combined with docetaxel on expression levels of protein regulators and, J) the quantitative assessments. Each experiment was performed in triplicates and the data was presented as mean ± SE. Student t-test was used to compare the means. *P < 0.05, **P < 0.001, ***P < 0.0001. C=Control, dmr=dmrFABP5, Doc=Docetaxel, Com=Combination of both dmr and Doc.
1.1. The combination effect assessment and maximum suppression of dmrFABP5 in combination with enzalutamide in PCa cell lines
The combination of dmrFABP5 with enzalutamide (Figure 5) did not produce any synergic effect although dmrFABP5 alone significantly suppressed the DU145 growth. DmrFABP5 was fixed at 5 µM and combined with enzalutamide at 100, 50,10 and 1 µM respectively which inhibited the growth by 51%, 43%, 45% and 47% respectively while 4%, 6%, 5%, 1% respectively with enzalutamide alone as shown in A, and those combination CI= 1.4991, 1.69301, 2.50332 and 1.98945 respectively. Similar negative effect when fixed enzalutamide at 100 µM and mixed with 5, 1, 0.5 and 0.1 of dmrFABP5 (B), CI= 1.36991, 1.76754, 1.90371 and 1.45473 respectively, with suppression of 47%, 44%, 29% and 8% whereas 51%, 47%, 31% and 9% respectively for dmrFABP5 singly.
Significant enhancement was achieved when dmrFABP5 combined with enzalutamide on 22RV1 as shown in Figure 6, a fixed dmrFABP5 at 10 µM and different concentration of enzalutamide at 50, 10, and 5 µM (A) revealed synergic interaction (Table 1C-a), CI= 0.14490, 0.10838 (as a maximum suppression) and 0.88896, by 87%, 77% and 45% respectively, but enzalutamide alone slightly inhibited 22RV1 growth by 16%, 11 and 7% respectively. No synergic suppression of dmrFABP5 at 10 µM with enzalutamide at 1 µM CI= 1.21405. Similar synergic effect (B) when enzalutamide was fixed at 10 µM, different concentration of dmrFABP5 were used as a combination at 10, 5 and 1 µM, CI= 0.11310, 0.23215 and 0.86129 by 81%, 62% and 44% respectively whereas 58%, 46% and 26% respectively for dmrFABP5 alone. Enzalutamide at 10 µM in combination with dmrFABP5 at 0.5 µM did not produce synergistic effect (CI= 1.49663, as shown in Table 1C-b).
Further investigation was performed by using the same compounds on LNCaP cells (Figure 7). When dmrFABP5 was fixed at 20 µM and combined with enzalutamide as illustrated in A) at 1, 0.1, 0.01 and 0,001 µM, but no synergic interactions were found when CI= 1.74432, 1.02632, 3.98224 and 1.64482 respectively by 80%, 49%, 32% and 6%, while 79%, 48%, 34% and 7% for enzalutamide alone. More combinations were used (no synergic effect) when a fixed dose of enzalutamide at 0.1 µM combined with dmrFABP5 at 20, 10, 5, 1 µM (B), respectively and CI=1.03654, 1.99209, 1.66456 and 1.98465 respectively, by 45%, 47%, 44% and 47% respectively, whereas 6%, 5%, 3% and 5% respectively for dmrFABP5 alone.
1.1. The effect of dmrFABP5 alone or in combination with docetaxel or enzalutamide on malignant characteristics of PCa cells
1.1.1. Motility assay
DU145 cells were treated with DMSO (control), 3nM of docetaxel, 5 µM of dmrFABP5 and in combination of both agents and results were shown in Figure 2C. Quantitative assessment showed that 12h after the treatment, both docetaxel and dmrFABP5 significantly inhibited the wound space healing of DU145, and 70% and 82% of the wound spaces respectively were not closed (Figure 2D), whereas after 24h, significant suppression on the migration by 37% and 51% respectively, of the wounds were not healed. The combination of both agents produced greater suppressive effect after 12h and 24h by 96% and 93% respectively.
Same treatments were used on 22RV1, and DMSO was used for the control, either docetaxel at 4nM, dmrFABP5 at 10 µM or both compounds in combination and different time points images (0h, 24h, 48h, 72h) were shown in Figure 3C. The results of quantitative analysis (Figure 3D) showed that after 24h, while the control remained not closed, 77%, 79% and 96% of the wound spaces remained not healed for docetaxel, dmrFABP5 and the combination respectively. After 48h, the unclosed wound spaces of control, docetaxel, dmrFABP5 and combination were 49%, 70%, 69% and 92% respectively. The control gap space after 72h was 20% while treatment with docetaxel or dmrFABP5 produced mostly similar inhibition by 37% and 40% respectively. Greater inhibition produced by the combination with 89% of the wound was not closed.
When it came to the LNCaP (Figure 4C), same treatments were applied as DMSO for the control, 2nM or 20 µM for docetaxel or dmrFABP5 and combination of both. Results (Figure 4D) showed that similar wound closure of the control and dmrFABP5 after 24h, by 72% and 69% respectively whereas 91% and 87% of wound remained not closed for docetaxel and the combination respectively. Same closure levels of the control and dmrFABP5 after 48h, by 53% and 50% respectively, but docetaxel and the combination remained 81% and 79% respectively. Last day of the experiment (72h), the control and dmrFABP5 wounds were almost completely healed by 3% and 4% respectively, and that cells treated with docetaxel and combination were similar in closure rates by 69% and 65% respectively.
Further treatments were used when dmrFABP5 was combined with enzalutamide and their suppressive effects were investigated on DU145, 22RV1 and LNCAP. DU145 was treated with DMSO, enzalutamide at 100µM, 5 µM of dmrFABP5 and in combination of same single concentrations (Figure 5C). Quantitative results showed that after 12h, similar unclosed rate of the control and enzalutamide by 46% and 47% respectively, cells treated with dmrFABP5 and those treated with combination remained 89% and 90% respectively. After 24h, the gap areas of the control and enzalutamide were completely closed while 78% and 76% of the wounds were unclosed in docetaxel and combination respectively.
For 22RV1, cells (control) were treated with DMSO, 10µM of enzalutamide, 10µM of dmrFABP5 and combination of both compounds (Figure 6C). Twenty-four h after the treatments, the wound gap of the control and enzalutamide were 74% and 76% respectively. Cells treated with dmrFABP5 and with combination were 88% and 97% respectively. At the end of the experiment (72h), similar closure gaps of the control and enzalutamide by 33% and 37% respectively, while those treated with dmrFABP5 and the combination were 69% and 91% respectively (Figure 7D).
LNCAP cells were treated with DMSO, 100nM of enzalutamide, 20µM of dmrFABP5 and in combination of both agents (Figure 7C). Quantitative results (Figure 7D) revealed that after 24h, the gap spaces of the control and the combination were 74% and 71% respectively. Enzalutamide or enzalutamide combined with dmrFABP5 inhibited the migration of LNCAP by 91% and 86% respectively. After 72h, the gap of the control and dmrFABP5 were 7% and 9% respectively, whereas 65% and 63% of enzalutamide and the combination respectively.
1.1.1. Invasion assay
DU145 was treated with DMSO, docetaxel, dmrFABP5 and combination at the same concentrations as those used in motility assay to test their effect on invasiveness of the cells, and the results were shown in Figure 2E. As shown in quantitative analysis (Figure 2F), the average number of invaded cells in the control was 449±14. The average number of invaded cells incubated with docetaxel, dmrFABP5 and combination of both were 89 ± 3.2, 68 ± 2.64, and 9 ± 1.2, respectively, and suppression by 77%, 79% and 98% respectively. Thus, significant reduction on the invasive ability of DU145 produced by the combination (Student t-test ****P<0.0001).
Same treatments were used on 22RV1 with similar concentrations mentioned in motility assay and images were shown in Figure 3E. Results (Figure 3F) indicated that the average invaded cell number of the control was 306 ± 6.88. Docetaxel and dmrFABP5 were significantly suppressed the average invaded cells to 88 ± 3.2, 110 ± 2.6, by 71% and 64% respectively. Stronger suppression (P<0.0001****) of the average invaded cells from combination than each single agent to 14 ± 1.7 by 93%.
LNCaP cells were treated with either DMSO, dmrFABP5, docetaxel and combination of both at the same concentrations used in motility assay (Figure 4E). Quantitative analysis (Figure 4F) showed that, the average invaded cells of control and dmFABP5 revealed to 292 ± 4.2 and 294± 8.55 respectively with no significant difference (P>0.05) whereas similar inhibition of average invaded cells found in docetaxel and combination to 29 ± 4 and 37 ± 5 by 87% and 85% respectively.
DU145 cells were again treated with DMSO, enzalutamide, dmrFABP5 and enzalutamide plus dmrFABP5 (Figure 5E) with same doses explained previously in motility assay section. Enzalutamide did not suppress the average invaded cells and was almost similar to the control with 425 ± 25.8 and 413 ± 20.9 respectively (P>0.05) while dmrFABP5 significantly suppress the average invaded cell numbers by 80% to 27 ± 2.4 and 82% to 43 ± 9.8 for the combination (P>0.05) (Figure 5F).
As shown in Figure 6E, 22RV1 were subjected to the same treatments of motility assay and results (Figure 6F) indicated that control and enzalutamide did not significantly (P>0.05) inhibited the average invaded cells 292 ±33 and 321 ±10 although enzalutamide slightly effected the invasion ability of 22RV1 cells. DmrFABP5 significantly (P<0.01**) reduced the average invaded cell numbers by 72% to 80 ±11. Greater suppression (****P<0.0001) of the average invaded cells produced by the combination treatment with 8 ± 1.3 by 97%.
LNCAP were treated (Figure 7E) with same treatments cycle mentioned in enzalutamide section of motility assay. As expected, the control and dmrFABP5 average invaded cells (Figure 7F) were 315 ±22 and 310 ± 42 respectively with no significant difference (P>0.05). Enzalutamide and the combination significantly inhibited the average invaded cells by 81% and 77% to 60 ± 3 and 73 ± 9 respectively.
1.1.1. Soft agar assay
DU145 was treated with DMSO as control. Docetaxel, dmrFABP5 were used either singly or in combination (Figure 2G) at same concentrations used in motility assay experiment. Quantitative analysis (Figure 2H) revealed that the average number of colonies formed by the control was 880 ± 44. Docetaxel and dmrFABP5 were significantly (P<0.001***) reduced the average number of colonies to 144 ± 37, 217 ± 33, respectively but those treated with both agents in combination produced more reduction (P<0.0001****) to 16 ± 4.
Further assessment applied when 22RV1 cells (Figure 3G) were subjected to same treatments. As shown in Figure 3H, when the average number of the colonies of the control was 621± 30, the treatment with docetaxel or with dmrFABP5 produced significant (***P<0.001) suppression on colonies formation to 119 ± 11 and 354 ± 28 respectively. The combination of both agents revealed an even greater (****P<0.001) reduction on the average number of colonies to 18 ± 5.
LNCAP cells were treated with DMSO, docetaxel, dmrFABP5 and combination of both agents (Figure 4G) in the same way. The average colonies number of control and dmrFABP5 were similar to 290 ± 12 and 299 ± 45 respectively (P>0.05), while both docetaxel and the combination produced similar suppression of the average colonies number to 62 ± 9 and 69 ± 10 respectively (Figure 4H) and no significant difference (P>0.05).
Enzalutamide and dmrFABP5 were used singly or in combination with same concentrations used in motility assay section as a treatment on DU145 cells (Figure 5G). As shown in Figure 5H, enzalutamide did not reduce the average colonies number in DU145 (P>0.05) and similar to the control with 778 ± 66 and 743 ± 81 respectively. The suppressive effect of dmrFABP5 (P<0.001***) produced lower average colonies number to 113 ± 9 and 159 ± 12 for the combination. Thus, dmrFABP5 did not enhance the effect of enzalutamide (P>0.05).
The effect of dmrFABP5 alone or combined with enzalutamide on 22RV1 colonies were shown in Figure 6G. As shown in Figure 6H, the average numbers of the colonies formed by the control and the enzalutamide treatment were not significantly changed as 614 ± 54 and 599 ± 6.75 respectively (P>0.05). DmrFABP5 significantly inhibited the average number of colonies to 219 ± 19, and significantly (P<0.0001****) enhanced the effect of enzalutamide with an extreme reduction to 23 ± 6.
Same compounds were used to treat LNCAP (Figure 7G) and the concentrations were the same as before. As shown in Figure 7H, both dmrFABP5 and control average colony numbers were similar as 380 ± 21 and 394 ± 26 respectively with no significant difference (P>0.05). Enzalutamide and the combination treatments produced similar inhibition effect as 67 ± 6 and 68 ± 7 colonies respectively (P<0.001**) but compared two groups showed no significant difference (P>0.05).
1.1.1. Molecular mechanism involved in the combination treatments.
The combination of dmrFABP5 with docetaxel on protein regulators in DU145 cells were assessed by Western blot (Figure 2I). Quantitative results (Figure 2J) showed that when the relative level of VEGF was set at 1, significant reduction induced by docetaxel and dmrFABP5 alone significantly (P<0.01**) reduced the expression of VEGF by 34% and 40% to 0.64 ± 0.025 and 0.6 ± 0.06 respectively. Both agents in combination greatly (P<0.001***) downregulated VEGF expression by 65% to 0.35 ± 0.01. Similar treatments were used to study their effect on the expression of PPARγ and p-PPARγ (Figure 2I). As shown in Figure 2J, when the control was set at 1, respectively, no significant (P>0.05) changed induced by docetaxel on PPARγ to 0.96 ± 0.023, but it significantly (P<0.01**) reduced the level of p-PPARγ by 25% to 0.75 ± 0.005. DmrFABP5 significantly suppressed (P<0.001***) both PPARγ and p-PPARγ 56% and 35% to 0.44 ± 0.01 and 0.65 ± 0.01, respectively. Greater reduction (P<0.0001****) of the combination treatment on both proteins by 78% and 74%, with reduced expression levels 0.22 ± 0.007 and 0.26 ± 0.01 respectively. Relative level of ac a-tubulin in control was set at1, the level was raised significantly (P<0.01**) after docetaxel and dmrFABP5 treatment separately by 47% and 41% to 1.928±0.0033 and 1.733±0.026 respectively. The combination of both compounds produced more increase (P<0.001***) by 69% to 3.384± 0.091. Further, same treatments were used to test Sp1 level (Figure 2I). When control relative level was set at 1, significant (P<0.001***) inhibition produced by docetaxel as 54% to 0.46 ± 0.07, while slight reduction produced by dmrFABP5 with 43% to 0.57 ± 0.02 (P<0.01**). Both treatments in combination significantly suppressed Sp1 by 88%% to 0.12 ± 0.03 (P<0.0001****). The effect of these treatments on Bcl-2 were also performed and the control was set at 1, 63% reduction in the expression induced after docetaxel treatment to a relative level of 0.37 ± 0.02 (P<0.001***); while dmrFABP5 treatment produced a significant reduction in Bcl-2 level by 51% to 0.49 ± 0.04 (P<0.01**). Both joint compounds suppressed Bcl-2 by (P<0.0001****) 87% to 0.13 ± 0.3. Bax levels were also, tested by same treatments. When the control was set at 1, docetaxel significantly upregulated its expression (P<0.01**) by 183% to 1.83 ± 0.0595; whereas dmrFABP5 treatment produced higher increased (P<0.001***) in Bax level by 263% to 2.63 ± 0.047. The combination treatment increased significantly (P<0.0001****) the level of Bax more than the sum of each agent alone by 330% to a relative level of 3.3 ± 0.09.
Further protein regulators were investigated when used the same treatments on 22RV1 cells (Figure 3I). As shown in Figure 3J, when the levels of AR and AR-V7 were set at 1, respectively, both docetaxel and dmrFABP5 significantly (*P<0.05) downregulated the level of AR expression by 32% and 22% to 0.68±0.027 and 0.78±0.018 respectively. Whereas docetaxel (P<0.001***) and dmrFABP5 (P<0.01**) downregulated the levels of AR-V7 by 66%% and 43% to 0.34±0.017 and 0.57±0.030 respectively. More significant (P<0.0001****) reduction of both compounds in combination on AR and AR-V7 expression by 75% and 92% to 0.25± 0.039 and 0.089±0.006 respectively. VEGF expression was also affected by either treatment, singly or jointly (Figure 3I). Quantitative results (Figure 3J) indicated that potent suppressive effect (P<0.01**) produced by docetaxel and dmrFABP5 alone by 51% and 59% to 0.49±0.077 and 0.41±0.028, respectively. The jointly combination induced greater inhibition effect by 99.9 % to 0.035± 0.015 (P<0.0001****). The expression of PPARγ and p-PPARγ were also affected by those treatments. The control relative level was set at 1, docetaxel significantly decreased the level of PPARγ by 23% to 0.774±0.024 (P>0.05*) and slightly downregulated p- PPARγ by 19% to 0.75±0.064 (P<0.05*), while dmrFABP5 reduced the expression levels of both protein regulators PPARγ (P<0.05*) and p- PPARγ (P<0.01**) by 16% and 25% to 0.84±0.010 and 0.63±0.0055 respectively. The combination treatment produced greater reductions both on PPARγ and p- PPARγ levels, which are greater than the total reduction produced by the sum of each agent by 37%% and 54% to 0.62± 0.015 and 0.46±0.23 respectively. Significant suppression induced on Sp1 expression (Figure 3I). the level of Sp1 in 22RV1 cells after the docetaxel treatment was reduced by 82% to 0.35±0.035 (****P<0.0001). The level of Sp1 in 22RV1 cells treated with dmrFABP5 was reduced by 37% to 0.6311±0.046 (**P < 0.01). The combination of both agents potently reduced Sp1 expression by 89% to 0.109± 0.009 (Figure 3J). Both treatments were also affected the expression of apoptotic-related proteins (Bcl-2 and Bax). Docetaxel downregulated Bcl-2 (**P < 0.01) by 55% to 0.45±0.049 while it upregulated Bax level (**P < 0.01) by 184% to 1.84±0.051. Whereas dmrFABP5 suppressed the expression of Bcl-2 (*P < 0.05) by 39% to 0.612±0.044, it increased Bax level by (*P < 0.05) by 40% to 1.4±0.051. Further to this, docetaxel and dmrFABP5 in combination significantly downregulated Bcl-2 expression by 86% to 0.138± 0.005 (****P<0.0001) which was a higher suppression than any of those obtained by treatment with each agent separately, whereas induced increased Bax by 214% to 3.146± 0.254 (***P < 0.001). The relative level of ac a-tubulin where set at 1, docetaxel, dmrFABP5 and combination of both agents were produced significant upregulation (P<0.001***) with no significant difference between each treatment group by 58%, 53% and 64% to 2.395±0.165, 2.15±0.250 and 2.82±0.040 respectively.
Molecular mechanism of the treatment by dmrFABP5 or enzalutamide singly or in combination were used on 22RV1 cells (Figure 6I). When the control level was set at 1, for both AR and AR-V7 (Figure 6J), respectively, the treatment of enzalutamide did not significantly suppress AR nor AR-V7 (Student t-test P > 0.05). DmrFABP5 significantly downregulated the expression of both AR (*P < 0.05) and AR-V7 (**P < 0.01) proteins by 26% and 59% to 0.743±0.013 and 0.41±0.063 respectively. The combination treatment with both compounds produced more downregulation effect of both AR and AR-V7 (****P<0.0001) and more than each agent alone by 72% and 99.5% to 0.28±0.017 and 0.0057±0.0009 respectively. Thus, dmrFABP5 significantly enhanced enzalutamide suppressive effect. Same compounds were used and VEGF level was slightly reduced (P>0.05) by enzalutamide to 0.95±0.10. But the dmrFABP5 treatment significantly (**P < 0.01) suppressed the expression level of VEGF by 41% to 0.59±0.063. Both compounds in combination (***P < 0.001) produced a greater reduction in VEGF expression level by 77% to 0.230± 0.032. Thus, dmrFABP5 promoted the enzalutamide activity. Both PPARγ and p-PPARγ expressions were not significantly reduced by enzalutamide to 1.049±0.051 and 0.910±0.018 respectively (P>0.05). In contrast, dmrFABP5 significantly downregulated PPARγ (*P < 0.05) by 23% to 0.77±0.006, and significantly (**P < 0.01) downregulated the level of p-PPARγ by 42% to 0.58±0.017. DmrFABP5 combined with enzalutamide produced a more significant (***P < 0.001) suppression effect on PPARγ and p-PPARγ expression levels by 72% and 73% to 0.284±0.040 and 0.293±0.055 respectively. Further, enzalutamide alone did not significantly decrease (P>0.05) the expression of Sp1 to 0.943±0.024, but dmrFABP5 (**P < 0.01) reduced it by 45% to 0.56±0.62. The treatment with a combination of both compounds produced more significant (***P < 0.001) reduction by 79% to 0.2139± 0.031.
1. Discussion
Prostate cancer is a common male cancer and a leading cause of cancer-related deaths. Treatment typically involves ADT, but a more aggressive form called CRPC can develop, which is resistant to ADT [46]. The molecular mechanism involved in the transition of the from androgen-dependent to androgen-independent cancer cells is not well understood. Currently, there are a few different hypotheses. The dominant theory is that under the high selection pressure during the first round of ADT, the biological sensitivity of AR is amplified (due to different changes, such as mutation and differential RNA-splicing) to such an extent that even micro-quantities of the remaining male hormone in peripheral blood can still be used to promote the malignant progression of CRPC cells [47,48]. Thus, further ADT and increasing the ability of the drugs to block microquantities of male hormone to treat CRPC have been the general clinical practice, despite the fact that the effectiveness of ADT treatment has been inconclusive or even controversial. These treatments include the recent new anti-androgen or AR-targeting drugs, such as Abiraterone and Enzalutamide [49,50].
Apart from the AR-amplification theory, alternative or opposite opinions have been occasionally expressed, and it was even suggested that the ADT was leading to a therapeutic dead end [51,52,53]. Our previous study indicated that the FABP5-PPARγ-VEGF axis, rather than AR-related pathway SP1, was responsible for CRPC progression. FABP5 promoted cell growth and metastasis by transporting fatty acids and activating PPARγ [12,15]. Targeting FABP5 with inhibitors, such as dmrFABP5 or SB-FI-26, showed promise in inhibiting the malignant progression of the cancer cells [15,54]. Prostate cancer treatments like enzalutamide and docetaxel eventually lose effectiveness due to resistance, with AR-V7 being a major factor. Knocking down AR-V7 re-sensitized cells to anti-androgen treatments [37,55,56]. In this study, we investigated the combination therapy and using dmrFABP5, combined with docetaxel, or enzalutamide, to treat the prostate cancer cells. When used singly, dmrFABP5 significantly suppressed the malignant characteristics of the FABP5- positive cells DU145 and 22RV1, but not the FABP5-negative LNCaP cells. While docetaxal supressed significantly the malignant progression of all 3 cell lines, enzalutamide only supressed the AR-positive cell lines 22RV1 and LNCaP, but not the AR-negative DU145. When used jointly, dmrFABP5 combined with docetaxal produced synergic effects on suppressing the malignant progression of the 22RV1 and DU145. When dmrFABP5 was combined with enzalutamide to treat the PCa cells, dmrFABP5 produced synergic effect to enzalutamide on suppressing the malignant progression of LNCaP. These results, combined with previous finding that FABP5 was expressed in over 90% of the prostate carcinomas (Morgan, et al.), suggested that dmrFABP5 was a new hopeful therapeutic compound that could be developed to an agent to suppress the malignant progression of CRPC.
The study determined the IC50 values of three compounds (dmrFABP5, docetaxel, and enzalutamide) in three PCa cell lines (DU145, 22RV1, and LNCaP). In DU145 and 22RV1 cells, dmrFABP5 showed IC50 values of 5µM and 12µM respectively, while no significant inhibition was observed in LNCaP cells. Docetaxel exhibited IC50 values of 3nM, 4nM, and 2.2nM in DU145, 22RV1, and LNCaP cells respectively. Enzalutamide did not achieve IC50 values in DU145 and 22RV1 cells, showing no significant inhibition. However, in LNCaP cells, the IC50 value of enzalutamide was 97nM. These results suggest that dmrFABP5 only works in FABP5-positive cells and has no effect on FABP5-negative LNCaP cells. Docetaxel effectively suppressed all PCa cells, while enzalutamide did not suppress androgen-independent DU145 cells or androgen-responsive 22RV1 cells expressing AR-V7 lacking the LBD. Enzalutamide did suppress LNCaP cells, which only expressed AR-FL and not AR-V7 [56,57].
The combination of dmrFABP5 and docetaxel demonstrated a strong synergic effect, resulting in a maximum suppression of 89% in DU145 cells and 92% in 22RV1 cells. However, no synergic interaction was observed in LNCaP cells. When dmrFABP5 was combined with enzalutamide, no synergic effect was observed in DU145 cells, but a highly synergic effect of 87% suppression was observed in 22RV1 cells. Again, no synergic interaction was found in LNCaP cells. These results indicated that the combination of dmrFABP5 with either docetaxel or enzalutamide can enhance cell growth suppression in specific prostate cancer cell lines, while the lack of synergic effects in certain cells may be attributed to the absence of specific targets or expression of certain proteins.
The combination of dmrFABP5 and docetaxel resulted in a significant 93% reduction in motility of DU145 cells, surpassing the individual effects of each compound alone. However, when dmrFABP5 was combined with enzalutamide to treat DU145 cells, there was no additional reduction in cell motility compared to dmrFABP5 alone. This result suggested that enzalutamide, which targets AR, does not affect the migration of AR-negative DU145 cells. The combination of dmrFABP5 and docetaxel demonstrated significant suppression of migration in 22RV1 cells, achieving a maximum of 89% wound gap closure. This synergic effect was greater than the effects of each agent alone. In 22RV1 cells, the combination of dmrFABP5 with enzalutamide resulted in 91% cell motility inhibition, significantly higher than the effects of enzalutamide (37%) or dmrFABP5 alone (69%). However, in LNCaP cells, the combination of dmrFABP5 with either docetaxel or enzalutamide did not enhance their effects, although both treatments significantly inhibited migration by 69% and 65% respectively. This result indicated that dmrFABP5 did not suppress FABP5-negative LNCaP cells.
DmrFABP5 synergistically enhanced the suppressive effect of docetaxel in DU145 cells, resulting in a 98% inhibition of cell invasion. However, when dmrFABP5 was combined with enzalutamide, no additional suppression was observed. In 22RV1 cells, enzalutamide alone did not significantly suppress invasion, while dmrFABP5 alone achieved a 72% inhibition. The combination of dmrFABP5 with enzalutamide resulted in a 97% inhibition, indicating an enhancement effect. No enhancement was observed in LNCaP cells when dmrFABP5 was combined with docetaxel or enzalutamide, although both drugs individually significantly inhibited invasion. These results highlight the effectiveness of dmrFABP5 in specific cell lines and its potential for enhancing the activity of certain drugs.
In a previous study, dmrFABP5 was found to suppress colony formation in PC3-M cells [15]. When combined with docetaxel, dmrFABP5 significantly enhanced the inhibition of colony formation in DU145 cells. However, the combination of dmrFABP5 with enzalutamide did not have a significant effect on colony formation in DU145 cells, indicating that enzalutamide did not work in AR-negative DU145 cells. In 22RV1 cells, the combination of dmrFABP5 with either docetaxel or enzalutamide showed a synergic effect, resulting in greater suppression of colony formation compared to each compound alone. No significant enhancement was observed in LNCaP cells when the same combinations were used, suggesting that dmrFABP5 did not enhance the suppressive effect of docetaxel or enzalutamide in LNCaP cells, which are FABP5-negative.
FABP5 plays a crucial role in lipid metabolism and has been implicated in cancer progression [58]. It transports fatty acids to the nucleus, where they activate the receptor PPARγ, leading to the regulation of cancer-related genes [59]. Inhibitors of FABP5 showed effectiveness in suppressing tumour growth and metastasis. A recent study demonstrated that the bio-inhibitor dmrFABP5 was more potent than the chemical inhibitor SB-FI-26 in cancer suppression. Unlike SB-FI-26, dmrFABP5 did not block fatty acid uptake by cancer cells but instead promoted apoptosis through various mechanisms [15]. However, more study is needed to fully understand the exact molecular mechanisms of dmrFABP5's suppressive effects on malignant progression of the cancer cells.
1. Conclusions
In this study, we investigated the experimental -treatment effects of dmrFABP5, docetaxel, and enzalutamide in PCa cells. Our results showed that dmrFABP5 effectively suppressed FABP5-positive cells (22RV1 and Du145) but had no significant effect on FABP5-negative LNCaP cells. Docetaxel acted as an inhibitor in all cell lines, while enzalutamide specifically suppressed AR-positive LNCaP cells. The combination of dmrFABP5 with docetaxel synergistically suppressed FABP5-positive cells, but no significant enhancement was observed in FABP5-negative LNCaP cells. In 22RV1 cells, the combination of dmrFABP5 with enzalutamide showed promising results in restoring sensitivity to enzalutamide, which was previously resistant due to AR-V7 expression. Western blot analysis revealed changes in key factors related to FABP5-initiated signalling pathways, supporting the involvement of these pathways in the observed synergic effects.
Supplementary Materials
All essential data obtained from the current study was shown in this publication and no Supplementary Materials are provided.
Author Contributions
SAA, assisted by AAN, GH, BTA, JZ, and performed the experimental work. YK designed and supervised the study, prepared the manuscript. HZ, XJ, and JA discussed the results, and contributed critical suggestions. SAA also assisted the manuscript writing. All authors read and agreed to this submitted version of the manuscript.
Funding
This study was not supported by grants from external sources.
Institutional Review Board Statement
Not applicable.
Informed Consent Statement
The authors declared no interest conflict.
Data Availability Statement
The cell line data presented in this study are available in main figures and tables. Additional data related to this study are available on request from the corresponding author.
Acknowledgments
SAA and AAN were supported by Ph.D scholarships from King Saud Bin Abdulaziz University for Health Sciences, College of Science and Health Professions, Jeddah, Saudi Arabia. BTA is supported by a PhD studentship from the Faculty of Medicine, Northern Borders University, Saudi Arabia.
Conflicts of Interest
All authors declare no conflict of interest.
References
- Sung, H.; Ferlay, J.; Siegel, R.L.; Laversanne, M.; Soerjomataram, I.; Jemal, A.; et al. Global cancer statistics 2020: GLOBOCAN estimates of incidence and mortality worldwide for 36 cancers in 185 countries. CA: a cancer journal for clinicians 2021, 71, 209–249. [Google Scholar] [CrossRef] [PubMed]
- Frieling, J.S.; Basanta, D.; Lynch, C.C. Current and emerging therapies for bone metastatic castration-resistant prostate cancer. Cancer Control 2015, 22, 109–120. [Google Scholar] [CrossRef] [PubMed]
- Deep, G.; Schlaepfer, I.R. Aberrant lipid metabolism promotes prostate cancer: role in cell survival under hypoxia and extracellular vesicles biogenesis. International Journal of Molecular Sciences 2016, 17, 1061. [Google Scholar] [CrossRef] [PubMed]
- Zadra, G.; Photopoulos, C.; Loda, M. The fat side of prostate cancer. Biochimica et Biophysica Acta (BBA)-Molecular and Cell Biology of Lipids 2013, 1831, 1518–1532. [Google Scholar] [CrossRef] [PubMed]
- Apte, S.A.; Cavazos, D.A.; Whelan, K.A.; Degraffenried, L.A. A low dietary ratio of omega-6 to omega-3 Fatty acids may delay progression of prostate cancer. Nutrition and cancer 2013, 65, 556–562. [Google Scholar] [CrossRef]
- Levi, L.; Wang, Z.; Doud, M.K.; Hazen, S.L.; Noy, N. Saturated fatty acids regulate retinoic acid signalling and suppress tumorigenesis by targeting fatty acid-binding protein 5. Nature communications 2015, 6, 1–10. [Google Scholar] [CrossRef] [PubMed]
- Forootan, F.S.; Forootan, S.S.; Malki, M.I.; Chen, D.Q.; Li, G.D.; Lin, K.; et al. The expression of C-FABP and PPAR gamma and their prognostic significance in prostate cancer. Int J Oncol 2014, 44, 265–275. [Google Scholar] [CrossRef] [PubMed]
- Morgan, E.A.; Forootan, S.S.; Adamson, J.; Foster, C.S.; Fujii, H.; Igarashi, M.; et al. Expression of cutaneous fatty acid-binding protein (C-FABP) in prostate cancer: Potential prognostic marker and target for tumourigenicity-suppression. Int J Oncol 2008, 32, 767–775. [Google Scholar] [PubMed]
- Jing, C.; Beesley, C.; Foster, C.S.; Rudland, P.S.; Fujii, H.; Ono, T.; et al. Identification of the messenger RNA for human cutaneous fatty acid-binding protein as a metastasis inducer. Cancer research 2000, 60, 2390–2398. [Google Scholar] [PubMed]
- Fujita, K.; Kume, H.; Matsuzaki, K.; Kawashima, A.; Ujike, T.; Nagahara, A.; et al. Proteomic analysis of urinary extracellular vesicles from high Gleason score prostate cancer. Scientific reports 2017, 7, 1–9. [Google Scholar] [CrossRef]
- Bao, Z.; Malki, M.I.; Forootan, S.S.; Adamson, J.; Forootan, F.S.; Chen, D.; et al. A Novel Cutaneous Fatty Acid–Binding Protein-Related Signaling Pathway Leading to Malignant Progression in Prostate Cancer Cells. Genes & cancer 2013, 4, 297–314. [Google Scholar]
- Forootan, F.S.; Forootan, S.S.; Gou, X.; Yang, J.; Liu, B.; Chen, D.; et al. Fatty acid activated PPARγ promotes tumorigenicity of prostate cancer cells by up regulating VEGF via PPAR responsive elements of the promoter. Oncotarget 2016, 7, 9322. [Google Scholar] [CrossRef] [PubMed]
- Kawaguchi, K.; Kinameri, A.; Suzuki, S.; Senga, S.; Ke, Y.; Fujii, H. The cancer-promoting gene fatty acid-binding protein 5 (FABP5) is epigenetically regulated during human prostate carcinogenesis. Biochemical Journal 2016, 473, 449–461. [Google Scholar] [CrossRef] [PubMed]
- Naeem, A.A.; Abdulsamad, S.A.; Rudland, P.S.; Malki, M.I.; Ke, Y. Fatty acid-binding protein 5 (FABP5)-related signal transduction pathway in castration-resistant prostate cancer cells: a potential therapeutic target. Precision Clinical Medicine 2019, 2, 192–196. [Google Scholar] [CrossRef]
- Al-Jameel, W.; Gou, X.; Jin, X.; Zhang, J.; Wei, Q.; Ai, J.; et al. Inactivated FABP5 suppresses malignant progression of prostate cancer cells by inhibiting the activation of nuclear fatty acid receptor PPARγ. Genes & cancer 2019, 10, 80. [Google Scholar]
- Berger, W.T.; Ralph, B.P.; Kaczocha, M.; Sun, J.; Balius, T.E.; Rizzo, R.C.; et al. Targeting fatty acid binding protein (FABP) anandamide transporters–a novel strategy for development of anti-inflammatory and anti-nociceptive drugs. PloS one 2012, 7, e50968. [Google Scholar] [CrossRef]
- Kaczocha, M.; Rebecchi, M.J.; Ralph, B.P.; Teng,Y. -H.G.; Berger, W.T.; Galbavy, W.; et al. Inhibition of fatty acid binding proteins elevates brain anandamide levels and produces analgesia. PloS one 2014, 9, e94200. [Google Scholar] [CrossRef]
- Zhang, J. Molecular mechanisms of the apoptosis-promoting activity of FABP5 inhibitors in prostate cancer cells. The University of Liverpool (United Kingdom); 2019.
- Tannock, I.F.; De Wit, R.; Berry, W.R.; Horti, J.; Pluzanska, A.; Chi, K.N.; et al. Docetaxel plus prednisone or mitoxantrone plus prednisone for advanced prostate cancer. New England Journal of Medicine 2004, 351, 1502–1512. [Google Scholar] [CrossRef]
- Galletti, G.; Leach, B.I.; Lam, L.; Tagawa, S.T. Mechanisms of resistance to systemic therapy in metastatic castration-resistant prostate cancer. Cancer treatment reviews 2017, 57, 16–27. [Google Scholar] [CrossRef]
- Zhu, M.L.; Horbinski, C.M.; Garzotto, M.; Qian, D.Z.; Beer, T.M.; Kyprianou, N. Tubulin-targeting chemotherapy impairs androgen receptor activity in prostate cancer. Cancer research 2010, 70, 7992–8002. [Google Scholar] [CrossRef]
- Wang, Q.; Liu, X. The dual functions of α-tubulin acetylation in cellular apoptosis and autophage induced by tanespimycin in lung cancer cells. Cancer Cell International 2020, 20, 1–10. [Google Scholar] [CrossRef]
- Guo, X.L.; Lin, G.J.; Zhao, H.; Gao, Y.; Qian, L.P.; Xu, S.R.; et al. Inhibitory effects of docetaxel on expression of VEGF, bFGF and MMPs of LS174T cell. World journal of gastroenterology 2003, 9, 1995. [Google Scholar] [CrossRef]
- Cao, W.; Shiverick, K.T.; Namiki, K.; Sakai, Y.; Porvasnik, S.; Urbanek, C.; et al. Docetaxel and bortezomib downregulate Bcl-2 and sensitize PC-3-Bcl-2 expressing prostate cancer cells to irradiation. World journal of urology 2008, 26, 509–516. [Google Scholar] [CrossRef]
- Yu, J.X.; Liu, X.; Xu, B. Docetaxel induces apoptosis and influences the expression of P-gp, BCL-2 and BAX protein in HL-60/ADR cells. Zhongguo shi yan xue ye xue za zhi 2010, 18, 311–316. [Google Scholar]
- Higano, C.S.; Beer, T.M.; Taplin, M.E.; Efstathiou, E.; Hirmand, M.; Forer, D.; et al. Long-term safety and antitumor activity in the Phase 1–2 study of enzalutamide in pre-and post-docetaxel castration-resistant prostate cancer. European urology 2015, 68, 795–801. [Google Scholar] [CrossRef] [PubMed]
- Tran, C.; Ouk, S.; Clegg, N.J.; Chen, Y.; Watson, P.A.; Arora, V.; et al. Development of a second-generation antiandrogen for treatment of advanced prostate cancer. Science 2009, 324, 787–790. [Google Scholar] [CrossRef] [PubMed]
- Mostaghel, E.A.; Marck, B.T.; Plymate, S.R.; Vessella, R.L.; Balk, S.; Matsumoto, A.M.; et al. Resistance to CYP17A1 inhibition with abiraterone in castration-resistant prostate cancer: induction of steroidogenesis and androgen receptor splice variants. Clinical cancer research 2011, 17, 5913–5925. [Google Scholar] [CrossRef]
- Kim, W.; Ryan, C.J. Androgen receptor directed therapies in castration-resistant metastatic prostate cancer. Current treatment options in oncology 2012, 13, 189–200. [Google Scholar] [CrossRef] [PubMed]
- Miyamoto, H.; Messing, E.M.; Chang, C. Androgen deprivation therapy for prostate cancer: current status and future prospects. The Prostate 2004, 61, 332–353. [Google Scholar] [CrossRef] [PubMed]
- Dehm, S.M.; Schmidt, L.J.; Heemers, H.V.; Vessella, R.L.; Tindall, D.J. Splicing of a novel androgen receptor exon generates a constitutively active androgen receptor that mediates prostate cancer therapy resistance. Cancer research 2008, 68, 5469–5477. [Google Scholar] [CrossRef]
- Hu, R.; Dunn, T.A.; Wei, S.; Isharwal, S.; Veltri, R.W.; Humphreys, E.; et al. Ligand-independent androgen receptor variants derived from splicing of cryptic exons signify hormone-refractory prostate cancer. Cancer research 2009, 69, 16–22. [Google Scholar] [CrossRef]
- Guo, Z.; Yang, X.; Sun, F.; Jiang, R.; Linn, D.E.; Chen, H.; et al. A novel androgen receptor splice variant is up-regulated during prostate cancer progression and promotes androgen depletion–resistant growth. Cancer research 2009, 69, 2305–2313. [Google Scholar] [CrossRef]
- Li, Y.; Alsagabi, M.; Fan, D.; Bova, G.S.; Tewfik, A.H.; Dehm, S.M. Intragenic rearrangement and altered RNA splicing of the androgen receptor in a cell-based model of prostate cancer progression. Cancer research 2011, 71, 2108–2117. [Google Scholar] [CrossRef]
- Hu, R.; Isaacs, W.B.; Luo, J. A snapshot of the expression signature of androgen receptor splicing variants and their distinctive transcriptional activities. The Prostate 2011, 71, 1656–1667. [Google Scholar] [CrossRef] [PubMed]
- Li, Y.; Hwang, T.H.; Oseth, L.; Hauge, A.; Vessella, R.L.; Schmechel, S.C.; et al. AR intragenic deletions linked to androgen receptor splice variant expression and activity in models of prostate cancer progression. Oncogene 2012, 31, 4759–4767. [Google Scholar] [CrossRef] [PubMed]
- Antonarakis, E.S.; Lu, C.; Wang, H.; Luber, B.; Nakazawa, M.; Roeser, J.C.; et al. AR-V7 and resistance to enzalutamide and abiraterone in prostate cancer. New England Journal of Medicine 2014, 371, 1028–1038. [Google Scholar] [CrossRef] [PubMed]
- Harris, W.P.; Mostaghel, E.A.; Nelson, P.S.; Montgomery, B. Androgen deprivation therapy: progress in understanding mechanisms of resistance and optimizing androgen depletion. Nature clinical practice Urology 2009, 6, 76–85. [Google Scholar] [CrossRef] [PubMed]
- Cella, D.; Peterman, A.; Hudgens, S.; Webster, K.; Socinski, M.A. Measuring the side effects of taxane therapy in oncology: The Functional Assessment of Cancer Therapy–taxane (FACT-taxane). Cancer: Interdisciplinary International Journal of the American Cancer Society 2003, 98, 822–831. [Google Scholar] [CrossRef]
- Baker, J.; Ajani, J.; Scotté, F.; Winther, D.; Martin, M.; Aapro, M.S.; et al. Docetaxel-related side effects and their management. European journal of oncology nursing 2009, 13, 49–59. [Google Scholar] [CrossRef]
- Merseburger, A.S.; Haas, G.P.; von Klot, C.A. An update on enzalutamide in the treatment of prostate cancer. Therapeutic advances in urology 2015, 7, 9–21. [Google Scholar] [CrossRef] [PubMed]
- Naeem, A.A.; Abdulsamad, S.A.; Al-Bayati, A.; Zhang, J.; Malki, M.I.; Ma, H.; et al. Prostate Cell Lines. Journal of Oncology and Medicine 2022. [Google Scholar]
- Mitchell, S.; Abel, P.; Ware, M.; Stamp, G.; Lalani, E.N. Phenotypic and genotypic characterization of commonly used human prostatic cell lines. BJU international 2000, 85, 932–944. [Google Scholar] [CrossRef]
- Forootan, F.S.; Forootan, S.S.; Malki, M.I.; Chen, D.; Li, G.; Lin, K.; et al. The expression of C-FABP and PPARγ and their prognostic significance in prostate cancer. Int J Oncol 2014, 44, 265–275. [Google Scholar] [CrossRef] [PubMed]
- Chou, T.-C. Drug combination studies and their synergy quantification using the Chou-Talalay method. Cancer research 2010, 70, 440–446. [Google Scholar] [CrossRef] [PubMed]
- Ross, R.W.; Xie, W.; Regan, M.M.; Pomerantz, M.; Nakabayashi, M.; Daskivich, T.J.; et al. Efficacy of androgen deprivation therapy (ADT) in patients with advanced prostate cancer: association between Gleason score, prostate-specific antigen level, and prior ADT exposure with duration of ADT effect. Cancer: Interdisciplinary International Journal of the American Cancer Society 2008, 112, 1247–1253. [Google Scholar] [CrossRef] [PubMed]
- Coutinho, I.; Day, T.K.; Tilley, W.D.; Selth, L.A. Androgen receptor signaling in castration-resistant prostate cancer: a lesson in persistence. Endocrine-related cancer 2016, 23, T179–T97. [Google Scholar] [CrossRef]
- Forootan, S.S.; Hussain, S.; Aachi, V.; Foster, C.S.; Ke, Y. Molecular mechanisms involved in the transition of prostate cancer cells from androgen dependant to castration resistant state. Journal of Andrology and Gynaecology 2014, 2, 1–9. [Google Scholar]
- Merseburger, A.S.; Haas, G.P.; von Klot, C.A. An update on enzalutamide in the treatment of prostate cancer. Ther Adv Urol 2015, 7, 9–21. [Google Scholar] [CrossRef] [PubMed]
- Zobniw, C.M.; Causebrook, A.; Fong, M.K. Clinical use of abiraterone in the treatment of metastatic castration-resistant prostate cancer. Res Rep Urol 2014, 6, 97–105. [Google Scholar] [PubMed]
- Karantanos, T.; Corn, P.G.; Thompson, T.C. Prostate cancer progression after androgen deprivation therapy: mechanisms of castrate resistance and novel therapeutic approaches. Oncogene 2013, 32, 5501–5511. [Google Scholar] [CrossRef]
- Katzenwadel, A.; Wolf, P. Androgen deprivation of prostate cancer: Leading to a therapeutic dead end. Cancer letters 2015, 367, 12–17. [Google Scholar] [CrossRef]
- Wang, K.; Ruan, H.; Xu, T.; Liu, L.; Liu, D.; Yang, H.; et al. Recent advances on the progressive mechanism and therapy in castration-resistant prostate cancer. Onco Targets Ther 2018, 11, 3167–3178. [Google Scholar] [CrossRef]
- Zhang, J.; He, G.; Jin, X.; Alenezi, B.T.; Naeem, A.A.; Abdulsamad, S.A.; et al. Molecular mechanisms on how FABP5 inhibitors promote apoptosis-induction sensitivity of prostate cancer cells. Cell Biology International 2023. [Google Scholar] [CrossRef]
- Zheng, Z.; Li, J.; Liu, Y.; Shi, Z.; Xuan, Z.; Yang, K.; et al. The Crucial Role of AR-V7 in Enzalutamide-Resistance of Castration-Resistant Prostate Cancer. Cancers 2022, 14, 4877. [Google Scholar] [CrossRef]
- Zhu, Y.; Dalrymple, S.L.; Coleman, I.; Zheng, S.L.; Xu, J.; Hooper, J.E.; et al. Role of androgen receptor splice variant-7 (AR-V7) in prostate cancer resistance to 2nd-generation androgen receptor signaling inhibitors. Oncogene 2020, 39, 6935–6949. [Google Scholar] [CrossRef] [PubMed]
- Khurana, N.; Kim, H.; Chandra, P.K.; Talwar, S.; Sharma, P.; Abdel-Mageed, A.B.; et al. Multimodal actions of the phytochemical sulforaphane suppress both AR and AR-V7 in 22Rv1 cells: Advocating a potent pharmaceutical combination against castration-resistant prostate cancer. Oncology Reports 2017, 38, 2774–2786. [Google Scholar] [CrossRef]
- Carbonetti, G.; Wilpshaar, T.; Kroonen, J.; Studholme, K.; Converso, C.; d’Oelsnitz, S.; et al. FABP5 coordinates lipid signaling that promotes prostate cancer metastasis. Scientific reports 2019, 9, 1–16. [Google Scholar] [CrossRef]
- Forootan, S.S.; Bao, Z.Z.; Forootan, F.S.; Kamalian, L.; Zhang, Y.; Bee, A.; et al. Atelocollagen-delivered siRNA targeting the FABP5 gene as an experimental therapy for prostate cancer in mouse xenografts. Int J Oncol 2010, 36, 69–76. [Google Scholar] [PubMed]
Figure 1.
Determination of the IC50 doses via measuring the viability of cells treated with different concentrations of each compound. Viabilities of prostate cancer cell lines DU145 (A), 22RV1 (B) and LNCaP (C) were measured when treated with different concentrations of docetaxel. Viabilities of DU145 (D), 22RV1 (E) and LNCaP (F) were measured when treated with different concentrations of enzalutamide. Viabilities of DU145 (G), 22RV1 (H) and LNCaP (I) were measured when treated with different concentrations of dmrFABP5. IC50 values achieved in each cell line is pointed by an arrowhead.
Figure 2.
Synergic effect of dmrFABP5 on the tumor-suppression activity of docetaxel in DU145 cells and the effect on expression levels of relevant regulators. A), the effect on the viability of cells treated by a fixed dose of dmrFABP5 combined with different doses of docetaxel. B), the effect on the viability of cells treated by a fixed dose of docetaxel combined with different doses of dmrFABP5. C), the effect of dmrFABP5 combined with docetaxel on cell migration ability and, D) its quantitative assessment. E), the effect of dmrFABP5 combined with docetaxel on the cell invasion and, F) the quantitative assessment on its relative levels. G), the effect of dmrFABP5 combined with docetaxel on cell anchorage-independent growth and, H) the quantitative assessment on cell colony numbers. I) the effect of dmrFABP5 combined with docetaxel on expression levels of protein regulators and, J) the quantitative assessments.
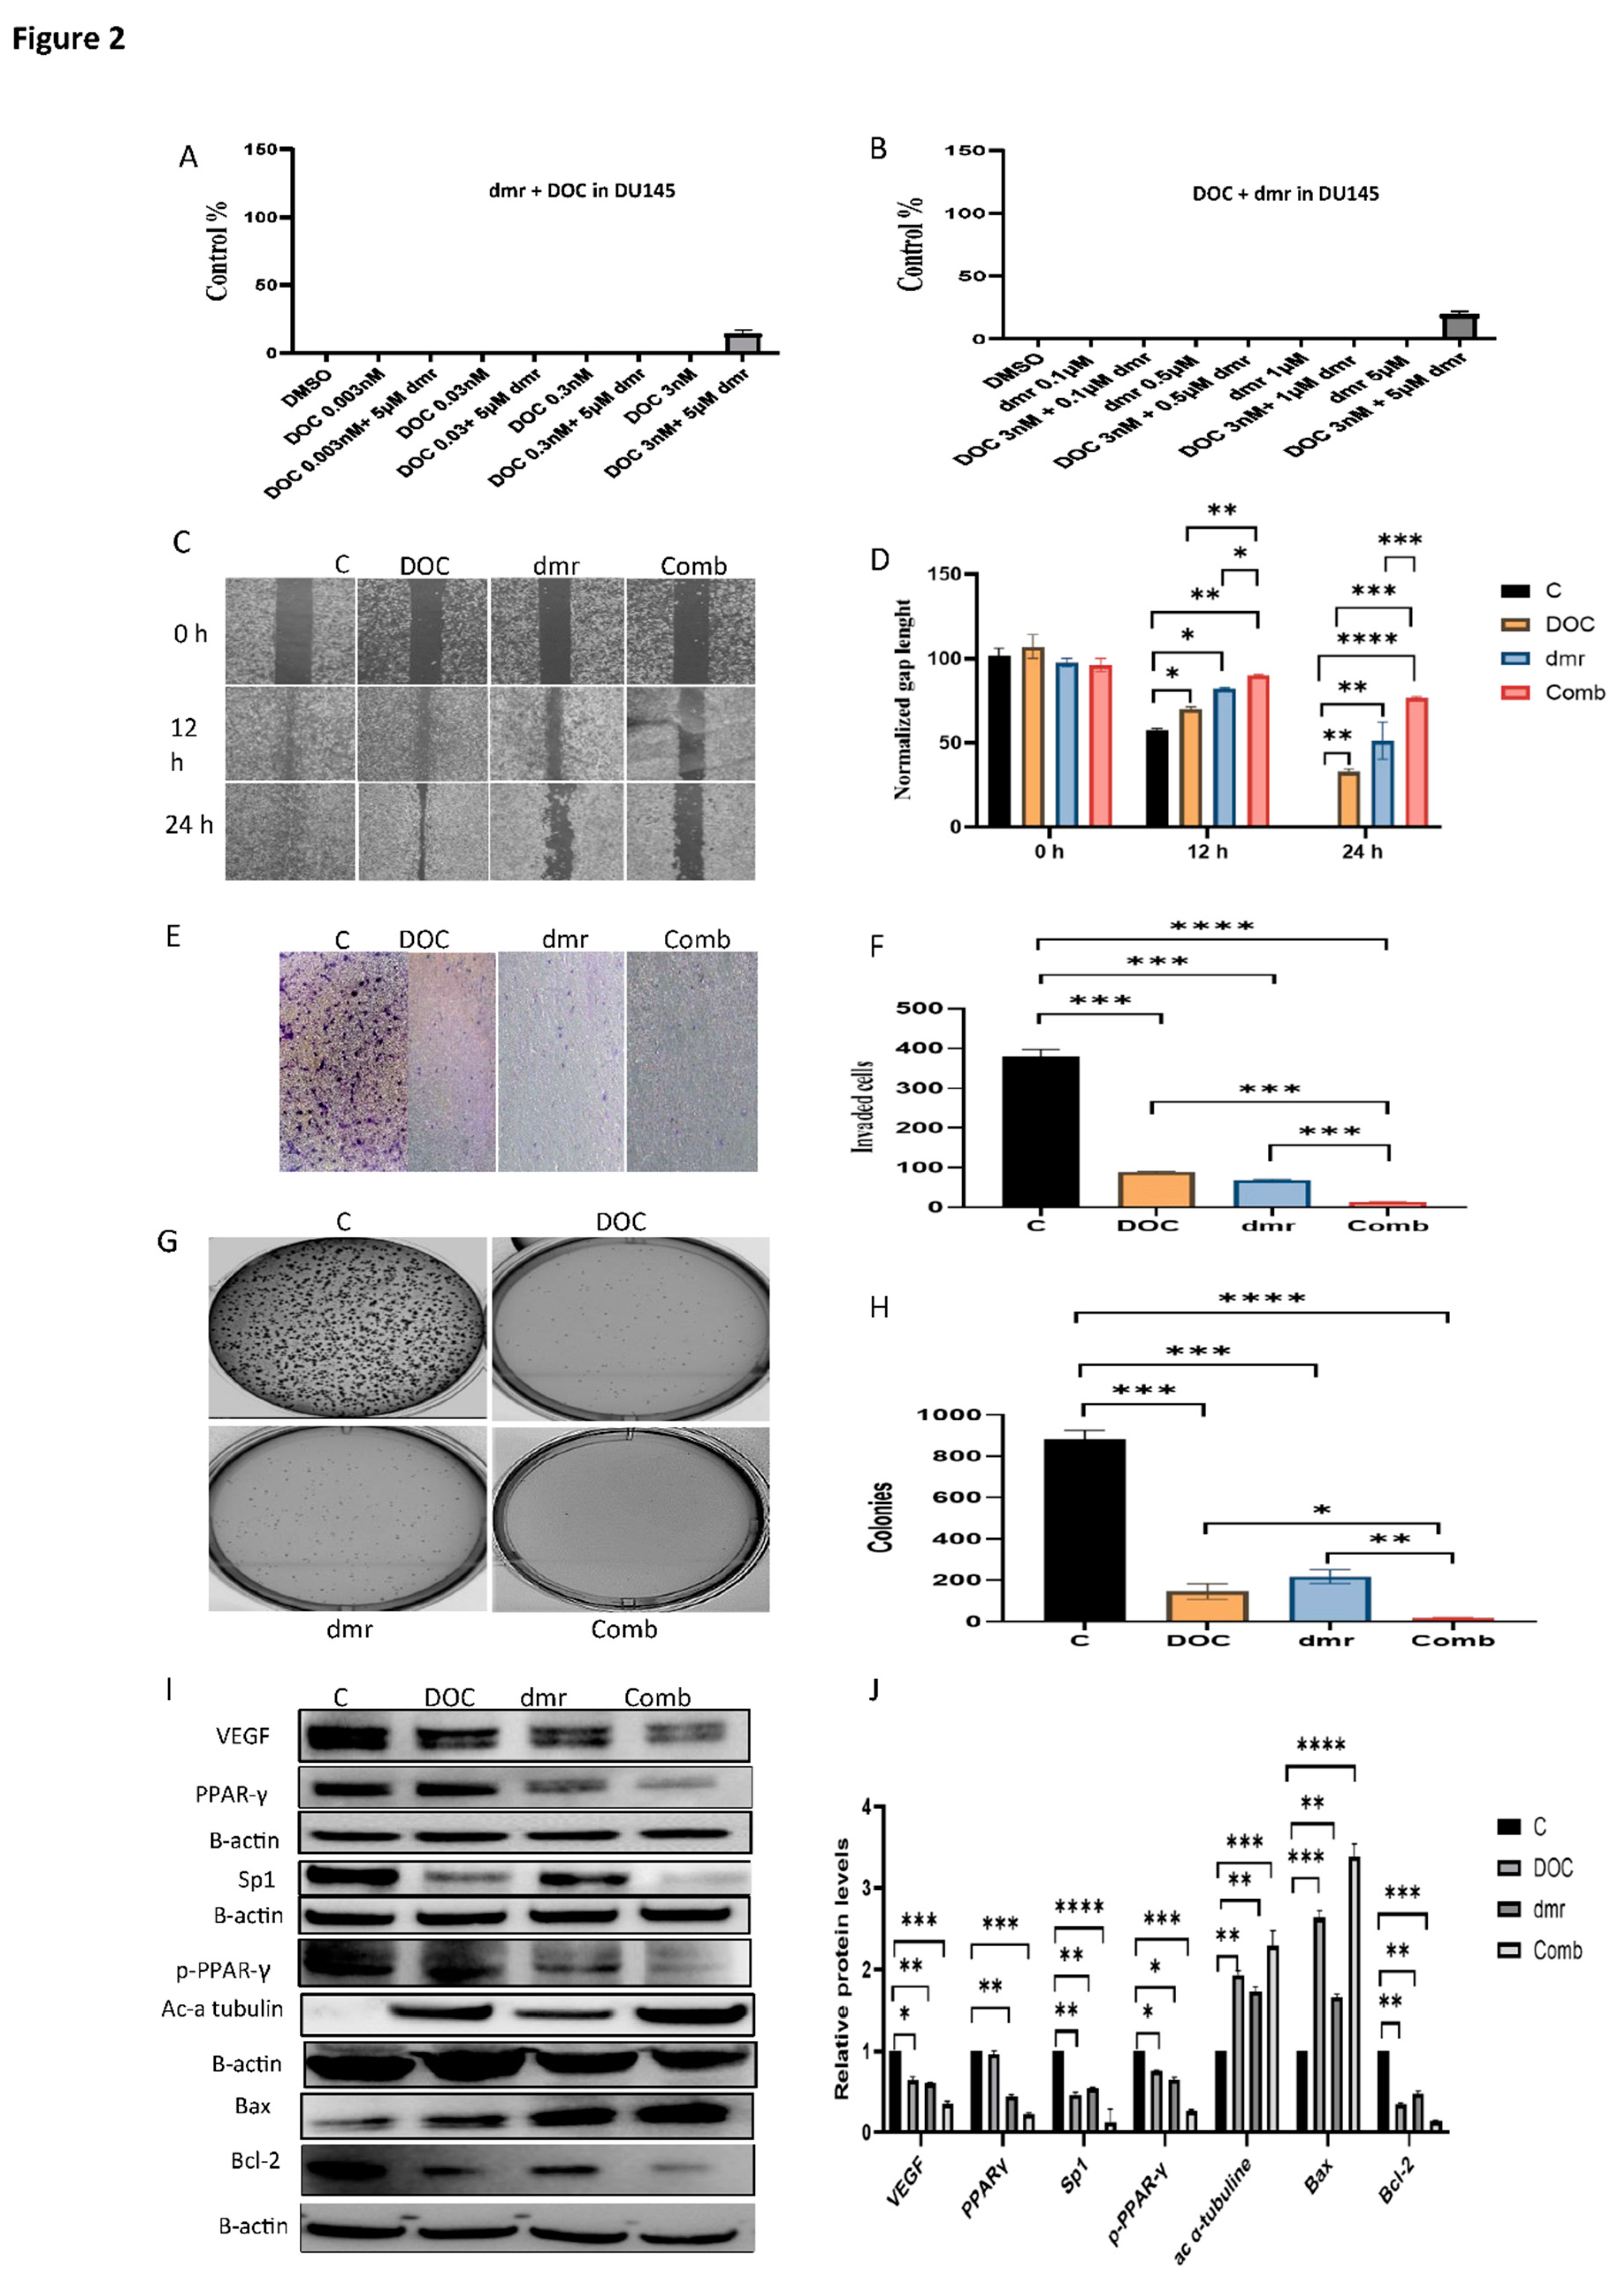
Figure 4.
The effect of dmrFABP5 on the tumor-suppression activity of docetaxel in LNCaP cells. A), the effect on cell viability produced by the fixed dose of dmrFABP5 combined with different doses of docetaxel. B), the effect on cell viability produced by the fixed dose of docetaxel combined with different doses of dmrFABP5. C), the effect of dmrFABP5 combined with docetaxel on cell migration ability and, D) its quantitative assessment. E), the effect of dmrFABP5 combined with docetaxel on the cell invasion and, F) the quantitative assessment on its relative levels. G), the effect of dmrFABP5 combined with docetaxel on cell anchorage-independent growth and, H) the quantitative assessment on cell colony numbers. Each experiment was performed in triplicates and the data was presented as mean ± SE; Student t-test was used to compare the means. *P<0.05, **P<0.001, ***P<0.0001. C=Control, Doc=docetaxel, dmr=dmrFABP5, Com=Combination of both dmr and Doc.
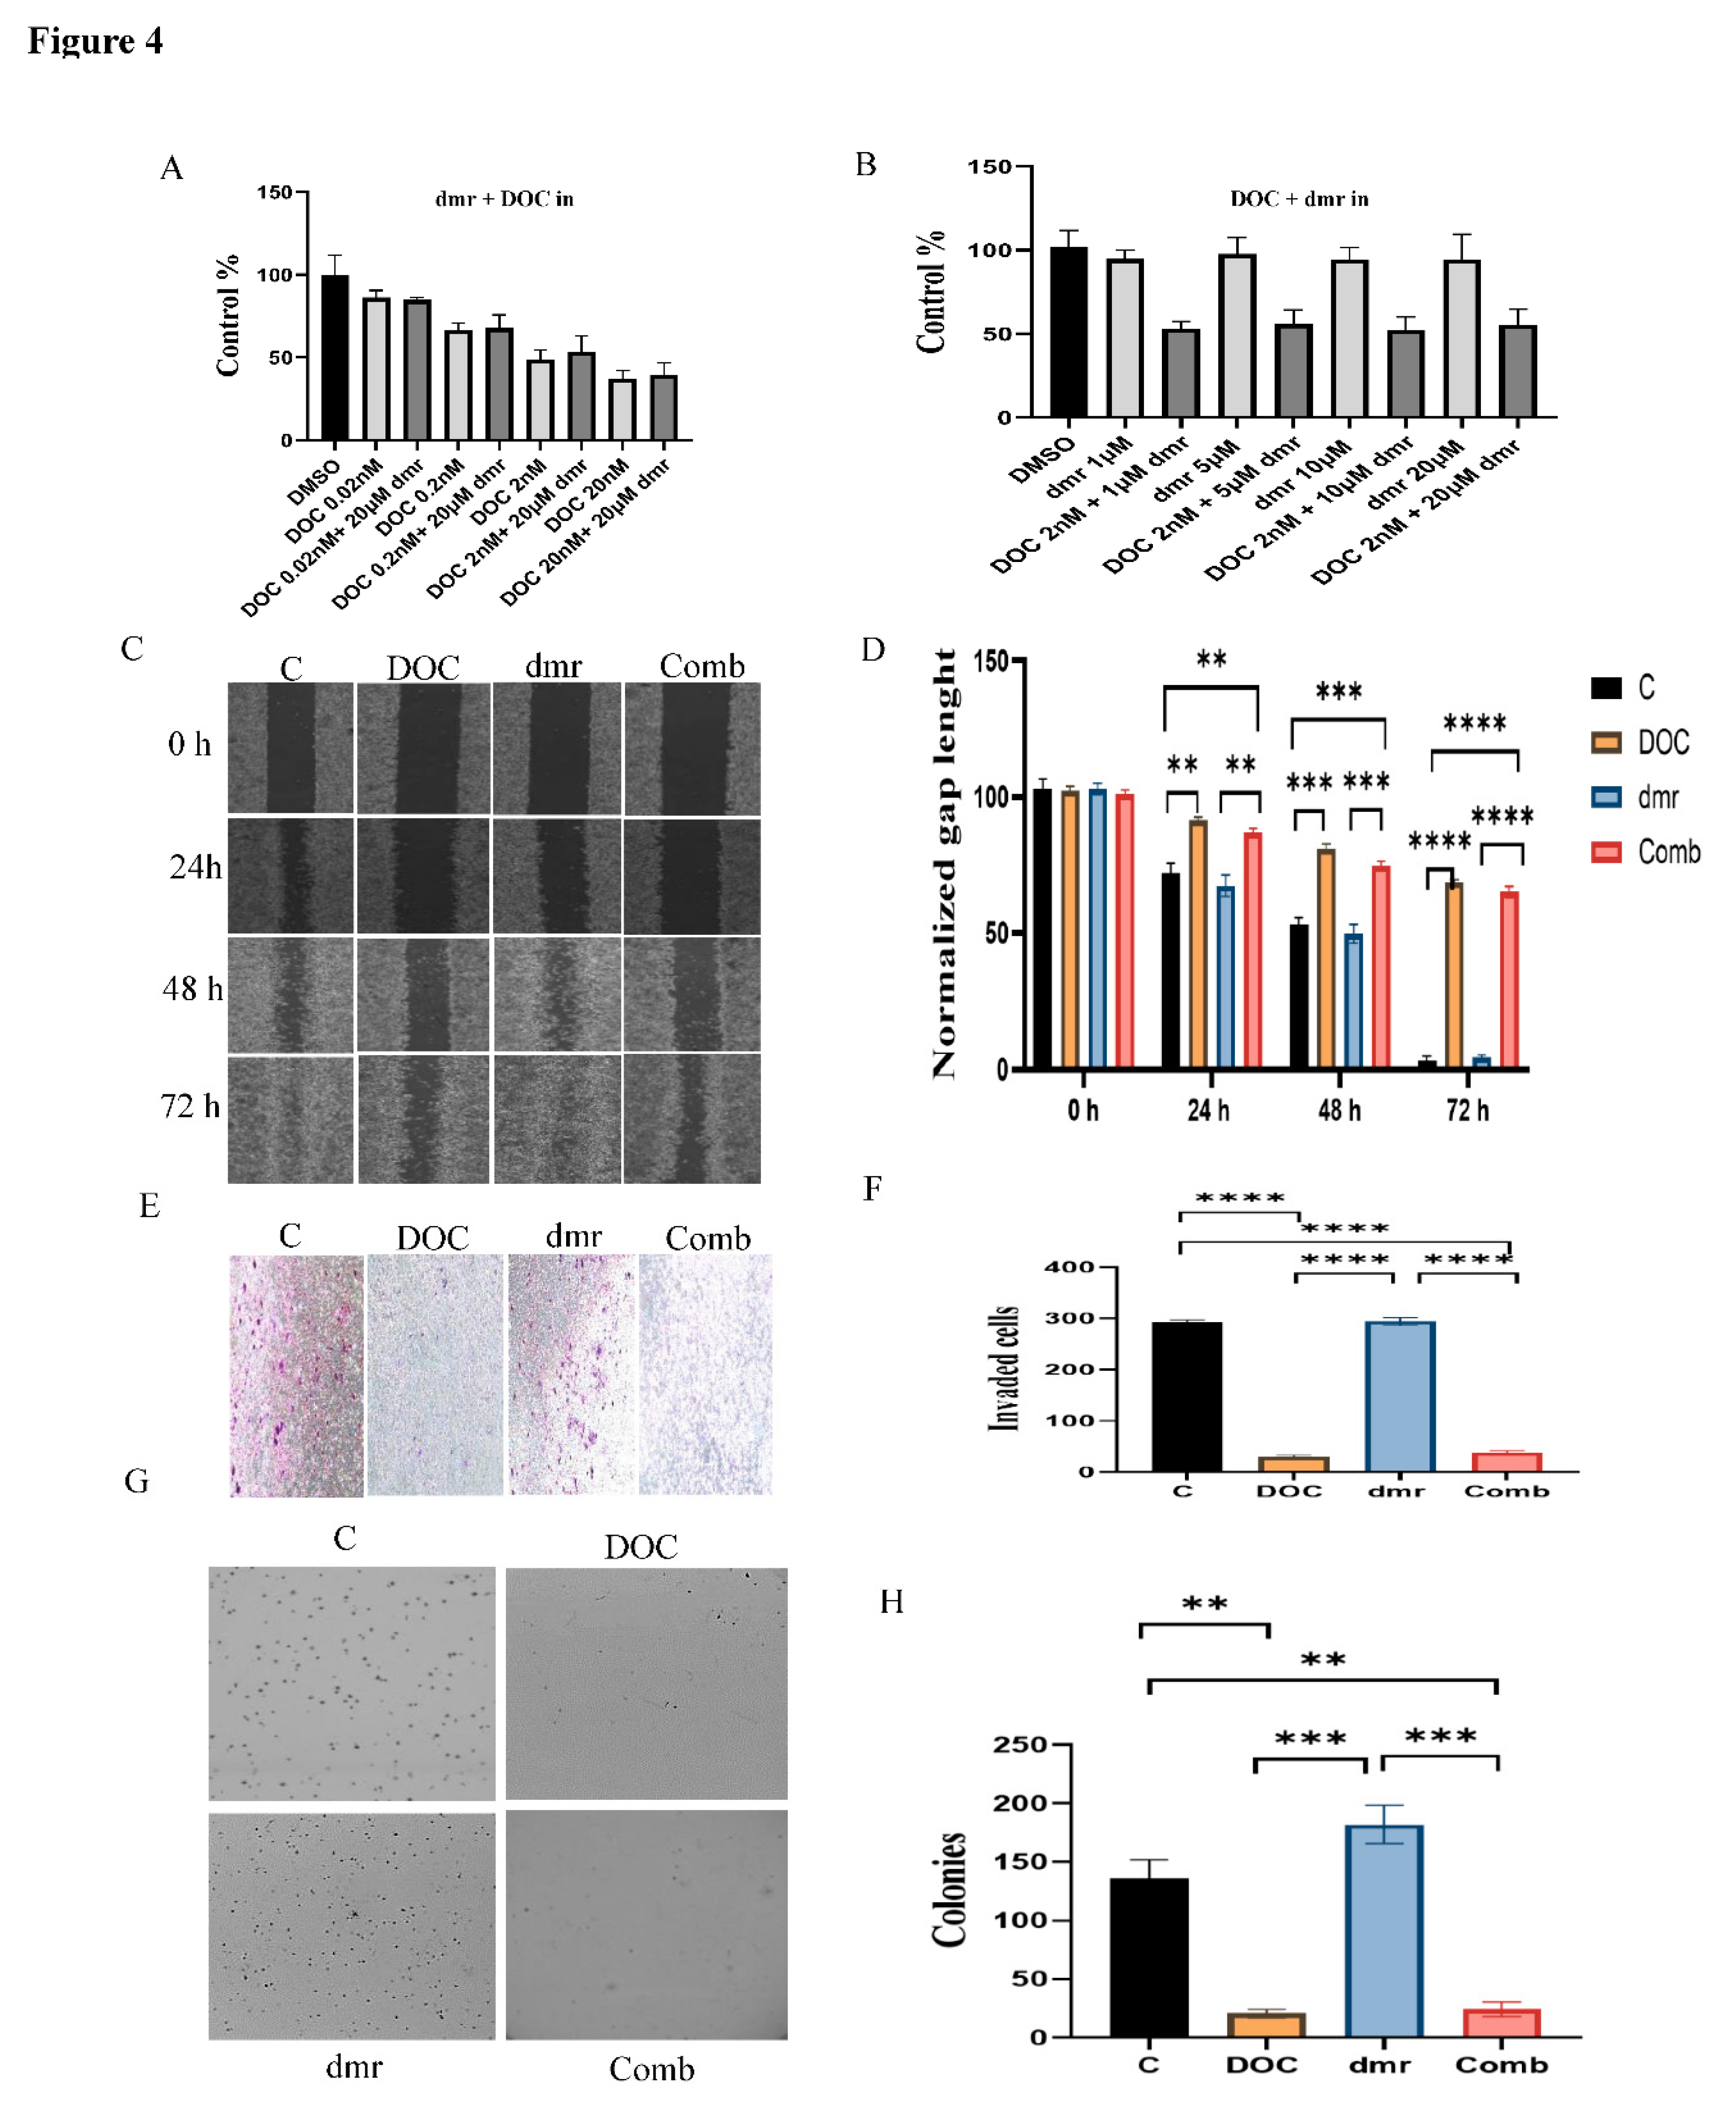
Figure 5.
The effect of dmrFABP5 on the tumor-suppression activity of enzalutamide in DU145 cells. A), the effect on cell viability produced by the fixed dose of dmrFABP5 combined with different doses of enzalutamide. B), the effect on cell viability produced by the fixed dose of enzalutamide combined with different doses of dmrFABP5. C), the effect of dmrFABP5 combined with enzalutamide on cell migration ability and, D) its quantitative assessment. E), the effect of dmrFABP5 combined with enzalutamide on the cell invasion and, F) the quantitative assessment on its relative levels. G), the effect of dmrFABP5 combined with enzalutamide on cell anchorage-independent growth and, H) the quantitative assessment on cell colony numbers. Each experiment was performed in triplicates and the data was presented as mean ± SE; Student t-test was used to compare the means. *P < 0.05, **P < 0.001, ***P < 0.0001. C=Control, Enz= enzalutamide, dmr=dmrFABP5, Com=Combination of both dmr and Enz.
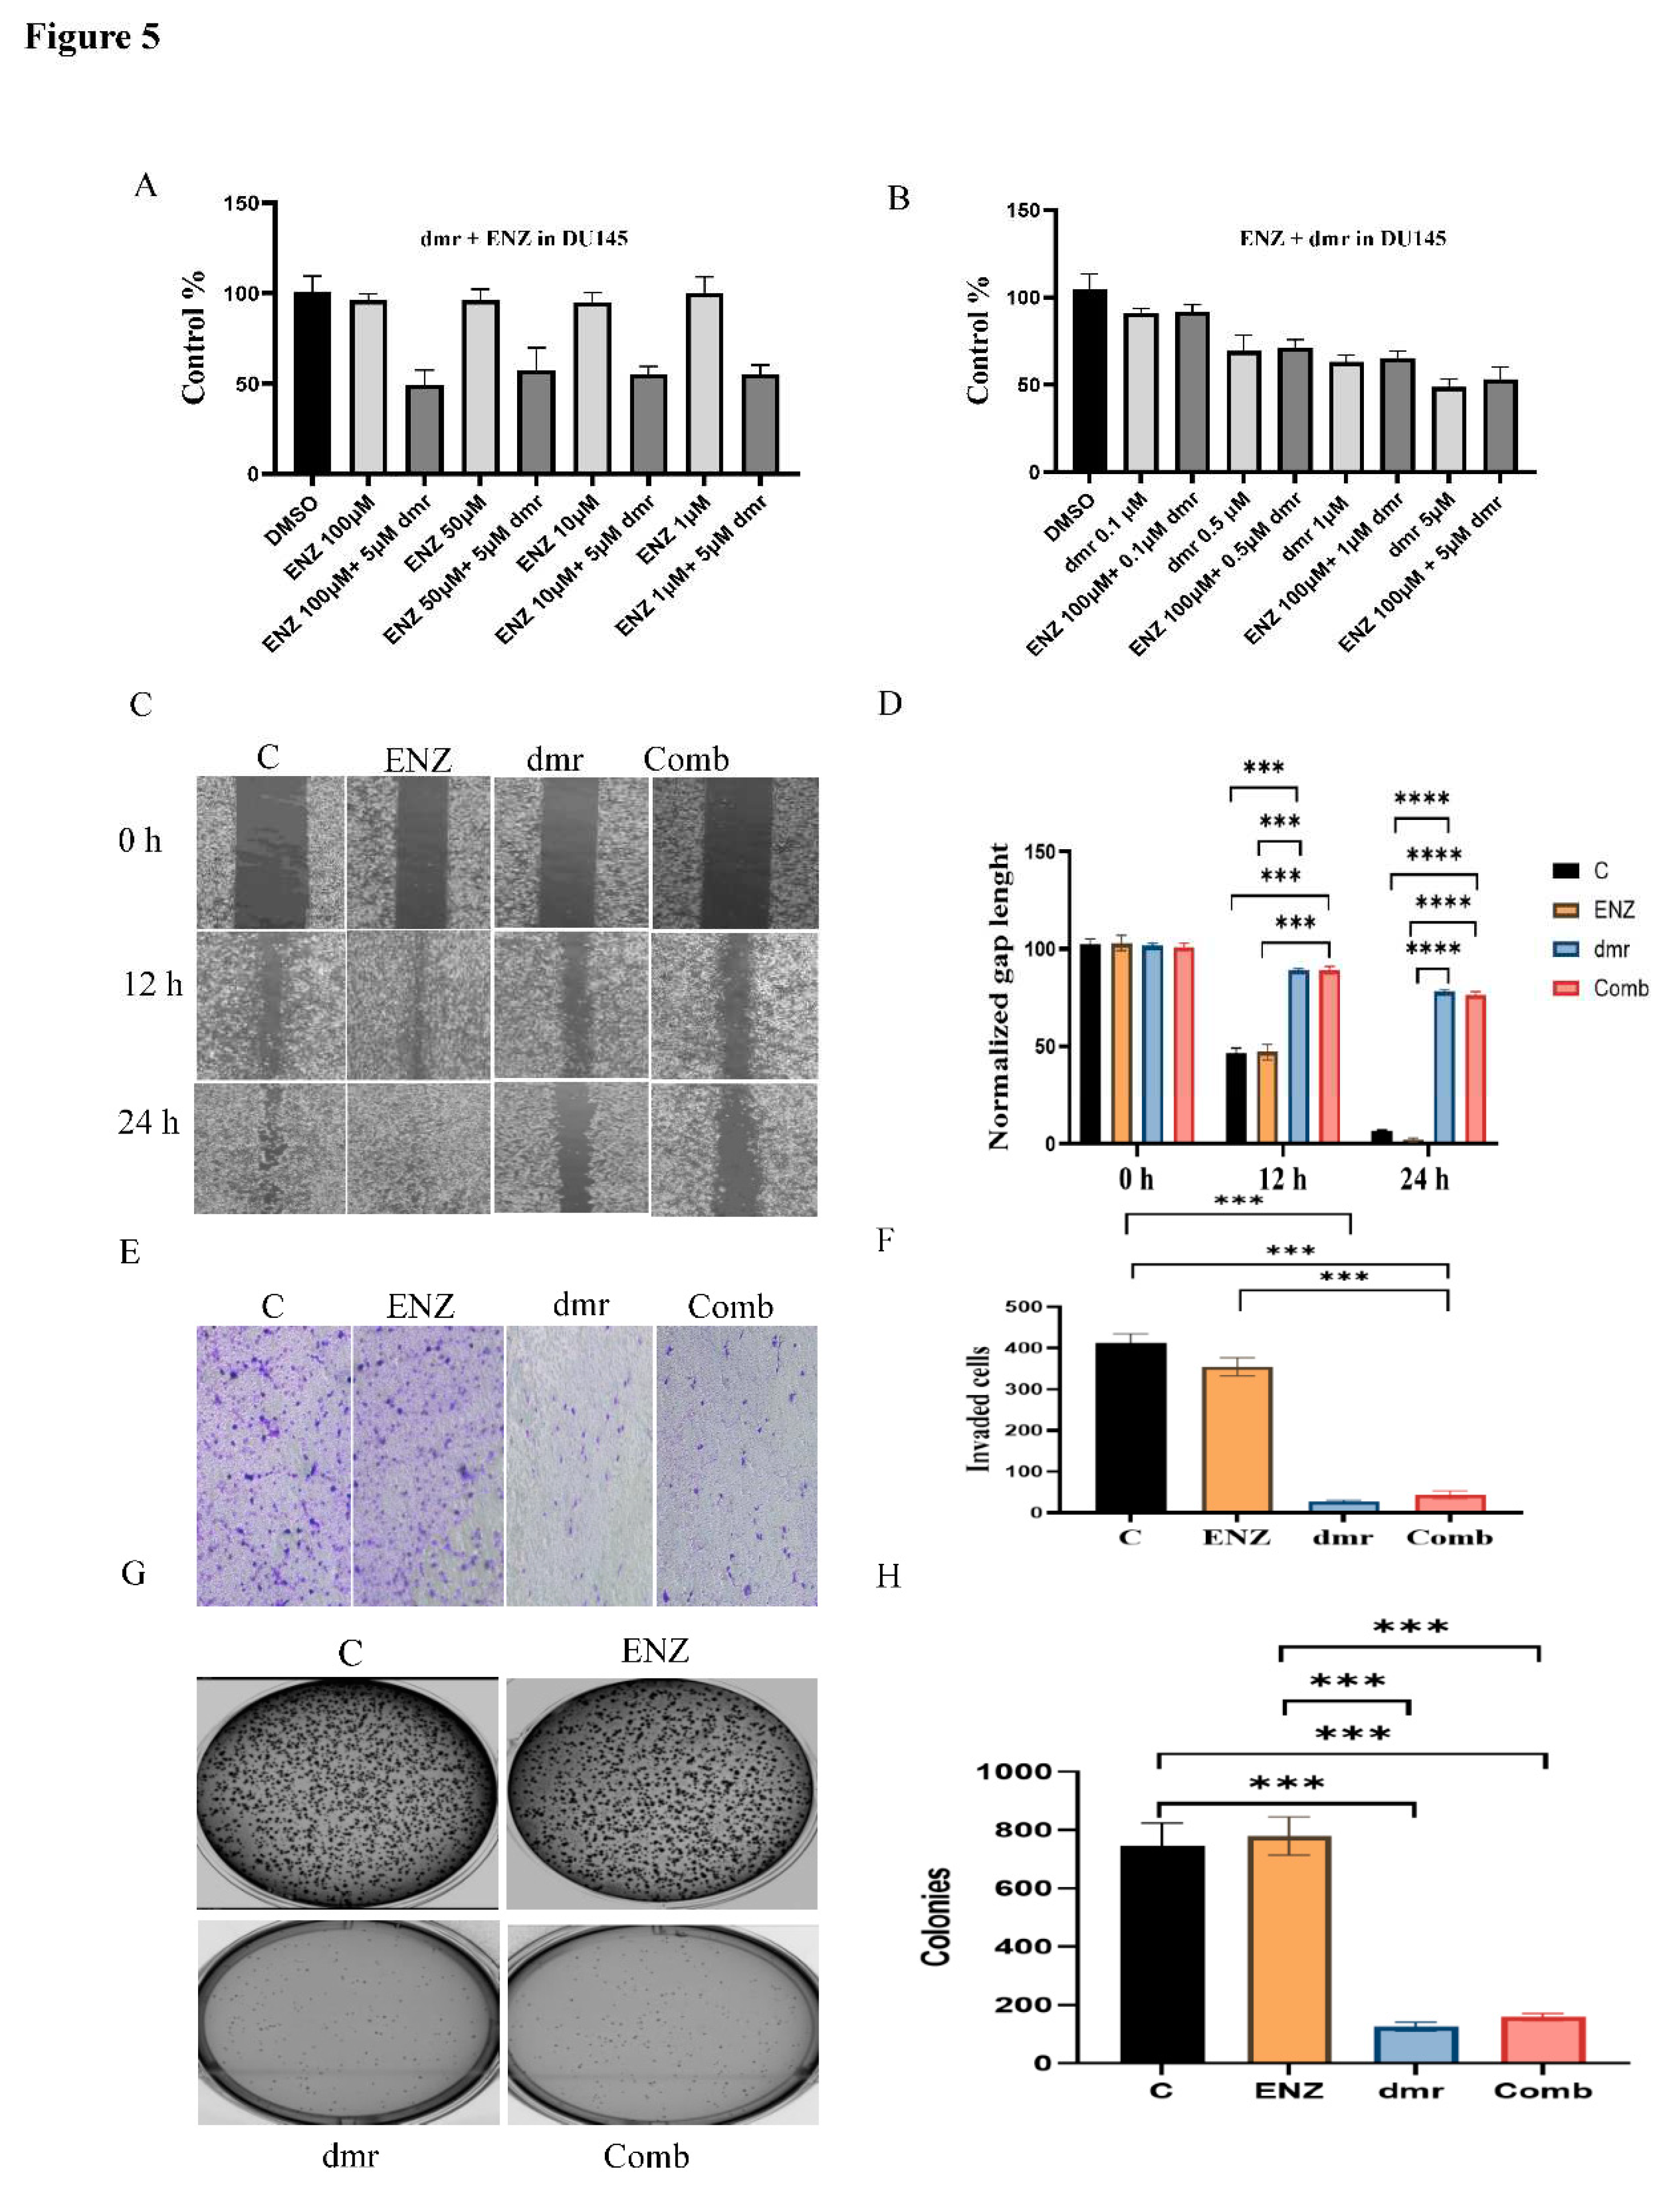
Figure 6.
Synergic effect of dmrFABP5 on the tumor-suppression activity of enzalutamide in 22RV1 cells and the effect on expression levels of relevant regulators. A), the effect on cell viability produced by the fixed dose of dmrFABP5 combined with different doses of enzalutamide. B), the effect on cell viability produced by the fixed dose of enzalutamide combined with different doses of dmrFABP5. C), the effect of dmrFABP5 combined with enzalutamide on cell migration ability and, D) its quantitative assessment. E), the effect of dmrFABP5 combined with enzalutamide on the cell invasion and, F) the quantitative assessment on its relative levels. G), the effect of dmrFABP5 combined with enzalutamide on cell anchorage-independent growth and, H) the quantitative assessment on cell colony numbers. I) the effect of dmrFABP5 combined with enzalutamide on expression levels of protein regulators and, J) the quantitative assessments. Each experiment was performed in triplicates and the data was presented as mean ± SE; Student t-test was used to compare the means. *P< 0.05, **P<0.001, ***P<0.0001. C=Control, Enz= enzalutamide, dmr=dmrFABP5, Com=Combination of both dmr and Enz.
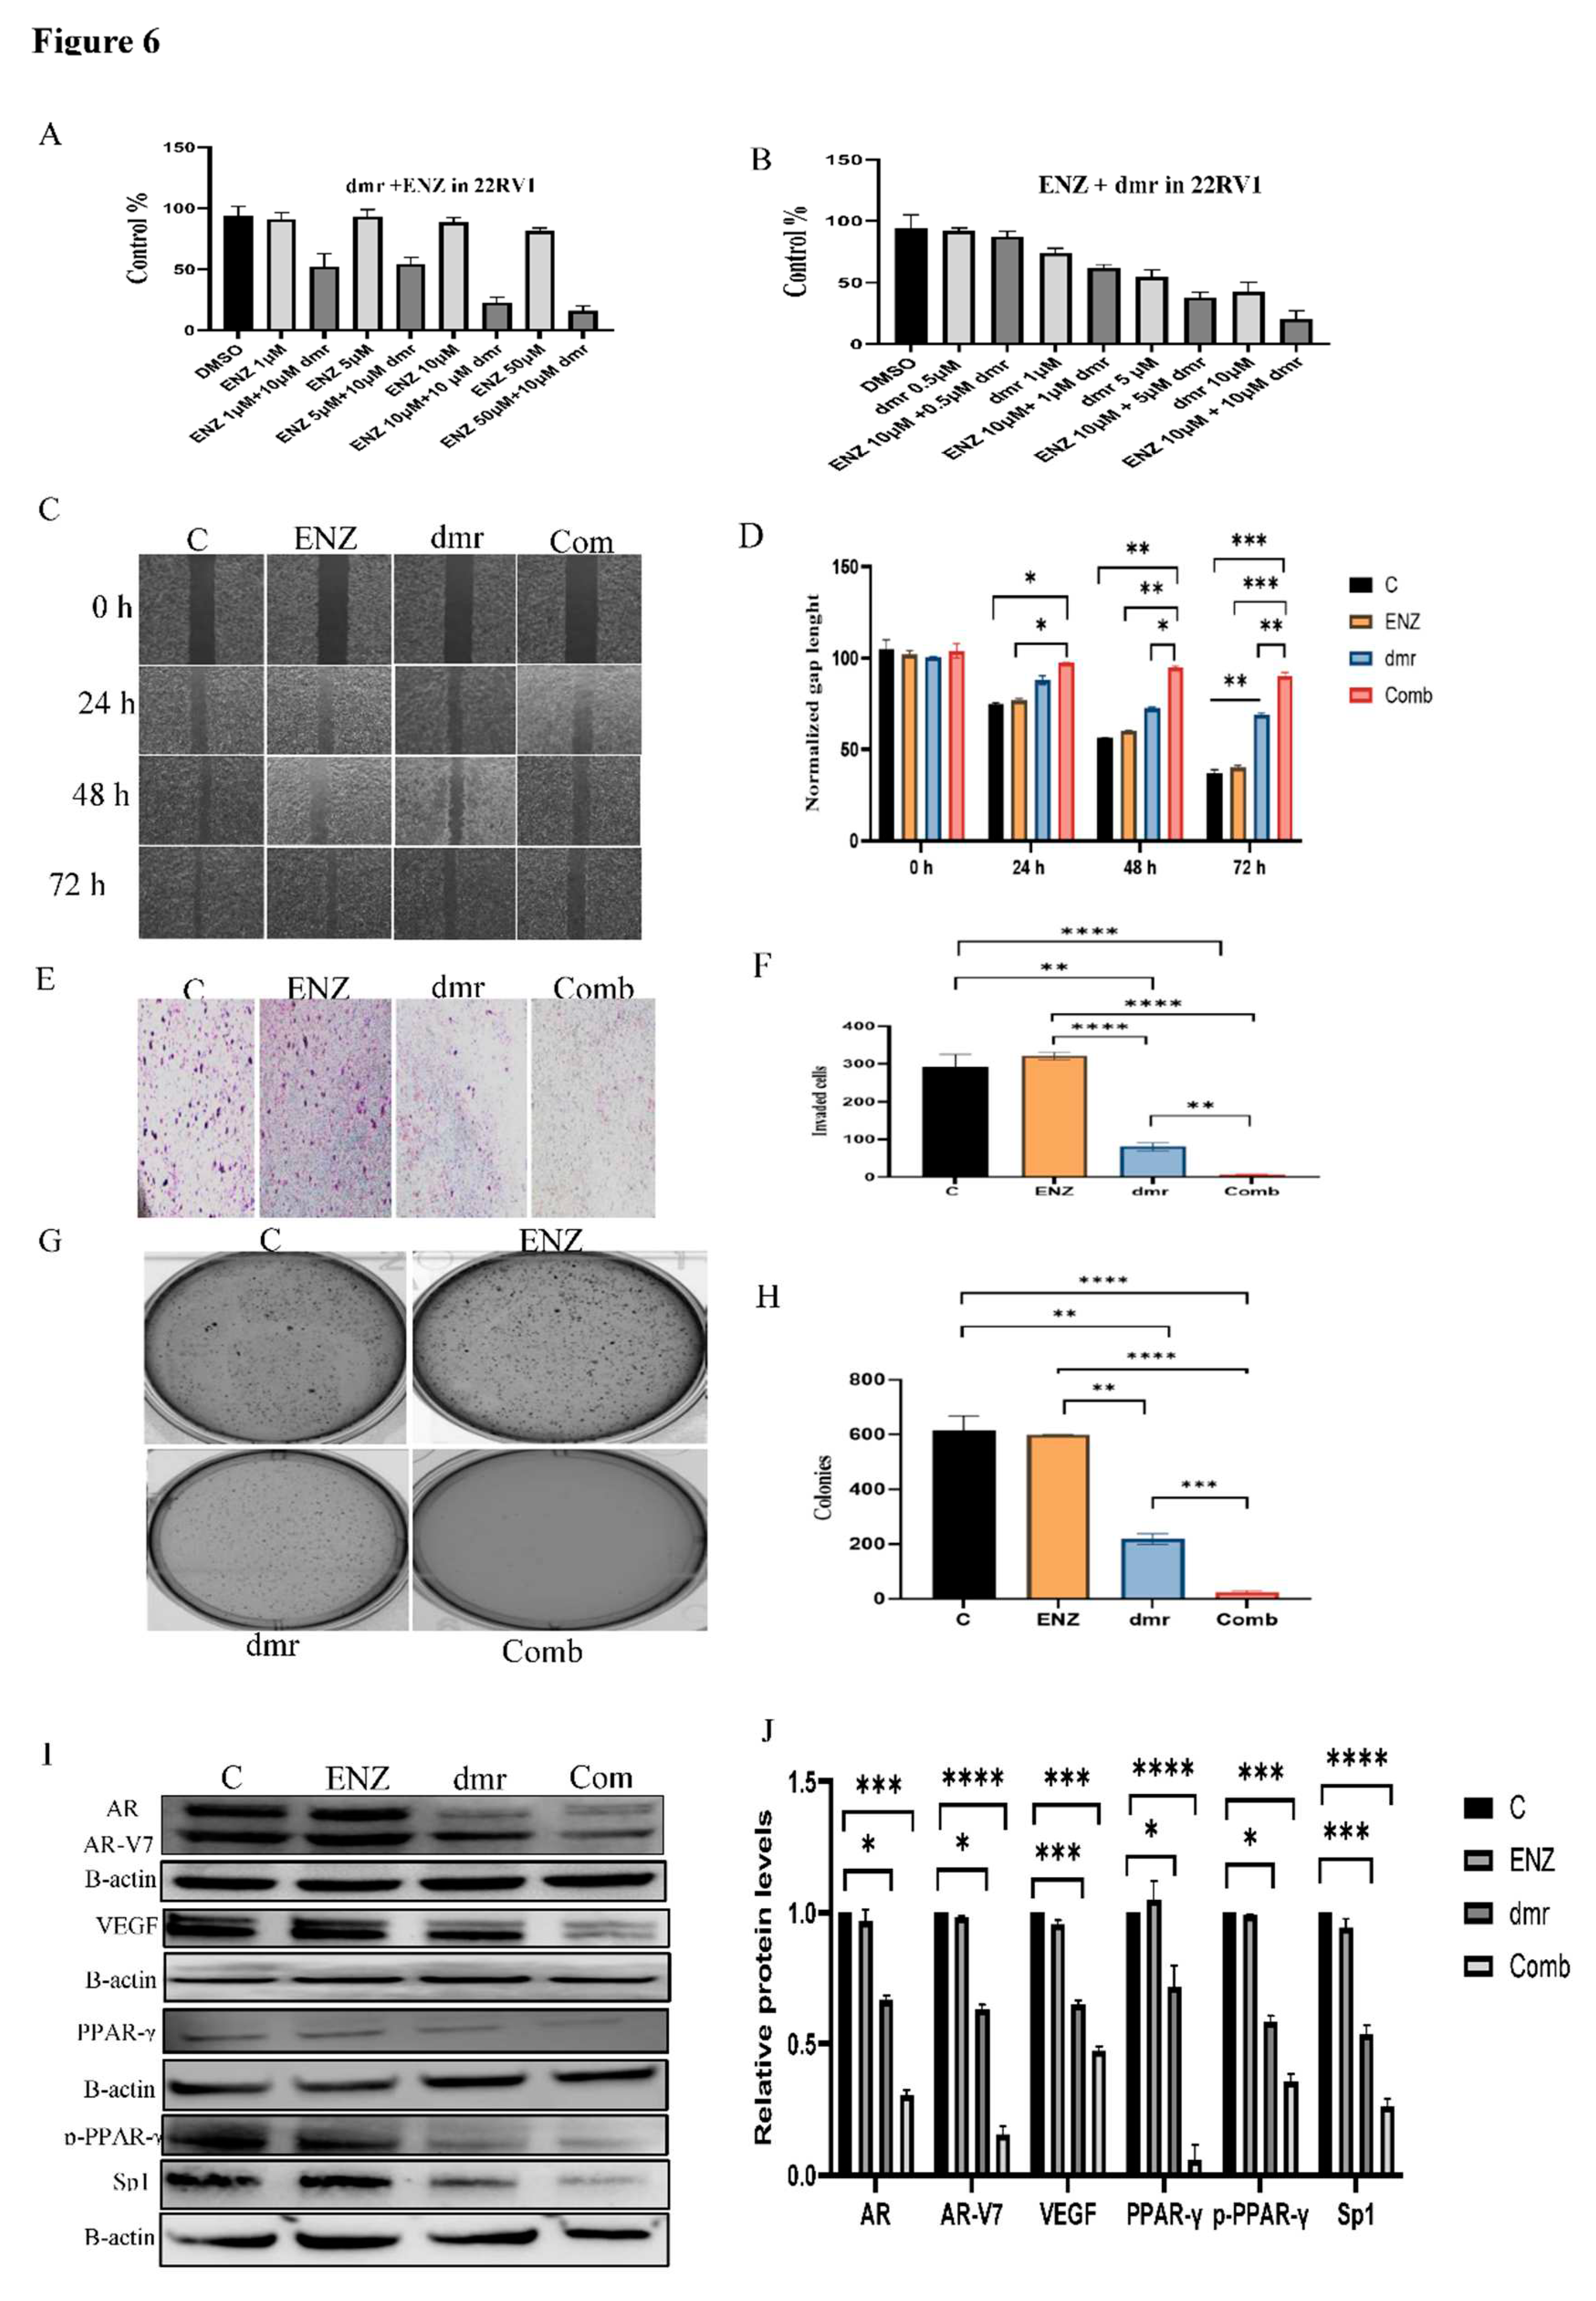
Figure 7.
The effect of dmrFABP5 on the tumor-suppression activity of enzalutamide in LNCaP cells. A), the effect on cell viability produced by the fixed dose of dmrFABP5 combined with different doses of enzalutamide. B), the effect on cell viability produced by the fixed dose of enzalutamide combined with different doses of dmrFABP5. C), the effect of dmrFABP5 combined with enzalutamide on cell migration ability and, D) its quantitative assessment. E), the effect of dmrFABP5 combined with enzalutamide on the cell invasion and, F) the quantitative assessment on its relative levels. G), the effect of dmrFABP5 combined with enzalutamide on cell anchorage-independent growth and, H) the quantitative assessment on cell colony numbers. Each experiment was performed in triplicates and the data was presented as mean ± SE; Student t-test was used to compare the means. *P<0.05, **P <0.001, ***P <0.0001. C=Control, Enz= enzalutamide, dmr=dmrFABP5, Com=Combination of both dmr and Enz.
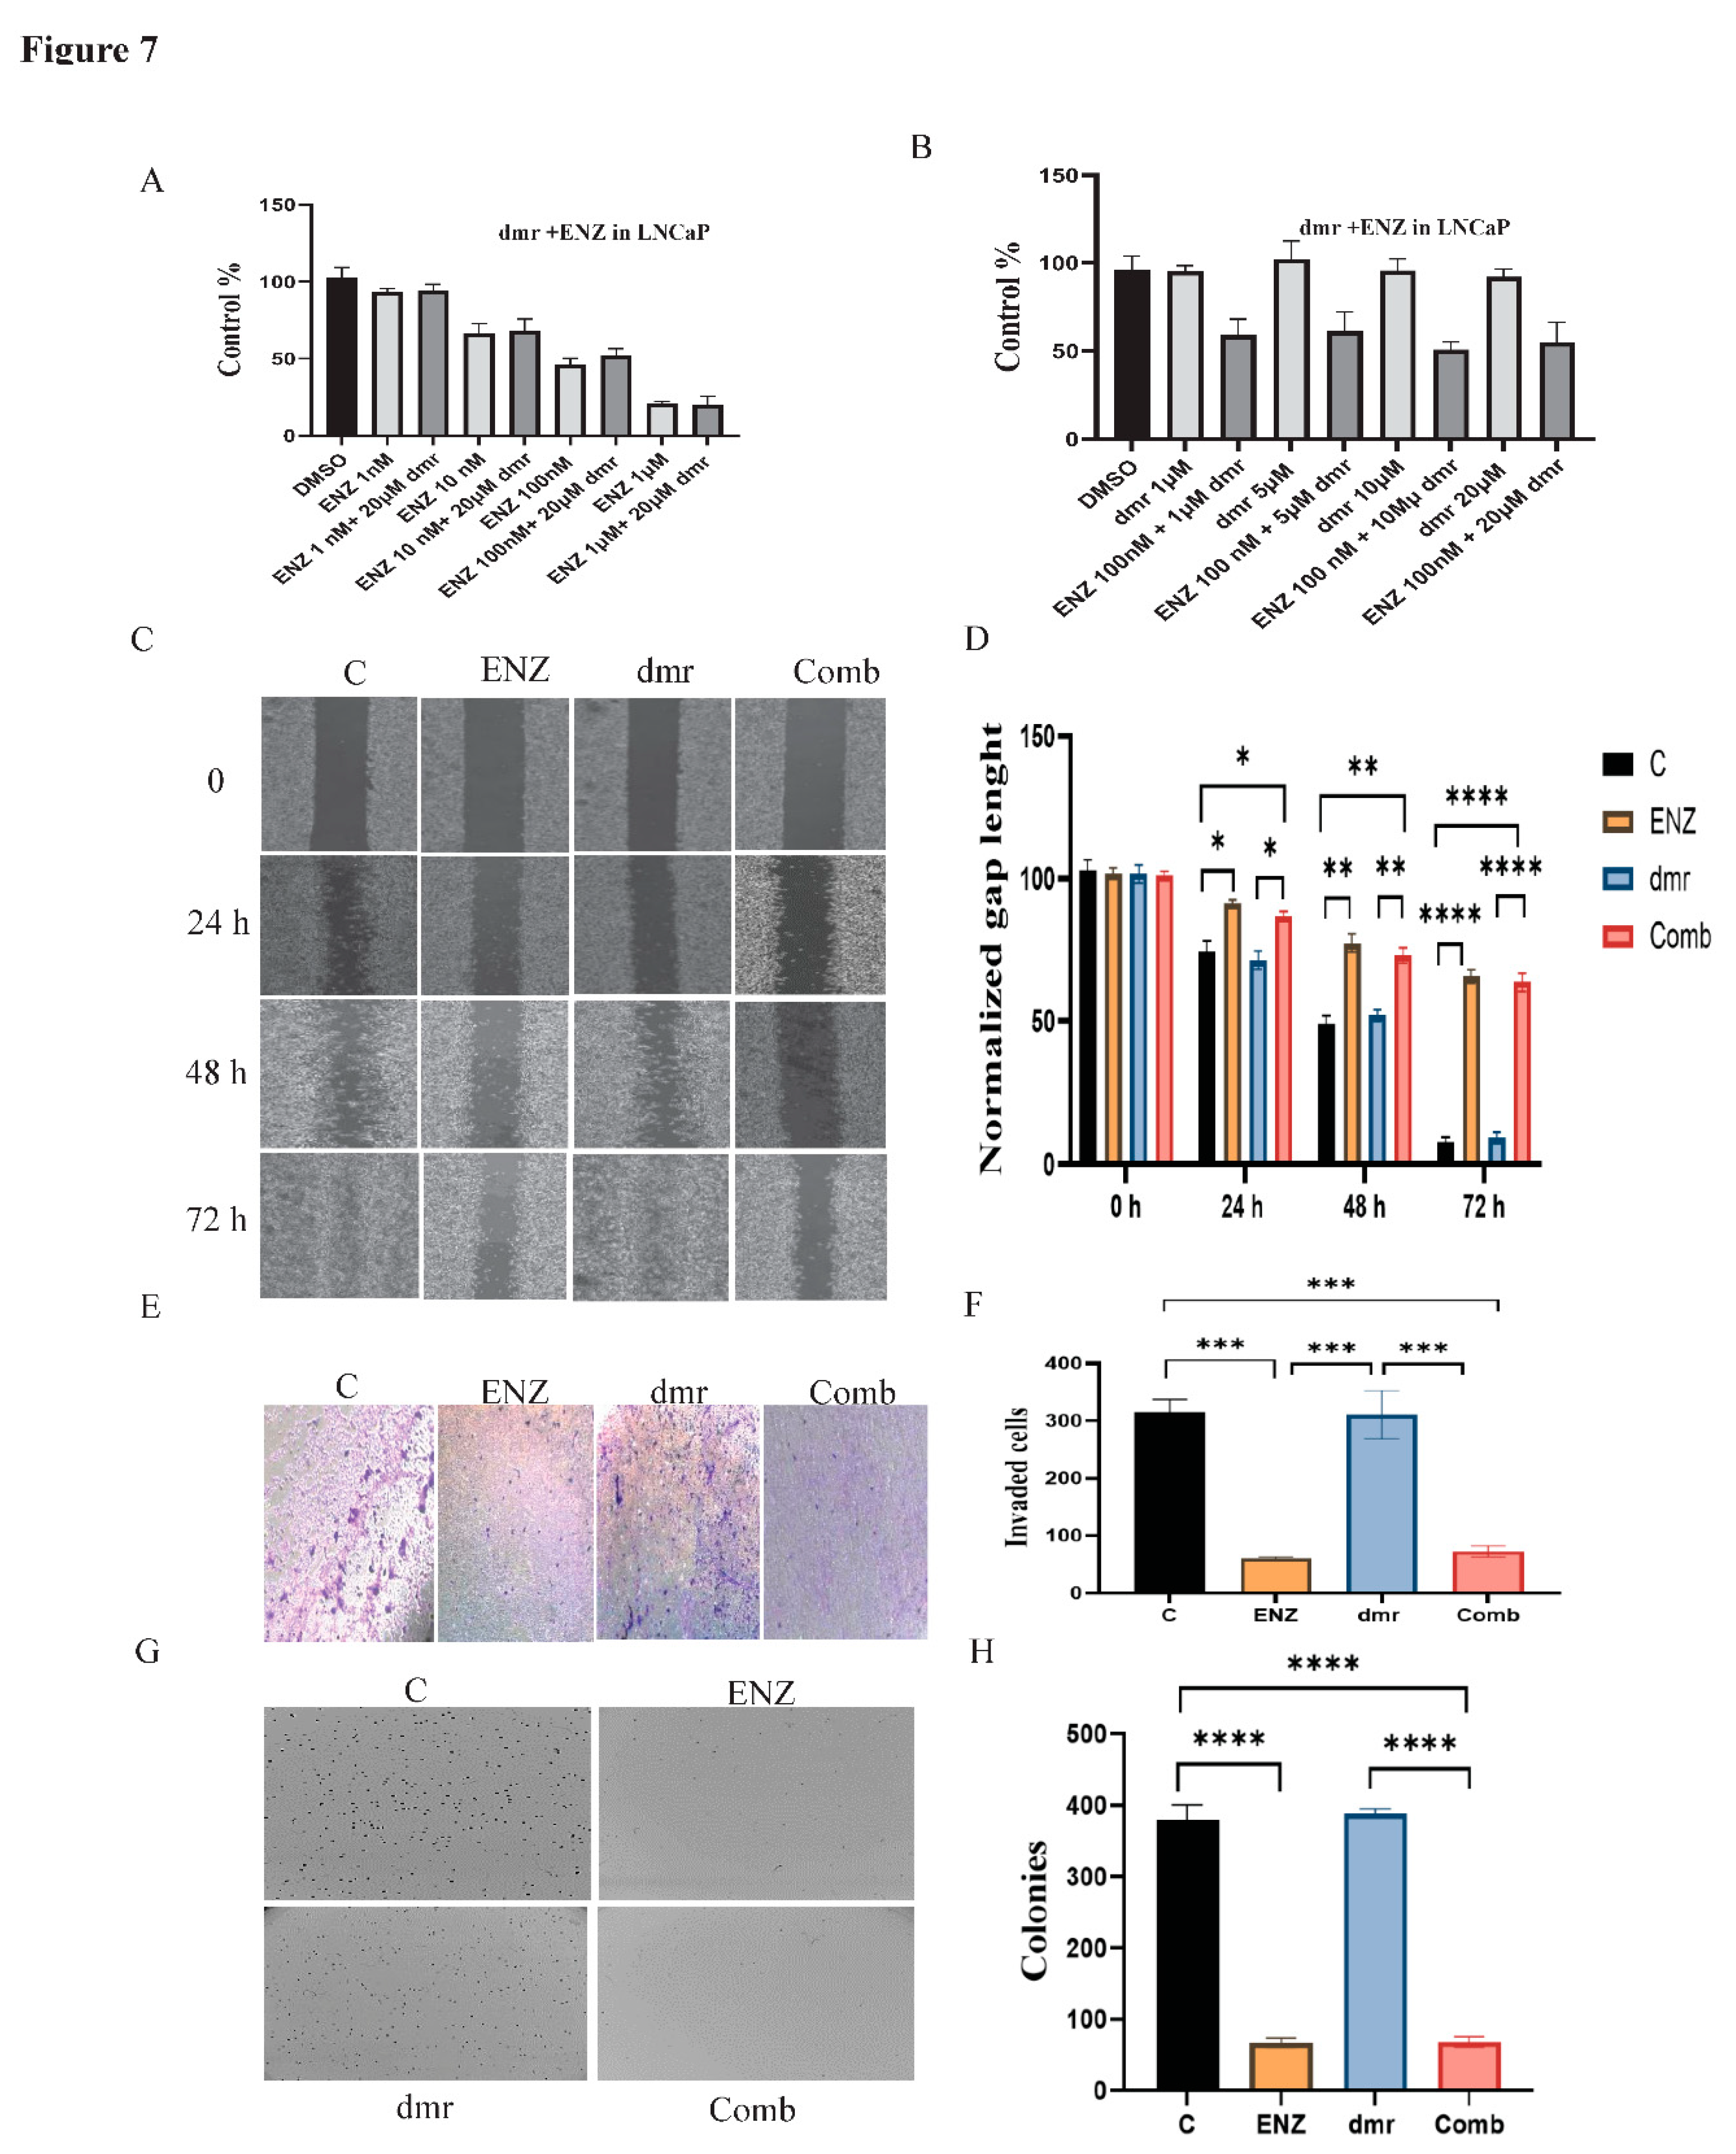
Disclaimer/Publisher’s Note: The statements, opinions and data contained in all publications are solely those of the individual author(s) and contributor(s) and not of MDPI and/or the editor(s). MDPI and/or the editor(s) disclaim responsibility for any injury to people or property resulting from any ideas, methods, instructions or products referred to in the content. |
© 2023 by the authors. Licensee MDPI, Basel, Switzerland. This article is an open access article distributed under the terms and conditions of the Creative Commons Attribution (CC BY) license (http://creativecommons.org/licenses/by/4.0/).
Copyright: This open access article is published under a Creative Commons CC BY 4.0 license, which permit the free download, distribution, and reuse, provided that the author and preprint are cited in any reuse.


