
Submitted:
07 July 2023
Posted:
11 July 2023
You are already at the latest version
Abstract
There is a have been positive correlations between the existence of type 2 diabetes mellitus (T2DM) and the development of thyroid disorders. Prediabetes is a progressive state of moderate insulin resistance that often precedes the onset of type 2 diabetes mellitus (TT2DM) however the association between prediabetes and thyroid function is unknown. This study assessed changes in markers of thyroid function in diet-induced prediabetes. 12 male Sprague Dawley rats were randomly allocated into two groups. Rats in the non-prediabetic (NPD) group were fed a standard rat diet while rats in the prediabetic (PD) were fed a high-fat high carbohydrate diet for 20 weeks to induce prediabetes. Thereafter, fasting blood glucose levels were measured. Plasma samples were assessed for triiodothyronine (T3), thyroxine (T4), thyroxine peroxidase (TPO) antibody, insulin and glycated haemoglobin (HbA1c) concentrations. The elevated blood glucose, HbA1c and plasma insulin levels coincided with increased T3 and reduced T4 levels in the PD group when compared to the NPD group. There was also an increase in the concentration of TPO antibodies in the PD group. Additionally, there was a significant correlation between the thyroid hormone concentrations and HbA1c levels. In conclusion, these results indicated that there is a positive association between thyroid dysfunction and diet-induced prediabetes.
Keywords:
thyroid hormone
; prediabetes
; triiodothyronine (T3)
; thyroxine (T4)
; thyroid disorder
; hyperglycaemia
; hyperinsulinemia
; Type 2 Diabetes Mellitus (T2DM)
1. Introduction
Type 2 diabetes mellitus (T2DM) is regarded as a metabolic disorder which occurs due to impaired insulin action on target tissues, thus resulting in chronically elevated blood glucose concentrations [1]. There are numerous long-term metabolic complications associated with T2DM [2]. However, several studies have shown that the onset of T2DM complications occurs during the prediabetic state [3,4]. Prediabetes (PD) is regarded as a state of moderate hyperglycaemia during which glycaemic indicators such as impaired fasting glucose, impaired glucose tolerance, elevated glycated haemoglobin (HbA1c), as well as homeostasis model assessment (HOMA-IR) levels are elevated above the normal range but are below the threshold for diagnosis of T2DM [5,6]. In addition, studies have shown that the functions of some metabolic hormones such as insulin, ghrelin, cortisol and aldosterone are impaired in the prediabetic state [7,8,9].
Thyroid hormones, triiodothyronine (T3) and thyroxine (T4), are regulatory hormones which are primarily associated with metabolic function and energy expenditure [10]. These hormones, along with thyroid peroxidase (TPO), are vital components of glucose homeostasis while the dysregulation of thyroid hormones has been found to correlate with reduced insulin sensitivity, metabolic dysfunction and T2DM [11,12]. Plasma creatine and insulin levels have also been used to assess changes in metabolic functions which are associated with irregular thyroid hormone production [13]. Studies have indicated that individuals diagnosed with T2DM are at a higher risk of developing thyroid disorders [14,15]. Both hyperthyroidism and hypothyroidism have been associated with diabetes mellitus, with the latter being the more prevalent diagnosis in T2DM [16]. Studies in our laboratory using a diet-induced prediabetic animal model have shown that the genesis of various endocrine disorders occurs during the prediabetic phase [8,9,17,18]. However, the association between prediabetes and thyroid hormone function remains unknown. In this study, using a diet-induced prediabetic rat model, we sought to determine the changes in some selected markers of thyroid function in prediabetes.
2. Materials and Methods
Animals and Housing
Sprague Dawley male rats (150-180g) bred and housed in the Biomedical Research Unit (BRU) of the University of Kwa-Zulu Natal were used in this study. The animals were kept under standard environmental condition of constant temperature (22±2°C), relative humidity (55±5%), CO2 content (< 5000p.m) and illumination (12h light/dark cycle, with lights on at 7am). The level of noise was kept below 65 decibels and the animals were acclimatized for a period of one week and fed standard chow and water without restriction prior to the induction of prediabetes. All protocols and environmental conditions were in accordance with the use of laboratory animals and approved by the Animal Ethics Committee of the University of KwaZulu Natal (ethics number: AREC/026/017M).
Experimental design
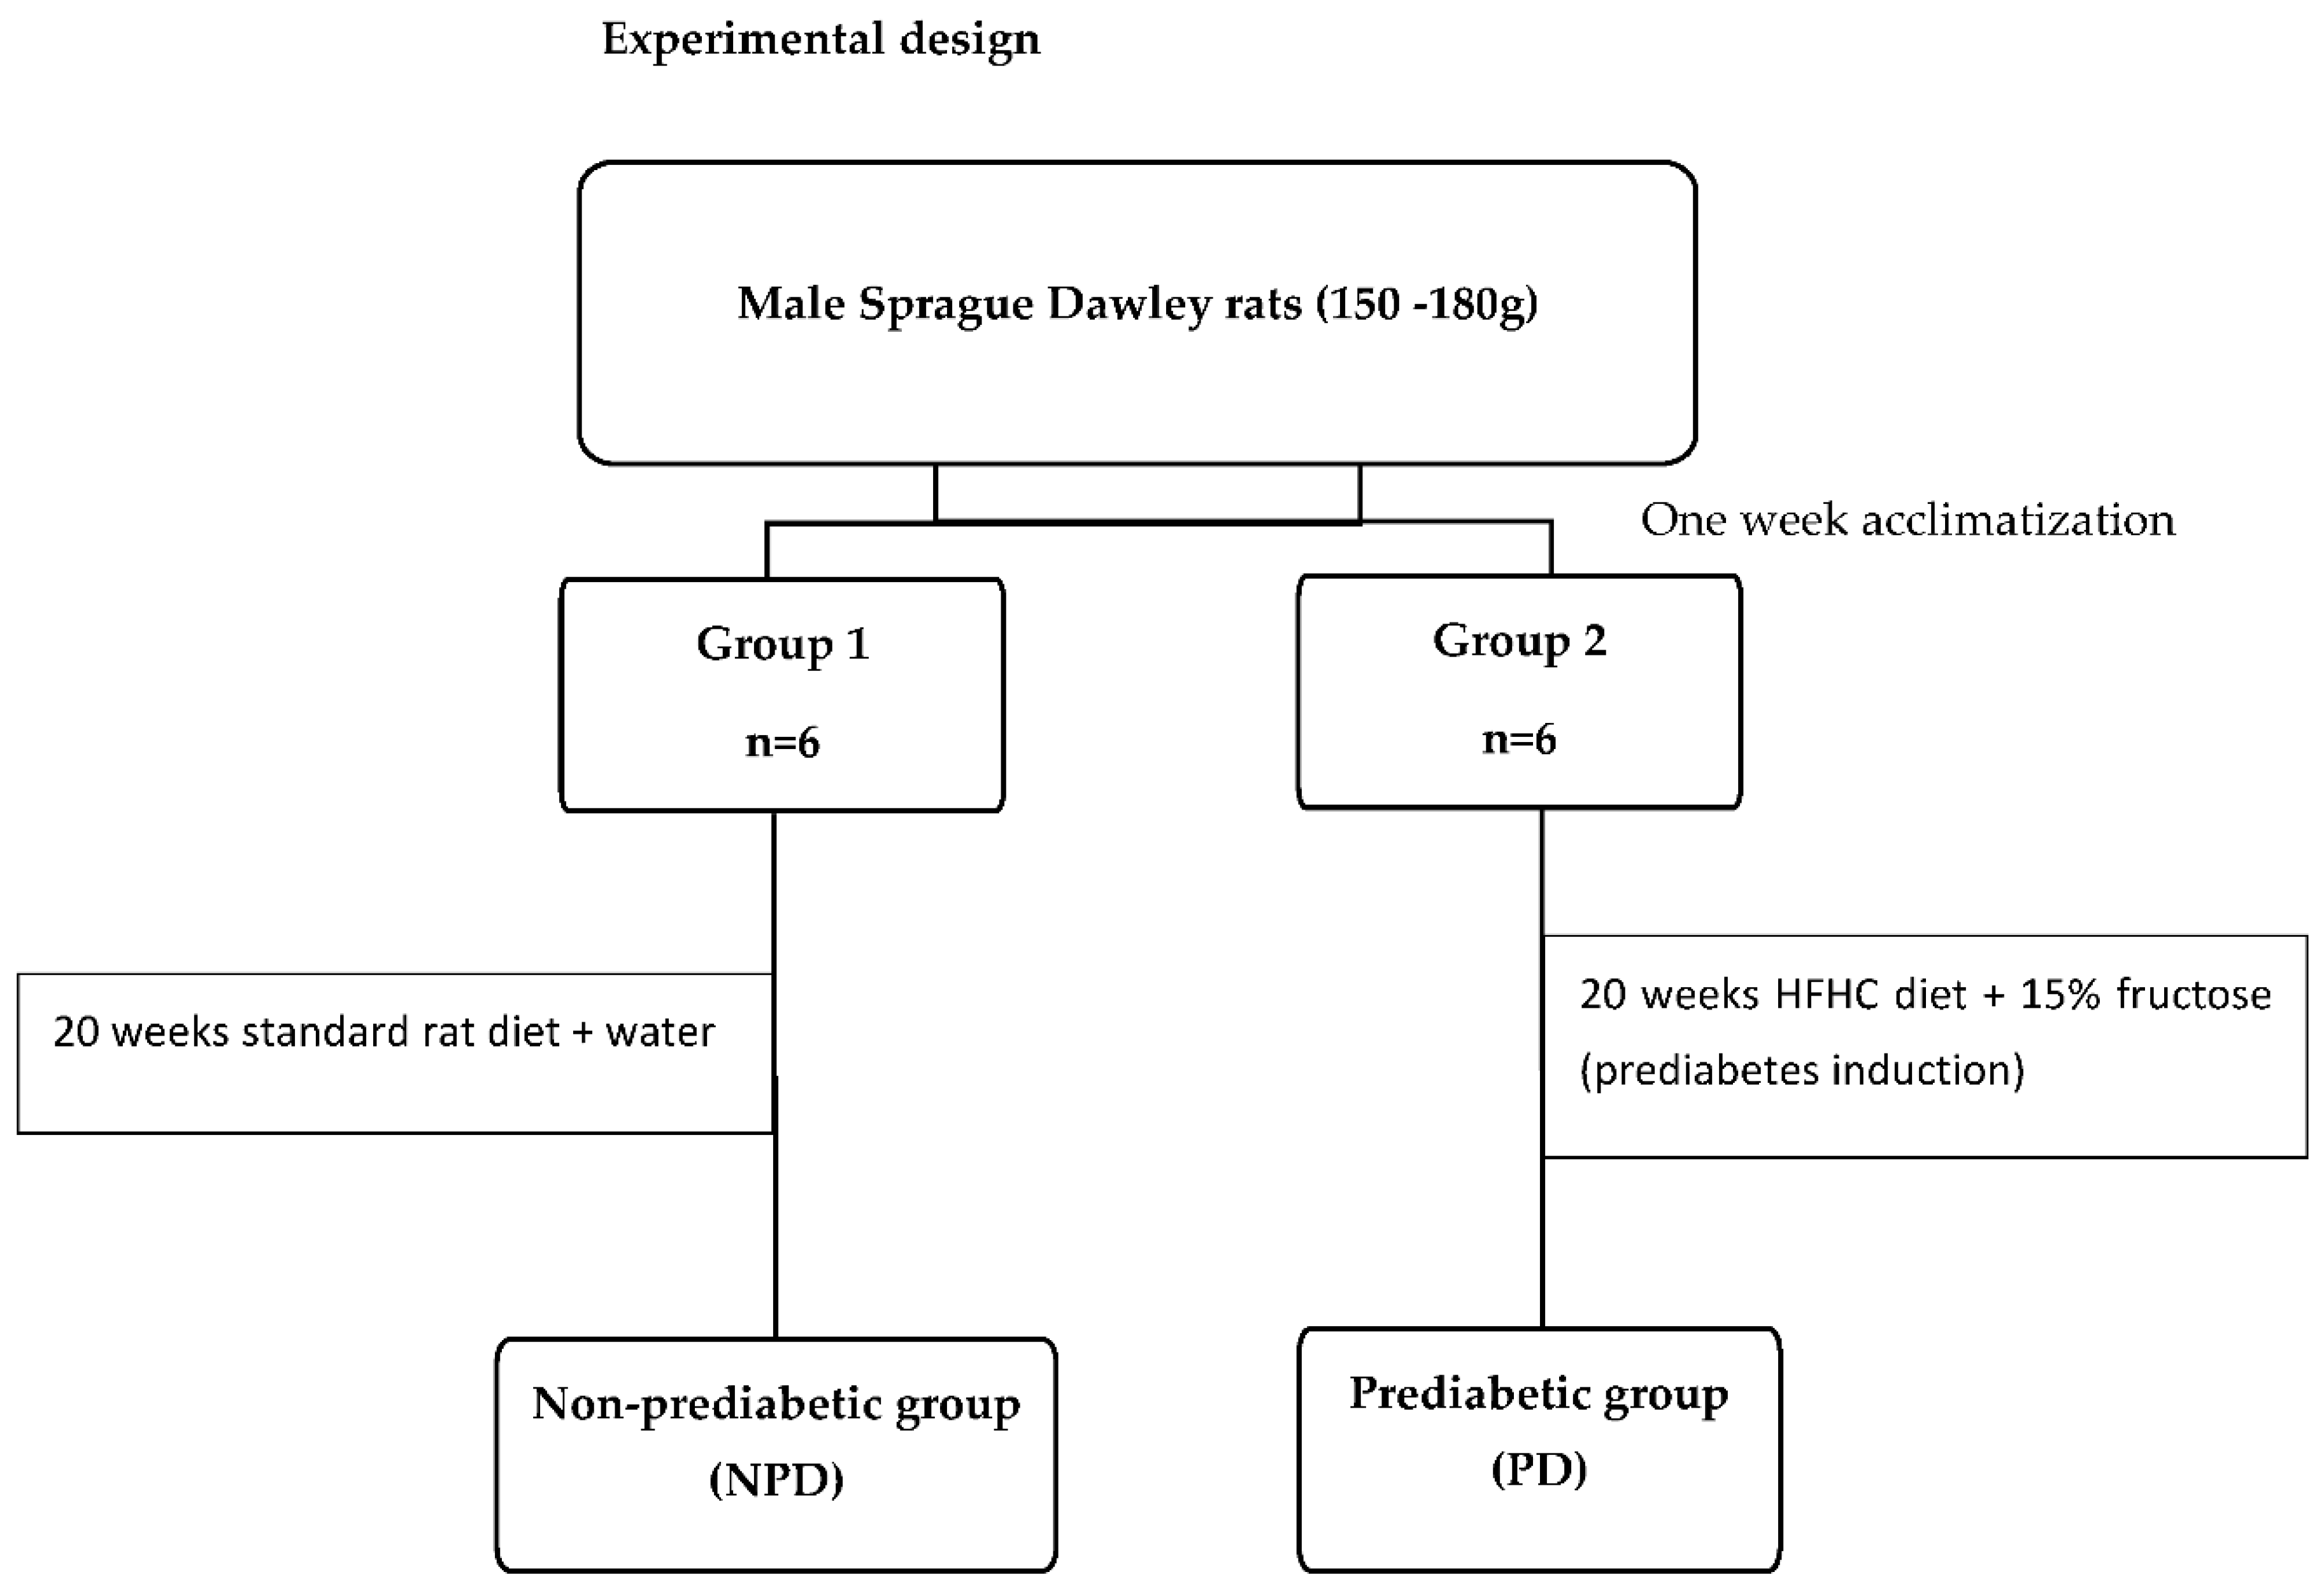
Induction of prediabetes
The induction of prediabetes in the male rats followed a previously described experimental protocol [17]. The animals were assigned randomly into two groups (Group 1 and Group 2) and fed their respective diets for duration of 20 weeks. Group 1, the non-prediabetic control group (NPD) (n=6) were fed standard rat chow and water while Group 2, the prediabetic group (PD) (n=6) were fed the high-fat high-carbohydrate (HFHC) diet supplemented with 15% fructose water. After the 20-week induction period, the American Diabetes Association criteria was used to diagnose prediabetes in the animals. Briefly, animals were fasted for 18 hours before fasting glucose measurements were taken. Animals with a fasting blood glucose concentration of 5.6-7.1 mmol/L, as well as a 2-hour postprandial blood glucose concentration of 7.1- 11.1 mmol/L following an oral glucose tolerance test were considered prediabetic while all measurements below the prediabetic threshold were considered non-prediabetic.
Blood Collection
After the experimental period, all the animals were placed in a gas chamber (Biomedical Resource Unit, UKZN, South Africa) which was anaesthetized with 100mg/kg of Isofor (Safeline Pharmaceuticals (Pty) Ltd, Roodeport, South Africa) for a duration of 3 minutes. Whilst in an unconscious state, cardiac puncture was used to collect blood samples from the animals into separate pre-cooled heparinized sample bottles. Other blood samples were collected into separate sample heparinized bottles and centrifuged (Eppendorf centrifuge 5403, Germany) at 4°C, 503g for 15 minutes to obtain plasma. The plasma was then stored at -80°C in a Bio Ultra freezer (Snijers Scientific, Holland) until biochemical analysis was conducted.
Biochemical Analysis
The blood glucose was measured by using One-Touch glucometer (Lifescan, Mosta, Malta, United Kingdom) through the tail-prick method. The glycated haemoglobin (HbA1c), insulin, thyroid stimulating hormone (TSH), thyroxine (T4) triiodothyronine (T3) and thyroid peroxidase (TPO) antibody concentrations were determined by using their respective ELISA kits (Elabscience Biotechnology Co., Ltd., Houston, TX, USA) as instructed by the manufacturer’s specifications. Briefly, the ELISA kits contained micro-ELISA plates that were coated with antibodies according to the standard experimental protocol. The plasma samples were pipetted into their specified wells and the appropriate biotinylated detection antibody (50µl) was subsequently added. The samples were then incubated at 37°C for a duration of 45 minutes, after which the unbound constituents were removed using the wash buffer supplied. Post-washing, 100µL of Avidin-horseradish peroxidase (HRP) was added to the micro-plates and incubated for 30 minutes at 37°C. A second wash step removed the unbound constituents after which the substrate reagent (90µl) was added to the wells, followed by an incubation period of 15 minutes at 37°C. Finally, a stop solution (50µl) was added to the micro-wells to halt the reaction, so that the appropriate measurements could be taken. The optical densities were measured spectrophotometrically at a wavelength of 450nm using a nano spectrophotometer (BMG Labtech, Ortenburg, Germany). The concentrations of the plasma insulin, TSH, T3, T4 and TPO antibodies within the samples were extrapolated from their respective standard curves.
Statistical Analysis
All the data obtained from the experiment were expressed as means ± SEM. Statistical comparisons were performed by using Graph Pad In Stat Software (version 5.00, Graph Pad Software, Inc., San Diego, California, USA). To determine the differences between the two groups, unpaired independent t-tests were used. Pearson’s correlation analysis was used to determine the associations between the glycated haemoglobin and triiodothyronine (T3)/ thyroxine (T4) hormones. A value of p < 0.05 was considered statistically significant. A coefficient value between ±0.5 and ±1.0 was considered significant.
3. Results
Plasma Thyroid Stimulating Hormone (TSH)
At the end of the 20-week induction period, plasma thyroid stimulating hormone (TSH) concentration was measured in the non-prediabetic (NPD) and prediabetic (PD) groups. The results (Figure 1) showed that the PD group had a significantly (p=0.002) increased concentration of TSH compared to the NPD group.
Plasma Thyroxine (T4) and Triiodothyronine (T3)
Plasma thyroxine (T4) and triiodothyronine (T3) hormone concentrations were analysed at the end of the 20-week induction period in both the non-prediabetic (NPD) and the prediabetic (PD) groups. The results (Figure 2) showed that the PD group had a significantly (p=0.001) lower T4 concentration in comparison to the NPD group while the T3 concentration in the PD group was significantly (p=0.002)* higher in comparison to the NPD group.
Plasma thyroid peroxidase (TPO) antibody
Plasma thyroid peroxidase (TPO) antibody concentrations were analyzed at the end of the 20-week induction period in both the non-prediabetic control group (NPD) and the prediabetic group (PD). The results (Figure 3) showed that the PD group had a significantly higher TPO antibody concentration (p=0.001), in comparison to the NPD group.
Plasma Creatinine
Plasma creatinine concentrations were analysed at the end of the 20-week induction period in both the non-prediabetic control group (NPD) and the prediabetic group (PD). The results (Figure 4) showed that the PD group had significantly (p=0.01) lower plasma creatinine concentration by comparison to the NPD group.
Plasma insulin and glycated hemoglobin
Plasma insulin concentrations and glycated hemoglobin (HbA1c) concentrations of non-prediabetic control group (NPD) and pre-diabetic group (PD) were determined at the end of the experimental period (Table 1). The insulin and HbA1c concentrations significantly increased in the prediabetic group in comparison to the non-prediabetic group#.
HbA1c and thyroid hormones (T3 and T4) correlation
As indicated in Table 2, HbA1c concentrations were shown to have a positive correlation (r = 0.8122) with T3 plasma concentration and a negative correlation (r = -0.8238) with T4 plasma concentration in the prediabetic (PD) group. Therefore, as HbA1c concentration increased, the T3 plasma concentration increased while the T4 plasma concentration decreased. However, there was insignificant correlation between HbA1c and T3 concentrations as well as the T4 concentration in non-prediabetic (NPD) group#
4. Discussion
The association between T2DM and thyroid dysfunction has been extensively studied[13]. Several studies have not only identified prediabetes as the period that precedes the onset of overt type 2 diabetes but also a period where numerous complications associated with T2DM begin [3,19]. Thyroid hormones play a regulatory role in glucose homeostasis, metabolic function and energy expenditure [10]. There have been several studies that have investigated changes in thyroid function during T2DM [11,12]. However, no studies have been conducted to investigate thyroid function during the prediabetic phase. In our laboratory, the HFHC diet-induced prediabetic rat model was used to mimic the human prediabetic condition [17]. Using this animal model, we investigated thyroid function during the prediabetic state.
The thyroid hormones, triiodothyronine (T3) and thyroxine (T4) have an imperative function in both metabolic and protein synthesis pathways [20]. Previous studies have shown that individuals diagnosed with T2DM often present with supraphysiological concentrations of insulin, coupled with a dysregulation in the plasma levels of thyroid hormones [21]. The synthesis of thyroid hormones requires the cumulative effort of the thyroid gland, regulated biochemical signaling cascades and sufficient dietary iodine intake [22]. The hypothalamic-pituitary-thyroid axis (HPT-axis) is stimulated to regulate the excitatory and inhibitory signals which trigger the production of the thyroid hormones. Thyroid stimulating hormone (TSH), released from the anterior pituitary gland, is the primary stimulator of thyroid hormone synthesis [23]. The release of TSH is stimulated by thyroid releasing hormone (TRH) from the hypothalamus, both of which are regulated via the negative feedback loops that acts on the HPT axis [24]. Studies have shown that impairment of these feedback loops result in increased release of both T3 and T4 hormone production simultaneously [25,26]. In this study, the T3 levels were found to be elevated in the prediabetic group whereas the T4 levels were reduced. These findings were supported by previous literature which showed that a subsequent increase in T3 hormone production coincided with a reduction in T4 production [27]. This imbalance in hormone synthesis is suspected to arise from the thyroid gland itself rather than the HPT axis [27]. The synthesis of thyroid hormones requires a multi-step process along with vital metabolic and cellular constituents. This intricate process is initiated by the binding of TSH to the TSH-receptor on the surface of the follicular cell within the thyroid gland. Once the receptor-ligand complex has formed, an intracellular signalling cascade is stimulated thus, leading to the synthesis of T3 and T4 [28]. The major constituents of thyroid hormones are tyrosine and iodine. A key enzyme in the synthesis of thyroid hormones is thyroid peroxidase (TPO) which has multiple functions in the synthesis pathway. It is responsible for the formation of iodine by oxidizing the iodide ions as well as initiating the formation of covalent bonds between the iodide and the thyroglobulin [29]. This covalent bonding ultimately leads to the synthesis of monoiodotryrosine (MIT) and diiodotyrosine (DIT), depending on their single or double iodinated state [30]. TPO then regulates the generation of T4 by coupling two DIT residues or T3 by coupling a DIT with a MIT.
Studies have identified T4 as the more abundant thyroid hormone as TPO is predisposed to promote the coupling of DIT-to-DIT residues rather than the alternative DIT to MIT [31]. Thus, a reduction in T4 hormone production may be attributed to the simultaneous reduction in TPO enzyme synthesis or function. Therefore, the results of this study corroborated with that of previous literature as the plasma T4 levels were significantly reduced in the prediabetic group along with an increase in TPO antibody production. TPO enzyme function is disrupted by the production of TPO antibodies which are synthesized by the lymphocytes of the autoimmune system [32]. Thyrocyte destruction precedes the action of TPO antibodies as they exert an intracellular inhibitory effect on the TPO enzymes and their associated signalling cascade [33]. TPO antibodies competitively inhibit the action of TPO enzyme activity by forming conformational isotopes of the enzymes which impede its function in the thyroid hormone synthesis pathway. These antibodies also attribute to the fixation of complement which results in the destruction of the thyroid gland [34]. In this study, we found elevated levels of TPO antibody production in the prediabetic group as compared to the non-diabetic group. A previous study has shown that there is dysregulation of immune function during the prediabetic state leading to an elevation of lympohycytes [18]. We therefore speculate that the reduction in TPO enzyme activity may be attributed to the increase in TPO antibody production, thus the thyroid hormone synthesis pathways favored the deionization of T4 to T3 in response to the diminished hormone production.
The reduction in the T4 hormone concentration leads to the reduced function of the thyroid gland [35]. This leads to a reduction in circulating T4 levels resulting in diminished biological function [36]. One such physiological function is that of protein synthesis. In a previous study, elevated levels of thyroid hormone were found to correlate with the destruction of protein stores from skeletal muscle [37]. Thus, an inference can be made regarding the reduced creatinine levels which form as a by-product of protein degradation in the prediabetic group as the reduction in T4 would subsequently enhance the synthesis and degradation of proteins. A previously published study showed no significant changes in glomerular filtration during the prediabetic state thus eliminating hyperfiltration as a possible cause for the reduction in creatinine levels [38]. The reduced plasma creatinine observed in the prediabetic group may therefore be an indicator of reduced protein synthesis, preceded by the reduction in thyroid hormone activity [39].
Another imperative function of thyroid hormones is to facilitate the breakdown of insulin [21]. Previous studies have found a correlation between insulin resistance and thyroid disorders. Thyroid hormones have been found to impede the action of insulin whilst stimulating the hepatic gluconeogenesis [40,41]. The increase in plasma insulin observed in the prediabetic group may be due to the diminished activity of the circulating thyroid hormones. Thus, there is hyperinsulinemia as well as increased insulin half-life which promotes insulin resistance [12]. This may be a compensatory mechanism that arises due to the cells’ failure to respond to insulin leading to a fall in T4 concentrations thus ensuring higher insulin concentrations. Also, studies have found a positive correlation between elevated T3 levels and insulin resistance [42]. T3 was found to be actively involved in the regulation of metabolic transcription factors which are attributed to insulin resistance [43,44]. In this study, we found elevated T3 levels in the prediabetic state. This suggests that thyroid dysfunction in the prediabetic state may contribute to the progression of prediabetes to overt type 2 diabetes. Since T4 is the more abundant thyroid hormone, a reduction in its plasma concentration may suggest the onset of a thyroid disorder. On the other hand, the increase in the biologically active T3 hormone, may be due to the impediment of the TPO enzyme leading to the over activity of the deiodinase system resulting in an increase in T3 production [45]. The interaction between the concentration of the thyroid hormones along with their downstream enzymes, metabolic and biosynthetic pathways, attests to the importance of the thyroid and the consequences of its dysfunction.
Moreover, in this study, there was increased glycated haemoglobin (HbA1c) in correlation with increased T3 and decreased T4 concentration in prediabetic rats while this was not observed in non-prediabetic rats. One of the characteristics of prediabetes is elevated HbA1c which has been associated with insulin resistance. As discussed above, the increase in T3 or decrease in T4 production may be a compensatory mechanism to alleviate insulin resistance in prediabetic condition. Therefore, we may suggest that the compensatory mechanism engendered the observed positive correlation of HbA1c with T3 and negative correlation of HbA1c with T4 in the prediabetic rats. However, the limitation of this study is the absence of molecular and cellular changes that occur in the thyroid gland following prediabetes, therefore, future studies are needed to be carried out in these areas.
5. Conclusions
In conclusion, previous studies had shown the associations between thyroid hormone dysregulation in overt type 2 diabetes. This study has shown for the first time, using a diet-induced prediabetic animal model, that these thyroid hormone dysregulations also occur in prediabetes, the condition that often precedes the onset of type 2 diabetes. In this study, there was a positive correlation between diet-induced prediabetes and thyroid dysfunction. This is evidenced by the notable increase in triiodothyronine (T3) and subsequent decrease in thyroxine (T4) hormone concentrations as HbA1c increase in the prediabetic state. This observed dysregulation of thyroid hormones was further evidenced by the increased production of TPO antibodies. Taken together, the finding of this study suggest that thyroid hormone homeostasis is disrupted during prediabetes and this warrants more research on the thyroid hormone synthesis pathway within the thyroid gland.
Author Contributions
Conceptualization, M.P and A.K.; methodology, M.P, P.M., A.A., N.H.S., P.N. and A.K.; software, M.P, P.M., A.K.; validation, M.P., P.N., N.S and A.K.; formal analysis, M.P and A.K.; investigation, M.T., P.M., A.A., N.S., P.N. and A.K. ; resources, A.K.; data curation, M.P., P.M., A.A.; writing—original draft preparation, M.P; writing—review and editing, M.P, P.M., A.A., N.S., P.N. and A.K.; supervision, P.N., N.S. and A.K.; project administration A.K.; funding acquisition, A.K. All authors have read and agreed to the published version of the manuscript.
Funding
This research was funded by National Research Foundation (NRF) (grant 106041) and the APC was funded by University of KwaZulu Natal College of Health Science.
Institutional Review Board Statement
The animal study protocol was approved by the Institutional Animal Research Ethics Committee of University of KwaZulu-Natal UKZN (protocol code AREC/026/017M).
Informed Consent Statement
Not applicable.
Data Availability Statement
The data presented in this study are available on request from the corresponding author.
Acknowledgments
The authors acknowledge Mr Dennis Makhubela from the physiology department for laboratory assistance and the personnel at the UKZN Biomedical Resource Unit for their technical assistance.
Conflicts of Interest
The authors declare no conflict of interest. The funders had no role in the design of the study; in the collection, analyses, or interpretation of data; in the writing of the manuscript; or in the decision to publish the results.
References
- Punthakee, Z.; Goldenberg, R.; Katz, P. Definition, classification and diagnosis of diabetes, prediabetes and metabolic syndrome. Can. J. Diabetes 2018, 42, S10–S15. [Google Scholar] [CrossRef] [PubMed]
- Shah, A.; Kanaya, A.M. Diabetes and associated complications in the South Asian population. Curr. Cardiol. Rep. 2014, 16, 1–16. [Google Scholar] [CrossRef] [PubMed]
- Dorcely, B.; Katz, K.; Jagannathan, R.; Chiang, S.S.; Oluwadare, B.; Goldberg, I.J.; Bergman, M. Novel biomarkers for prediabetes, diabetes, and associated complications. Diabetes Metab. Syndr. Obes. Targets Ther. 2017, 345–361. [Google Scholar] [CrossRef]
- Tuso, P. Prediabetes and lifestyle modification: time to prevent a preventable disease. Perm. J. 2014, 18, 88. [Google Scholar] [CrossRef] [PubMed]
- Bansal, N. Prediabetes diagnosis and treatment: A review. World J. Diabetes 2015, 6, 296. [Google Scholar] [CrossRef] [PubMed]
- Yip, W.C.; Sequeira, I.R.; Plank, L.D.; Poppitt, S.D. Prevalence of pre-diabetes across ethnicities: a review of impaired fasting glucose (IFG) and impaired glucose tolerance (IGT) for classification of dysglycaemia. Nutrients 2017, 9, 1273. [Google Scholar] [CrossRef]
- Akinnuga, A.M.; Siboto, A.; Khumalo, B.; Sibiya, N.H.; Ngubane, P.; Khathi, A. Evaluation of the effects of bredemolic acid on selected markers of glucose homeostasis in diet-induced prediabetic rats. Arch. Physiol. Biochem. 2022, 128, 306–312. [Google Scholar] [CrossRef]
- Mkhize, B.C.; Mosili, P.; Ngubane, P.S.; Sibiya, N.H.; Khathi, A. Diet-induced prediabetes: Effects on the activity of the renin–angiotensin–aldosterone system in selected organs. J. Diabetes Investig. 2022, 13, 768–780. [Google Scholar] [CrossRef]
- Mosili, P.; Mkhize, B.C.; Ngubane, P.; Sibiya, N.; Khathi, A. The dysregulation of the hypothalamic–pituitary–adrenal axis in diet-induced prediabetic male Sprague Dawley rats. Nutr. Metab. 2020, 17, 1–12. [Google Scholar] [CrossRef]
- Mullur, R.; Liu, Y.-Y.; Brent, G.A. Thyroid hormone regulation of metabolism. Physiol. Rev. 2014. [Google Scholar] [CrossRef]
- Makandar, A.; Sonagra, A.D.; Shafi, N. Study of thyroid function in type 2 diabetic and non-diabetic population. Int. J. Med. Sci. Public Health 2015, 4, 769–772. [Google Scholar] [CrossRef]
- Ahmed, R. Thyroid-insulin dysfunction during development. Int. J. Res. Stud. Zool. 2017, 3, 73–75. [Google Scholar]
- Zhao, W.; Li, X.; Liu, X.; Lu, L.; Gao, Z. Thyroid function in patients with type 2 diabetes mellitus and diabetic nephropathy: a single center study. J. Thyroid. Res. 2018, 2018. [Google Scholar] [CrossRef] [PubMed]
- Jali, M.; Kambar, S.; Jali, S.M.; Pawar, N.; Nalawade, P. Prevalence of thyroid dysfunction among type 2 diabetes mellitus patients. Diabetes Metab. Syndr. Clin. Res. Rev. 2017, 11, S105–S108. [Google Scholar] [CrossRef] [PubMed]
- Subekti, I.; Pramono, L.A.; Dewiasty, E.; Harbuwono, D.S. Thyroid dysfunction in type 2 diabetes mellitus patients. Acta Medica Indones. 2018, 49. [Google Scholar]
- Nishi, M. Diabetes mellitus and thyroid diseases. Diabetol. Int. 2018, 9, 108–112. [Google Scholar] [CrossRef]
- Luvuno, M.; Mbongwa, H.; Khathi, A. Development of a novel prediabetes animal model using a high fat high carbohydrate diet: Implications for type 2 diabetes. PloS ONE 2017, 13, 8–14. [Google Scholar]
- Mzimela, N.C.; Ngubane, P.S.; Khathi, A. The changes in immune cell concentration during the progression of pre-diabetes to type 2 diabetes in a high-fat high-carbohydrate diet-induced pre-diabetic rat model. Autoimmunity 2019, 52, 27–36. [Google Scholar] [CrossRef]
- Gamede, M.; Mabuza, L.; Ngubane, P.; Khathi, A. The effects of plant-derived oleanolic acid on selected parameters of glucose homeostasis in a diet-induced pre-diabetic rat model. Molecules 2018, 23, 794. [Google Scholar] [CrossRef]
- Carvalho, D.P.; Dupuy, C. Thyroid hormone biosynthesis and release. Mol. Cell. Endocrinol. 2017, 458, 6–15. [Google Scholar] [CrossRef]
- De Vito, P.; Candelotti, E.; G Ahmed, R.; Luly, P.; J Davis, P.; Incerpi, S.; Z Pedersen, J. Role of thyroid hormones in insulin resistance and diabetes. Immunol. Endocr. Metab. Agents Med. Chem. (Former. Curr. Med. Chem. -Immunol. Endocr. Metab. Agents) 2015, 15, 86–93. [Google Scholar] [CrossRef]
- Rousset, B.; Dupuy, C.; Miot, F.; Dumont, J. Thyroid Hormone Synthesis And Secretion, Endotext. 2015.
- Liu, C.-C.; Dong, Z.-Q.; Zhou, Y.-L.; Liao, Z.-B.; RH, A.; Ming, X.; Guo, J.; Sun, X.-L. Role of HPA and HPT Axis in Anxiety Disorder Complicated with Diabetes Mellitus. Sichuan Da Xue Xue Bao. Yi Xue Ban= J. Sichuan University. Med. Sci. Ed. 2017, 48, 895–899. [Google Scholar]
- Fliers, E.; Bianco, A.C.; Langouche, L.; Boelen, A. Thyroid function in critically ill patients. Lancet Diabetes Endocrinol. 2015, 3, 816–825. [Google Scholar] [CrossRef]
- Annamalai, A. Medical management of psychotropic side effects; Springer, 2017.
- Ramos-Leví, A.M.; Marazuela, M. Pathogenesis of thyroid autoimmune disease: the role of cellular mechanisms. Endocrinol. Y Nutr. 2016, 63, 421–429. [Google Scholar] [CrossRef] [PubMed]
- Sharma, A.N.; Levy, D.L. Thyroid and adrenal disorders. Rosen’s Emergency Medicine: Concepts and Clinical Practice. St. Louis, Mosby 2014, 1676–1693. [Google Scholar]
- Hannoush, Z.C.; Weiss, R.E. Defects of thyroid hormone synthesis and action. Endocrinol. Metab. Clin. 2017, 46, 375–388. [Google Scholar] [CrossRef]
- Vissenberg, R.; Manders, V.; Mastenbroek, S.; Fliers, E.; Afink, G.; Ris-Stalpers, C.; Goddijn, M.; Bisschop, P. Pathophysiological aspects of thyroid hormone disorders/thyroid peroxidase autoantibodies and reproduction. Hum. Reprod. Update 2015, 21, 378–387. [Google Scholar] [CrossRef]
- Summers, R.; Macnab, R. Thyroid, parathyroid hormones and calcium homeostasis. Anaesth. Intensive Care Med. 2017, 18, 522–526. [Google Scholar] [CrossRef]
- Abdalla, S.M.; Bianco, A.C. Defending plasma T3 is a biological priority. Clin. Endocrinol. 2014, 81, 633–641. [Google Scholar] [CrossRef]
- Loh, T.P.; Tee, J.C.S.; Tee, N.W.S.; Cheng, W.L.; Thevarajah, M.; Sabir, N.; Chew, Y.Y.; Sethi, S.K.; Khoo, C.M. Association between thyroid function tests and anti-thyroid peroxidase (TPO) antibodies in pregnancy. Endocrine 2016, 53, 865–867. [Google Scholar] [CrossRef]
- Fröhlich, E.; Wahl, R. Thyroid autoimmunity: role of anti-thyroid antibodies in thyroid and extra-thyroidal diseases. Front. Immunol. 2017, 8, 521. [Google Scholar] [CrossRef] [PubMed]
- Kumru, P.; Erdogdu, E.; Arisoy, R.; Demirci, O.; Ozkoral, A.; Ardic, C.; Ertekin, A.A.; Erdogan, S.; Ozdemir, N.N. Effect of thyroid dysfunction and autoimmunity on pregnancy outcomes in low risk population. Arch. Gynecol. Obstet. 2015, 291, 1047–1054. [Google Scholar] [CrossRef] [PubMed]
- Schroeder, A.C.; Privalsky, M.L. Thyroid hormones, t3 and t4, in the brain. Front. Endocrinol. 2014, 5, 40. [Google Scholar] [CrossRef] [PubMed]
- Dunn, D.; Turner, C. Hypothyroidism in women. Nurs. Women's Health 2016, 20, 93–98. [Google Scholar] [CrossRef] [PubMed]
- Bernardes, S.S.; Guarnier, F.A.; Marinello, P.C.; Armani, A.; Simão, A.N.C.; Cecchini, R.; Cecchini, A.L. Reactive oxygen species play a role in muscle wasting Dur. thyrotoxicosis. Cell Tissue Res. 2014, 357, 803–814. [Google Scholar] [CrossRef]
- Khathi, A.; Luvuno, M.; Mabandla, M. Diet-induced prediabetes: effects on oxidative stress and inflammatory biomarkers as agents for vascular complications in renal function. PONTE Int. J. Sci. Res. 2019, 75. [Google Scholar] [CrossRef]
- Cicatiello, A.G.; Di Girolamo, D.; Dentice, M. Metabolic effects of the intracellular regulation of thyroid hormone: old players, new concepts. Front. Endocrinol. 2018, 9, 474. [Google Scholar] [CrossRef]
- Gierach, M.; Gierach, J.; Junik, R. Insulin resistance and thyroid disorders. Endokrynol. Pol. 2014, 65, 70–76. [Google Scholar] [CrossRef]
- Samy, D.M.; Ismail, C.A.; Nassra, R.A. Circulating irisin concentrations in rat models of thyroid dysfunction—effect of exercise. Metabolism 2015, 64, 804–813. [Google Scholar] [CrossRef]
- Jayanthi, R.; Srinivasan, A.R.; Hanifah, M.; Maran, A.L. Associations among Insulin resistance, triacylglycerol/high density lipoprotein (TAG/HDL ratio) and thyroid hormone levels—a study on type 2 diabetes mellitus in obese and overweight subjects. Diabetes & metabolic syndrome: clinical research & reviews 2017, 11, S121–S126. [Google Scholar]
- Ağbaht, K.; Erdogan, M.F.; Emral, R.; Baskal, N.; Güllü, S. Circulating glucagon to ghrelin ratio as a determinant of insulin resistance in hyperthyroidism. Endocrine 2014, 45, 106–113. [Google Scholar] [CrossRef] [PubMed]
- Martinez, B.; Ortiz, R.M. Thyroid hormone regulation and insulin resistance: insights from animals naturally adapted to fasting. Physiology 2017, 32, 141–151. [Google Scholar] [CrossRef] [PubMed]
- Gereben, B.; McAninch, E.A.; Ribeiro, M.O.; Bianco, A.C. Scope and limitations of iodothyronine deiodinases in hypothyroidism. Nat. Rev. Endocrinol. 2015, 11, 642–652. [Google Scholar] [CrossRef] [PubMed]
Figure 1.
Plasma thyroid stimulating hormone (TSH) concentration in the non-prediabetic group (NPD) (n=6) and prediabetic group (PD)(n=6). Values are presented as mean ± SEM.
Figure 1.
Plasma thyroid stimulating hormone (TSH) concentration in the non-prediabetic group (NPD) (n=6) and prediabetic group (PD)(n=6). Values are presented as mean ± SEM.
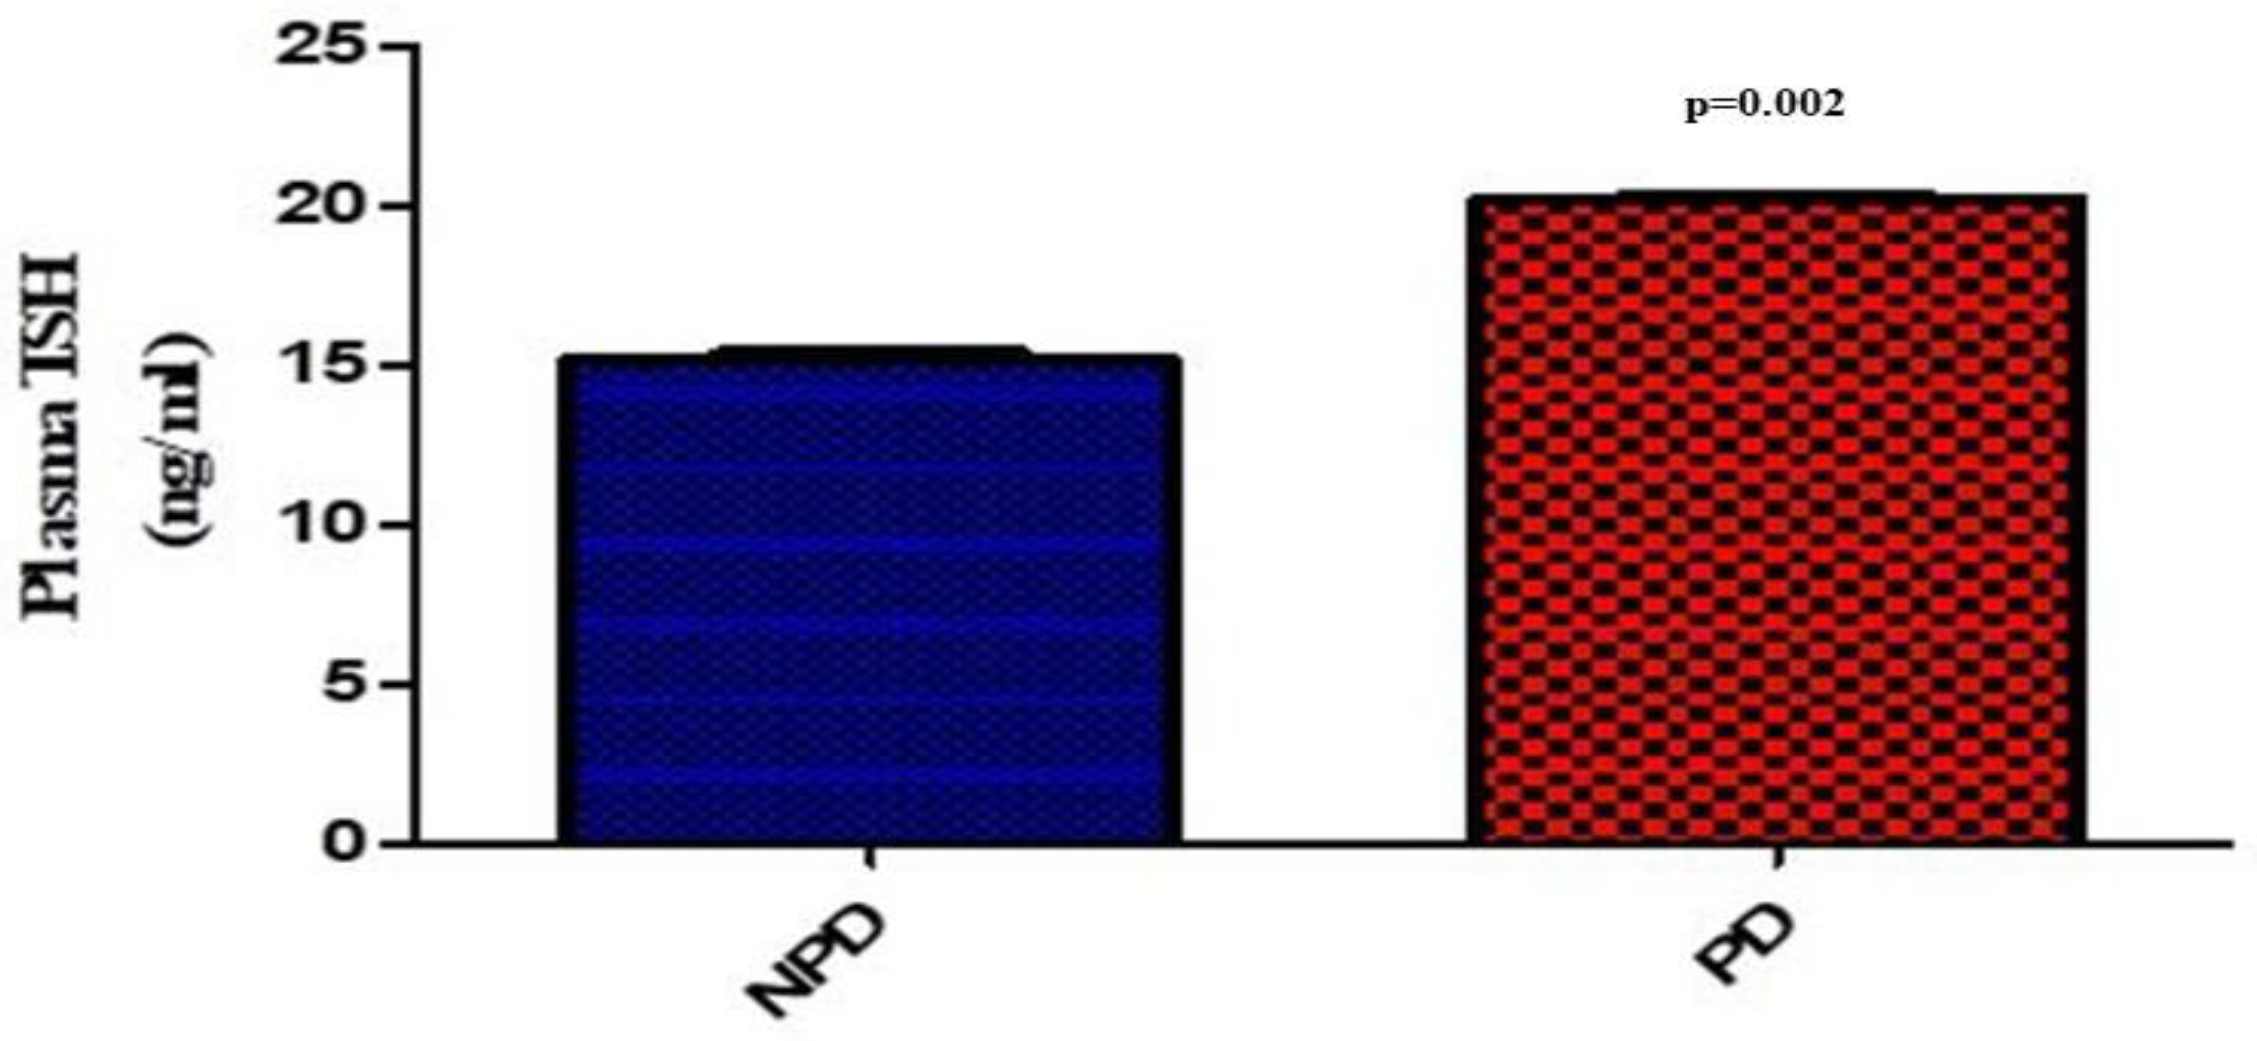
Figure 2.
Plasma tetraiodothyronine (T4) (A) and plasma triiodothyronine (T3) (B) concentrations in the non-prediabetic group (NPD) (n=6) and prediabetic group (PD)(n=6). Values are presented as mean ± SEM.
Figure 2.
Plasma tetraiodothyronine (T4) (A) and plasma triiodothyronine (T3) (B) concentrations in the non-prediabetic group (NPD) (n=6) and prediabetic group (PD)(n=6). Values are presented as mean ± SEM.
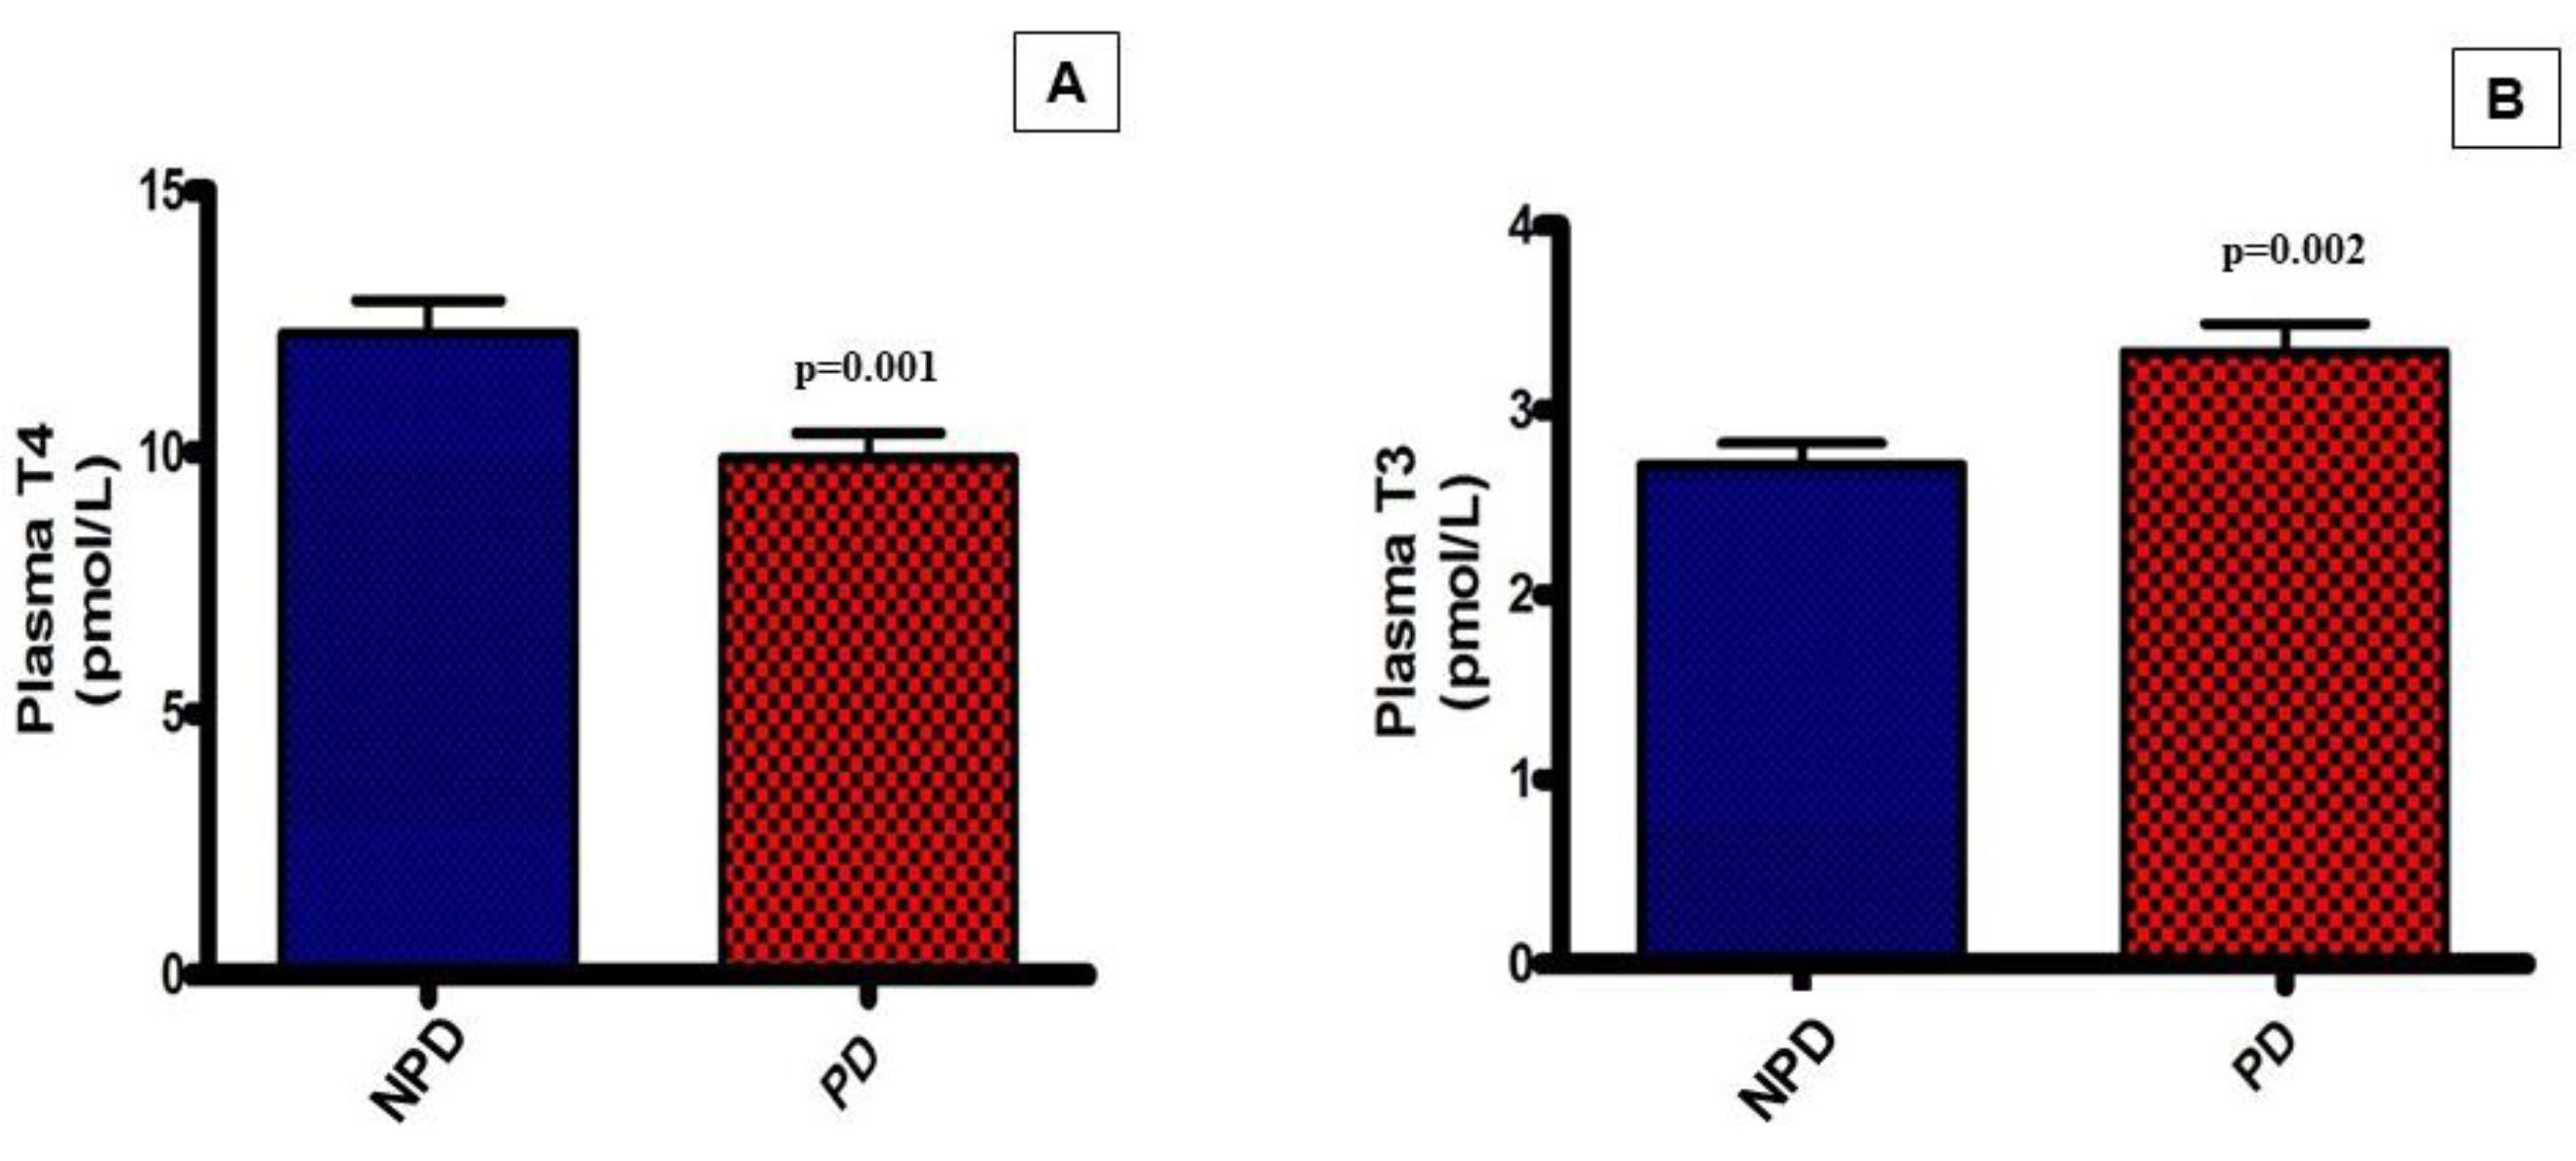
Figure 3.
Plasma thyroid peroxidase (TPO) antibody in both the non-prediabetic control group (NPD)(n=6) and prediabetic group (PD)(n=6). Values are presented as mean ± SEM.
Figure 3.
Plasma thyroid peroxidase (TPO) antibody in both the non-prediabetic control group (NPD)(n=6) and prediabetic group (PD)(n=6). Values are presented as mean ± SEM.
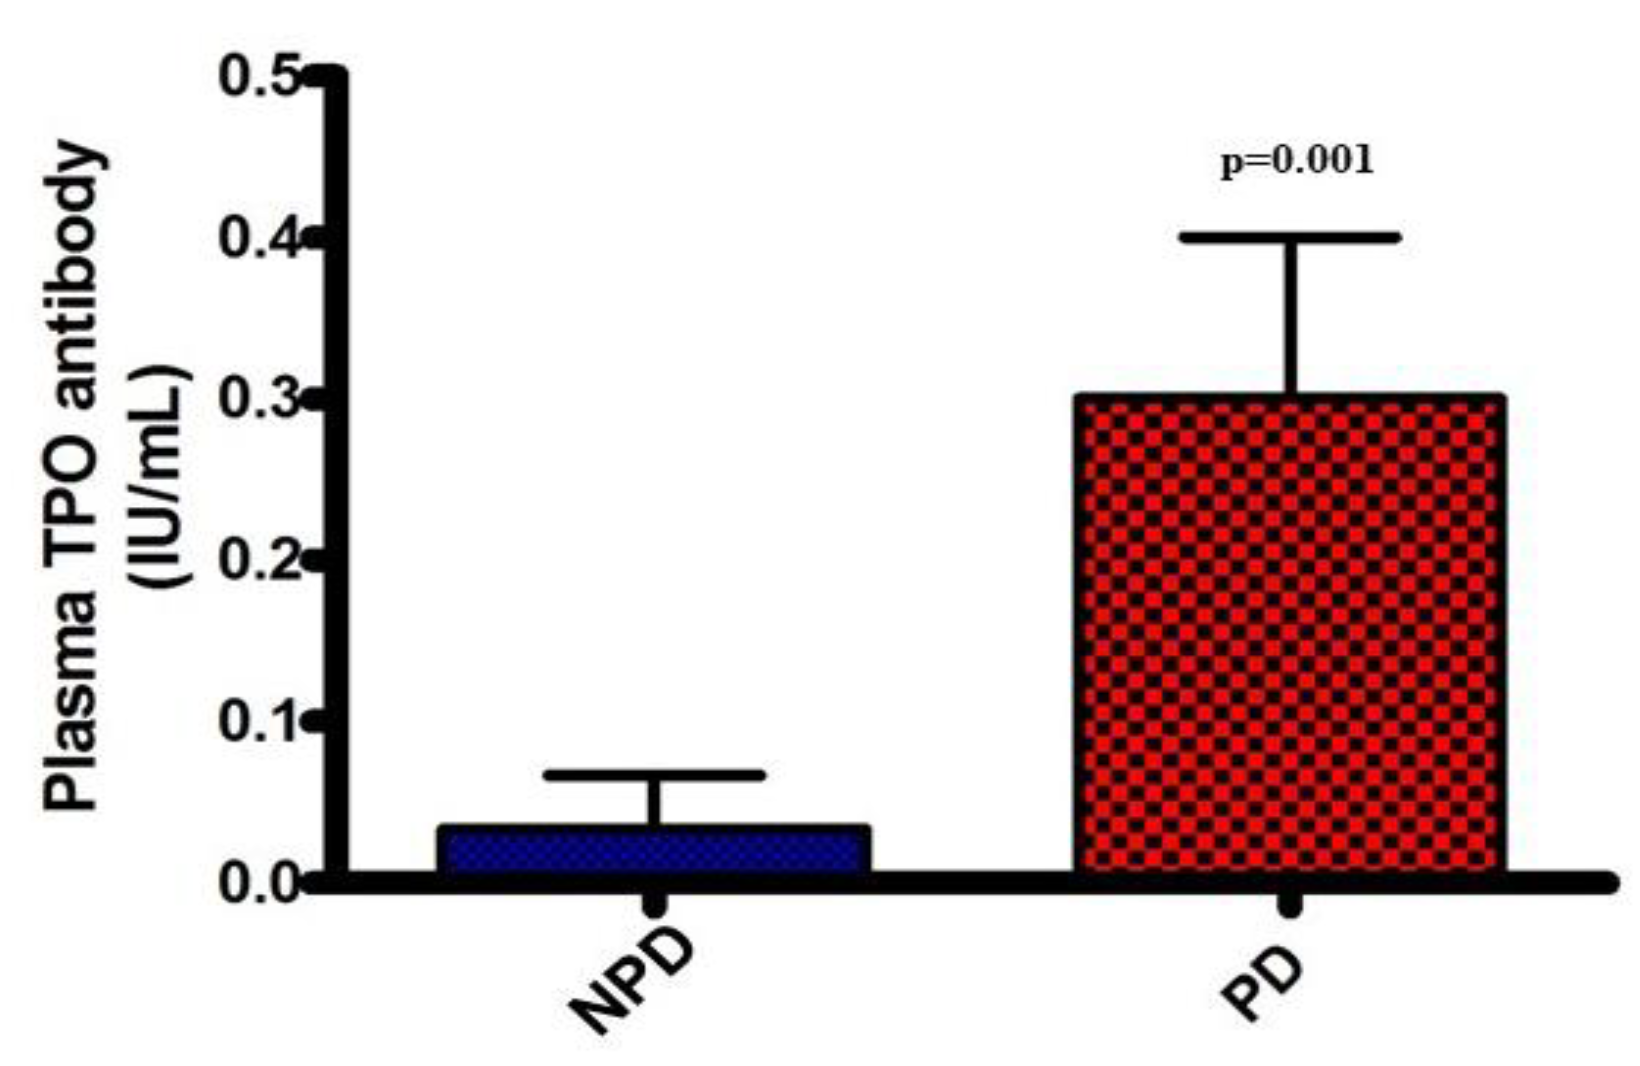
Figure 4.
The plasma creatinine concentrations in both the non-prediabetic control group (ND)(n=6) and pre-diabetic group (PD)(n=6). Values are presented as mean ± SEM.
Figure 4.
The plasma creatinine concentrations in both the non-prediabetic control group (ND)(n=6) and pre-diabetic group (PD)(n=6). Values are presented as mean ± SEM.
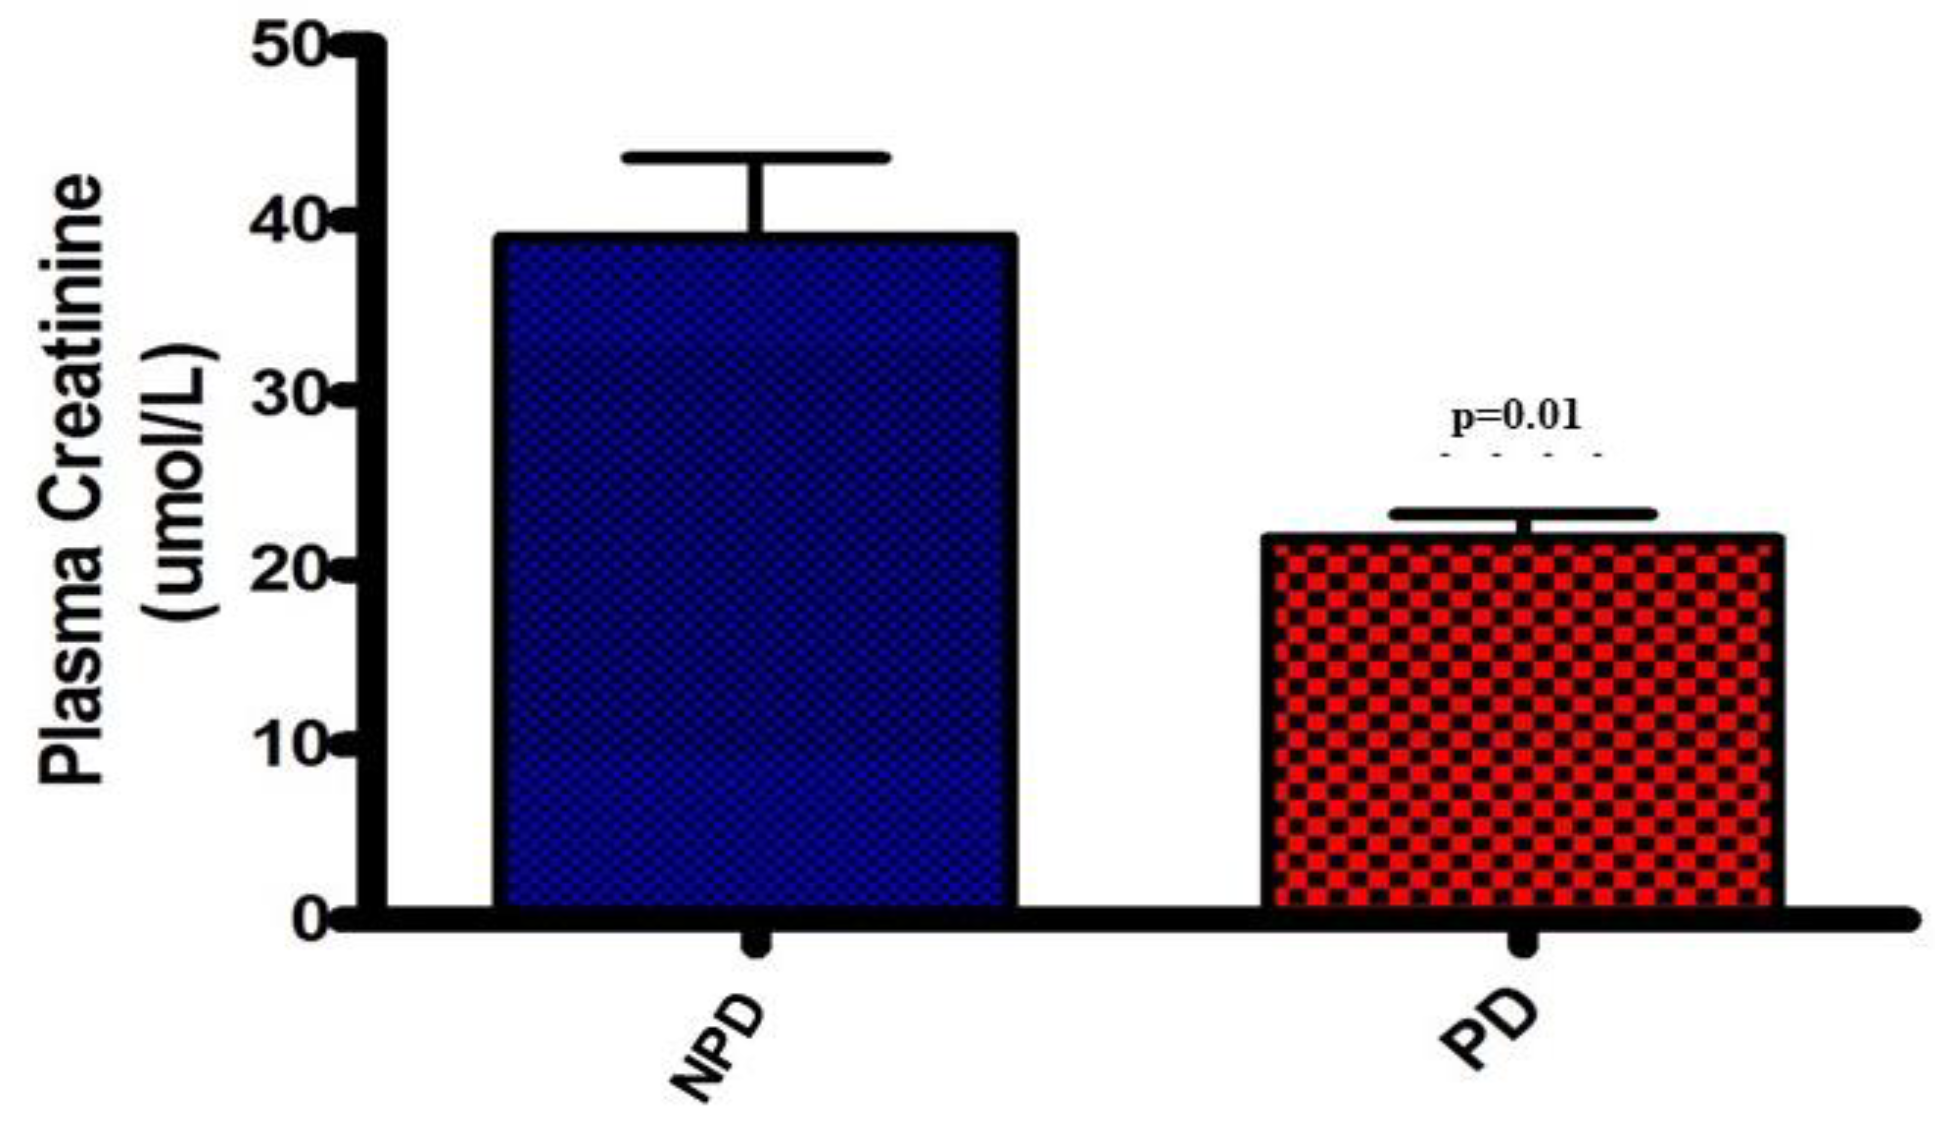

Table 1.
Plasma insulin concentrations (ng/ml) and glycated hemoglobin (HbA1c) concentrations (%) of non-diabetic control group (ND) and prediabetic group (PD).
Table 1.
Plasma insulin concentrations (ng/ml) and glycated hemoglobin (HbA1c) concentrations (%) of non-diabetic control group (ND) and prediabetic group (PD).
| Group | NPD | PD | p value |
|---|---|---|---|
| Plasma Insulin (ng/ml) | 2.97 ± 0.01 | 14.25 ± 0.12★ | p<0.0001 |
| Blood Glucose (mmol/l) | 4.62 ± 0.11 | 6.25 ± 0.11★ | p<0.001 |
| HOMA-IR | 0.61 ± 0.01 | 3.96 ± 0.09★ | p<0.0001 |
| HbA1c (%) | 3.80 ± 1.17 | 6.30 ± 0.36★ | p<0.001 |
| Body Weight (g) | 368.71 ± 4.02 | 568.50 ± 8.57★ | p<0.0001 |
★Denotes comparison with NPD group.
Table 2.
Correlation between glycated haemoglobin (HbA1c) and triiodothyronine (T3) as well as tetraiodothyronine or thyroxine (T4) in non-prediabetic (NPD) and prediabetic (PD) rats. r = Pearson’s correlation coefficient, n = sample size.
Table 2.
Correlation between glycated haemoglobin (HbA1c) and triiodothyronine (T3) as well as tetraiodothyronine or thyroxine (T4) in non-prediabetic (NPD) and prediabetic (PD) rats. r = Pearson’s correlation coefficient, n = sample size.
| Groups | Correlation analysis | Independent variable: HbA1c vs Dependent variable: T3 |
Independent variable: HbA1c vs Dependent variable: T4 |
|---|---|---|---|
| NPD | r | -0.0680 | 0.5016 |
| p value | 0.8981NS | 0.3107NS | |
| N | 6 | 6 | |
| PD | r | 0.8122 | -0.8238 |
| p value | 0.0496* | 0.0438* | |
| n | 6 | 6 |
NS Not significant.*p<0.05.
Disclaimer/Publisher’s Note: The statements, opinions and data contained in all publications are solely those of the individual author(s) and contributor(s) and not of MDPI and/or the editor(s). MDPI and/or the editor(s) disclaim responsibility for any injury to people or property resulting from any ideas, methods, instructions or products referred to in the content. |
© 2023 by the authors. Licensee MDPI, Basel, Switzerland. This article is an open access article distributed under the terms and conditions of the Creative Commons Attribution (CC BY) license (https://creativecommons.org/licenses/by/4.0/).
Copyright: This open access article is published under a Creative Commons CC BY 4.0 license, which permit the free download, distribution, and reuse, provided that the author and preprint are cited in any reuse.


