1. Introduction
With the advent of technologies such as voice recognition and Natural Language Processing (NLP), novel developmental features are being introduced into everyday tools, impacting various fields. One such field is Cartography and Geoinformatics, where these advancements are integral to the evolution of map and geospatial data visualisation. Online mapping applications and open geospatial data have democratised spatial information, enabling public participation in its creation [
1]. Speech recognition technology’s integration into these applications can enhance efficiency, user experience, and accessibility while reducing the need for specialised skills and knowledge in handling geospatial data [
2]. Blanco [
3] emphasised the lack of infrastructure and practical experience in implementing voice recognition on GIS interfaces, a challenge which this study aims to explore. Past research has primarily examined the application of speech recognition and NLP in navigation interactions; this research seeks to assess their application in geospatial data visualisation and customisation. Technical and conceptual hurdles, such as language diversity, real-time geospatial data processing, human-computer interaction cognitive aspects, data democracy, and artificial intelligence utilisation, are also addressed. The objective is to develop a functional prototype incorporating voice virtual assistants into a web application, enhancing geospatial data visualisation and processing.
Developing a voice speech recognition map application on the web involves addressing technical and conceptual challenges. These challenges include recognizing a variety of voice commands and languages, processing and displaying geospatial data in real-time, accommodating the cognitive aspects of human-computer interaction, considering data democracy and domain knowledge, and leveraging artificial intelligence technology. Lack of existing applications in this field and ethical considerations further complicate the development process. The focus of this research is to introduce a fully functional prototype that incorporates voice virtual assistants into a web application, empowering users to visualize and process geospatial data effectively. It seeks to explore and synthesize the current state of knowledge, methodologies employed, key findings, and emerging trends in order to contribute to the scholarly discourse surrounding this subject matter.
2. Literature Review and State-of-the-Art
2.1. State-of-the-art
The potential of speech recognition and NLP in geospatial applications has been the focus of numerous studies. For instance, Pei-Chun Lai and Auriol Degbelo [
4] designed a prototype web map application utilising both text and speech inputs to retrieve metadata. Thomas Gilbert [
5] developed VocalGeo, a tool using speech recognition for the interactive teaching of geospatial information. In contrast, Davide Cal‘ı and Antonio Condorelli [
6] examined the effectiveness of traditional Geographic Information Systems (GIS) compared to those incorporating NLP and speech recognition. Their project, iTour, reduced user knowledge requirements and facilitated understanding of user intentions.
Hongmei Wang, Guoray Cai, and Alan M. MacEachren [
7] introduced a computational model, PlanGraph, and a prototype software agent, GeoDialogue, to improve user-GIS communication. Jacobson and Sam K [
8] combined voice and graphic interfaces to create a multimodal web-GIS application, demonstrating the potential of using voice commands for spatial data navigation and visualisation. A similar study by Andrew Hunter and Dr C. Vincent Tao [
9] investigated the efficiency of a mobile mapping tool equipped with speech recognition capabilities in identifying and locating road infrastructure issues.
2.2. Research Gaps
Despite progress, several challenges persist in developing a web voice speech recognition map application. These challenges include the recognition of various voice commands and languages, processing and displaying extensive geospatial data in real-time, and including cognitive aspects of human-computer interaction. Balancing data democracy and domain knowledge, leveraging artificial intelligence technology, and dealing with the ethical and social implications of the technology are also significant considerations. This research aims to bridge these gaps by assessing the viability of voice commands in an open-source web application for geospatial data visualisation, focusing on the cognitive aspects of user interactions and the alignment of voice recognition technology with user behaviour.
3. Materials and Methods
3.1. Domain and Phenomenon Characterisation
The primary objective of this section is to delineate and articulate the operational and functional requirements of the voice map application. It is essential to understand the various components and their interactions within the application’s ecosystem, focusing on functional and non-functional elements. The system under scrutiny is a web application composed of three key elements: Frontend, Backend, and Database. A web browser acts as the client interface, facilitating user interaction with dynamic components and enabling real-time visualisation and data manipulation. The microphone is a critical device for converting voice commands to digital signals interpretable by the server. Users can interact with the application through preset visualisations or generate their own visualisations via voice commands.
The application supports various thematic visualisation formats, such as marker and choropleth maps. User profiles might differ based on their domain expertise and capabilities. Potential use cases include map exploration, visualisation of spatial relationships, educational contexts, palette customisation, and data filtering and querying. Key functions of the application encompass voice-assisted navigation, cartographic visualisation, changing base maps, palette alteration, and data filtering and analysis.
3.2. Methodology
Employing a theoretically-driven model in research conceptualisation offers advantages, such as a framework for hypotheses formulation and testing, improved communication, and enhanced comprehension. Systems that request geographical information in natural language often face difficulties due to vague references. These ambiguities must be resolved using context analysis and machine learning methods. Integrating natural language and gestural inputs in Geographic Information Systems (GIS) can enhance accessibility and decision-making efficacy.
A compatible, visible, relevant, and intuitive action set was required for effective geospatial data processing and visualisation in the Human-GIS computer context, leading to the categorisation of all actions into four primary types:
Type I: Acceleration of spatial data (e.g., map layer retrieval)
Type II: Analytical tasks (e.g., finding spatial clusters)
Type III: Cartographic and visualisation tasks (e.g., zooming, panning)
Type IV: Domain-specific tasks (e.g., evacuation planning during hurricanes)
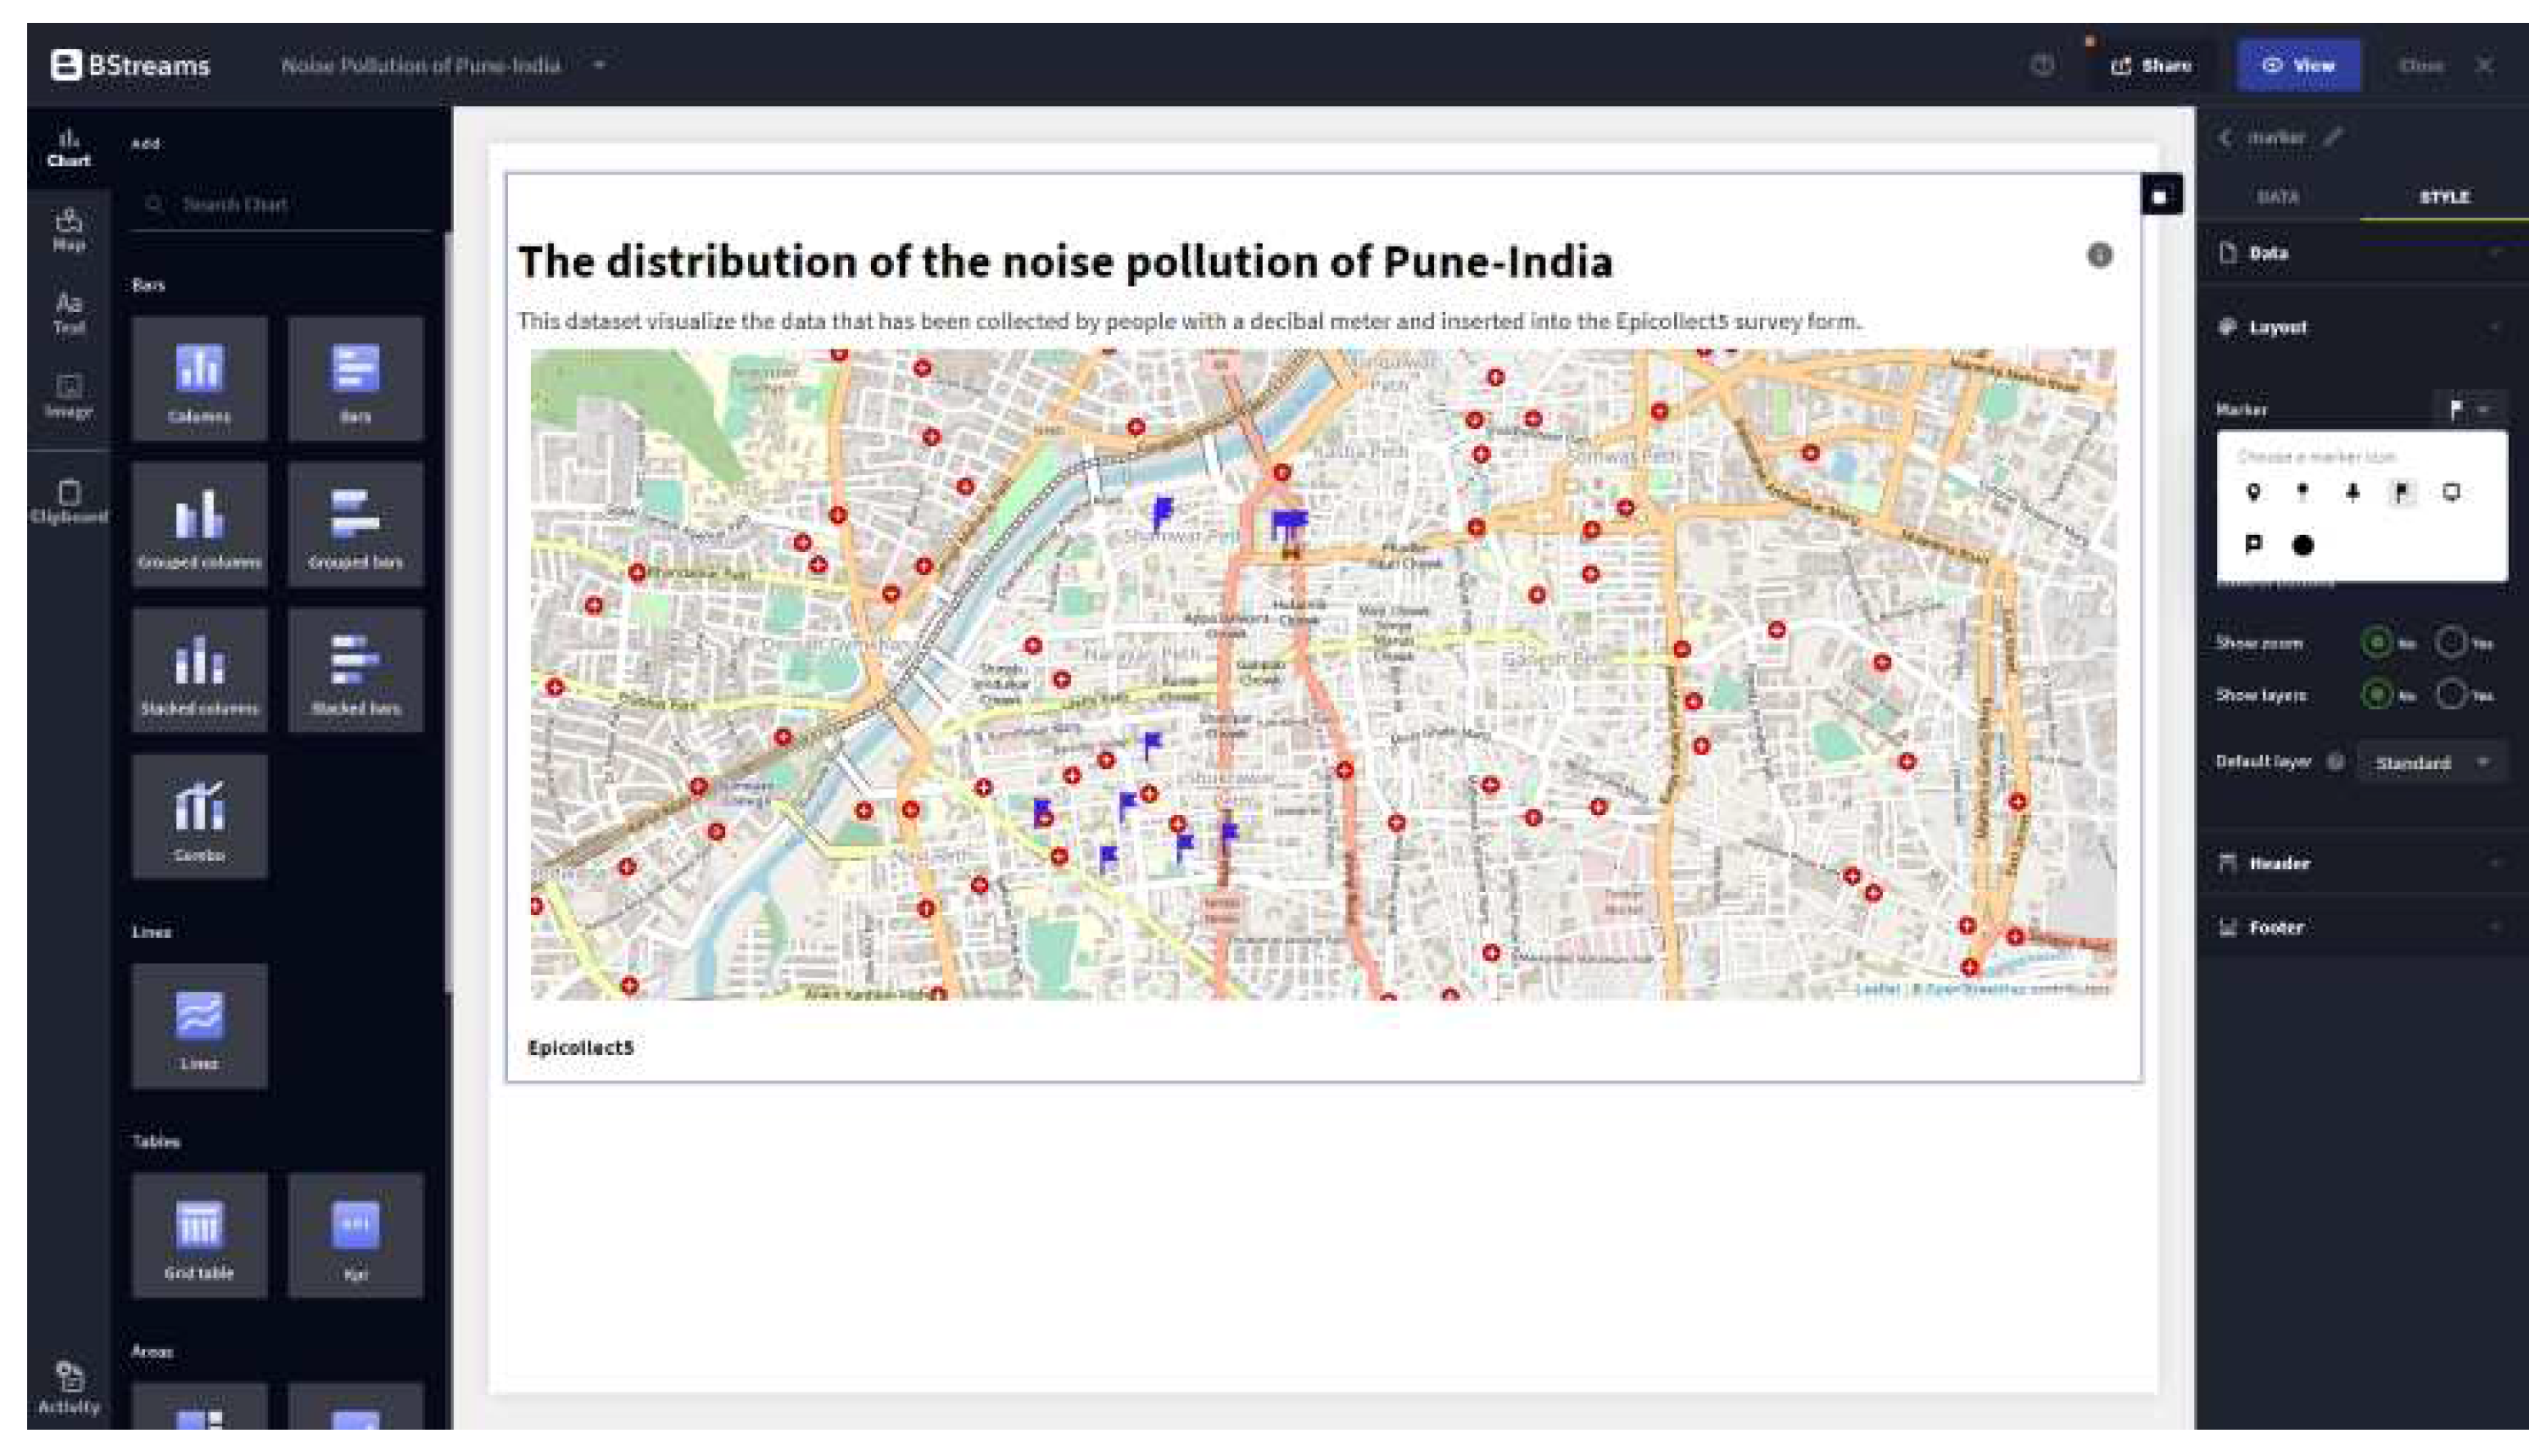
The PlanGraph model facilitates user interaction and function through reasoning algorithms. Upon receiving user inputs, the system initiates a three-step process: interpreting the input, advancing available plans towards completion, and delivering responses to the user. The PlanGraph methodology was integrated into the application by initially categorising all tasks into two main groups: cartographic tasks (visual map modifications) and analytical tasks (data filtering). Task extraction and categorisation were streamlined by leveraging the existing User Interface (UI) and features on the BStreams platform, a pre-existing platform for geospatial data visualisation.
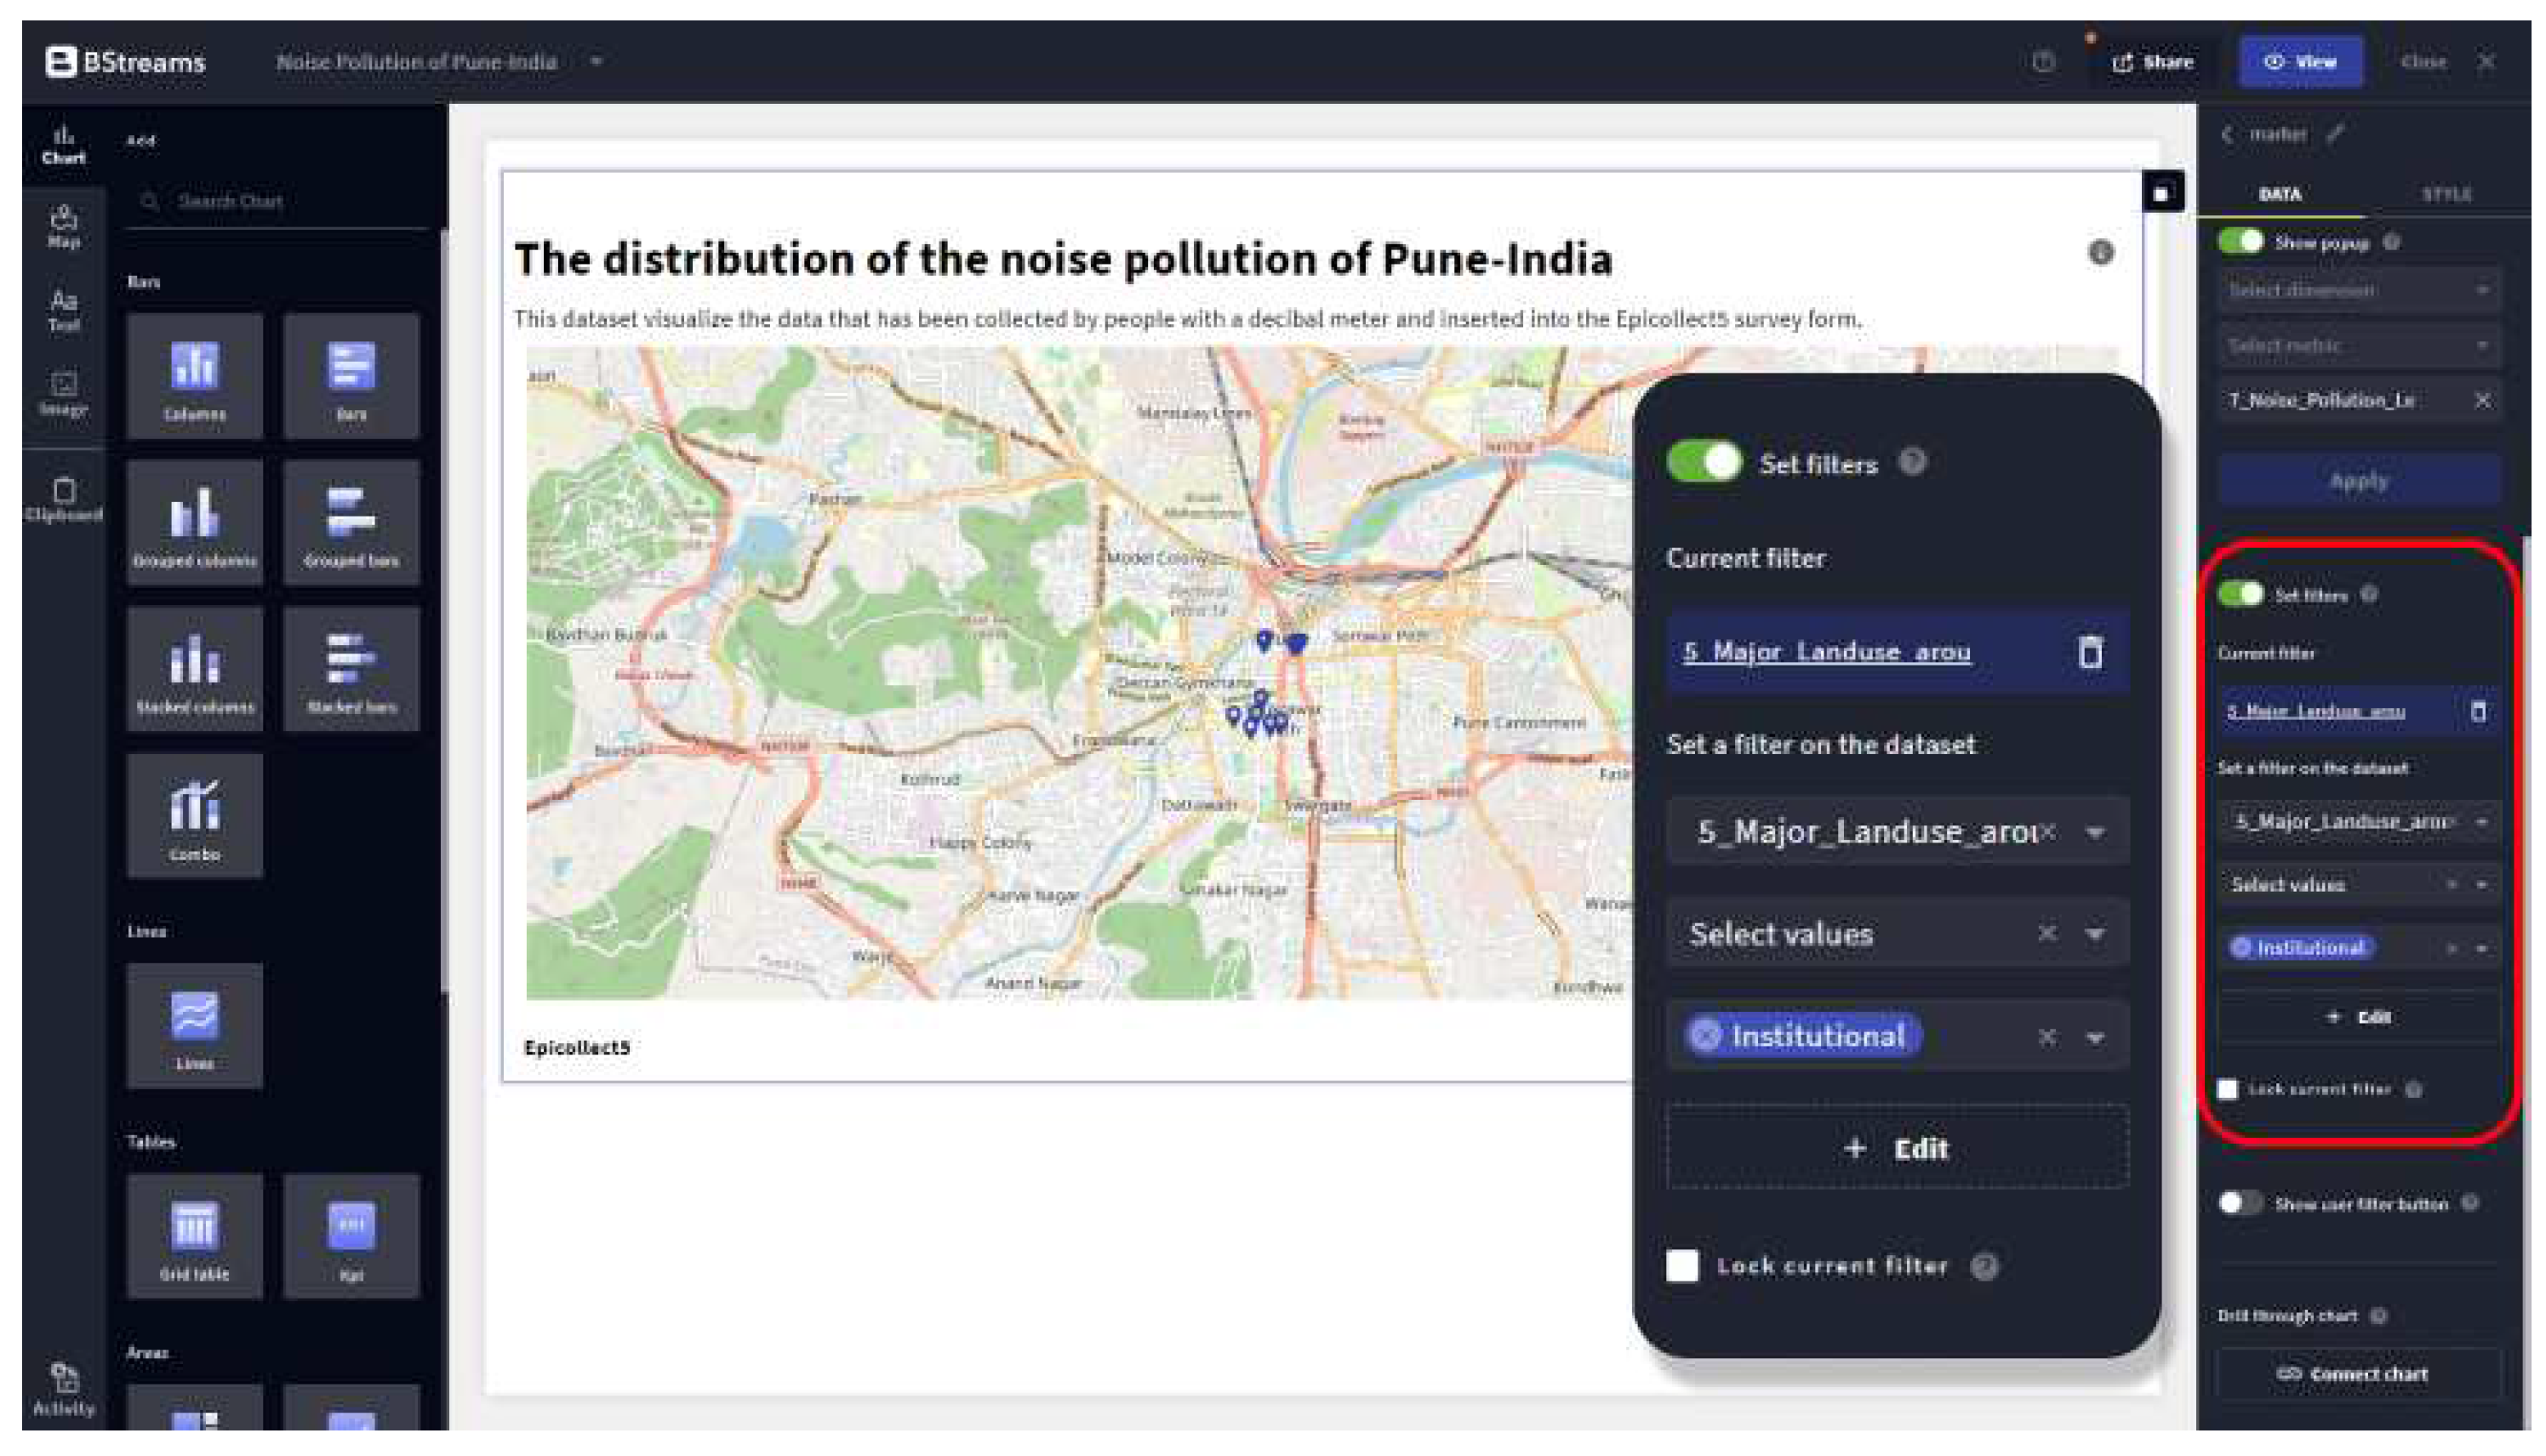
Figure 3 and
Figure 4 depict some cartographic and analytical tasks and their notation on the BStreams platform.
The UI heavily relies on user-platform interaction for task execution and modification. However, an in-depth exploration of each tool and feature was necessary to determine the correct format, threshold, and structure of user inputs. Examining the core functions of the two visualisations in the backend and the default configuration file stored in the database provided insights into the necessary parameters and conditions for each derived task.
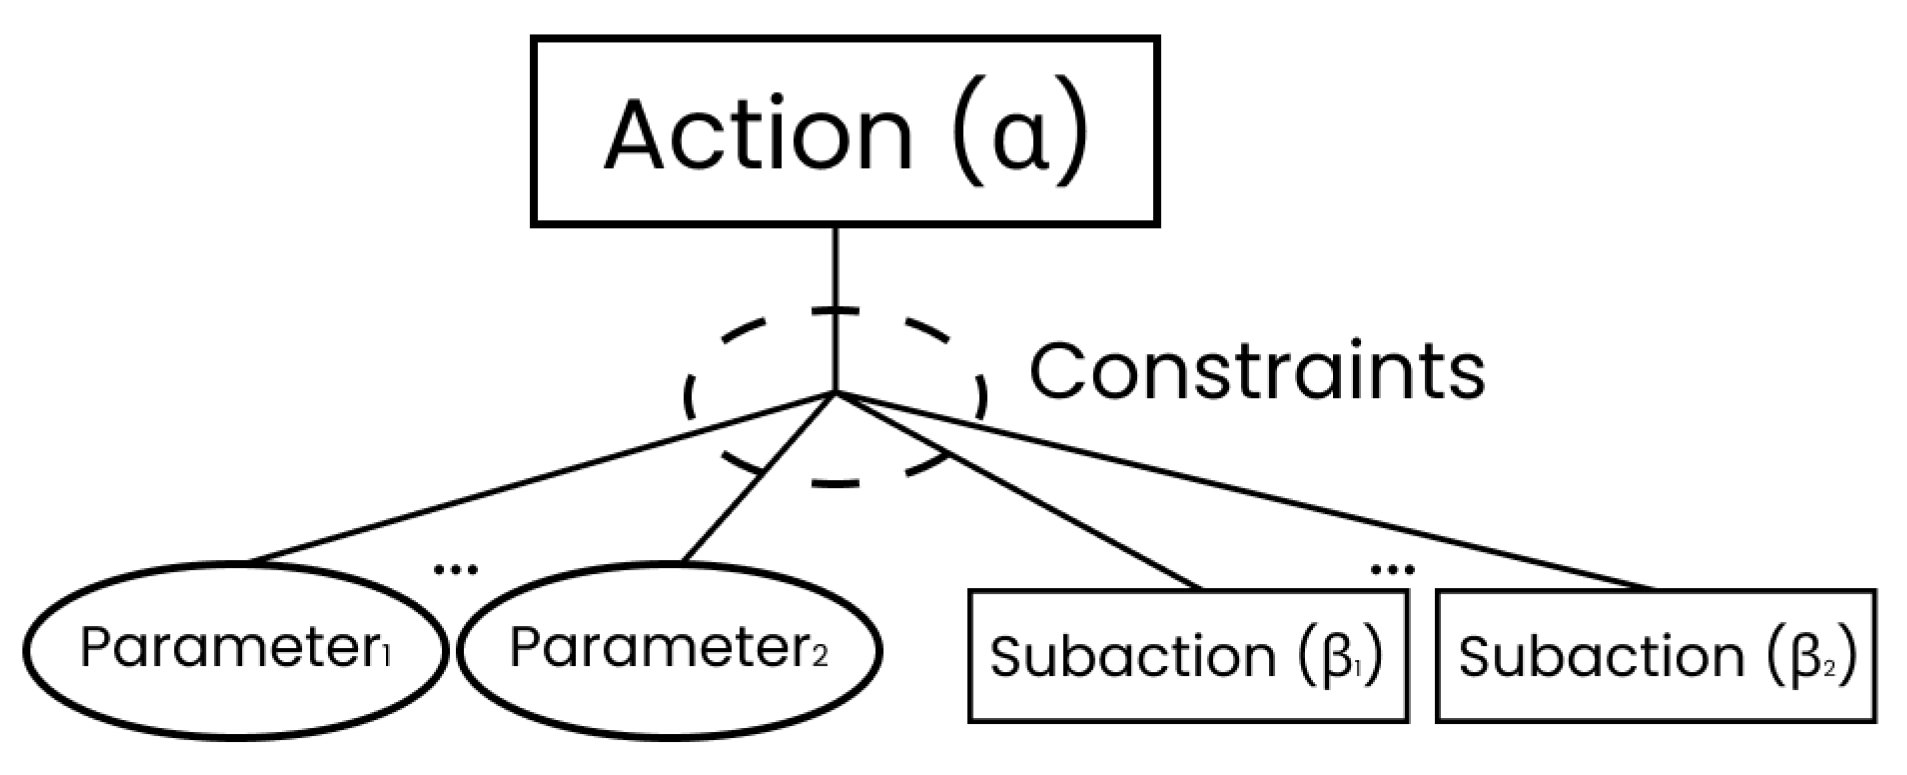
Once all the necessary components were identified, including parameters and constraints, the actions of the Plan-Graph models were conceptualised. Following the outlined methodology, the process started with defining the root action/plan and then defining the parameters and constraints for each task, as depicted in
Figure 2. Next, the type of action was identified based on the PlanGraph types discussed previously. Actions were classified as basic or complex, depending on whether users required prior domain knowledge to perform the task.
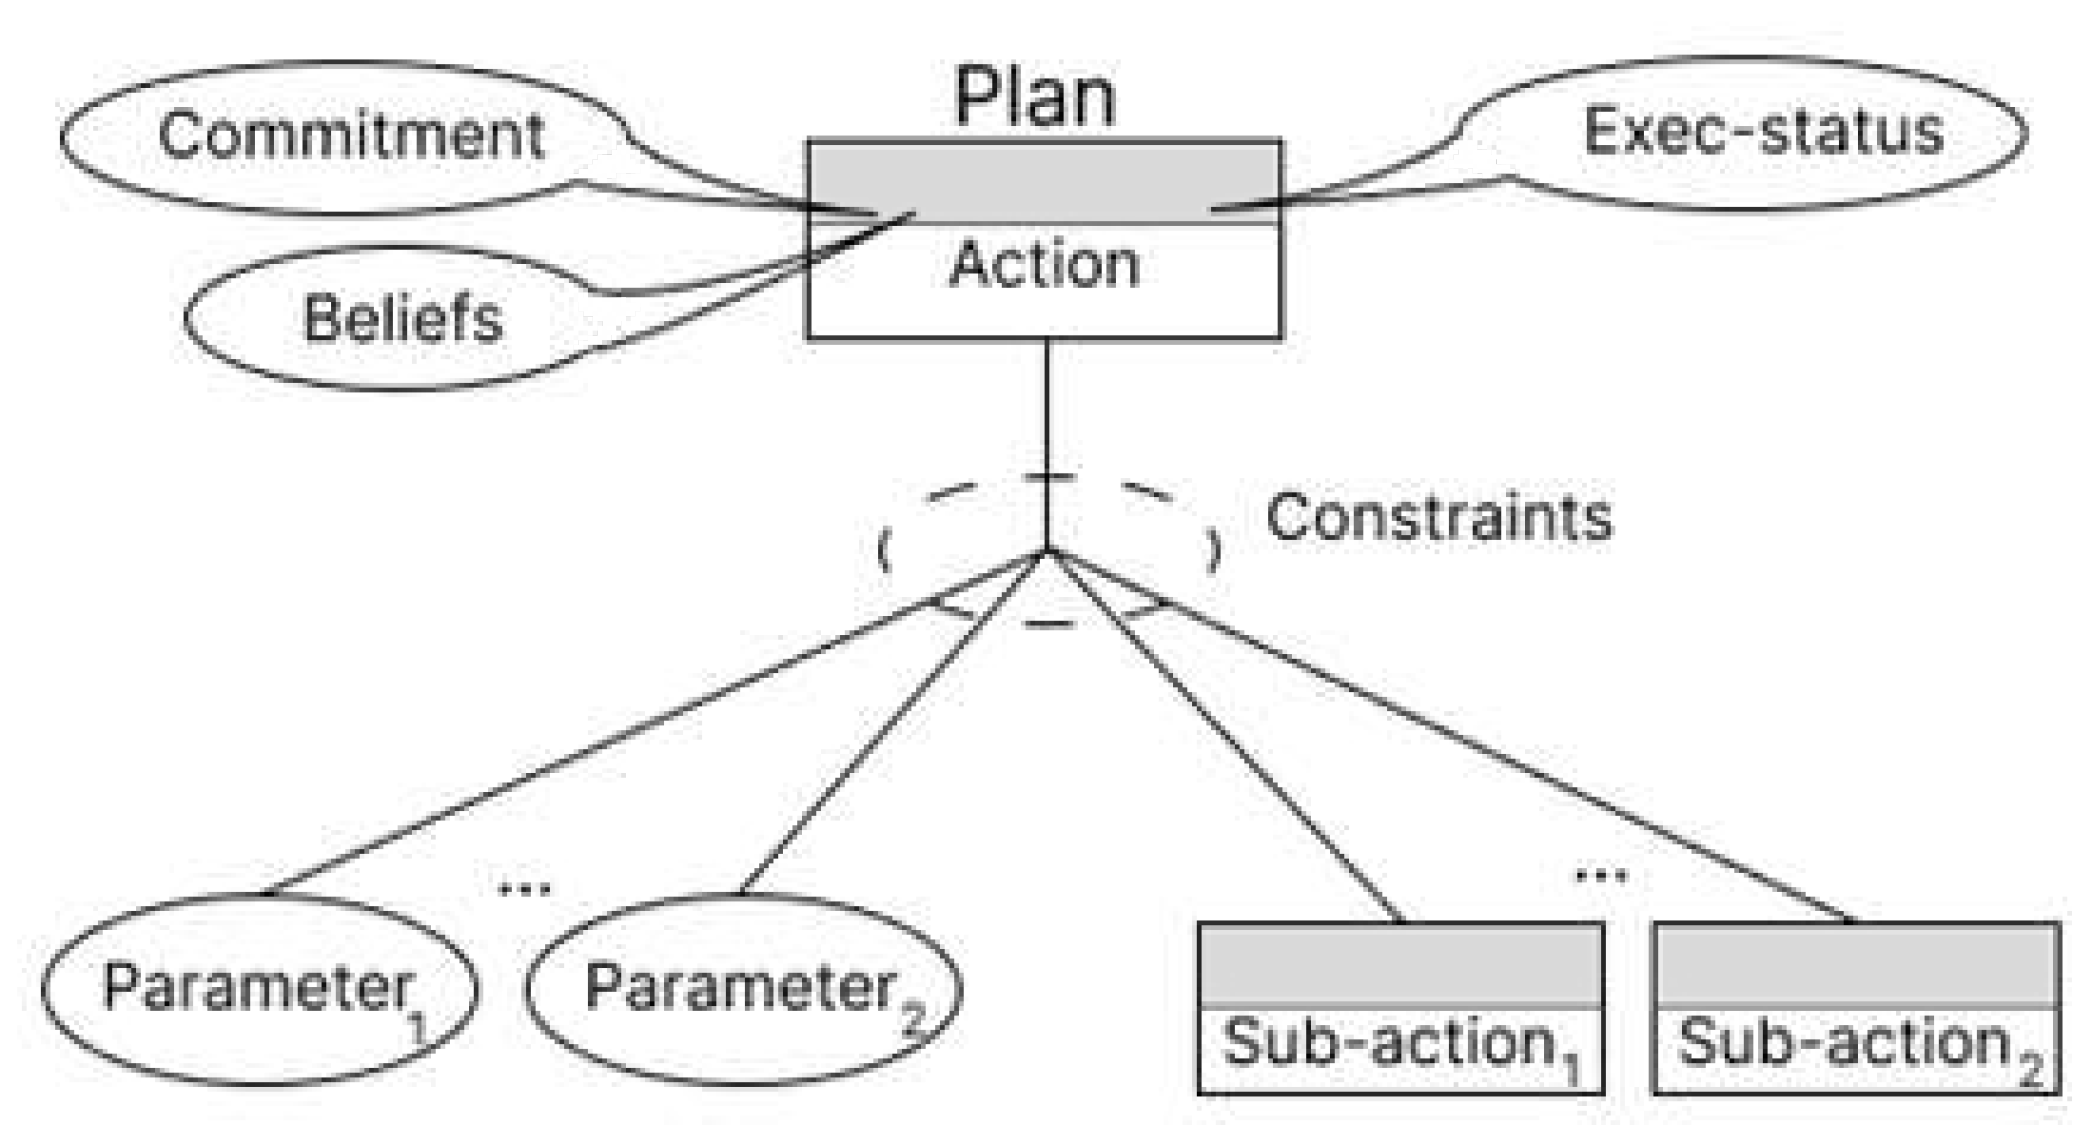
For example, tasks like "Zoom in" or "Pan to the left" were considered basic, while tasks like "Changing the steps for graduated colour" were deemed complex and involved sub-actions and plans. Each action type was determined based on its complexity, with
Figure 5 illustrating an example of the basic task "Zoom in/out" in the Plan-Graph model.
In this model, the root plan aimed to achieve the zooming action, with parameters such as map window size, predefined scale, and the sub-action of reloading the basemap with pre-loaded data. The root plan was classified as a Type III action, focusing on visualisation modification, while the sub-action was considered Type I.
3.3. Survey
The rapid advancement of Natural Language Processing (NLP) technology has unlocked significant potential for implementing a natural language-based approach to data visualisation [
10,
11]. However, efforts to adapt this technology for geospatial data have been limited. To bridge this gap, an English-language survey was designed and circulated among the general public to assess and extract users’ vocabulary choices when interacting with web-based maps. The questionnaire contained twelve open-ended questions, enabling respondents to articulate their thoughts and ideas about tasks converted into questions. GIFs were incorporated to aid users in understanding the tasks and commands better.
The survey also collected demographic data such as age, gender, educational attainment, field of study, native language, and English proficiency to detect possible patterns or correlations. The survey reached 66 diverse respondents via social media and underwent data-cleaning procedures for result analysis. The analysis primarily revolved around identifying frequently used vocabulary and verbs to enhance human-computer interaction in the application design. More than half of the respondents identified as men, indicating a potential gender bias in interest towards the topic.
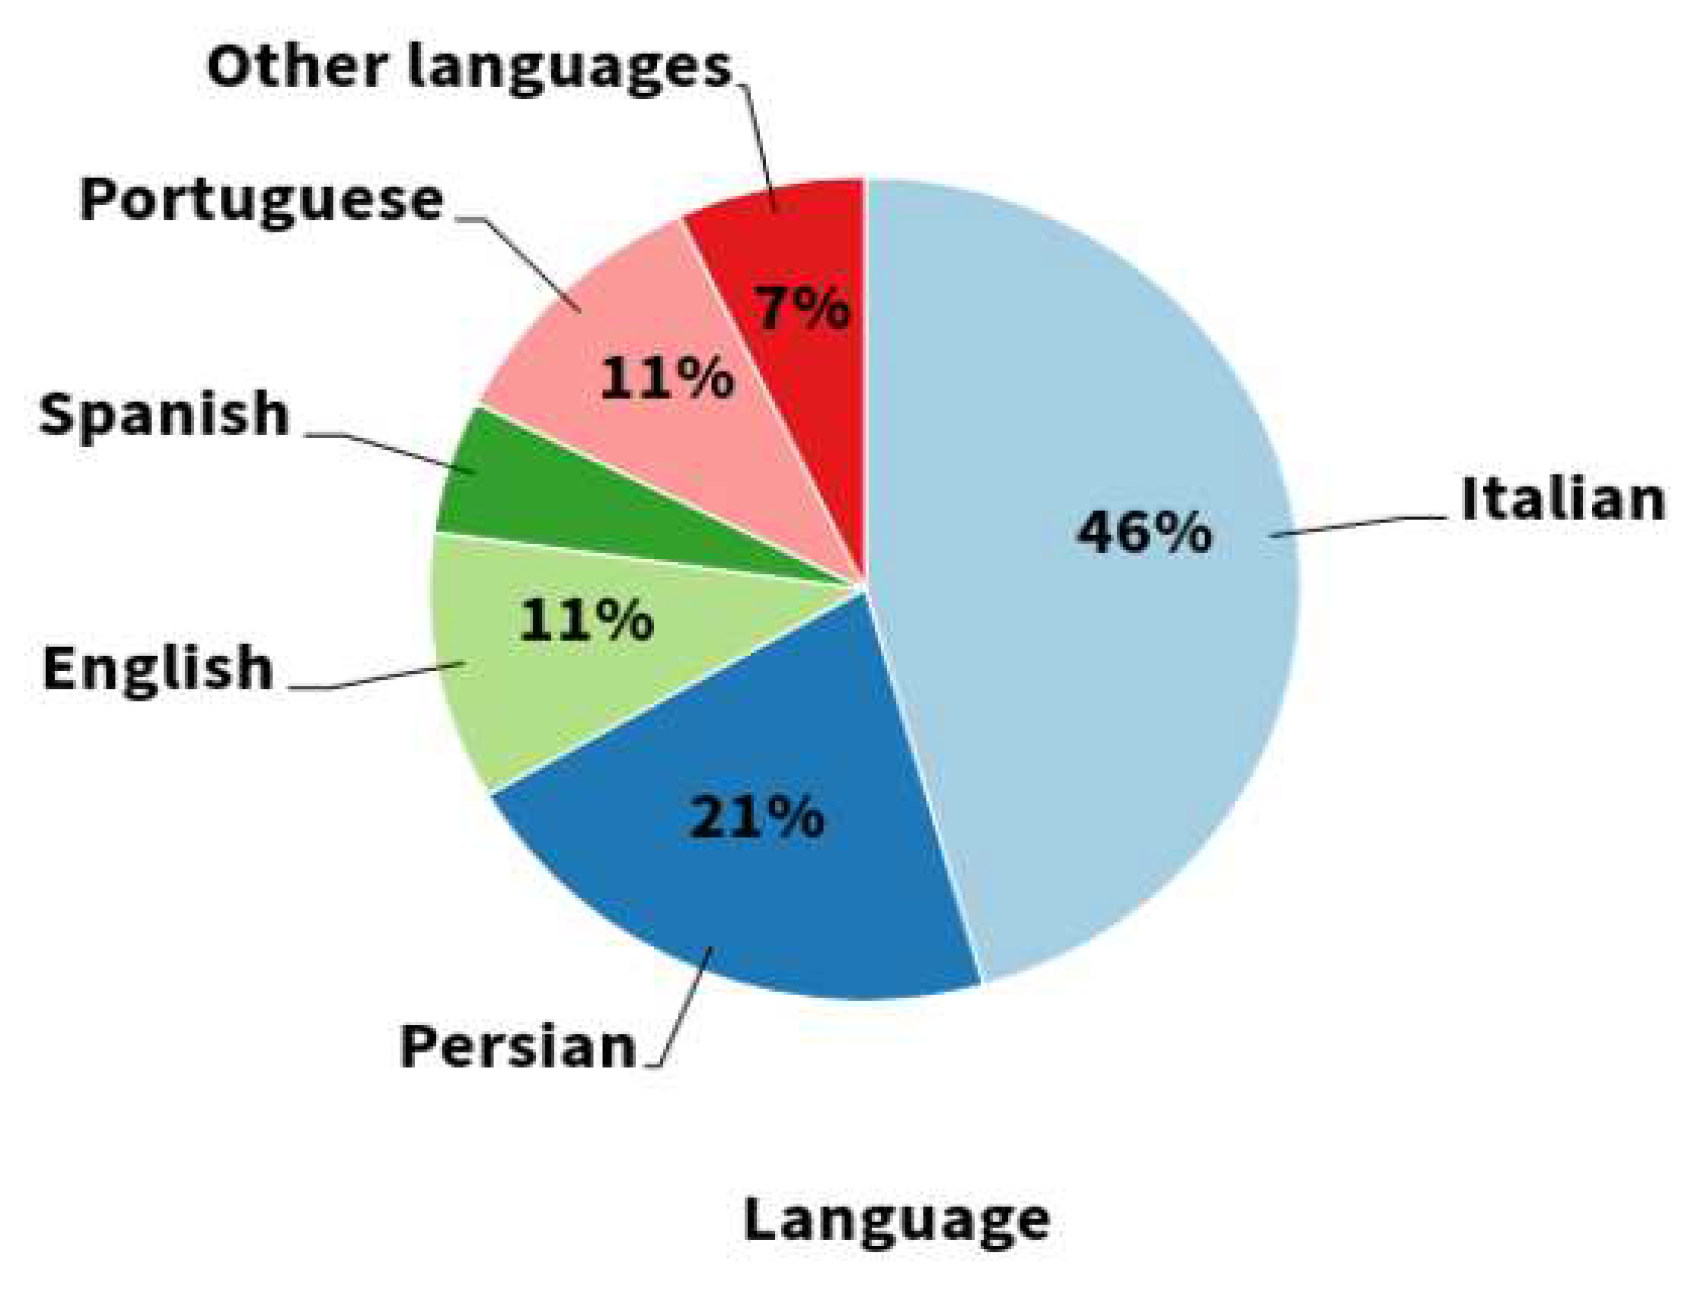
The majority of the respondents (over 65%) were in the 18-30 age range, which may suggest that older generations find voice technology on a map less appealing or unfamiliar. Educational attainment was another factor examined, revealing that over 58% of respondents held a master’s degree or higher. Fields of study were also considered, with 50 respondents providing related information. Native language and English proficiency also played key roles. As anticipated, due to the survey distribution channels, the largest group of respondents were Italian speakers.
Figure 6 depicts the distribution of other native languages among the respondents, with Persian speakers constituting the second-largest group due to the researcher’s ethnicity. Regarding English proficiency, most respondents were anticipated to have an advanced level, while none reported having basic proficiency.
The survey aimed to collect specialised geospatial data visualisation and analysis terminology to create a structured archive accessible to users. The compiled terms were integrated into the application’s code to enhance the user experience by offering diverse inputs and improving response accuracy.
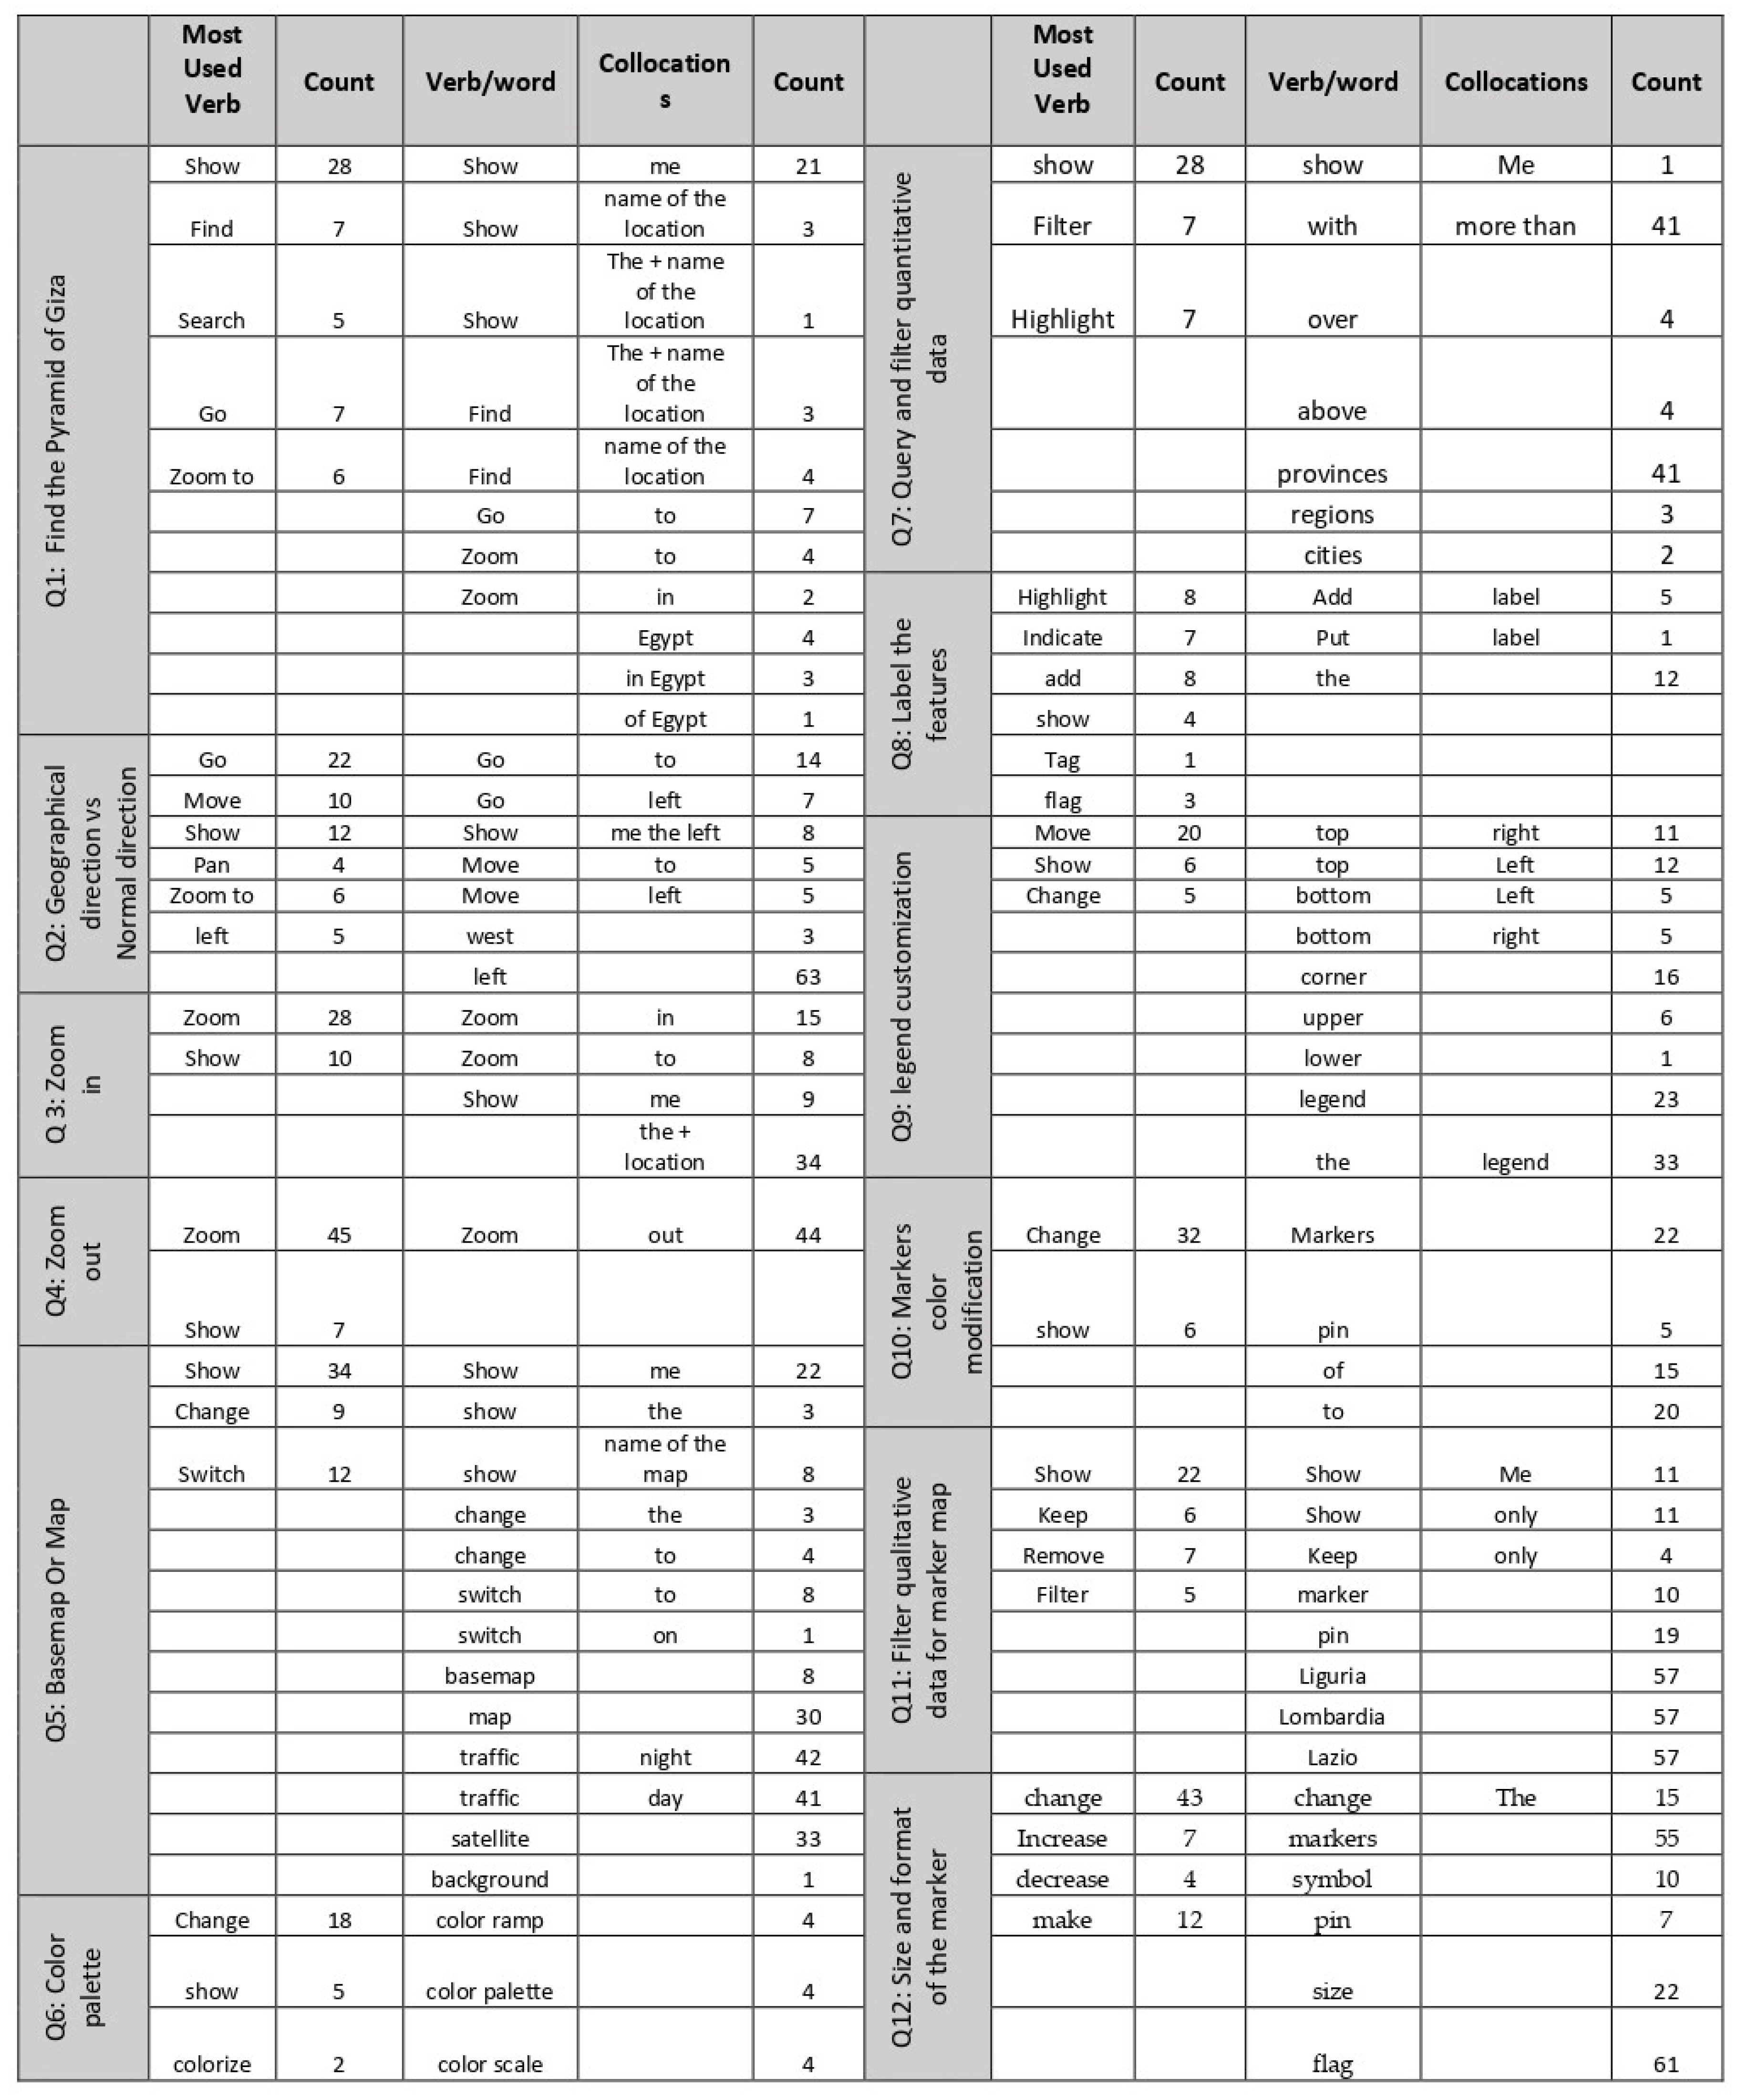
The frequency of most commonly used verbs was estimated for each question, taking into account the verb-word collocation. Each question was designed to fulfil a specific task and characteristic. The primary approach to analysing derived results was the frequency of vocabularies. Estimating the frequency of commonly used vocabulary also facilitated predicting the most frequently used verbs and words for cloud words and overall human-computer interaction scenarios. Given the human tendency to perceive machines and applications as service tools, most verbs and words exhibited a command or order behaviour. This user-centric design application aims to acknowledge and prioritise users’ needs, preferences, and experiences.
The
Figure 8 presents the results from analysing questions in the survey, formulated to understand the terminologies people use to talk to a map. While the anticipated most frequent verbs were "find" and "search," statistics reveal that "show" was used more often. This preference could be attributed to the visual nature of the tasks and the user’s interaction with the application, relying on the fact that the application should visually respond to commands.
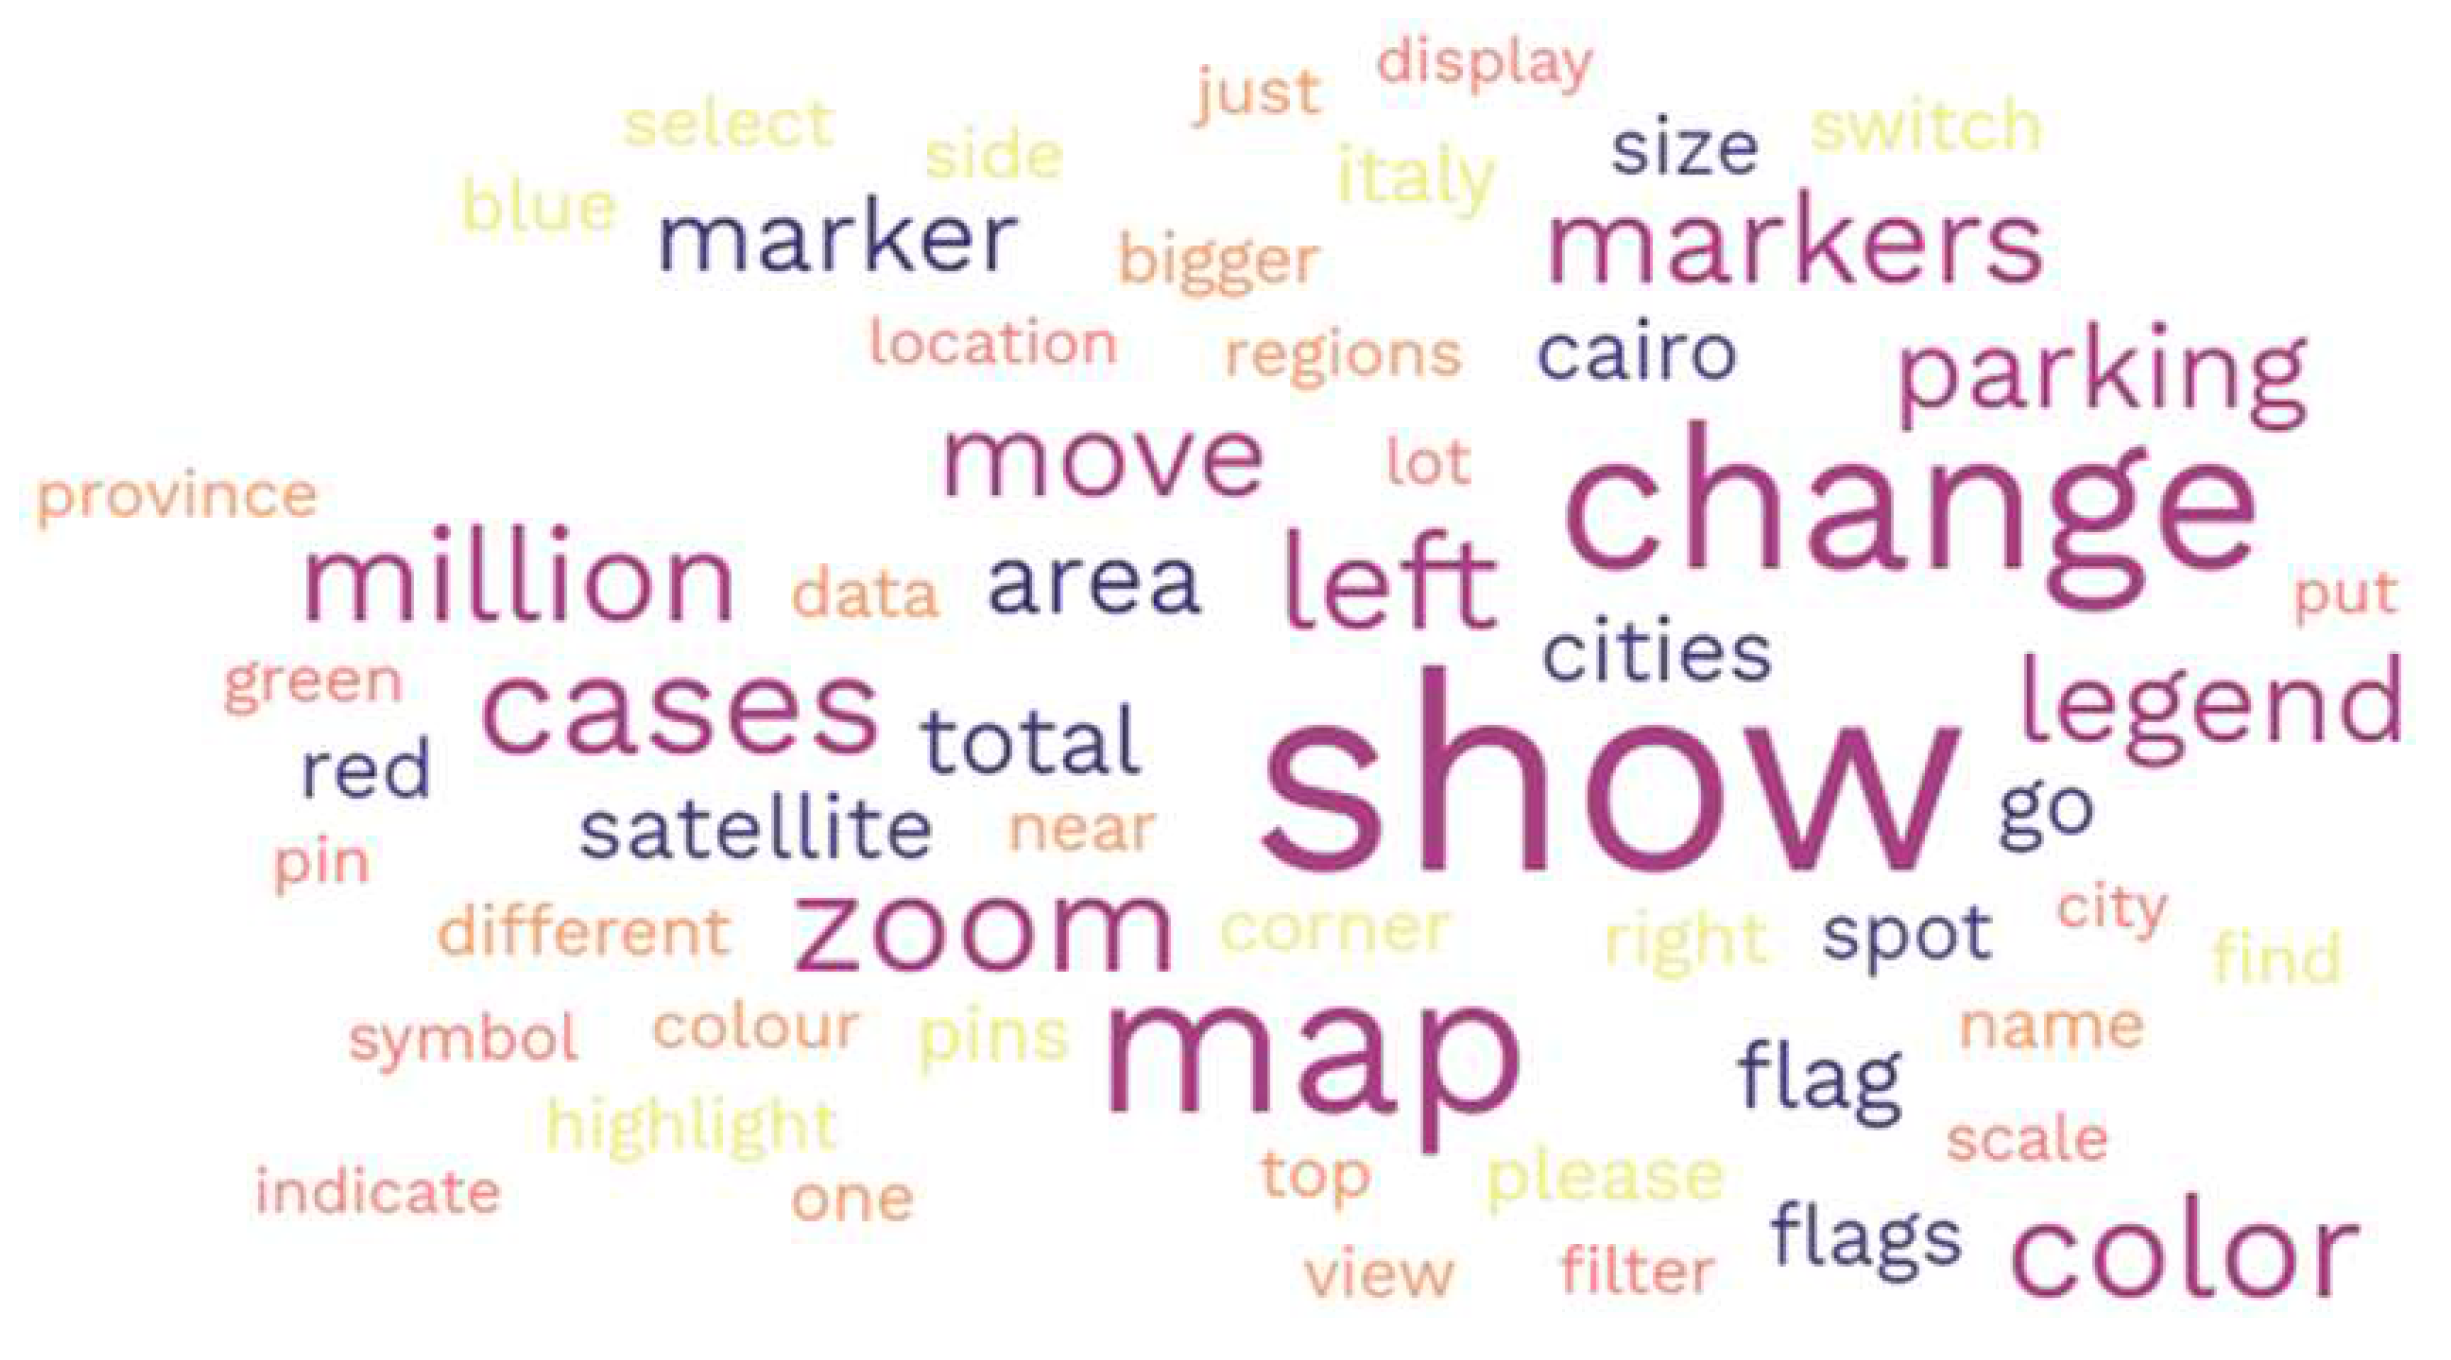
One of the anticipated significant outcomes of the survey was the creation of a word cloud, which visually represents the most frequent words used in the collected archive, offering a quick overview and understanding of user tendencies. In this context, the word cloud helped pinpoint the most frequently used terminologies related to the application’s defined tasks.
Figure 7 portrays the word cloud visualisation that represents the frequency of terms derived from the survey data.
This visualisation provides a snapshot of user tendencies and the most commonly used terminologies in the context of the application’s defined tasks. Through this survey, we gained insights into the potential user interactions and vocabulary usage, enabling us to tailor the application to suit user preferences and needs best.
Figure 8.
The most frequent verbs and words
Figure 8.
The most frequent verbs and words
3.4. Comparison with ChatGPT
This study undertook a comparison to validate the results gleaned from a survey on voice commands for map interaction. To evaluate the reliability and correctness of the collected data, the survey was simulated using ChatGPT, a sophisticated AI language model developed by OpenAI. The aim of comparing responses generated by ChatGPT with the survey data was to gain a deeper understanding of the commands used and to corroborate the findings. Based on the questionnaire’s questions, a vast collection of voice commands was gathered, transcribed into text, and fed into ChatGPT for training and evaluation.
Our analysis revealed the most commonly used verbs in voice commands for map interaction: "show", "change", "locate", "zoom", "find", "move", and "filter". The likelihood of using these verbs varied depending on the specific interaction performed and the user’s background knowledge. For instance, users with an environmental engineering background preferred the verb "locate", whereas those from a computer science background favoured "search". Notably, the AI-generated answers closely mirrored responses from human participants. Both sources utilised similar commands and verbs such as "show", "find", "zoom in", and "locate". However, there were differences in sentence structures - AI responses often used simpler imperative forms, while human responses involved more complex sentences.
ChatGPT mostly understood the intention behind the questions, though the responses varied in terms of terminologies, sentence structures, and probability of appearance. For example, the first question asked after conveying the whole scenario and user profiles was, "Imagine users have a map and wish to command the map with their voice to visualise the Pyramid of Giza. What are the possible commands and their likelihoods in percentages?". The AI’s responses mirrored the ones we collected from human respondents, with the verb "show" used most frequently, confirming our expectations.
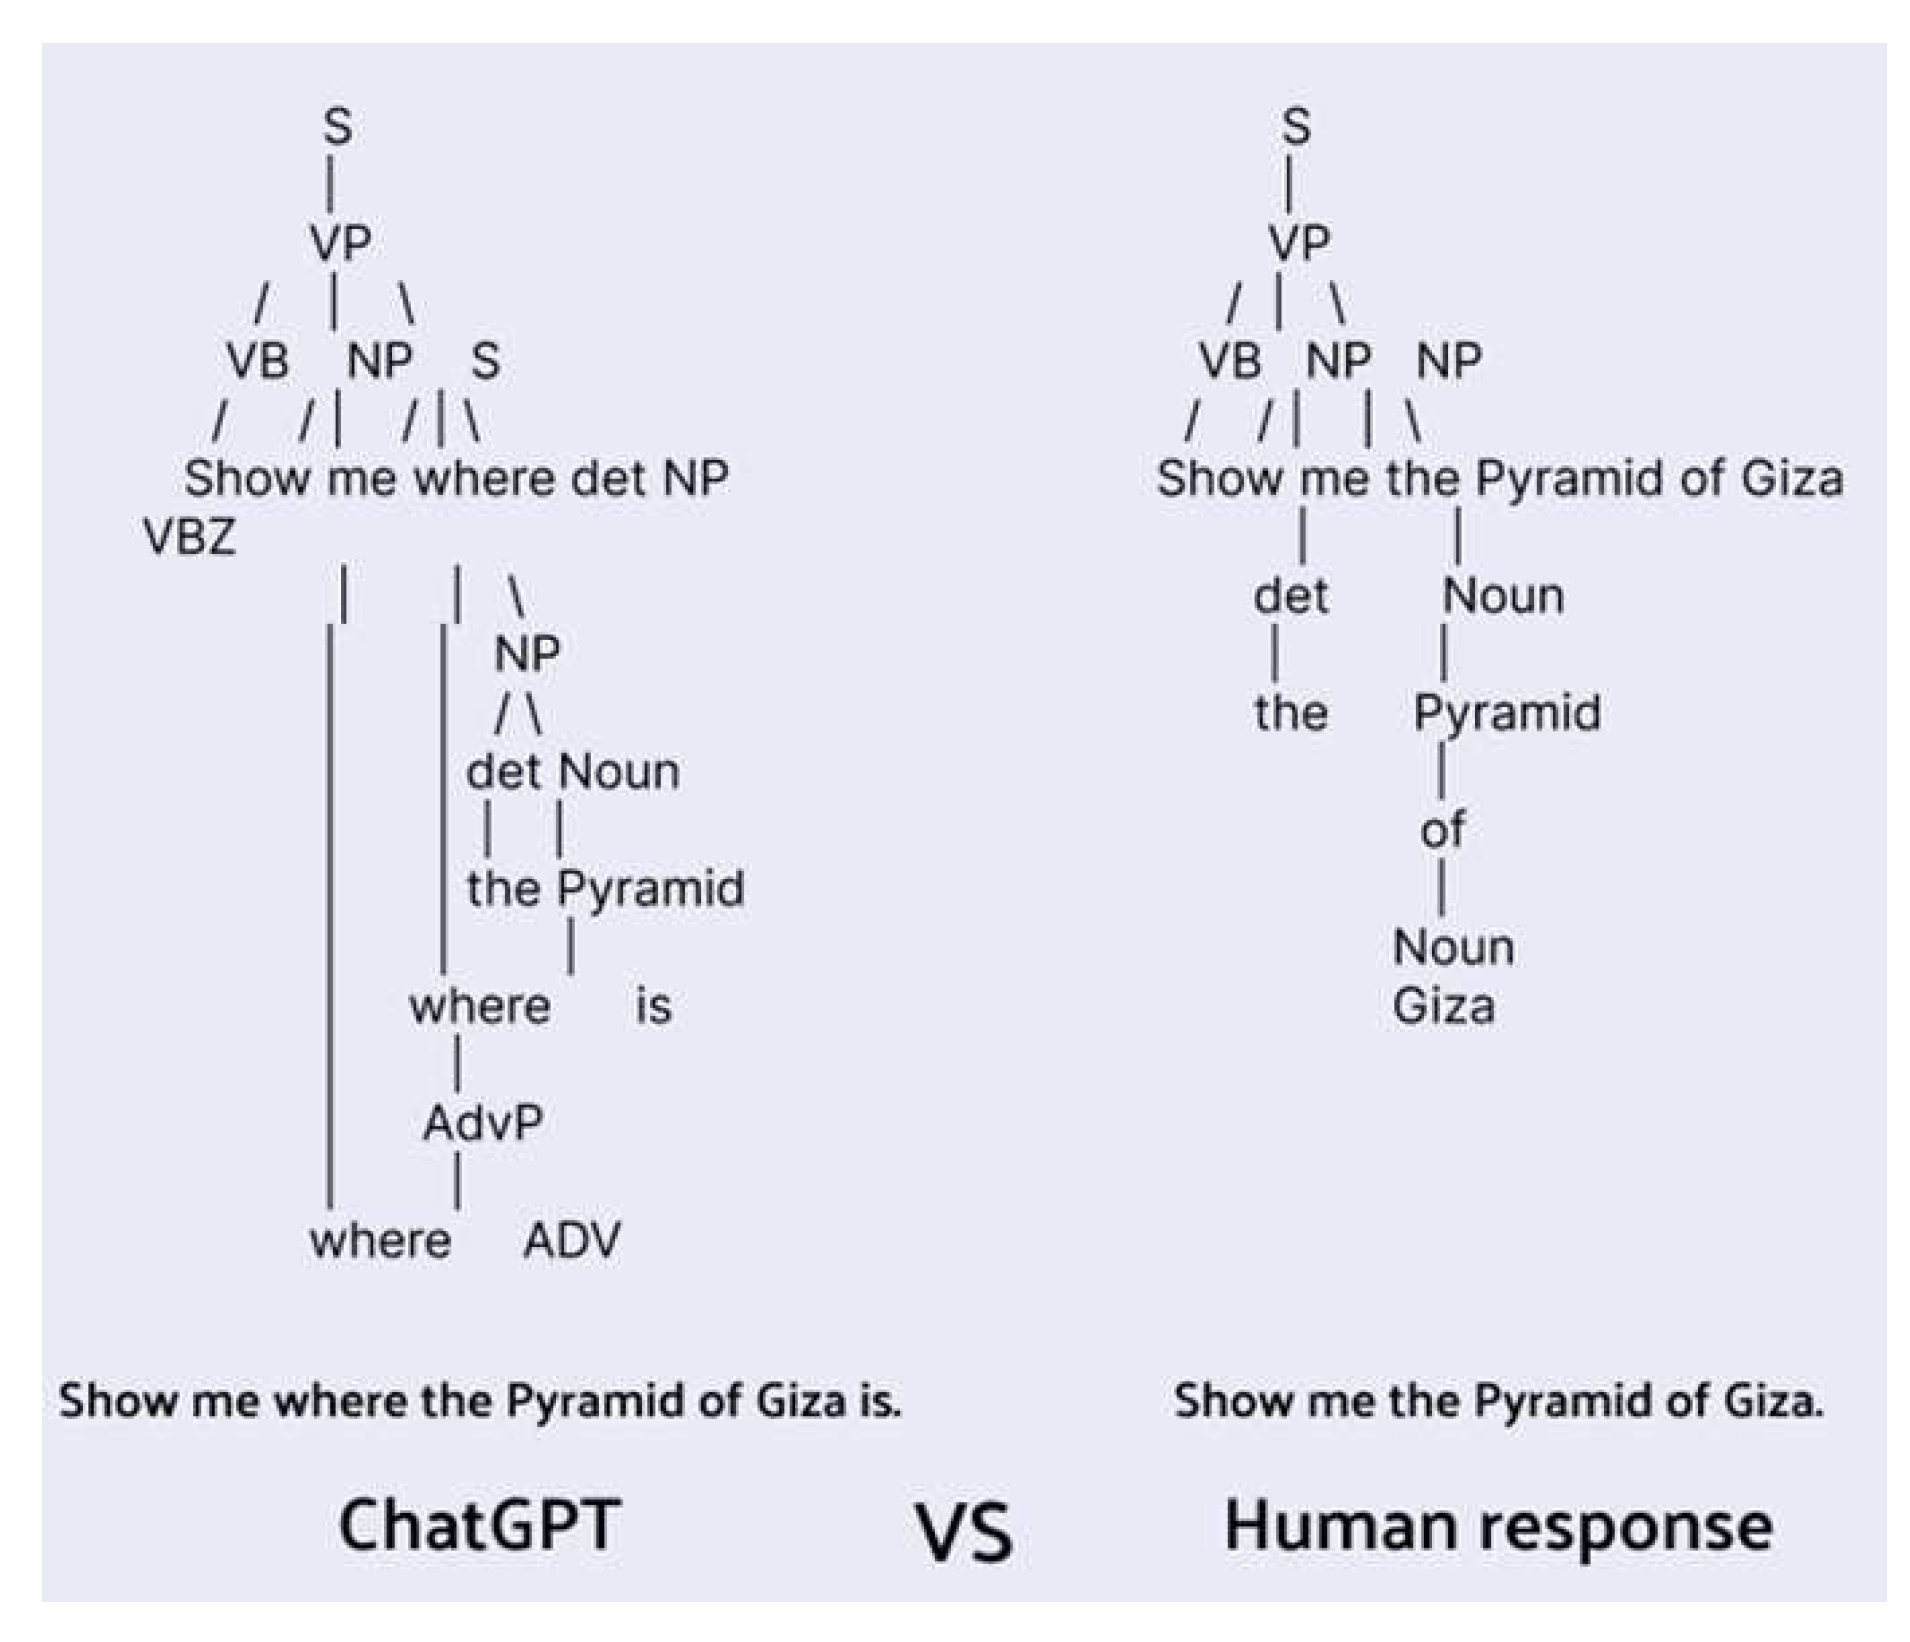
A comparison of the two most frequent sentences from ChatGPT and respondents revealed that AI-generated sentences tended to be more complex and informative, whereas humans typically used simpler and shorter sentences when interacting with a voice chatbot (
Figure 9).
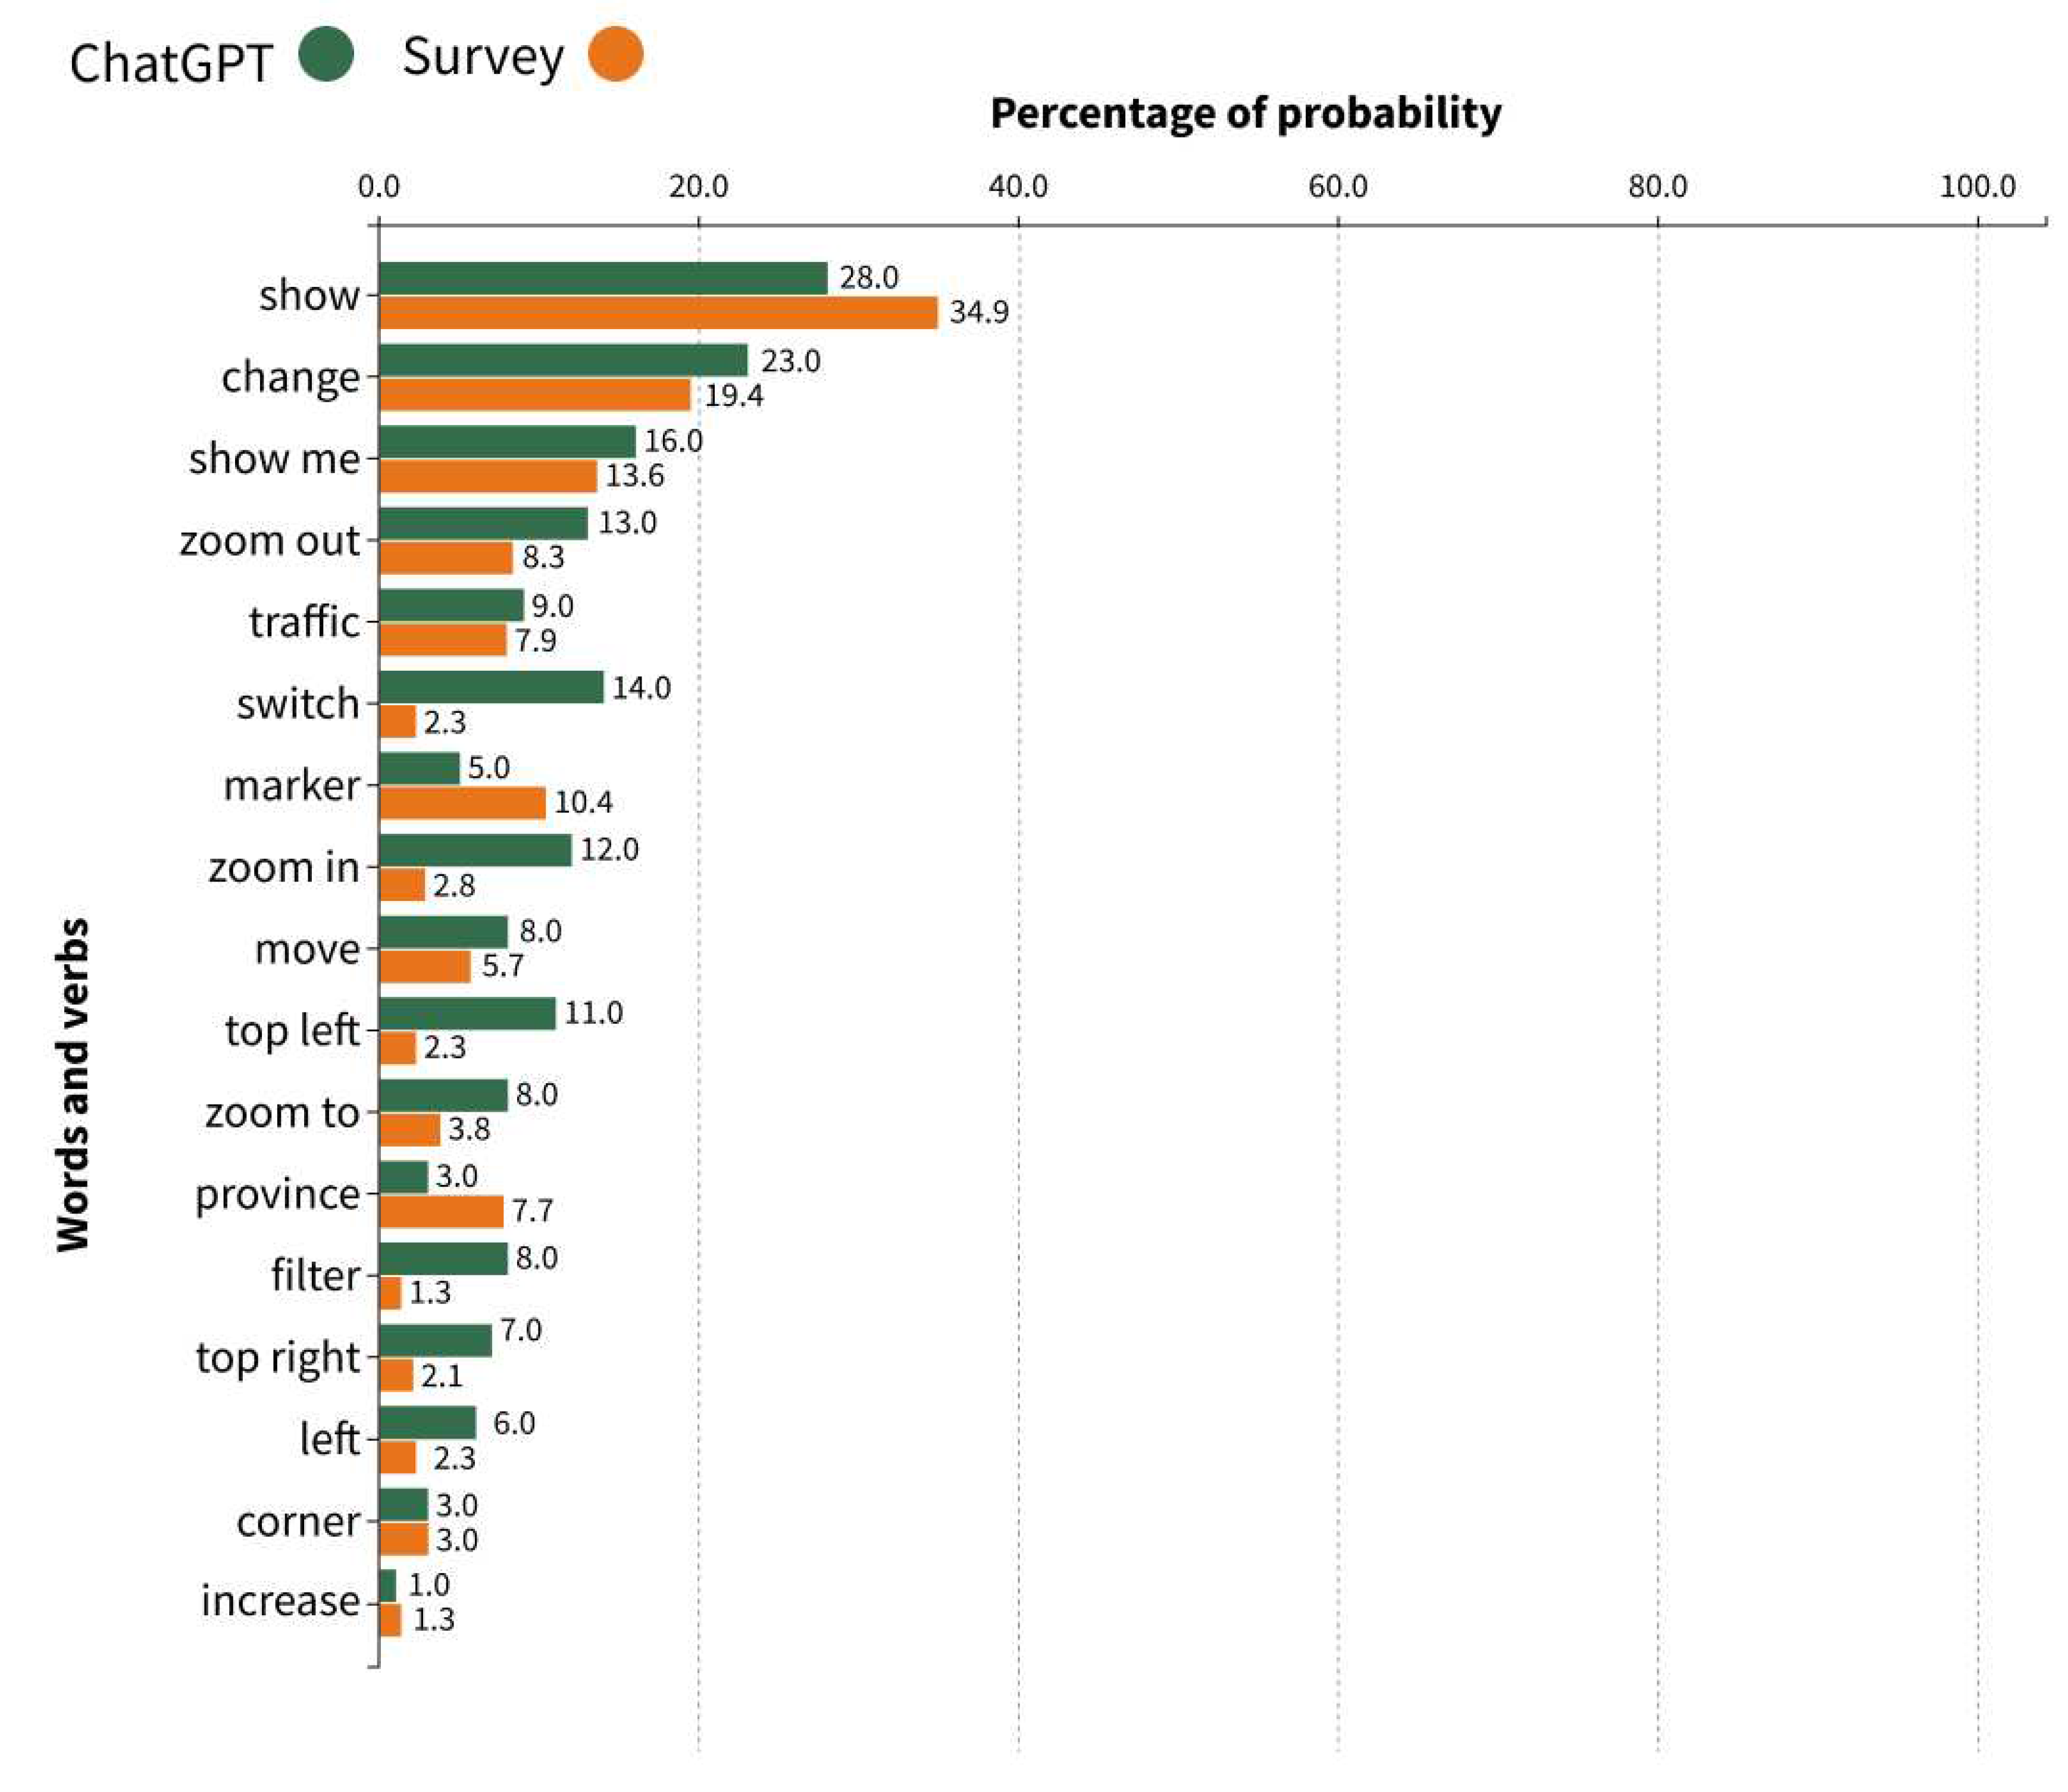
Our comparison between ChatGPT’s responses and those collected from human respondents highlighted similarities and differences. In most cases, the frequency of verb and word usage was similar. However, the complexity of sentence structures showed that humans tend to interact with virtual assistants more generally and simply. This tendency might be due to ease of use, limited time or patience, and advancements in natural language processing and machine learning that enable virtual assistants to comprehend and respond effectively to general queries. The comparison between the percentage of the probability of terminologies’ appearance among the two sources (ChatGPT and Survey) for the mutual words has been visualized in the
Figure 10 .
4. Results
To implement the project, it was necessary to understand and establish the architecture’s backbone. The development process was chosen based on its coherency and compatibility with the interface, guided by the existing architecture of BStreams. The following section provides a detailed explanation of the key elements that shaped the application’s development.
4.1. Frameworks
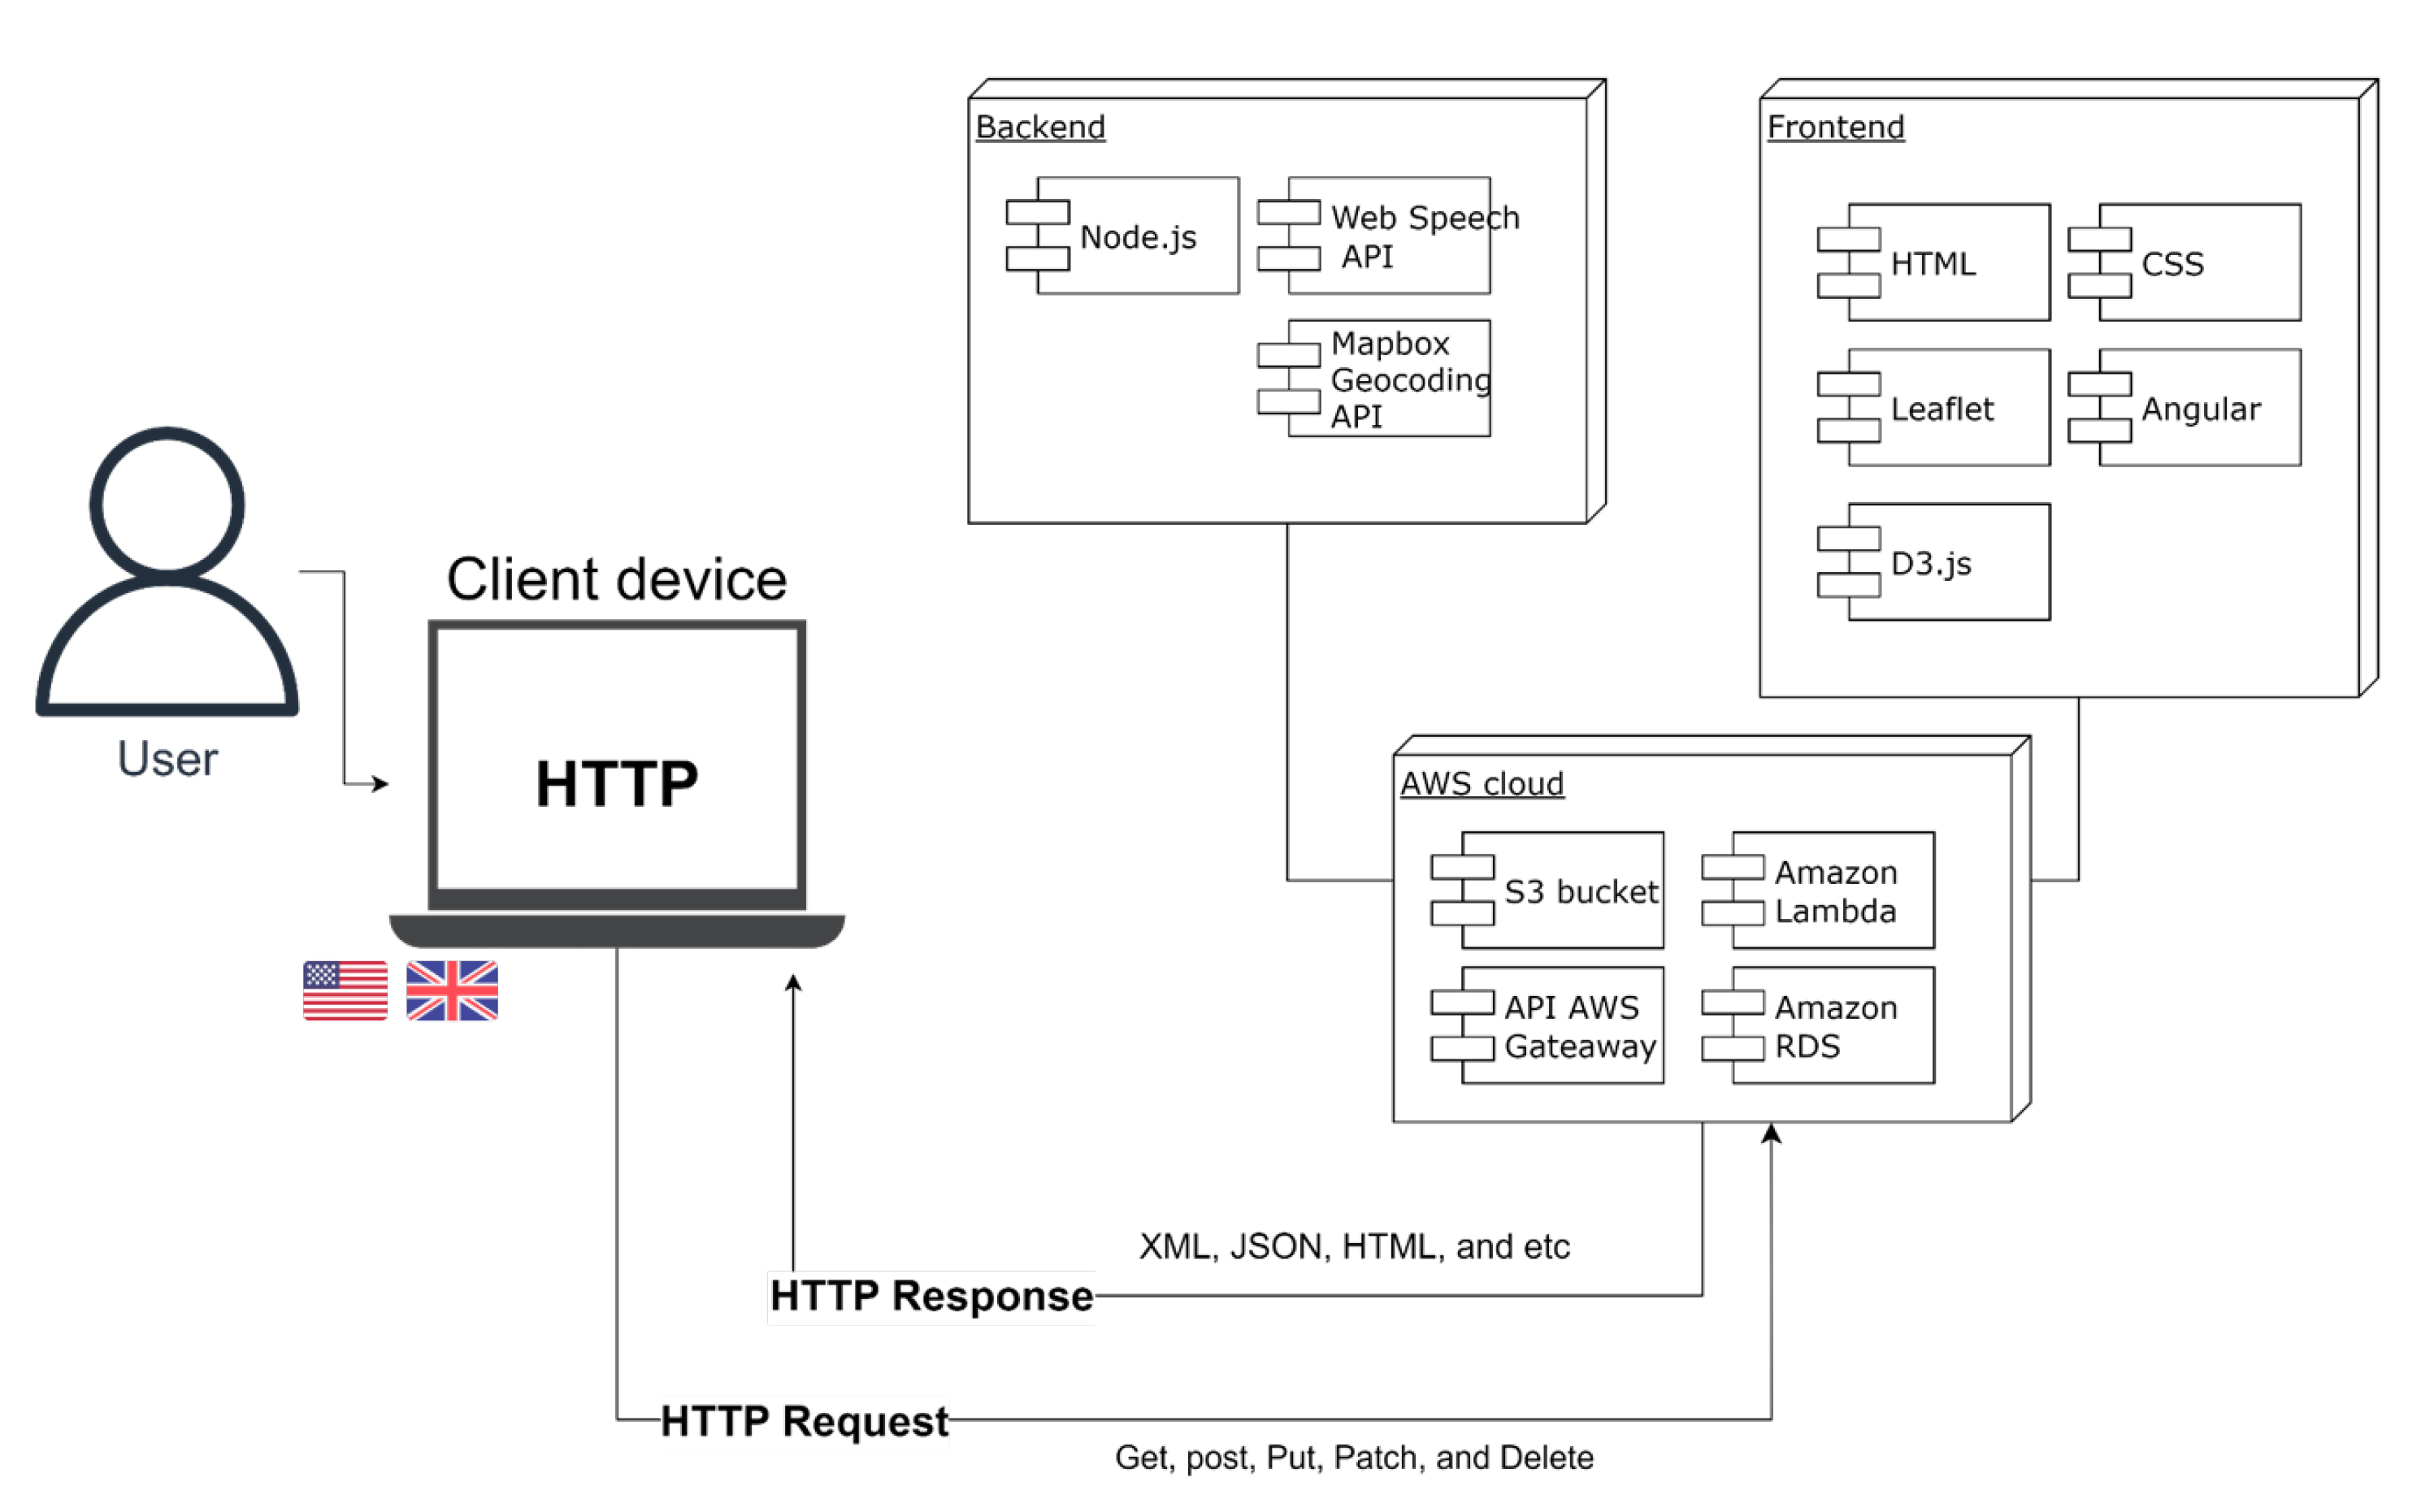
BStreams employs object-oriented programming for visualisations creation. Each chart or graph is a subclass inheriting from a parent class, with the primary parent class, "skeleton.js", containing essential features. Each chart or graph is enriched with its script, supplemented by other child and parent classes. Given the platform’s influence on the architecture and engineering for developing virtual voice assistants and geospatial data visualisation, the application was developed in JavaScript to ensure compatibility with the platform. The application’s architecture follows a REST API, an API that adopts a Representational State Transfer (REST) architectural style, using HTTP requests to access and use data. The main framework is Node.js, an open-source JavaScript runtime environment executing JavaScript code outside a web browser. The application also uses AWS cloud services like S3 Bucket and Lambda functions, with the front end developed using Angular, CSS, and HTML. The two main essential modules with crucial rules in the application are discussed in the following sections.
Figure 11 visualises the architecture of the application.
4.2. Web speech API
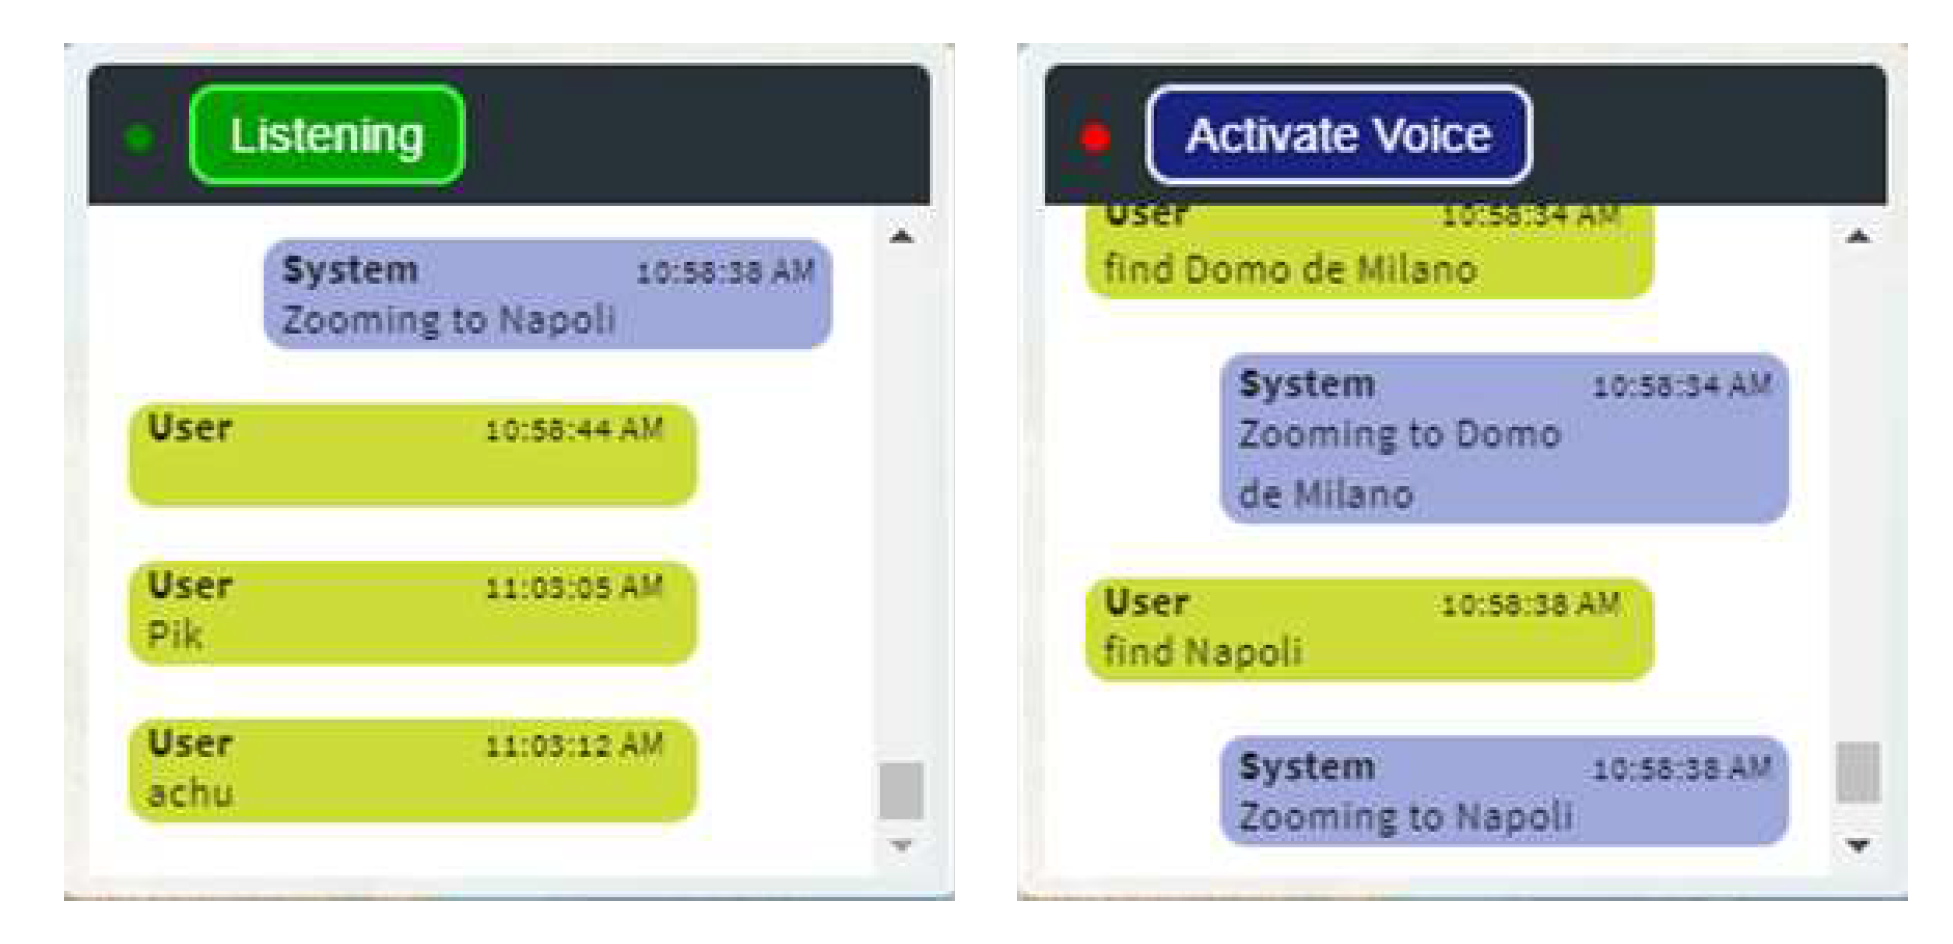
The application integrates the Web Speech API to include advanced speech recognition and synthesis into the web application. This feature allows users to activate the microphone by clicking on a button in the chatbot interface, triggering voice speech recognition in their browser and facilitating communication between the application and the user. The application has been enhanced with a wide range of synonyms based on survey results and application testing, and it uses regular expressions (regex) to match snippets with the received commands and generate the appropriate responses and actions.
Figure 12 shows the chatbot with the button activated for listening and resumed for listening.
4.3. Geocoding API
The application incorporates geocoding and positioning features using the MapBox Geocoding API, enabling users to navigate to desired locations by retrieving coordinates based on location queries. This API connects the application to Mapbox with a token, and regular expressions are used to recognise user input patterns and extract locations. If a match is found, the application sends a Get request to the Mapbox geocoding API to retrieve the latitude and longitude coordinates of the requested location, and the map moves to the specified location using the retrieved coordinates.
4.4. Functions
The engineering behind all the visualization in BStreams is based on creating the main script for each graph or charts as an extended class based on the main parent class which already exists. In JavaScript, the class extends keyword is used to create a subclass that inherits properties and methods from a parent class. This is part of object-oriented programming (OOP) and is called inheritance. The subclass is often called a child class, and the parent class is also known as the base class or superclass. When a class extends another class, the child class inherits all the properties and methods of the parent class. The child class can also define its own properties and methods, and override methods from the parent class. All the available charts and graphs inherit main parents scripts and they can be extended particularly to form their own characteristic, while receiving common features from the parents. The voice map, is not excluded from this engineering and since it provides the two format of geospatial visualization the scripts is a combination of both marker map and thematic map. There are two main important scripts that build the backbone of the applications:
MainSpeechAPI.js
VoiceMapChart.js
The MainSpeechAPI.js as other scripts available in the application programmed in the JavaScript language. It uses the Web speech API to recognize speech and perform certain actions based on the speech input. It defines variables for SpeachRecognition, SpeachGrammerList, and SpeechRecognitionEvent, and initializes other variables and sets default values, which are critical for the connection between the frontend and backend. Basically, this script is the component of the voice application on the backend which by using the Web Speech API and it feature “SpeachRecognition” enables the whole structure to listen, transcript, and recognize the commands. This script is the bridge to connect the defined element on the frontend to the backend and control their functionalities.In the following some of the important functionalities that embedded within the script is represented:
logToBoxArea(): This function logs chat messages into an HTML element, distinguishing between user and system messages. It also recieves the snippets from the user’s commands and print the transcriptions and propitiate commands as the response from the interpreted commands.
interpret(): This function is responsible for interpreting and comprehending the received command. It logs the input snippet and passes it to the "logToBoxArea()" function. It then parses the snippet to determine which command to execute. Regular expressions are used to match commands, such as changing or showing the base map, zooming, panning, and geocoding. If a match is found, the function performs the corresponding action, such as changing the basemap or panning the map to a specific location. The geocoding functionality utilizes the Mapbox geocoding API to retrieve latitude and longitude coordinates based on the user’s input.
Within the interpret() function all of the voice commands with the help of the regular expression technique of JacaSvript has been defined. With the help of the technique we could embedded more terminologies that has been driven from the survey and also from the testing of the application. Each voice command after recognition nd transcription if matches with the existing snippets, calls the proper function to execute the requested action and visualize it on the map. The functions related to the actions has been embedded within the VoiceMapChart.js.
The VoiceMapChart.js script is an extended code, for the skeleton of the voice map chart. As it described the general prospective of the maps on BStreams platform in the section script, this script must follow the same architecture of both maps. Basically, this script containing all the functionalities and features for both the marker and thematic map but programmed specifically for the voice interaction. To adopt the visualization with voice commands, the functions must be rewritten to accommodate the defined commands and callbacks in MainSpeechAPI.js.The following items, are explaining the most important structures and functions of the script VoiceMapChart.js which already is used as a callback in the other MainSpeechAPI.js. Noteworthy, that all the mentioned function here, assign themselves to the global properties of the “window” object. By declaring the window variable with global type, it ensures that the variable is compatible with both the browser and server-side environments, and it can be used to access global variables and functions in a consistent way:
filterAggregates(): Checks if a given code snippet contains keywords related to filtering data. Extracts method and value from the snippet, performs formatting on the value, and calls a function with the extracted parameters.
Resetfilters(): Checks if a code snippet ends with the phrase "reset filters" and logs a message before calling a function to reset the filters.
panTo: Takes an object parameter with latitude, longitude, and place type properties. Uses Leaflet library methods to either fly to or pan to the specified location on the map.
placeZoom: Defines an object with different zoom levels based on place types.
mapLayer: Adds and removes map layers on a Leaflet map based on the provided parameters.
removeLayer/addLayer: Removes or add a specific layer from the map object. Its useful for controlling the basemap layers, Markers, and the shapefile of the thematic maps.
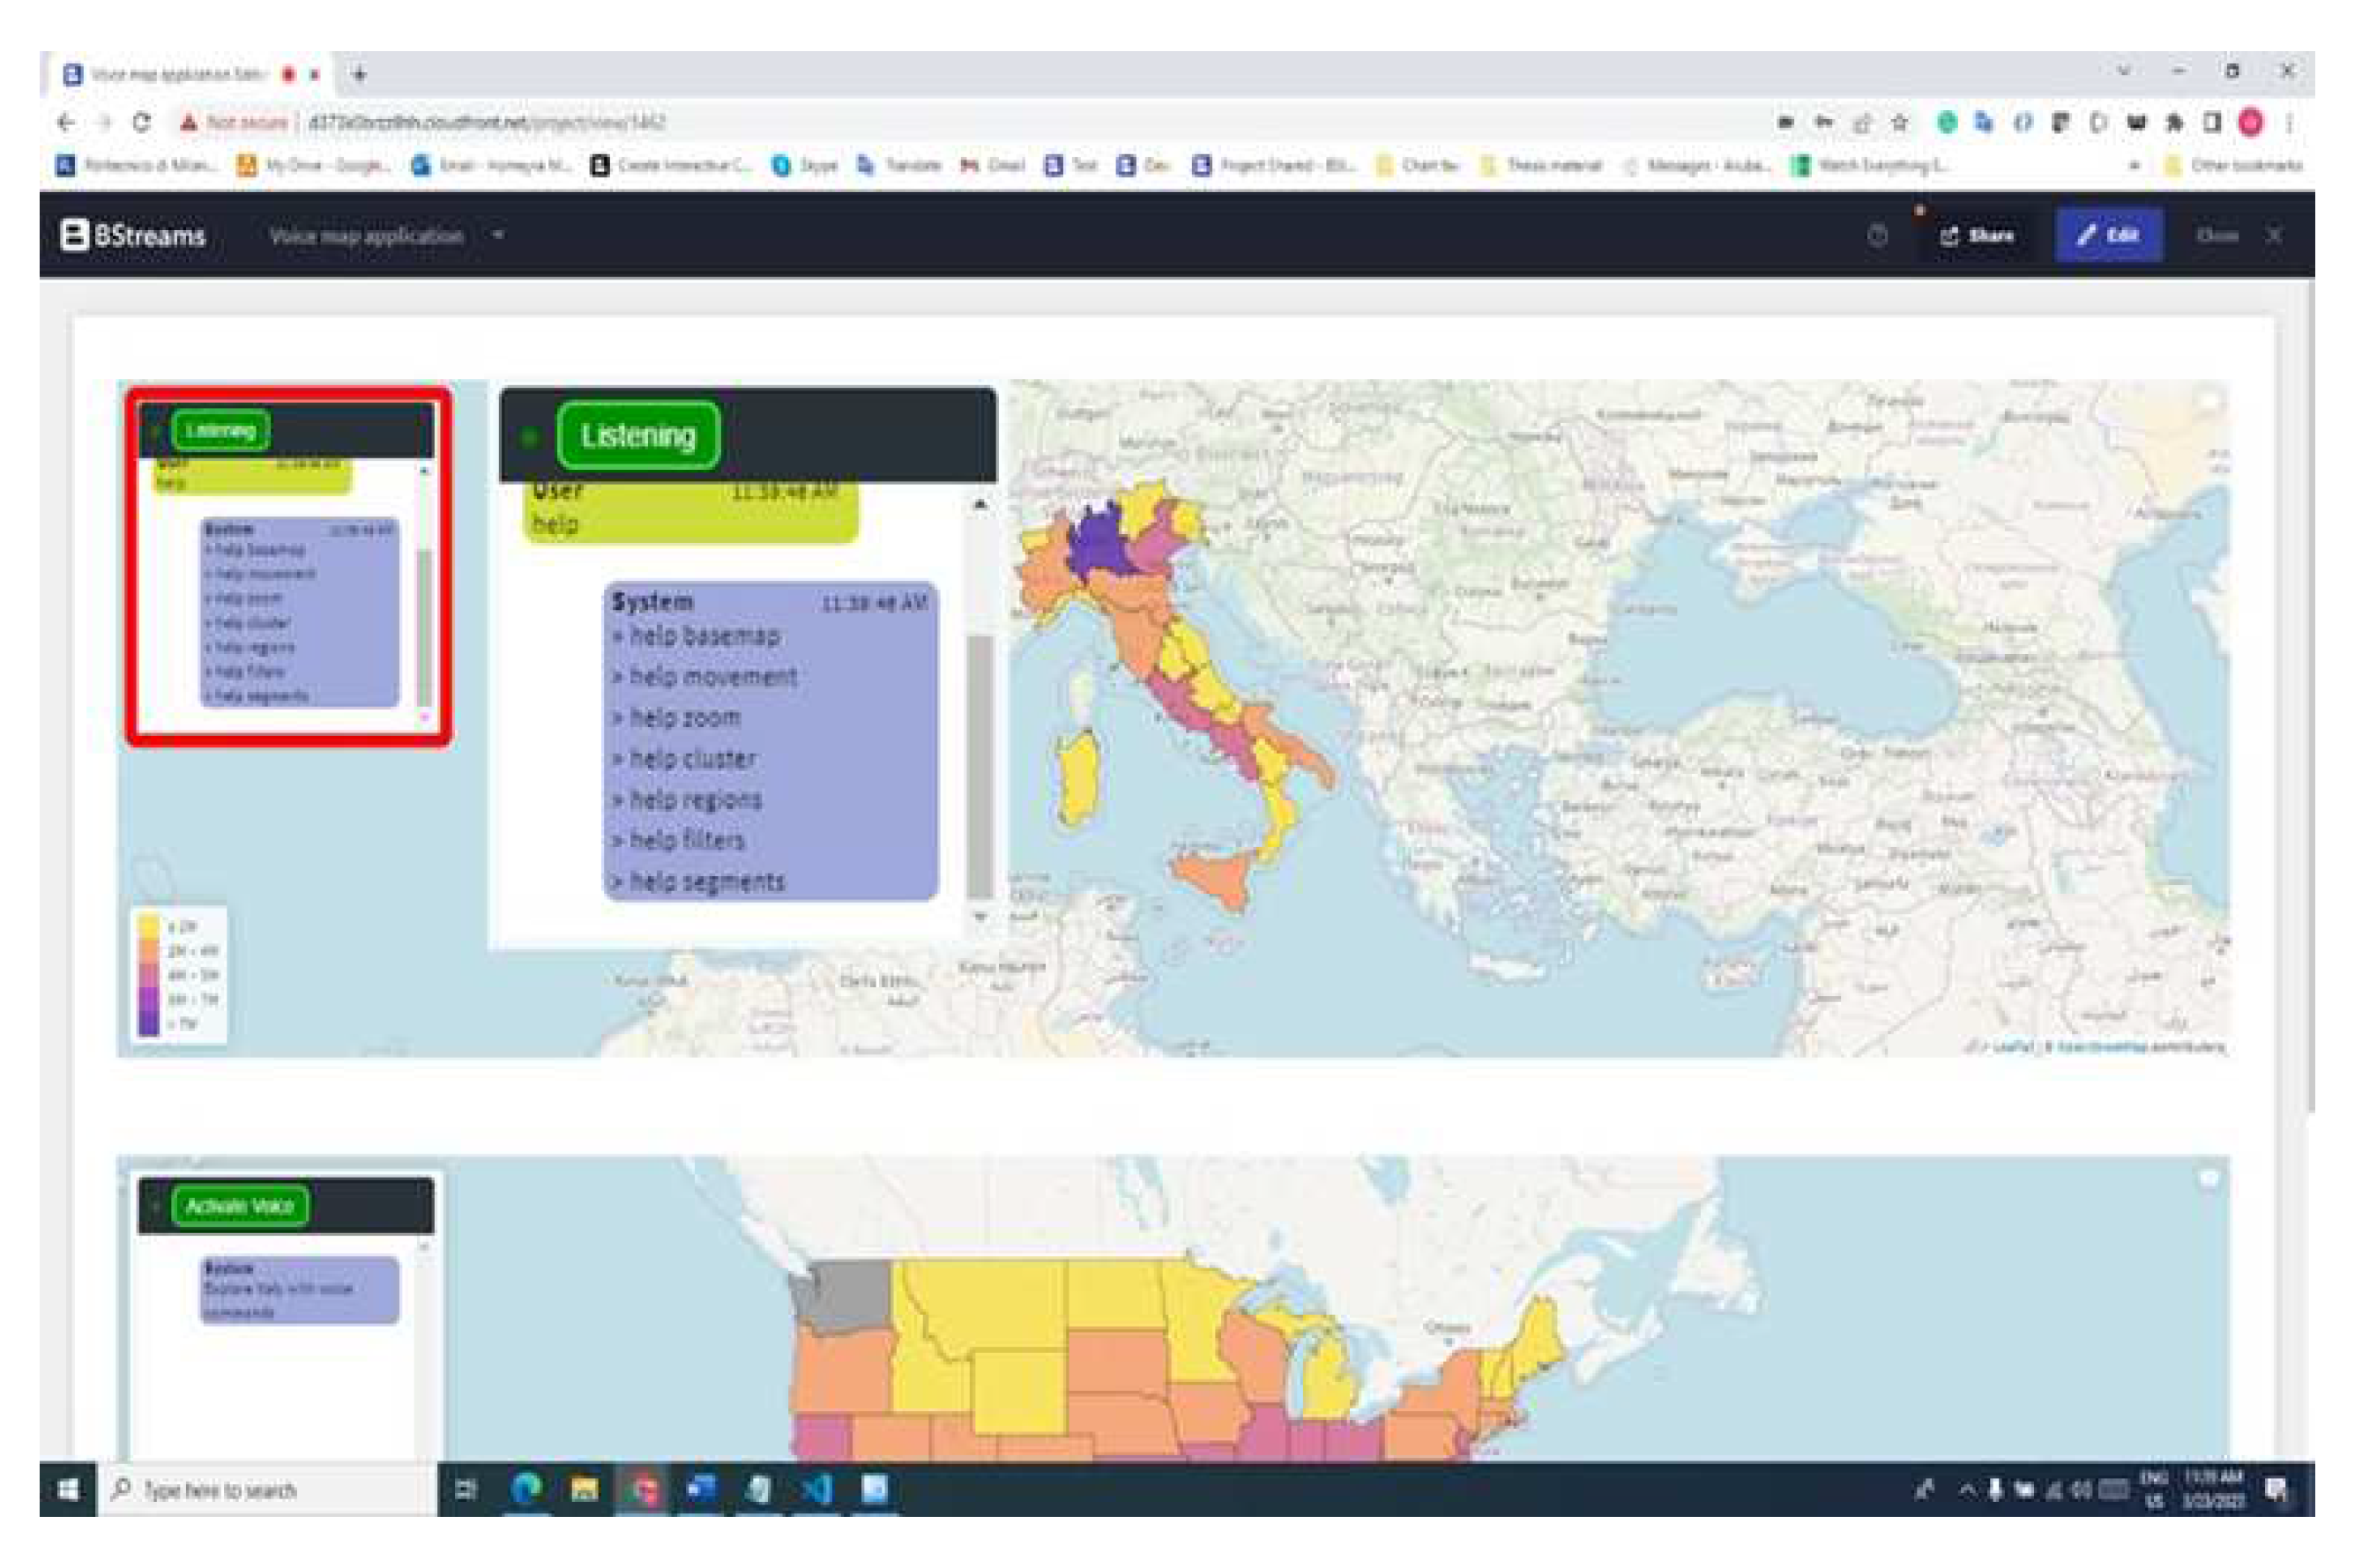
The help command which has shown in the
Figure 13 in the chatbot provides users with information about existing commands. Users can use the "help" or "commands" command to access this feature. The code uses regular expressions to identify patterns related to help or commands. If a pattern is matched, the code generates a response text containing a list of available commands for the specific topic. The code then calls a function called logToBoxArea() to display the list of commands in a designated area on the map interface:
"help basemap" displays commands for changing, hiding, or showing the basemap.
"help movement" lists commands for moving the map in different directions.
"help zoom" shows commands for zooming in or out and navigating to specific locations.
"help cluster" provides commands for showing or hiding markers or clusters, modifying marker appearance, and adjusting cluster radius.
"help regions" lists commands for showing or hiding regions and controlling map opacity.
"help filters" displays commands for filtering data based on specific values, managing regions in the filter, and resetting filters.
"help segments" provides commands for adjusting the number of steps, color palette, and visibility of the legend on the map.
4.5. Figures, Tables and Schemes
As a matter of developing an open-source application all the codes related to the mentioned script is available on a
Github repo. The final application is available on the platform
BStreams, and everyone can access to it.
4.6. Testing
Testing is a critical phase of the software development process, designed to evaluate the application’s usability and gather user feedback. It aims to identify issues, assess user experience, validate functionality, measure performance metrics, and drive iterative improvements. In this phase, participants were asked to complete 18 tasks, and their task completion rates, task time, error rates, and usability feedback were measured. The
Table 1 demonstrates the results that driven from testing of the voice map application..The analysis evaluated the methodology’s effectiveness and identified common issues and opportunities for improvement.
Task Completion Rate: This metric measured the percentage of participants who successfully completed each task. It provided an indication of the effectiveness of the application in enabling users to accomplish their intended goals.
Task Time: The average time taken by participants to complete each task was recorded. This metric assessed the efficiency of the application in terms of task completion speed.
Error Rate: The number of errors made by participants during task completion was measured. It reflected the accuracy of the application in interpreting voice commands and user interactions.
User Satisfaction Score: Participants were asked to rate their satisfaction with the application on a scale of 1 to 10. This metric gauged the overall user experience and their level of contentment with the application’s usability.
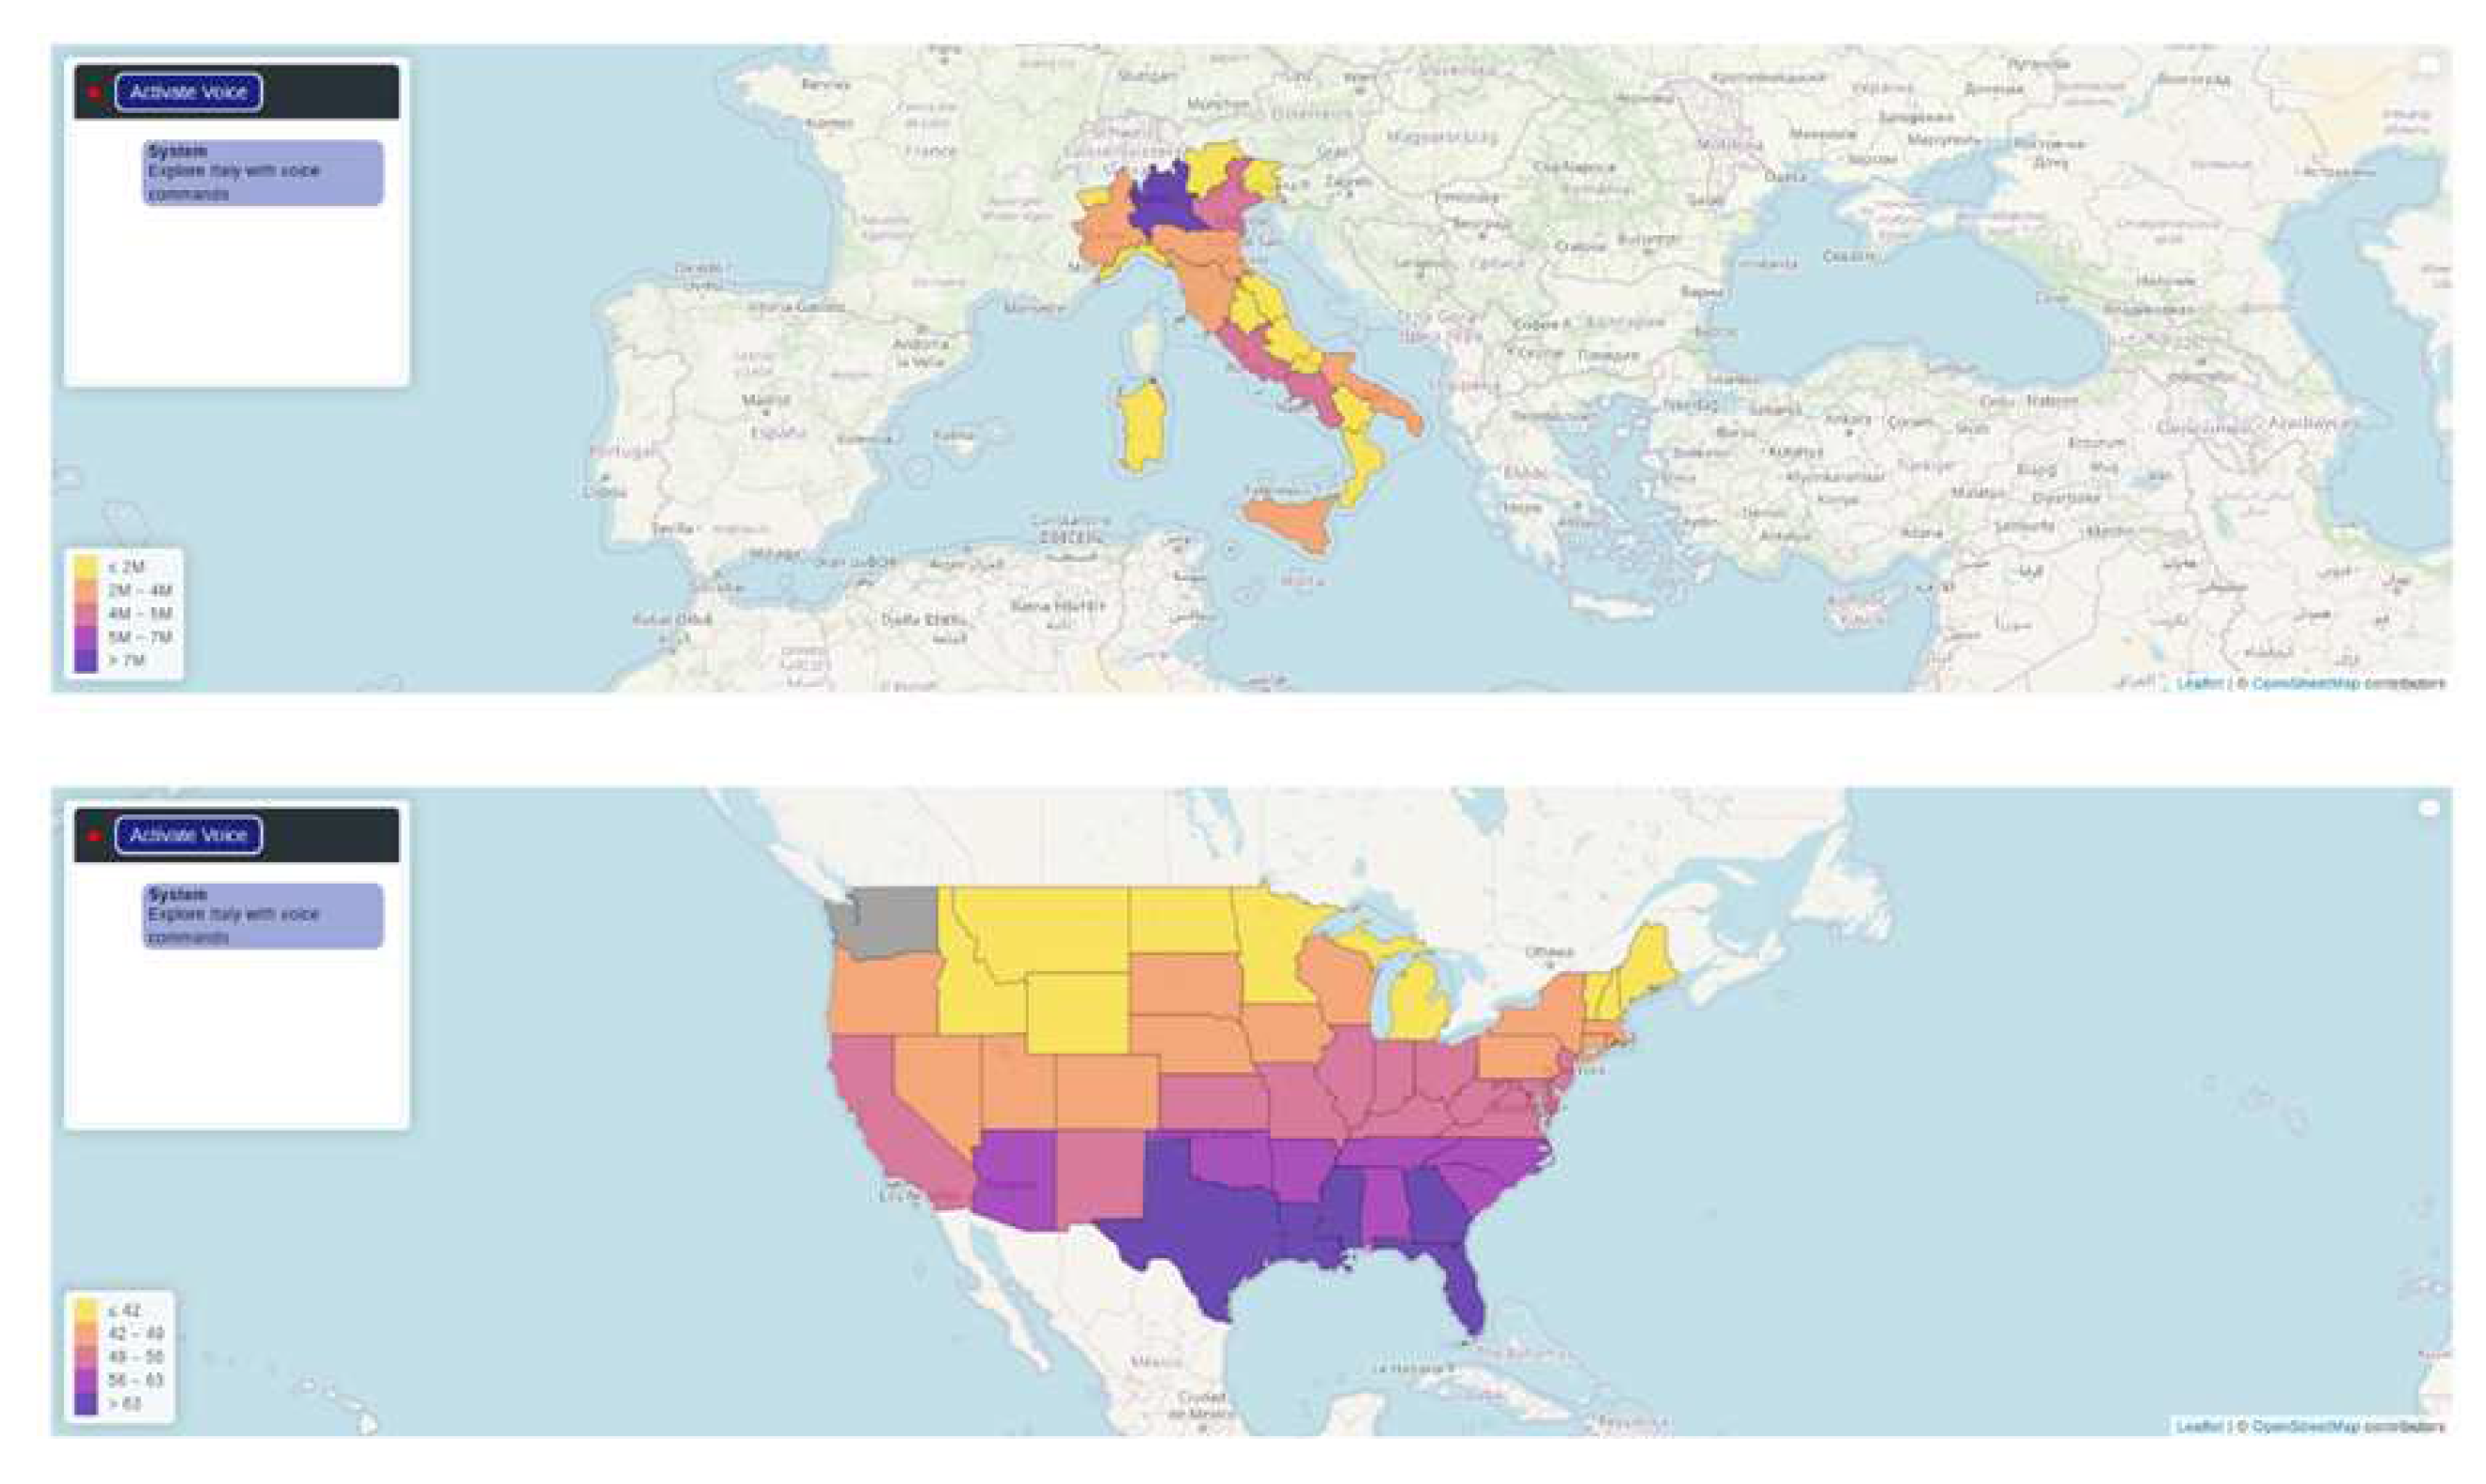
The results suggest that the application is generally usable, efficient, and accurate, with the potential for further enhancements in task completion, efficiency, accuracy, and user satisfaction. Two case studies were conducted to test the application’s functionality and performance, focusing on visualising the COVID-19 cases in Italy during 2020 and the mean temperature trends across the USA from 1900 to 2022.
4.7. Discussion
Visual representations of data stimulate creativity and simplify the identification of patterns in complex geographical data [
12]. With the rise of web-based platforms, the democratisation of geospatial visualisation has expanded, making it increasingly accessible. Embedding these applications online empowers users to contribute to creating and visualising geospatial data, which can lead to uncovering insights with societal implications (
Figure 14). Integrating a voice virtual assistant into a geospatial data visualisation and processing application enhances accessibility and interactivity. Virtual assistants provide an intuitive way to interact with data, making it more approachable to users who may find traditional interfaces challenging.
However, challenges persist, particularly with virtual assistants’ understanding and processing of user commands and users’ cognitive load due to task complexity and domain knowledge. This study aimed to address these challenges by developing a specialised voice user interface for geospatial data visualisation, using data collected to enhance human-computer interaction within this field. The study involved conceptualising existing tasks into a discourse methodology for geospatial data, collecting corpus and terminologies for voice commands, and testing the developed application. One interesting finding was that people use fewer and shorter words when interacting with a map, suggesting the need for precise and straightforward commands in voice assistants. Testing the application revealed further challenges, notably in natural language processing and understanding accents. Users expected the application to interpret short, easily understandable commands, but various accents led to transcription errors and incorrect command execution.
5. Conclusion
The development of specialized technology for voice user interfaces supporting geospatial data visualization and processing is an exciting and rapidly evolving field. It involves leveraging natural language and voice-based systems to enhance the user experience and improve accessibility to geospatial data. By using voice commands, users can interact with maps, spatial datasets, and location-based services in a more intuitive and seamless manner. However, there are still challenges to overcome in this field. One major challenge is related to domain knowledge. Geospatial data encompasses a wide range of information, including maps, satellite imagery, spatial databases, and more. Developing voice-based systems that can accurately understand and respond to user queries in this domain requires deep knowledge and understanding of the underlying spatial concepts. Another challenge lies in natural language processing (NLP). NLP techniques are crucial for accurately interpreting user commands and extracting relevant information from geospatial data sources. Improving the accuracy and robustness of NLP algorithms specific to geospatial data is an ongoing area of research and development.Despite these challenges, the potential benefits of voice-based systems for geospatial data are significant. Voice assistants can be employed in various fields, such as smart cities and environmental monitoring. For instance, users can ask questions about air quality, traffic congestion, or locate nearby amenities using voice commands, making the interaction more efficient and user-friendly.
To further advance this field, several future work perspectives were identified. These include incorporating machine learning algorithms to enhance natural language processing capabilities, developing multilingual voice assistants to cater to a broader user base, exploring the use of augmented reality technologies to supplement voice assistants, and investigating the application of voice command technology in remote sensing applications, such as detecting and monitoring environmental changes. Additionally, efforts should focus on developing and improving existing programs and applications specialized for smart home assistants like Alexa, specifically for geospatial data queries in the context of smart cities and smart homes. Finally, user studies should be conducted to evaluate the usability and user satisfaction of voice assistants for geospatial data visualization and processing.
References
- Haklay, Muki. How good is volunteered geographical information? A comparative study of OpenStreetMap and Ordnance Survey datasets. Environ Plann B Plann Des 2010, 37, 682–703. [CrossRef]
- Austerjost, J.; Nordmann, A.; Reiser, D.; Th"unemann, A.F.; Ochse, N.; ten Brink, T.; Biskup, M.; Staiger, D. Introducing a Virtual Assistant to the Lab: A Voice User Interface for the Intuitive Control of Laboratory Instruments. SLAS Technol 2018, 23, 476–482. [Google Scholar] [CrossRef] [PubMed]
- Blanco, T.; Mart’ın-Segura, S.; de Larrinzar, J.L.; B’ejar, R.; Zarazaga-Soria, F.J. First Steps toward Voice User Interfaces for Web-Based Navigation of Geographic Information: A Spanish Terms Study. Appl. Sci. 2023, 13, 2083. [Google Scholar] [CrossRef]
- Lai, P.-C.; Degbelo, A. A Comparative Study of Typing and Speech For Map Metadata Creation. AGILE: GIScience Series 2021, 2, 1–12. [Google Scholar] [CrossRef]
- Gilbert, T. (Newcastle University, Newcastle, UK) VocalGeo: Using Speech to Provide Geospatial Context in the Classroom. 2020. Publisher: figshare. [CrossRef]
- Cali, D.; Condorelli, A.; Papa, S.; Rata, M.; Zagarella, L. Improving intelligence through use of Natural Language Processing. A comparison between NLP interfaces and traditional visual GIS interfaces. Procedia Computer Science 2011, 5, 920–925. [Google Scholar] [CrossRef]
- Wang, H.; Cai, G.; MacEachren, A.M. Geo dialogue: A software agent enabling collaborative dialogues between a user and a conversational GIS. In Proceedings - International Conference on Tools with Artificial Intelligence, ICTAI; 2008; Volume 2, pp. 357–360. [Google Scholar] [CrossRef]
- Jacobson, R.D.; Sam, K. Multimodal WebGIS: Augmenting Map Navigation and Spatial Data Visualization with Voice Control. In Proceedings of the 9th AGILE International Conference on Geographic Information Science; 2006. [Google Scholar]
- Hunter, A.; Tao, C. UBIQUITOUS GIS, DATA ACQUISITION AND SPEECH RECOGNITION. 2002. Available online: https://www.researchgate.net/publication/250884232_UBIQUITOUS_GIS_DATA_ACQUISITION_AND_SPEECH_RECOGNITION.
- Young, T., Hazarika, D., Poria, S. and Cambria, E. Recent trends in deep learning based natural language processing. ieee Computational intelligenCe magazine 2018, 13, 55–75. [CrossRef]
- Belinkov, Y. and Glass, J. Analysis methods in neural language processing: A survey. Transactions of the Association for Computational Linguistics 2019, 7, 49–72. [CrossRef]
- Dodge, M. Mapping and geovisualization, 2nd ed.; Aitken, S. C., Valentine, G., Eds.; Approaches to Human Geography, 2014; pp. 289–305. [Google Scholar]
|
Disclaimer/Publisher’s Note: The statements, opinions and data contained in all publications are solely those of the individual author(s) and contributor(s) and not of MDPI and/or the editor(s). MDPI and/or the editor(s) disclaim responsibility for any injury to people or property resulting from any ideas, methods, instructions or products referred to in the content. |
© 2023 by the authors. Licensee MDPI, Basel, Switzerland. This article is an open access article distributed under the terms and conditions of the Creative Commons Attribution (CC BY) license (http://creativecommons.org/licenses/by/4.0/).
