Submitted:
04 July 2023
Posted:
05 July 2023
You are already at the latest version
Abstract
A general method is presented that permits enantiomers, originally present in a low enantiomeric excess (%ee1), to accumulate in a high %ee (%ee2) without a chiral source present. An equation was derived that demonstrates the final %ee2 of any unreacted chiral starting material will become higher when that starting material has reacted to generate an additional chiral center, hence forming two sets of diastereomeric enantiomeric products. Importantly, chiral amplification factor (multiples), %ee2/%ee1, depends on the yield of this reaction (p), which exhibits a nonlinear increase in amplification as p approaches 100%. This process is inevitable. It represents a possible route by which small initial %ee1 values of prebiotic molecules could have been raised to high %ee2 contents during the pre-evolution of life period on Earth, without the need for an added chiral source to be present. This predicted behavior was then experimentally verified in Pictet-Spengler reactions of L-tryptophane methyl ester (L-TME) samples present in low enantiomeric excess (%ee1) with biacetyl or oxaldehyde (model reactions) run to various yields. Each reaction generates stereoisomer products, and chiral amplification of the L-TME’s initial %ee1 values to higher %ee2 values occurs in the unreacted (recovered) L-TME. Repeated cycles of these reactions create very high L-TME %ee values. Self-cyclodimerization of low %ee1 L-amino acids with their D-enantiomers to generate L,L-, D,D- and L,D-cyclic products were computationally studied, leading to the same conclusion. Small %ee1 values are enhanced to larger %ee2 in the unreacted starting materials.
Keywords:
chiral amplification/enrichment
; enantiomer
; prebiotic era
; amino acid
1. Introduction
Many reports until now have been exhibited that origin of life requires explanations from chemistry, especially organic stereochemistry. [1] For example, L-amino acids must have initially been amplified to a reasonably high %ee to permit synthesis of L-peptides in prebiotic conditions after L-amino acids had initially been formed with a low %ee. [2,3,4,5,6,7,8,9] This raises the general question: could L-amino acids have been amplified without any chiral ligand or chiral auxiliary present, and if so could other enantiomers originally formed with a low %ee value also have been amplified by following the same general principle? As one of the most fascinating study in this field that has been widely investigated recently. [10] In this study, we report that L-amino acids can be amplified to high %ee magnitudes without requiring other chiral sources to be present. Furthermore, this is just one example of other enantiomers that can be amplified from very low %ee magnitudes to high %ee values in this same manner.
There were two possible ways to increase the (R)- or (S)-enantiomer content in the prebiotic pool. The first is to directly to amplify the enantiomer’s %ee. L-amino acids with tiny %ee values are known to be formed through various routes. [2,3,4,5,6,7,8,9] These include selective D-amino acid decomposition from racemic amino acids by circularly polarized light, [11,12,13] chiral asymmetric breaking, [14,15,16] or other ways. [17,18,19] L-amino acids present in small %ee values might be amplified by autocatalysis, [19] or amplification in the presence of a chiral auxiliary. [17,18,20,21,22]
It remains necessary to investigate how chiral amplification could have occurred under prebiotic conditions. No previous chiral amplification of a chiral compound present in a tiny %ee value (e.g., 1%ee of L-amino acid) directly to a reasonably high %ee value (for example 30%ee) has been reported under simulated prebiotic chemical conditions in the absence of chiral source. We now report a general amplification method that inevitably leads to this result. It is fascinating that this problem is still unsolved despite the thousands of publications which have appeared on origin of life. [23] In this study, a possible explanation occurring by a natural route through typical organic reactions is revealed that demonstrates how the %ee values of reactants with initially small %ee’s are amplified as the reaction yields changed. Both computational and experimental investigations were performed under reasonable prebiotic conditions.
2. Results
2.1. Theoretical investigation of chiral amplification without any chiral source
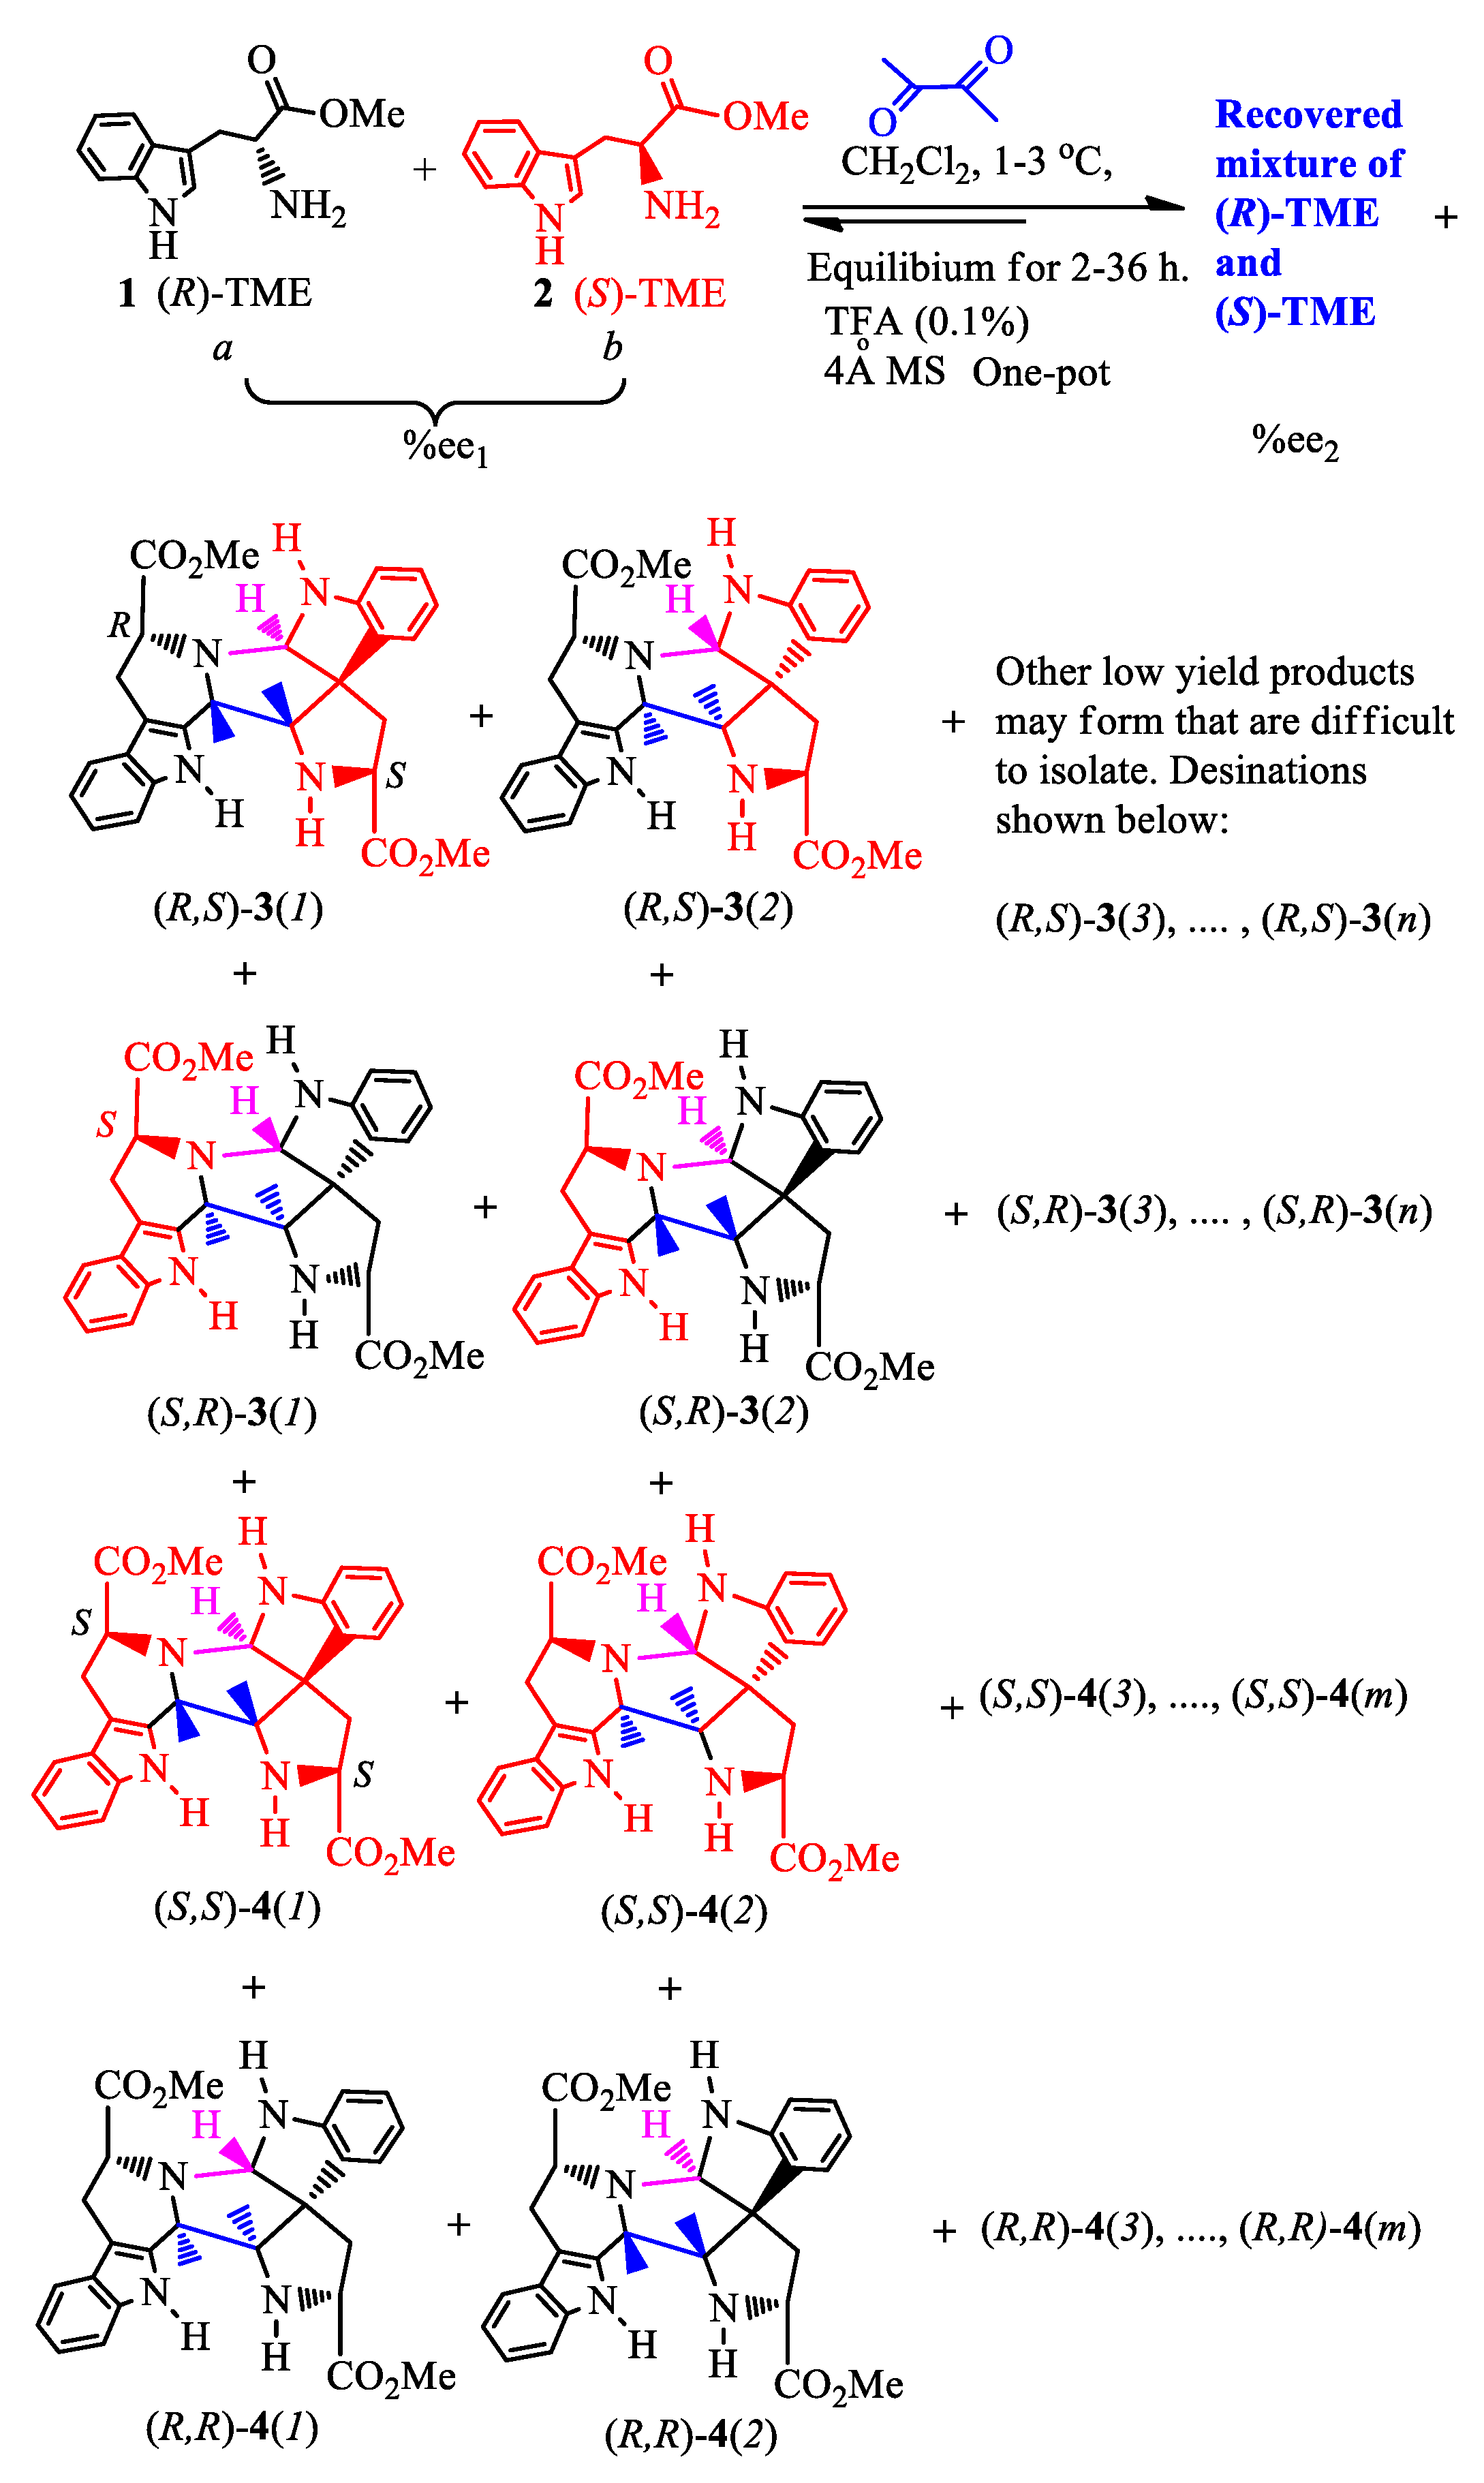
Consider the (R)-molecule ((R)-M, 1) and its enantiomer (S)-M (2), each of which can react with a bis-functional group-containing reactant (bis-FG). This process is shown in Scheme 1 (Item 1 in SM). The reaction was performed at 0 to 5 oC in dichloromethane (see experimental sections for more details). Scheme 1 illustrates the reaction of tryptophan’s methyl ester (TME), where a small %ee excess of the (S) enantiomer (L-TME) exists, with bis-functional group reagent 2,3-diketobutane. The TME’s amine reacts with the first ketone group of 2,3-diketobutane initiating the Pictet-Spengler reaction to afford a six-membered ring moiety. [24,25] This is followed by a second TME reacting with the keto group via another Pictet-Spengler sequence to form compounds 3 (racemates 3(1) and 3(2)) and 4 (racemates (4(1) and 4(2)) [26,27] (Scheme 1, Items 2-6, Figures S1–S7 and Tables S1–S10 in SM) using various methods. [28,29,30,31] Since the two compounds polarities were quite close, it is difficult to obtain their very purity in a high yield. The isolated yields were 18% for 3 and 35% for 4, a total of 53% yield. Also, the circular dichroism calculations permitted absolute configuration assignments of the chiral centers (Item 8, Figure S8 and Table S11 in SM). [32,33,34,35] This reaction is used later in the experimental validation of general equations (1-8) which will be developed herein to explain the relationship between the enantiomeric excess of the unreacted TMEs to the percent conversion of their initial amounts. Two molecules of this ester are incorporated into the product by amine condensation with this bis-FG’s carbonyls followed by the Pictet-Spengler reaction to form product groups 3 and 4. This reaction’s products all carry the original chiral center present in the TME enantiomers that were incorporated into 3 and 4. Now this process will be designated in a compact manner illustrated in Scheme 2 to allow the derivation of Equations (1)–(8).
2.2. A simplified expression of the four reaction cases and amplification equations
The representative TME reaction in Scheme 1 can be divided into four reaction cases which afford the corresponding product groups 3 and 4. These products are shown in Scheme 1 and used in Scheme 2. In the first case, one molecule of (R)-1 and one molecule of (S)-2 react with bis-FG to form products (R,S)-3(i) (i=1 to n), here i is the ith product number of group 3, and n is final product number of 3. For example, the first product (i=1) was obtained (see the details later). It is designated as (R,S)-3(1). The second product is designated as (R,S)-3(2). The second reaction case occurs when (S)-2 and (R)-1 reacts with bis-FG to afford (S,R)-products 3(i). These are the enantiomers of (R,S)-3(i), and the number of these formed in case 2 are the same as (R,S)-3(i) in case 1. Case 3 occurs when two molecules of (R)-1 react with one bis-FG to afford compounds (R,R)-4(j) (j=1 to m), where j means the jth product of 4 and m is final product of the group numbered 4. Finally, in case 4, two molecules of (S)-2 react with bis-FG to produce (S,S)-4(j) (j=1 to m). Thus, the total of all products 3 formed in these four cases are the sum corresponding to all of (R,S)-3(i) and (S,R)-3(i) as illustrated in Scheme 1. This same procedure also applies to totaling all of the compounds, 4.
In Scheme 2, %ee1 means the initial enantiomeric excess of the (R) and (S)-starting materials, D- and L-TME, 1 and 2. The %ee2 is the enantiomeric excess of the recovered TME from the remaining solution. Scheme 1 can be revised in a compressed format as Scheme 2. Scheme 2A re-expresses the four reaction cases, while 2B summarizes these four cases as a general formula for further development of equations 4 to 8. The term p represents combined yield of all the products in group 3. Therefore, the yield of products in group 4 is (100-p).
Initially, there are x moles of 1 and y moles (x > y) of 2 in the reactions with y moles of bisFG (Scheme 2B). This means there is an enantiomeric excess of (R)-M (1) initially. The yield of 3 is p% (0 ≤ p ≤ 100). This entire process affords both 3 and 4 (Scheme 1). When p×y/100 of 1 is consumed, p× y/100 of 2 (1:1 ratio) must also be consumed during formation of 3, where (R,S)-3 and (S,R)-3 have each been generated in equal p× y /2×100 mole amounts. No matter what the ratio of (R,S)-3 to (S,R)-3 is, the moles of (R)-1 and (S)-2 consumed are always the same. Thus, the amount of unreacted (R)-M (1) remaining is (x − p×y/100) moles, while only (y − p×y/100) of (S)-M (2) is left (Scheme 2B) after p×y/100 moles of 3 formed.
The total quantity of compound 4 formed is (100-p)× y/100. At first glance, it seems like Δx and Δy could be computed as below after the formation of 3 and 4:
Then, the final %ee2 could be obtained from:
This initially suggests that the %ee2 has nothing to do with the yield (p) to 3. However, using this equation (3) to calculate %ee2 is wrong. The reason for this is that the quantity of (R,R)-4 and (S,S)-4 formed in the reaction may be different. Since formation of (R,R)-4 and (S,S)-4 pass over the same transition state barrier, the quantity of (R,R)-4 and (S,S)-4 formed must depend on the ratio of the quantity of (R)-1 and (S)-2 remaining in solution after any formation of 3. Thus, when x > y, initially, and the amount of (R)-1 and (S)-2 consumed is the same when 3 formed, Δx must be larger than Δy. Therefore, the quantity of (R,R)-4 formed is different from (S,S)-4. The amounts of (R)-1 and (S)-2 consumed are different during formation of 4. Clearly, in this case, it is not correct to use the total quantity of 4 [(100-p)×y/100] instead of the quantity of (R)-1 and (S)-2 in (2) and (3) to compute Δx and Δy. The correct analysis of the quantity of (R)-1 and (S)-2 left in solution after forming 3 is derived below.
After y×p/100 moles of 3 has formed, the quantity of 4 produced is (100-p)×y/100. Since the formation of (R,R)- and (S,S)-products had to pass over same transition state barrier, the ratio of the (R,R)-products to (S,S)-products formed in solution depends on the ratio of 1 and 2 remaining in solution. Namely, the ratio of (R,R)-products to (S,S)-products in 4 is proportional to the ratio of 1 and 2 remaining in solution after any formation of 3. Thus, the amount of (R)-1 consumed (QR,R) to make (R,R)-4 in group 4 can be expressed as equation (4) after y×p/100 moles of 3 has formed.
Similarly, the amount of (S)-2 that is being incorporated into the (S,S)-4 products is QS,S. It can be calculated as:
Next, the amount of 1 and 2 remaining (Δx and Δy, respectively) after formation of 3 and 4 is given as shown below:
Thus, the enantiomeric excess (%ee2) of (R)-1 remaining in solution, which can be recovered after the reactions shown in Equation (1), is calculated using Equation (8):
After putting and into the Equation (8), can be calculated using the following equations:
Or its relationship with %ee1 can be expressed as:
Here, %ee2 is obtained at p, which is the combined yield for the sum of all products 3 produced. Thus, %ee2 can be calculated for any initial value %ee1 as a function of yield p.
2.3. Relationship among the x, y and p
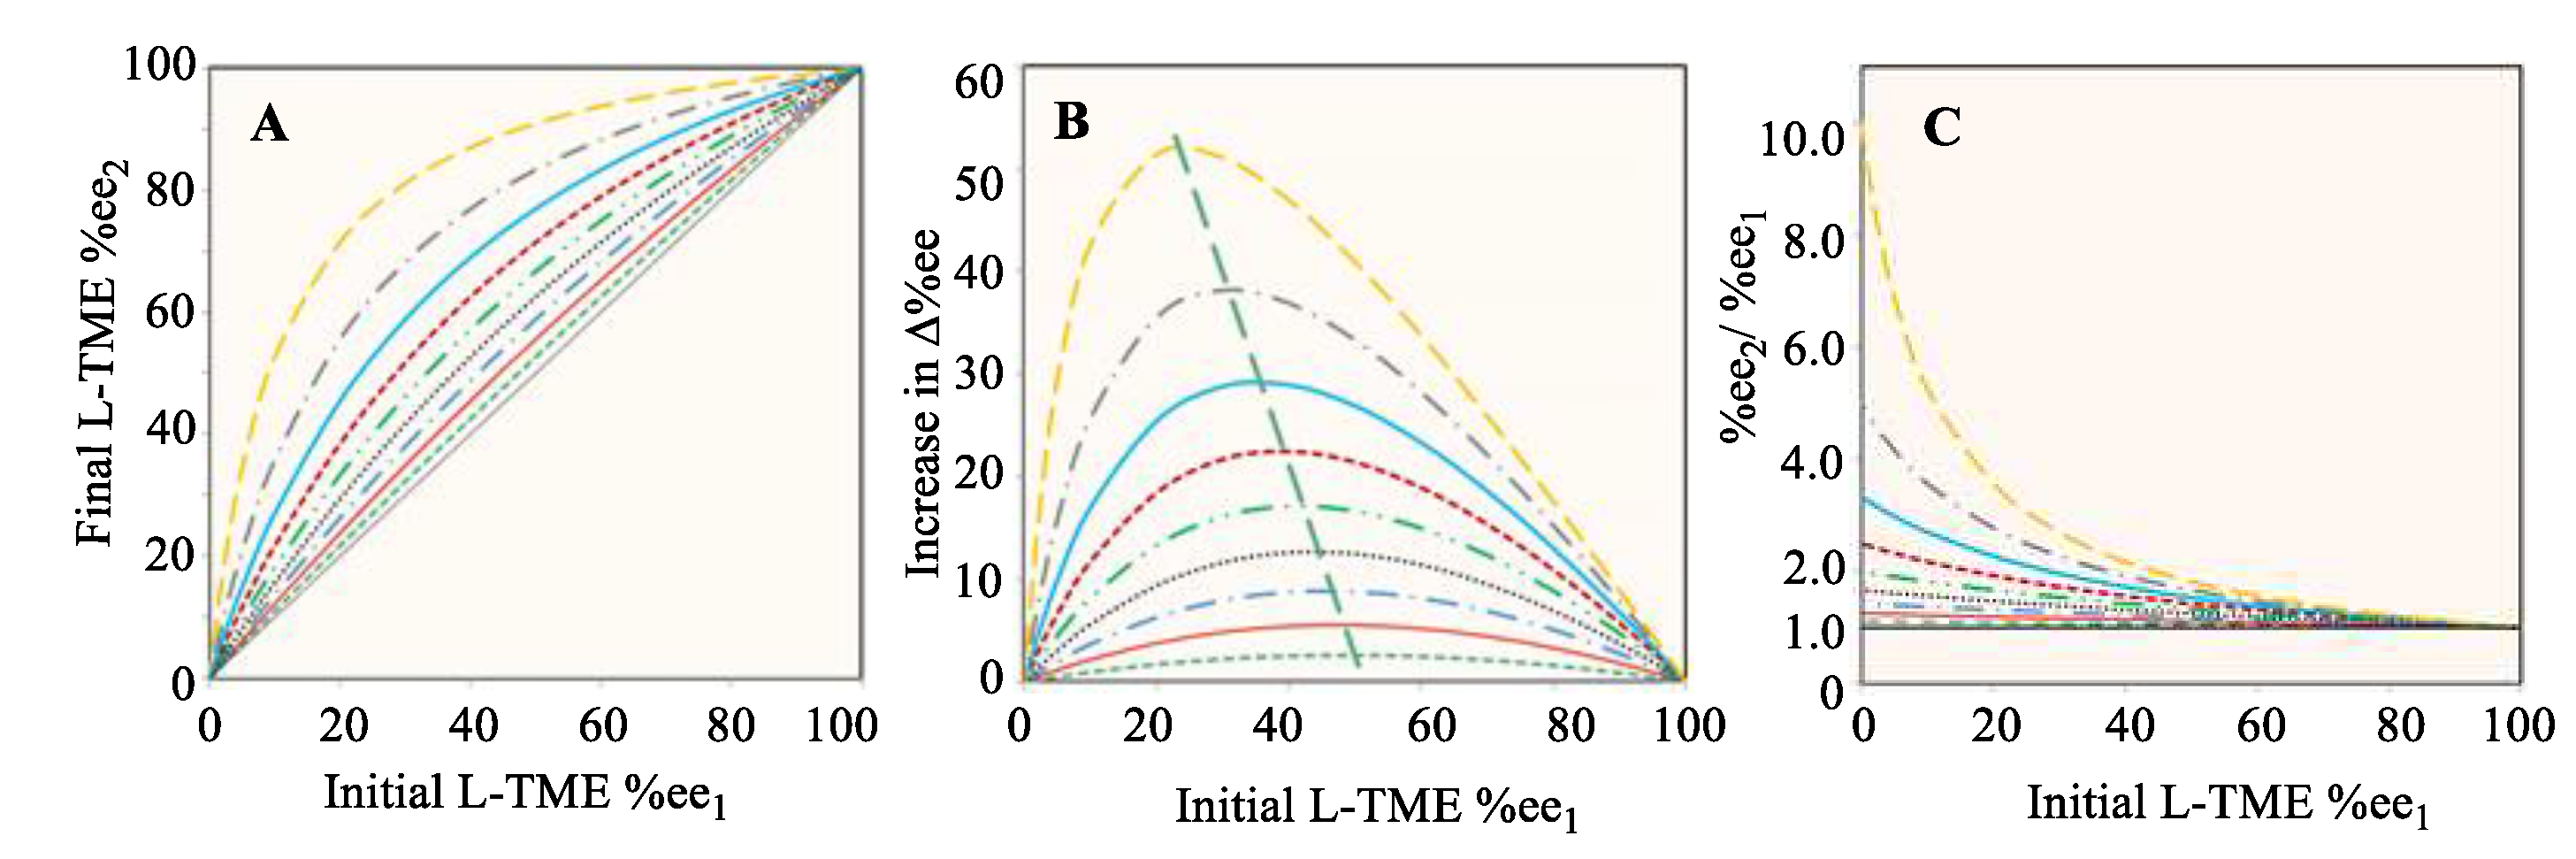
Three major characteristics of any general reaction, like that in Scheme 1 or Scheme 2, result from Eq. 8. The first (Figure 1(A)) plots the final (R)-1 %ee2 versus the starting %ee1. The second plot (Figure 1(B)) illustrates the relationship of Δ%ee = (%ee2 − %ee1) versus %ee1. The final relationship (Figure 1(C)) depicts the ratio of %ee2 to %ee1 versus %ee1. Nine curves were calculated for each of these three relationships, which correspond to forming product 3 in 10% to 90% yields (p in Eq. (8)) in 10% increments. These predicted results are illustrated in Figure 1. As the value of %ee1 of (R)-1 decreases, the quantity of bis-FG (in Scheme 1 this is 2,3-butandione) added is increased since it is added in an equimolar amount to (S)-2. Proceeding from the lowest curve to the highest curve on all three plots represents raising the yield of 3 progressively from 10% to 90%.
All nine %ee1 vs %ee2 curves for (R)-1 in Figure 1(A) are located above the 45° diagonal (the black line). Thus, they represent the chiral amplification region. 17,18 Amplification is inevitable as the reaction affords 3, despite the yield of 3 being progressively lowered to 10%. The higher the yield of 3 becomes, the bigger the enantiomeric enhancement, Δ%ee, of the remaining (R)-1 in solution becomes. Figure 1(B) illustrates that the larger the yield (p) to 3 becomes, a smaller initial %ee1 is needed to reach the maximum increase in Δ%ee. Figure 1(C) shows that the amplification multiples are not linear. Smaller the %ee1 values produce bigger %ee2/%ee1 ratios. As p approaches to 90%, the amplification multiple is 10. If the yield approaches 100% with a starting %ee1 value of 0.005%, then the enhancement factor, %ee2/%ee1, reaches 20000. The %ee2 is almost 100% after this reaction. Thus, the extremely important possibility is demonstrated that a very small initial %ee1 of (R)-1, or any reactive (R) or (S) reactant, could have undergone extensive chiral amplification under prebiotic conditions upon reaction with a bis-FG reagent.
2.4. Experimental verification of chiral amplification as predicted by equation 8.
2.4.1. Chiral amplification using TME and 2,3-diketobutane
Suitable reactive chiral molecules can be used to test the predictions of Eq. 8. An amino acid or its ester would have obvious importance for the prebiotic formation of high enantiomeric excesses required in origin of life. We selected D-tryptophan methyl ester (D-TME, (R)-1) and L-TME ((S)-2) as the chiral amplification target and 2,3-butandione (biacetyl) as the bis-FG reagent. This reaction was performed
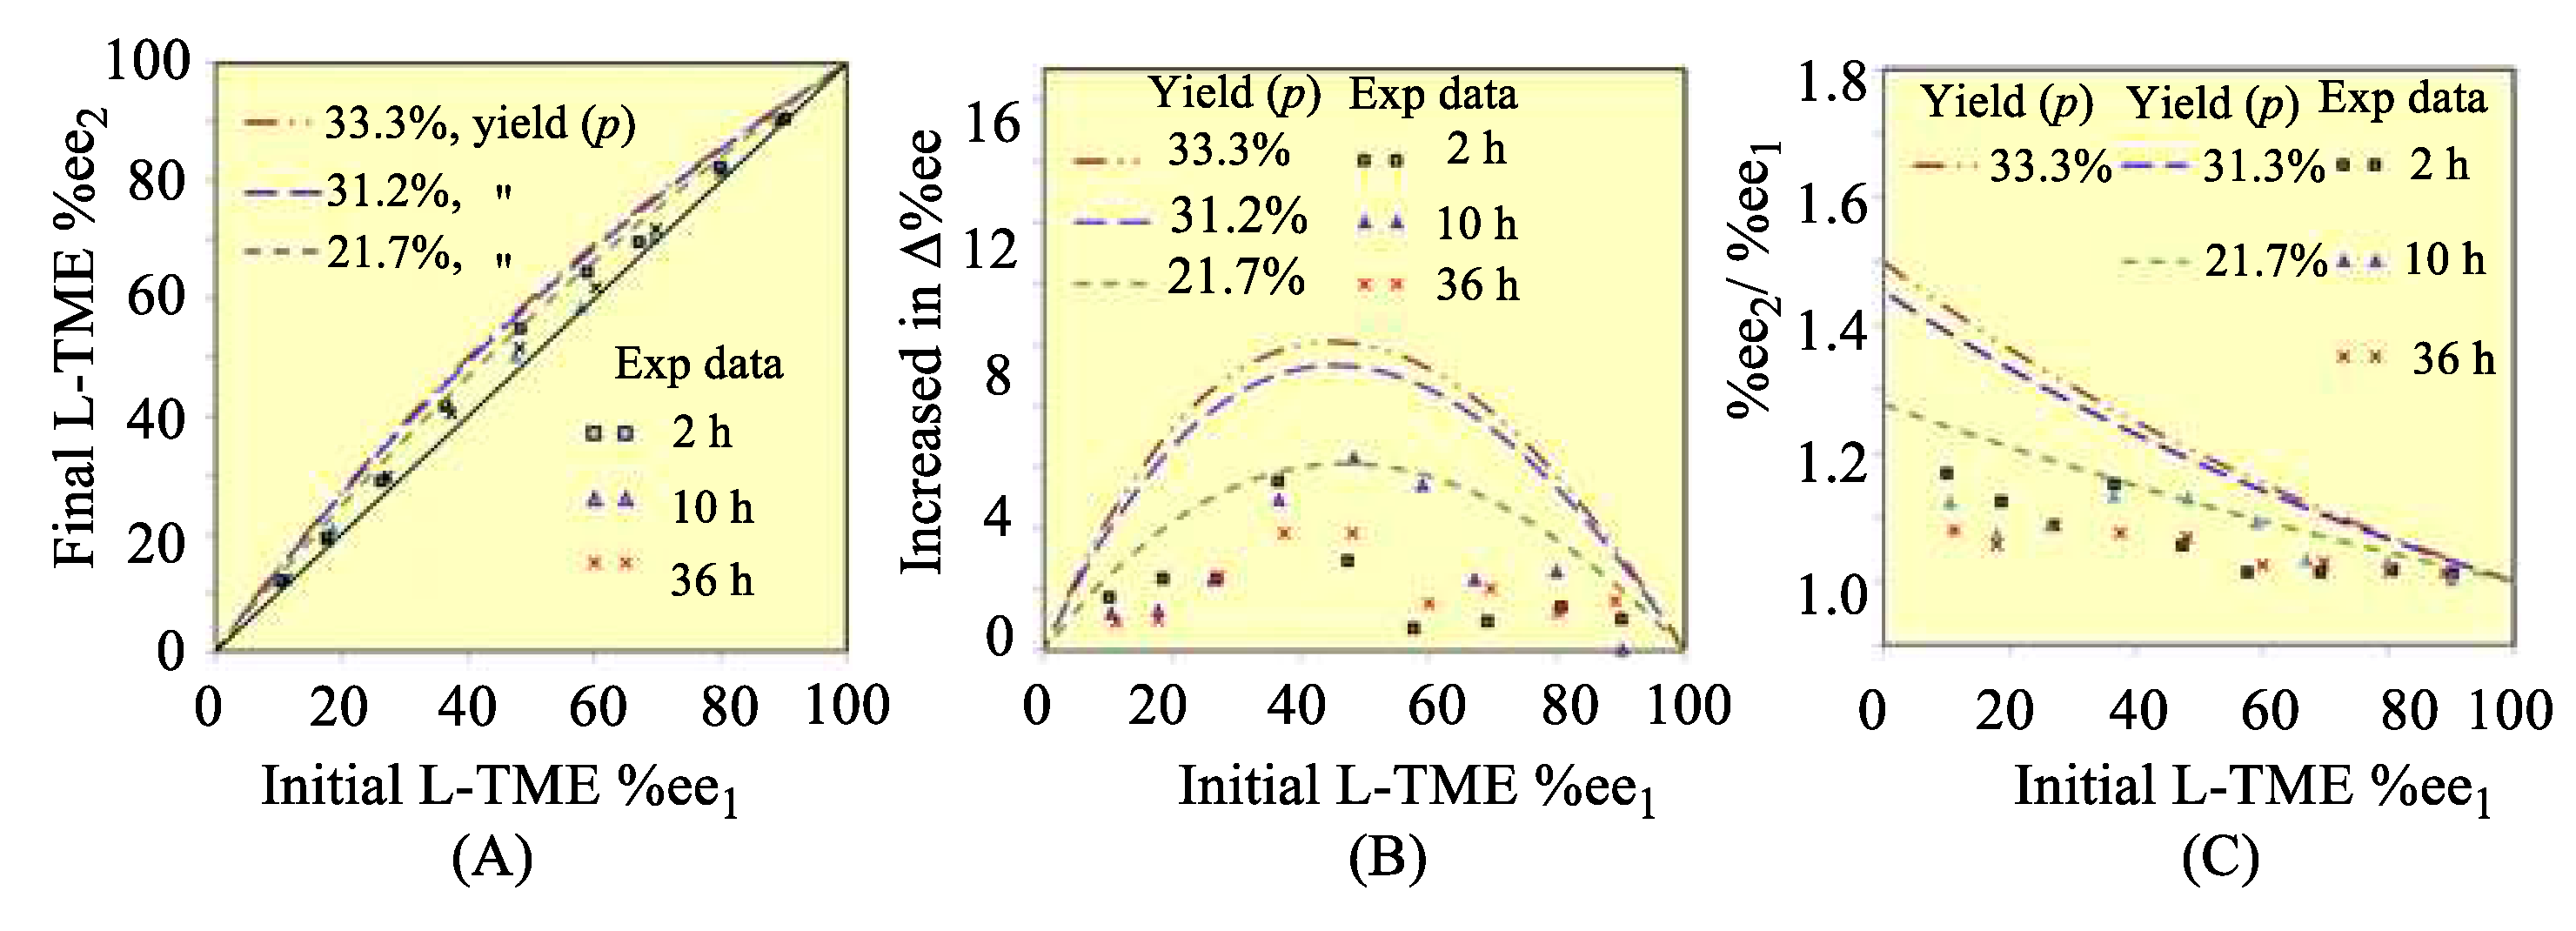
Formation of 3 competes with formation of 4 because the intermediate hydroxyl amines are in equilibrium with the reagents (Scheme 3) before imine formation and cyclizations occur, eventually producing 3 and 4 (Scheme 1). The more 3 that forms, the higher the Δ%ee values of unreacted L-TME will be. Therefore, sufficient time must be allowed to achieve equilibrium between these D,L- and L,L-intermediate amino alcohols with TME and biacetyl before dehydrations occur to their imines in order to achieve high Δ%ee values of unreacted the L-TME (Scheme 3, Items 8-10, Tables S12–S16, Figures S9 and S10 in SM). Thus, 2, 10 and 36 h times were selected for the process to equilibrate (Items 8-9, Tables S12–S16 in SM). The %ee2 values of unreacted L-TME were measured after these times and the three plots corresponding to the predictions in Figure 1 were constructed from these data and illustrated in Figure 2. The 10 h equilibrium time achieved the largest Δ%ee for the recovered (R)-1. All of the experimental L-TME %ee2 values obtained versus the initial L-TME feed %ee1 values were located in the traditional amplification region. In Figure 2A, symbols Δ, × and □ represent the data from the first, second, and third series of experiments which correspond to the equilibrium times of 2, 10 and 36 h, respectively, in Table 1 (Table S15 in SM)
Amplification of L-TME’s %ee occurred, although no new L-TME was produced and no additional chiral source was present. The observed amplification was an inevitable consequence of the reaction sequence. The three different red, blue and black dashed lines (Figure 2) predicted using Eq. 8, occur at 21.7%, 31.3 and 33.3% yields of 3. These three yields were calculated based on the corresponding relative energy differences between 3 and 4 of 0.520, 0.456, 0.677 kcal/mol, respectively, where 4 is more stable than 3. 37 These rigorous energy difference calculations employed B3LYP theory, using both 6-311+G(d) and 6-311++G(2d,p) basis sets. Calculations in the gas phase and in dichloromethane via the PCM model were made 29-35 (Item 2, Tables S4–S6 in SM). The L-TME enantiomeric excess changes (Δ%ee) determined by experiments (Table 1) mostly lie near the curve predicted by Eq. 1 using the 21.7% yield of 3 (Figure 2B). These experimental results confirmed that this reaction procedure (Scheme 1) will amplify the %ee of L-TME compared to its lower initial %ee1 value in a L- and D-TME solution.
2.4.2. Amplification of a 0.7%ee of L-TME up to 3%ee
The averaged L-TME Δ%ee magnitude is 1.2% when %ee1 was about 10% (Table 1, entry 1). If the %ee1 is 1% or lower, the Δ%ee increases might be small, with a low accompanied unreacted quantity of TME that is difficult to isolate from the reaction products. Thus, a low initial %ee1 of 1% was reacted with 2,3-diketobutane in about 90% conversion of D-TME in the first double Pictet-Spengler reactions cycle. The recovered TME (about 10% of D-TME left in the recovered TME theoretically) could again reacted with 2,3-diketobutane and the recovered TME from the second cycle used to determine it %ee2.
L- and D-TME was prepared with an initial L-TME %ee1 value between 0.7-1.0%ee, determined using OR and HPLC methods (Item 8, Tables S12–S15). The first amplification multiple (%ee2/%ee1) was estimated as 1.3-1.4 based on the above results (Figure 2C). Two sequential cycles of the double Pictet-Spengler bis-addition/cyclization of sequence were then performed, using a mole ratio of biacetyl to D-TME of 0.90 and 5.0 g of the starting material, the recovered L-TME exhibited %ee2 values of 2.7 and 3.3 (Item 9, Table S16 in SM), when applying the same HPLC and OR methods used for the %ee1 determination of the starting material (Item 10 in SM).
This procedure was repeated with 11.50 g of the 0.8%ee L-TME. The biacetyl/D-TME ratio was 0.90. After completing two cycles, HPLC analysis found a 3.3%ee. It was 3.0%ee using OR data. This %ee2 values was about 4.2 times larger than the original %ee1 value, a result close to that obtained in the first test using 5.00 g L-TME (Item 9, Table S16 in SM).
2.4.3. Amplification of high %ee of L-TME using oxalaldehyde
In Scheme 1, only one cycle of the double Pictet-Spengler reaction were conducted to generate the amplification of %ee values. Thus, another set of condensations were performed at 1-3 oC employing oxalaldehyde in place of biacetyl (Scheme 4) using series of L-TME %ee1 values from about 5%ee to 90%ee. 27 Only one cycle of double Pictet-Spengler reaction sequence was used in these experiments. Compounds 5 (two racemates 5(1) and 5(2)) and 6 (one racemate 6(1)) formed. 5(1) had a lower relative energy (1.31 kcal/mol) than 6(1) (Items 11-12, Tables S17–S21), predicted by calculations at the B3LYP/6-311++G(2d,p) level in CH2Cl2 using the PCM model (Scheme 4). The three plots, %ee2 vs %ee1, Δ%ee vs %ee1, and %ee2/%ee1 vs %ee1, were predicted using Eq 8 and are illustrated in Figure 3.
The initial %ee1 for L-TME increased from 6% to 90% at a mole ratio of oxalaldehyde to D-TME of 0.90 (Items 13-14, Tables S22 and S23A). The maximum Δ%ee reached a high of 11.2 %ee when %ee1 was 30.6%. The simulated relationships among %ee1 vs %ee2, %ee1 vs Δ%ee and %ee1 vs %ee2/%ee1 are summarized in Figure 3. Finally, a 30.6%ee of L-TME was reacted with nine different oxalaldehyde/D-TME mole ratios from 0.7 to 1.5. The experimental results of %ee2 vs this mole ratio is plotted in Figure 4. As the ratio of oxalaldehyde to D-TME increased, the Δ%ee2 rose from 5.0% to 12.1% (Item 14, Table S23B).
2.4.4. Chiral amplifications of L-amino acids
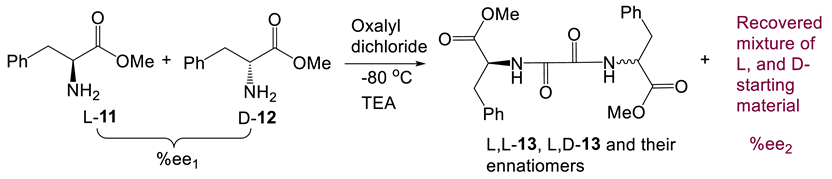
Scheme 1 illustrates that an amine reacting with 2,3-diketobutane in the Pictet-Spengler reaction should produce an increase in the enantiomeric excesses. However, under nonequilibrium conditions and at low temperatures, is this conclusion still true? To demonstrate that an equilibrium need not exist, we selected oxalyl dichloride as the bis-functional reagent and performed bis-amide-formation reaction (Eq. 9). This reaction was only performed once, occurring readily at −80 oC in 24 h in the presence of triethylamine (TEA). The increased Δ%ee values of L-phenylalanine methyl ester were 1.8%, 2.3%, 3.9% and 0.8% when the %ee1 values of the L-phenylalanine methyl ester changed from 22.0% to 26.8%, 46.6% and 56.0%, respectively (Item 15, Tables S24 and S25). Amide formation from oxalyl dichloride, catalyzed by TEA, has a low activation energy. Thus, the increased %ee value (%ee2-%ee1) was only 0.3% when 63.9% of L-phenylalanine (%ee1) was used. This confirms that Scheme 1 can generally be applied for the reaction classes in Eq. 9 or in Scheme 1 and Scheme 4.
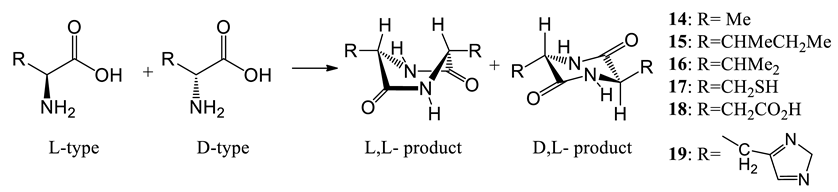
2.4.5. Possible L-amino acid amplification by dimerization to cyclic dipeptides
Amino acids could have participated in prebiotic condensations, where an L-amino acid reacted with another L- or D-amino acid to afford the corresponding L,L-and D,L-cyclic dipeptides (Eq. 10). The undimerized L-amino acid remaining, if initially present in a tiny %ee1, could have been amplified to a higher %ee. Cyclodipeptide formation is slow under lab conditions and difficult to control, but it could have occurred slowly in prebiotic pools. We selected six typical amino acids for a computational study of possible ee amplification. They included alanine, the smallest chiral amino acid, isoleucine, containing a double-stereogenic center, valine, with an isopropyl group, cysteine, containing a thiol, histidine, with a heterocyclic moiety and aspartic acid, with two carboxylic acid groups. B3LYP and MPW1PW91 computations at the 6-311++G(2d,p) level in water using PCM model provided the energy differences of L,L-and D,L-cyclic dimers. These were used to calculate values of %ee2, Δ%ee and %ee2/%ee1 for initial L-amino acid values of %ee1 = 0.50% at selected cyclodimer yields (p) (Table 2, also see Item 16, Table S26) [37]
>
The D,L-cyclic dimers formed in water have lower energy than their corresponding L,L-products in water except for those derived from cysteine (17) and histidine (19), where the D,L-products are less stable by 0.018 and 0.626 kcal/mol, respectively (Table 2, entries 4 and 6) using B3LYP theory. This cysteine diastereomer energy difference is small and was corroborated by the -0.028 kcal/mol value obtained from MPW1PW91 theory in water using the PCM model. No intramolecular H-bond was found in formed cyclodipeptides structure of cysteine. In contrast, after careful examination of the low energy D,L-cyclodipeptide geometry of histidine, a strong intramolecular H-bond formed in the lowest energy geometry. Possibly, water may break the intramolecular H-bond by solvation. Thus, the conformers with and without intramolecular H-bonds were both used for the energy difference analyses.
Histidine and aspartic acid represent interesting examples. The D,L-cyclodimer of histidine ester has a 1.026 kcal/mol (entry 6) lower energy than the L,L-product in water when the geometries with H-bonds were not computed in energy computations. Similarly, the energy difference between the D,L- and L,L-product of aspartic acid ester is 0.547 kcal/mol under these conditions (entry 5). Therefore, if all the starting amino acids were converted into the L,L- and D,L-cyclic peptides (Eq. 10), the maximum product yields formed (at complete conversion of the D-enantiomer) would depend on the relative energy between the two products. The higher a cyclodimer product’s relative energy, the smaller will be the yield of this product. Most D,L-cyclodimers had lower energies than their L,L-counterparts. Therefore, the selected L-, and D-amino acids tend to form D,L-cyclodimer major products (over 50% yields). The more D,L-products that form, the more L-amino acids will be left unreacted in solution. From B3LYP computed energies, the relationships among the yield (p) to D,L-cyclic dipeptides in Eq. 10 (this corresponds to the (R,S)-products), %ee1, %ee2, Δ%ee and amplification multiples %ee2/%ee1 are quantitatively predicted by Eq. 8 and listed in Table 2. Logically, the concentration of the remaining L-amino acids will increase (e.g., the %ee2 value will increase).
3. Materials and Methods
3.1. Experimental section
A low initial %ee1 value below 1.0% for L-TME was prepared by mixing commercial L-TME and D-TME samples of known enantiomeric contents. This initial %ee1 value was very small. Thus, three methods were used for %ee1 determinations (Item 7 in SM). The first directly measured the OR value and compared it with that of a 99%ee sample of L-TME. The second method employed HPLC analysis with a chiral column. In the third method, L-TME was reacted with benzoyl chloride to afford the corresponding benzamide (Item 6, Figures S3 and S4). The (S)-benzamide obtained was used to measure its OR and for HPLC analysis to achieve an %ee1 determination (using a Chiralcel-IA column and elution with a petroleum and isopropanol solution (v/v, 60:40) (Table S13, Items 6 and 7 in SM). These three methods gave almost the same result. The real %ee was confirmed to be about between 0.7-1.0%ee.
The TME with a 0.7-1.0%ee of L-TME was dissolved in CH2Cl2 and cooled to near 0 oC. Biacetyl was added in a biacetyl to D-TME mole ratio of 0.90, using 5.0 g of the starting material. This mixture was stirred for 10 h in the presence of 0.01% of trifluoroacetic acid (TFA) to begin the Pictet-Spengler reaction. Then, molecular sieves (4Å) were added and the reaction was held at 0 oC for ~14 h. The recovered unreacted starting TME was then employed in a second Pictet-Spengler cycle (mole ratio of biacetyl to D-TME of 0.90) under the same reaction conditions. After this second Pictet-Spengler reaction cycle, the recovered unreacted material was analyzed by chiral HPLC analysis to obtain %ee2. The amplification value, %ee2/%ee1, was 2.7 to 3.2 after the two cycles (Table S6, Item 8 in SM).
L-TME samples with different %ee1 values were reacted with oxalyl dichloride (Eq. 3). These reactions were held at −80 oC for 24 h after addition of triethylamine (TEA). Following each reaction, the unreacted L-TME crude was purified by column chromatography over silica gel. The recovered pure TME samples were then analyzed by chiral HPLC.
NMR data for the compounds involved in the report. The racemic products isolated from the 1%ee of L-tryptophan methyl ester were separated using a Chiralcel-IA stationary phase (Item 3, Figure S7). The mixture of petroleum ether and isopropanol (80:20) were used in the HPLC separation of enantiomer 3. The mixtures of petroleum ether and isopropanol (v/v: 85:15) were used for 4 isolation.
Separated dimethyl (6R,7aR,12bS,14S,15aS,15bR)-15a,15b-dimethyl-5,6,7a,8,13,14,15,15a,15b,16-decahydropyrrolo[2′,3′:1,2]indolizino[3,2-b:8,7-b′]diindole-6,14-dicarboxylate ((+)-3(1)). [α]D +32 (c 3.25, CH2Cl2). HR-MS-ESI m/z calcd for C28H30N4O4[M+H]+ 487.2345, found 487.2356. 1H NMR (600 MHz, CDCl3) δ 9.85 (s, 1H), 7.39 (d, J=7.8Hz, 1H), 7.31 (d, J=7.86 Hz, 1H), 7.05 (t, J=7.2 Hz, 1H), 6.99 (m, 2H), 6.88 (d, J=7.2 Hz, 1H), 6.63 (t, J=7.2 Hz, 1H), 6.49 (d, J=8.4 Hz, 1H), 5.10 (s, 1H), 4.45 (dd, J=12, 7.2 Hz, 1H), 4.12 (dd, J=12.0, 5.1 Hz, 1H), 3.76 (s, 3H), 3.39 (s, 3H), 3.27 (dd, J=15.6, 12 Hz, 1H), 2.88 (dd, J=15.6, 4.8 Hz, 1H), 2.15 (m, 1H), 1.38 (s, 3H), 1.30 (m, 1H), 1.11 (s, 3H). 13C NMR (150 MHz, CDCl3) δ 173.4, 172.8, 149.2, 138.2, 135.4, 129.9, 127.5, 125.7, 122.8, 120.4, 118.0, 116.8, 116.6, 110.7, 108.2, 104.5 80.0, 74.2, 66.9, 63.7, 60.8, 51.3, 51.0, 42.0, 23.3, 21.1, 19.2.
Separated dimethyl (6S,7aS,12bR,14S,15aR,15bR)-15a,15b-dimethyl-5,6,7a,8,13,14,15,15a,15b,16-decahydropyrrolo[2′,3′:1,2]indolizino[3,2-b:8,7-b′]diindole-6,14-dicarboxylate (4(2)). [α]D -104.76 (c, 5.25, CHCl3). HR-MS-ESI m/z calcd for C28H30N4O4[M+H]+ 487.2345, found 487.2354. 1H NMR (600 MHz, CDCl3) δ 7.88 (s, 1H), 7.44 (d, J=7.8 Hz, 1 H,), 7.24 (d, J=7.8 Hz, 1 H), 7.06 (m, 2 H,), 7.02 (m, 2 H), 6.65 (t, J=7.2 Hz, 1 H,), 6.54 (d, J=7.8 Hz, 1 H,), 4.78 (s, 1 H), 4.29 (t, J=5.4 Hz, 1 H), 3.89 (dd, J=10.2, 4.8 Hz, 1 H), 3.62 (s, 3 H), 3.58 (s, 3 H), 3.27 (dd, J=15, 6.0 Hz,1 H,), 3.12 (dd, J=15, 5.4 Hz, 1 H), 2.51-2.41 (dd, J=14.4, 4.8 Hz, 2 H), 1.43 (s, 3 H), 1.04 (s, 3H). 13C NMR (150 MHz, CDCl3) δ 175.5, 175.0, 150.7, 136.3, 136.0, 129.7, 128.7, 126.6, 124.1, 122.0, 119.6, 118.4, 118.0, 111.2, 109.7, 107.8, 89.7, 77.7, 66.6, 65.3, 59.6, 57.3, 52.3, 52.2, 43.3, 26.2, 26.2, 23.4.
3.2. Computational section
Each of 32 pairs of enantiomers from the 64 total stereoisomers in compound 3 (including 4-6) were used in energy optimizations at the B3LYP/6-31G(d). Before these energy calculations were conducted, each of the 32 pairs of enantiomers was subjected to a full conformational search employing the MMFF94S force field. The B3LYP/6-31G(d)-optimized geometries with relative energies from 0-4 kcal/mol were further optimized at the B3LYP/6-311++G(2d,p) level, both in the gas phase and in solution (CH2Cl2) using PCM model. Then, the most stable and the second stable structures with their relative energy data were found. All of these are summarized in the SM
4. Conclusions
An inevitable chemical process was discovered that amplifies the enantiomeric excesses of any enantiomer originally present in a low %ee to a higher %ee value without a chiral catalyst or an additional chiral reagent present. An equation was derived (Eq. 8) to predict the Δ%ee value of this enhancement as a function of the reaction processes yield (p) and the initial %ee1 value. Then this equation was experimentally verified in three different reactions and the Δ%ee and %ee2 values were obtained. Amino acid cyclodimerization was studied using quantum theory to calculate L,L- vs D,L-cyclodimer energy differences. The energy data was used to compute the yields (p) to D,L-cyclodimers when all the D-enantiomer is consumed. Then, these p values were further used to calculate %ee2 and Δ%ee values, when %ee1 is known. Chiral compounds, such as L-amino acids which had undergone significant %ee enhancement from their low initial %ee1 values, could then have been used in synthesis of L-peptides or as chiral catalysts for prebiotic reactions. This method of obtaining high %ee values in the prebiotic period during the evolution of life has not previously been mentioned or proposed. We have demonstrated that these and other repetitive chemical reactions could have been a viable path that produced highly enriched %ee enantiomers from very low initial %ee values.
Thus, after the amplification reactions, enantiomers, such as L-amino acids with very tiny %ee increased to a reasonable concentration (such as more than 20%ee or higher) will be left. They may be small amount, however, they may act as a seed, and promoted or catalyzed the synthesis of other chiral compounds in prebiotic time.
Supplementary Materials
The following supporting information can be downloaded at the website of this paper posted on Preprints.org. Figure S1: 1H NMR spectra for (R,S)-3(2). Figure S2 13C NMR spectra for (R,S)-3(2); Figure S3 The HMBC spectrum for (R,S)-3(2). Figure S4 The 1H NMR for (S,S)-4(1) compound in CDCl3; Figure S5 The 13C NMR for (S,S)-4(1) compound in CDCl3; Figure S6. The HMBC spectrum for (S,S)-4(1). The relationship of H and C in the HMBC is summarized below (also see the specific data in Table S2); Figure S7 The HPLC plots for major products 3 and 4 using Chiracel-IA. The specific optical rotations are +32.0 for signal A (named as 3SA) and almost -32.0 for signal B (3SB). The specific optical rotation values are +104.0 for signal A (4SA) and -104.0 for signal B (4SB). The solvent is chloroform; Figure S8 The experimental and computed ECD for the two compounds 3 and 4. Figure S9 The 1H NMR spectra for the structure of methyl 2-benzamido-3-(1H-indol-3-yl)propanoate. Figure S10 The 13C NMR spectra for the structure of methyl 2-benzamido-3-(1H-indol-3-yl)propanoate. Table S1. Relationship of C and H in HMBC spectra for (R,S)-3(2); Table S2 Relationship of C and H in HMBC spectra ((S,S)-4(1) in DMSO-d6). Table S3 Experimental ECD spectra for (+)-3SA and (-)-4SB; Table S4 The specific isomer structures and their energetic. Table S5 The predicted relative energy for the four isomers of 3 and 4. Table S6 The summarized energetics and yields for the four compounds. Table S7 Coordinates for (R,S)-3(2) (=DL-9 in SM). Table S8 Coordinates for (R,S)-3(1) (=DL-6 in SM). Table S9 Coordinates for (S,S)-4(1) (=LL-8 in SM). Table S10 Coordinates for (S,S)-4(2) (=LL-9 in SM). Table S11 The experimental and predicted OR values for the four compounds. Table S12 HPLC analysis for the first series of condensations. Accurate determination of %ee values is very critical in HPLC analysis. The integration intervals (from starting retention time to its ending time) are fixed in all integration squares. Table S13 The HPLC analysis for the L-TME recovered from the second series of condensation. Table S14 The HPLC analysis for recovered L-TME from the third series of reactions. Table S15 The summaries from the Tables S13 to S14. Table S16 The %ee values of (S)-benzamide analyzed by HPLC using a Chiralcel-IA column and mixtures of petroleum and isopropanol (v/v, 60:40) (Specific HPLC plots are listed below. The compound is pure enough for HPLC analysis. The integration time ranges that were used for %ee value calculations are strictly held the same in different measurements.). Table S17 The total 32 enantiomers optimized at the B3LYP/6-31G(d) level in the gas phase and their energy values. Table S18 The predicted energy for the eight compounds. Table S19 coordinate for (R,S)-5(1) in text (=DL-4 in the Table S18). Table S20 coordinate for (R,S)-5(2) in text (=DL-9 in Table S18). Table S21 coordinate for (S,S)-6(1) in text (=LL-6 in Table S18). Table S22 The HPLC plots for the %ee2 of L-TME analysis (L-TME was converted into the corresponding benzamide for this measurement, see details at the end of this Table). Table S23A The %ee2 changes when starting material %ee1 changes from 6.1% to 89.6% summarized from Table S22. Table S23B The %ee2 change tendency when the starting material’s %ee1 was fixed and the mole ratio of oxalaldehyde to D-TME increased from 0.7 to 1.3 summarized from Table S22. Table S24 Analysis of %ee values of L-phenylalanine benzamide via HPLC. Table S25 The %ee2 changes when starting material %ee1 varies (summary of Table S24). Table S26 The predicted energy for six selected amino acids using DFT methods in the gas phase and in liquid using PCM model.
Author Contributions
HJ Zhu designed the current research topic, did partial computations, and wrote the paper. YJ Jia did the most experiments and computations. ZW Li did partial experiments. YJ Zhu did partial computations and experiments. CU Pittman, Jr. directed the experiments and proofreading the English.
Funding
This research was funded by National Natural Scientific Foundation of China (NSFC#21877025). The Jointed Key Project in Pharmacy and Medicine from the Committee of Science and Technology of Hebei Province (#H2020201029 and #B2022208057).
Acknowledgments
the “High-Performance Computing Center of Hebei University”, Dr. E. W. Li and Dr. J. W. Ren in State Key Laboratory of Mycology, Institute of Microbiology of Chinese Academy of Sciences are thanked for a portion of the NMR and optical rotation measurements.
Conflicts of Interest
The authors declare no conflict of interest.
References
- (a). Prebiotic Chemistry: From simple amphiphiles to model protocells; Walde, P. Ed., Topics in Curr. Chem. Vol. 259; Springer-Verlag: Berlin/Heidelberg, 2005. (b) Das, K.; Gabrielli, L.; and Prins. L. J. Chemically fueled self-assembly in biology and chemistry. Angew. Chem. Int. Ed. 2021, 60, 20120– 20143. (c) Gözen, I.; Köksal, E.S.; Põldsalu, I.; Xue, L.; Spustova, K.; Pedrueza-Villalmanzo, E.; Ryskulov, R.; Meng, F.; and Jesorka, A. Protocells: milestones and recent advances. Small, 2022, 2106624. (c). Davankov, V.A. Chance and necessity in the evolution of matter to life: a comprehensive hypothesis. Symmetry 2021, 13, 1918. (d) Kolodiazhnyi, O.I. Phosphorus compounds of natural origin: prebiotic, stereochemistry, application. Symmetry 2021, 13, 889. (e) Chen, Y.; Ma, W. The origin of biological homochirality along with the origin of life. PLoS Comput Biol 2020, 16, e1007592. (f) Jheeta, S.; Chatzitheodoridis, E.; Devine, K.; and Block, J. The way forward for the origin of life: prions and prion-like molecules first hypothesis. Life 2021, 11, 872. (g) Smith, H.H.; Hyde, A.S.; Simkus, D.N.; Libby, E.; Maurer, S.E.; Graham, H.V.; Kempes, C.P.; Lollar, B.S.; Chou, L.; Ellington, A.D.; Fricke, G.M.; Girguis, P.R.; Grefenstette, N.M.; Pozarycki, C.I.; House, C.H. and Johnson, S.S. The grayness of the origin of life. Life, 2021, 11, 498. (h) Seitz, C.; Eisenreich, W.; Huber, C. The abiotic formation of pyrrole under volcanic, hydrothermal conditions—an initial step towards life’s first breath? Life, 2021, 11, 980. (i) Devínsky, F.. Chirality and the origin of life. Symmetry 2021, 13, 2277. (j) Jia, T.Z.; Nishikawa, S.; Fujishima, K. Sequencing the origins of life. BBA Advances 2022, 2, 100049. (k) Baum, D.A. The origin and early evolution of life in chemical composition space. J. Theo. Biology 2018, 456, 295–304. (K) Liu, B.; Charalampos, G.; Pappas, J.; Schaeffer, G.; Jurissek, C.; Pieters, P.F.; Altay, M.; Marić, I.; Stuart, M.C.A. and Otto, S. Spontaneous emergence of self-replicating molecules containing nucleobases and amino acids. J. Am. Chem. Soc. 2020 142, 4184–4192.
- Pizzarello, S.; Groy, T.L. Molecular asymmetry in extraterrestrial organic chemistry: An analytical perspective. Geochim. Cosmochim. Acta. 2011, 75, 645–656. [Google Scholar] [CrossRef]
- Kvenvolden, K.; Lawless, J.; Pering, K.; Peterson, E.; Flores, J.; Ponnamperuma, C.; Kaplan, I.R.; Moore, C. Evidence for extraterrestrial amino-acids and hydrocarbons in the Murchison meteorite. Nature. 1970, 228, 923−926. [Google Scholar] [CrossRef]
- Cronin, J.R.; Pizzarello, S. Enantiomeric excesses in meteoritic amino acids. Science. 1997, 275, 951–955. [Google Scholar] [CrossRef] [PubMed]
- Cronin, J.R.; Pizzarello, S.; Yuen, G.U. Amino acids of the Murchison meteorite: II. Five carbon acyclic primary β-, γ-, and δ-amino alkanoic acids. Geochim. Cosmochim. Acta. 1985, 49, 2259–2265. [Google Scholar] [CrossRef]
- Pizzarello, S.; Krishnamurthy, R.V.; Epstein, S.; Cronin, J.R. Isotopic analyses of amino acids from the Murchison meteorite. Geochim. Cosmochim. Acta. 1991, 55, 905–910. [Google Scholar] [CrossRef]
- Pizzarello, S.; Weber, A.L. Prebiotic amino acids as asymmetric catalysts. Science. 2004, 303, 1151–1151. [Google Scholar] [CrossRef]
- Levine, M.; Kenesky, C.S.; Mazori, D.; Breslow, R. Enantioselective synthesis and enantiomeric amplification of amino acids under prebiotic conditions. Org. Lett. 2008, 10, 2433–2436. [Google Scholar] [CrossRef] [PubMed]
- (a) Breslow, R. Likely possible origin of homochirality in amino acids and sugars on prebiotic earth. Tetrahedron Lett. 2011, 52, 2028–2032. (b). Siegel, J.S. Homochiral imperative of molecular evolution. Chirality 1998, 10, 24–27.
- (a) J. Greenwald, W. Kwiatkowski and R. Riek, Peptide Amyloids in the Origin of Life, J Mol Biol, 2018, 430, 3735–3750. (b) G. Kostyrka. What roles for viruses in origin of life scenarios? Stud. Hist. & Phil. Biolog. Biomed. Sci.. 2016, http://dx.doi.org/10.1016/j.shpsc.2016.02.014. (c) C. Huber, W. Eisenreich, G. Wächtershäuser. Tetrahedron Lett. 51 (2010) 1069–1071. (d) S. Toxvaerd, The role of the peptides at the origin of life. J. Theoretical Biology. 2017, doi: 10.1016/j.jtbi.2017.06.023.
- Flores, J.J.; Bonner, W.A.; Massey, G.A. Asymmetric photolysis of (R,S)-leucine with circularly polarized ultraviolet light. J. Am. Chem. Soc. 1977, 99, 3622–3625. [Google Scholar] [CrossRef] [PubMed]
- Bailey, J.; Chrysostomou, A.; Hough, J.H.; Gledhill, T.M.; McCall, A.; Clark, S.; Menard, F.; Tamura, M. Circular polarization in star-formation regions: implications for biomolecular homochirality. Science, 1998, 281, 672–674. [Google Scholar] [CrossRef]
- Rubenstein, E.; Bonner, W.A.; Noyes, H.P.; Brown, G.S. Supernovae and life. Nature, 1983, 306, 118–121. [Google Scholar] [CrossRef]
- Mauksch, M.; Tsogoeva, S.B.; Wei, S.W.; Martynova, I.M. Demonstration of spontaneous chiral symmetry breaking in asymmetric Mannich and Aldol reactions. Chirality 2007, 19, 816–825. [Google Scholar] [CrossRef] [PubMed]
- Viedma, C. Chiral symmetry breaking and complete chiral purity by thermodynamic-kinetic feedback near equilibrium: implications for the origin of biochirality. Astrobiology 2007, 7, 312–319. [Google Scholar] [CrossRef]
- Weissbuch, I.; Leiserowitz, L.; Lahav, M. Stochastic “mirror symmetry breaking” via self-assembly, reactivity and amplification of chirality: relevance to abiotic conditions. Top Curr Chem 2005, 259, 123–165. [Google Scholar]
- (a). Kitamura, A.M.; Suga, S.; Kawai, K.; Noyori, R. Catalytic Asymmetric Induction. Highly Enantioselective Addition of Dialkylzincs to Aldehydes. J. Am. Chem. Soc. 1986, 108, 6071–6072. (b). Andrew S. Tupper, Paul G. Higgs. Rolling-circle and strand-displacement mechanisms for non-enzymatic RNA replication at the time of the origin of life J. Theor. Biology, 2021, 527, 110822. (c) Michaelian, K.. Non-Equilibrium Thermodynamic Foundations of the Origin of Life. Foundations, 2022, 2, 308–337. (c) Vanchurin, V.; Wolf, Y.I.; Koonin, E.V.; Katsnelson, M.I. Thermodynamics of evolution and the origin of life. PNAS 2022, 119, e2120042119. (d) Ghosh, B.; Bose R. and Tang, T.Y. D. Curr. Opin. in Coll. & Interface Sci., 2021, 52, 101415. (e) Krishnamurthy, R.; Chemical Origins of Life: Its Engageme with Society. Trends in Chem. https://doi.org/10.1016/j.trechm.2020.02.011. (f) Slijepcevic, P.. Serial Endosymbiosis Theory: From biology to astronomy and back to the origin of life BioSystems 2021, 202, 104353. (g) Maruyama, S.; Kurokawa, K.; Ebisuzaki, T.; Sawaki, Y.; Suda, K.; Santosh, M. Nine requirements for the origin of Earth’s life: Not at the hydrothermal vent, but in a nuclear geyser system. Geosci. Front. 2019, 10, 1337–1357.
- (a) Puchot, B.C.; Samuel, O.; Duiiach, E.; Zhao, S.; Agami, C.; Kagan, H.B. Nonlinear effects in asymmetric synthesis, Examples in asymmetric oxidations and aldolization reactions. J. Am. Chem. Soc. 1986, 108, 2353–2357. (b) V. N. Obridko, M.V. Ragulskaya, E.G. Khramova. Young Sun, galactic processes, and origin of life. J. Atmosph. Solar-Terr. Phys. 2020, 208, 105395.
- Soai, K.; Shibata, T.; Morioka, H.; Choji, K. Asymmetric autocatalysis and amplification of enantiomeric excess of a chiral molecule. Nature. 1995, 378, 767–768. [Google Scholar] [CrossRef]
- Blackmond, D.G. Spoilt for choice: assessing phase behavior models for the evolution of homochirality. Chem. Eur. J. 2007, 13, 3290–3295. [Google Scholar] [CrossRef]
- Blackmond, D.G.; Matar, O.K. Re-examination of reversibility in reaction models for the spontaneous emergence of homochirality. J. Phys. Chem. B. 2008, 112, 5098–5104. [Google Scholar] [CrossRef]
- Glavin, D.P.; Dworkin, J.P. Enrichment of the amino acid L-isovaline by aqueous alteration on CI and CM meteorite parent bodies Proc. Natl. Acad. Sci. U.S.A. 2009, 106, 5487–5492. [Google Scholar] [CrossRef]
- Ruiz-Mirazo, K.; Briones, C. and de la Escosura, A. Prebiotic Systems Chemistry: New Perspectives for the Origins of Life. Chem. Rev. 2014, 114, 285–366. [CrossRef]
- Mundy, B.P.; Ellerd, M.G.; Favaloro, F.G. Name reactions and reagents in organic synthesis. John Wiley & Sons. 2005.
- Bailey, P.D.; Collier, L.D.; Hollinshead, S.P.; Moore, M.H.; Morgan, K.M.; Smith, D.I.; Vernon, J.M. A new asymmetric route to bridged indole alkaloids: formal syntheses of (–)-suaveoline,(–)-raumacline and (–)-Nb-methylraumacline. J. Chem. Soc., Chem. Commun. 1994, 25, 1559–1560. [Google Scholar] [CrossRef]
- Bai, B.; Li, D.-S.; Huang, S.-Z.; Ren, J.; Zhu, H.-J. Chirality Paring Recognition, A Unique Reaction Forming Spiral Alkaloids from Amino Acids Stereoselectively in One-Pot. Nat. Prod. Bioprospect. 2012, 2, 53–58. [Google Scholar] [CrossRef]
- Oxalaldehyde was used in the Pictet-Spengler reactions with tryptophan methyl ester first and similar structures were obtained. However, commercially available oxalaldehyde contains about 0.5% formaldehyde, which could react with tryptophan methyl ester to afford tetrahydro-β-carboline analogue. Its polarity is extremely close to the tryptophan methyl ester and is hard to isolate it from tryptophan methyl ester from the tetrahydro-β-carboline analogue. Therefore, the recovered L-tryptophane methyl ester must contain the tetrahydro-β-carboline analogue with unknown quantity. It brings the difficulty too to determine the quantity of the recovered L-tryptophan methyl ester that must be used in the second Pictet-Spengler cycle reactions. Thus, it is not suitable to use the L-tryptophan methyl ester with small %ee value as a starting material to examine %ee amplification in the reaction. Finally, biacetyl was used for the reaction to see how much the %ee1 value increased from small values to relative big values.
- Frisch, M.J.; Trucks, G.W.; Schlegel, H.B.; Scuseria, G.E.; Robb, M.A.; Cheeseman, J.R.; Montgomery, Jr. J. A.; Vreven, T.; Kudin, K.N.; Burant, J.C.; Millam, J.M.; Iyengar, S.S.; Tomasi, J.; Barone, V.; Mennucci, B.; Cossi, M.; Scalmani, G.; Rega, N.; Petersson, G.A.; Nakatsuji, H.; Hada, M.; Ehara, M.; Toyota, K.; Fukuda, R.; Hasegawa, J.; Ishida, M.; Nakajima, T.; Honda, Y.; Kitao, O.; Nakai, H.; Klene, M.; Li, X.; Knox, J.E.; Hratchian, H.P.; Cross, J.B.; Adamo, C.; Jaramillo, J.; Gomperts, R.; Stratemann, R.E.; Yazyev, O.; Austin, A.J.; Cammi, R.; Pomelli, C.; Ochterski, J.W.; Ayala, P.Y.; Morokuma, K.; Voth, G.A.; Salvador, P.; Dannenberg, J.J.; Zakrzewski, V.G.; Dapprich, S.; Daniels, A.D.; Strain, M.C.; Farkas, O.; Malick, D.K.; Rabuk, A.D.; Raghavachari, K.; Foresman, J.B.; Ortiz, J.V.; Cui, Q.; Baboul, A.G.; Clifford, S.; Cioslowski, J.; Stefanov, B.B.; Liu, G.; Liashenko, A.; Piskorz, P.; Komaromi, I.; Martin, R.L.; Fox, D.J.; Keith, T.; Al-Laham, M.A.; Peng, C.Y.; Nanayakkara, A.; Challacombe, M.; Gill, P.M.W.; Johnson, B.; Chen, W.; Wong, M.W.; Gonzalez, C.; Pople, J.A. Gaussian 03 User’s Reference Gaussian Inc: Carnegie, PA, USA, 2003.
- Berova, N.; Polavarapu, P.L.; Nakanish, K.; Woody, R.W. Comprehensive chiroptical spectroscopy, John Wiley & Sons, Hoboken, New Jersey, 2011.
- Zhu, H.J. Organic Stereochemistry---Experimental and computational methods, Wiley-VCH, Verlag GmbH & Co. KGaA, 2015.
- Halgren, T.A. MMFF VI. MMFF94s Option for Energy Minimization Studies. J. Comput. Chem. 1999, 20, 720–729. [Google Scholar] [CrossRef]
- Jørgensen, P.; Jensen, H.J.A. and Olsen, J. Linear response calculations for large scale multiconfiguration self-consistent field wave functions. J. Chem. Phys. 1988, 89, 3654–3661. [CrossRef]
- Autschbach, J.; Ziegler, T.; van Gisbergen, S.J.A.; Baerends, E.J. Chiroptical properties from time-dependent density functional theory. I. Circular dichroism spectra of organic molecules. J. Chem. Phys. 2002, 116, 6930–6940. [Google Scholar] [CrossRef]
- Bak, K.L.; Hansen, A.E.; Ruud, K.; Helgaker, T.; Olsen, J.; Jøgensen, P. Ab initio calculation of electronic circular dichroism for trans-cyclooctene using London atomic orbitals. Theor. Chem. Acc. 1995, 90, 441–58. [Google Scholar]
- Kondru, P.K.; Wipf, P.; Beratan, D.N. Theory-Assisted Determination of Absolute Stereochemistry for Complex Natural Products via Computation of Molar Rotation Angles. J. Am. Chem. Soc. 1998, 120, 2204–2205. [Google Scholar] [CrossRef]
- Generally, to determine the ratio of 3 and 4 in the reaction, the energy difference of various conformations of intermediates should be computed before 3 and 4 formations. However, there are many conformations need to be computed for each intermediate, and intermediates have several different configuration. Therefore, a simple but not very accurate method is used to compute the energy difference between the products 3 and 4. All possible configurations of all 64 were investigated. Conformational searches were performed first using FFMM94S force field. Then, three different quantum methods were used for all for the computations on all the geometries to ensure the geometries with the lowest and second lowest energies were correctly identified. For details see ESI.
- Zhao, D.; Zhao, Q.Q.; Zhu, H.J.; Liu, L. Theoretical investigation of the relationship between four-carbon D-sugars and five L-amino acids. Tetrahedron 2016, 72, 5558–5562. [Google Scholar] [CrossRef]
Scheme 1.
Possible products formed upon reacting TME with bis-functional molecule 2,3-diketobutane (four cases). In this Scheme, %ee1 is given as the initial enantiomeric excess of the starting materials of 1 ((R)-TME) and 2 ((S)-TME). The %ee2 is given as the enantiomeric excess of the recovered 1 and 2 remaining in solution.
Scheme 2.
A simplified expression of the four reaction cases based on the Scheme 1.
Scheme 2.
A simplified expression of the four reaction cases based on the Scheme 1.
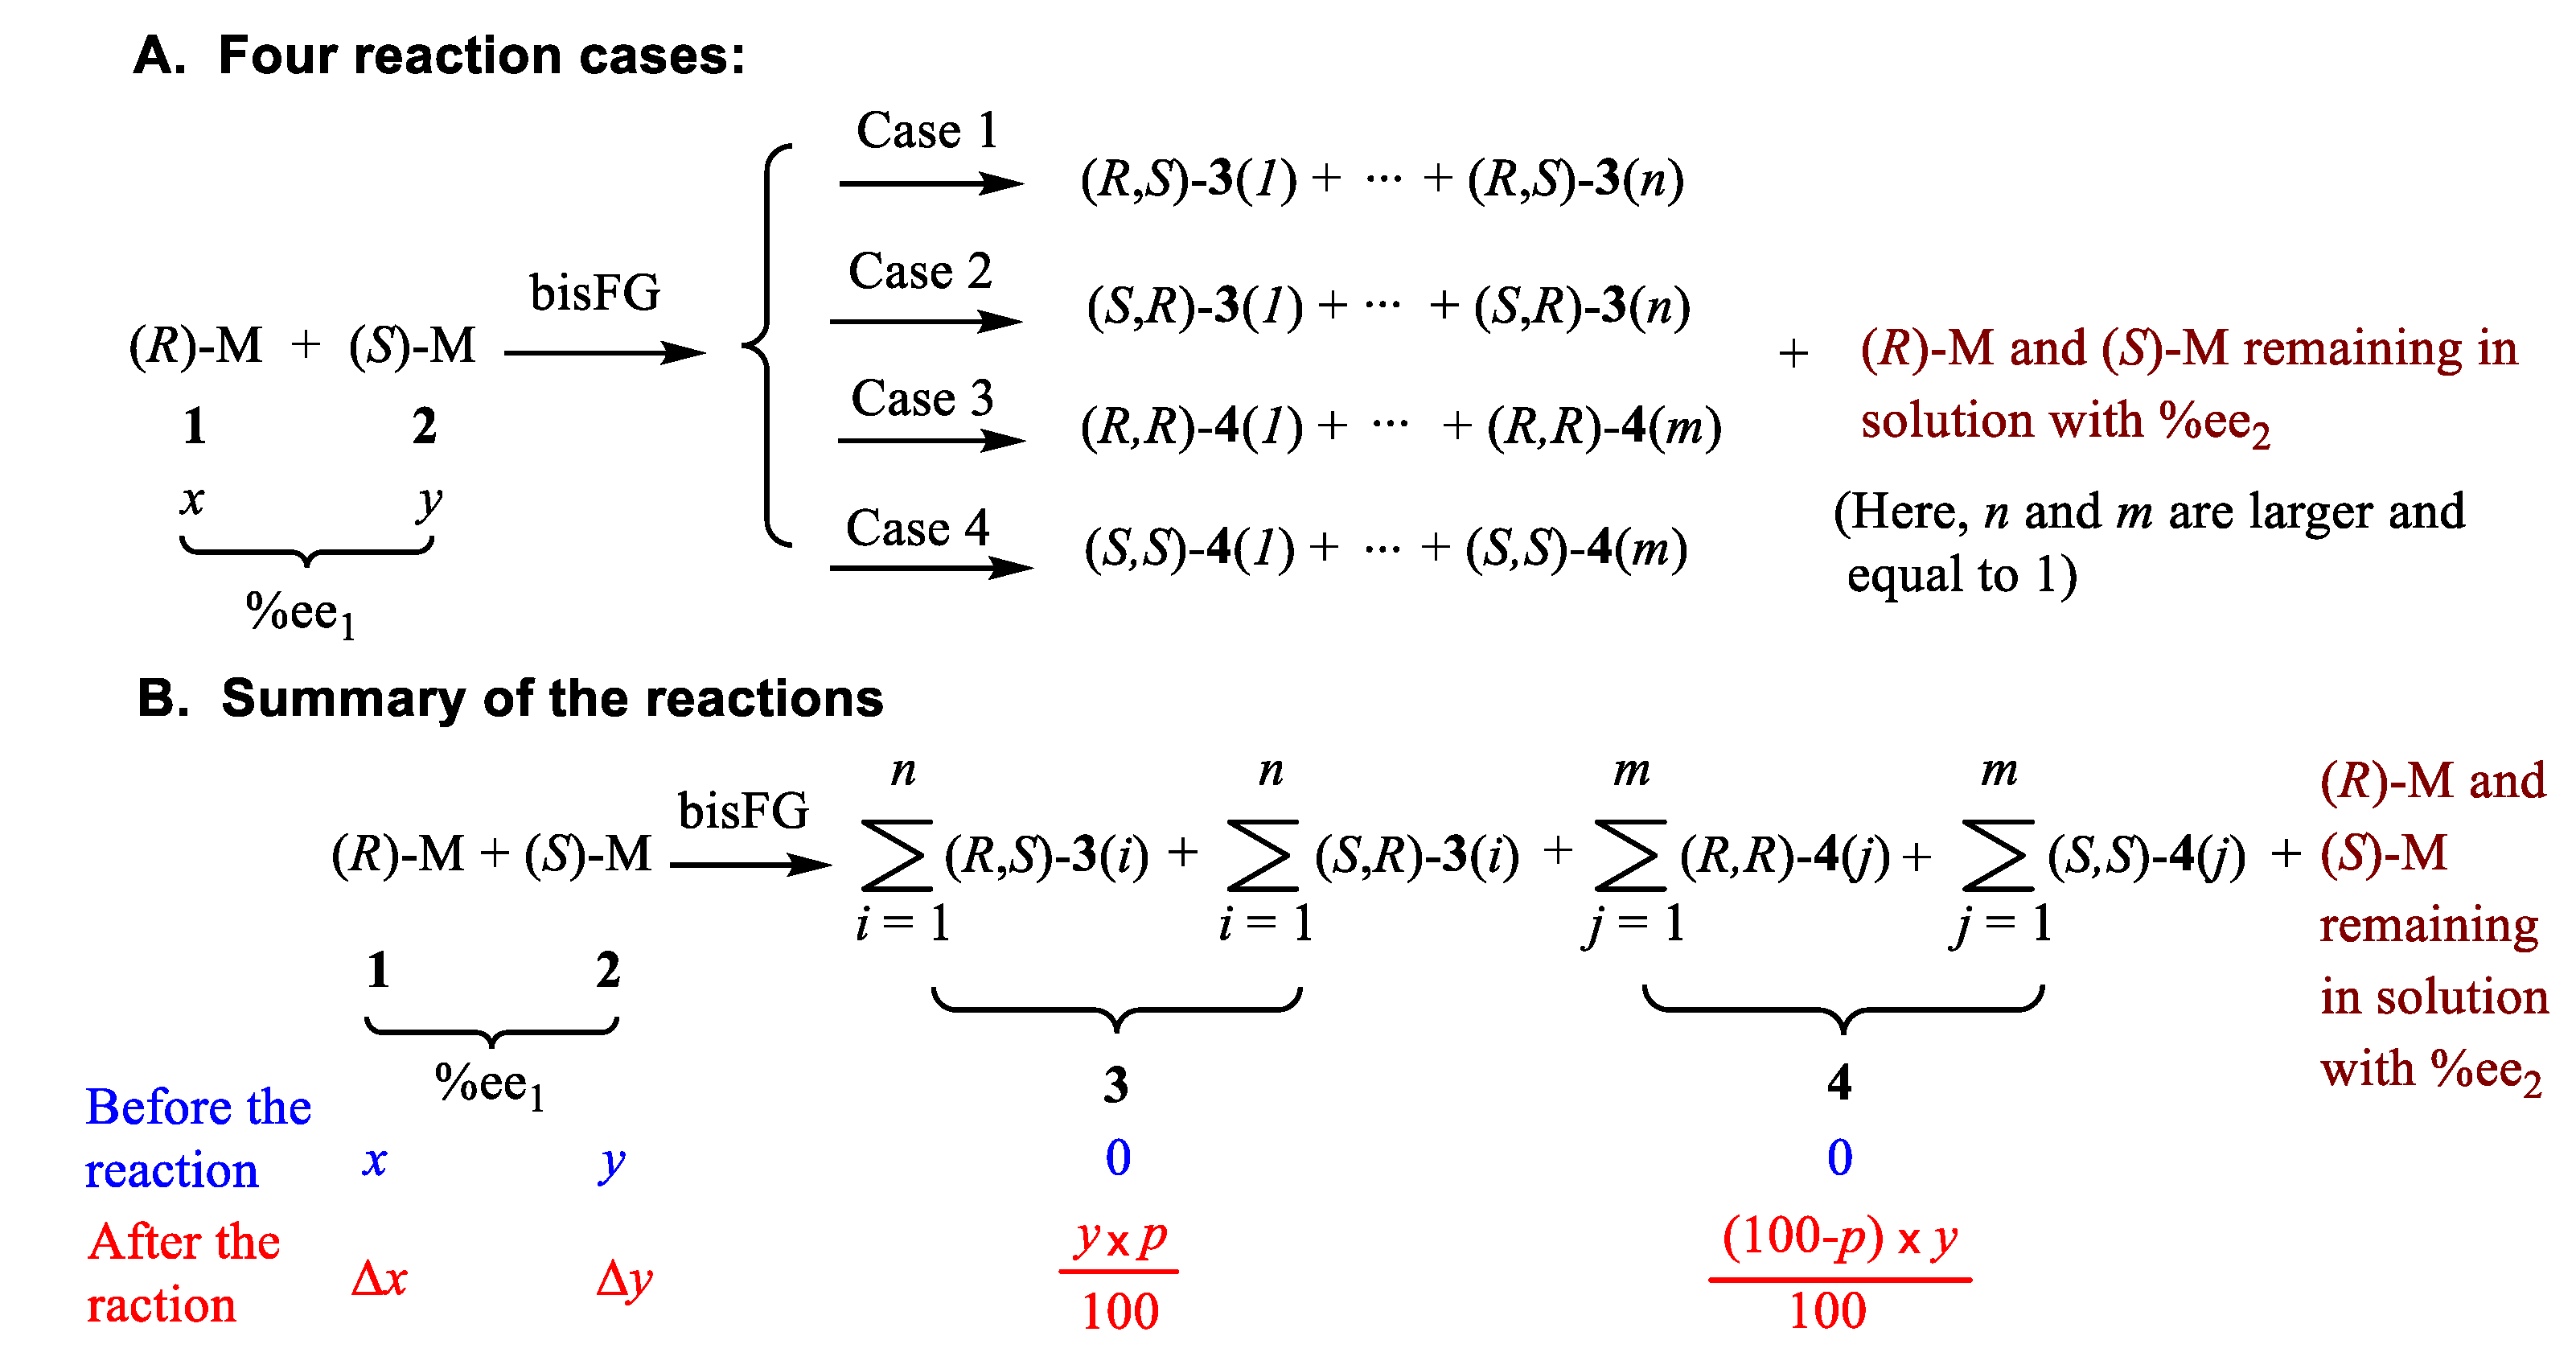
Figure 1.
Calculated relationships based on Eq. 8A. The value of x (amount of (R)-1, in Scheme 2) is fixed as 10.0, which y (amount of (S)-2 changes from 0.001 to 9.999 in order to produce the %ee1 from 99.980%ee to 0.005%ee in the calculations (x > y in Eq. 8A), respectively. The nine curves from the lowest one to the highest one on all three plots represents raising the yield (p) of 3 progressively from 10% to 90%. (A) Relationship of the initial %ee1 versus the final (R)-1 %ee2. (B) Relationship of the %ee enhancement, Δ%ee, of (R)-1 versus %ee1, where Δ%ee equals (%ee2 − %ee1). (C) Relationship of the ratio of %ee2/%ee1 versus %ee1 for (R)-1.
Scheme 3.
Plausible intermediates from reactions of (R)-1 and (S)-2 with biacetal to afford product groups 3 and 4.
Scheme 3.
Plausible intermediates from reactions of (R)-1 and (S)-2 with biacetal to afford product groups 3 and 4.
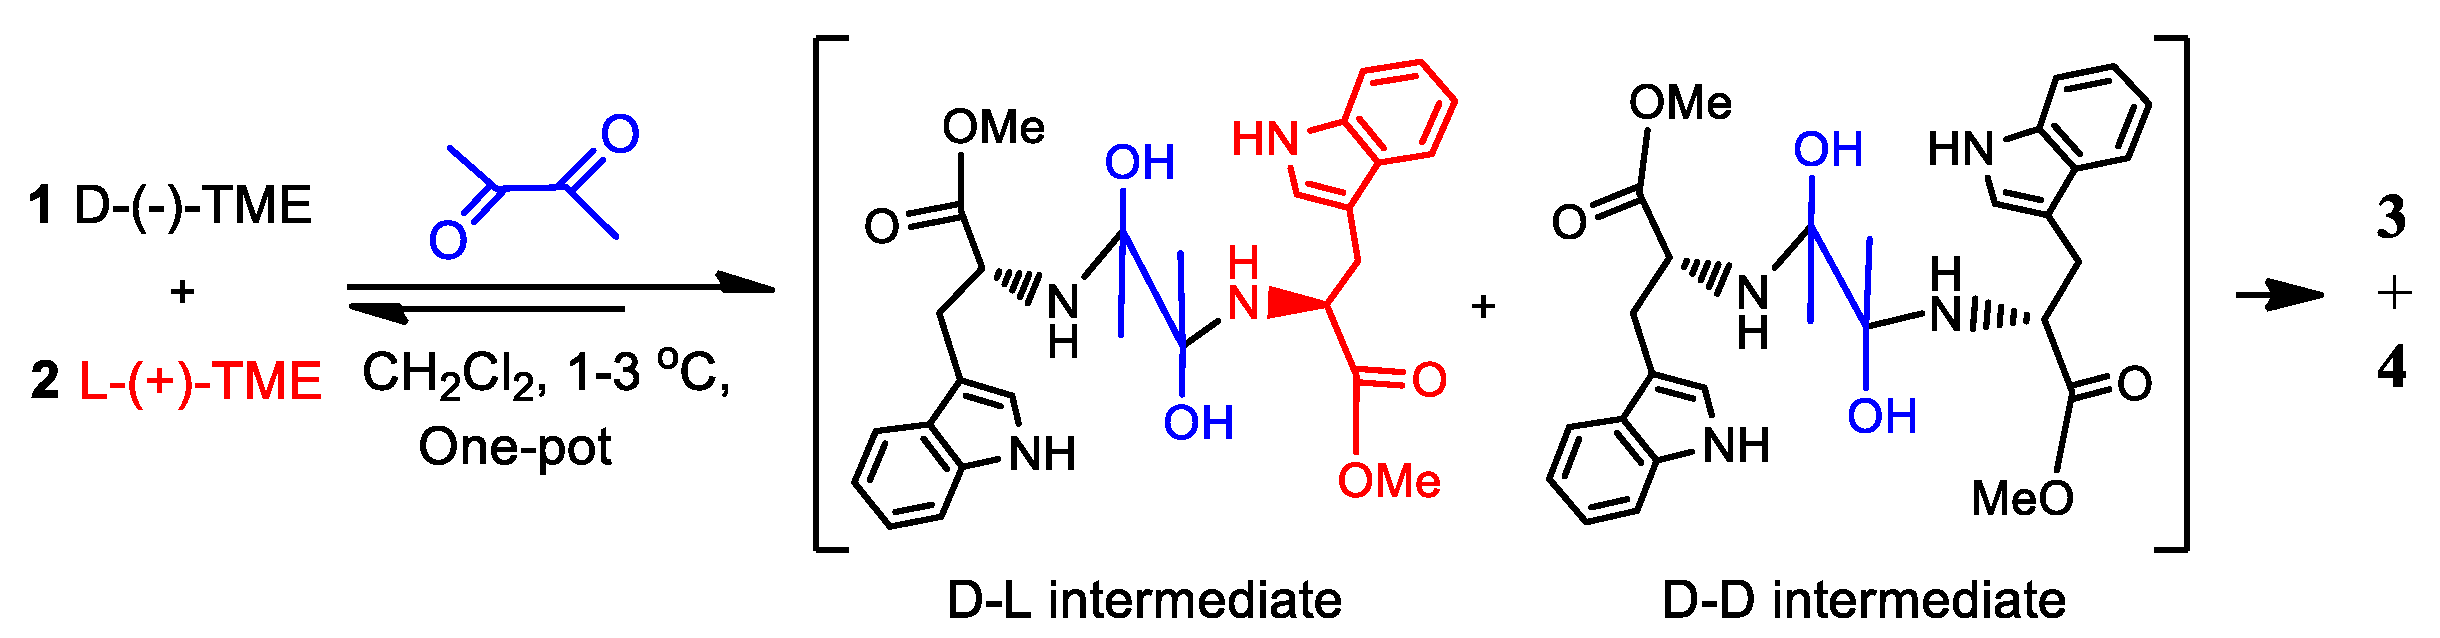
Figure 2.
(A) Relationships of the initial L-TME %ee1 versus the final L-TME %ee2. (B) Relationship of the changes in L-TME’s enantiomeric excess, Δ%ee, versus the initial L-TME %ee1, where Δ%ee equals (%ee2−%ee1); (C) Relationship of the ratio (%ee2/%ee1) versus %ee1. Theoretical relationships were plotted with dash-lines. All data were obtained by Eq 8 using three yields (p) of 21.7%, 31.2% to 33.3% yields to 3. Experimental data are printed with square □, triangle Δ, and cross ×.
Scheme 4.
L-TME (%ee1) reacts with oxalaldehyde to afford 5(1), 5(2) and 6(1) (relative energies listed below their structures).
Scheme 4.
L-TME (%ee1) reacts with oxalaldehyde to afford 5(1), 5(2) and 6(1) (relative energies listed below their structures).
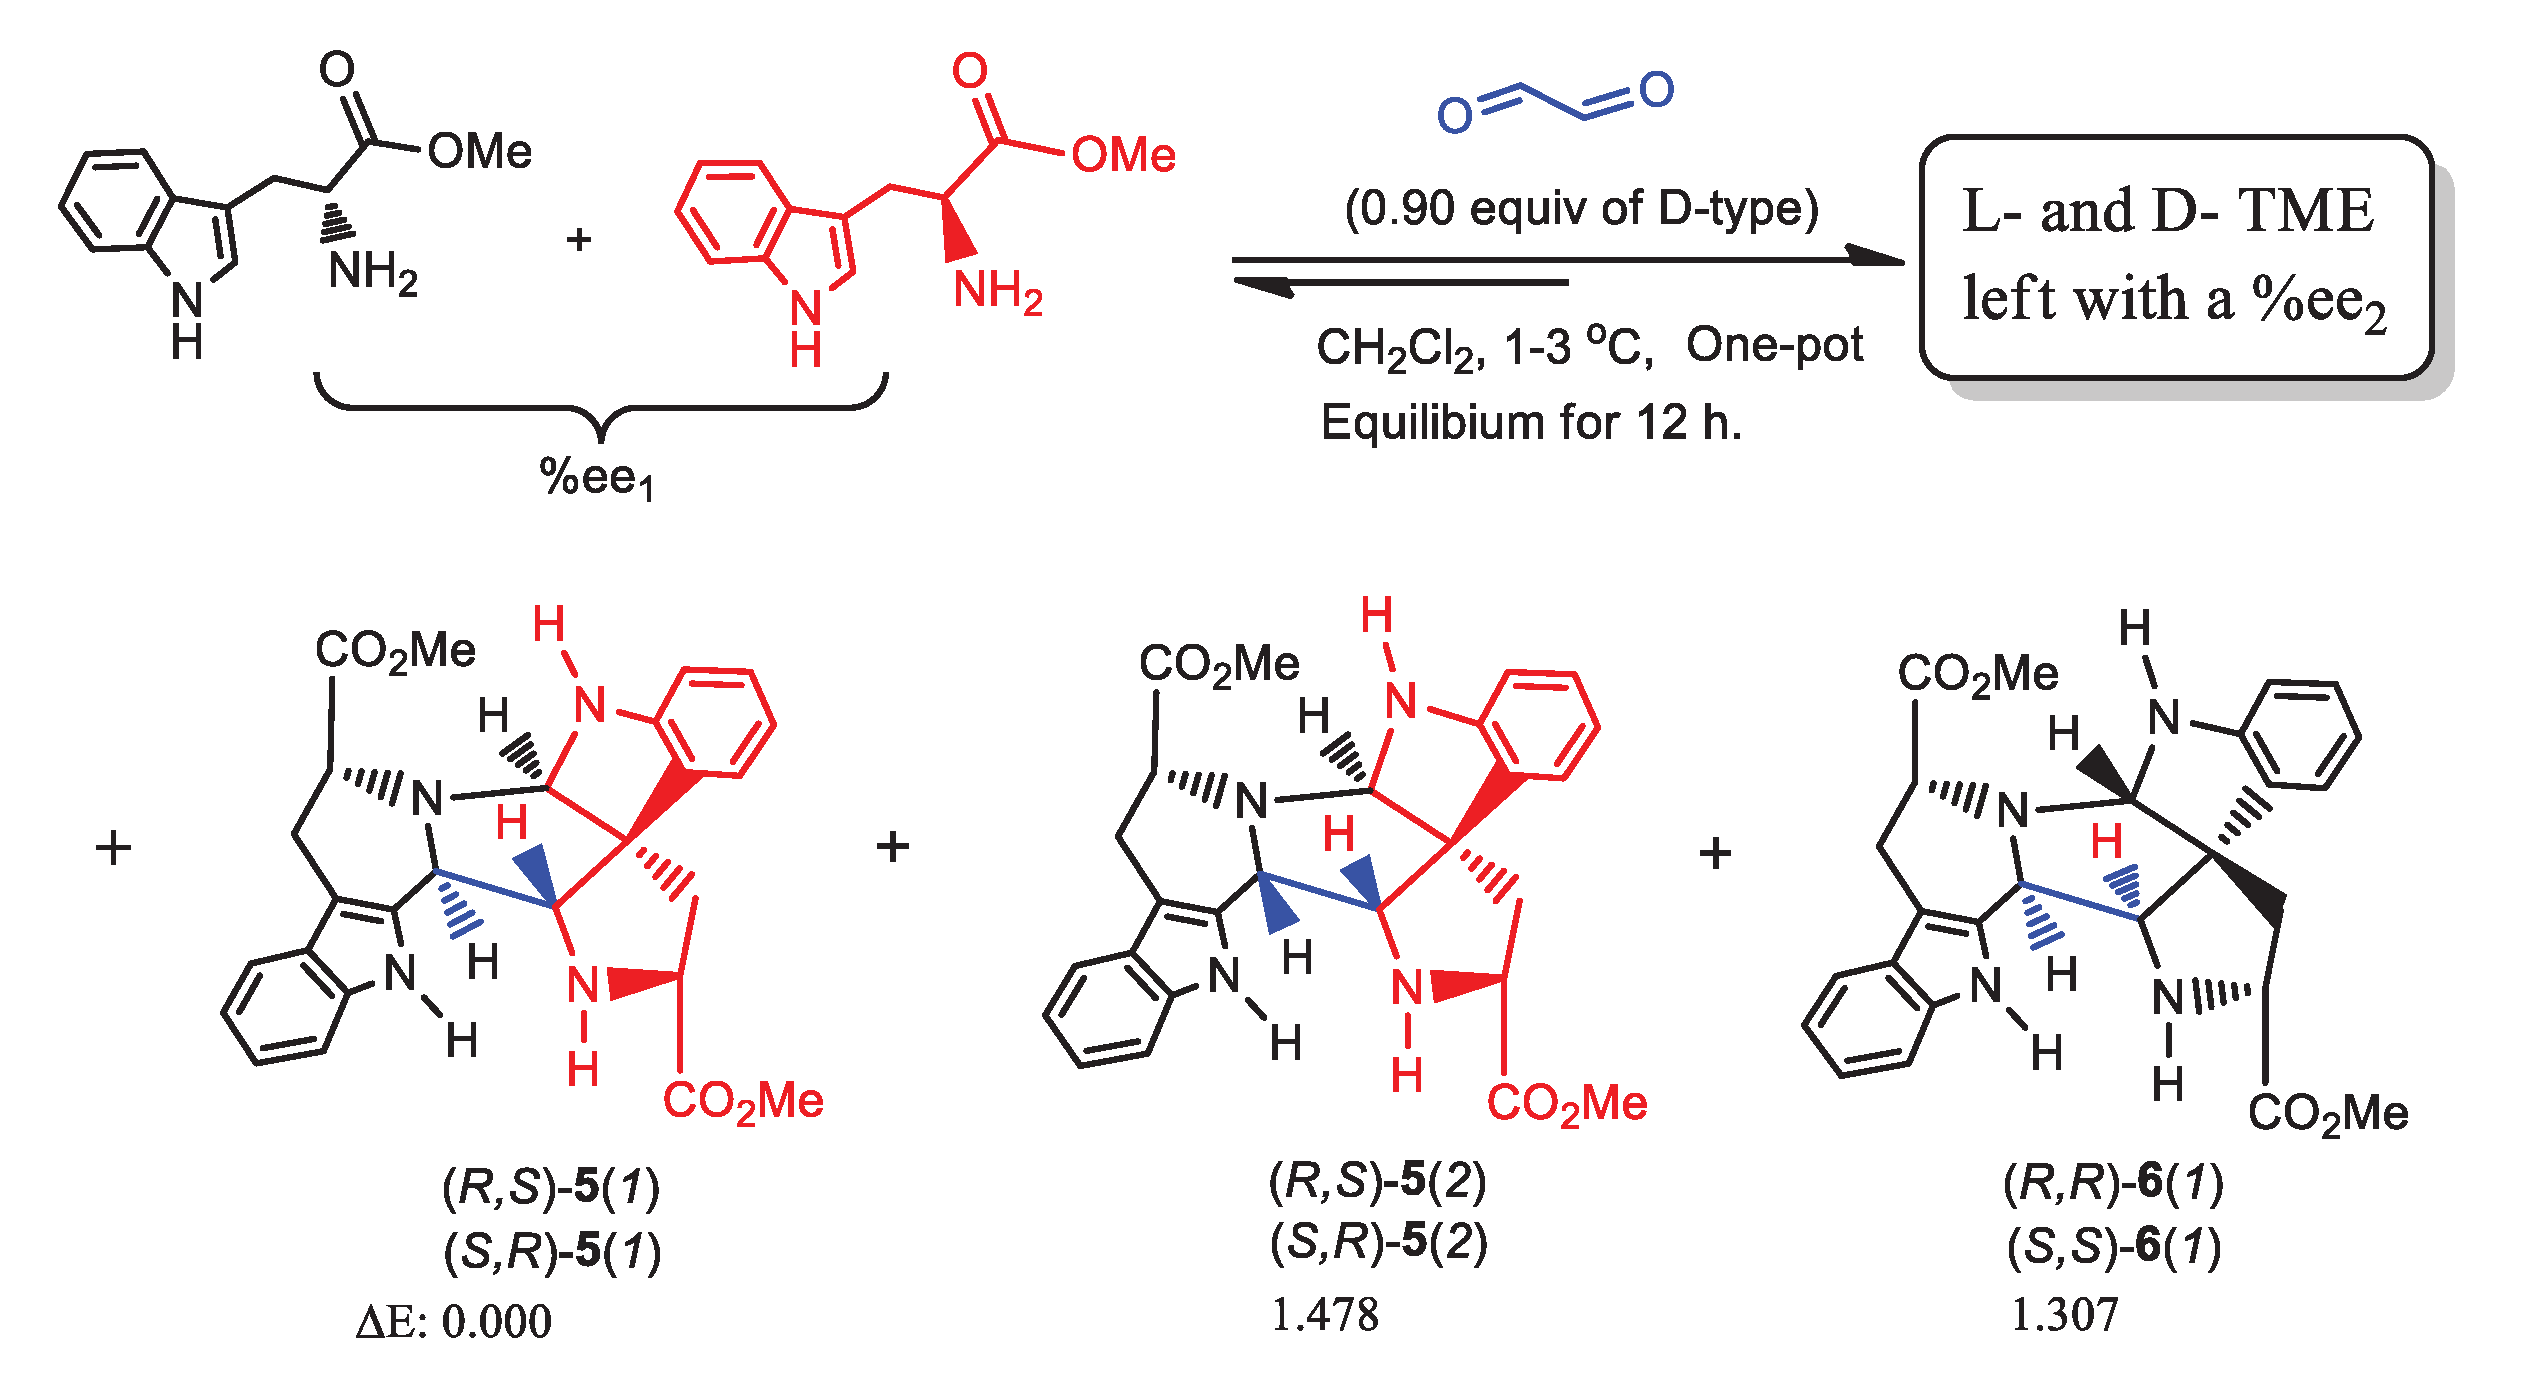
Figure 3.
Computed relationships predicted from Eq.8 and experimental results obtained for %ee1, %ee2, Δ%ee and the ratio of %ee2/%ee1 in the L-TME/oxalaldehyde reactions. The yield, p, to (R,S)-5 was assumed as 90% based on the energy difference between 5(1) and 6(1) of 1.307 kcal/mol (dash curve). The “×” symbols represent the experimental values. The deep blue lines through the “×” symbols are the fitted experimental points.
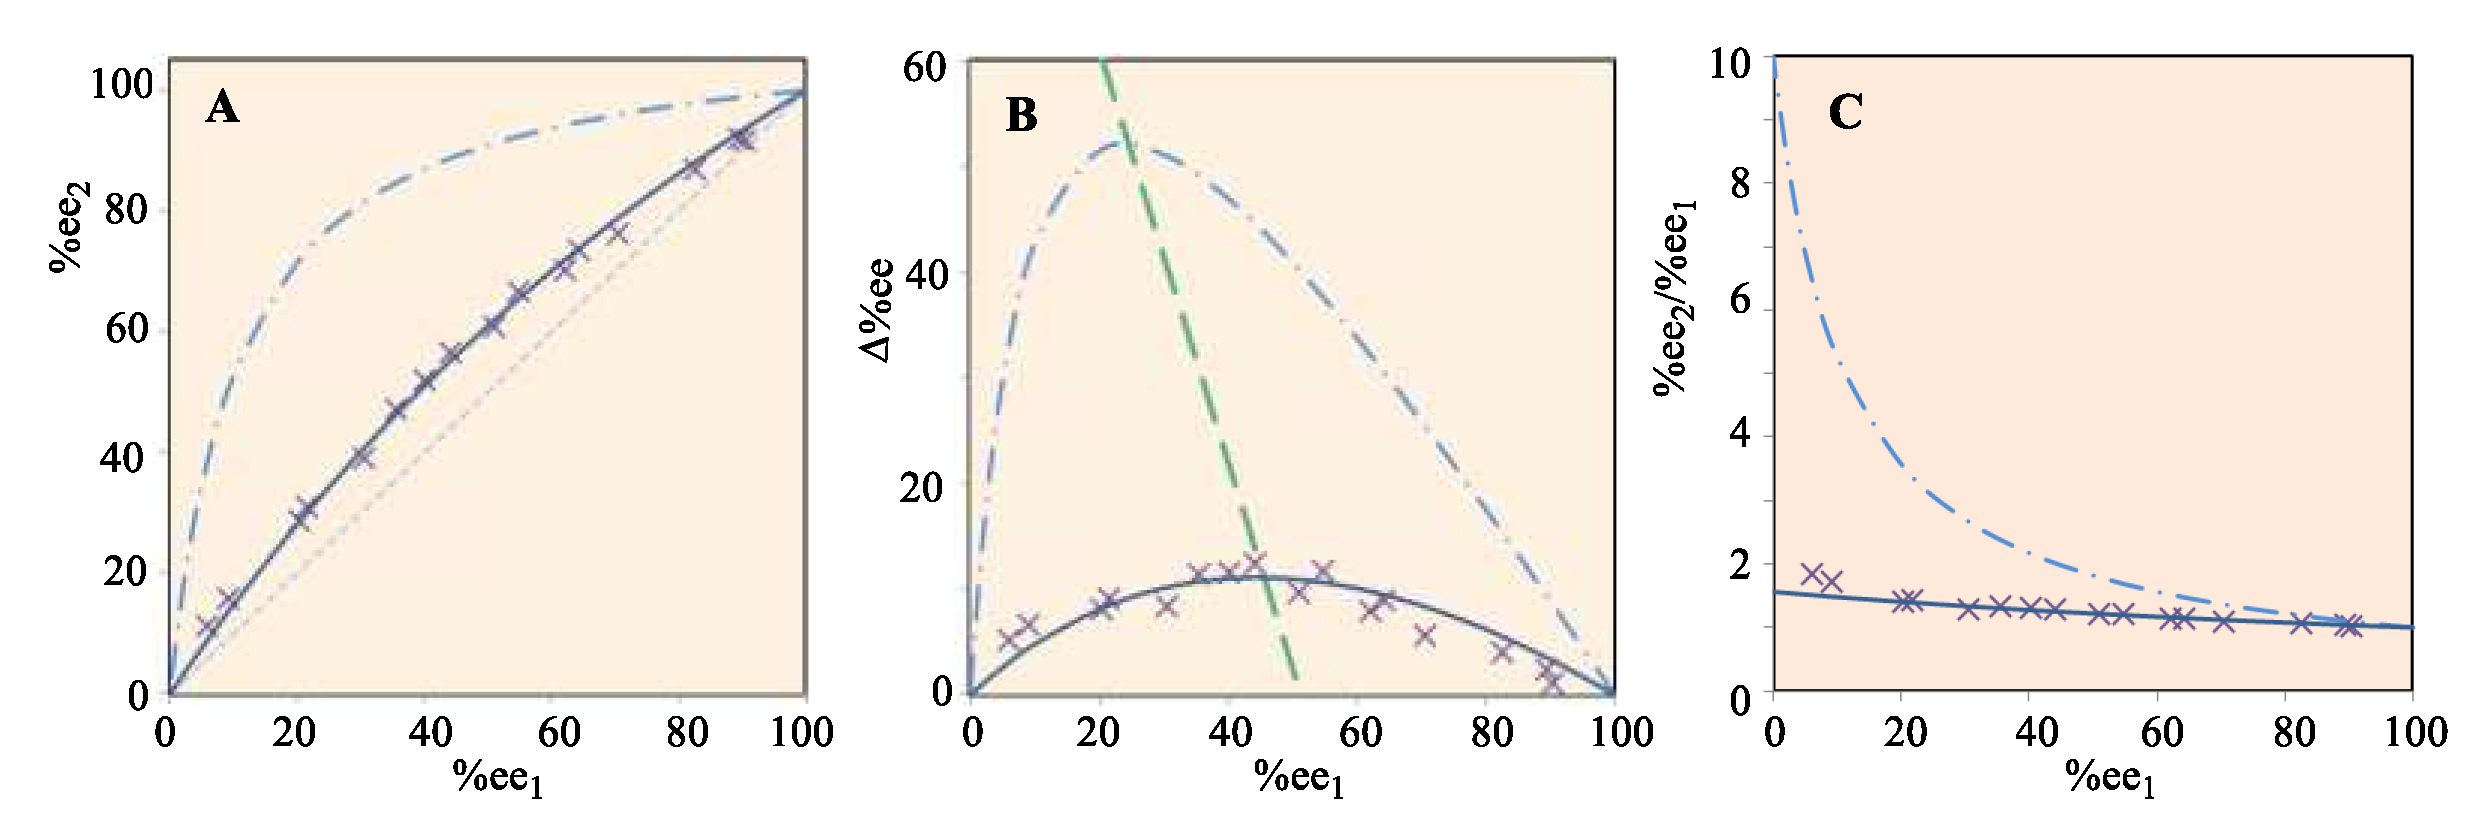
Figure 4.
The change in %ee2 versus the oxalaldehyde to D-TME mole ratio (%ee1 = 30.6%) in CH2Cl2 at 1-3 oC.
Figure 4.
The change in %ee2 versus the oxalaldehyde to D-TME mole ratio (%ee1 = 30.6%) in CH2Cl2 at 1-3 oC.
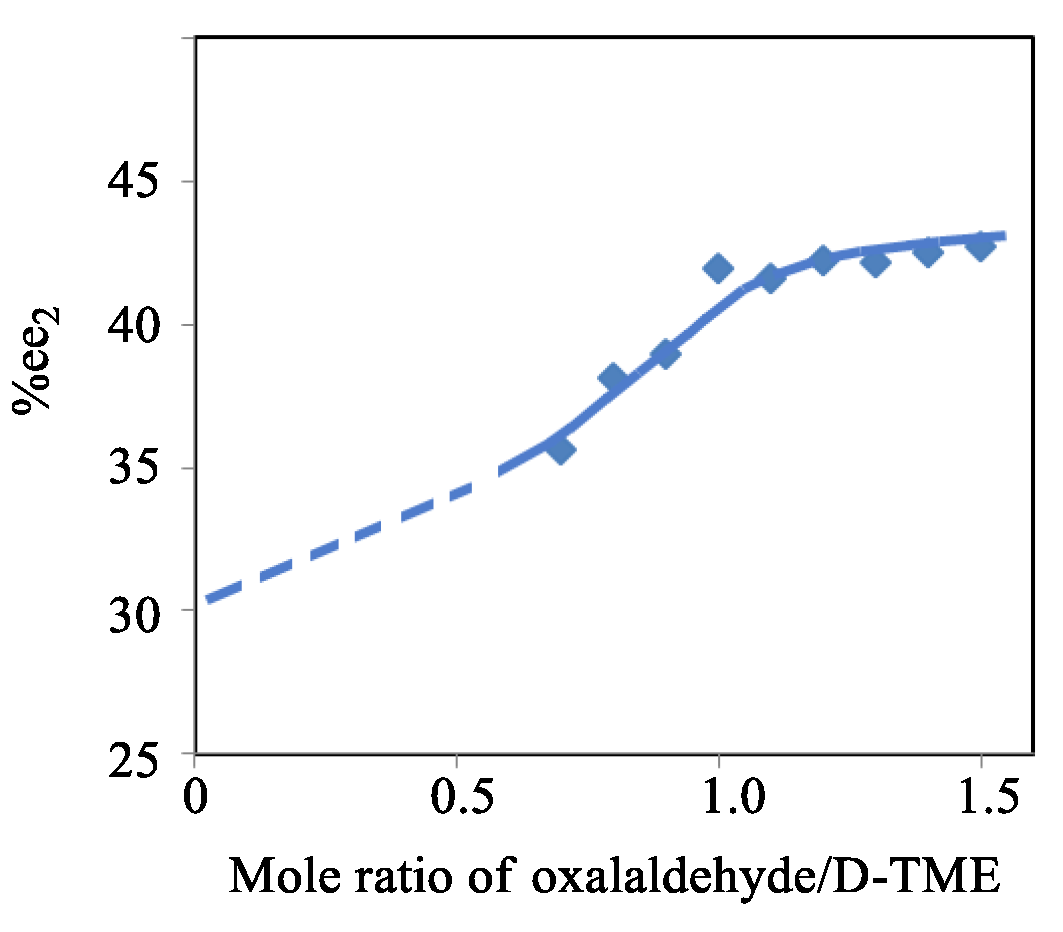

Table 1.
Three equilibrium times used in the reactions in Scheme 1 to afford the %ee2 and Δ%ee values using L-TME with initial %ee1 at 1-3 oC a.
Table 1.
Three equilibrium times used in the reactions in Scheme 1 to afford the %ee2 and Δ%ee values using L-TME with initial %ee1 at 1-3 oC a.
| Entry | %ee1 of L-TME initially used | %ee2 of L- TME recovered | Δ%ee (%ee2-%ee1) | ||||||
|---|---|---|---|---|---|---|---|---|---|
| 1st series | 2nd series |
3rd series |
1st series (yield) b |
2nd series |
3rd series |
1st series |
2nd series |
3rd series |
|
| 1 | 10.3 | 10.6 | 11.3 | 11.8(62%) | 11.8(61%) | 12.2(55%) | 1.5 | 1.2 | 0.9 |
| 2 | 18.7 | 17.9 | 17.9 | 20.9(60%) | 19.0 (56%) | 18.8 (53%) | 2.2 | 1.1 | 0.9 |
| 3 | 27.1 | 26.5 | 27.4 | 29.4(58%) | 28.8 (55%) | 29.7 (55%) | 2.3 | 2.3 | 2.3 |
| 4 | 36.6 | 36.7 | 37.6 | 42.2(59%) | 41.5 (55%) | 40.7 (51%) | 5.6 | 4.8 | 3.1 |
| 5 | 47.7 | 48.4 | 47.9 | 50.2(56%) | 54.2 (56%) | 51.4 (52%) | 2.5 | 5.8 | 3.5 |
| 6 | 57.8 | 59.0 | 60.2 | 58.4(60%) | 64.4 (62%) | 61.7 (53%) | 0.6 | 5.4 | 1.5 |
| 7 | 69.4 | 67.2 | 69.8 | 70.3(64%) | 69.5 (61%) | 71.8 (53%) | 0.9 | 2.3 | 2.0 |
| 8 | 80.5 | 79.9 | 80.1 | 82.1(62%) | 82.5 (63%) | 81.2(56%) | 1.6 | 2.6 | 1.1 |
| 9 | 90.4 | 90.18 | 89.1 | 91.2(60%) | 90.22(56%) | 90.6 (52%) | 0.8 | 0.04 | 1.5 |
a The equilibrium time was 2 h in the first series of reactions, 10 h in the second series, and 36 h. in the third series. b The data in parentheses are the yields to the recovered material.
Table 2.
Energy differences between the L,L- and D,L-cyclic dimers of six example amino acids and calculations of %ee2 and Δ%ee values using this energy data.
Table 2.
Energy differences between the L,L- and D,L-cyclic dimers of six example amino acids and calculations of %ee2 and Δ%ee values using this energy data.
| Entry | Cpd | ΔE a | ΔE b | p D,L-prod (%) | %ee2 f | Δ%ee | %ee2/%ee1 |
|---|---|---|---|---|---|---|---|
| 1 | 14 | -0.194 | -0.101 | 58.1 d / 54.2 e | 1.19 | 0.69 | 2.37 |
| 2 | 15 | -0.485 | -0.469 | 69.4 / 68.8 | 1.64 | 1.12 | 3.23 |
| 3 | 16 | -0.438 | -0.458 | 67.3 / 68.4 | 1.53 | 1.01 | 3.02 |
| 4 | 17 | +0.018 | -0.028 | 49.2 / 51.2 | 0.98 | 0.48 | 1.96 |
| 5 | 18 | -0.185 -0.547 c |
+0.198 -0.650 c |
57.7 / 41.7 60.3 / 75.0 |
1.18 1.26 |
0.68 0.75 |
2.34 2.50 |
| 6 | 19 | +0.626 -1.026 c |
+0.796 -1.569 c |
25.8 / 20.7 85.0 / 93.4 |
0.68 3.26 |
0.18 2.76 |
1.34 6.48 |
a The B3LYP/6-311++G(2d,p) method (M1) applied the PCM model to calculate these results in a water medium. ΔE = 627.5 × (ED,L-product − EL,L-product), in kcal/mol. bThe MPW1PW91/6-311++G(2d,p) method (M2) was used. c These geometries have no intramolecular H-bonds. Their energy was used for ΔE calculations. d ΔE was calculated via method M1 and used in yield predictions. e ΔE, computed via method M2, was used in yield predictions. f A %ee1 value of 0.50%ee was used in %ee2 and Δ%ee calculations employing Eq. 8. Only the data from M1 calculations were used for these calculations.
Disclaimer/Publisher’s Note: The statements, opinions and data contained in all publications are solely those of the individual author(s) and contributor(s) and not of MDPI and/or the editor(s). MDPI and/or the editor(s) disclaim responsibility for any injury to people or property resulting from any ideas, methods, instructions or products referred to in the content. |
© 2023 by the authors. Licensee MDPI, Basel, Switzerland. This article is an open access article distributed under the terms and conditions of the Creative Commons Attribution (CC BY) license (http://creativecommons.org/licenses/by/4.0/).
Copyright: This open access article is published under a Creative Commons CC BY 4.0 license, which permit the free download, distribution, and reuse, provided that the author and preprint are cited in any reuse.


