
Submitted:
30 June 2023
Posted:
04 July 2023
You are already at the latest version
Abstract
In this study, the gravimetric characterization and analysis of the solubilized extract of the organic fraction of Urban Household Solid Waste (RSDU) from the municipality of Belém do Pará was carried out in order to obtain the composition of the collected materials and the characteristics of the liquid resulting from the solubilization of these materials . The waste used to carry out this research was collected door-to-door, in which the points and neighborhoods served were determined through the sectorization of these locations and representative statistical sampling. For the sectorization of neighborhoods, family income values were considered as the main parameter. After collecting the solid waste, the material was sent to the facilities of the Federal University of Pará (FUPa), where the waste was classified into paper, cardboard, tetrapak, rigid plastic, soft plastic, metals, glass, organic matter, waste toilets, fabrics and others. The organic fraction of solid waste was separated and sent to the drying, crushing and packaging processes. Subsequently, the solubilized extract of the organic fraction of solid waste was obtained, following the methodology recommended by NBR standard nº 10.006/2004, of the Brazilian Association of Technical Standards and the values obtained were compared with Ordinance GM/MS nº 888/2021 and CONAMA Resolution nº 357/2005, in addition to results obtained by other authors. After carrying out the gravimetric characterization, it was possible to obtain the average proportions of 5.09% paper, 3.20% cardboard, 0.94% tetrapak, 3.58% rigid plastic, 9.97% soft plastic, 2.00% metals, 55.57% organic matter, 1.86% glass, 14.26% sanitary waste, 3.23% fabrics and 3.00% other waste. High values of organic residues were found in the gravimetric composition, which can be explained by the collection method used and the high humidity of the organic solid residues. In the analyzes of the solubilized extract, values of Hp (3.69 to 4.92), Turbidity (791 to 1,733 uT), Apparent Color (8,500 to 12,500 uC), True Color (6,000 to 14,000 uC), Total Dissolved Solids (5,330 to 8,040 mg/L), Total Nitrogen (201.80 to 359.90 mg/L), Ammoniacal Nitrogen (161 to 289 mg/L), Nitrate (10 to 40 mg/L), Total Phosphorus (52.30 to 166.80 mg/L) and Chemical Oxygen Demand (28,701 mg/L to 38,608 mg/L), in addition to other measured parameters, in which such information makes it possible to check the similarities of the waste solubilization conditions to that of leachates from landfills, in addition to not being in compliance with environmental and health legislation, demonstrating risks to the local environment and public health.
Keywords:
Urban Solid Waste
; Gravimetric Characterization
; Solubilized Extract
; Leachate Extract and Organic Fraction.
1. Introduction
The human capacity to transform nature has evolved since the beginning of societies. However, after the Industrial Revolution, transformations have reached greater proportions, as well as the production of goods and services [1]. The increase in birth rates, longevity, population rates and industrialization, combined with the culture of consumption and accumulation and the lack of knowledge about the limitation of environmental resources, causes an unbridled production of solid waste, causing environmental impacts that directly reflect on the quality of population's life [2].
The development model we live in has been causing constant changes in the environment. The increase in population, combined with increased consumption, has triggered negative impacts on the environment, such as inadequate disposal of solid waste. The improper disposal of solid waste is one of the major problems today. The high rates of waste production and problems with its final destination are recurrent concerns of governments and society as a whole [3,4]. In the year 2022, approximately 81.8 million tons of solid urban waste were generated in Brazil, corresponding to 224 thousand tons per day. Of this amount, 29.7 million tons were not sent to the environmentally appropriate destination/final disposal. Of the units with final disposal, around 64.31% represent environmentally inappropriate alternatives, such as dumps and controlled landfills. In the state of Pará, this value goes to 90.51% [5,6].
Garbage dumps and sanitary landfills cause significant impacts to the environment. Among the impacts, it is possible to detect the depreciation of groundwater, water, soil and air pollution, changes in soil biota, biodiversity and local ecological balance, contamination of waste pickers, visual pollution and the presence of odors [7,8]. Obtaining leached and solubilized extracts makes it possible to simulate the impact of liquid products from solid waste on the environment [9,10]. The need for analysis of these liquid by-products comes from the potential to generate toxic compounds, such as phthalate diesters [11,12,13].
Physical-chemical analyzes of the leachate verified average pH values of 7.74 [14,15,16,17,18,19,20], Total solids 4882 mg.L-1 [15,16,18,20], Ammonia Nitrogen 909 mg.L-1 [15,16,18,19,20], Nitrite 12.8 mg.L-1 [15,20], Nitrate 23.6 mg.L-1 [15,16,18,20], Biochemical Oxygen Demand (BOD) 1,507.69 mg.L-1 [14,15,16,17,18,19,20] and Chemistry Oxygen Demand (COD) 16,524.47 mg.L-1. In general, leachate is a liquid rich in dissolved organic matter, macronutrients, metals, ammonia, xenobiotic compounds, high levels of BOD and COD, in addition to a dark color [21,22].
Exudates with the solubilized extract were able to prove its ecotoxic effects [23,24,28], perform physicochemical analyzes to verify compounds [23,24,25,26,27,28,29,30,31,32,33] and and classify the residues that originated these compounds according to their dangerousness and solubility [26,29,30]. Obtaining leached and solubilized extracts has procedures defined in Technical Standards NBR 10,005/04 and 10,006/04 of the Brazilian Association of Technical Standards [34,35], and the classification of waste according to its dangerousness and solubility is guided by NBR 10,004/04 [36].
The objective of this work is to systematically evaluate the physical-chemical characterization of the solubilized extract of the organic fraction of urban solid waste from the municipality of Belém-PA. Thus, solid waste was collected, with delimitation of the study area, statistical sampling and gravimetric characterization. After the gravimetric analysis, procedures were performed to obtain the solubilized extract, the values obtained were compared with the potability ordinance of the Brazilian Ministry of Health GM/MS no. 888/2021 [37] and the Resolution of the Brazilian Council for the Environment (CONAMA) no. 357/2005 [38].
(Populus nigra x P.
2. Materials and Methods
2.1. Strategy and Methodology
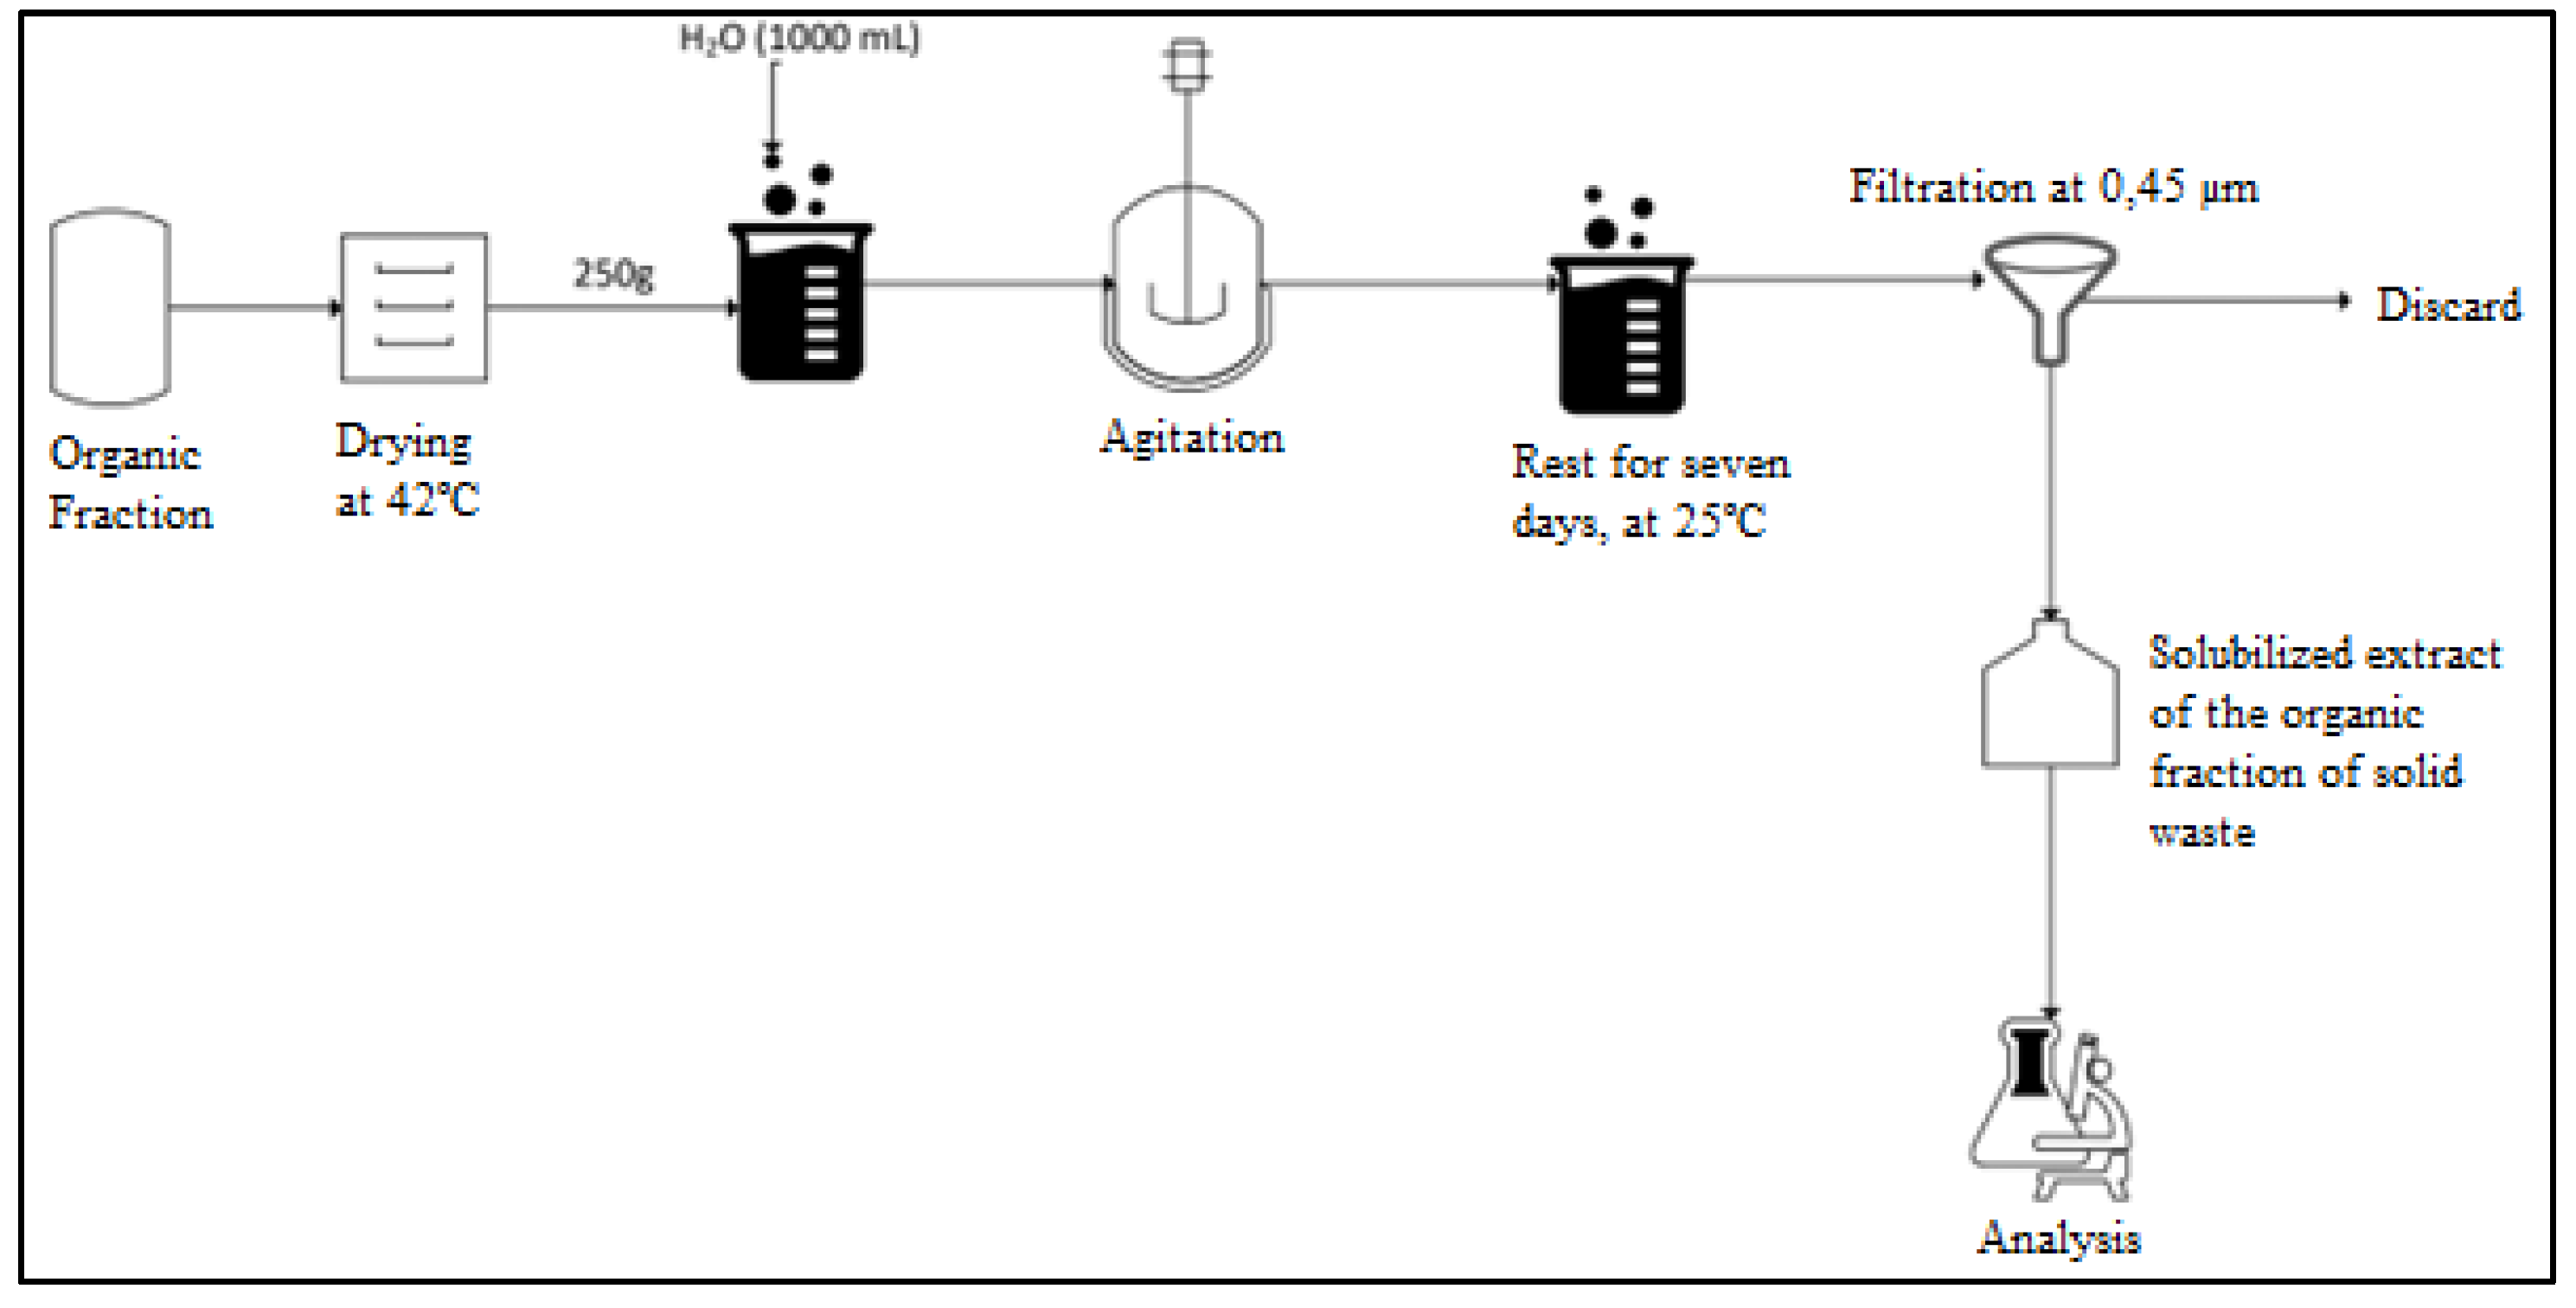
The process shown in Figure 1 simplifies the processes carried out so that the research objectives are fulfilled. First, information was extracted from the database of the Brazilian Institute of Geography and Statistics (IBGE) [39] on the nominal income of the inhabitants of the neighborhoods where the collections were carried out. Subsequently, the neighborhoods were grouped into sectors and regions and a representative statistical sampling was carried out to have knowledge of the amount of solid waste to be collected in each sector.
After the collections, the gravimetric characterization of solid waste was carried out, in which they were classified and separated into paper, cardboard, tetrapak, rigid plastic, malleable plastic, metals, glass, organic matter, sanitary waste, fabrics and others wastes. The proportion of each of these residues was calculated. Subsequently, the organic fraction of the residues was subjected to drying at 100ºC, crushing, sieving through 6 to 9 mesh sieves, and freezing at a temperature below 0ºC. Subsequently, the material was thawed at a temperature of 42ºC, in which the procedures for obtaining the solubilized extract and carrying out the analyzes were carried out.
2.2. Conceptual Design
The plan of action applied to systematically study the effect of the solubilization of solid waste in the environment, when released, in addition to proposing technologies that prevent the proliferation of these materials was designed conceptually as a logic sequence of ideas, concepts, and methods including the determination and characterization of the study area, statistical sampling of the mass of waste to be collected, collection door-by-door of solid waste in the neighborhoods, gravimetric characterization according to the class of materials (paper, cardboard, tetrapak, rigid plastic, malleable plastic, metals, glass, organic matter, sanitary waste, fabrics and others wastes), pre-treatment of the organic fraction of solid waste, obtaining the solubilized extract and analysis of the solubilized extract.
2.2.1. Determination on the Study Area
The gravimetric collections and characterizations of this research, in addition to the logistics in the collection of materials, were financed with resources from the CNPq Project (Edital 12/2020 MAI/DAI UFPA-Terraplena) Development and Application of Technology for the Sustainability of the Provision of the Collection Service and Urban Solid Waste Transport, coordinated by Doctor José Almir Rodrigues Pereira (FAESA/ITEC/UFPA).
Figure 2.
Neighborhoods served by Terraplena in Belém.
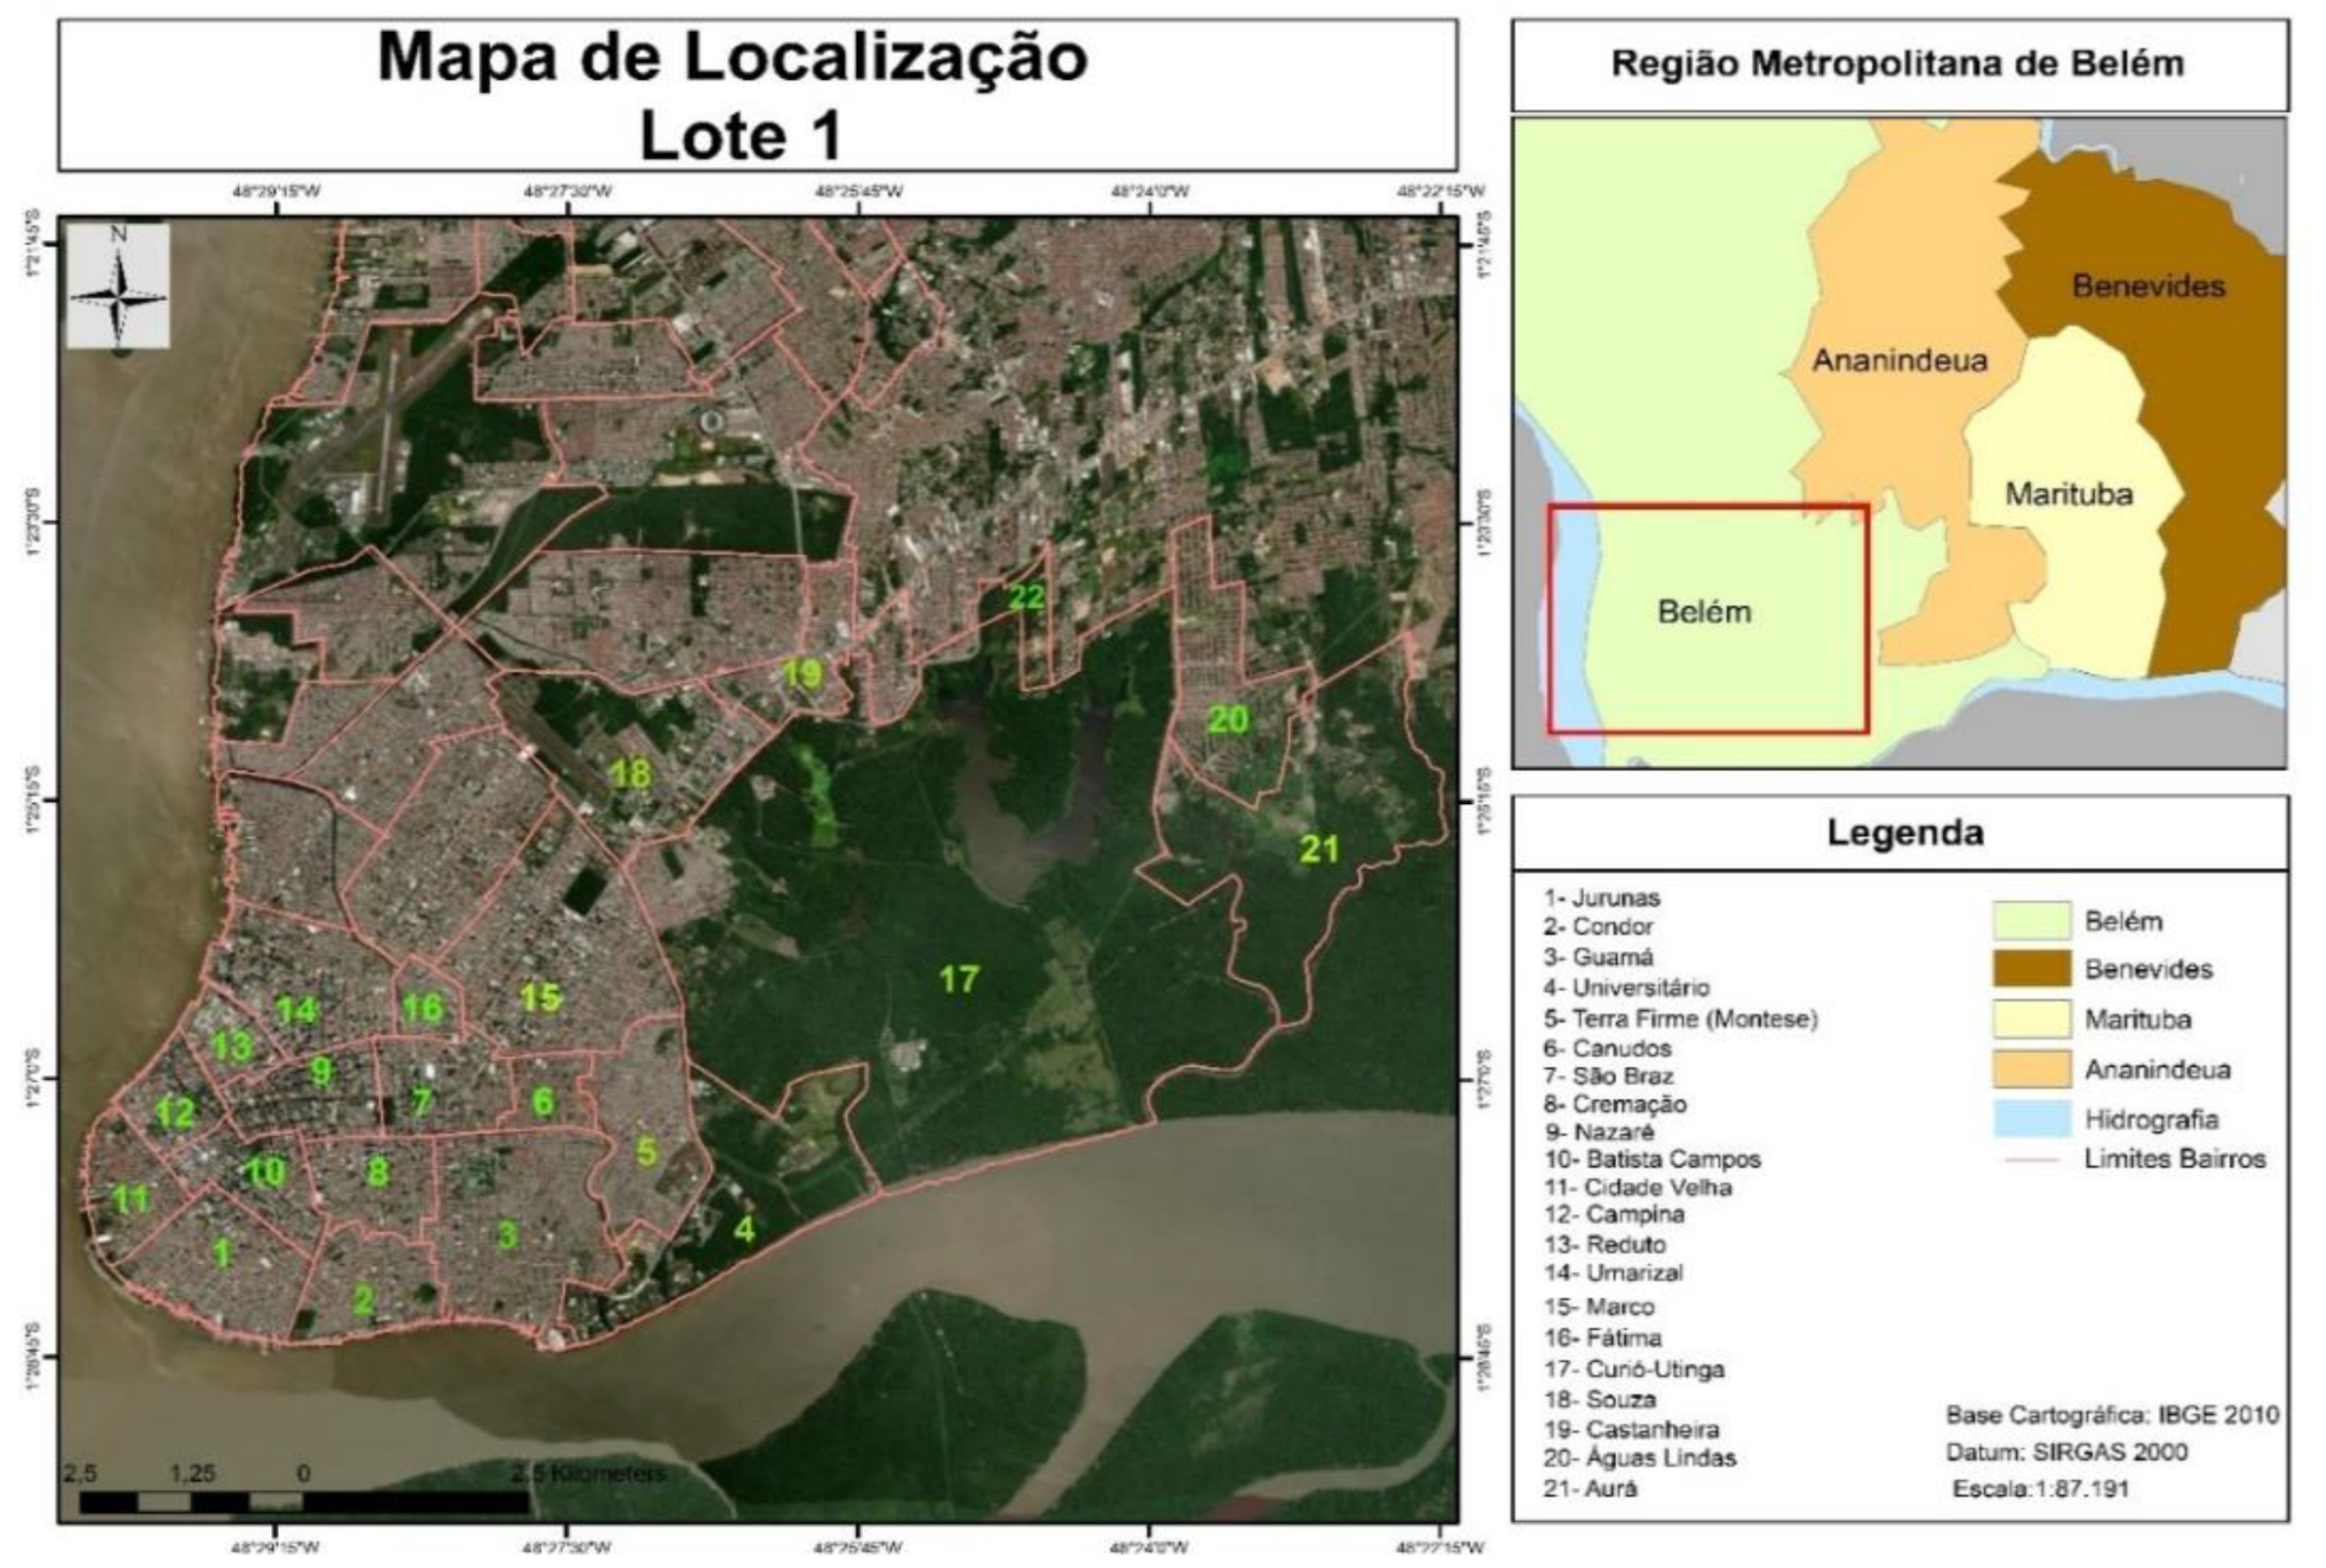
For a better distribution of the neighborhoods and for the formation of representative samples for carrying out the collection procedures, the neighborhoods were grouped into sectors and regions, in which the average nominal income was considered as the main factor for this type of organization. The grouping resulted in nine sectors and three regions, originating from twenty-one (21) neighborhoods and thirty-seven (37) waste collection routes. To carry out the groupings, the neighborhoods were divided by average nominal income, according to the methodology recommended by [39,40] which states that the Brazilian population is divided into five social classes: A, B, C, D and E. Social classes are defined based on the total income of a family group.

Table 1.
Socio-economic classification in the municipality of Belém-Pará-Brazil based on minimum salary [35].
Table 1.
Socio-economic classification in the municipality of Belém-Pará-Brazil based on minimum salary [35].
| Socio-economic Classification | |
| Classes | Family Income (Minimum/Basic Salary) |
| A | over 20 salaries |
| B | from 10 to 20 salaries |
| C | from 10 to 20 salaries |
| D | from 10 to 20 salaries |
| E | up to 02 salaries |
Table 2.
Socio-economic classification, population, average family income in reais (R$) and and grouping into sectors of all the neighborhoods in the municipality of Belém-Pará-Brazil [35].
Table 2.
Socio-economic classification, population, average family income in reais (R$) and and grouping into sectors of all the neighborhoods in the municipality of Belém-Pará-Brazil [35].
| Sectors | Neighborhoods | Average family income (R$) | Population (Pop) | Socioeconomic classification |
|---|---|---|---|---|
| Sector 1 | Aura | 354,51 | 1.827 | E |
| Águas Lindas | 344,47 | 17.520 | E | |
| Sector 2 | Curió-Utinga | 708,53 | 16.642 | E |
| Guanabara | 381,58 | 1.588 | E | |
| Castanheira | 748,87 | 24.424 | E | |
| Sector 3 | Souza | 1.291,02 | 13.190 | D |
| Marco | 1.326,37 | 65.844 | D | |
| Sector 4 | Canudos | 821,81 | 13.804 | E |
| Terra Firme | 414,65 | 61.439 | E | |
| Guamá | 525,80 | 94.610 | E | |
| Sector 5 | Condor | 483,06 | 42.758 | E |
| Jurunas | 633,08 | 64.478 | E | |
| Sector 6 | Fátima | 656,14 | 12.385 | E |
| Sector 7 | Umarizal | 1.991,17 | 30.090 | D |
| São Brás | 1.971,37 | 19.936 | D | |
| Cremação | 1.093,94 | 31.264 | D | |
| Sector 8 | Batista Campos | 2.537,63 | 19.136 | C |
| Nazaré | 3.036,30 | 20.504 | C | |
| Reduto | 2.964,30 | 6.373 | C | |
| Sector 9 | Campina | 2.035,60 | 6.156 | D |
| Cidade Velha | 1.235,27 | 12.128 | D | |
| Total population | - | 576.096 | - |
Table 3.
Grouping neighborhoods into sectors and regions.
| Regions | Sectors | Neighborhoods |
|---|---|---|
| 1 | 1, 2 and 3 | Aurá, Águas Lindas, Curió-Utinga, Guanabara, Castanheira, Souza e Marco |
| 2 | 4, 5 and 6 | Canudos, Terra Firme, Guamá, Condor, Jurunas e Fátima |
| 3 | 7, 8 and 9 | Umarizal, São Brás, Cremação, Batista Campos, Nazaré, Reduto, Campina e Cidade Velha |
The strategy applied for the selection of collecting routes in the municipality of Belém-Pará-Brazil is described synthetically as follows. The grouping in sectors and regions facilitated the planning of the collections, the gravimetric composition and all the packaging and transformation processes carried out in the waste, considering the objectives of the research carried out.
2.2.2. Simulation of Sample Mass of MHSR
In order to compute the statistically representative sample volume of MHSW, a simulation was performed with aid the software StatDisk 13.0. The simulation was based on the volume collected by route using a collector truck of 15 m³, assuming that average density of MHSW was that of liquid water. The significance and confidence levels were set equal to 5% and 95%, respectively, with a margin of error of 10%, giving as result a sample of mass ≈ 100 kg [37].
2.2.3. Collections and Gravimetric Characterization of Solid Waste
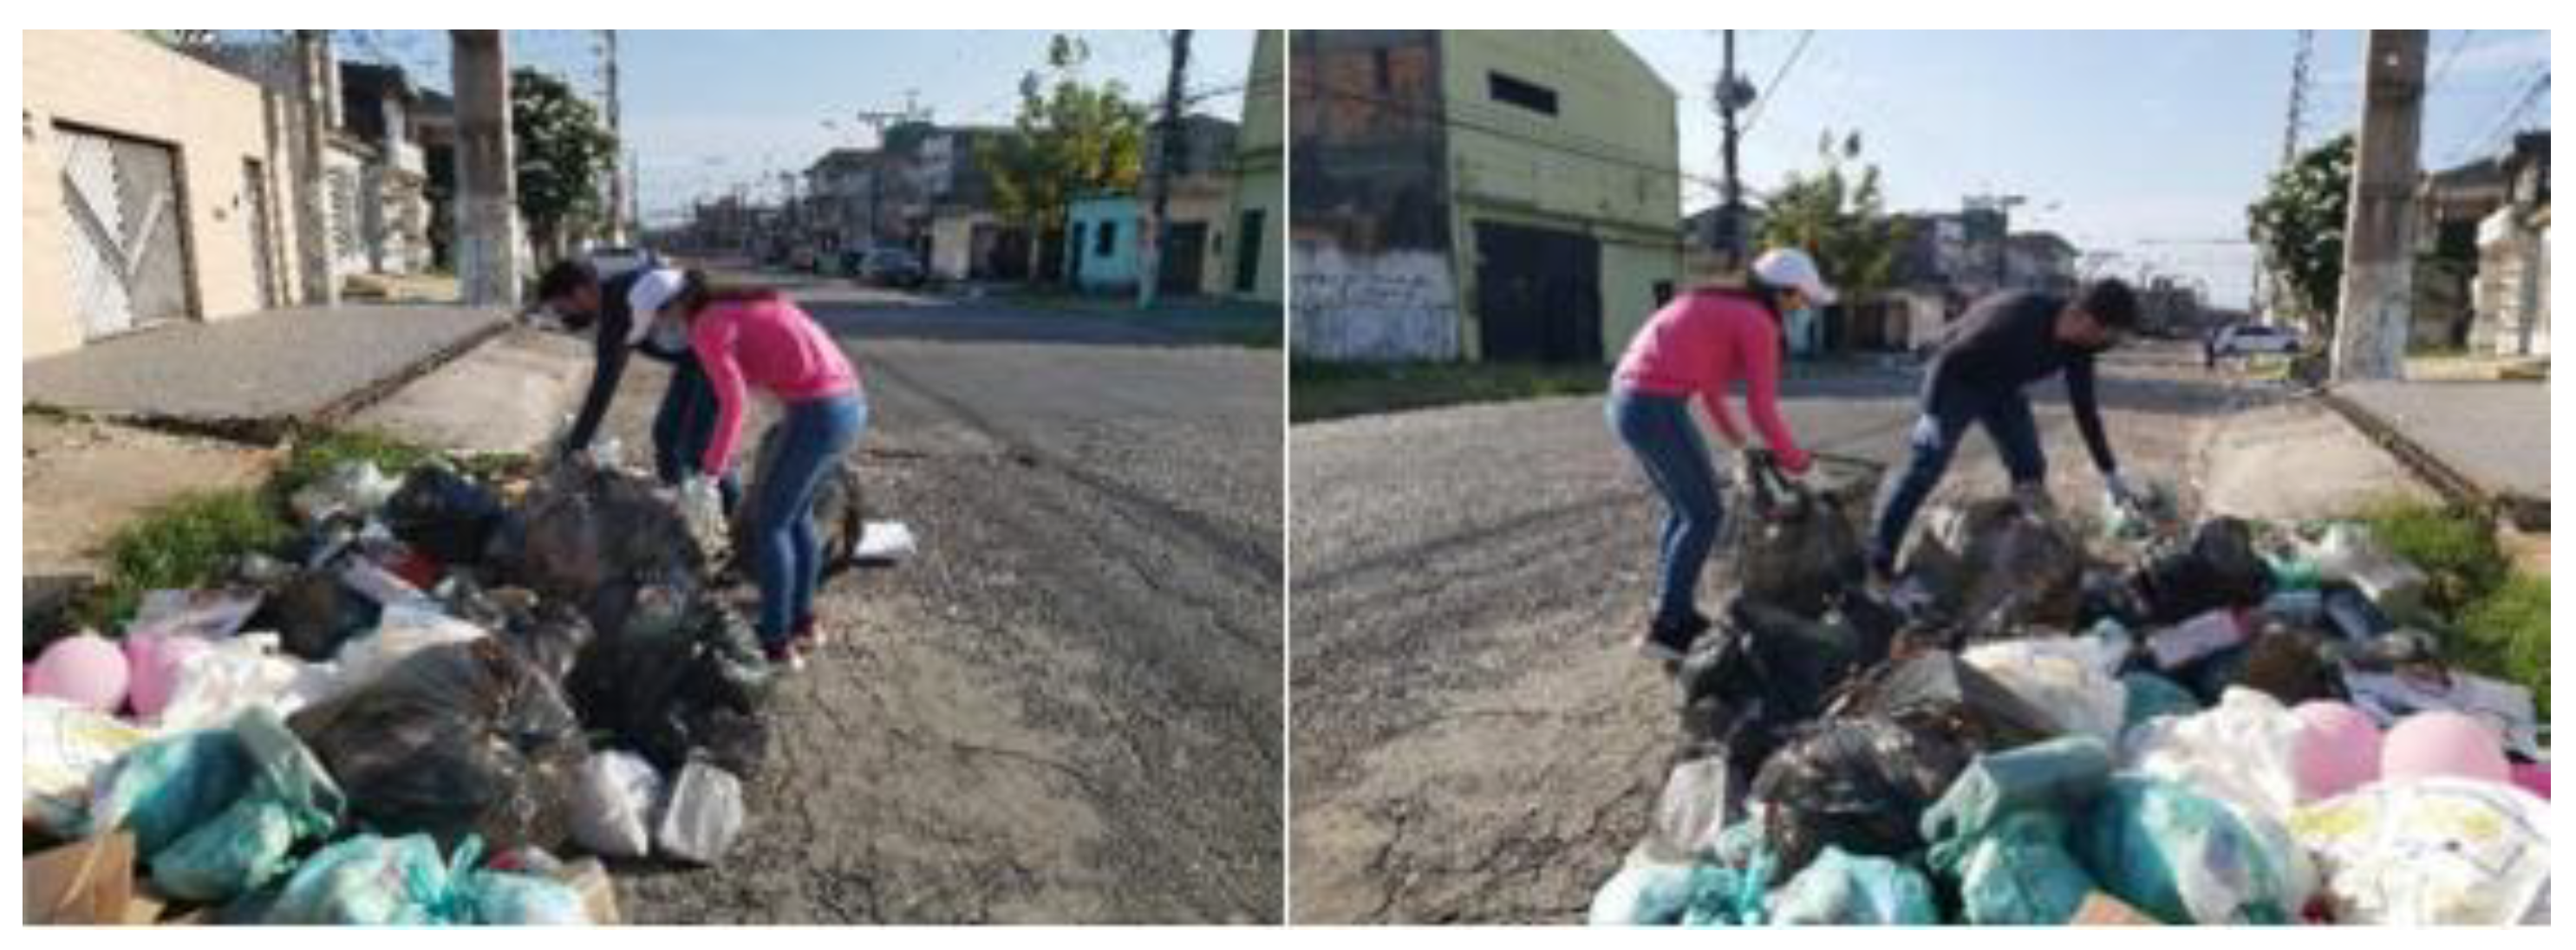
The door-to-door collection methodology was chosen, because in this way, the waste is collected in conditions similar to those of its generation and there is no compression in the material, not altering the degree of humidity.
After the collections were carried out by the door-to-door method, the residues were sent to a suitable space for carrying out the gravimetric characterization, at the Federal University of Pará. Immediately after the arrival of the material, the gravimetric characterization of the collected solid waste began. In the collections carried out at night, the gravimetric characterization was carried out in the morning of the following day.
Figure 3.
Colletions of solid waste in Belém.
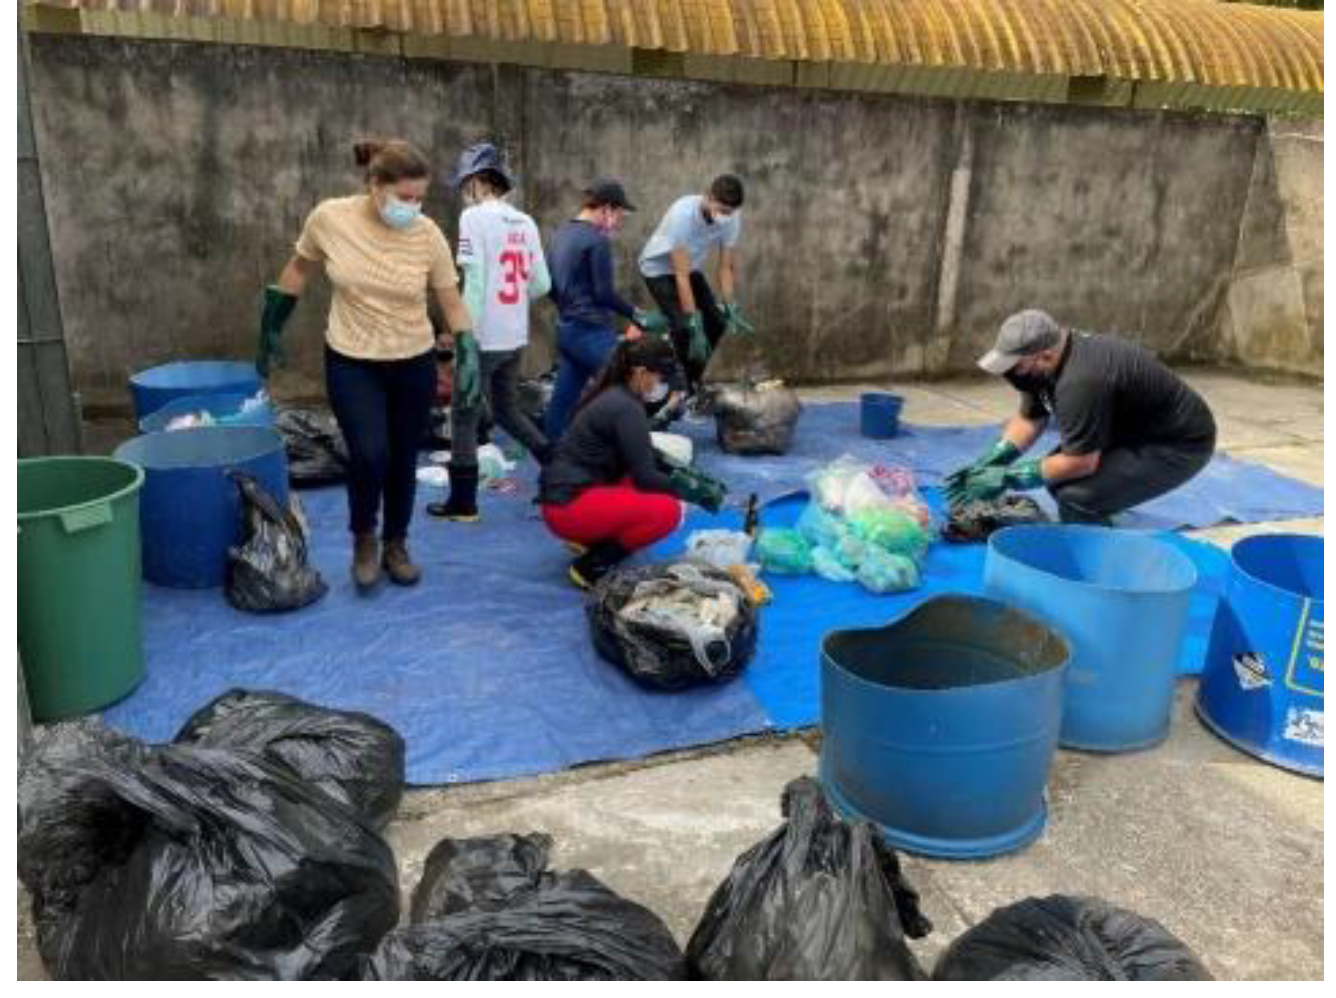
The gravimetric characterization was carried out considering the separation of solid waste into types: Paper, Cardboard, Tetrapak, Rigid Plastic, Malleable Plastic, Glass, Metal, Organic Matter, Fabrics, Sanitary Waste and others. Before carrying out the gravimetric characterization, the total mass of waste was measured, to guide the gravimetry process, with the correct proportion of characterized waste. The characterization was carried out in an outdoor location, in a hygienized space suitable for carrying out the procedures. The volunteers involved in the characterization process used personal protective equipment (PPE) to mitigate physical, chemical and biological risks.
Figure 4.
Gravimetric Characterization on 04/11/2021.
2.3. Materials
Pre-Treatment of the Organic Matter
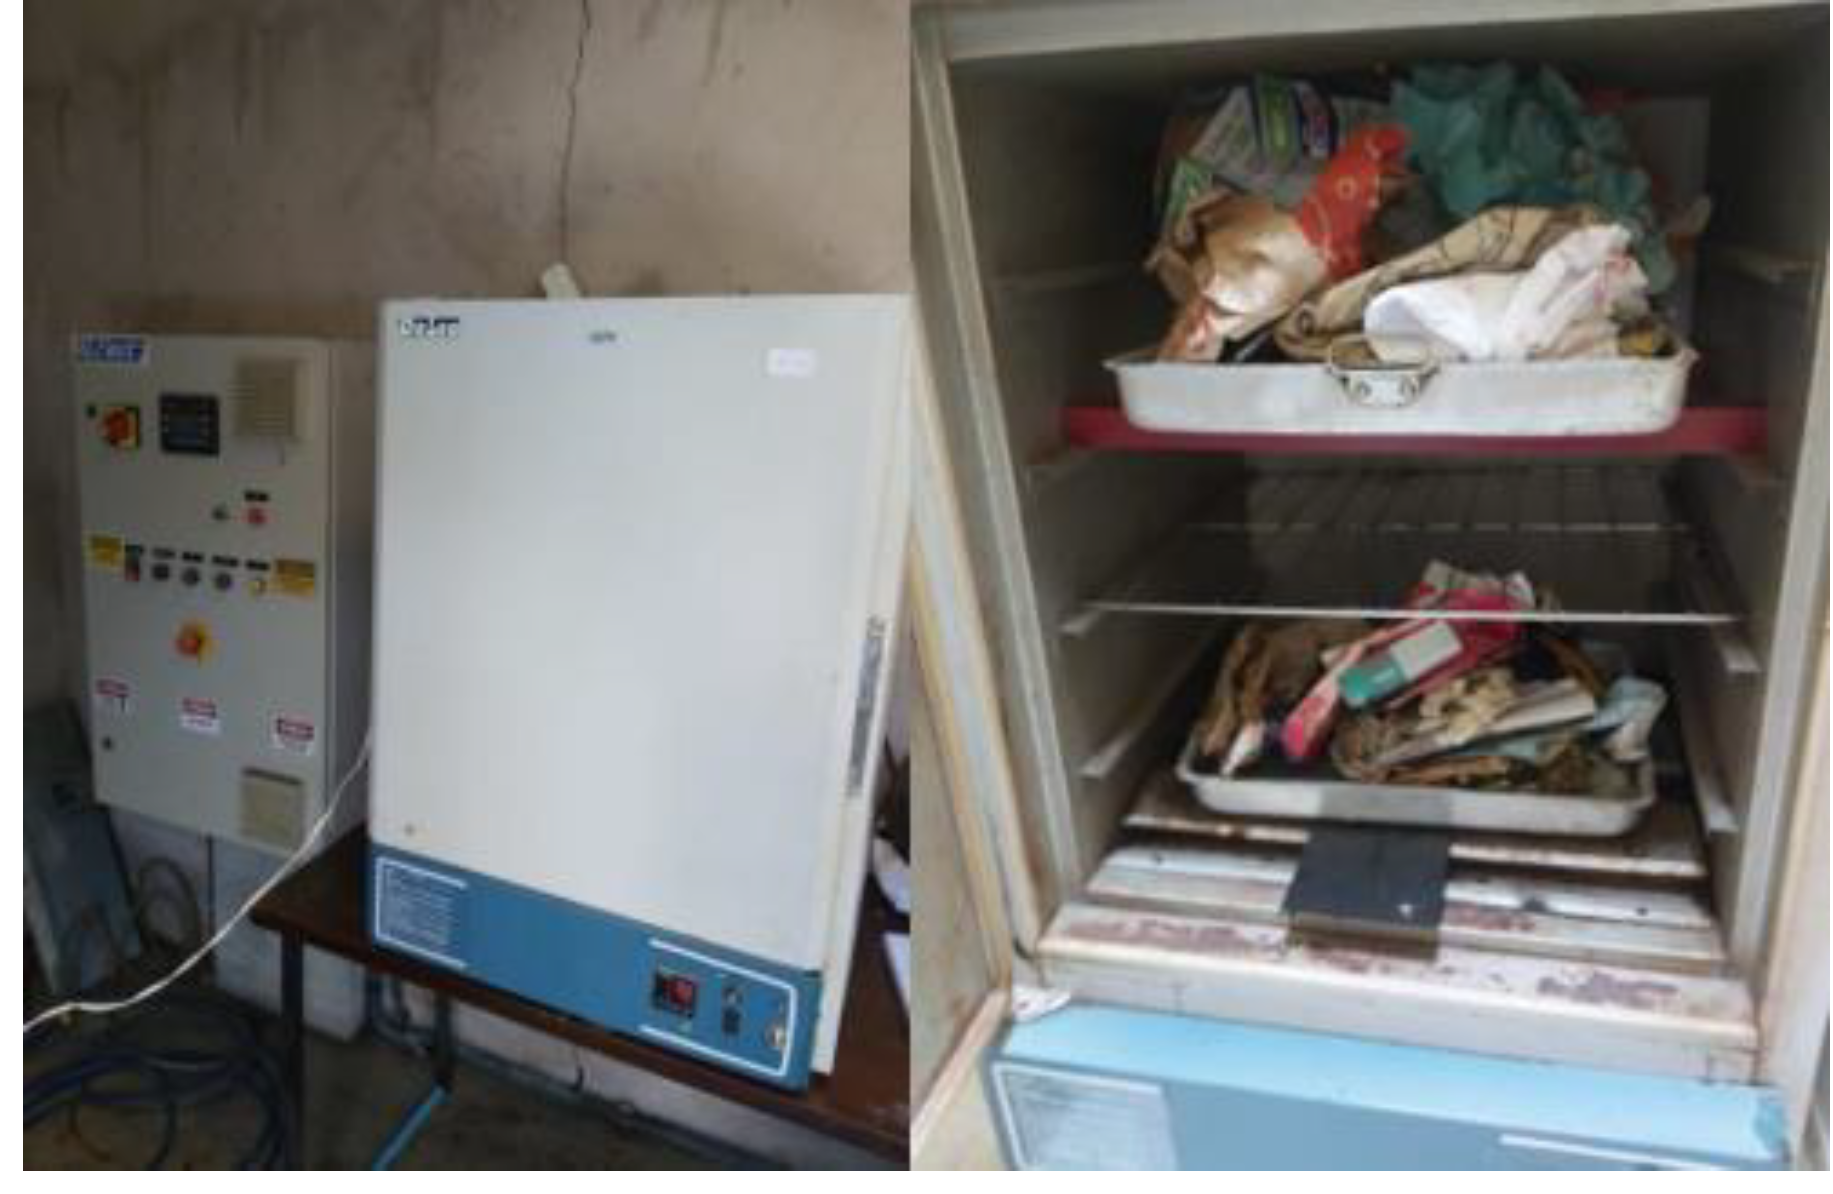
The organic matter, a mixture of carbohydrates, lipids, proteins, and fibers, selected from municipal household solid waste (MHSW), was submitted to pre-treatment (drying, crushing, sieving) and conditionate in a freezer to avoid physicochemical and microbiologic degradation. The material was dried using a thermal oven with air recirculation and analogous temperature control.
Figure 5.
Drying of the organic matter with a thermal.
After drying, the material proceeds to the crushing process, aiming to increase the surface area and reduce dimensions. Grinding is important for the next processes to be carried out with the residues since, in the case of laboratory scale processes, a small amount of material, of low granulometry, is required. In order to further reduce the size of the particles, to facilitate laboratory processes, the residue was subjected to the sieving process. Sifting was carried out immediately after comminution, to proceed with subsequent packaging. The sieves used were 6 and 9 mesh opening.
2.4. Experimental Procedures
2.4.1. Obtaining the Solubilized Extract of Organic Solid Waste
The preparation of the solubilized extract was carried out as recommended by NBR 10.006/04. Sample preparation was carried out at the Laboratory of Pilot Installations for Water and Sludge Treatability (FUPA). Sufficient samples were prepared for all the analyzes foreseen in this work. The complete collection material carried out in all sectors was homogenized, considering the grouping of sectors into regions.
Figure 6.
Procedure for obtaining the solubilized extract.
2.4.2. Physicochemical Analysis
After the sample preparation procedures for extracting the solubilized extract, determined in NBR 10,006/04, the standard determines that this extract must be analyzed according to the methodologies described in the Standard Methods for the Examination of Water and Wastewater (SMWW) [38] and having as parameters the current potability standards, in the case of Brazil, Ordinance GM/MS no. 888/2021. In addition to the potability ordinance, CONAMA Resolution No. 357/2005 was also considered, which classifies water bodies and provides guidelines for the classification of water bodies. The analyzes were carried out at the facilities of the Federal University of Pará.
Table 4.
Physical-chemical parameters analyzed in the solubilized extract.
| Parameter | Method | Parameter | Method |
|---|---|---|---|
| Hydrogenionic Potential | SMWW-4500H+ | Organic Nitrogen | SMWW-4500-Norg |
| Turbidity | SMWW-2130 | Ammoniacal nitrogen | SMWW-4500-NH3 |
| Apparent Color | SMWW-2120 B | Nitrite | SMWW-4500-NO2 |
| True Color | SMWW-2120 B | Nitrate | SMWW-4500-NO3 |
| Electric Conductivity | SMWW-2510 | Total Phosphorus | SMWW-4500-P |
| Total Dissolved Solids | SMWW-2540 C | Reactive Phosphorus | SMWW-4500-P |
| Total Alkalinity | SMWW-2320 | Hydrolysable Phosphorus | SMWW-4500-P |
| Free CO2 | SMWW-CO2 | Condensable Phosphorus | SMWW-4500-P |
| Chloride | SMWW-4500-Cl- | Organic Phosphorus | SMWW-4500-P |
| Cyanide | SMWW-4500-CN- | Total Hardness | SMWW-2340 |
| Fluoride | SMWW-4500-F- | Magnesic Hardness | SMWW-2340 |
| Sulfide | SMWW-4500-S2- | Calcium Hardness | SMWW-2340 |
| Sulfate | SMWW-4500-SO42- | Total COD | SMWW-5520 |
| Total Nitrogen | SMWW-4500-N | COD Filtered | SMWW-5520 |
| Total N. Kheldahl | SMWW-4500-N | - | - |
For the treatment of data, comparisons were made with bibliographic research carried out, the presentation of data in a table, with relevant information and presentation in graphs and other tools that allow a better understanding of the information raised throughout the research carried out.
3. Results
3.1. Gravimetric Characterization of MHSW
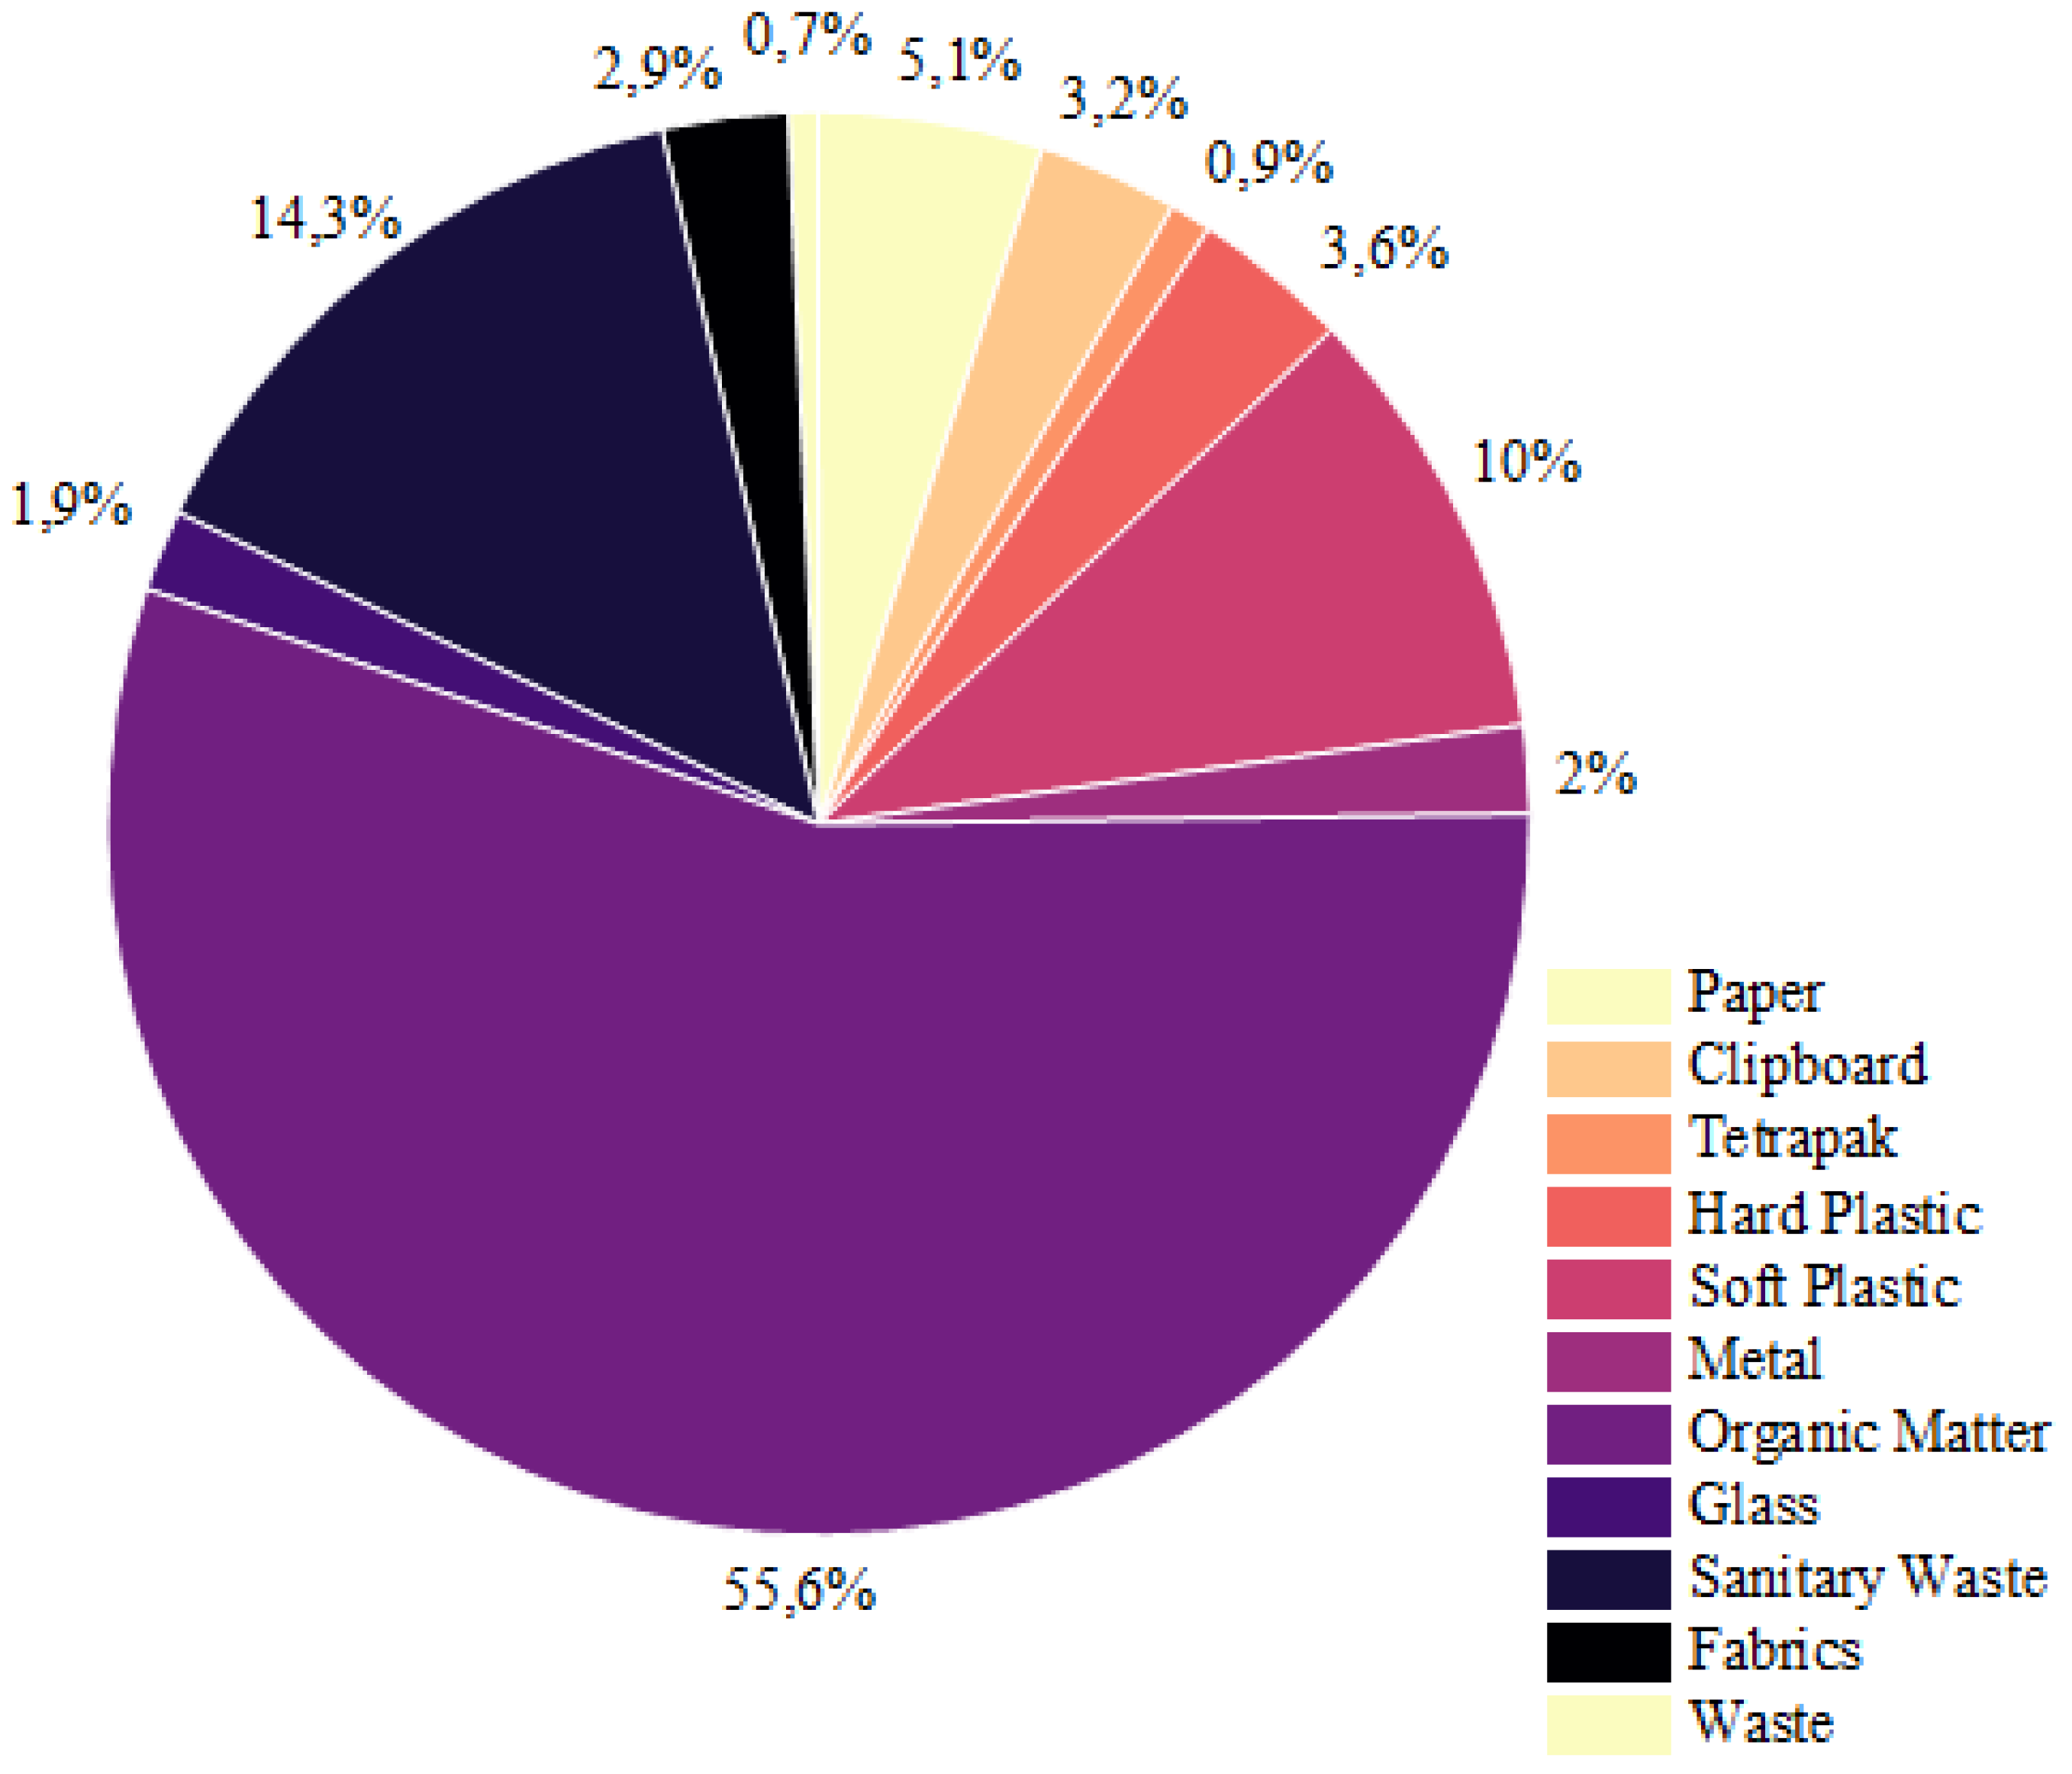
The Table 5 shows the results of gravimetric analysis of MSHW in municipality of Belém in the period from 04/11/2021 to 13/05/2022, according to ABNT NBR 10.007/2004. In addition, Table 6 shows the shows the mean, median results, in addition to the standard deviation of the analyzed values. Both tables shows the proportions of materials of percentage of MHSW fractions (paper, cardboard, tetrapak, rigid plastic, malleable plastic, metals, glass, organic matter, sanitary waste, fabrics and others wastes). By performing the analysis of Table 6, it is possible to verify the heterogeneity between the MHSW fractions in different sectors and, consequently, in different regions. Analyzing the values, in percentage, of the mass of residues, it is noticed that the percentage values of the fraction of organic matter are higher, in relation to the other proportions, as verified in gravimetric characterizations previously carried out in the locality [39,40,41,42] , the values of organic matter mass (%) vary between 49.45% and 61.12%, with mean values of 55.57%, median of 54.55% and a standard deviation of 3.62% between the values collected in the sectors. Still, between the maximum and minimum values, it is possible to observe a variance of 13.09%.
After raising the values, it is possible to analyze that the values of organic matter represent more than 50% of the total values of the fraction of solid waste, followed by the fraction of sanitary waste (14.30%) and malleable plastic (10%). These first three representing almost 80% of the total mass of collected waste.
Figure 7.
Proportions of waste fractions collected in the municipality of Belém.
3.2. Analysis of the Solubilized Extraction of the Organic Fraction of MHSW
3.2.1. Analysis of Physical-Chemical Parameters
After the period of conditioning the residues and the generation of the solubilized extract of the organic fraction of the solid residues, these were submitted to physicochemical analyses, in which pH values between 3.69 and 4.77 were verified, making it possible to verify an acidic character of the residues. obtained values, in addition to high values of total dissolved solids, of alkalinity (except for the values of Region 1). The Cyanide and Fluoride values found were below what could be measured with the equipment used. Sulphide values between 420 and 100 µg.L-1 and sulfate with maximum values of 24 mg.L-1 were verified.
Table 7.
Hydrogenionic Potential (pH), Electric Conductivity (EC), Total Dissolved Solids (TDS), Total Alcalinity (TA), Carbon Dioxide (CO2), Chloride, Cyanidre, Fluoride, Sullphite and Sulfate. QL represents values below the limit of quantification.
Table 7.
Hydrogenionic Potential (pH), Electric Conductivity (EC), Total Dissolved Solids (TDS), Total Alcalinity (TA), Carbon Dioxide (CO2), Chloride, Cyanidre, Fluoride, Sullphite and Sulfate. QL represents values below the limit of quantification.
| Region | pH | EC (mS.cm-1) | TDS (mg.L-1) | TA (mg.L-1) | CO2 (mg.L-1) | Chloride (mg.L-1) | Cyanidre(mg.L-1) | Fluoride (mg.L-1) | Sulphite (µg.L-1) | Sulphate (mg/L-1) |
|---|---|---|---|---|---|---|---|---|---|---|
| R1 | 3.69 | 10.13 | 5330 | > QL | 18.70 | 223.00 | < 0.005 | < 0.005 | 110 | 25 |
| R2 | 4.77 | 15.67 | 8040 | 2900 | 10.20 | 349.30 | < 0.005 | < 0.005 | 130 | < 2 |
| R3 | 4.92 | 15.99 | 8030 | 3650 | 12.80 | 230.40 | < 0.005 | < 0.005 | 420 | < 2 |
3.2.2. Turbidity, Color and Hardness Analysis
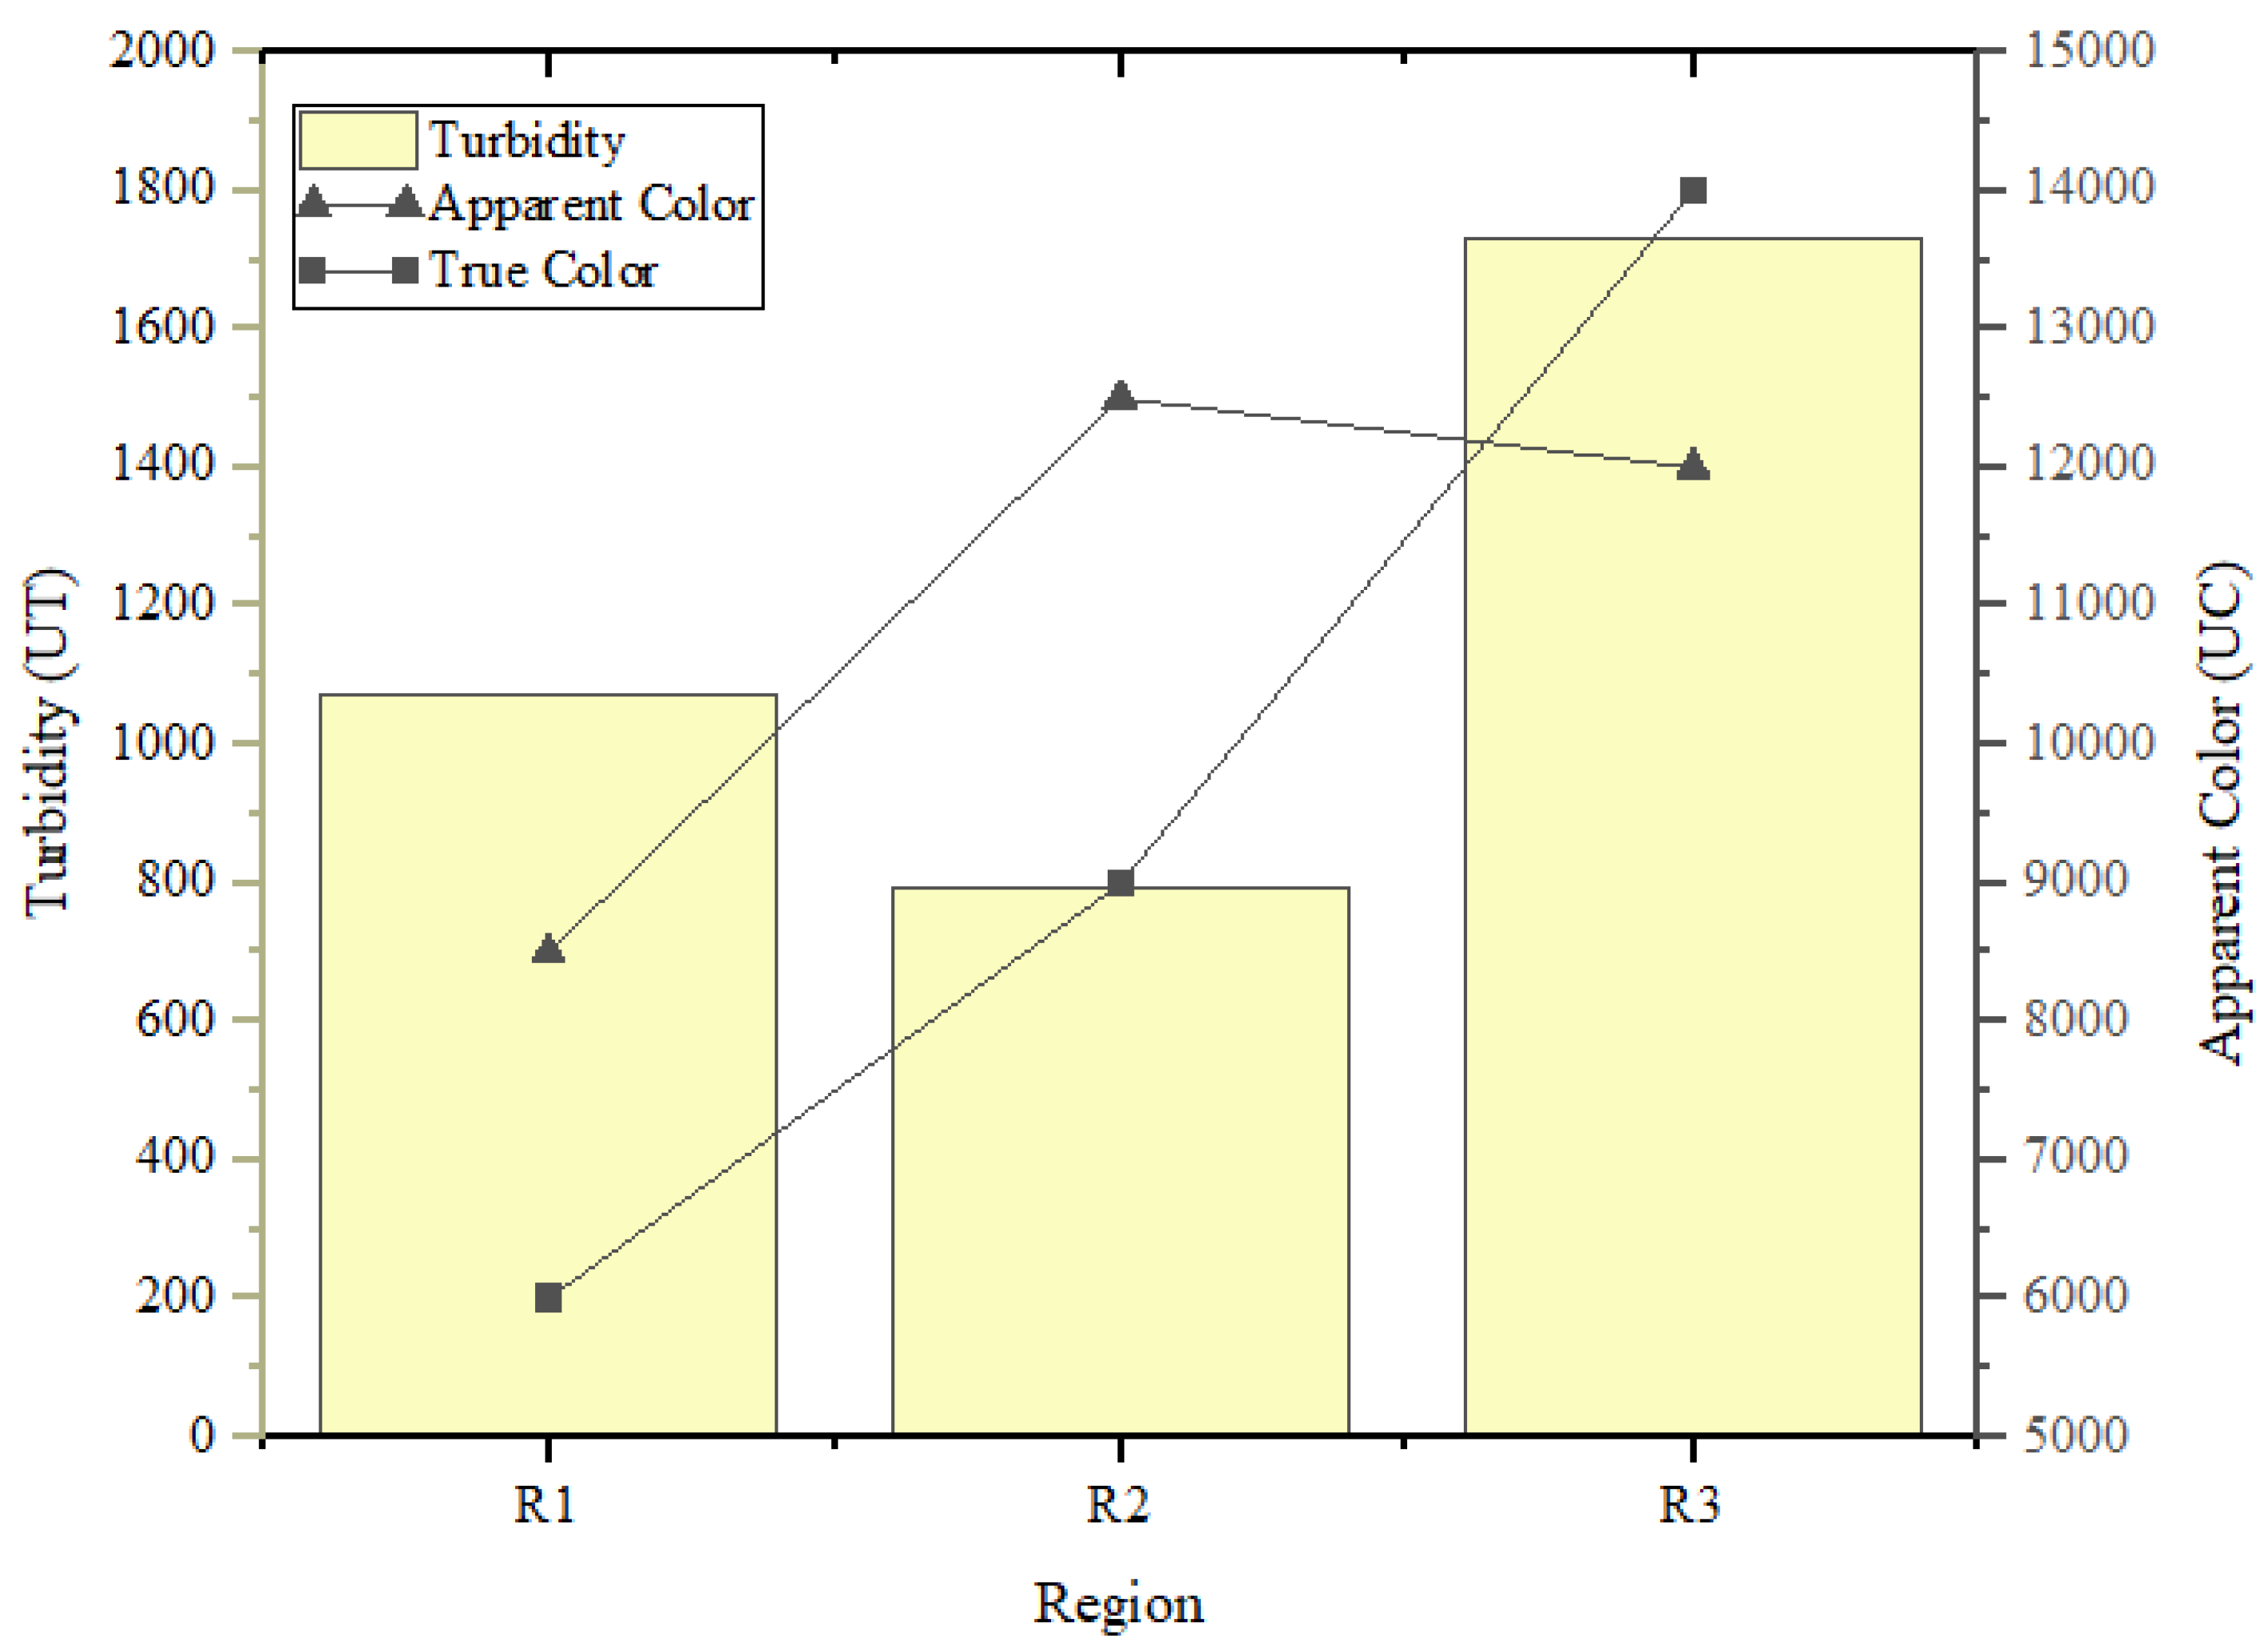
Turbidity, Color and Hardness values were analyzed based on the instructions in the Standard Methods For The Examination Of Water and Wastewater [38] and it was possible to find Turbidity values between 791 and 1,733 TU (Turbidity Unit), in addition to values of apparent color between 8,500 and 12,500 CU (Color Unit) and from 6,000 to 14,000 CU. Additionally, in this topic Hardness values were also considered and results were verified in the order of 234 to 371 mg.L-1 for Total Hardness, maximum values of 207 mg.L-1 for Calcium Hardness and values between 164 and 235 mg.L-1 for Magnesian Hardness. The analyzed values can be seen in Table 8.
It is possible to verify that the fraction of organic residues from Region 2 present the lowest values of turbidity, while in the values of the solubilized extract of residues collected in Region 3, the highest values of color and turbidity are verified, which indicates greater concentrations of total solids and dissolved solids.
Figure 8.
Comparison between the color and turbidity values of the solubilized extract obtained in relation to the regions delimited in the methodology.
Figure 8.
Comparison between the color and turbidity values of the solubilized extract obtained in relation to the regions delimited in the methodology.
3.2.3. Nitrogen Series Analysis
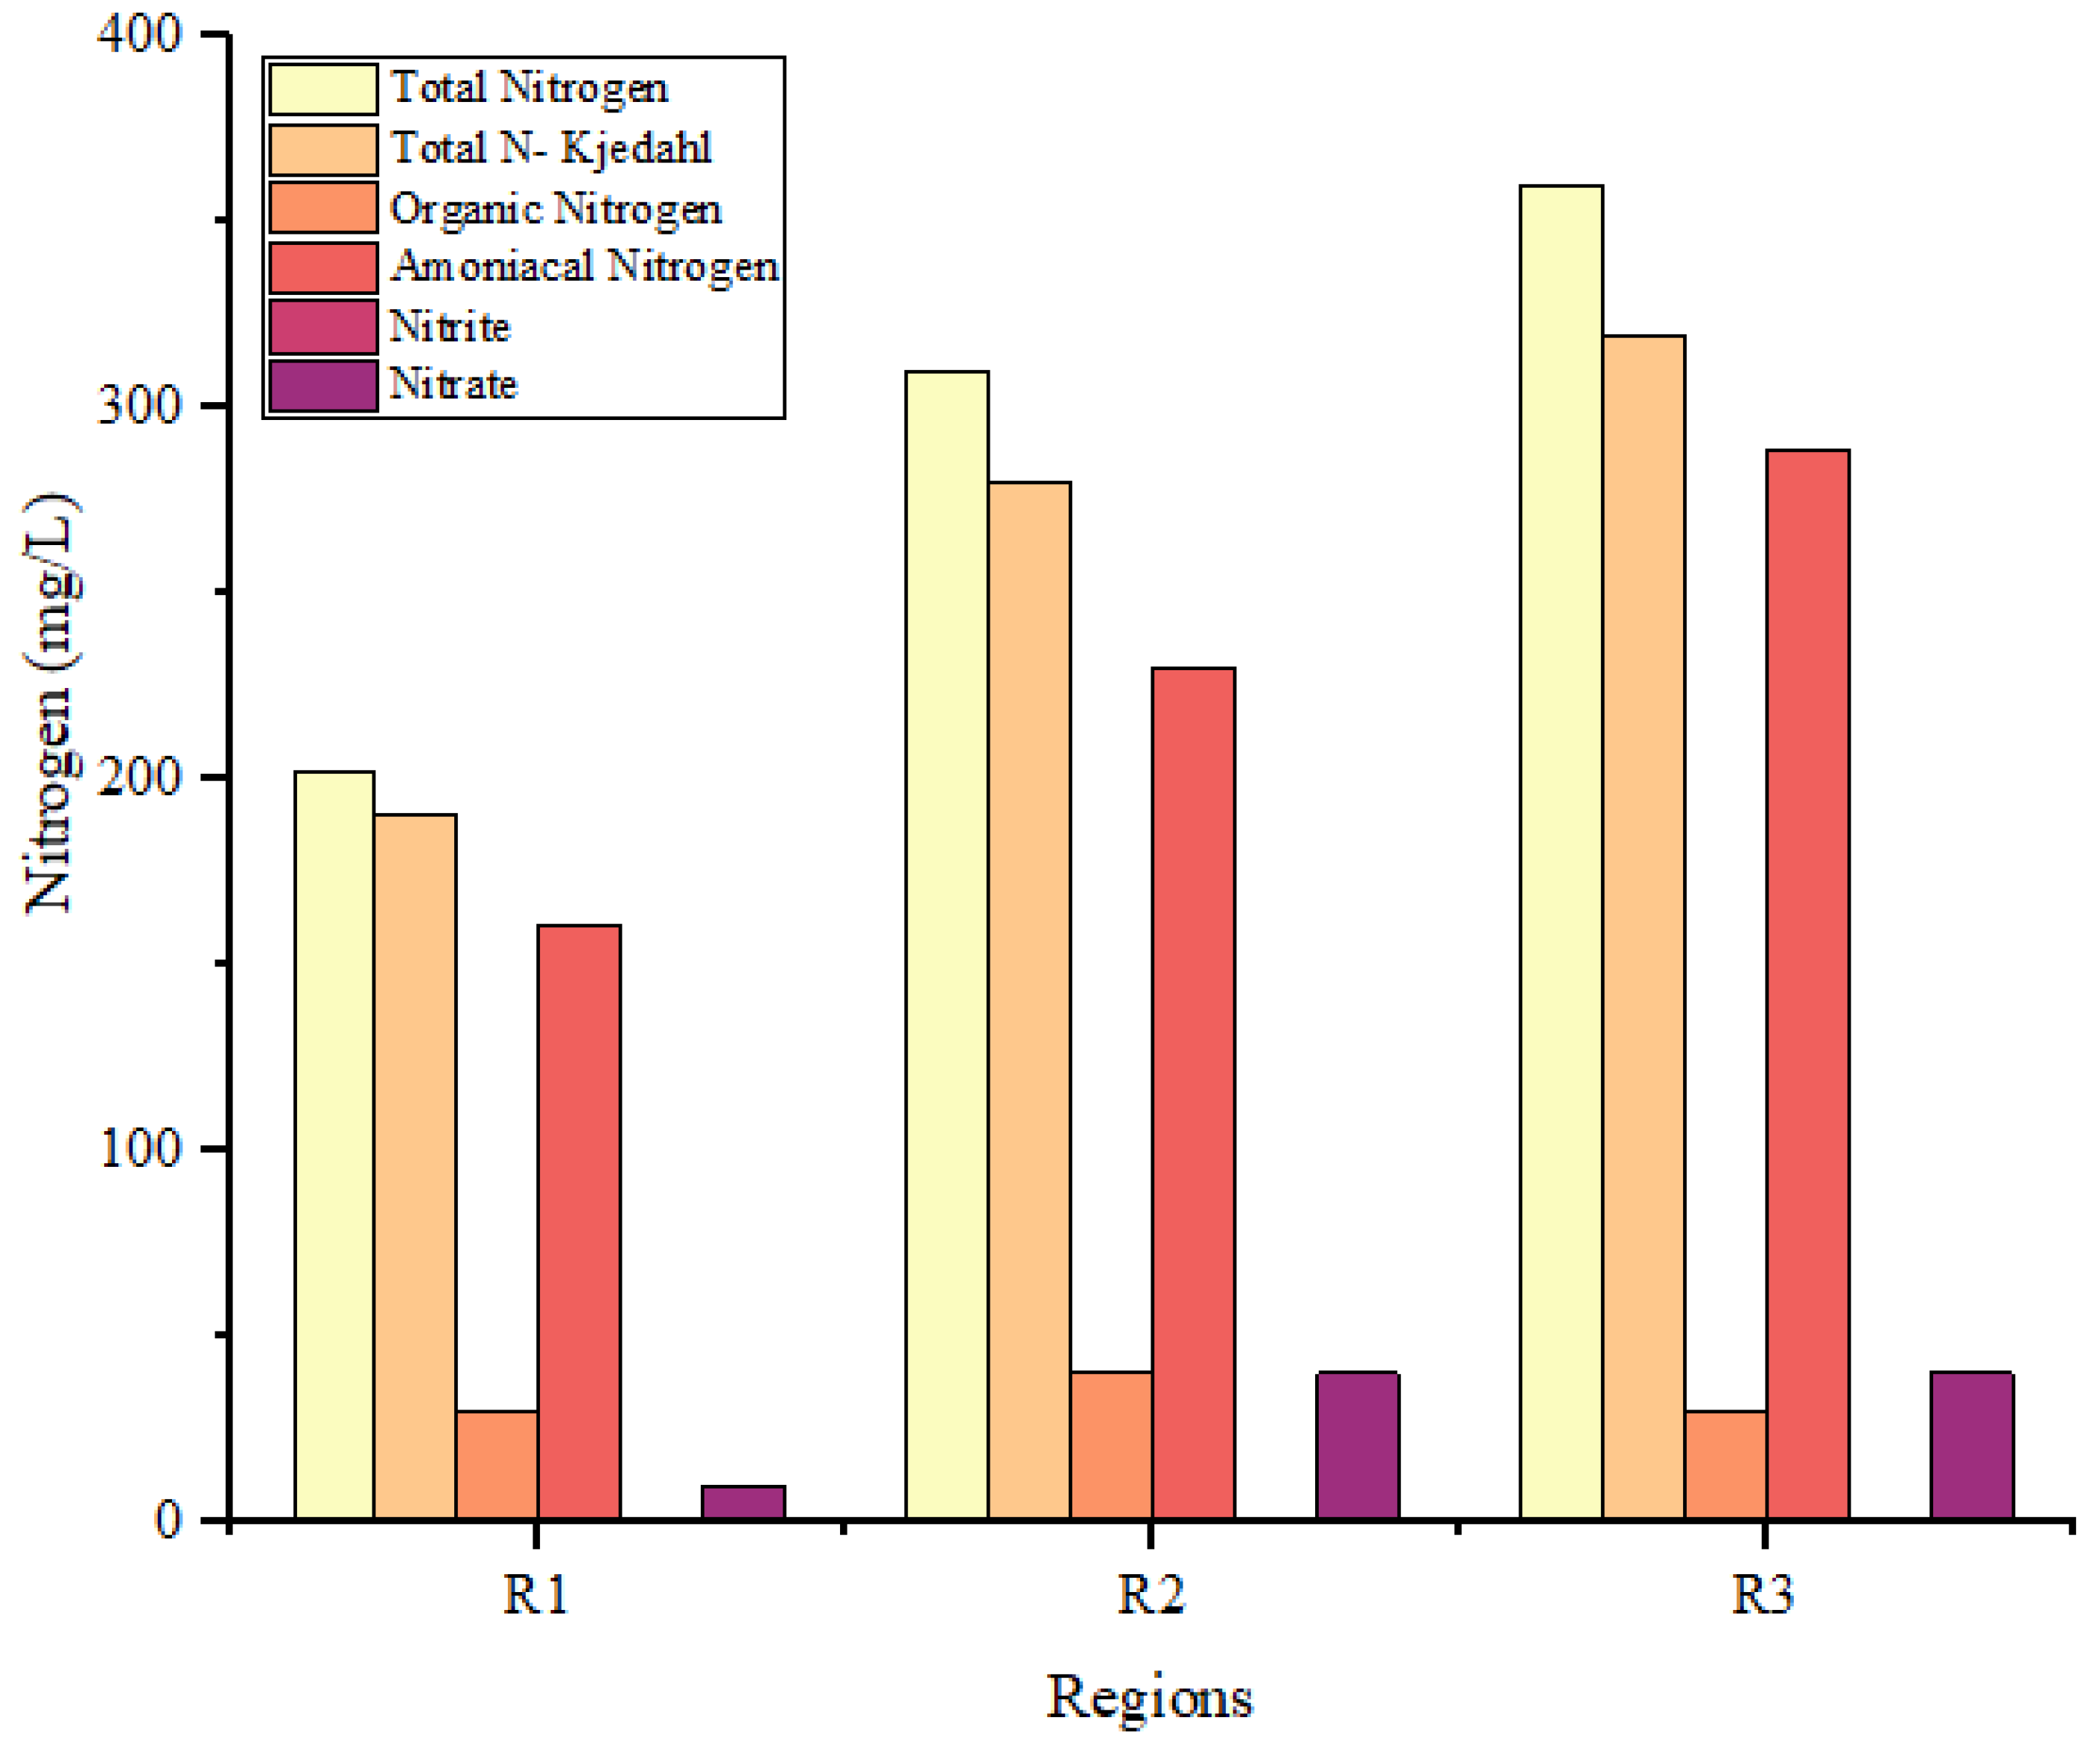
The values of the nitrogen series were verified using the instructions in the Standard Methods For The Examination of Water and Wastewater [38], in which it was possible to verify Total Nitrogen values in the range between 201.80 and 359.90 mg.L-1, of Nitrogen Total Kjeldahl in the range between 191 and 319 mg.L-1. Still, it was possible to analyze values in the order between 30 and 40 mg.L-1 for Organic Nitrogen and between 161 and 289 mg.L-1 for Ammoniacal Nitrogen. Among nitrogenous ions, values between 0.30 and 0.90 mg.L-1 were found for Nitrite and between 10 and 40 mg.L-1 for Nitrate.
Table 8.
Total Nitrogen, Total Nitrogen Kjeldahl, Organic Nitrogen, Amoniacal Nitrogen, Nitrite and Nitrate values obtained in laboratory analyses.
Table 8.
Total Nitrogen, Total Nitrogen Kjeldahl, Organic Nitrogen, Amoniacal Nitrogen, Nitrite and Nitrate values obtained in laboratory analyses.
| Region | Total Nitrogen (mg.L-1) | Total Nitrogen Kjeldahl (mg.L-1) | Organic Nitrogen (mg.L-1) | Amoniacal Nitrogen (mg.L-1) | Nitrite (mg.L-1) | Nitrate (mg.L-1) |
|---|---|---|---|---|---|---|
| R1 | 201.80 | 191.00 | 30.00 | 161.00 | 0.80 | 10.00 |
| R2 | 310.30 | 270.00 | 40.00 | 230.00 | 0.30 | 40.00 |
| R3 | 359.90 | 319.00 | 30.00 | 289.00 | 0.90 | 40.00 |
It is possible to verify higher values of Total Nitrogen, Total Kjedahl Nitrogen and Ammoniacal Nitrogen in the solubilized extract obtained for solid organic waste generated in Region 3. The values of Organic Nitrogen were higher in the analysis of the solubilized extract generated in Region 2. The values of Ni-trite and Nitrate were close for all regions, which indicates that a large portion of Total Nitrogen originates from organic and ammoniacal compounds.
Figure 9.
Concentration of the analyzed nitrogen series parameters for the delimited regions, according to the research methodology.
Figure 9.
Concentration of the analyzed nitrogen series parameters for the delimited regions, according to the research methodology.
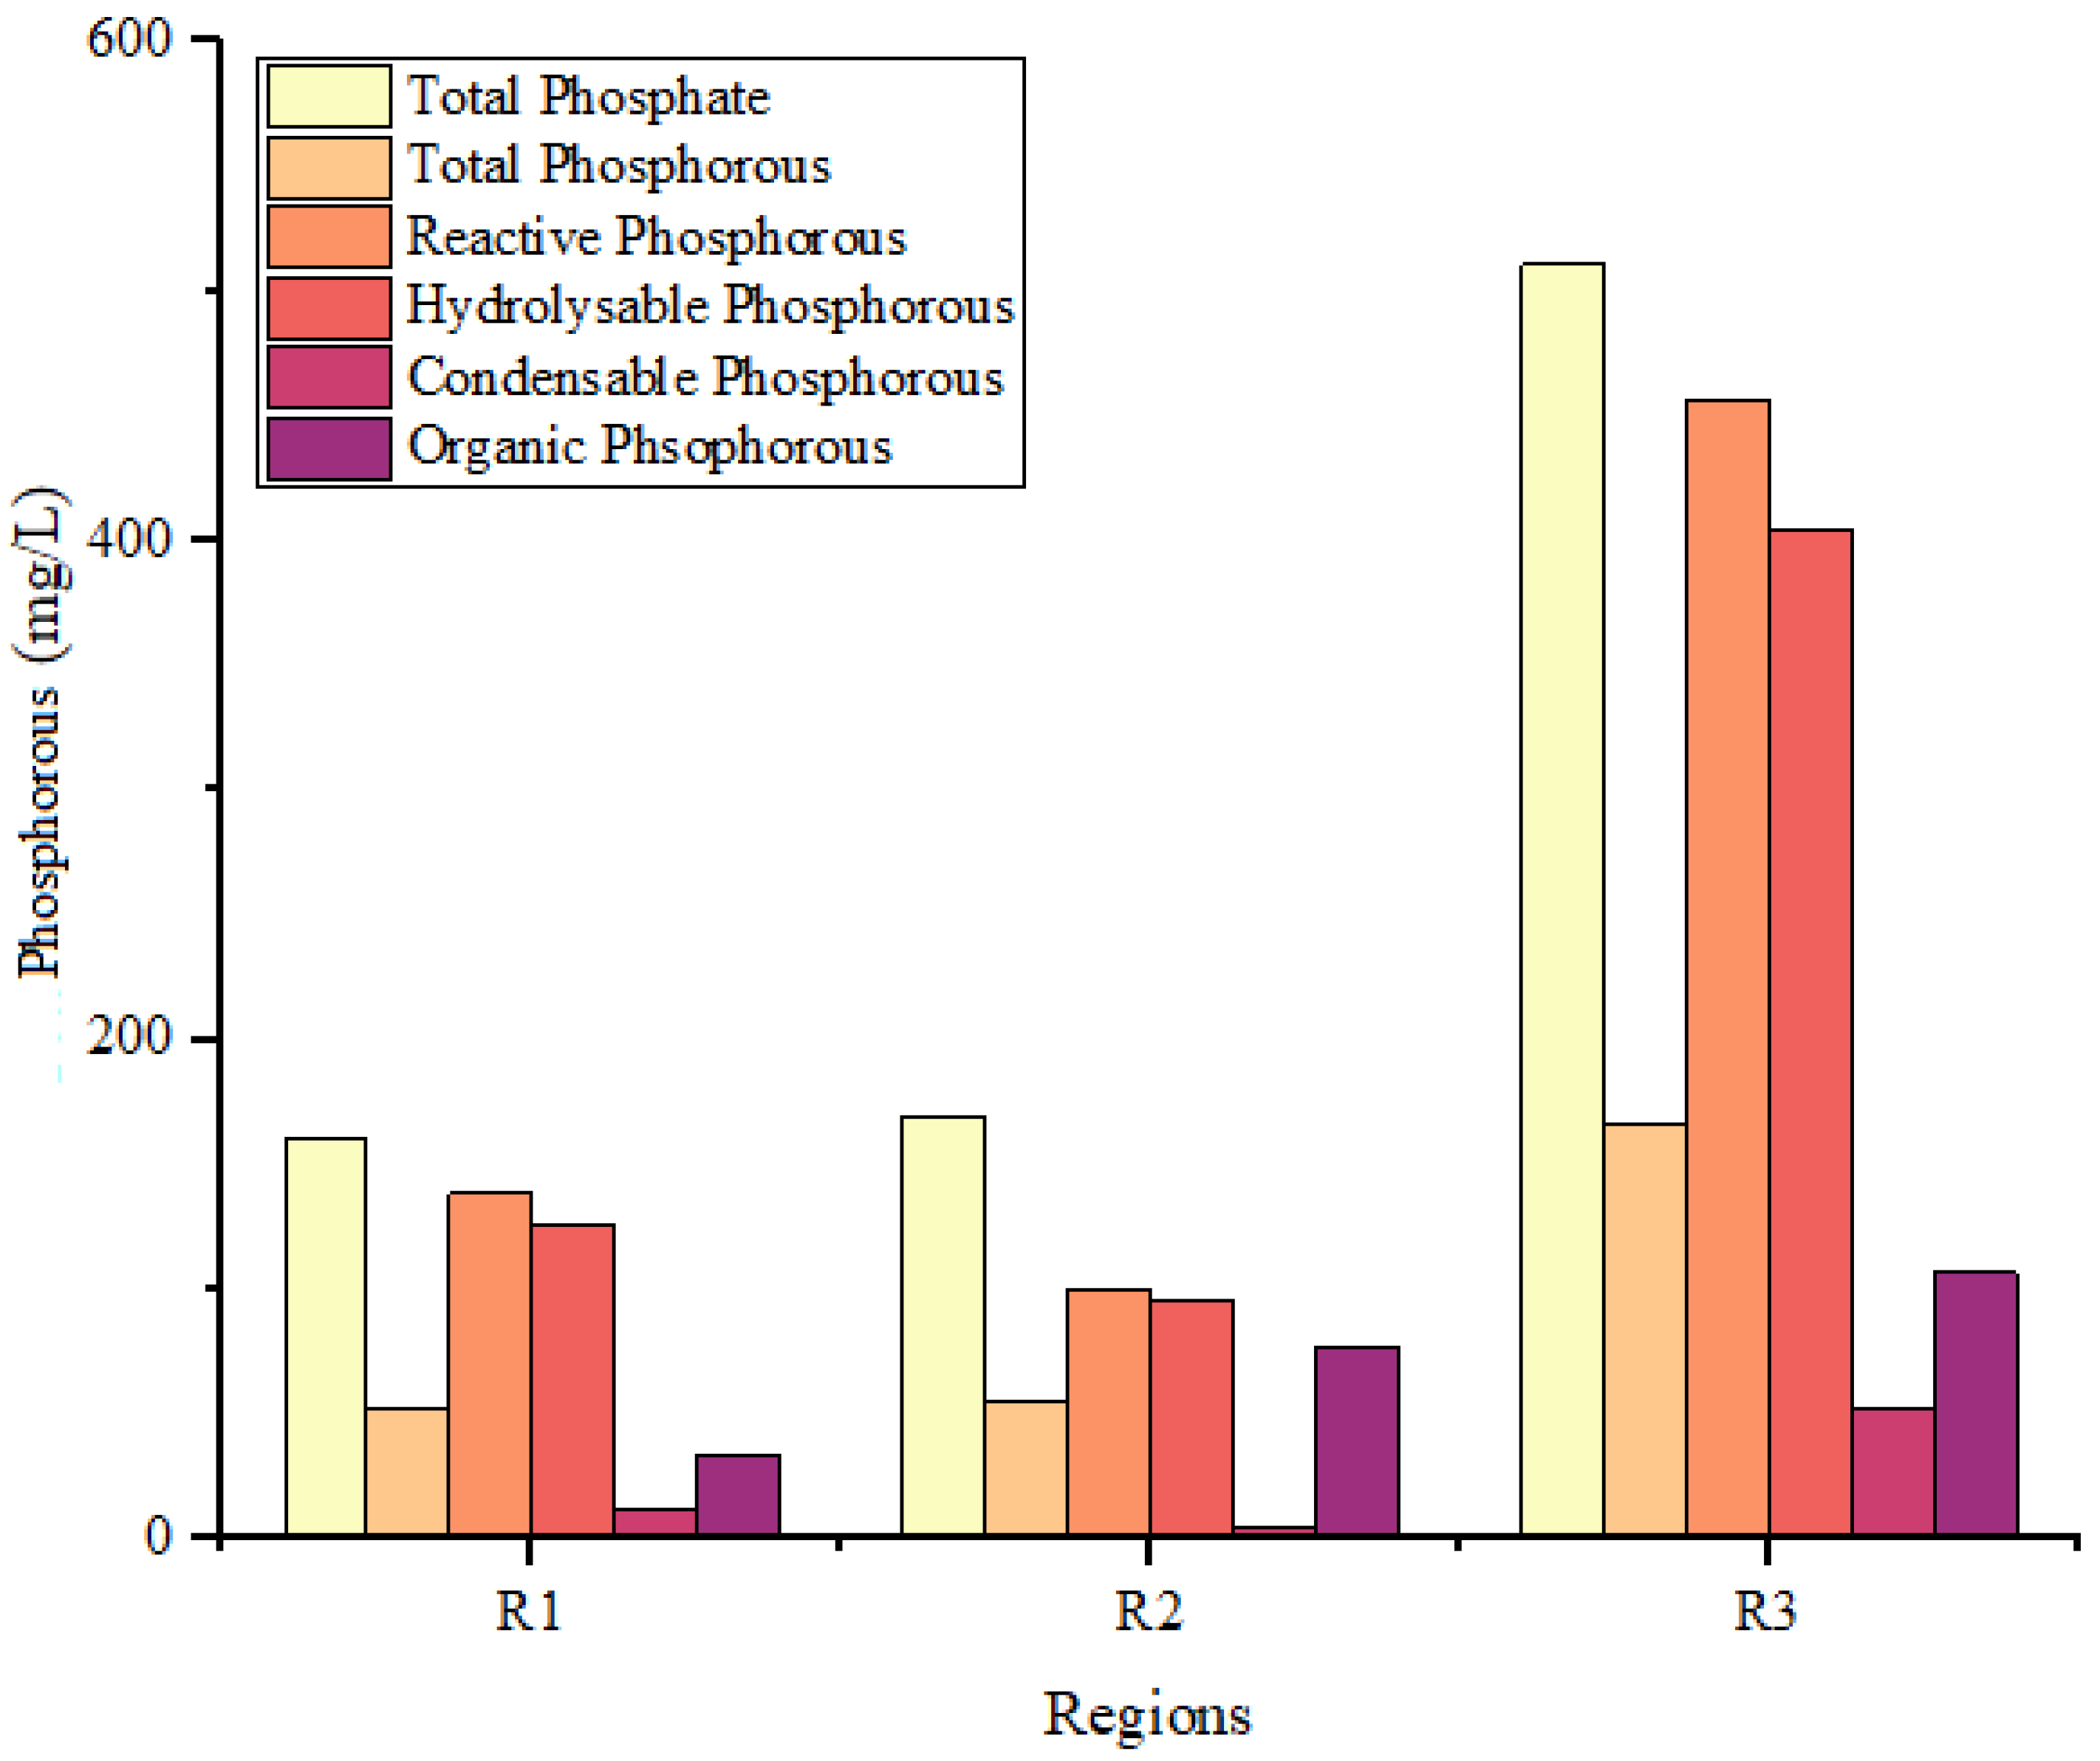
3.2.4. Phosphorus Series Analysis
Phosphorus values were analyzed through Total Phosphorus concentrations and as a function of Phosphate ion. For the Phosphorus series, values between 52.30 and 166.80 mg.L-1 of Total Phosphorus and 160.80 to 510.40 mg.L-1 of Total Phosphate were found. As for Reactive Phosphorus values, values between 100 and 456 mg.L-1 were verified and for Hydrolyzable Phosphate values, values were found in the range between 96 and 404 mg.L-1. As for the Condensable and Organic Phosphate fractions, values were found in the range of 4 to 52 mg.L-1 and 34 and 106.40 mg.L-1, respectively.
Table 9.
Total Phosphorous, Total Phosphate, Reactive Phosphate, Hydrolysable Phosphate, Condensable Phosphate and Organic Phosphate values obtained in laboratory analyses.
Table 9.
Total Phosphorous, Total Phosphate, Reactive Phosphate, Hydrolysable Phosphate, Condensable Phosphate and Organic Phosphate values obtained in laboratory analyses.
| Region | Total Phosphorous (mg.L-1) | Total Phosphate (mg.L-1) | Reactive Phosphate (mg.L-1) | Hydrolysable phosphate (mg.L-1) | Condensable Phosphate (mg.L-1) | Organic phosphate (mg.L-1) |
|---|---|---|---|---|---|---|
| R1 | 52.30 | 160.80 | 138.00 | 126.00 | 12.00 | 34.00 |
| R2 | 55.30 | 169.36 | 100.00 | 96.00 | 4.00 | 73.36 |
| R3 | 166.80 | 510.40 | 456.00 | 404.00 | 52.00 | 106.40 |
In the analysis of Phosphorus and Phosphate concentrations, higher values are found for all compounds in the solubilized extract analyzed in Region 3, where values are up to three times higher than those in other regions. For Regions 1 and 2, the concentrations of Total Phosphorus, Total Phosphate, Reactive Phosphate and Hydrolysable Phosphate present similar values.
Figure 10.
Concentration of the analyzed phosphorous series parameters for the delimited regions, according to the research methodology.
Figure 10.
Concentration of the analyzed phosphorous series parameters for the delimited regions, according to the research methodology.
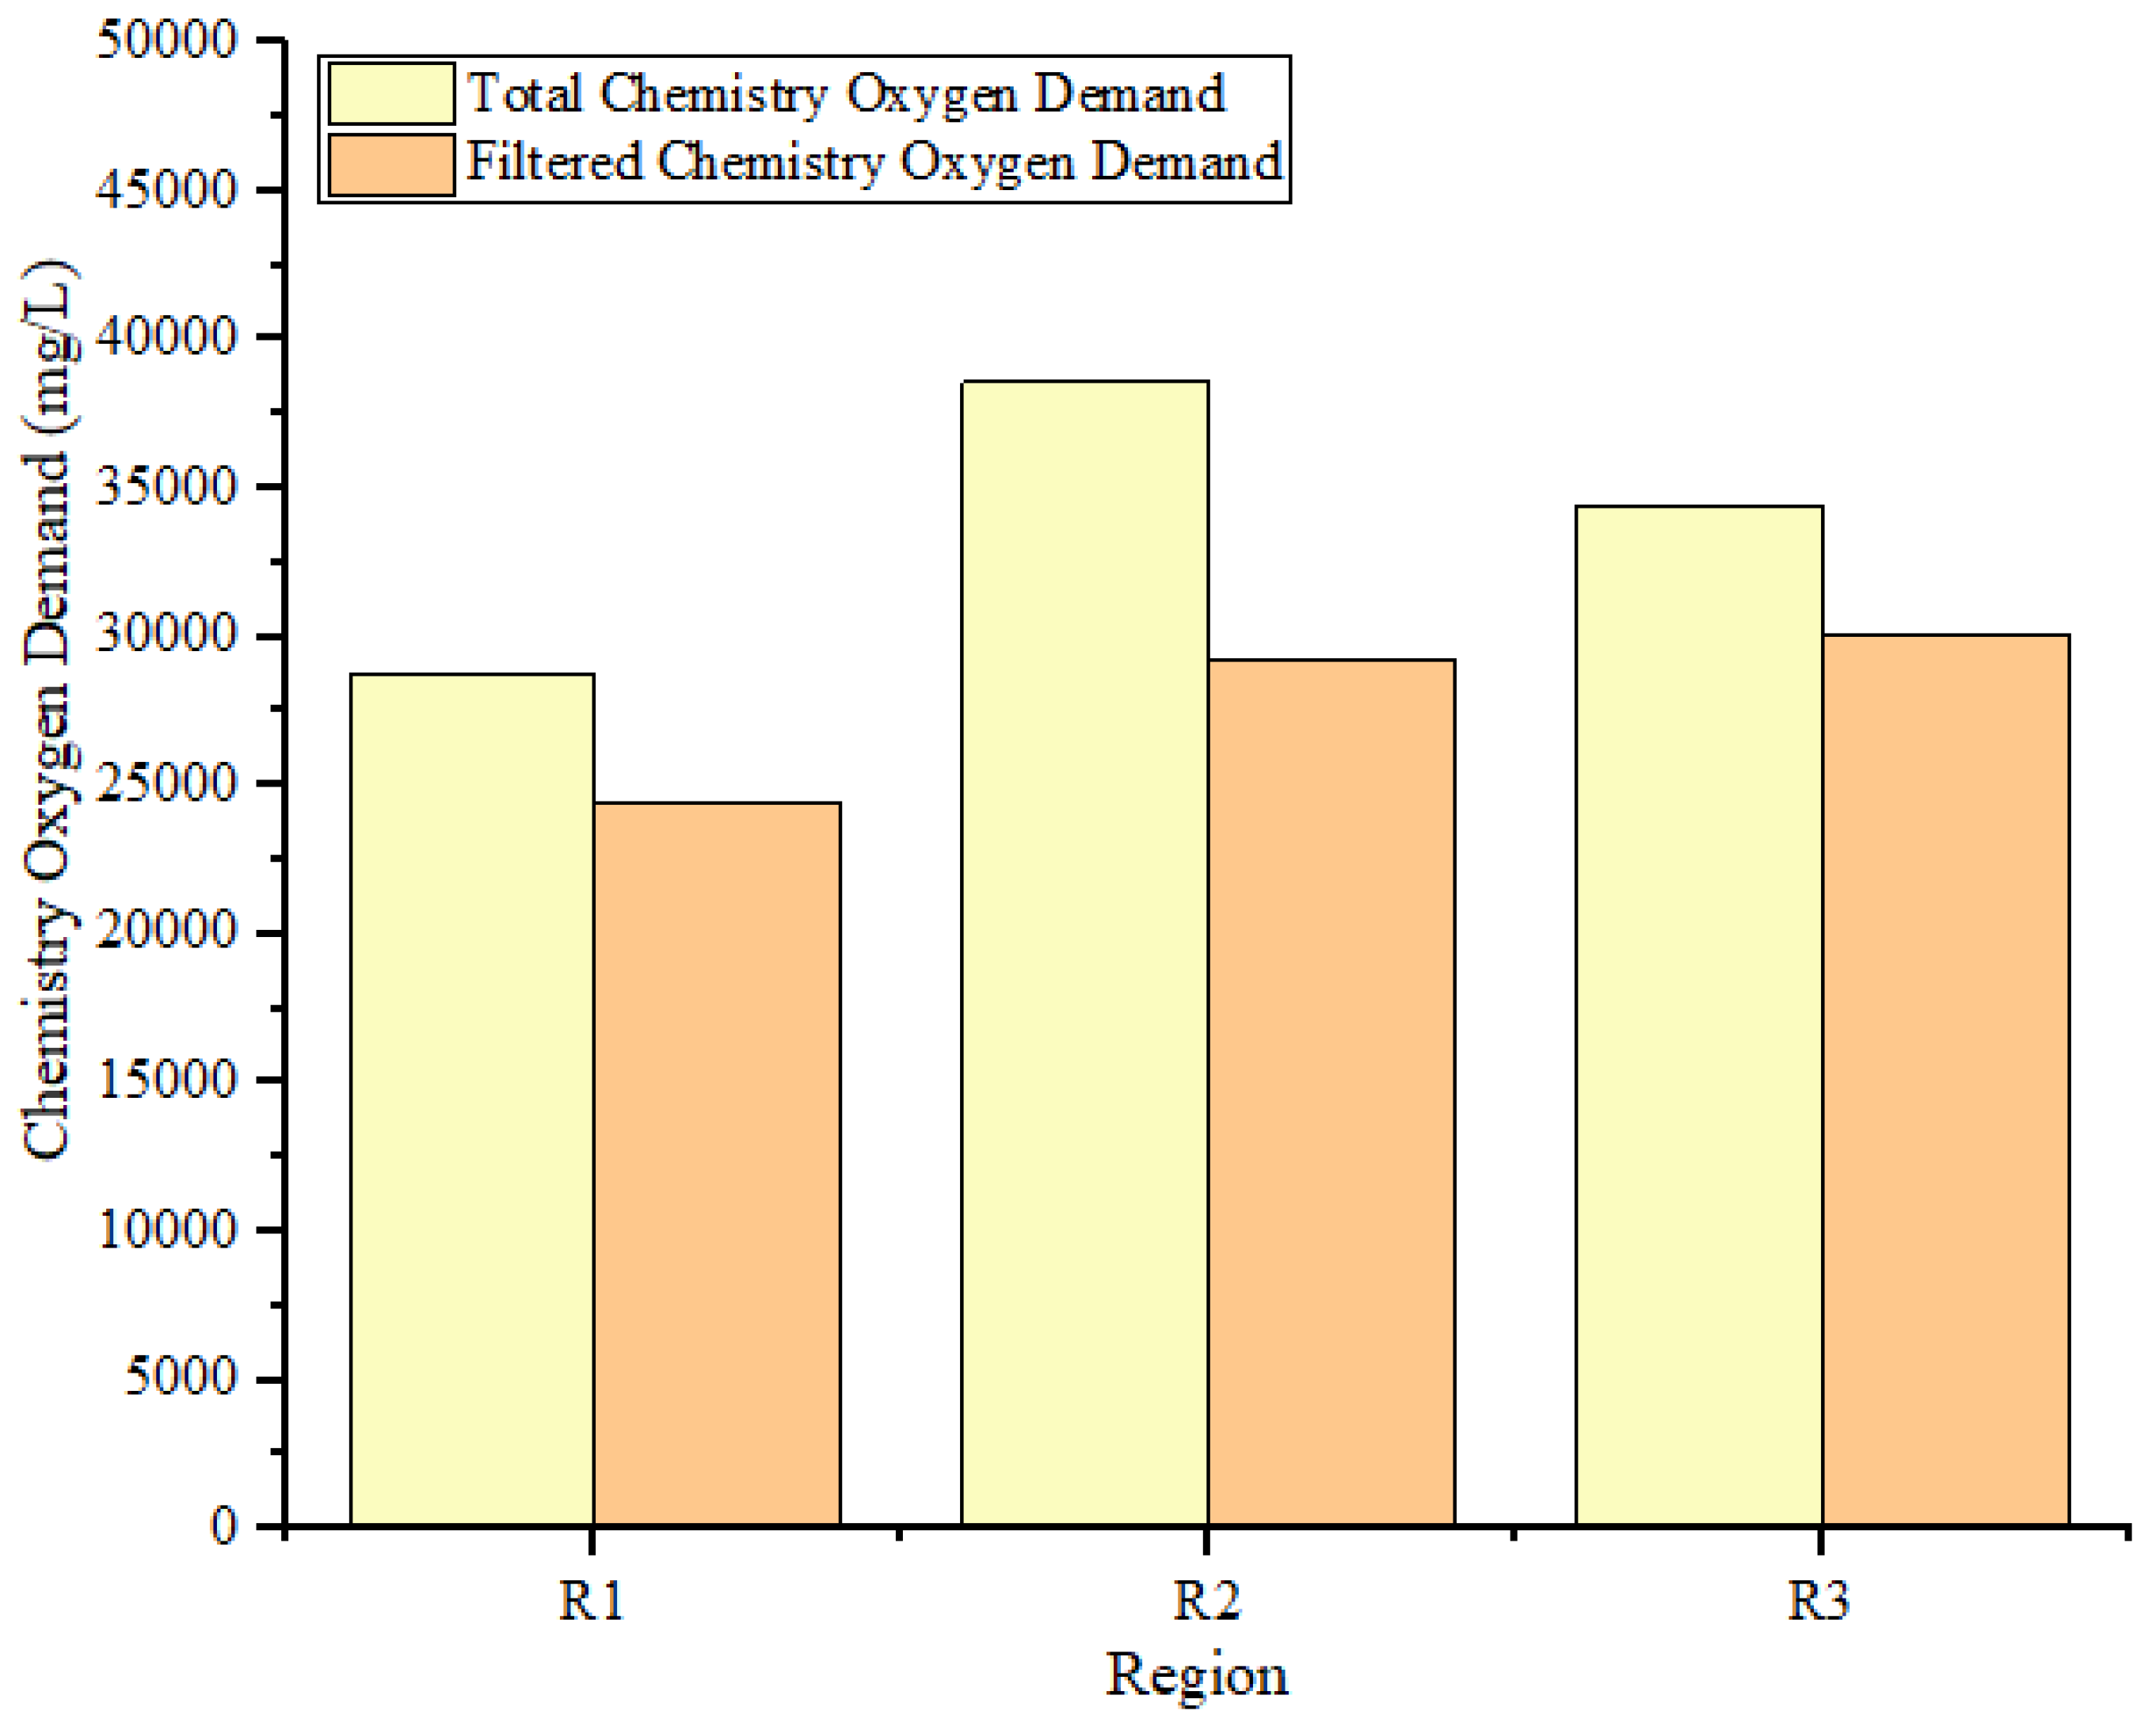
3.2.5. Organic Matter Analysis
To carry out the analyzes of organic matter, the parameter of Chemical Oxygen Demand was used, since due to the material conditioning process, it was not possible to carry out the analysis of Biochemical Oxygen Demand within the defined by ABNT NBR 10.007 /2004, after the physical-chemical analyzes carried out in the laboratory, values in the order of 28,701 mg.L-1 to 38,608 mg.L-1 of Total Chemical Oxygen Demand and 24,469 to 30,078 mg.L-1 for Filtered Chemical Oxygen Demand, as shown in Table 10.
Table 10.
Total Chemical Oxygen Demand and Filtered Chemical Oxygen Demand values obtained in laboratory analyses.
Table 10.
Total Chemical Oxygen Demand and Filtered Chemical Oxygen Demand values obtained in laboratory analyses.
| Region | Total Chemical Oxygen Demand (mg.L-1) | Filtered Chemical Oxygen Demand (mg.L-1) |
|---|---|---|
| R1 | 28,701.00 | 24,469.00 |
| R2 | 38,608.00 | 29,260.00 |
| R3 | 34,428.00 | 30,078.00 |
After the results of the analyses, high values of Chemical Oxygen Demand are verified in the solubilized extracts from all regions, since the residue comes from organic matter, high values of related parameters are expected. Both for Total Chemical Oxygen Demand and for Filtered Chemical Oxygen Demand, the highest values are presented in the solubilized extract of Region 2.
Figure 11.
Concentration of the analyzed organic matter parameters for the delimited regions, according to the research methodology
Figure 11.
Concentration of the analyzed organic matter parameters for the delimited regions, according to the research methodology
3.3. Verification of Compliance with the Limit Values of Ordinance MS/GM No. 888/2021 and Resolution of the National Council for the Environment No. 357/2005
ABNT NBR 10.004/2004 mentions that the results of physical-chemical analyzes of solubilized extracts of solid waste must be compared with reference values present in potability ordinances, mainly and other environmental norms. Such verification was carried out, together with Resolution no. 357/2007 of the Brazilian National Council for the Environment, for freshwater bodies of class II.
After the analyses, verifications of compliance with Brazilian health and environmental legislation confirmed that the parameters Hydrogenionic Potential, Turbidity, True Color, Apparent Color, Total Dissolved Solids, Sulfide, Total Nitrogen, Ammoniacal Nitrogen and Total Phosphorus were not in accordance with the legislation for the solubilized extract of solid organic waste grouped in Region 1. It is possible to observe in Table 11 the verification of conformity, where “no” means that it does not comply with the values and “yes” means that it is according to the limit values in the legislation. There are some parameters that are not mentioned in the legislation, such as Electrical Conductivity, Total Alkalinity, Free Carbon Dioxide, Total Kjeldahl Nitrogen, Organic Nitrogen, Phosphorus Series (exception of Total Phosphorus) and Chemical Demand of oxygen.
For the solubilized extract of waste from region 2, non-compliance with legal standards was verified for the parameters of Hydrogenionic Potential, Turbidity, Apparent Color, True Color, Total Dissolved Solids, Chloride, Sulfide, Total Nitrogen, Ammonia Nitrogen, Nitrate and Total Hardness. In parameters such as Apparent Color, True Color and Total Dissolved Solids, there was a relevant discrepancy with the legal standard values. You can view the verification performed in Table 12.
In the analysis of the solubilized extract of organic residues from region 3, it was possible to verify the non-compliance in the parameters of Hydrogenionic Potential, Turbidity, Apparent Color, True Color, Total Dissolved Solids, Sulfide, Total Nitrogen, Ammoniacal Nitrogen, Nitrate, Total Phosphorus and Hardness. It is possible to visualize the verification of each parameter for this case in Table 13.
3.4. Comparison of Concentration Values Obtained with Literature Values for Solubilized and Leached Compounds
3.4.1. Hidrogenionic Potential
For the Hp values, results below those of most of the consulted authors were verified, in which it was possible to verify proximity with the results of [16]. The Hp of the solubilized extract is considered acidic (below 7), thus presenting acidic characteristics. It is observed in the Figure 12 the comparison between the values of Hp raised in this research and the values of the authors in which their studies were consulted.
3.4.2. Total Dissolved Solids
Regarding the solids content, the values of Total Dissolved Solids (TDS) were and were observed high values, for Regions 2 and 3, being 8,040 and 8,030 mg.L-1, respectively (Figure 13). The results of the physical-chemical analyzes for obtaining solids demonstrate the proximity with the research carried out by [18] for region 1 (6,035 mg.L-1) and for regions 2 and 3, the results are closest to the values obtained by [15], with solid concentrations in the order of 6,903 mg.L-1.
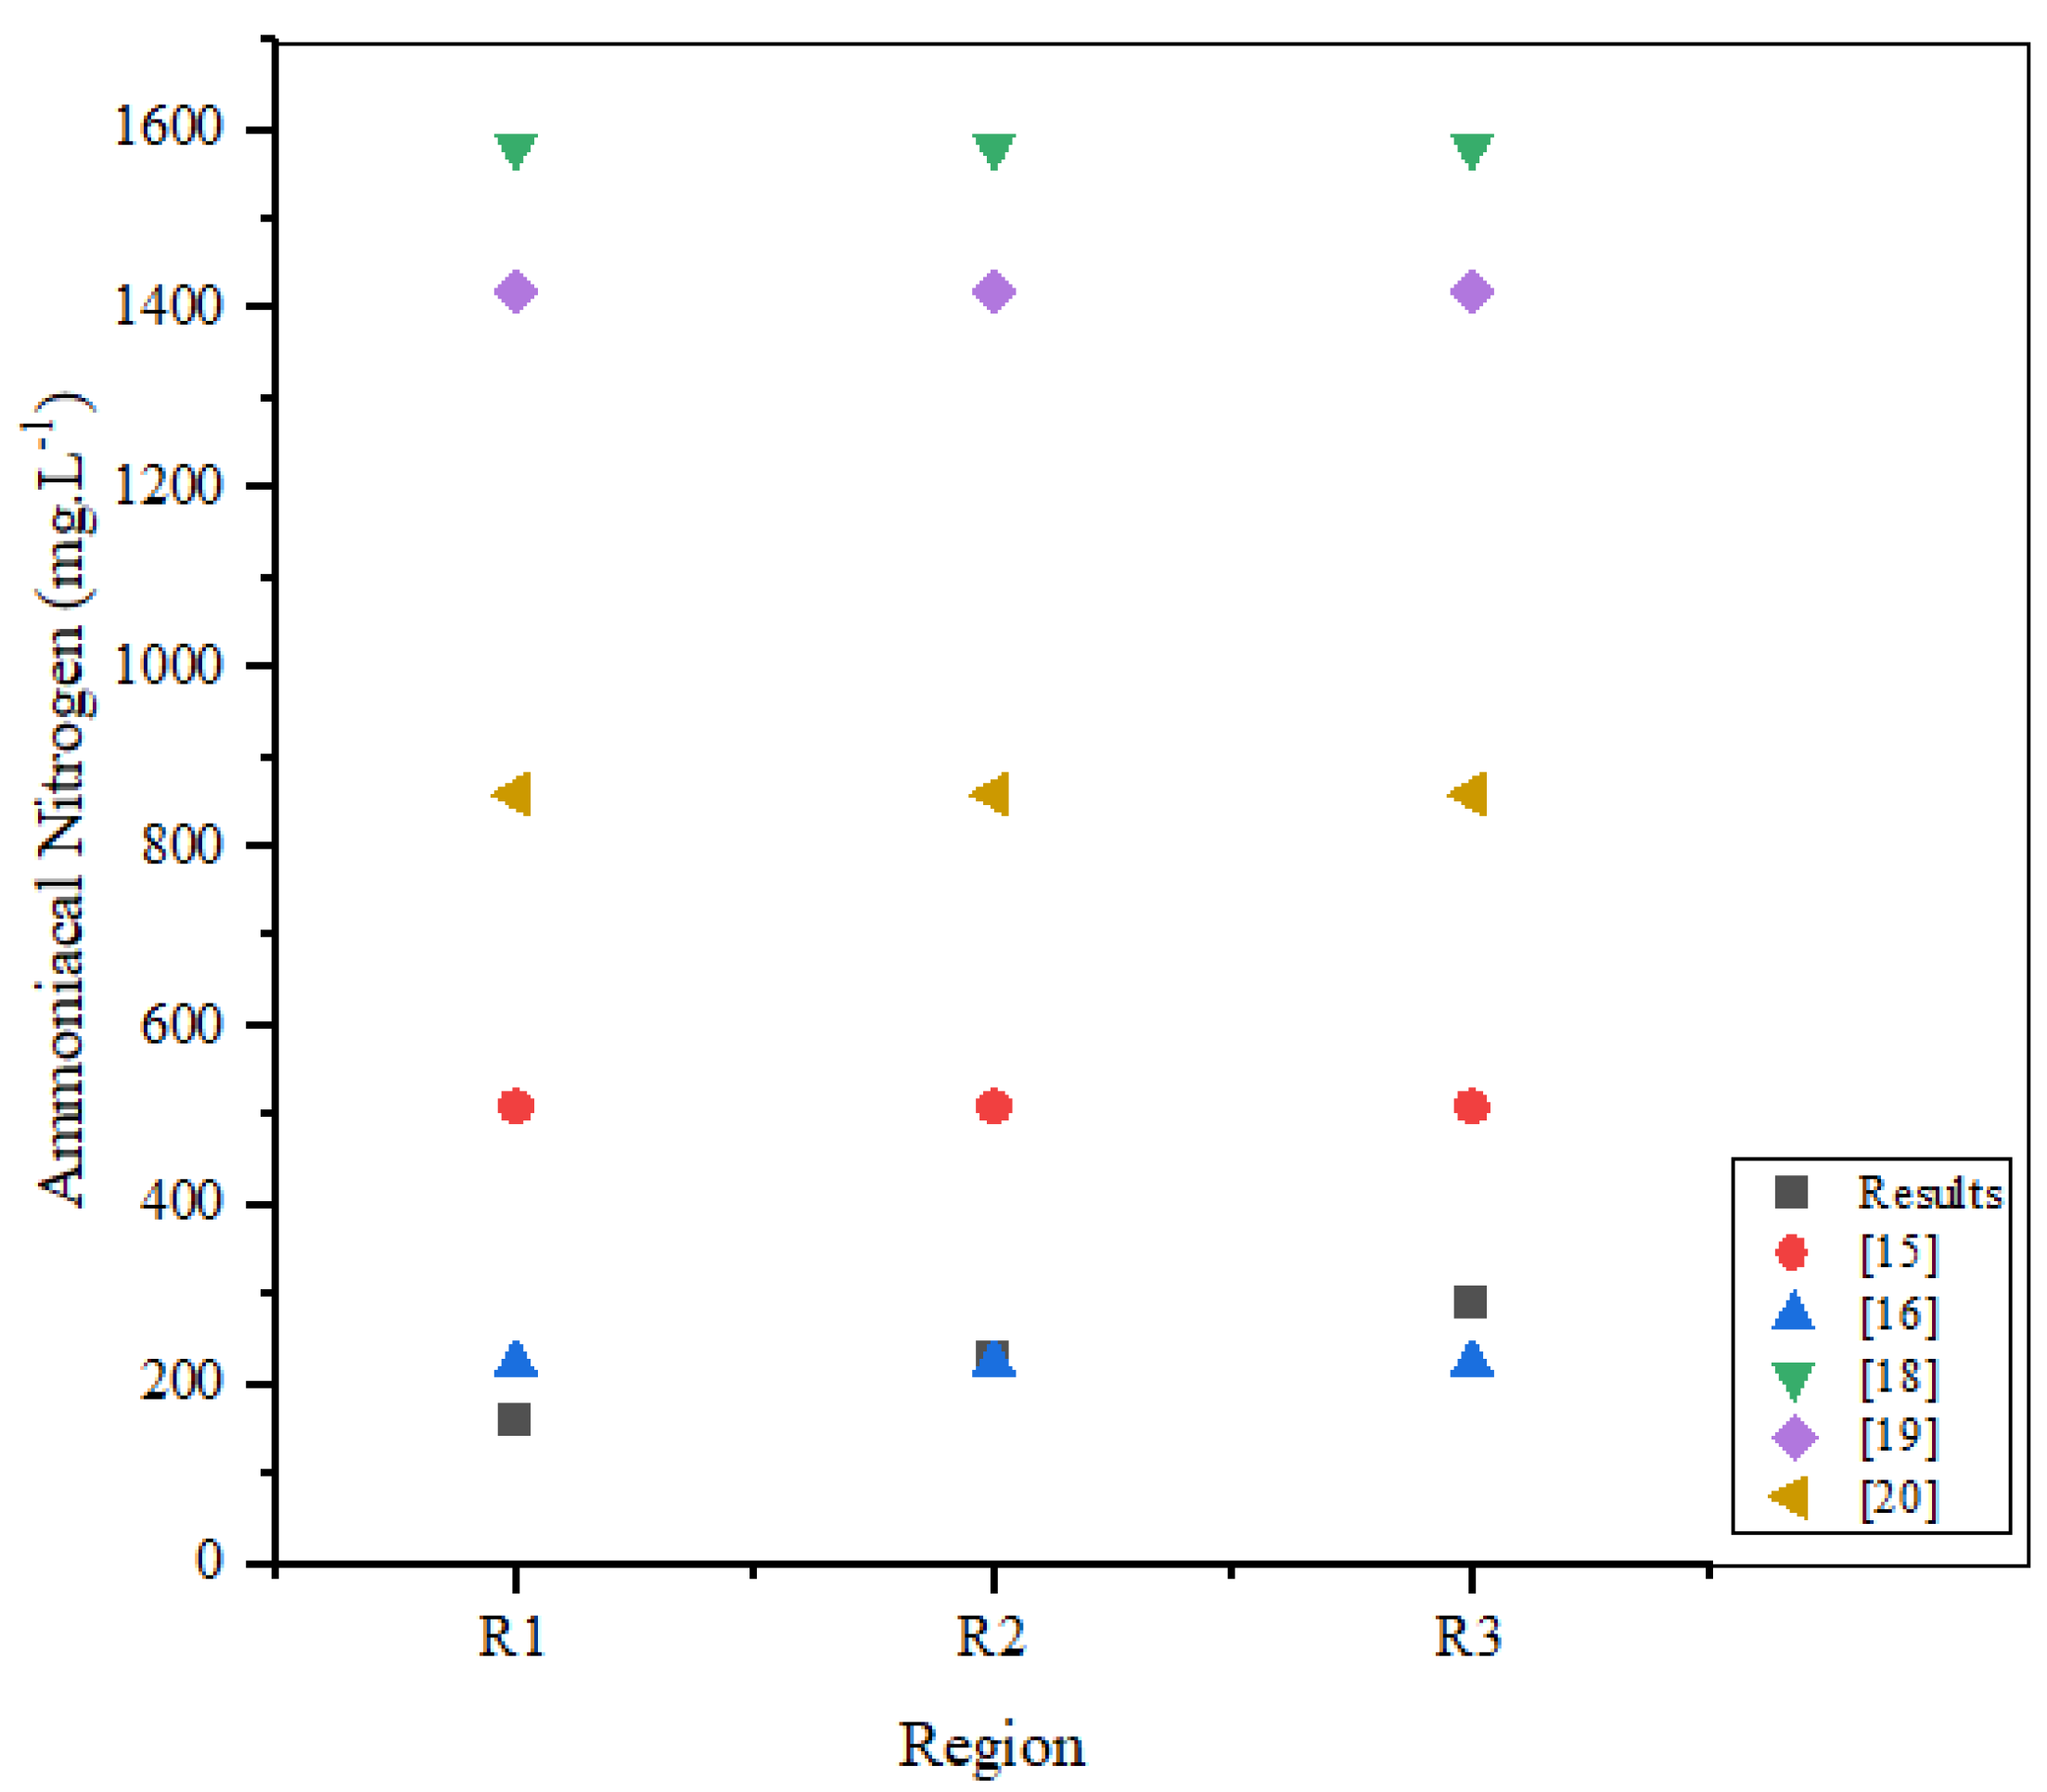
3.4.3. Ammoniacal Nitrogen and Nitrate
A comparison of the results obtained with the values of Ammoniacal Nitrogen and Nitrate was carried out, in which it was possible to verify low values of ammoniacal nitrogen, when compared with that raised by other authors. The information is closer to the analyzes carried out by [16] in which the values for Regions 1 (161 mg.L-1), 2 (230 mg.L-1) and 3 (289 mg.L-1) are close to the 224 mg.L-1 that is presented in the aforementioned author's research.
Figure 14.
Comparison between the values of ammoniacal nitrogen raised by other authors and the values obtained in the research.
Figure 14.
Comparison between the values of ammoniacal nitrogen raised by other authors and the values obtained in the research.
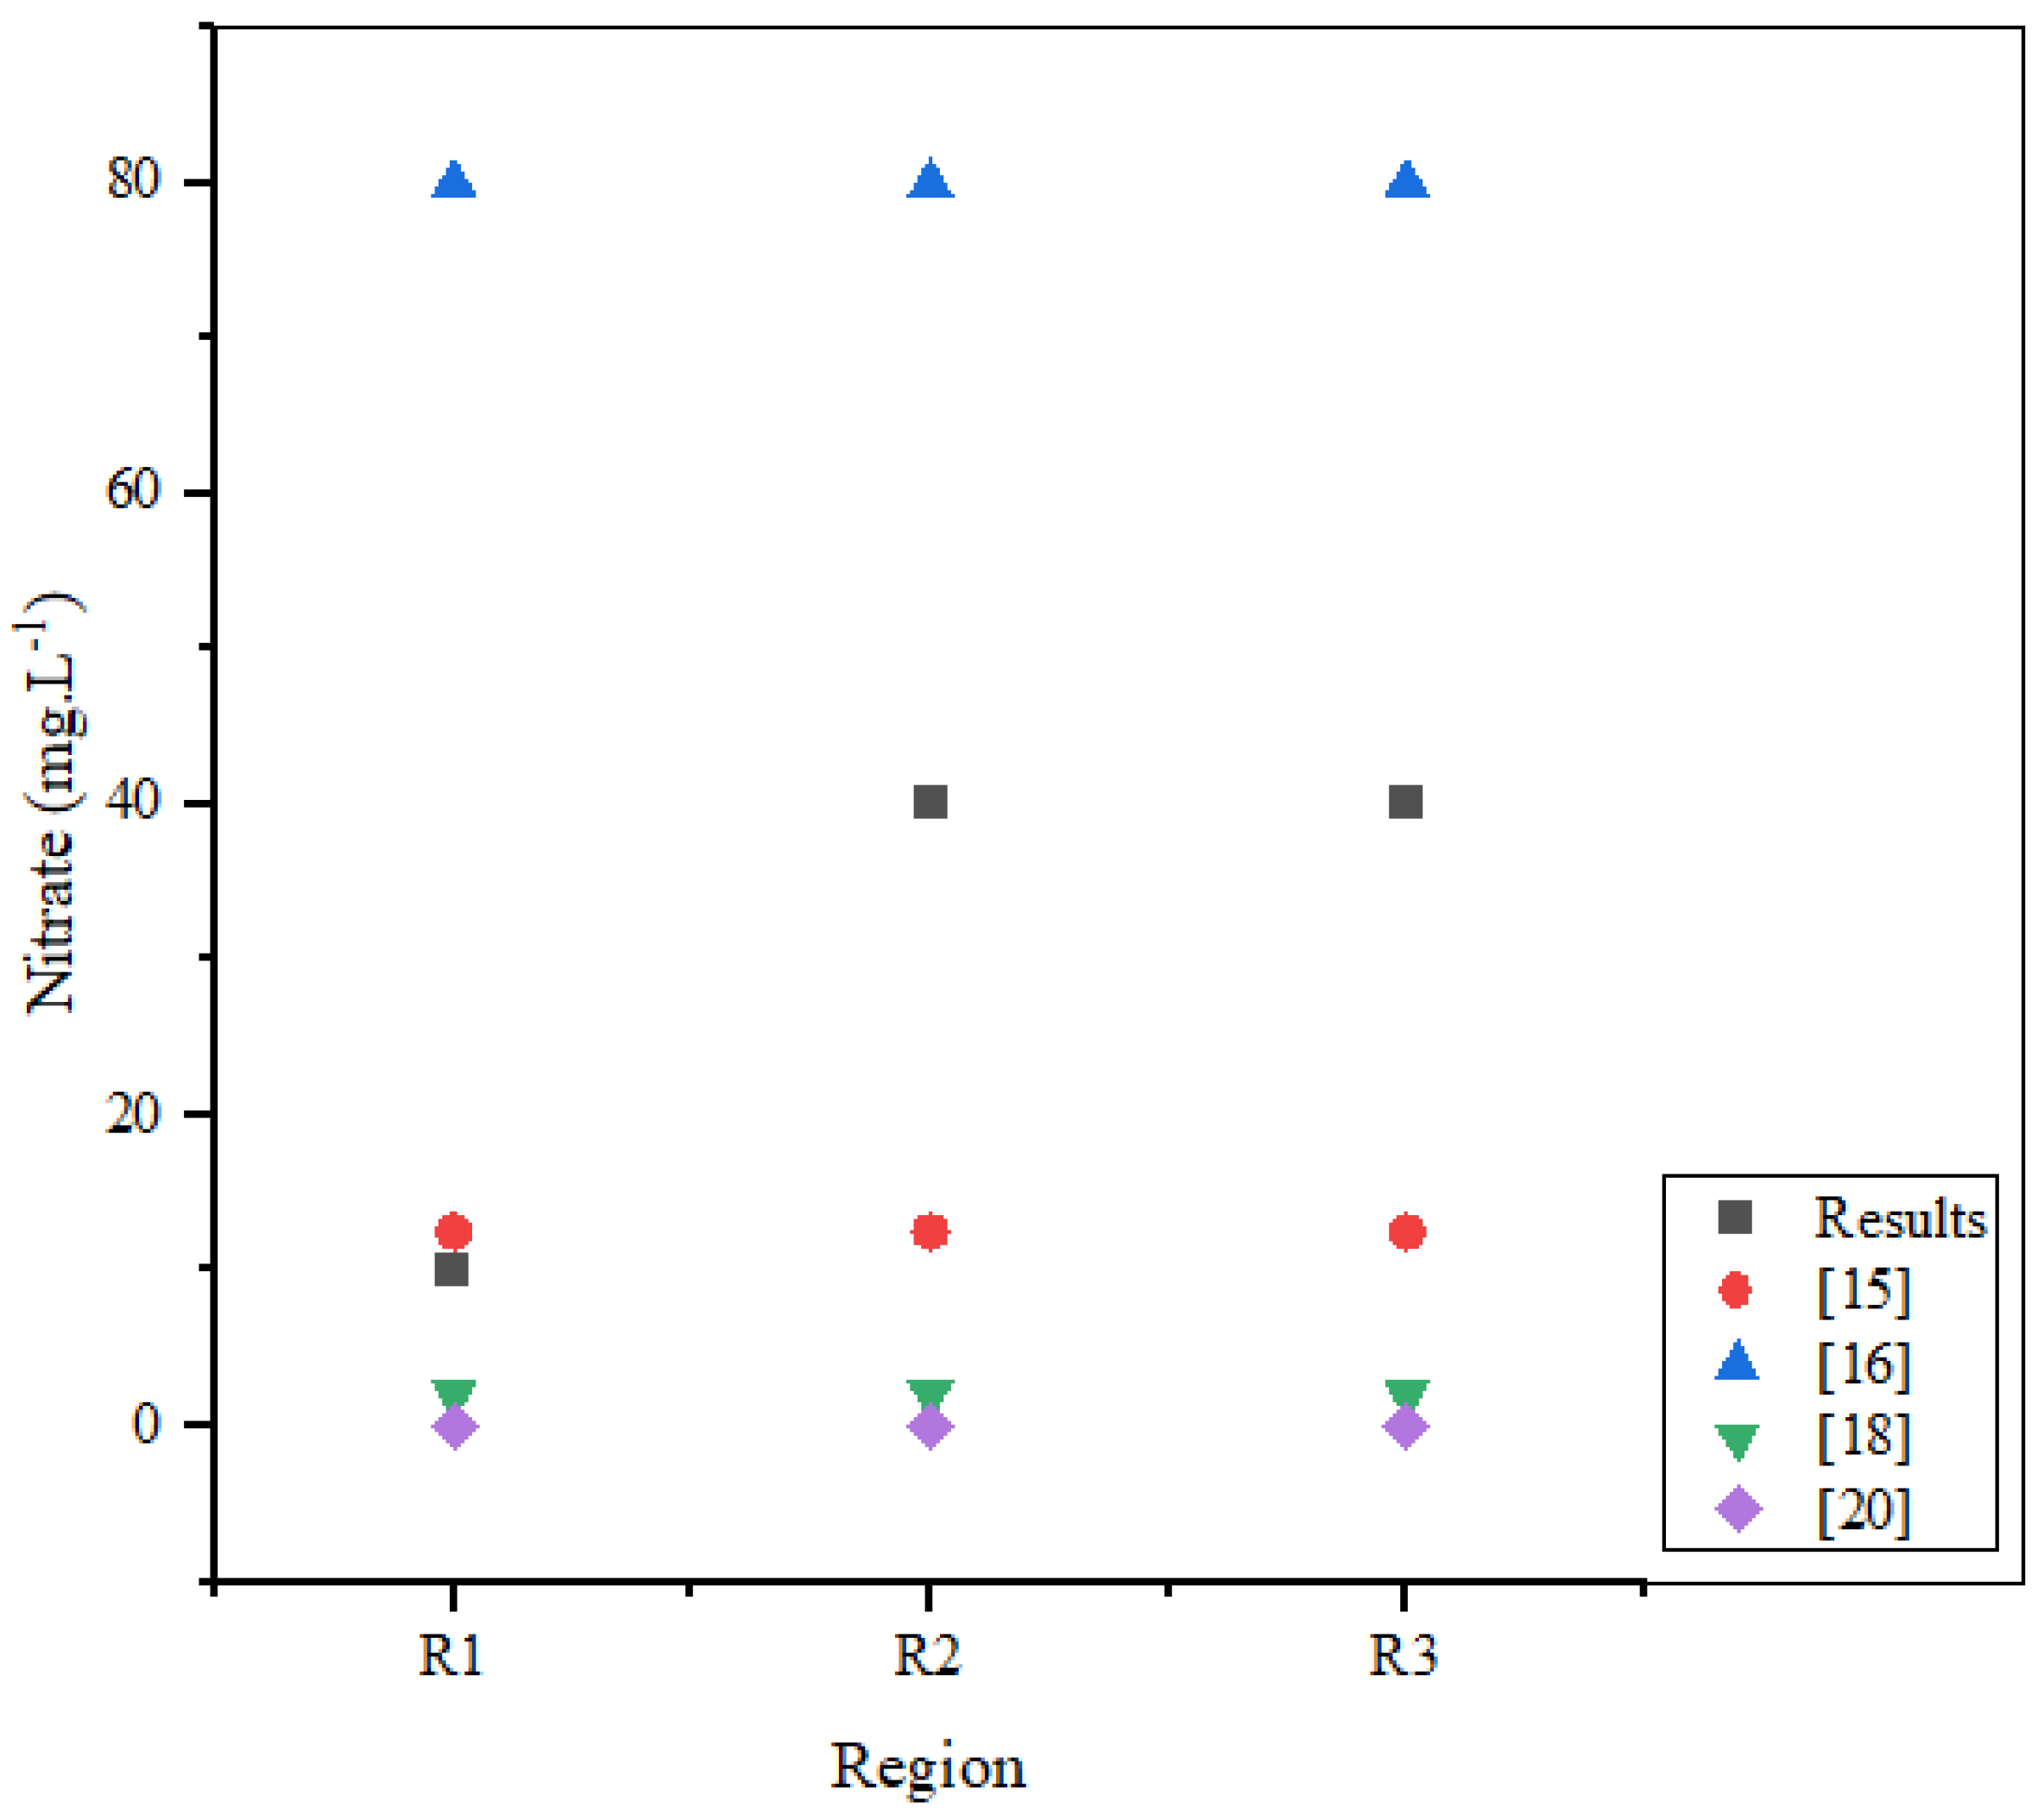
For the Nitrate values, it was possible to verify that the Nitrate concentrations for Region 1 (10 mg.L-1), 2 (40 mg.L-1) and 3 (40 mg.L-1) are similar to the results of [15] (12.50 mg.L-1) for Region 1 and the results of [16] (79.92 mg.L-1) and [15] for Regions 2 and 3, where it approaches the mean value between the two concentrations verified.
Figure 15.
Comparison between the values of nitrate raised by other authors and the values obtained in the research.
Figure 15.
Comparison between the values of nitrate raised by other authors and the values obtained in the research.
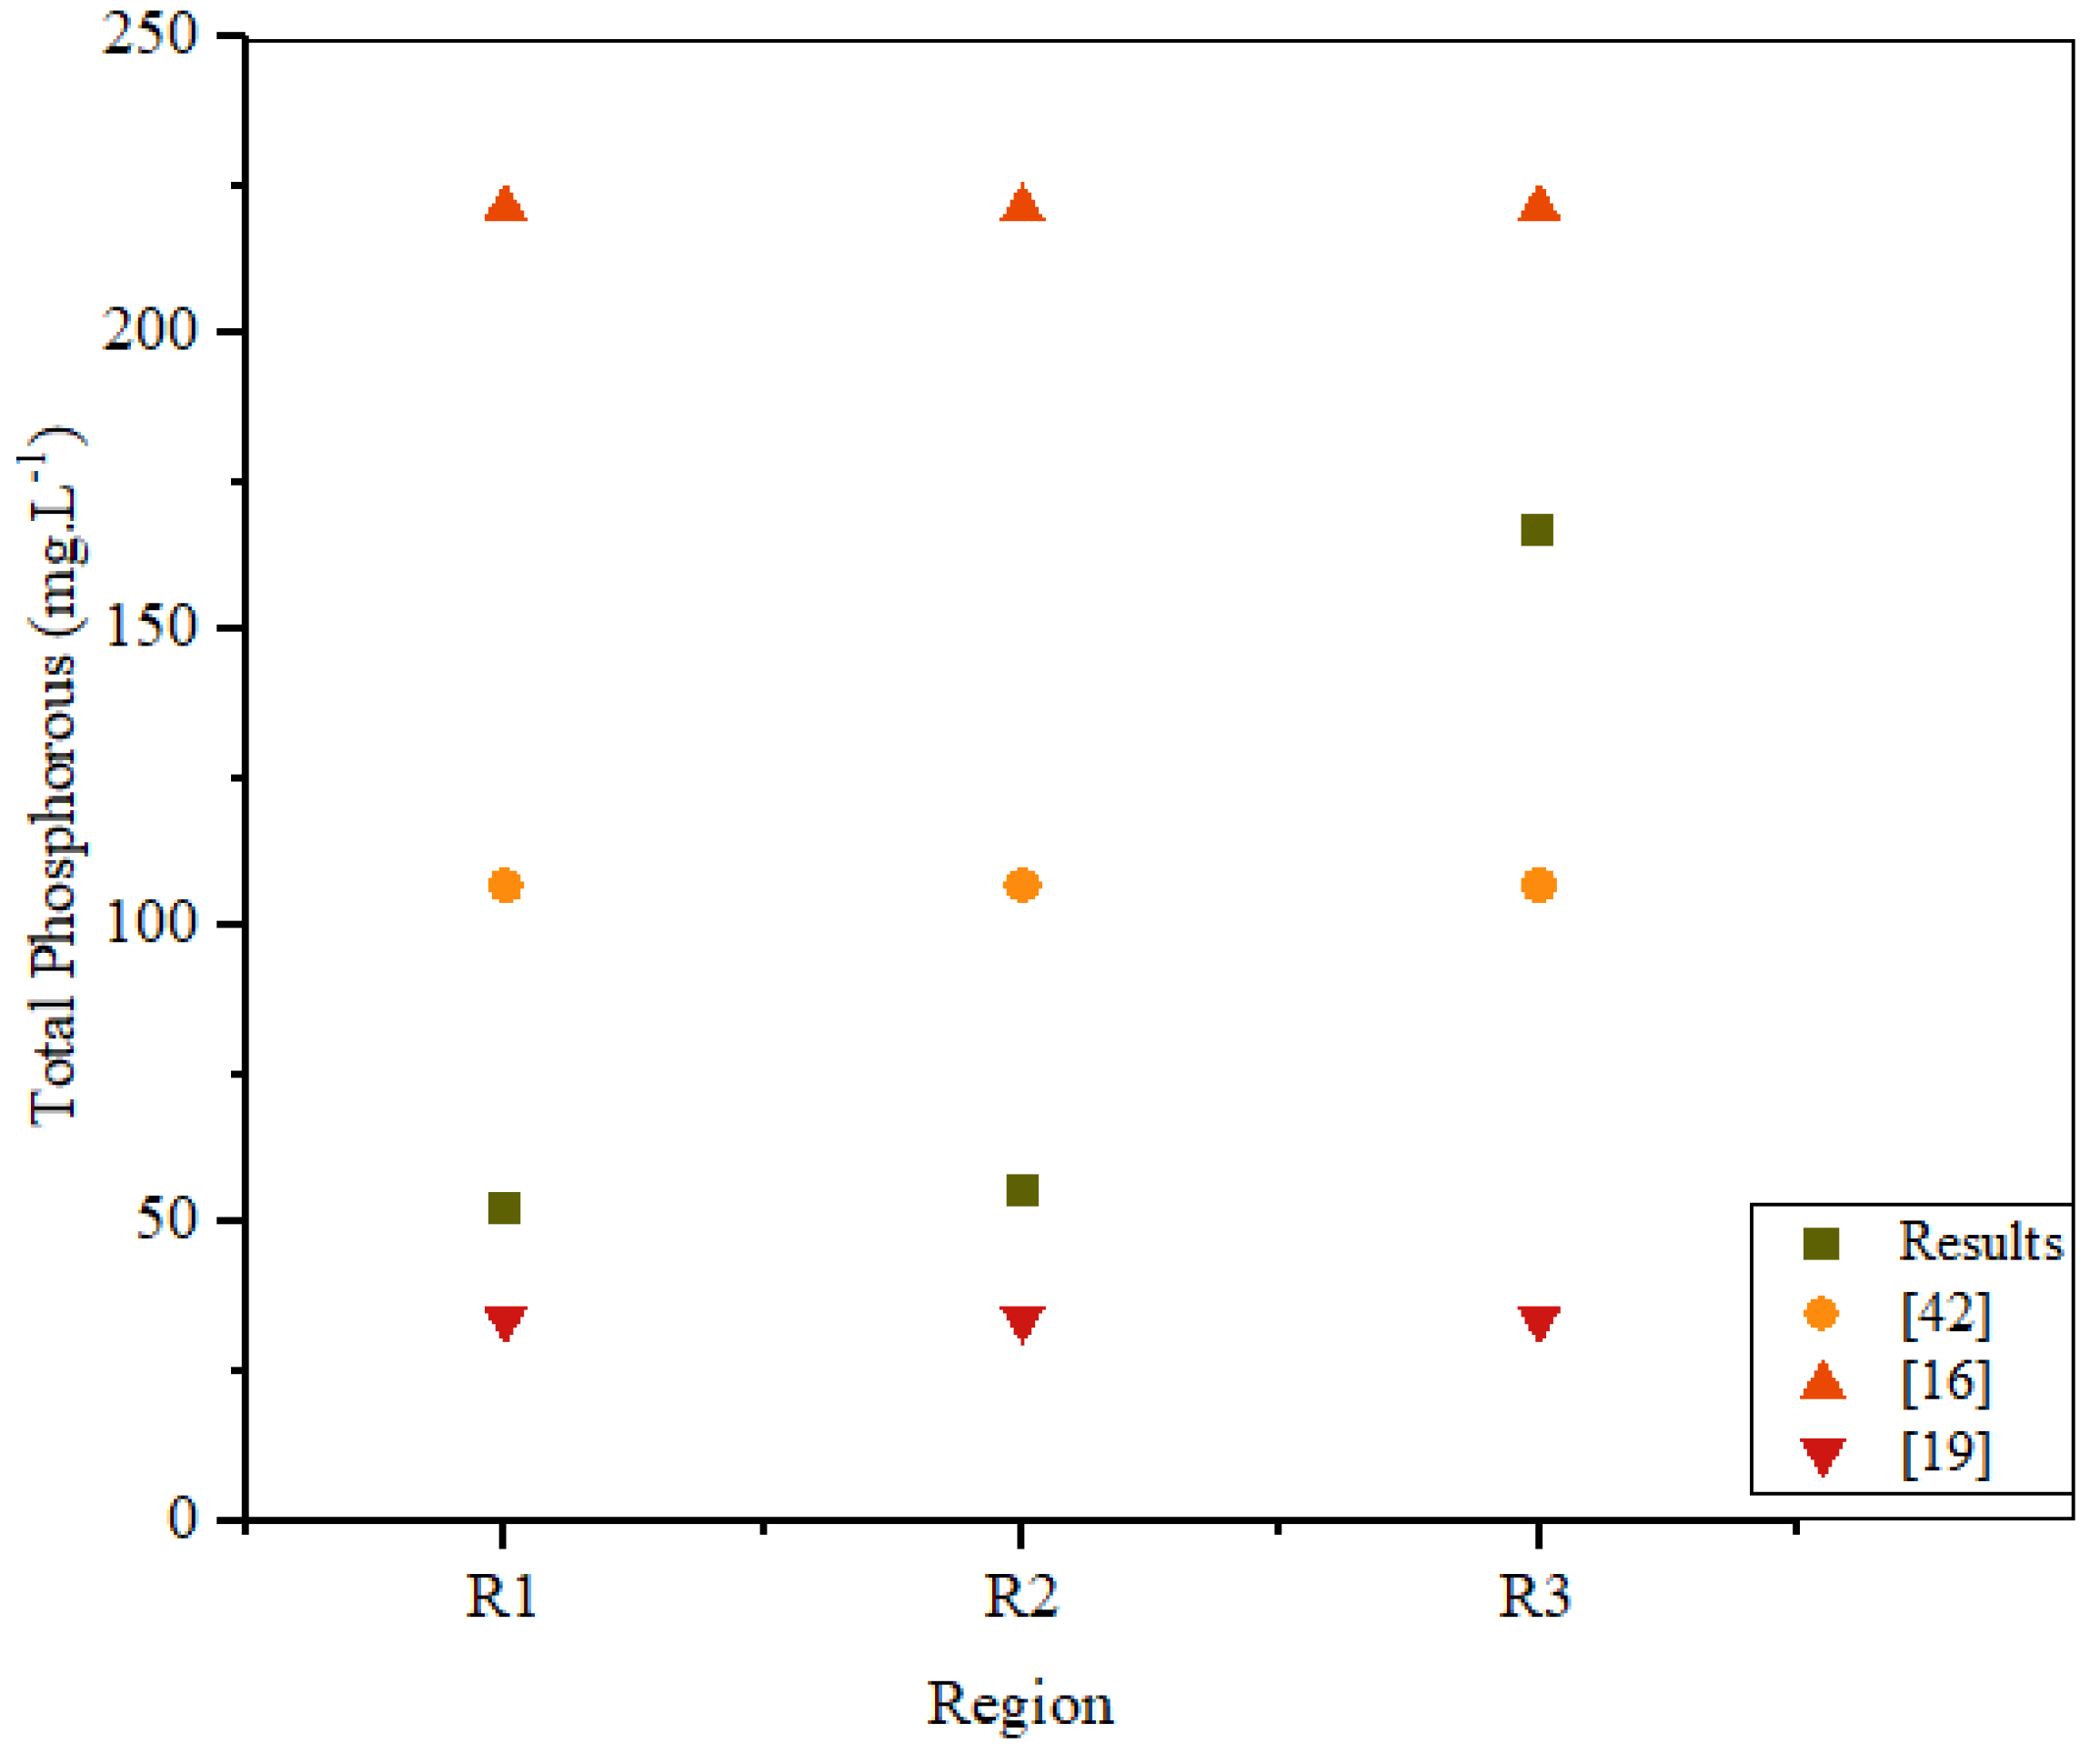
3.4.4. Total Phosphorous
When compared to other researches, the results of the analyzes of the phosphorus series show the existence of proximity with the raised values. For Region 1 and 2, phosphorus concentrations are consistent with the analyzes performed by [19] at a value of 34 mg.L-1. While the results of analyzes with the solubilized extract for Region 3 are closer to the values of [16] and [42] in the order of 221.19 mg.L-1 and 107.03 mg.L-1, respectively.
Figure 16.
Comparison between the values of total phosphorous raised by other authors and the values obtained in the research.
Figure 16.
Comparison between the values of total phosphorous raised by other authors and the values obtained in the research.
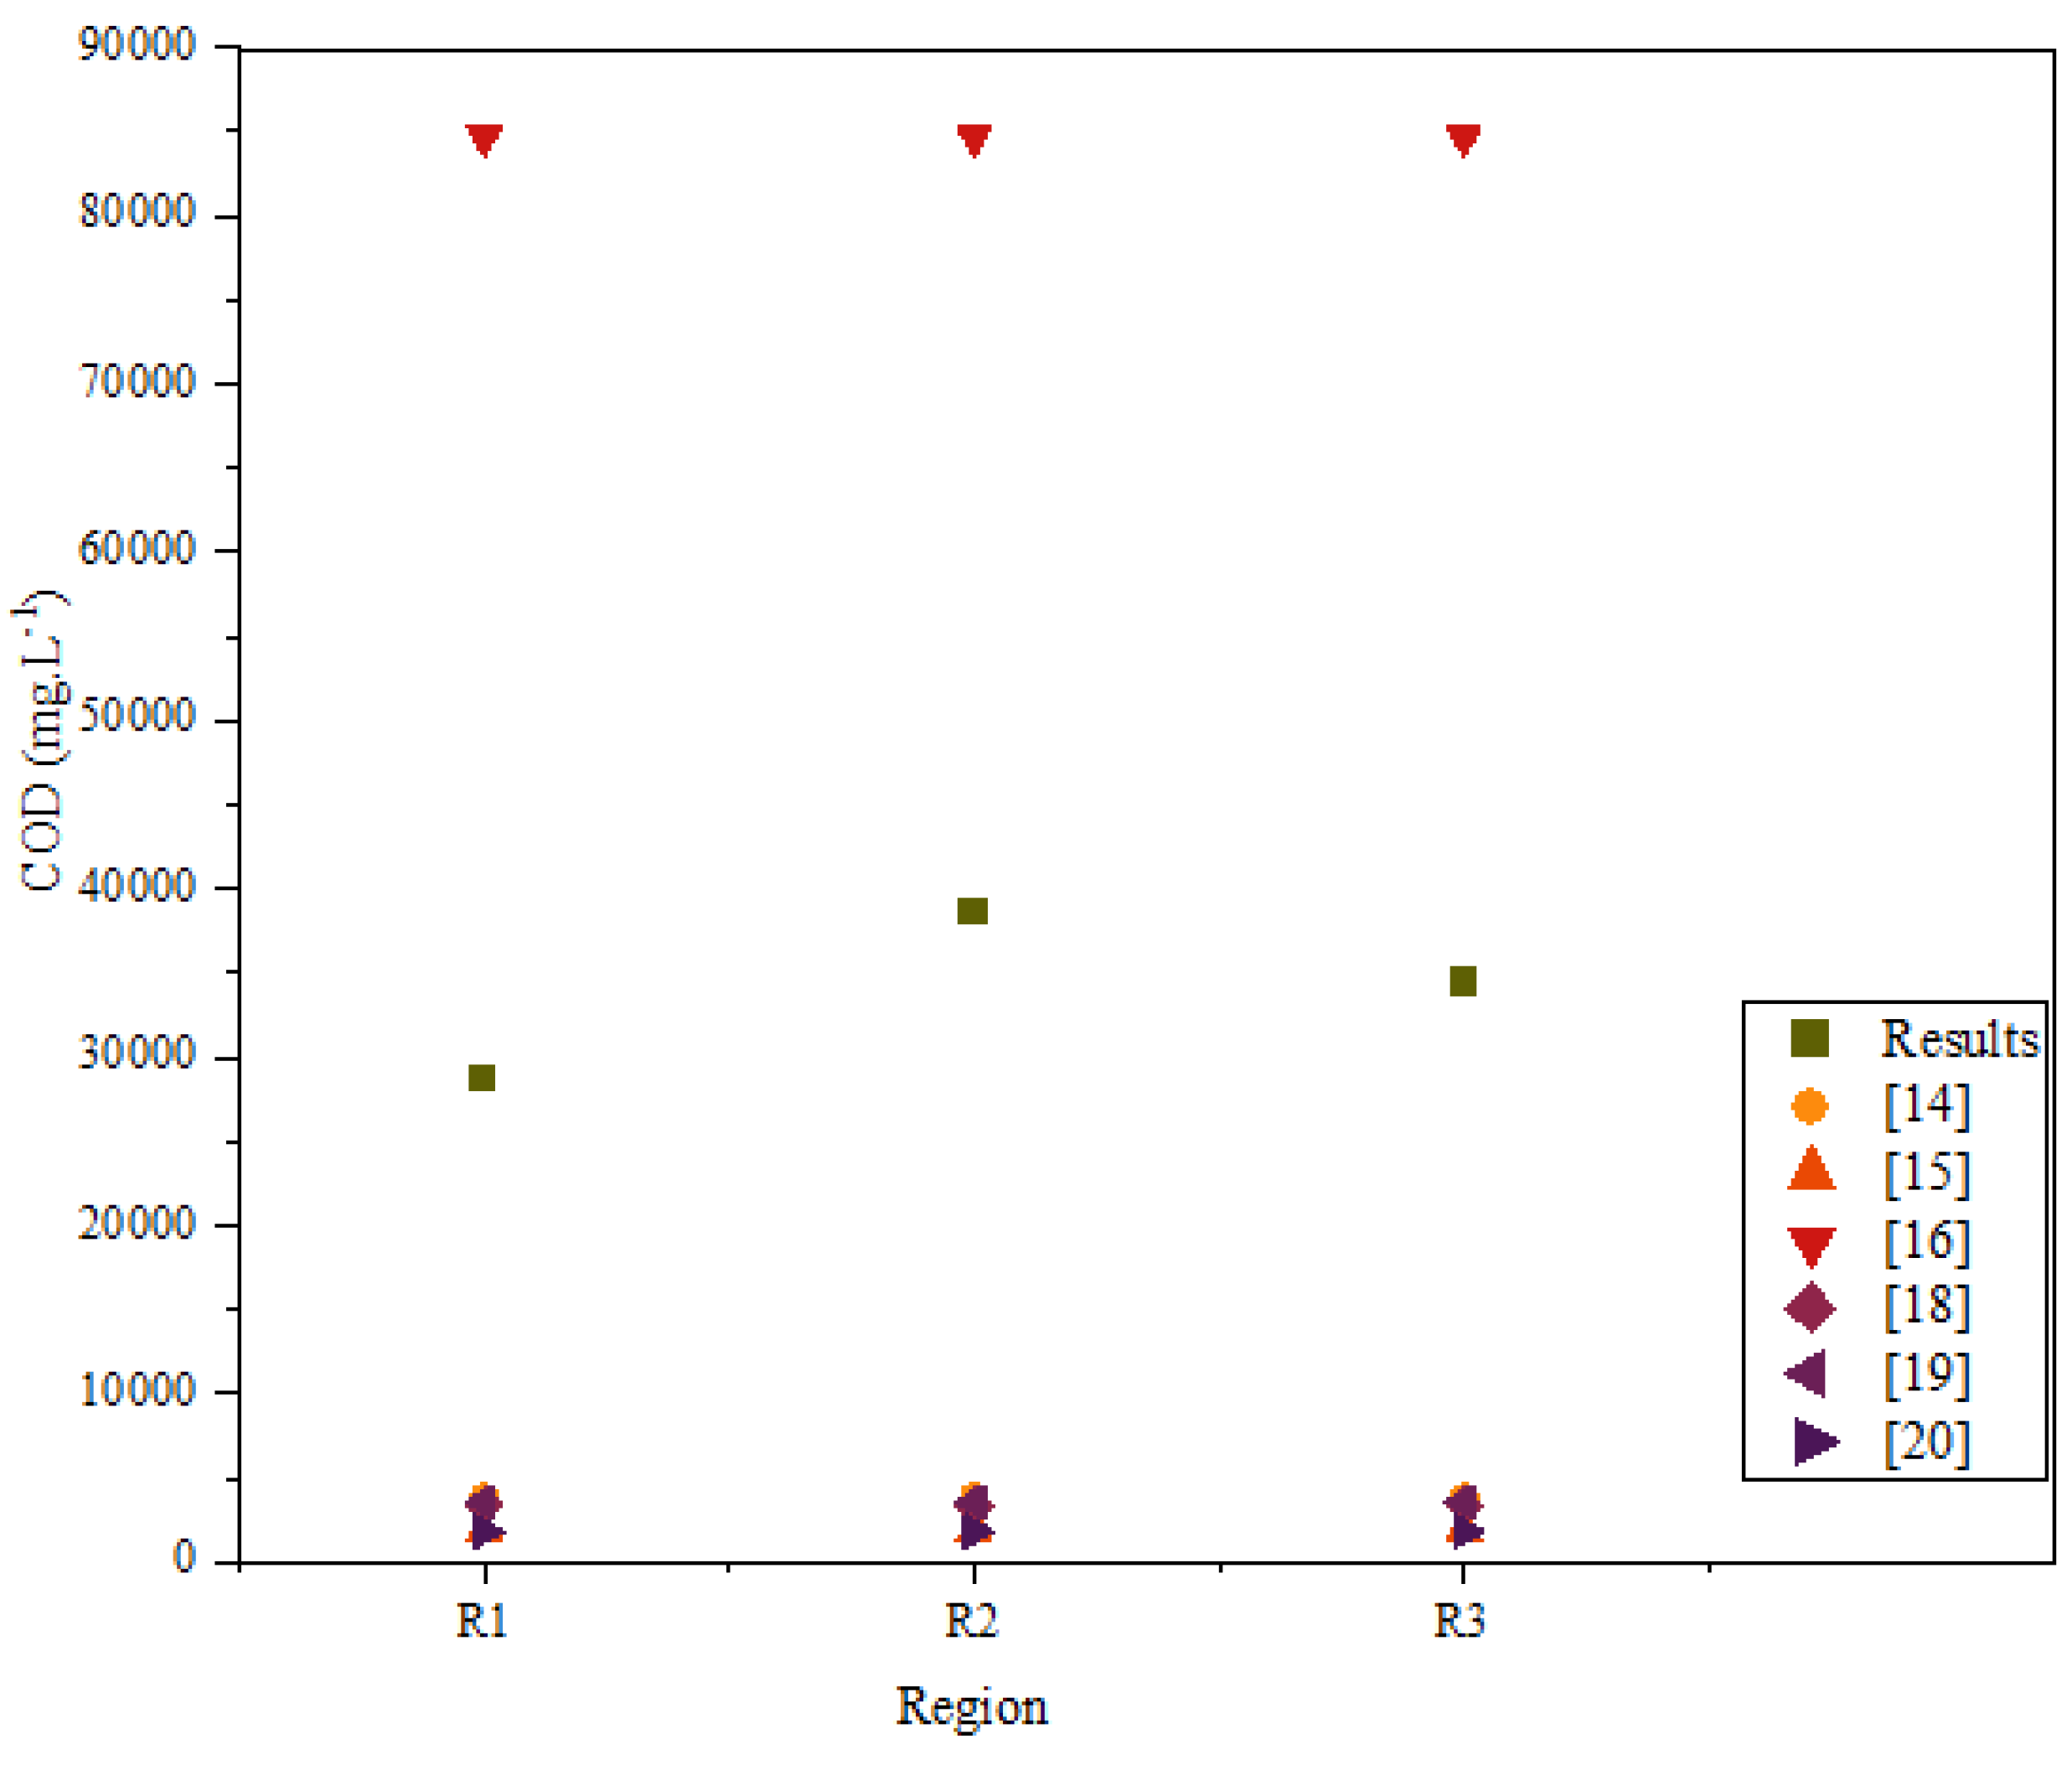
3.4.5. Chemical Oxygen Demand
When comparing the COD values with those found by other authors, discrepancies between the maximum and minimum values are observed. Therefore, the COD values for the solubilized extract of the residues are in an average range, when compared with the sources consulted in this work, however, with proximity to COD concentrations of leachate from landfills, it makes it possible to detect the environmental risk represented by the solubilization of solid organic waste.
Figure 17.
Comparison between the values of COD raised by other authors and the values obtained in the research.
Figure 17.
Comparison between the values of COD raised by other authors and the values obtained in the research.
After comparing the results of other authors whose works were consulted, a similarity with the results of [16] for the case of Hp, ammoniacal nitrogen, nitrate and phosphorus. The result of the analyzes of the solubilized extract, in several of its parameters, still demonstrated proximity with the research carried out by [15,16,17,18,19]. With this information, one can see the similarity of pollutant concentrations in solubilized extracts of solid organic waste with leachate generated in landfills, emphasizing the ability of these liquid by-products of landfills to degrade environmental conditions when released into the environment. That is, not only the leaching conditions, but also the simple solubilization of organic solid waste in water have a high potential for environmental contamination.
4. Conclusions
When carrying out the gravimetric analysis of the collected urban household solid waste, it is possible to analyze that the values of the proportions for organic matter are higher, when compared to research carried out in the region of Belém do Pará. For this case, it must be considered that the residue has not undergone any compression process that would cause it to lose moisture, in this case, it is considered that the increase in mass, when considering other studies, is due to the high moisture content of organic waste, in the order of 60%. The proportions of other materials are in a range close to that verified in research in the region.
The results of the physical-chemical analyzes of the solubilized extract of the organic fraction of urban household solid waste indicate similarity for pH, total dissolved solids, nutrients and organic matter with leachate generated in landfills, thus also demonstrating the polluting potential of the solubilization of these materials in the environment. In addition to the physical-chemical analyzes indicating the polluting potential of these materials, the non-compliance of the solubilized compound of these solid wastes with current Brazilian environmental and health legislation was also verified. For the treatment of these compounds, the use of the same technologies for the treatment of leachate from landfills is suggested, emphasizing physical-chemical treatment technologies, considering constant efficiency in the treatment process, regardless of microbial proliferation in reactors.
In order to avoid the environmental impacts arising from these materials, an efficient urban solid waste management system is necessary, in which the collection takes place in an integral way and can safely transport the waste to the treatment units. Also, in the treatment units, the handling of the material must be carried out properly so that liquid compounds with high polluting potential do not leak into the environment.
Author Contributions
D.O.P contributed to the general development of the research, participation in the gravimetric characterization and in obtaining and analyzing the solubilized extract; F.P.C.A contributed with participation in the gravimetric characterization and in obtaining and analyzing the solubilized extract; J.C.C.S contributed to the collections and gravimetric characterization; J.F.H.F contributed to the collections and gravimetric characterization; R.B.P.F contributed to the collections and gravimetric characterization; A.L.L contributed to the collections and gravimetric characterization; I.C.P.N contributed to the collections and gravimetric characterization; J.P.C contributed to the collections and gravimetric characterization; M.S.C.N contributed to the collections and gravimetric characterization; T.S.G contributed to the collections and gravimetric characterization; N.M.M contributed to obtaining and analyzing the solubilized extract; I.W.S.B contributed to obtaining and analyzing the solubilized extract; J.A.R.P contributed to the logistics for carrying out the collections, N.T.M contributed to the supervision and review of the research.
Funding
This research received no external funding.
Institutional Review Board Statement
Not applicable.
Informed Consent Statement
Not applicable.
Acknowledgments
I would like to acknowledge and dedicate this research in memory to Hélio da Silva Almeida, he used to work at the Faculty of Sanitary and Environmental Engineering/UFPa, and passed away on 13 March 2021. His contagious joy, dedication, intelligence, honesty, seriousness, and kindness will always be remembered in our hearts.
Conflicts of Interest
The authors declare no conflict of interest.
References
- Andriato, *!!! REPLACE !!!*; Florentino, M.; Lucy, M. Análise da sustentabilidade de cooperativas de materiais recicláveis selecionadas: alternativas para o tratamento de resíduos sólidos urbanos. Hum. Soc. Sci. Mar. 2020, 42, 2–12. [Google Scholar] [CrossRef]
- Balbueno, L.R.; Tiburtino-Silva, L.A.; Josemar De Campos, M.; Reginaldo Brito Da, C. Tratamento de resíduos sólidos no município de Bonito, Mato Grosso do Sul, Brasil, correlacionado com dados externos. Rev. Interações Campo Gd. 2021, 22, 883–905. [Google Scholar] [CrossRef]
- Silva, C.O.; Santos, G.M.; Silva, L.N. A degradação ambiental causada pelo descarte inadequado das embalagens plásticas: estudo de caso. In Revista Eletrônica em Gestão, Educação e Tecnologia Ambiental; 2013; pp. 2683–2689. [Google Scholar]
- Silva, N.R.D.; De Noroes Albuquerque, T. Enquadramento de corpos de água: um instrumento da política nacional de recursos hídricos. Geoambiente 2018. [CrossRef]
- Associação Brasileira De Empresas De Limpeza Pública E Resíduos Especiais—Abrelpe. In Panorama 2022; ABRELPE: São Paulo, Brazil, 2023.
- BRASIL. Ministério do Desenvolvimento Regional. In Diagnóstico Temático do Manejo de Resíduos Sólidos Urbanos; SNIS: Brasília, Brazil, 2022. [Google Scholar]
- Sheila De Araujo, C. Impactos Ambientais Causados pelo lixão desativado da cidade de Delmiro Gouveia - AL. 2020. 58 f. TCC (Graduação) - Curso de Engenharia Civil; Universidade Federal de Alagoas: Delmiro Gouveia, Brazil, 2020. [Google Scholar]
- Ruan Gonçalves, F. Proposta de padronização cartográfica para carta-imagem emergencial de inundação Impactos ambientais decorrentes do lixão da cidade de Condado-PB. Geografia Ensino Pesquisa Santa Maria 2017, 21, 142–151. [Google Scholar] [CrossRef]
- Silva, E.M.D. Ecotoxicidade de resíduos sólidos urbanos e de lixiviado gerado em aterro sanitário. 2022. 185 f. Tese (Doutorado) - Curso de Pós-Graduação em Engenharia Civil e Ambiental; Universidade Federal de Campina Grande: Campina Grande, Brazil, 2022. [Google Scholar]
- Wdowczyk, A.; Szymańska-Pulikowska, A. Analysis of the possibility of conducting a comprehensive assessment of landfill leachate contamination using physicochemical indicators and toxicity test. Ecotoxicol. Environ. Saf. 2021, 221, 112434. [Google Scholar] [CrossRef] [PubMed]
- Wowkonowicz, P.; Kijeńska, M. Phthalate release in leachate from municipal landfills of central Poland. PLoS One 2017, 12, e0174986. [Google Scholar] [CrossRef]
- Przybylińska, P.A.; Wyszkowski, M. Environmental contamination with phthalates and its impact on living organisms. Ecol. Chem. Eng. 2016, 23, 347–356. [Google Scholar] [CrossRef]
- Jonsson, S.; et al. Mono-and diesters from o-phthalic acid in leachates from different European landfills. Water Res. 2003, 37, 609–617. [Google Scholar] [CrossRef]
- Lucena, L.G; Rocha, E.M.R; Da Silva, F.L.H; Cahino, A.M. Otimização multivariada do processo foto-Fenton solar na remoção da demanda química de oxigênio em lixiviados de aterros sanitários. Eng. Sanit. Ambient. 2018, 23, 3. [Google Scholar] [CrossRef]
- Scandelai, A.P.J.; et al. Caracterização de lixiviado de aterro sanitário e propostas de tratamento. Colloq. Exactarum 2018, 36–43. [Google Scholar] [CrossRef]
- Torrez, V.M.; et al. Caracterización de lixiviados como alternativa que contribuya a la mitigación de contaminantes. Revista Ion 2018, 31, 59–63. [Google Scholar] [CrossRef]
- Vasconcelos, D.V.; et al. Estudo da tratabilidade de lixiviado gerado em um aterro controlado. Revista Ambiente Água. 2017, 12, 457–467. [Google Scholar] [CrossRef]
- Cavalcanti, A.S.; Izário Filho, H.J.; Guimarães, O.L.C.; Siqueira, A.F. Modelagem neural e análise estatística do processo de degradação de chorume por foto Fenton solar. Rev. Ambiente. Água 2015, 10. [Google Scholar] [CrossRef]
- Maia, I.S.; et al. Avaliação do tratamento biológico de lixiviado de aterro sanitário em escala real na Região Sul do Brasil. Engenharia Sanitária e Ambiental 2015, 20, 665–675. [Google Scholar] [CrossRef]
- Kawahigashi, F.; Mendes, M.B.; da Assunção Júnior, V.G.; Gomes, V.H.; Fernandes, F.; Hirooka, E.Y.; Kuroda, E.K. Pós-tratamento de lixiviado de aterro sanitário com carvão ativado. Eng Sanit Ambient. 2014, 19. [Google Scholar] [CrossRef]
- Pastore, C.; Barca, E.; del Moro, G.; di Iaconi, C.; Loos, M.; Singer, H.P.; Mascolo, G. Comparison of different types of landfill leachate treatment by employment of nontarget screening to identify residual refractory organics and principal component analysis. Sci. Total Environ. 2018, 635, 984–994. [Google Scholar] [CrossRef]
- Oliveira, L.F.; Silva, S.M.C.P.; Martinez, C.B.R. Assessment of domestic landfill leachate toxicity to the Asian clam Corbicula fluminea via biomarkers. Ecotox. Environ. Saf. 2014, 103, 17–23. [Google Scholar] [CrossRef]
- Silva, E.M. Ecotoxicidade de resíduos sólidos urbanos e de lixiviado gerado em aterro sanitário. 2022. 185 f. Tese (Doutorado) - Curso de Pós-Graduação em Engenharia Civil e Ambiental; Universidade Federal de Campina Grande: Campina Grande, Brazil, 2022. [Google Scholar]
- Franco, H.A.; Marcus Vinicius De Castro, R.; Thode Filho, S. Impacto Ambiental do Extrato Solubilizado de Borra de Café sobre Organismo Terrestre. Front. J. Soc. Technol. Environ. Sci. Anápolis 2020, 9, 404–413. [Google Scholar] [CrossRef]
- Jovelino, J.R.; et al. Estabilização/solidificação: caracterização, classificação e aplicação no tratamento e gerenciamento de resíduos sólidos de laboratórios químicos. Holos Environ. 2020, 20, 539–558. [Google Scholar] [CrossRef]
- Schneider, J.B.; Moraes, C.A.M.; Brehm, F.A. Avaliação ambiental da estabilização por solidificação de BTEX oriundo de resíduo de adsorvente composto por cinza de casca de arroz e carvão ativado em argamassa. Rev. Tecnol. Soc. 2020, 16, 69–79. [Google Scholar] [CrossRef]
- Webert Brasil Cirilo Da, S.; Suelly Helena De Araújo, B.; Antônio Eduardo Bezerra, C. Avaliação da aplicação de cinzas pesadas de termelétrica em blocos intertravados de concreto para pavimentos. Matéria 2020, 25. [Google Scholar]
- Thode Filho, S.; et al. Avaliação ecotoxicológica do extrato solubilizado de bagaço de cana-de-açúcar residual via germinação de sementes de alface (Lactuca sativa L.). Rev. Estud. Ambient. 2019, 21, 46–55. [Google Scholar] [CrossRef]
- Nardino, D.A.; et al. Reutilização de resíduos de curtume na fabricação de blocos de concreto para pavimentação: avaliação das características do resíduo. In XI Congresso Brasileiro de Engenharia Química em Iniciação Científica (CBEQIC); 2015. [Google Scholar]
- Alessandra dos Santos, S.; et al. Avaliação do potencial tóxico dos resíduos sólidos urbanos da cidade de Campina Grande-PB. Matéria 2015, 20, 840–851. [Google Scholar]
- Medeiros, C.R. Determinação de compostos fenólicos em extratos aquosos de resíduos sólidos por microextração em fase sólida e cromatografia a gás acoplada à espectrometria de massas. 2013. 82 f. Dissertação (Mestrado) - Curso de Pós-Graduação em Química. Universidade Federal de Santa Catarina: Florianópolis, Brazil, 2013. [Google Scholar]
- Nébora Liz Vendramin Brasil, R.; Pawlowsky, U. Testes de toxicidade aguda através de bioensaios no extrato solubilizado dos resíduos classe II A-não inertes e classe II B-inertes. Eng. SanitáriaAmbient. , 2007, 12, 8–16. [Google Scholar]
- Sisinno, C.L.S. Disposição em aterros controlados de resíduos sólidos industriais não-inertes: avaliação dos componentes tóxicos e implicações para o ambiente e para a saúde humana. Cadernos de Saúde Pública 2003, 19, 369–374. [Google Scholar] [CrossRef] [PubMed]
- Associação Brasileira de Normas Técnicas. NBR 10.005/2004 – Procedimentos para a obtenção de extrato lixiviado de resíduos sólidos; ANBT: Rio de Janeiro, Brazil, 2004. [Google Scholar]
- Associação Brasileira De Normas Técnicas. NBR 10.006/2004 – Procedimentos para a obtenção de extrato solubilizado de resíduos sólidos; ABNT: Rio de Janeiro, Brazil, 2004. [Google Scholar]
- Associação Brasileira De Normas Técnicas. NBR 10.004/2004 – Resíduos Sólidos – Classificação; ANBT: Rio de Janeiro, Brazil, 2004. [Google Scholar]
- BRASIL. Ministério da Saúde. Portaria GM/MS Nº 888, de 4 de maio de 2021. Altera o Anexo XX da Portaria de Consolidação GM/MS nº 5, de 28 de setembro de 2017, para dispor sobre os procedimentos de controle e de vigilância da qualidade da água para consumo humano e seu padrão de potabilidade. MS: Brasília, 2021.
- BRASIL. Conselho Nacional de Meio Ambiente. Resolução nº 357, de 17 de março de 2005. Dispõe sobre a classificação dos corpos de água e diretrizes ambientais para o seu enquadramento. CONAMA: Brasília, Brazil, 2005.
- Instituto Brasileiro De Geografia E Estatística. Censo 2010; IBGE: Brasília, Brazil, 2010. [Google Scholar]
- Menezes, R.O.; et al. Análise estatística da caracterização gravimétrica de resíduos sólidos domiciliares: estudo de caso do município de Juiz de Fora, Minas Gerais. Engenharia Sanitária e Ambiental 2019, 24, 271–282. [Google Scholar] [CrossRef]
- American Public Health Association. 23th Standard Methods for the examination of Water and Wastewater; APHA: Washington, DC, USA, 2017. [Google Scholar]
- Morais, M.; et al. Análise Físico-Química e Microbiológica do Lixiviado do Aterro Sanitário de Rio Branco-AC. S. A. J. Basic Educ. Tech. Technol. 2020, 7, 282–292. [Google Scholar]
Figure 1.
Process flowsheet by collecting, classification/segregation, and pre-treatment of the organic fraction of MSW and obtaining the solubilized extract.
Figure 1.
Process flowsheet by collecting, classification/segregation, and pre-treatment of the organic fraction of MSW and obtaining the solubilized extract.
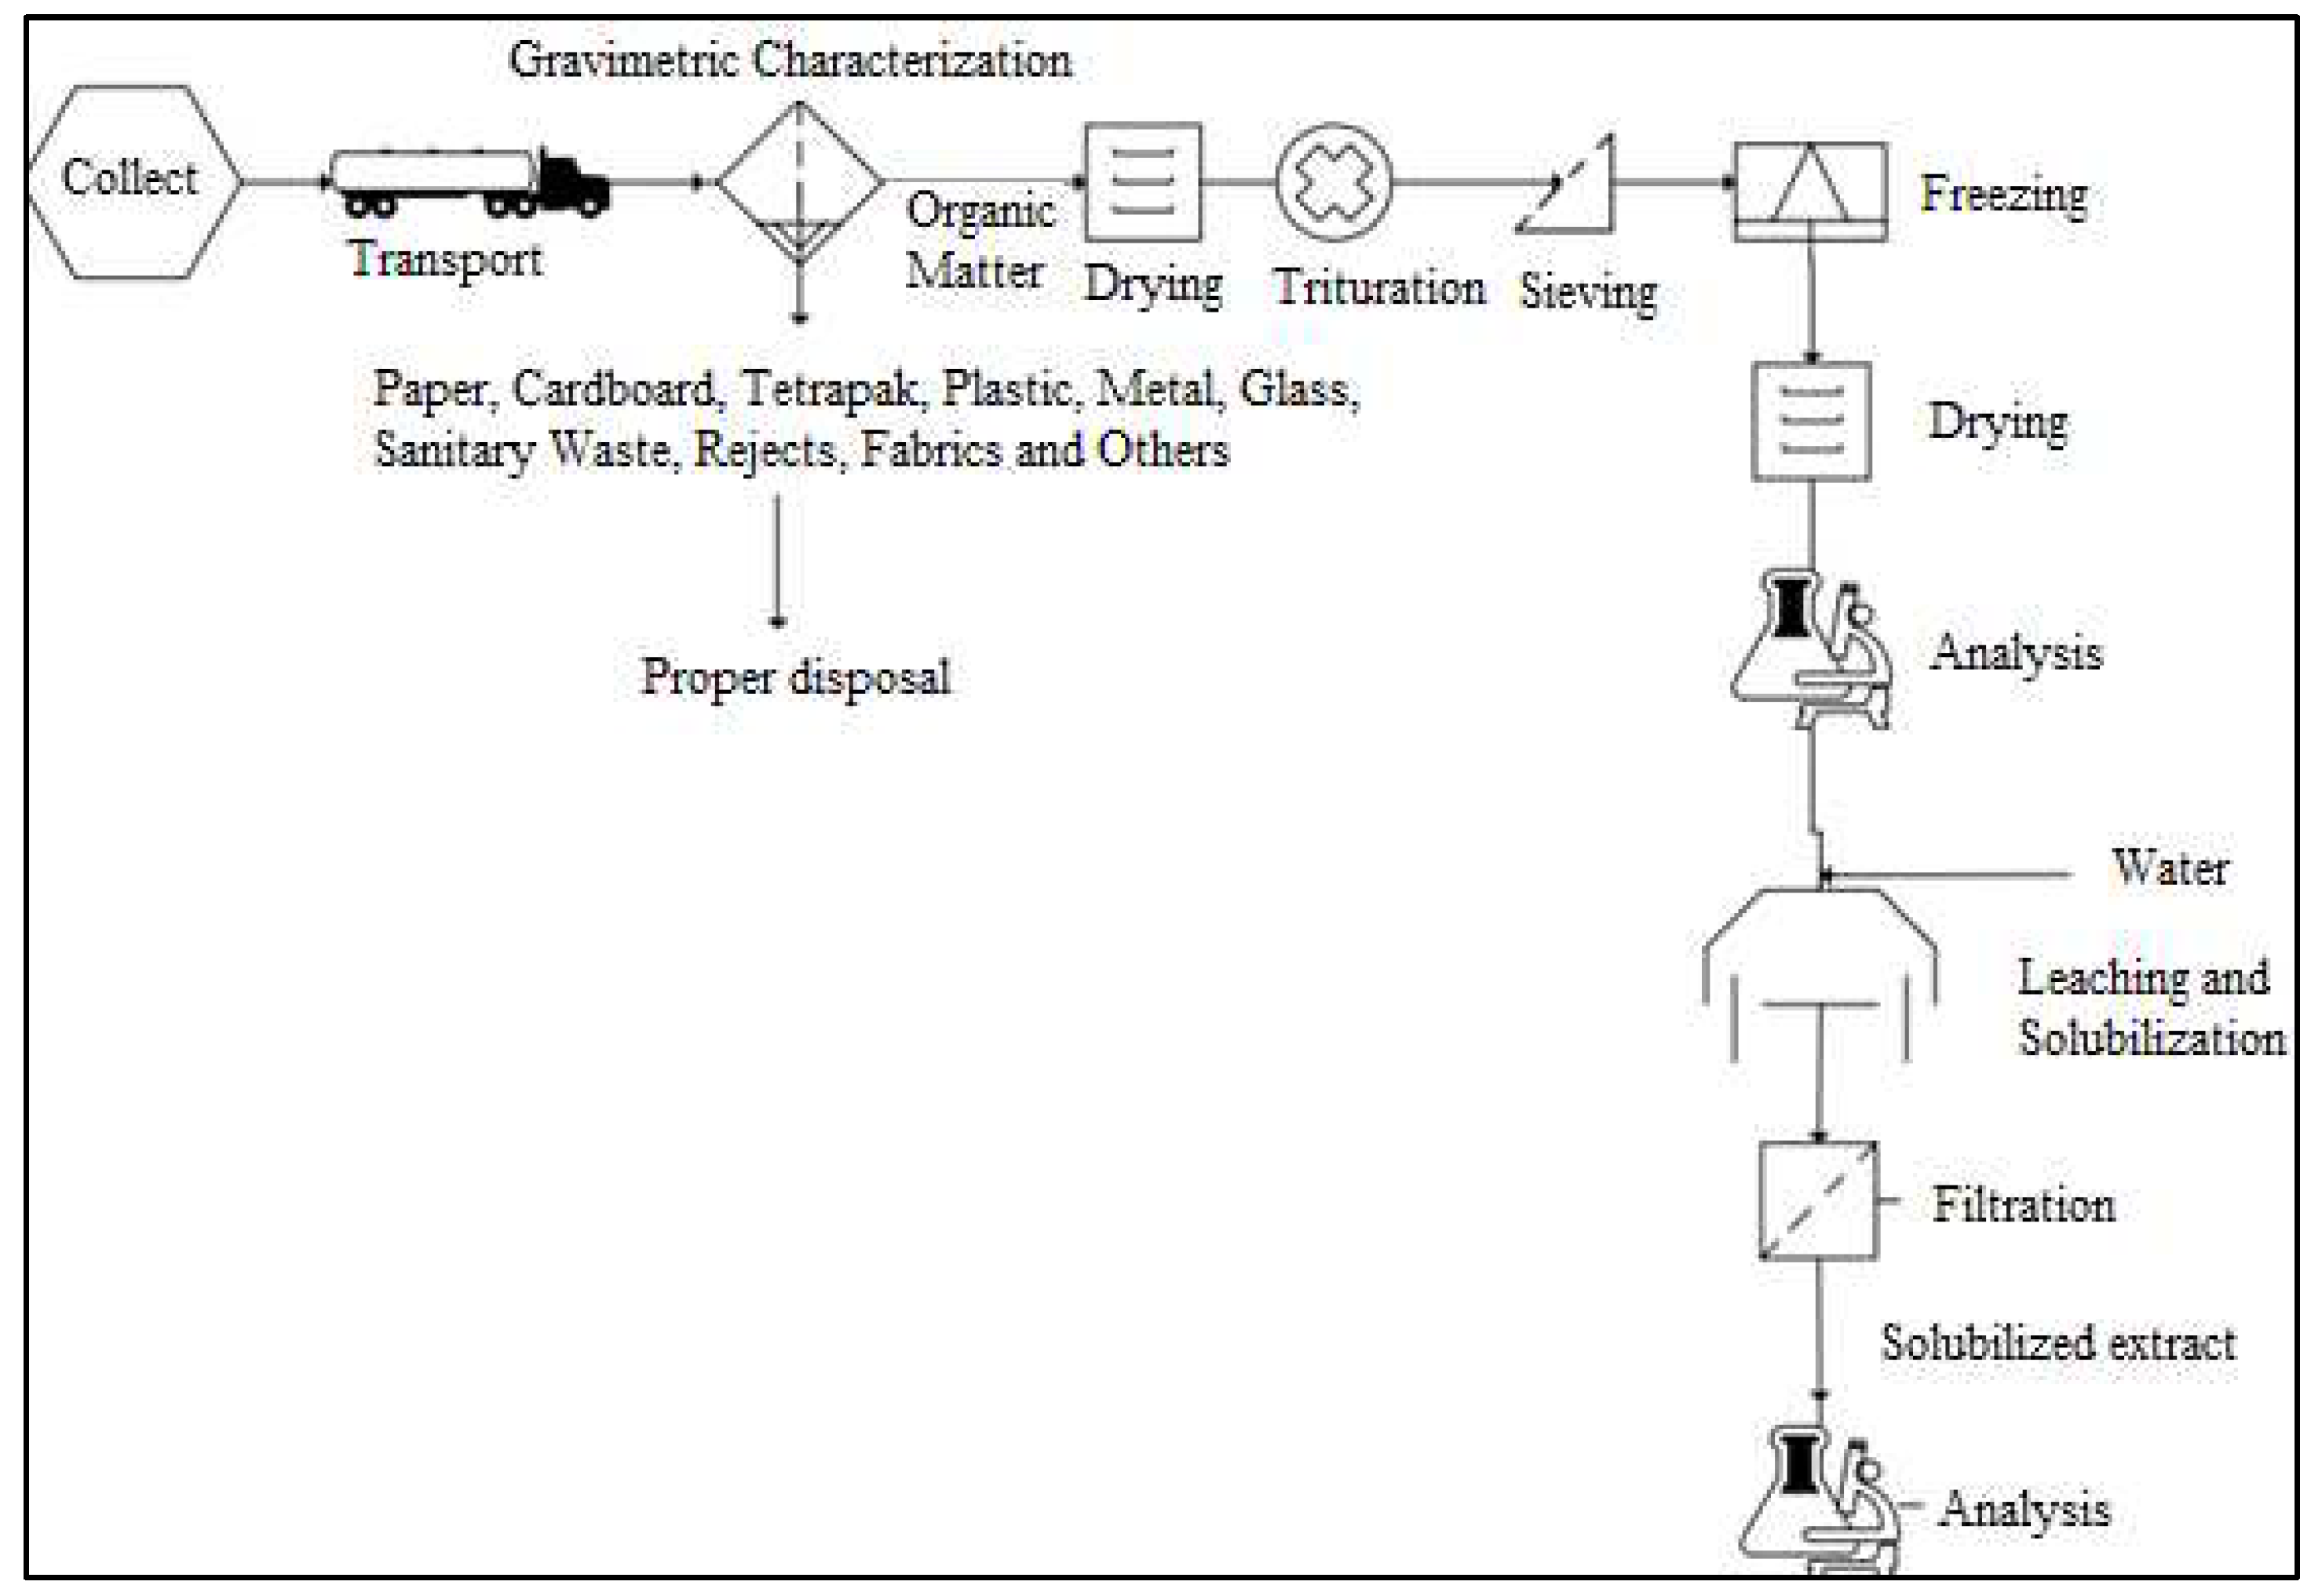
Figure 12.
Comparison between the Hp values raised by other authors and the pH values obtained in the research.
Figure 12.
Comparison between the Hp values raised by other authors and the pH values obtained in the research.
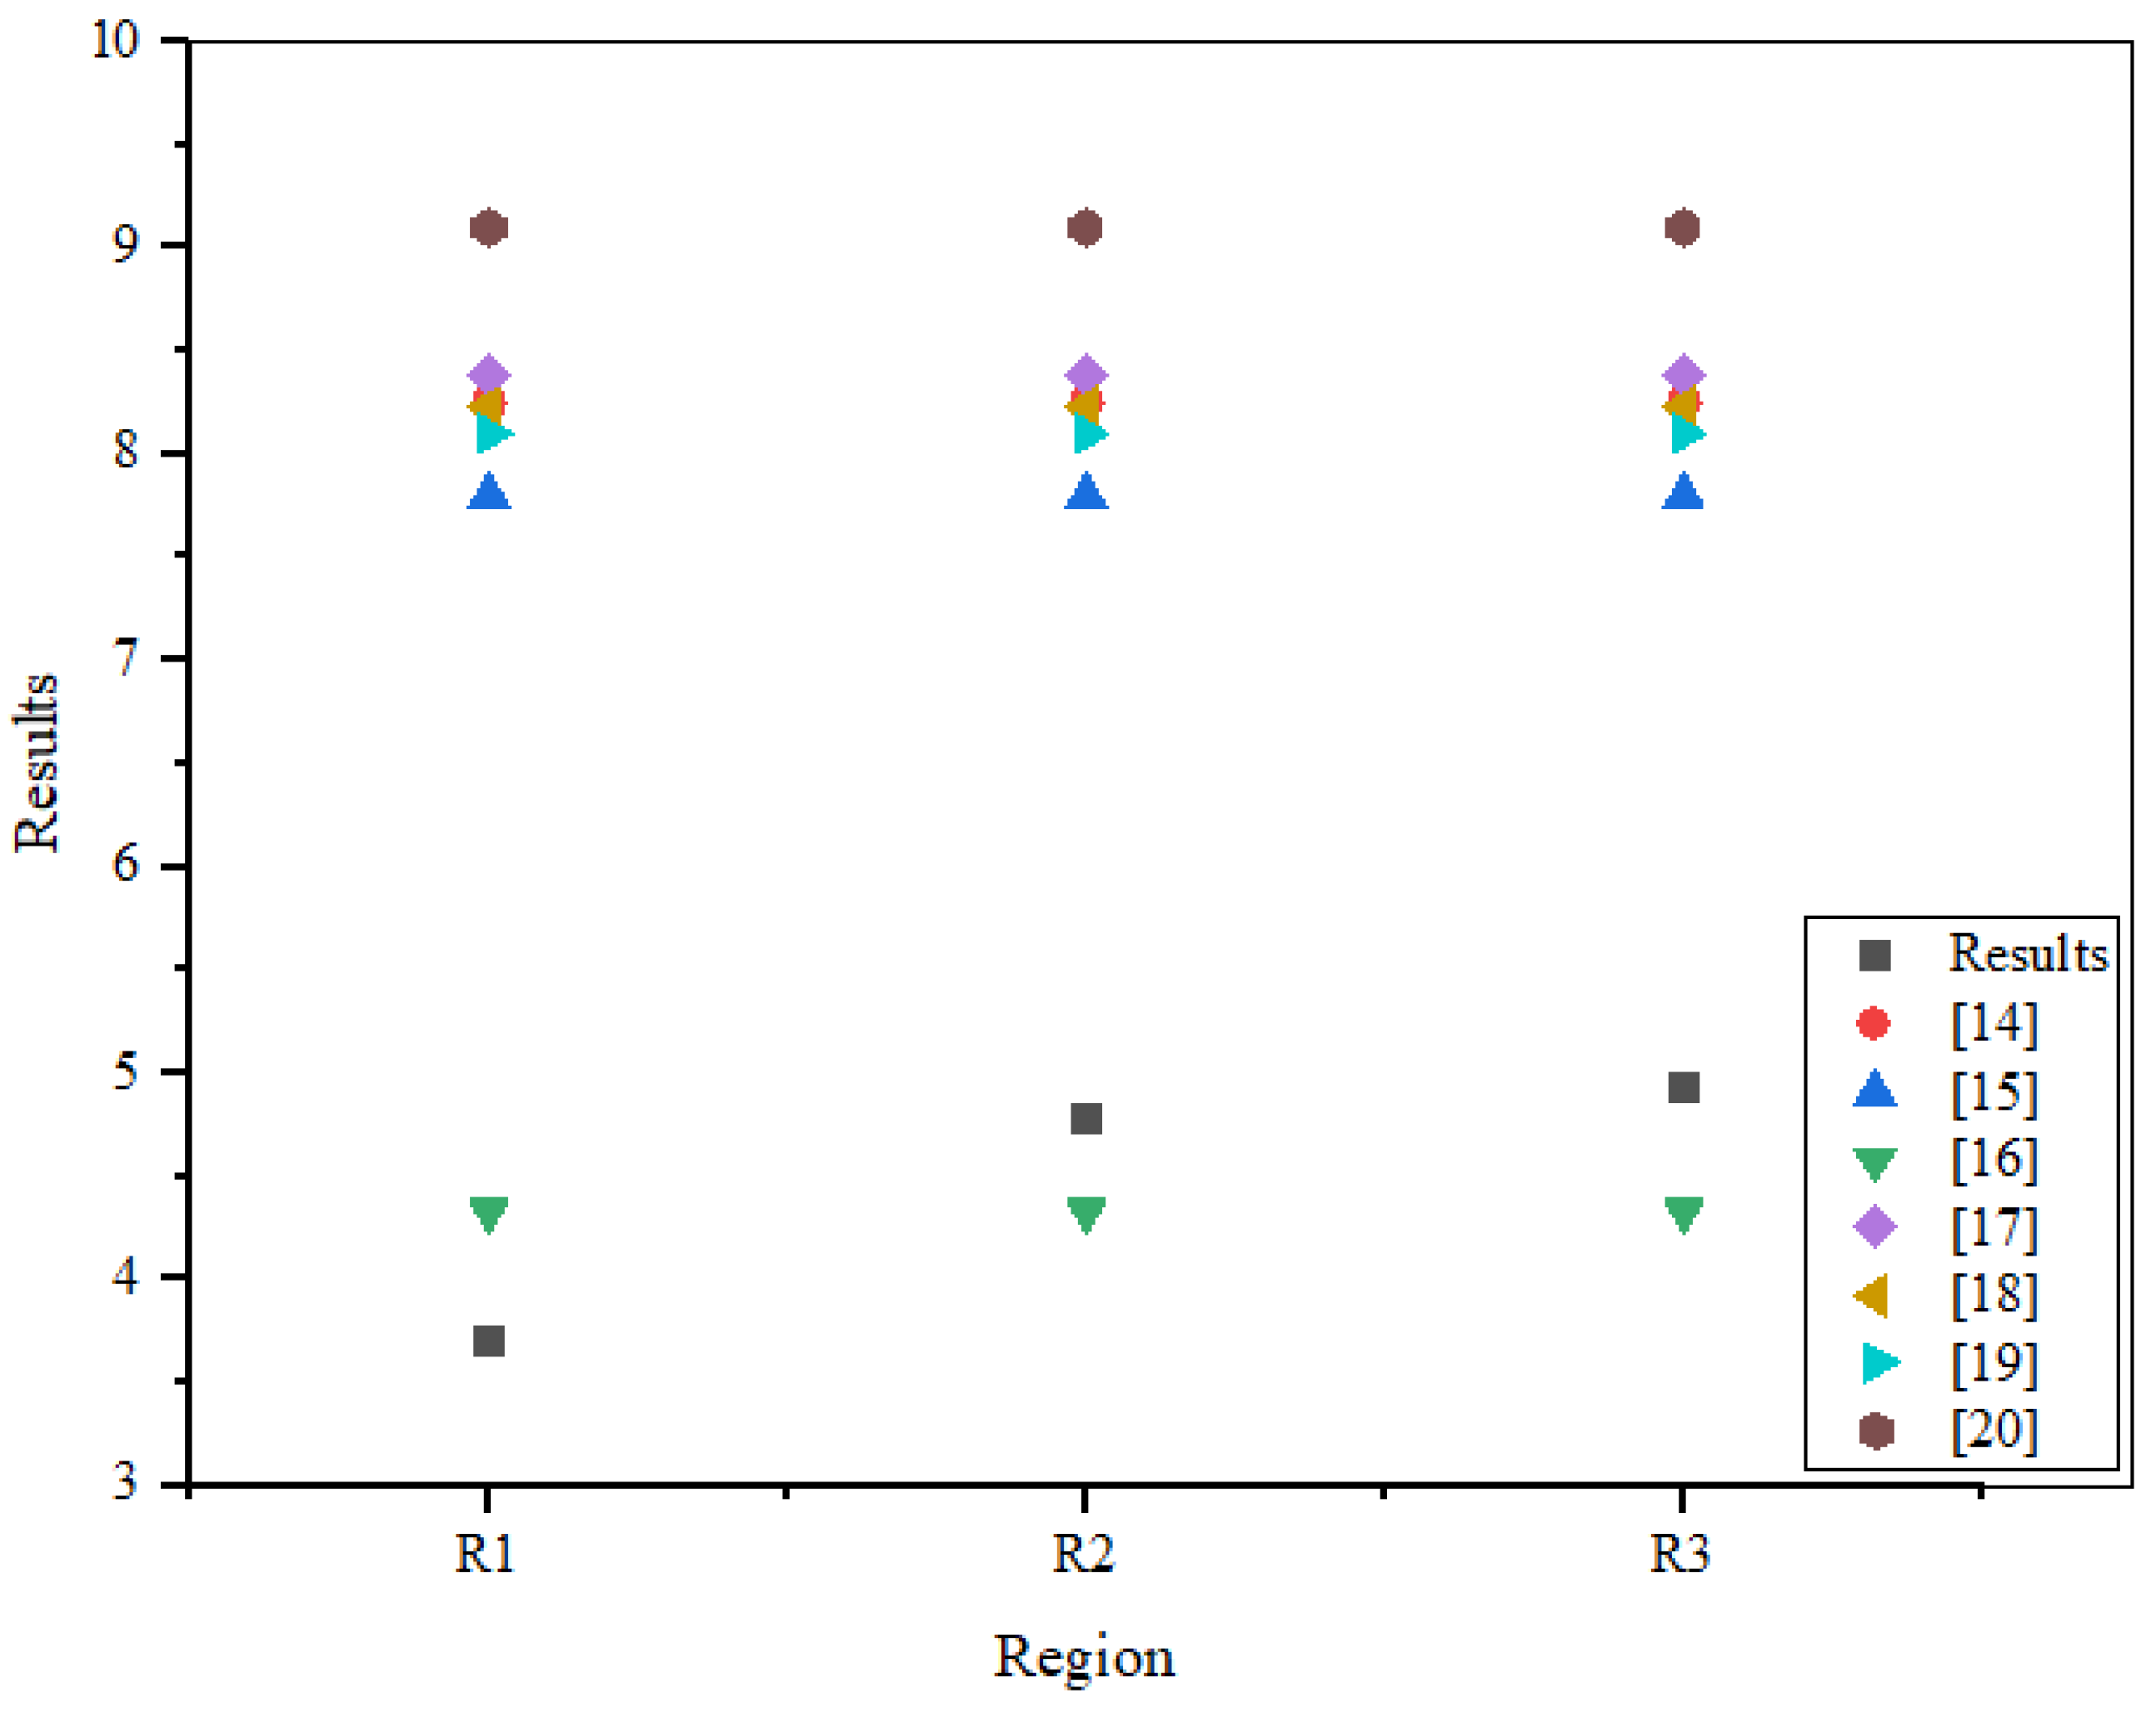
Figure 13.
Comparison between the values of solids raised by other authors and the values obtained in the research.
Figure 13.
Comparison between the values of solids raised by other authors and the values obtained in the research.
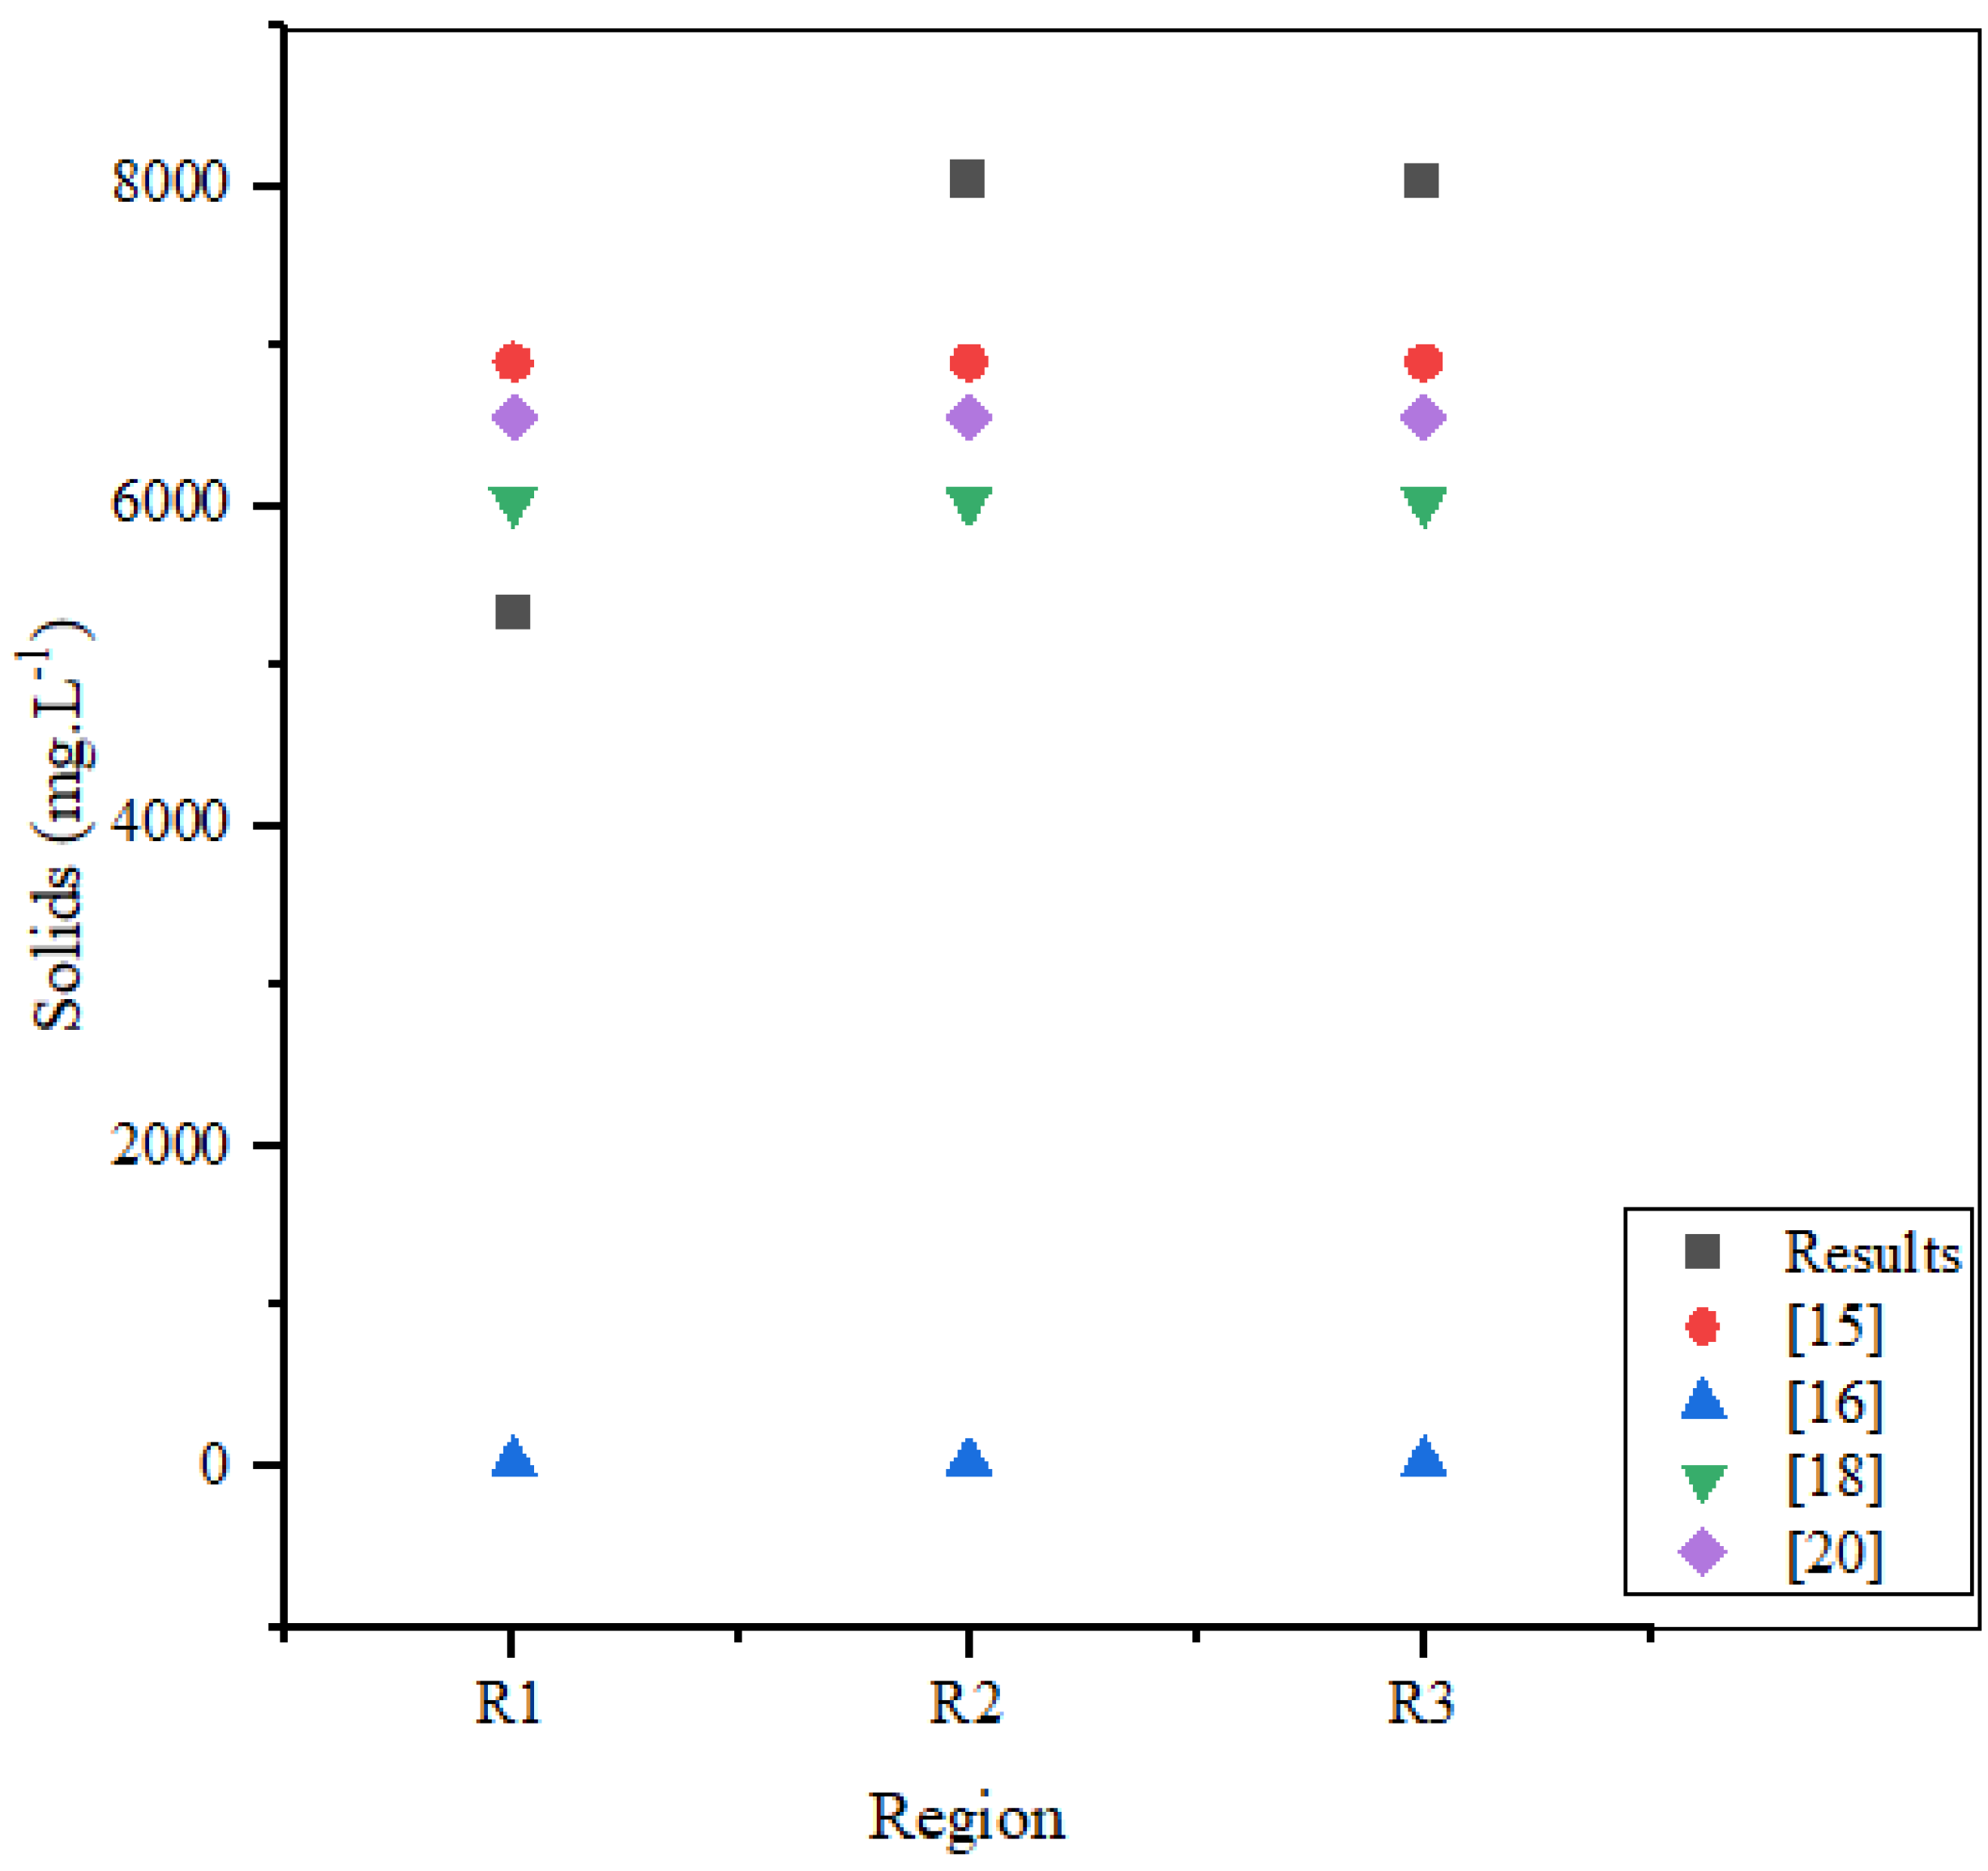
Table 5.
Results of the gravimetric characterization for the nine sectors, in relation to the percentage of the collected mass of waste, collected in the municipalities of Belém and Ananindeua, state of Pará, between 11/04/2021 and 05/13/2022.
Table 5.
Results of the gravimetric characterization for the nine sectors, in relation to the percentage of the collected mass of waste, collected in the municipalities of Belém and Ananindeua, state of Pará, between 11/04/2021 and 05/13/2022.
| Class of MHSW | Sectors | ||||||||
|---|---|---|---|---|---|---|---|---|---|
| S1 (%) | S2 (%) | S3 (%) | S4 (%) | S5 (%) | S6 (%) | S7 (%) | S8 (%) | S9 (%) | |
| Paper | 1.24 | 2.30 | 6.38 | 6.13 | 5.01 | 1.67 | 4.70 | 6.45 | 11.95 |
| Cardboard | 2.26 | 3.11 | 1.87 | 2.63 | 4.82 | 2.66 | 5.39 | 3.17 | 2.90 |
| Tetrapak | 0.31 | 0.68 | 0.48 | 0.34 | 0.63 | 0.99 | 0.92 | 0.87 | 3.25 |
| Hard Plastic | 3.72 | 3.29 | 3.98 | 2.25 | 4.10 | 3.25 | 4.53 | 3.37 | 3.70 |
| Soft Plastic | 7.96 | 11.69 | 9.50 | 10.15 | 8.44 | 8.17 | 10.66 | 15.25 | 7.90 |
| Metal | 2.03 | 2.39 | 1.39 | 1.68 | 3.09 | 2.35 | 2.58 | 1.20 | 1.25 |
| Organic Metter | 61.12 | 54.15 | 60.43 | 49.45 | 53.71 | 57.61 | 54.33 | 54.79 | 54.55 |
| Glass | 2.87 | 4.29 | 0.53 | 0.00 | 0.43 | 2.93 | 0.63 | 1.39 | 3.65 |
| Sanitary Waste | 16.67 | 13.00 | 15.44 | 20.34 | 12.78 | 18.78 | 12.72 | 10.34 | 8.25 |
| Fabrics | 1.81 | 5.10 | - | 1.87 | 6.17 | 1.58 | 3.55 | 3.17 | 2.60 |
| Waste | - | - | - | 5.17 | 0.82 | - | - | - | - |
| Total | 100 | 100 | 100 | 100 | 100 | 100 | 100 | 100 | 100 |
Table 6.
Mean, standard deviation, median, variance, maximum and minimum values of percentages of waste fractions collected in collection campaigns and gravimetric characterization results.
Table 6.
Mean, standard deviation, median, variance, maximum and minimum values of percentages of waste fractions collected in collection campaigns and gravimetric characterization results.
| Class of MHSW | Mean±SD | Median | Variance | Maximum | Minimum |
|---|---|---|---|---|---|
| Paper | 5,09 ± 3,28 | 5,01 | 10,76 | 11,95 | 1,24 |
| Cardboard | 3,20 ± 1,16 | 2,90 | 1,35 | 5,39 | 1,87 |
| Tetrapak | 0,94 ± 0,90 | 0,68 | 0,81 | 3,25 | 0,31 |
| Hard Plastic | 3,58 ± 0,65 | 3,70 | 0,42 | 4,53 | 2,25 |
| Soft Plastic | 9,97 ± 2,38 | 9,50 | 5,68 | 15,25 | 7,90 |
| Metal | 2,00 ± 0,66 | 2,03 | 0,43 | 3,09 | 1,20 |
| Organic Metter | 55,57 ± 3,62 | 54,55 | 13,09 | 61,12 | 49,45 |
| Glass | 1,86 ± 1,59 | 1,39 | 2,53 | 4,29 | 0,00 |
| Sanitary Waste | 14,26 ± 3,91 | 13,00 | 15,29 | 20,34 | 8,25 |
| Fabrics | 3,23 ± 1,66 | 2,89 | 2,75 | 6,17 | 1,58 |
| Waste | 3,00 ± 3,08 | 3,00 | 9,46 | 5,17 | 0,82 |
Table 8.
Turbidity, Apparent Color, True Color, Total Hardness, Calcium Hardness and Magnesium Hardness values obtained in laboratory analyses.
Table 8.
Turbidity, Apparent Color, True Color, Total Hardness, Calcium Hardness and Magnesium Hardness values obtained in laboratory analyses.
| Region | Turbidity (TU) | Appparent Color (CU) | True Color (CU) | Total Hardness (mg.L-1) | Calcium Hardness (mg.L-1) | Magnesium Hardness (mg.L-1) |
|---|---|---|---|---|---|---|
| R1 | 1072.00 | 8500.00 | 6000.00 | 371.00 | 207.00 | 164.00 |
| R2 | 791.00 | 12500.00 | 9000.00 | 234.00 | < 0.05 | 234.00 |
| R3 | 1733.00 | 12000.00 | 14000.00 | 255.00 | < 0.05 | 235.00 |
Table 11.
Verification of compliance of the analyzed parameters of the solubilized extract of Region 1 according to the Brazilian environmental and public health agencies.
Table 11.
Verification of compliance of the analyzed parameters of the solubilized extract of Region 1 according to the Brazilian environmental and public health agencies.
| Parameter | MS/GM 888/2021 |
CONAMA 357/2005 |
Parameter | MS/GM 888/2021 | CONAMA 357/2005 |
|---|---|---|---|---|---|
| Hydrogenionic Potential | No | No | Organic Nitrogen | - | - |
| Turbidity | No | No | Ammoniacal nitrogen | - | No |
| Apparent Color | No | - | Nitrite | Yes | Yes |
| True Color | - | No | Nitrate | Yes | Yes |
| Electric Conductivity | - | - | Total Phosphorus | - | No |
| Total Dissolved Solids | No | No | Reactive Phosphorus | - | - |
| Total Alkalinity | - | - | Hydrolysable Phosphorus | - | - |
| Free CO2 | - | - | Condensable Phosphorus | - | - |
| Chloride | Yes | Yes | Organic Phosphorus | - | - |
| Cyanide | - | Yes | Total Hardness | No | - |
| Fluoride | Yes | Yes | Magnesic Hardness | - | - |
| Sulfide | No | No | Calcium Hardness | - | - |
| Sulfate | Yes | Yes | Total COD | - | - |
| Total Nitrogen | - | No | COD Filtered | - | - |
| Total N. Kheldahl | - | - | - | - | - |
Table 12.
Verification of compliance of the analyzed parameters of the solubilized extract of Region 2 according to the Brazilian environmental and public health agencies.
Table 12.
Verification of compliance of the analyzed parameters of the solubilized extract of Region 2 according to the Brazilian environmental and public health agencies.
| Parameter | MS/GM 888/2021 |
CONAMA 357/2005 |
Parameter | MS/GM 888/2021 | CONAMA 357/2005 |
|---|---|---|---|---|---|
| Hydrogenionic Potential | No | No | Organic Nitrogen | - | - |
| Turbidity | No | No | Ammoniacal nitrogen | - | No |
| Apparent Color | No | - | Nitrite | Yes | Yes |
| True Color | - | No | Nitrate | No | No |
| Electric Conductivity | - | - | Total Phosphorus | - | No |
| Total Dissolved Solids | No | No | Reactive Phosphorus | - | - |
| Total Alkalinity | - | - | Hydrolysable Phosphorus | - | - |
| Free CO2 | - | - | Condensable Phosphorus | - | - |
| Chloride | No | No | Organic Phosphorus | - | - |
| Cyanide | - | Yes | Total Hardness | No | - |
| Fluoride | Yes | Yes | Magnesic Hardness | - | - |
| Sulfide | No | No | Calcium Hardness | - | - |
| Sulfate | Yes | Yes | Total COD | - | - |
| Total Nitrogen | - | No | COD Filtered | - | - |
| Total N. Kheldahl | - | - | - | - | - |
Table 13.
Verification of compliance of the analyzed parameters of the solubilized extract of Region 2 according to the Brazilian environmental and public health agencies.
Table 13.
Verification of compliance of the analyzed parameters of the solubilized extract of Region 2 according to the Brazilian environmental and public health agencies.
| Parameter | MS/GM 888/2021 |
CONAMA 357/2005 |
Parameter | MS/GM 888/2021 | CONAMA 357/2005 |
|---|---|---|---|---|---|
| Hydrogenionic Potential | No | No | Organic Nitrogen | - | - |
| Turbidity | No | No | Ammoniacal nitrogen | - | No |
| Apparent Color | No | - | Nitrite | Yes | Yes |
| True Color | - | No | Nitrate | No | No |
| Electric Conductivity | - | - | Total Phosphorus | - | No |
| Total Dissolved Solids | No | No | Reactive Phosphorus | - | - |
| Total Alkalinity | - | - | Hydrolysable Phosphorus | - | - |
| Free CO2 | - | - | Condensable Phosphorus | - | - |
| Chloride | Yes | Yes | Organic Phosphorus | - | - |
| Cyanide | - | Yes | Total Hardness | No | - |
| Fluoride | Yes | Yes | Magnesic Hardness | - | - |
| Sulfide | No | No | Calcium Hardness | - | - |
| Sulfate | Yes | Yes | Total COD | - | - |
| Total Nitrogen | - | No | COD Filtered | - | - |
| Total N. Kheldahl | - | - | - | - | - |
Disclaimer/Publisher’s Note: The statements, opinions and data contained in all publications are solely those of the individual author(s) and contributor(s) and not of MDPI and/or the editor(s). MDPI and/or the editor(s) disclaim responsibility for any injury to people or property resulting from any ideas, methods, instructions or products referred to in the content. |
© 2023 by the authors. Licensee MDPI, Basel, Switzerland. This article is an open access article distributed under the terms and conditions of the Creative Commons Attribution (CC BY) license (http://creativecommons.org/licenses/by/4.0/).
Copyright: This open access article is published under a Creative Commons CC BY 4.0 license, which permit the free download, distribution, and reuse, provided that the author and preprint are cited in any reuse.


