
Submitted:
24 June 2023
Posted:
25 June 2023
You are already at the latest version
Abstract
In this article, I estimate the value of “Individual Using Internet”-IUI in the context of Environmental, Social and Governance-ESG database of the World Bank. I use data from 193 countries for the period 2011-2020. I found that among others the value of IUI is positively associated to “Methane Emissions” and “People Using Safely Managed Sanitation Services” and negatively associated among others to “Fossil Fuel Energy Consumption” and “Renewable Energy Consumption”. I apply the k-Means algorithm for the clusterization optimized with the Elbow Method and we find the presence of three clusters. Finally, I confront eight machine-learning algorithms to predict the future value of IUI. I found that the best predictive algorithm is Linear Regression and that the value of IUI is expected to decrease on average of 0.30% for the analysed countries.
Keywords:
Analysis of Collective Decision-Making
; General
; Political Processes: Rent-Seeking
; Lobbying
; Elections
; Legislatures
; and Voting Behaviour
; Bureaucracy
; Administrative Processes in Public Organizations
; Corruption
; Positive Analysis of Policy Formulation
; Implementation
1. Introduction-Research Question
In the following analysis I consider the role of IUI in the context of ESG models. The data used refer to the World Bank's ESG dataset. Ideally, the use of the internet should lead to an increase in environmental sustainability, social inclusion, and governance capacity. However, it is not obvious that the use of the internet, i.e. digitalization, can be a tool to create greater value for the ESG model. In fact, the internet, and digitization in general, may also be able to increase pollution, reduce social inclusion and worsen governance by fomenting the radicalization of political and institutional conflict.
The use of the Internet depends on the social and cultural capacity of the population. If the cultural level of the population is low, then the internet is likely to become a tool against the application of ESG models. It is therefore necessary to carefully investigate the role of the internet in the ESG context to verify the limits and compatibility of digitization with the modeling of environmental, social and governance sustainability.
The article proceeds as follows: the second paragraph presents the literature analysis, the third paragraph contains the econometric model, the fourth paragraph shows the results of the clustering with k-Means algorithm, the fifth paragraph compares eight machine learning algorithms for the prediction, the sixth paragraph concludes.
2. Literature Review
A brief analysis of the economic literature concerning the role of internet use is presented below. The analysis is not meant to be exhaustive. The articles reported are in fact useful simply to introduce the topic for the purposes of the analysis.
IUI, cyber-security and law. The use of the internet increases citizens' risk of being subjected to cyber-attacks. This risk requires the presence of a set of digital police policies and anti-hacker tools that can be used by users to protect themselves from cyber-attacks. The increase in internet usage in Indonesia has created many problems in terms of cyber-security [1]. Furthermore, the use of the internet tends to reduce the informal economy by creating devices that can be measured to reduce the fraudulent behavior of citizens, for example in the case of paying taxes. There is a negative relationship between IUI and tax evasion [2].
IUI and international economics. The Internet also has an impact on the development of international trade. In fact, the use of the Internet through e-commerce could have macro-economic and long-term effects in both developed and developing economies. The distribution of internet among the population has a positive effect on the complexity of exports [3]. The growth in IUI is positively associated to an increase in imports to Nigeria [4]. Less than 10% of developing countries has promoted the application of internet technologies to promote digitalization [5]. There is a negative relationship between IUI and inflation in ASEAN-5 countries [6]. There is a positive relationship between economic growth and internet usage in Asian countries [7]. The increase of IUI is positively associated to economic growth in African Countries [8].
IUI and equality. The use of the Internet should improve the conditions of equality of opportunity among people regardless of gender elements and geographical location. In fact, the internet tends to be ideally inclusive and offers learning, emancipation, and business opportunities also to minorities or marginalized social groups. However, the literature tends to be against this ideal inclusiveness of the internet showing that the internet can worsen the condition of some groups at a socio-economic and geographical level. The growth in the level of internet users does not reduce digital divide in Spain [9]. The proclivity to use internet is greater in Northern Europe than in Southern Europe [10].
IUI and entrepreneurship. The Internet tends to have a positive impact in terms of entrepreneurial development. In fact, the presence of the internet can offer new business opportunities. However, business opportunities are above all linked to a type of entrepreneurship of the Necessity-driven type. The positive effect of the internet on entrepreneurship also depends on the ability to better evaluate business opportunities, identifying new models and new markets. The increase in the level of IUI has a positive effect on Total Entrepreneurial Activities-TEA [11]. The usage of internet is positively related to entrepreneurship in China [12].
IUI and learning. The Internet can increase the level of cultural and professional training of the population. This learning activity can be made available to both students and the general population by promoting lifelong learning systems. The promotion of internet has a positive impact in creating more learning opportunity for students [13]. The level of IUI for people over 65 in the countries of Visegrad is lower than the correspondent value in EU-28 [14].
Miscellaneous. The use of the internet also has general effects on the creation of political awareness, on the digitization of commercial activities. There is a negative relationship between IUI and political ignorance in the long run in Germany [15].There is a negative relationship between IUI and digitalization in China, Europe, and United States [16]. There is a positive relationship between IUI and internet banking in Czech Republic [17].
3. The Econometric Model for the Estimation of the Value of Internet Using Individuals
I have used various econometric techniques to estimate the future value of IUI. Specifically, we have used Panel Data with Fixed Effects, Panel Data with Random Effects, Pooled OLS. I have used data from the Environmental, Social and Governance-ESG database of the World Bank for 193 countries in the period 2011-2020. I have estimated the following formula:
Where and .
We have found that the level of IUI is positively associated to:
- ME: Methane emissions are those stemming from human activities such as agriculture and from industrial methane production. There is a positive relationship between the ME value and the IUI value. That is, the countries that have a higher level of IUI also have a higher level of ME. Specifically we can note that the countries that have high levels of IUI also have high levels of ME such as for example Granada with a level of UI equal to 77.76 and ME equal to 16.60, Bahrain with 100 and 11.65, Barbados with 85.82 and 8.39, Qatar with 100 and 7.64, New Zealand with 95.91 and 6.53, Uruguay with 90.07 and 6.05, Mongolia with 84.33 and 5.81, Kuwait with 99.7 and 5.56. This relationship shows that the level of ME and the level of IUI growth together.
- PUSS: The percentage of people using improved sanitation facilities that are not shared with other households and where excreta is safely disposed of on-site or transported and processed off-site. Improved sanitation includes flush/flush of piped sewer systems, septic tanks, or pit latrines: vented improved pit latrines, composite toilets, or slab pit latrines. There is a positive relationship between the PUSS value and the IUI value. Many of the countries that have high levels of IUI also have high levels of PUSS such as for example: Bahrain with a value of 100 IUI and 91.23 PUSS, Qatar with 100 and 97.2, Saudi Arabia with a value of 100 and 59.11, United Arab Emirates with 100 and 99.22, Kuwait with 99.7 and 100, Iceland with 99.68 and 83.68, Norway with 99 and 65.38, Denmark with 98.86 and 91, 88, Luxembourg with 98.66 and 96.78.
- AE: Access to electricity is the percentage of population with access to electricity. Electrification data are collected from industry, national surveys and international sources. There is a positive relationship between the AE value and the IUI value. Countries that have high levels of AE also typically have high levels of IUI. For example Bahrain has a value of 100 in terms of AE and 100 in terms of IUI, Qatar 100 and 100, Saudi Arabia 100 and 100, United Arad Emirates with 100 and 100, Kuwait with a value of 99.7 and 100, Iceland with 99.68 and 100, Norway with 99 and 100, Denmark with 98.86 and 100, Luxembourg with 98.66 and 100, Brunei Darussalam with 98.08 and 100.
Figure 1.
Average value for econometric regressions with Panel Data with Random Effects, Fixed Effects, Pooled OLS.
Figure 1.
Average value for econometric regressions with Panel Data with Random Effects, Fixed Effects, Pooled OLS.
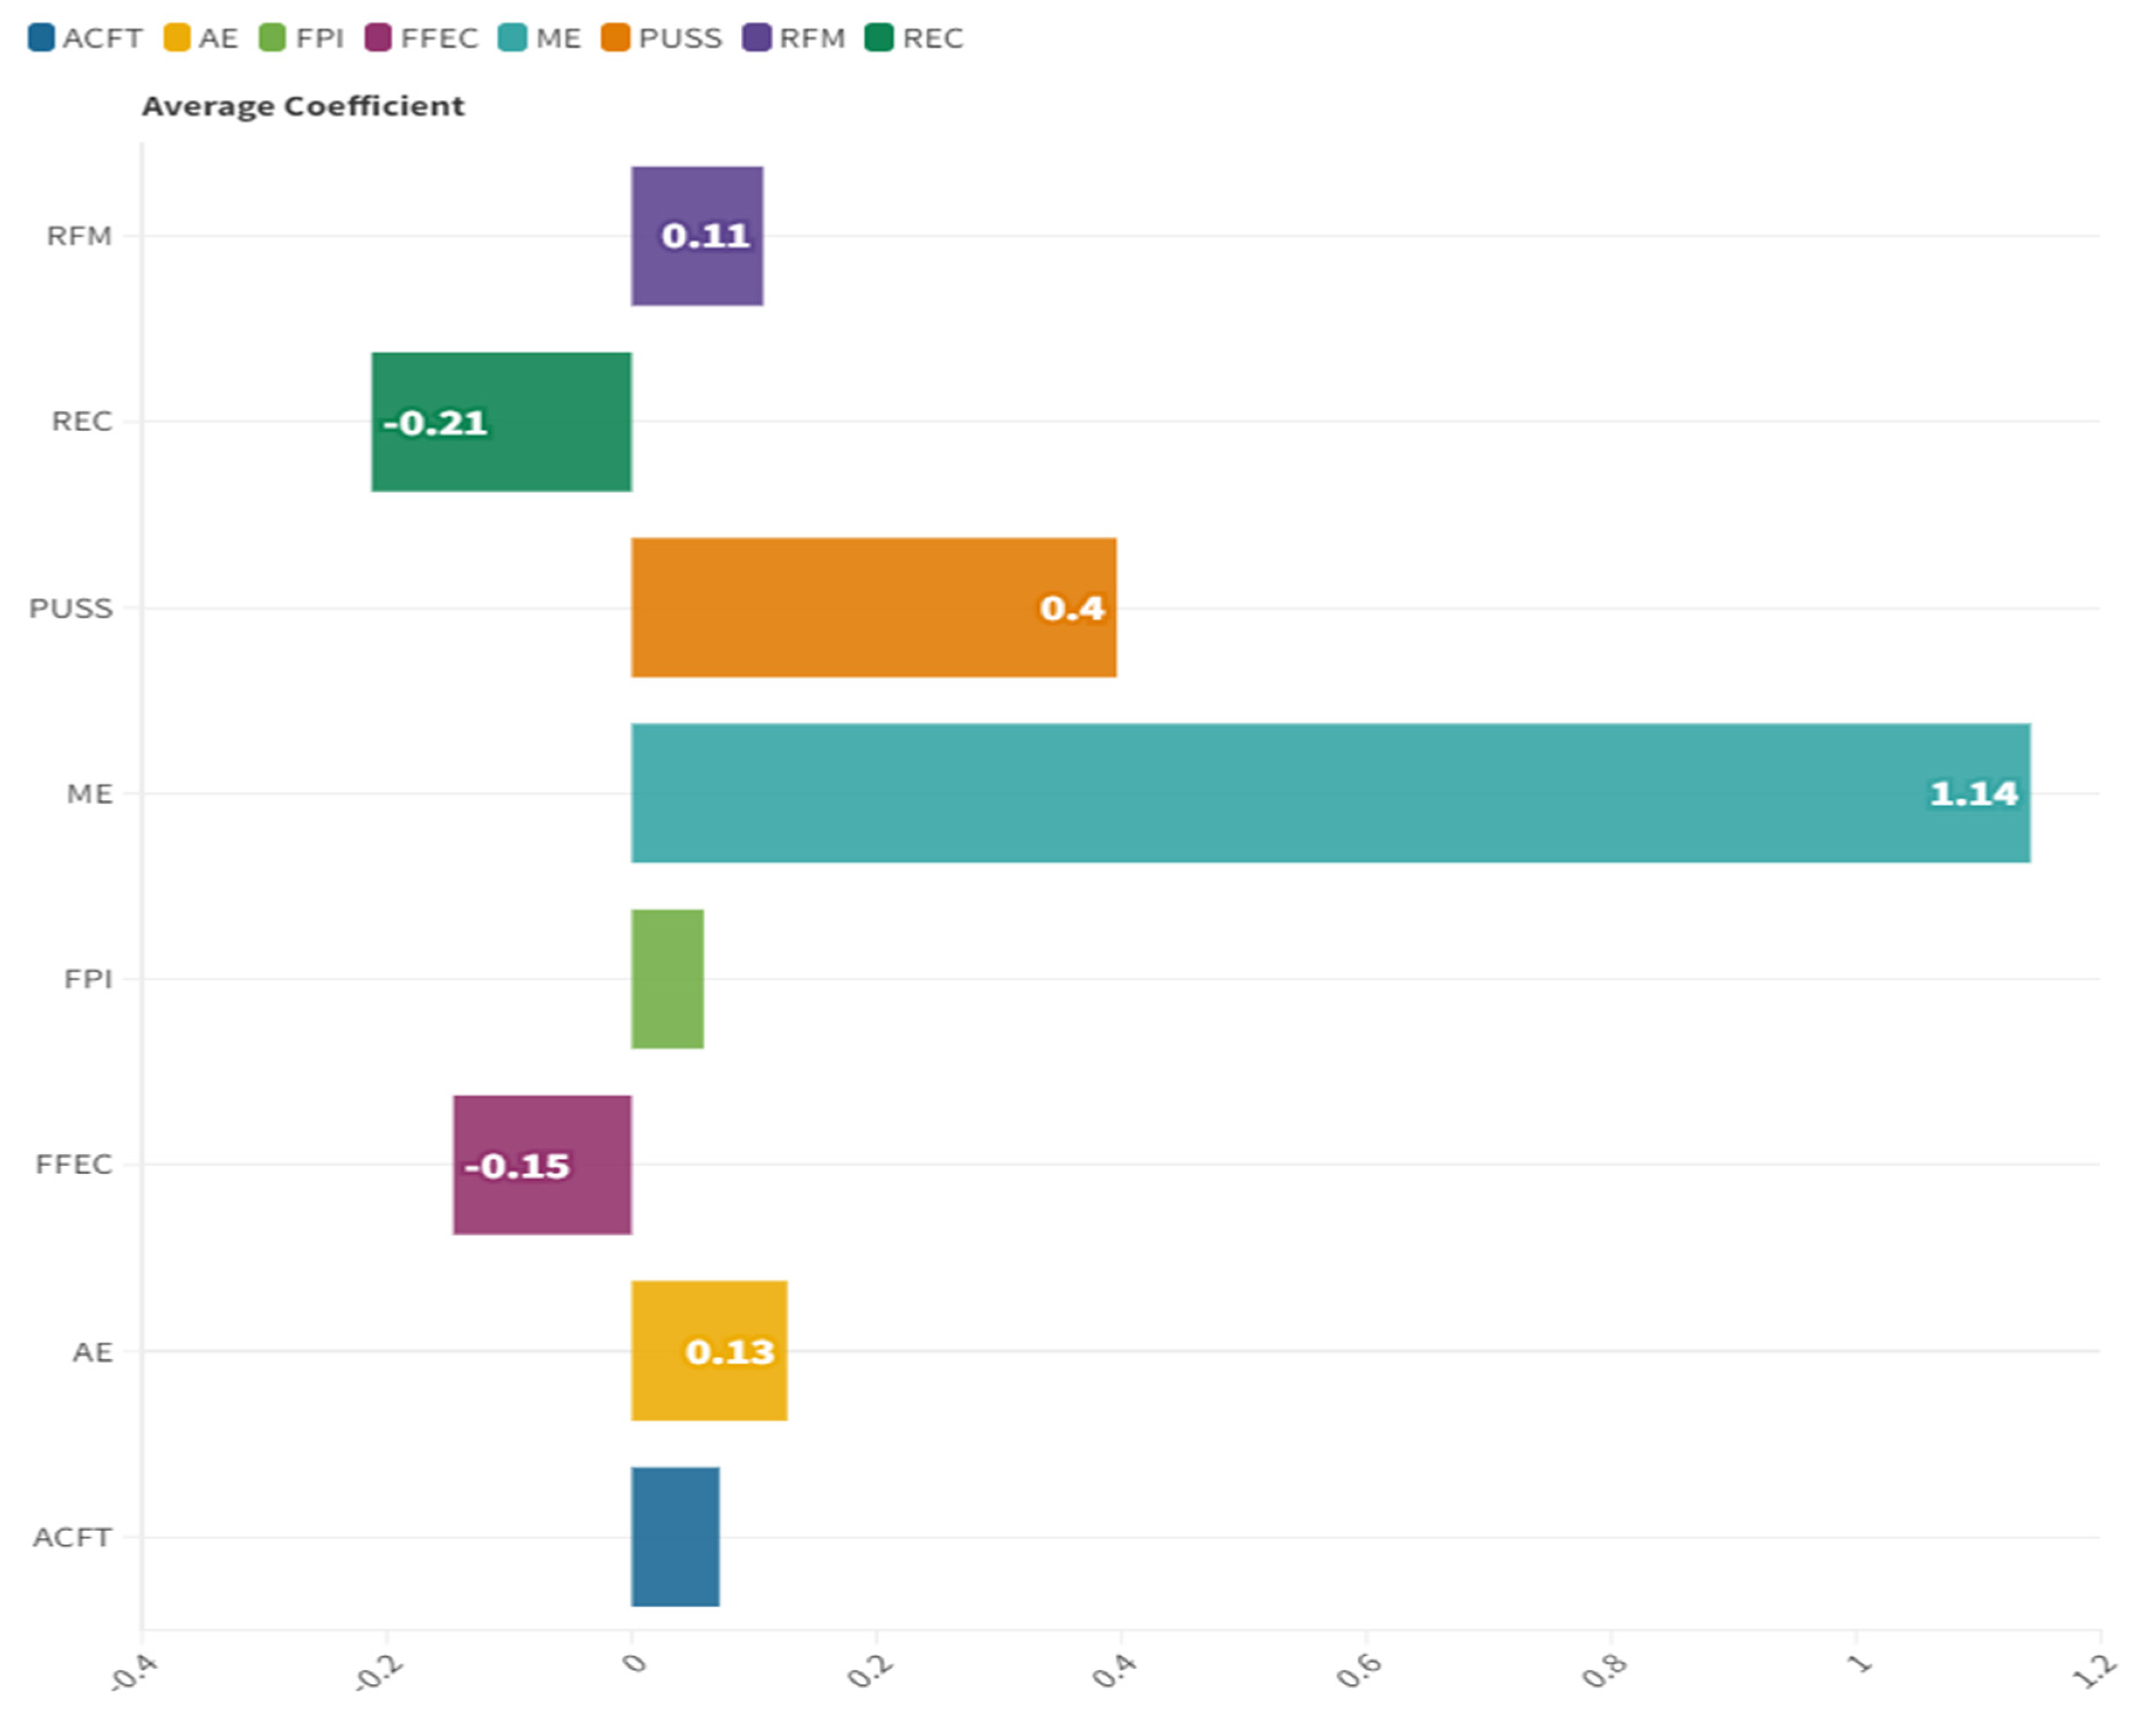
- RFM: Labour force participation rate is the proportion of the population ages 15 and older that is economically active: all people who supply labour for the production of goods and services during a specified period. Ratio of female to male labour force participation rate is calculated by dividing female labour force participation rate by male labour force participation rate and multiplying by 100. There is a positive relationship between the RFTM value and the IUI value. Many countries that have a high level of IUI also have a high level of RFTM. For example, Bahrain has an IUI value of 100 and an RMTF value of 51.15, Mozambique has an IUI value of 17.37 and an RFTM value of 99.30, Papua New Guinea with a value of 32.05 and 97.33, Norway with 99 and 96.48, Solomon Iceland with an amount of 36.13 and 96.30.
- ACFT: Access to clean fuels and technologies for cooking is the proportion of total population primarily using clean cooking fuels and technologies for cooking. Under WHO guidelines, kerosene is excluded from clean cooking fuels. There is a positive relationship between the ACFT value and the IUI value. Countries that generally have a high ACFT value also have a high IUI value. For example Andorra with 100 and 93.89, followed by Antigua and Barbuda with 100 and 95.66, followed by Australia with 100 and 96.24, Austria with a value of 100 and 92.52, and the Bahamas with a value from 100 to 94.29.
- FPI: food production index covers food crops that are considered edible and that contain nutrients. Coffee and tea are excluded because, although edible, they have no nutritional value. There is a positive relationship between the FPI value and the IUI value. Specifically, the countries that have greater use of the internet also have a higher level of food production. Specifically we can note that in the case of Senegal the FPI value is 177.74 while the IUI value is equal to an amount of 58.05, in Qatar the corresponding values are 162.02 and 100.00, in Arabia Saudi Arabia 158.96 and 100 in Djibouti 144.13 and 68.86, Oman 143.95 and 96.38, Oman 143.95 and 96.38, Malawi 141.74 and 24.40, Mozambique 139.77 and 17, 37, Zimbabwe 132.04 and 34.81, Sri Lanka with 130.31 and 66.68.
We also found that the level of IUI is negatively associated to:
- FFEC: Fossil fuels are non-renewable resources because they take millions of years to form and reserves are depleted much faster than new ones are created. In developing economies, growth in energy use is closely related to growth in modern sectors - industry, motorized transport and urban areas - but energy use also reflects climatic, geographical and economic factors (such as the relative price of energy). Energy use has grown rapidly in low- and middle-income economies, but high-income economies still use nearly five times as much energy on a per capita basis. Total energy consumption refers to the use of primary energy before processing it into other end-use fuels (such as electricity and refined petroleum products). Includes energy from renewable fuels and waste - solid biomass and animal products, biomass gases and liquids, and industrial and municipal waste. Biomass is any plant material used directly as fuel or converted into fuel, heat or electricity. There is a negative relationship between the FFEC value and the IUI value. Countries that have generally higher level of consumption in terms of FFEC also have lower levels of IUI.
- REC: is the share of renewable energy in total final energy consumption. There is a negative relationship between the REC value and the IUI value. In fact, countries that have high REC levels also have low IUI levels. For example Congo Dem. Rep. has a REC value equal to 96.24 and an IUI value equal to an amount of 22.90, Central African Republic has a value of 91.26 and 10.58, Uganda equal to an amount of 90.22 and 10.34, Gabon has a value of 89.88 and 71.74, Ethiopia with a value of 88.92 and 16.69, Liberia with 87.24 and 33.63, Guinea Bissau with 86 ,24 and 35.15, Tanzania with 85.22 and 31.63, Burundi with 84.77 and 5.80, Zambia 84.5 and 21.23, Madagascar with 82.77 and 19.73, Bhutan with 82, 27 and 85.63, Zimbabwe with 81.5 and 34.81.
| Synthesis of the main Econometric Results | |||||||||
| Random Effects | Fixed Effects | Pooled OLS | Average | ||||||
| A32 | Individuals using the Internet (% of population) | IUI | Coefficient | p-Value | Coefficient | p-Value | Coefficient | p-Value | |
| Const | 8,625750 | *** | 15,01890 | *** | 3,54718 | ** | 9,063943 | ||
| A1 | Access to clean fuels and technologies for cooking (% of population) | ACFT | 0,059552 | *** | 0,05106 | *** | 0,104497 | *** | 0,071703 |
| A2 | Access to electricity (% of population) | AE | 0,127424 | *** | 0,11932 | *** | 0,134299 | *** | 0,127014 |
| A21 | Food production index (2014-2016 = 100) | FPI | 0,053283 | *** | 0,03373 | * | 0,0891069 | *** | 0,058708 |
| A23 | Fossil fuel energy consumption (% of total) | FFEC | -0,148870 | *** | -0,15518 | *** | -0,133426 | *** | -0,145826 |
| A39 | Methane emissions (metric tons of CO2 equivalent per capita) | ME | 1,147750 | *** | 1,18922 | *** | 1,09063 | *** | 1,142533 |
| A45 | People using safely managed sanitation services (% of population) | PUSS | 0,455231 | *** | 0,31377 | *** | 0,420027 | *** | 0,396342 |
| A54 | Ratio of female to male labor force participation rate (%) (modeled ILO estimate) | RFM | 0,083456 | *** | 0,06875 | ** | 0,169803 | *** | 0,107337 |
| A57 | Renewable energy consumption (% of total final energy consumption) | REC | −0,174714 | *** | -0,09612 | *** | -0,32874 | *** | -0,212429 |
4. Clusterization with k-Means Algorithm Optimized with the Elbow Method
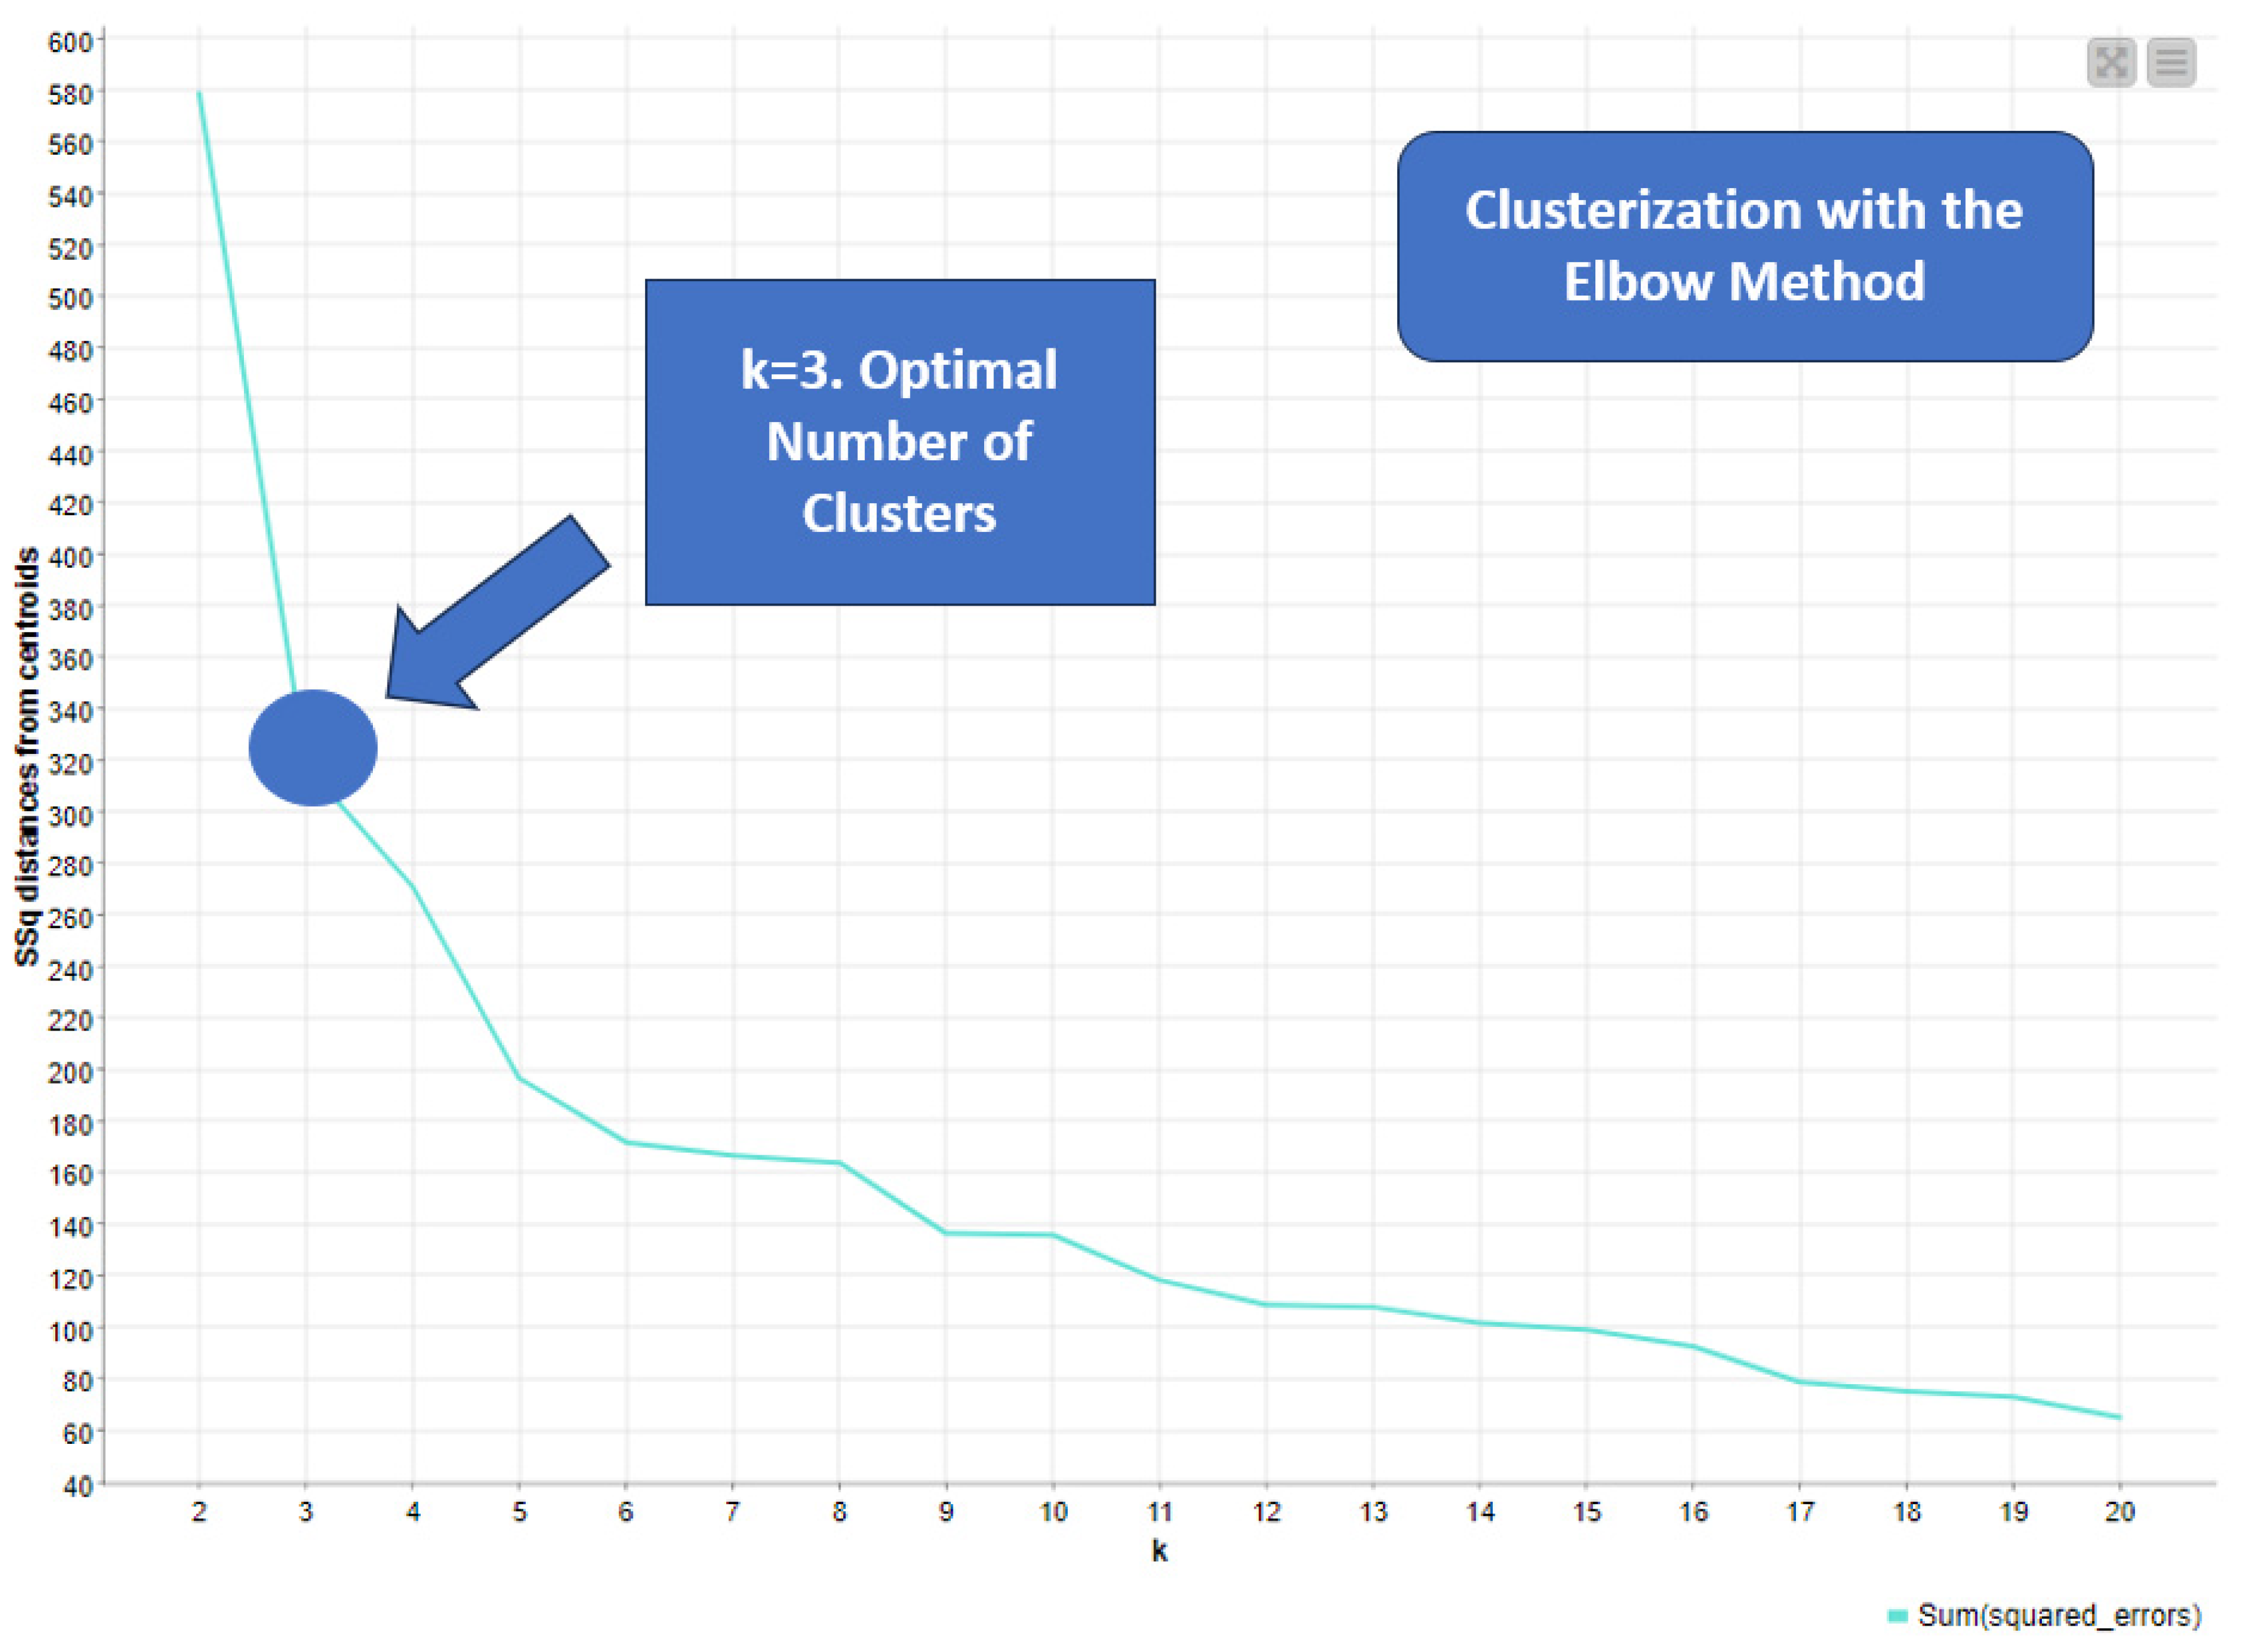
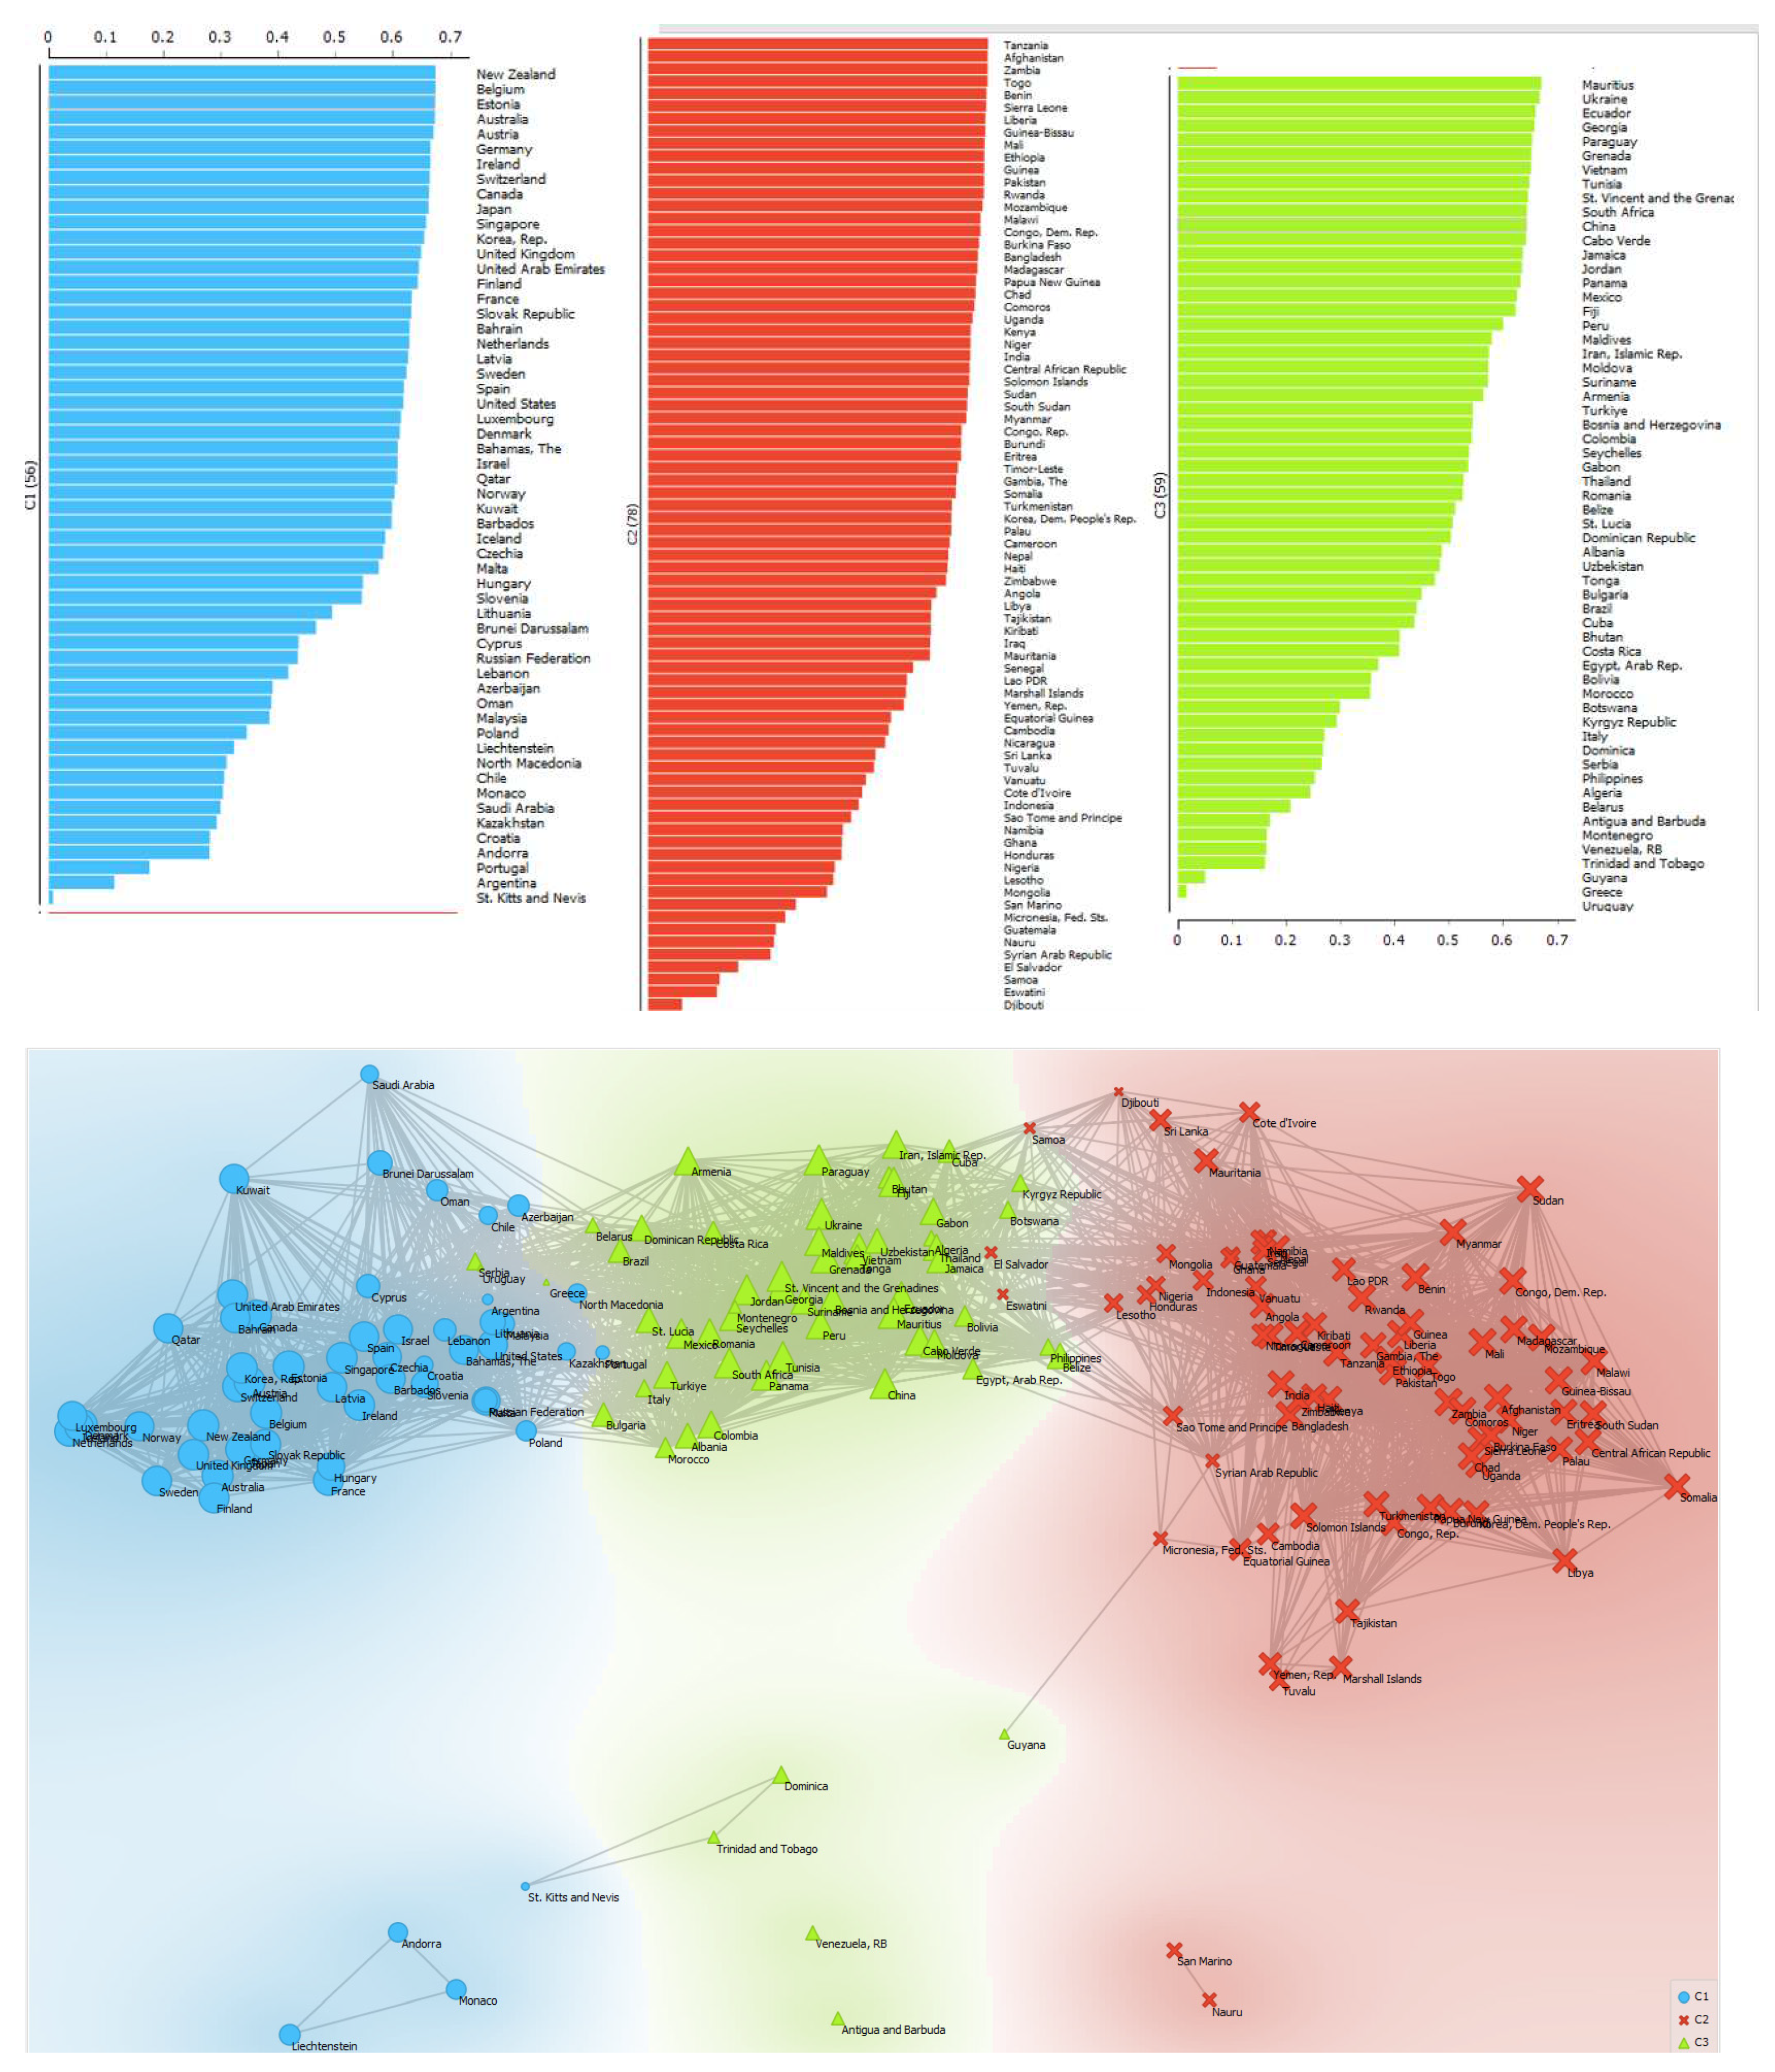
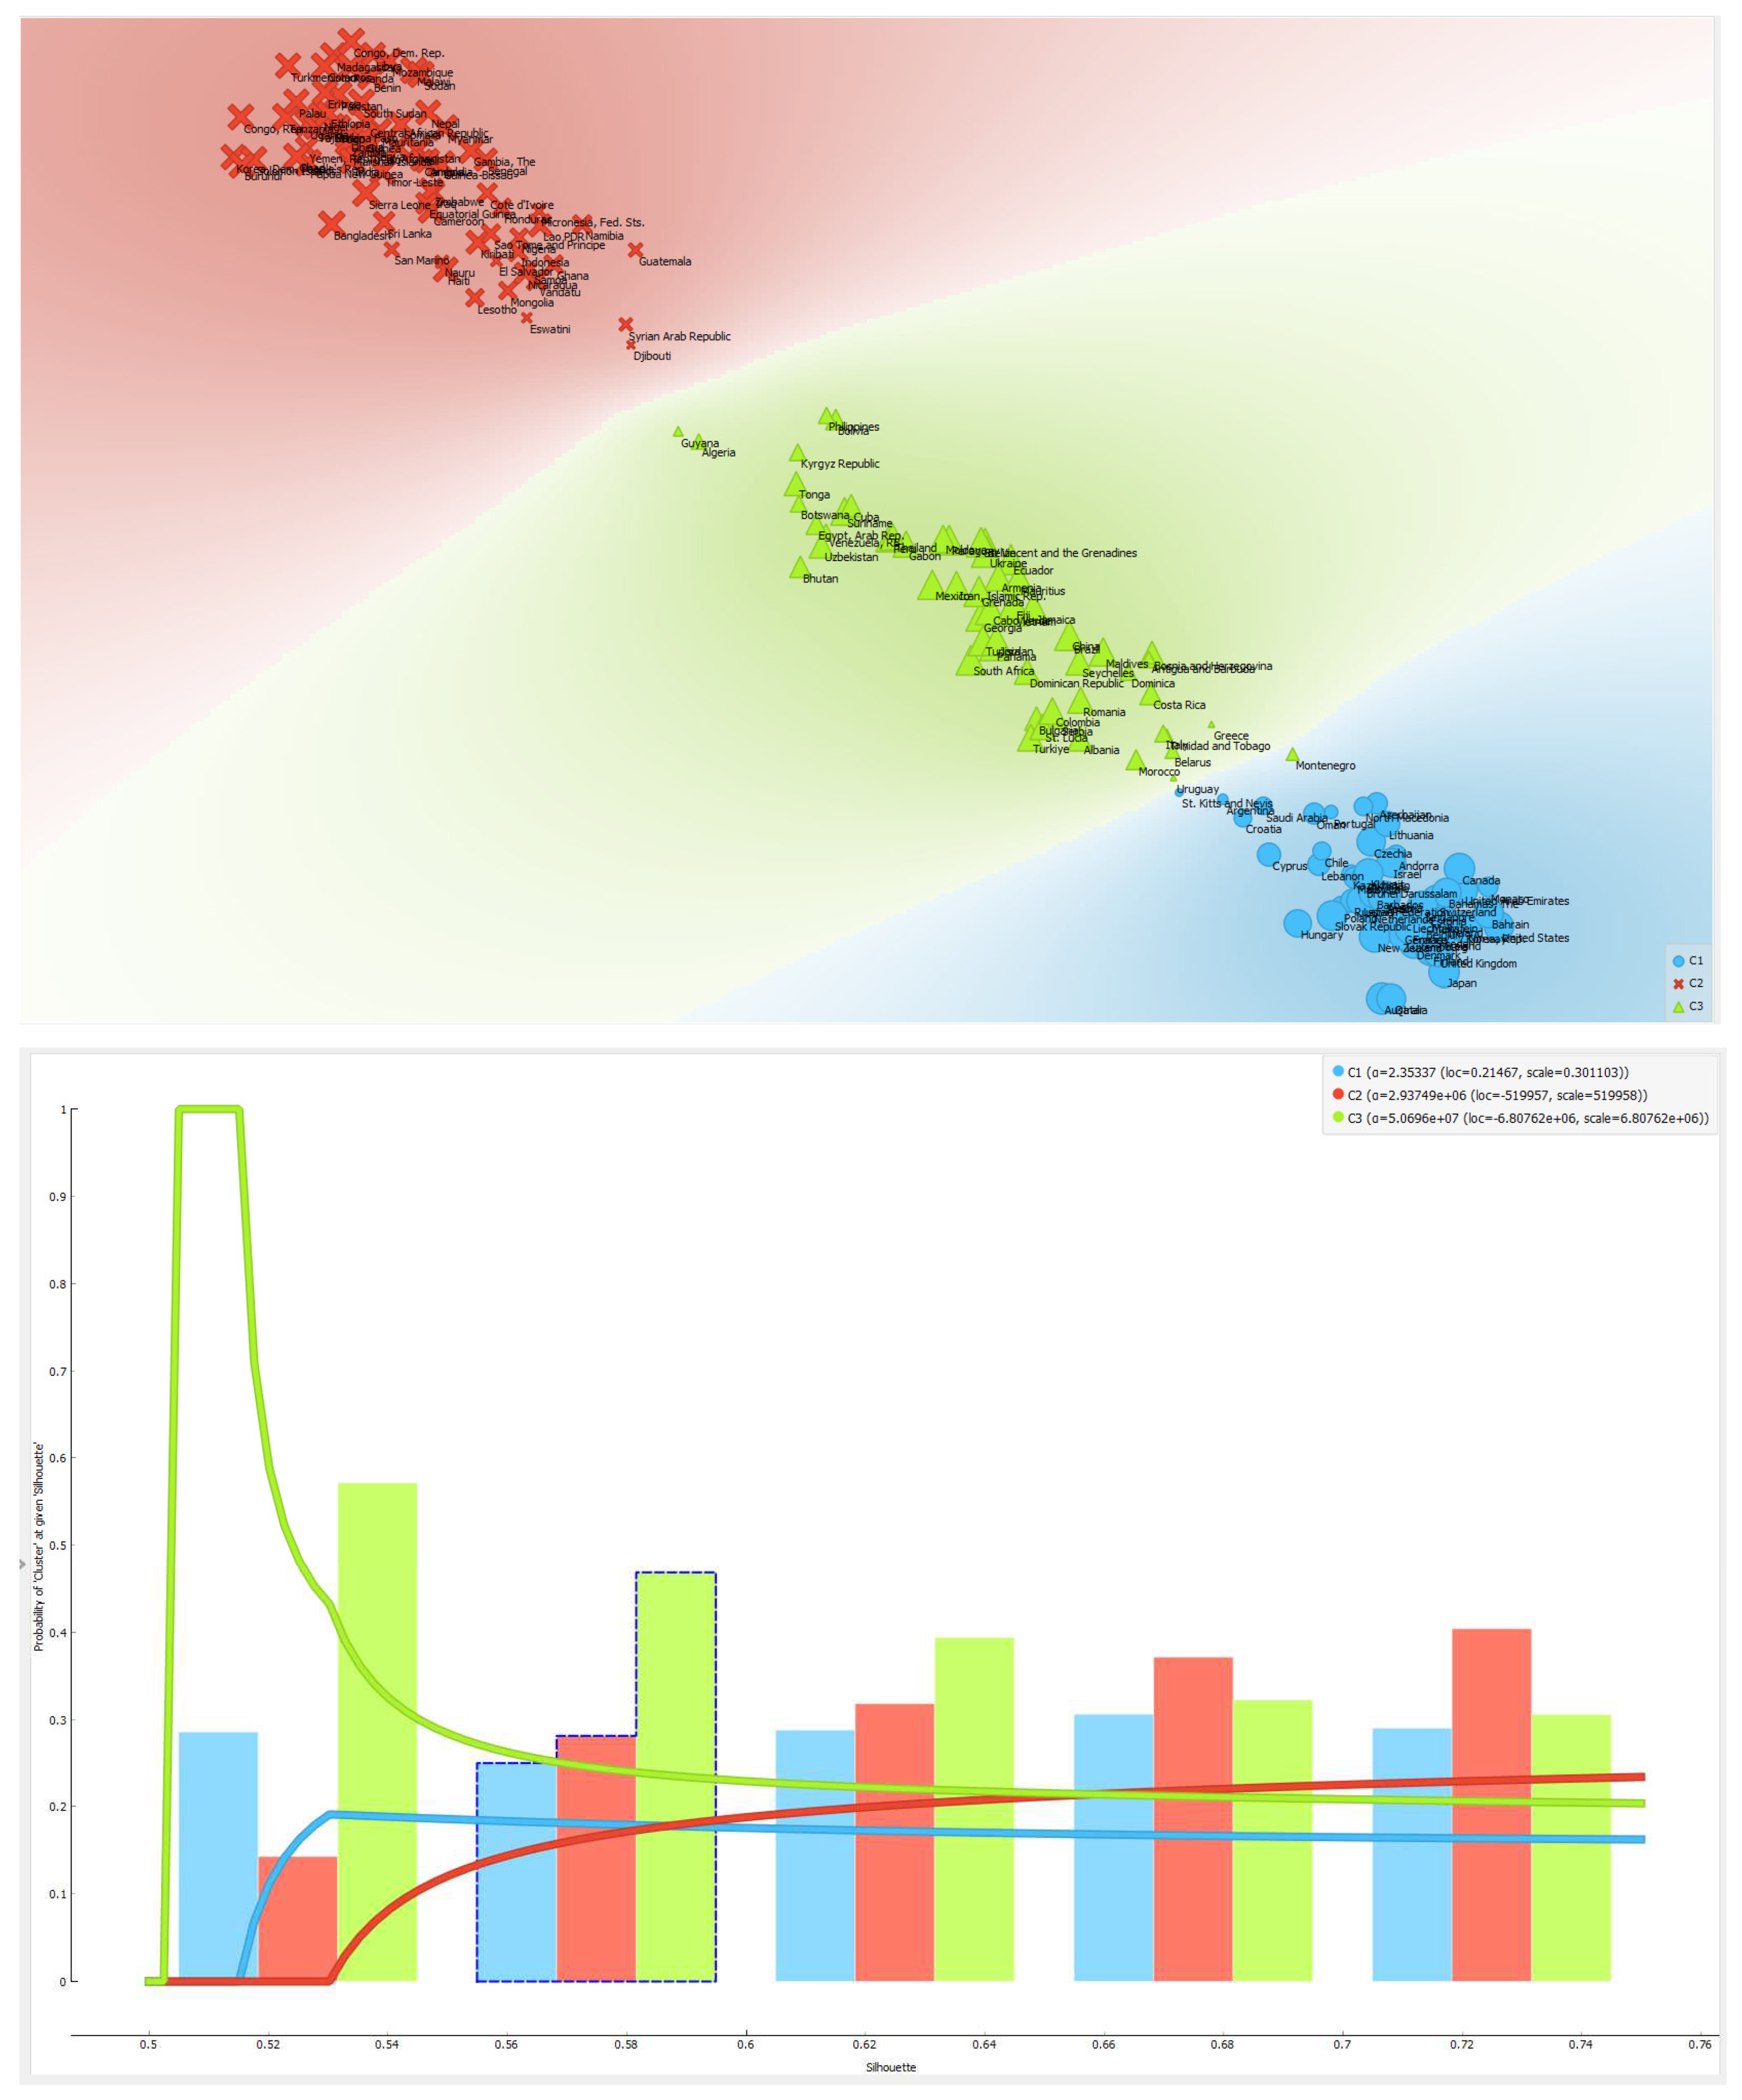
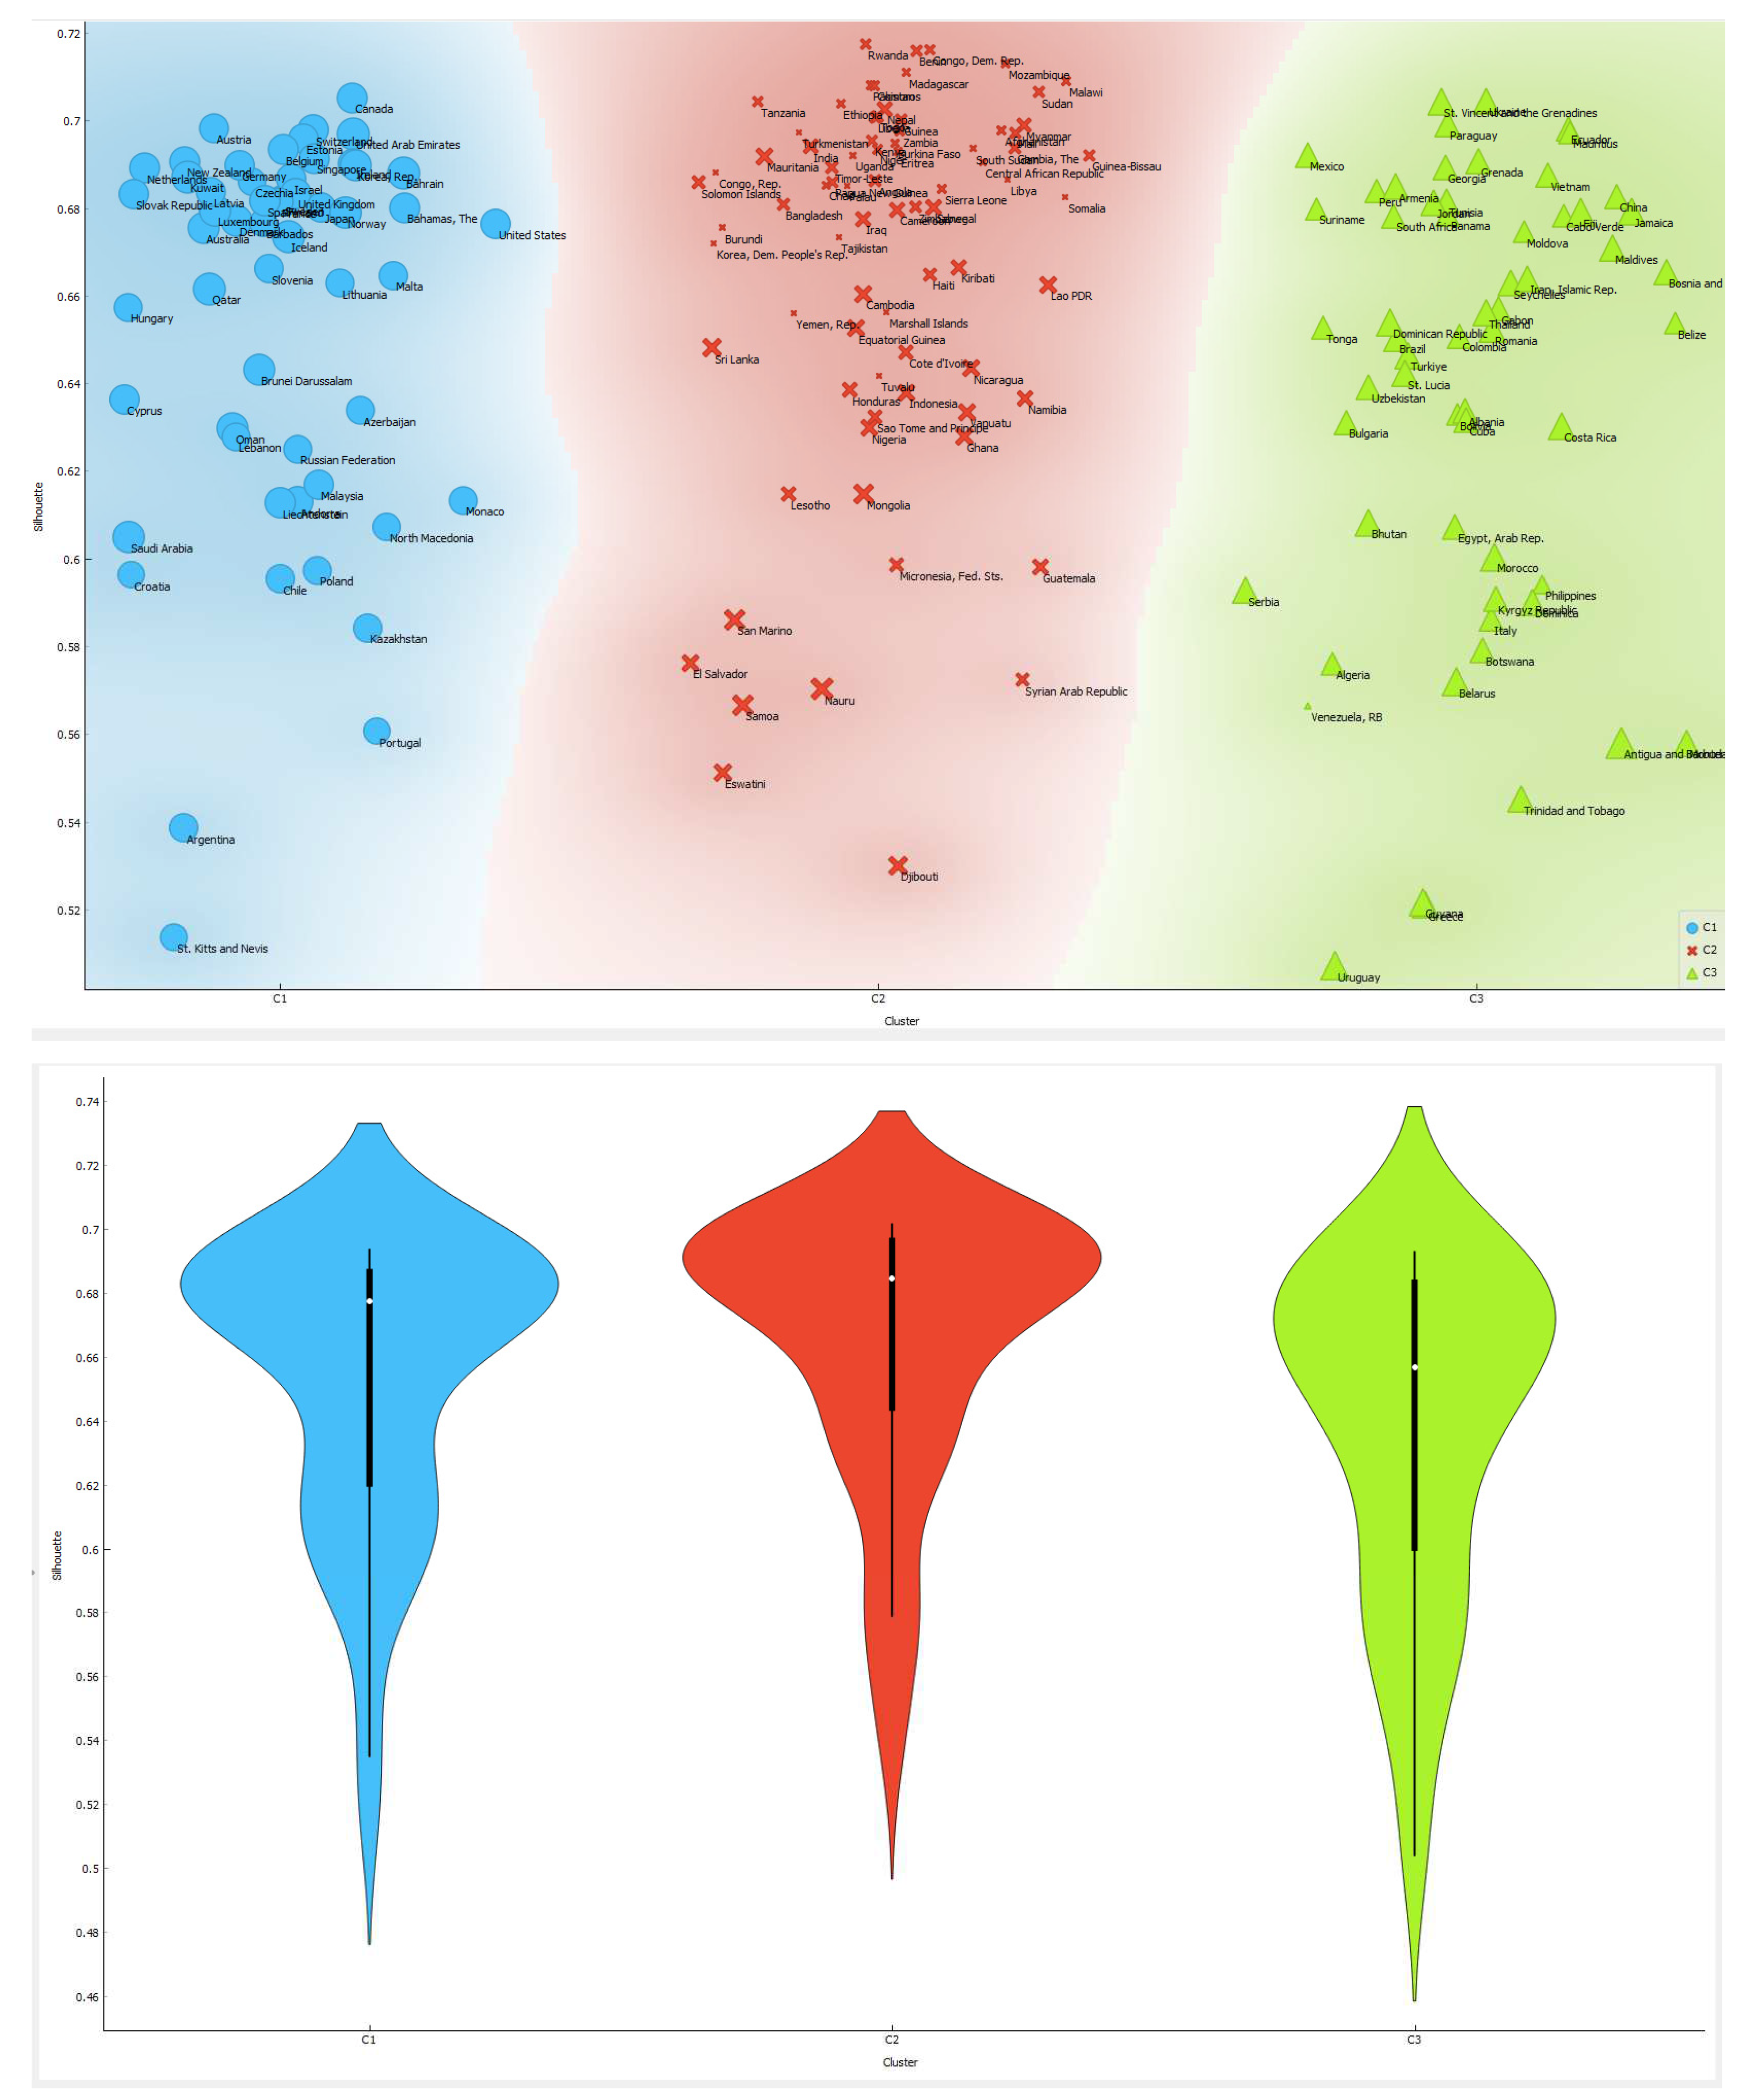
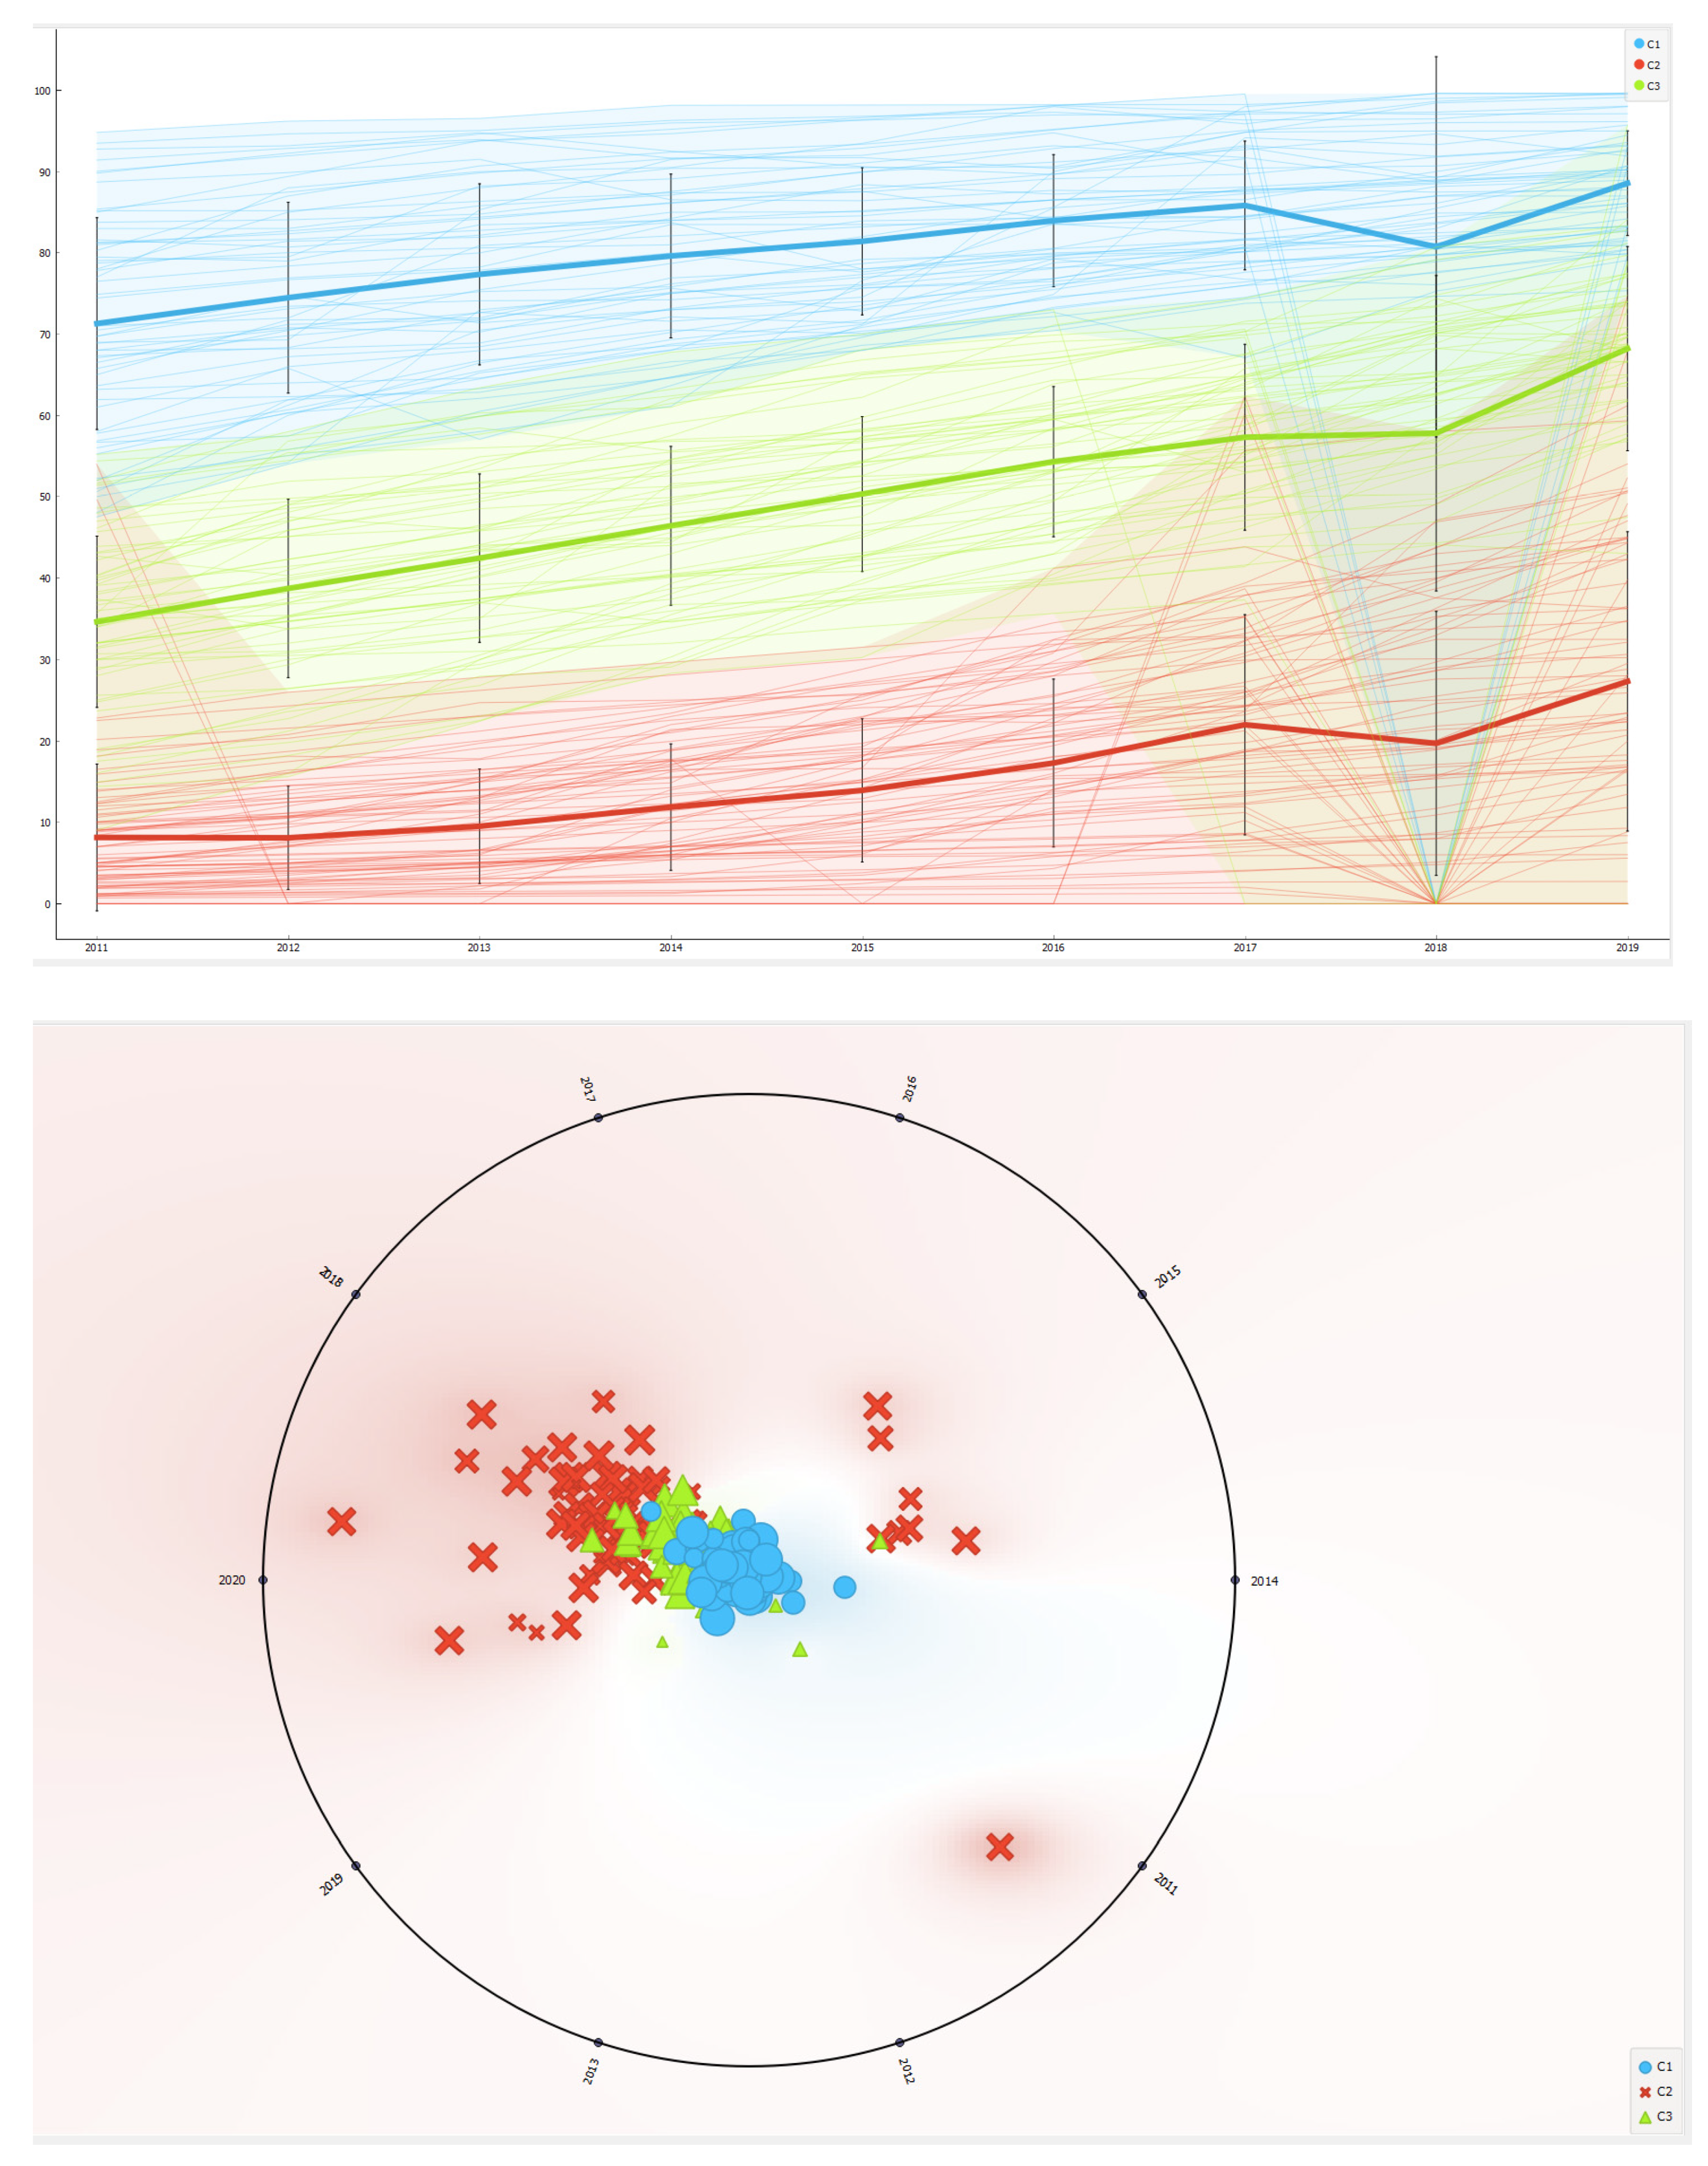
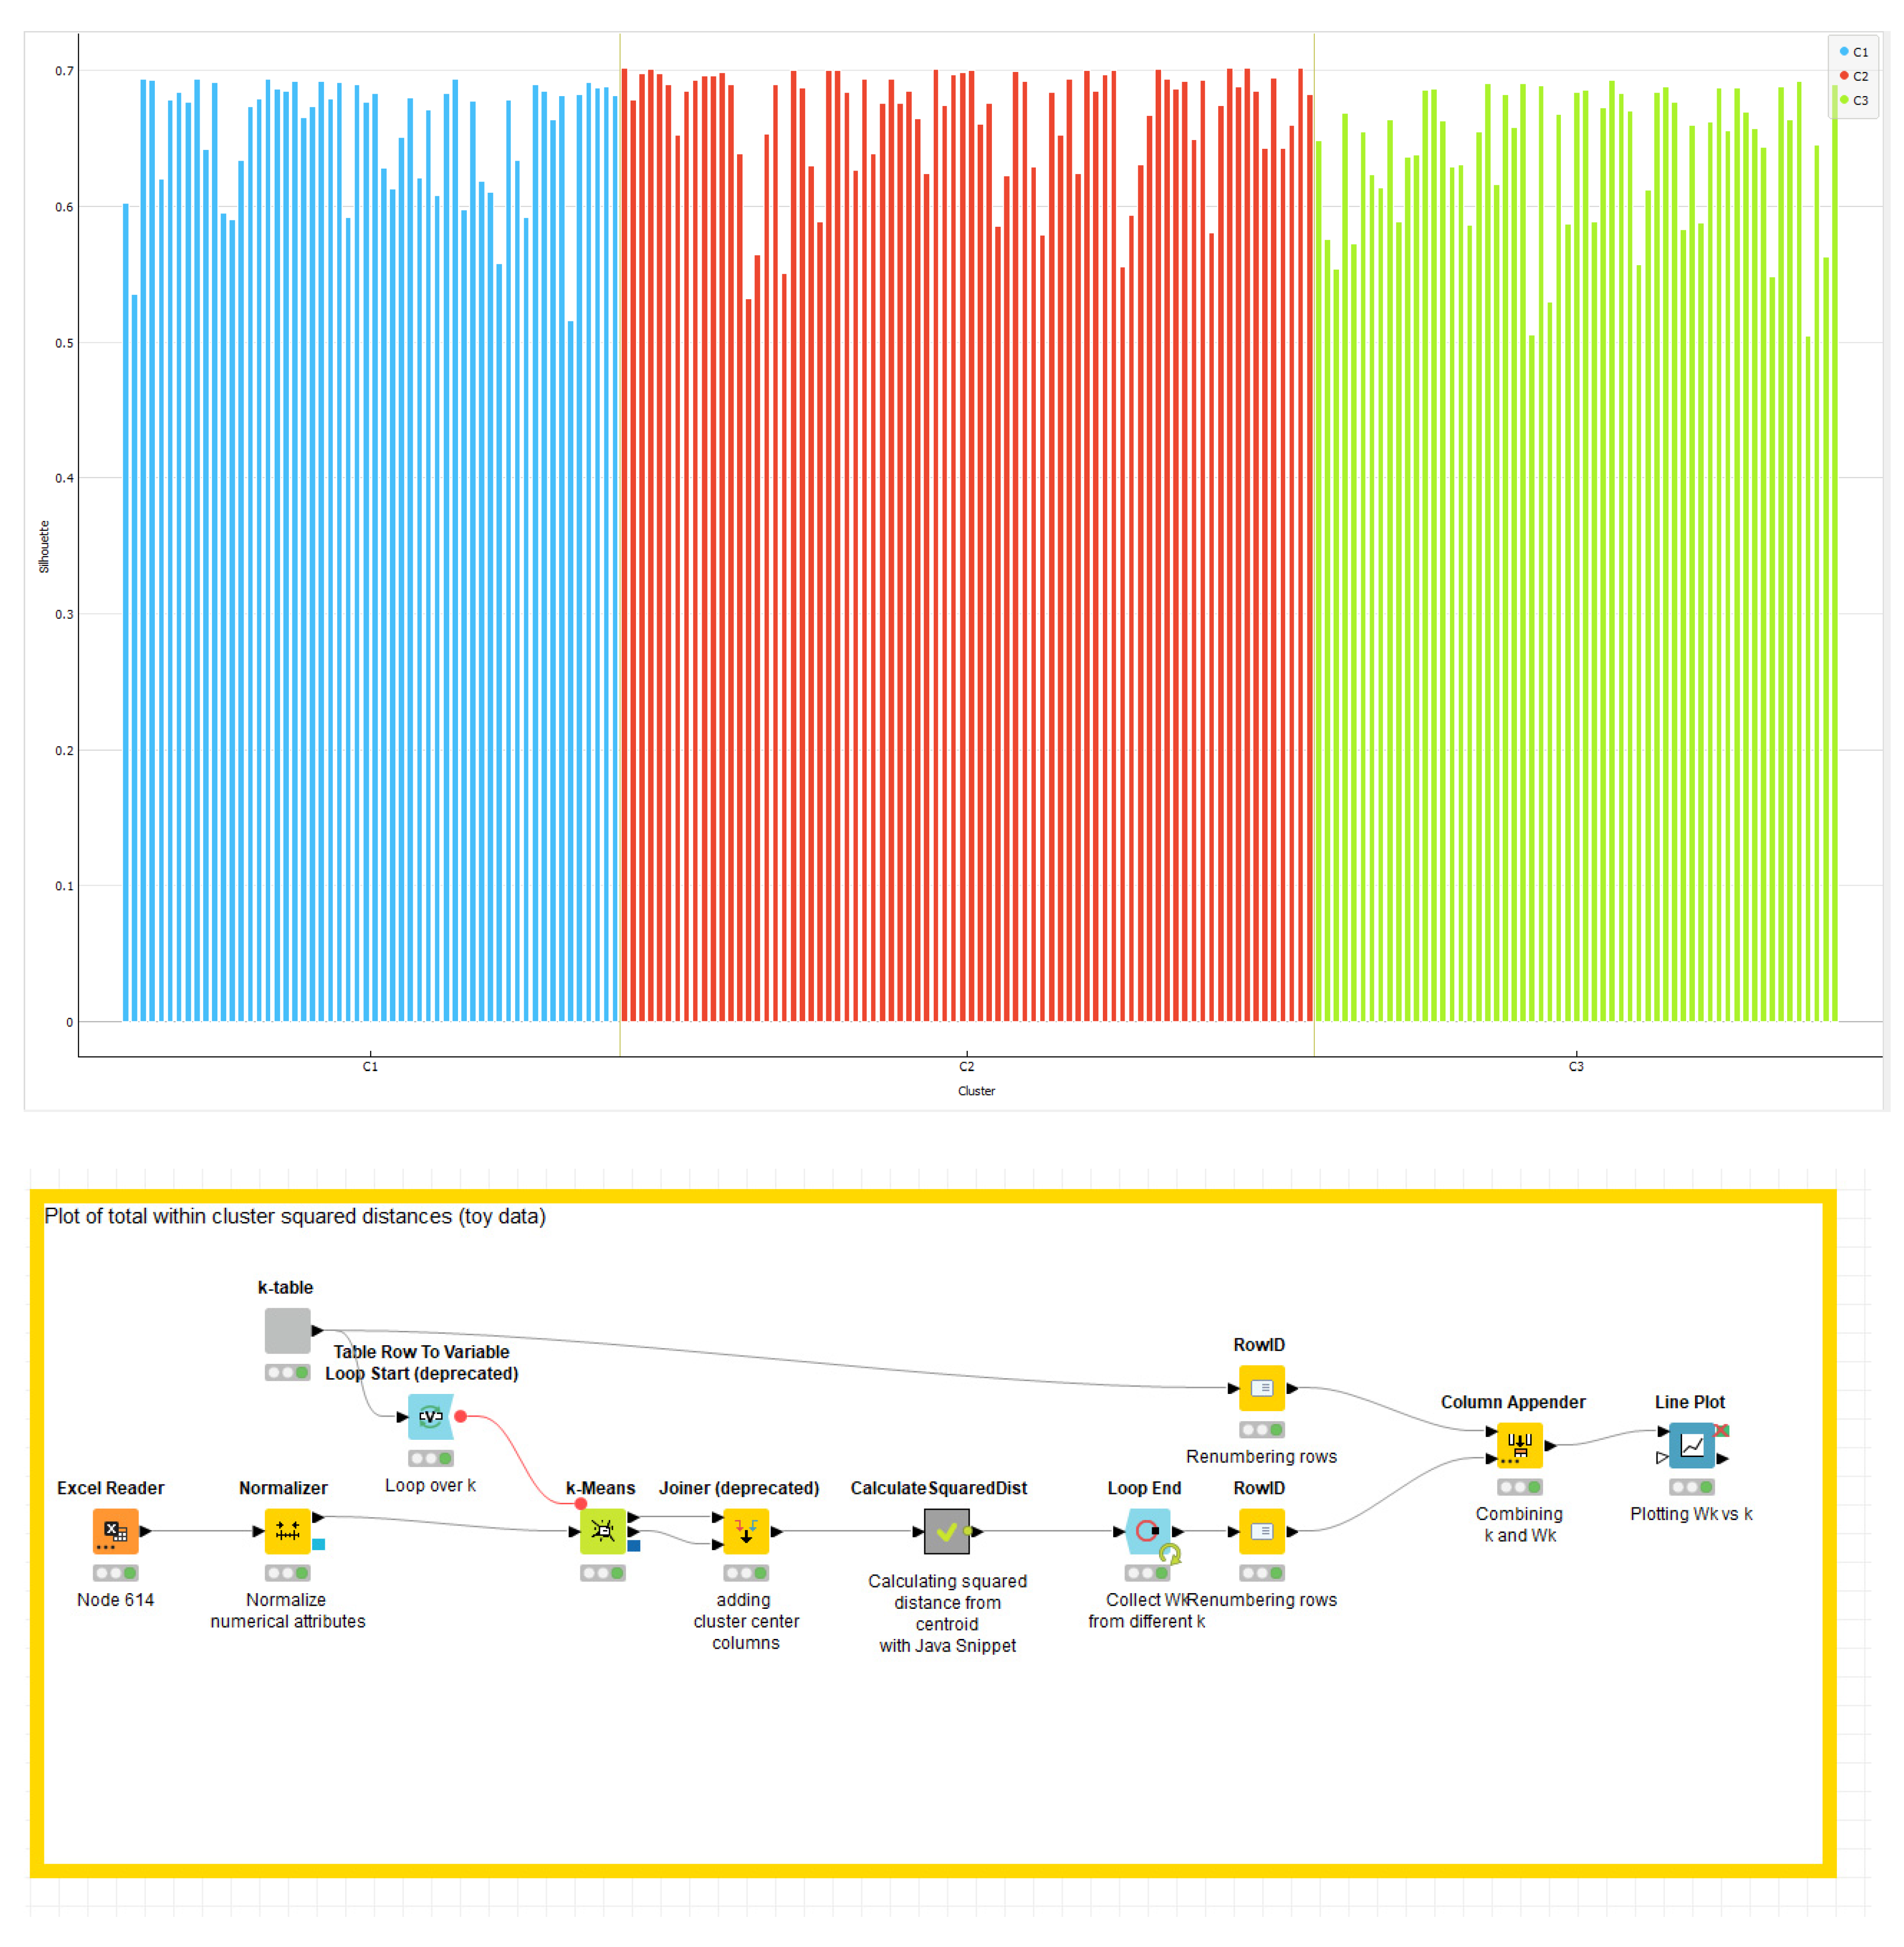
A cluster analysis using the k-Means algorithm optimized with the Elbow method is presented below. The analysis shows the presence of three different clusters that have the following median: C1=90.71>C3=73.21>C2=29.18.
Figure 2.
Clustering with k-Means algorithm optimized with Elbow Methods.
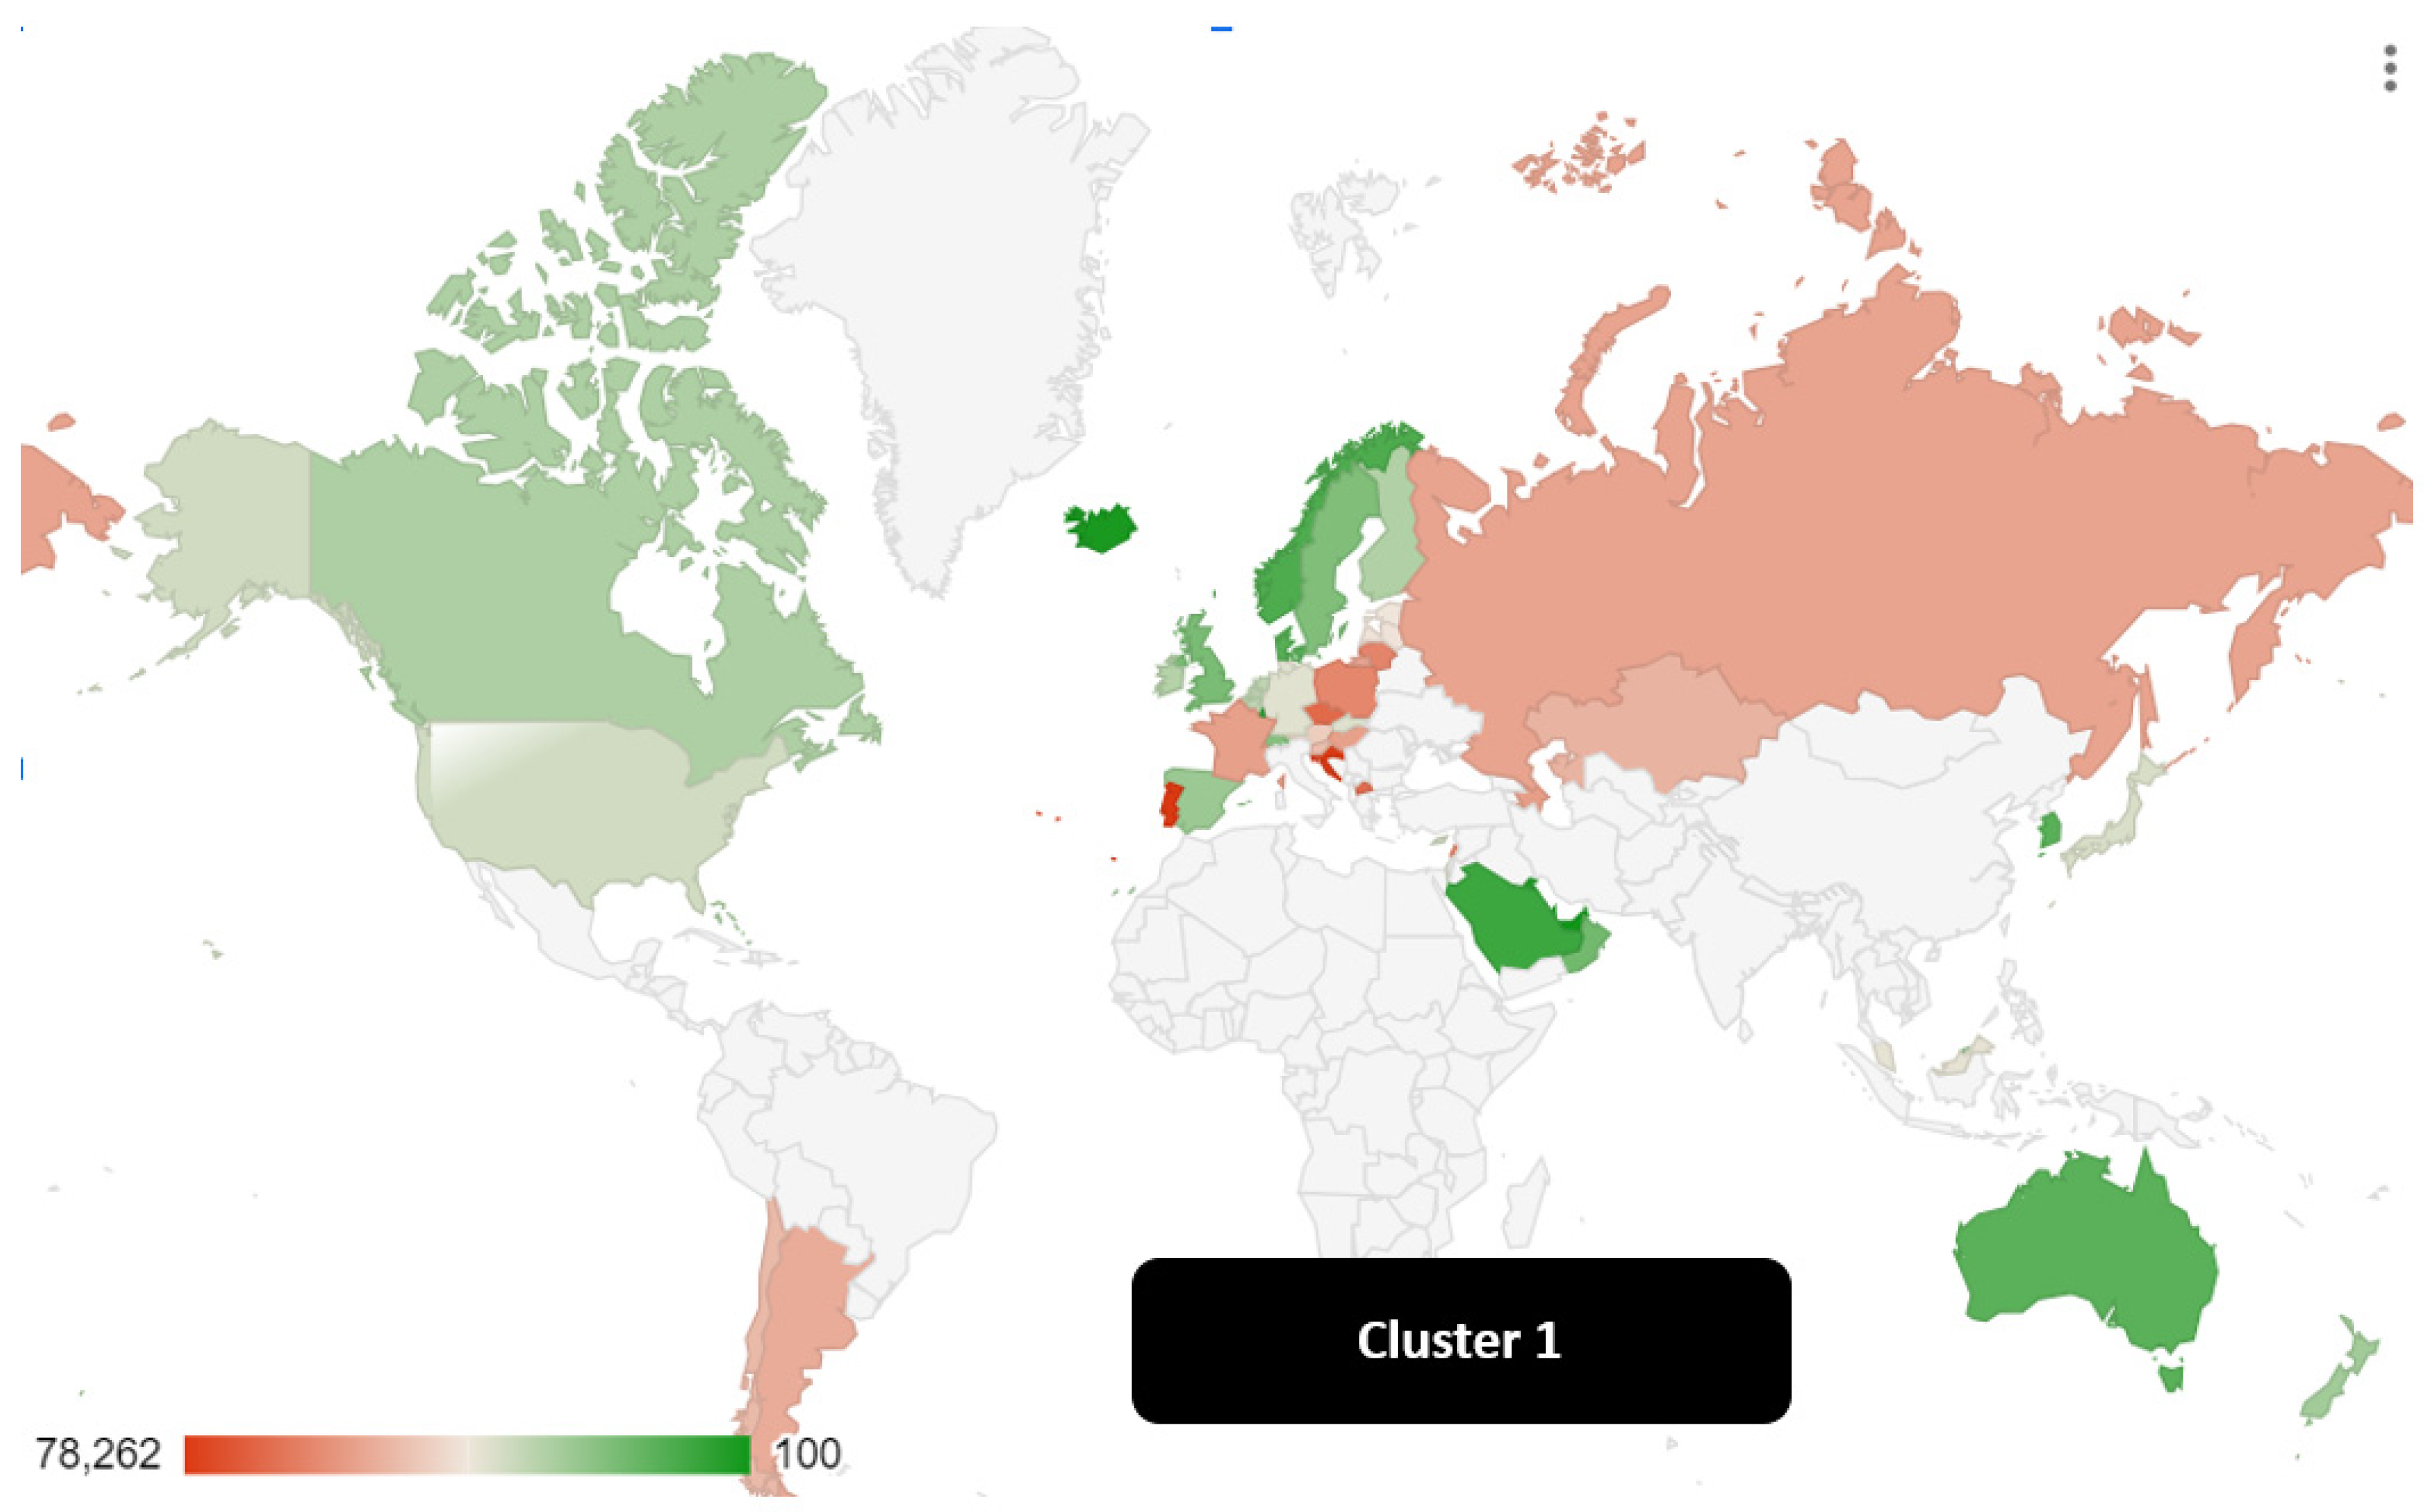
- Cluster 1: New Zealand, Belgium, Estonia, Australia, Austria, Germany, Ireland, Switzerland, Canada, Japan, Singapore, Korea, United Kingdom, United Arab Emirates, Finland, France, Slovak Republic, Bahrain, Netherlands, Latvia, Sweden, Spain, United States, Luxembourg, Denmark, The Bahamas, Israel, Qatar, Norway, Kuwait, Barbados, Iceland, Czech Republic, Malta, Hungary, Slovenia, Lithuania, Brunei Darussalam, Cyprus, Russian Federation, Lebanon, Azerbaijan, Oman, Malaysia, Poland, Liechtenstein, North Macedonia, Chile, Monaco, Saudi Arabia, Kazakhstan, Croatia, Andorra, Portugal, Argentina, St. Kittis and Nevis. Cluster 1 is the first cluster for median IUI value with a value of 90.71. From a strictly geographical point of view, the leading countries within the cluster are Saudi Arabia, Australia, the Scandinavian countries, Iceland, Canada, the USA, and Spain. In the same cluster there are also countries that have low levels of IUI or Russia, Portugal, France, Romania, Argentina, Chile. It should be considered that generally the growth in the value of IUI tends to be associated with the growth in per capita income. In fact, countries that have a low per capita income such as Russia, Argentina, and Eastern European countries, despite being part of Cluster 1, still have a low IUI value.
Figure 3.
Countries in Cluster 1.
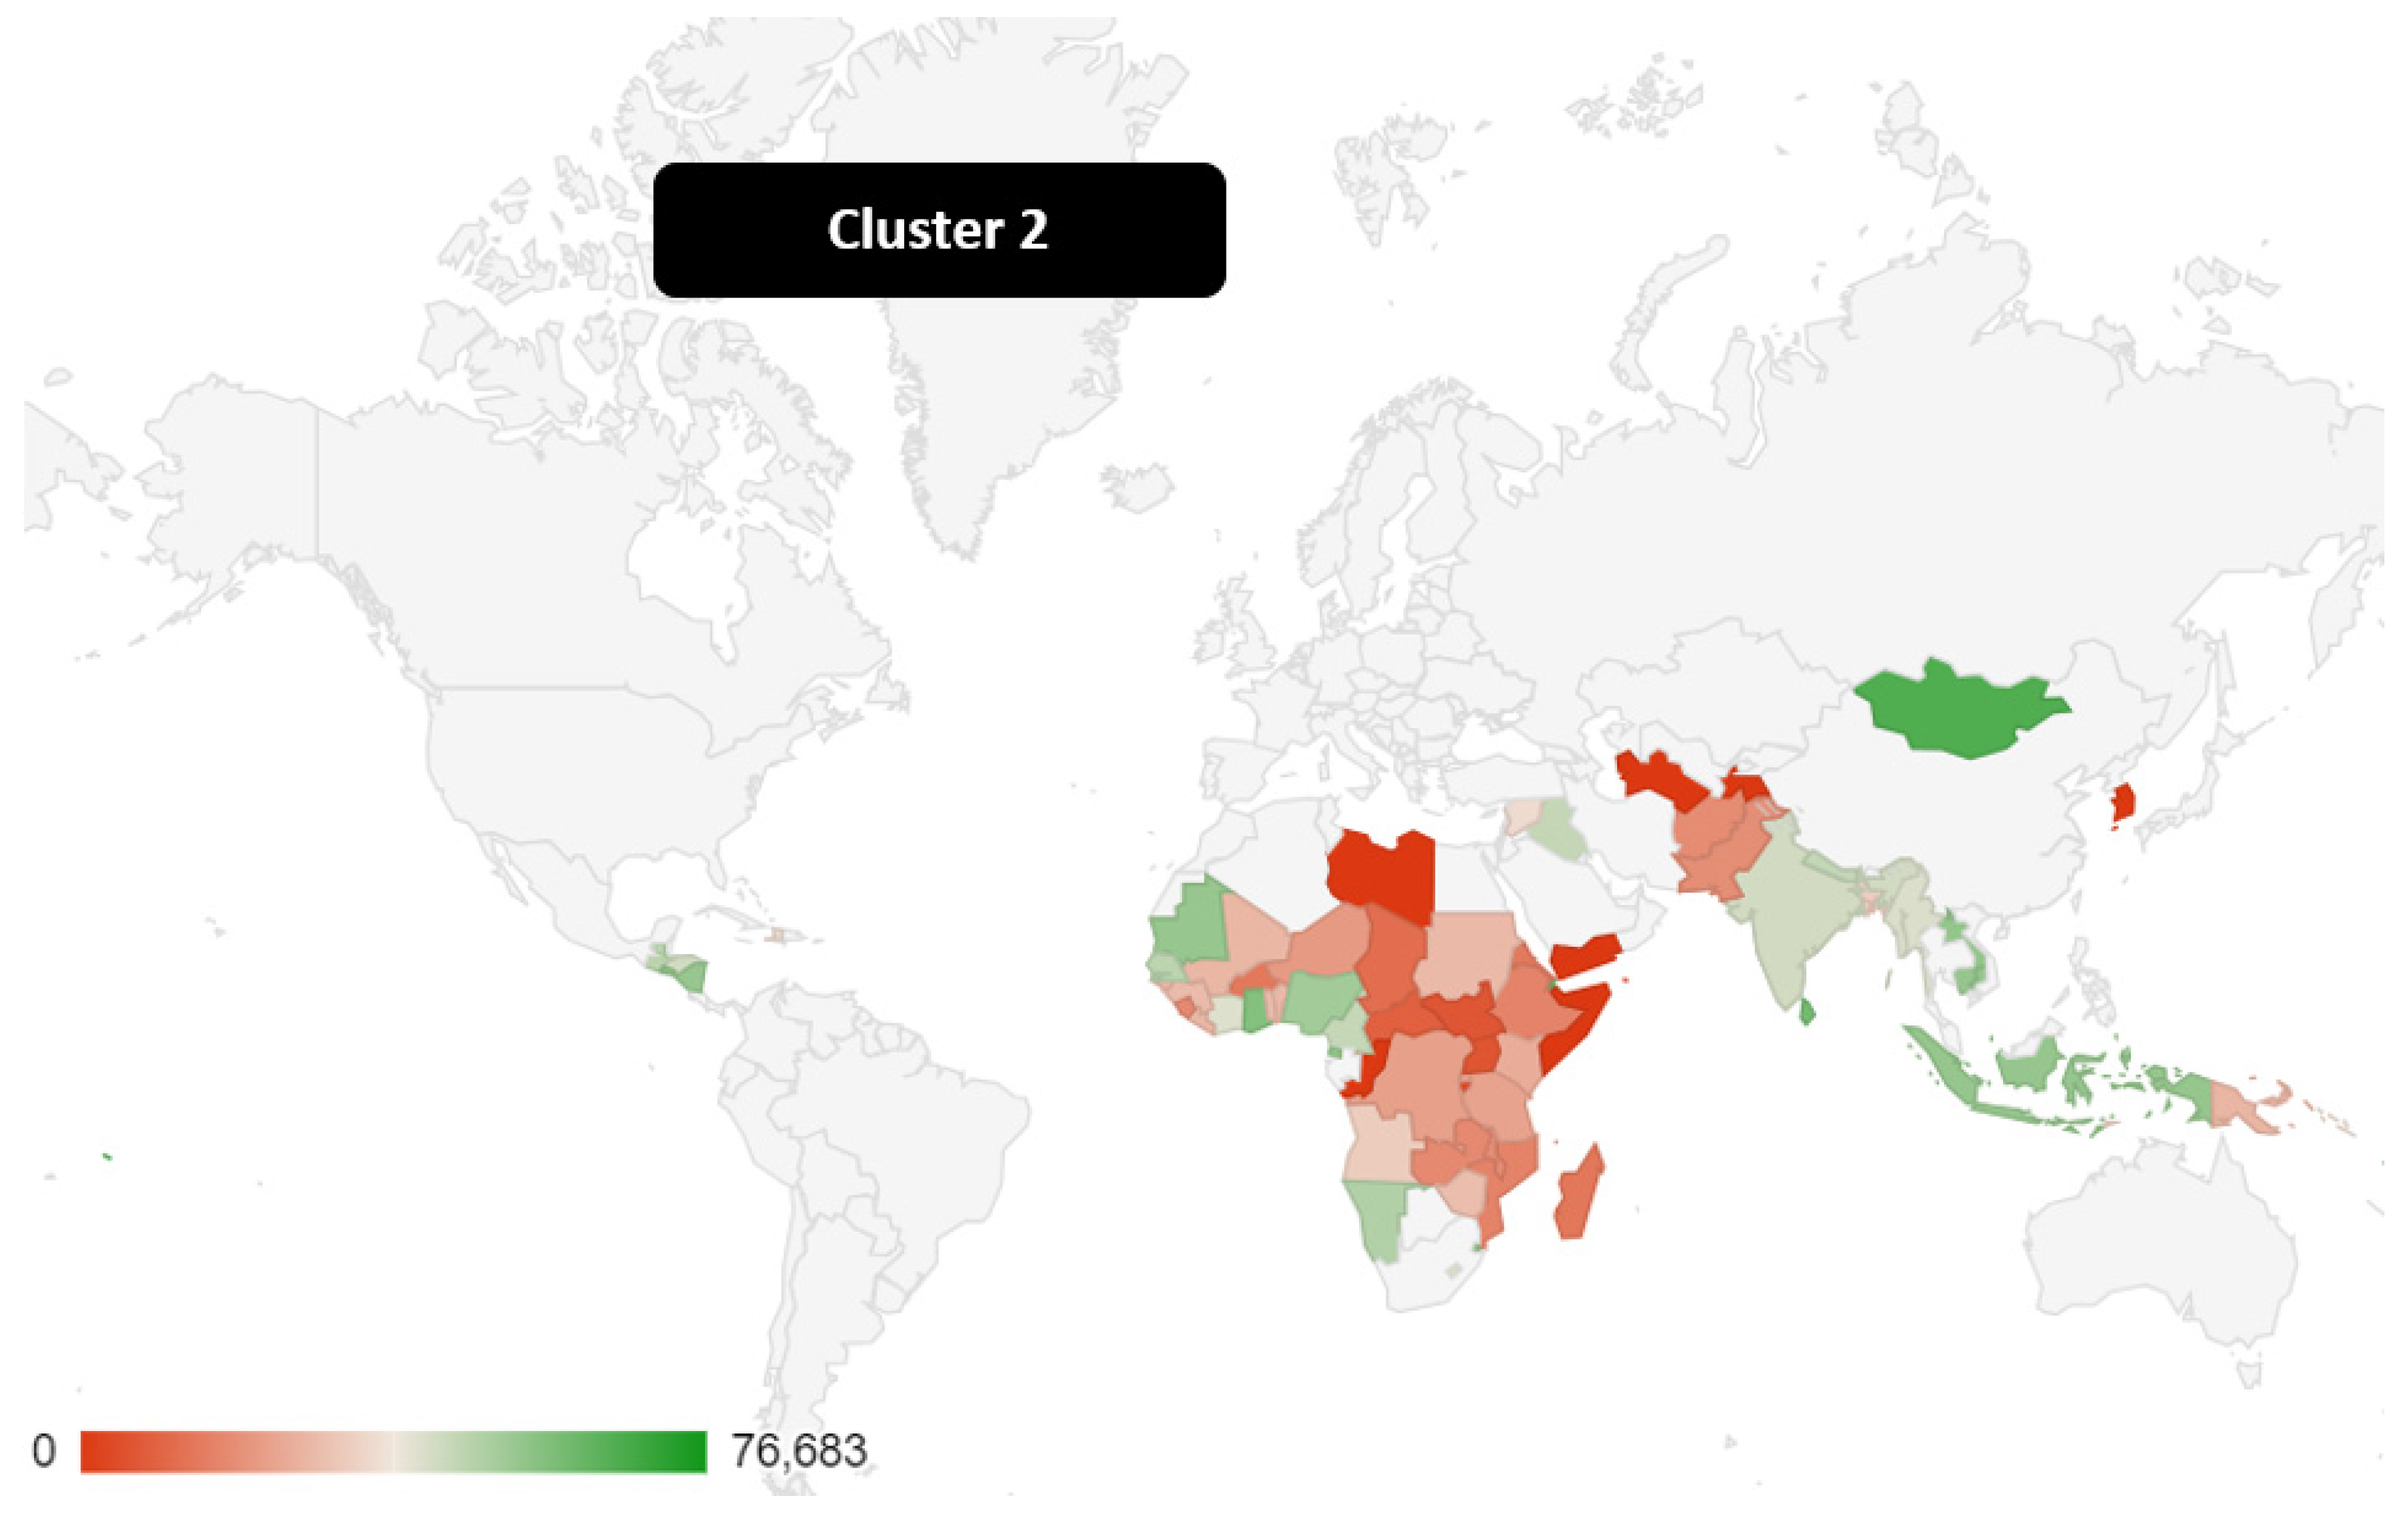
- Cluster 2: Tanzania, Afghanistan, Zambia, Togo, Benin, Sierra Leone, Liberia, Guinea-Bissau, Mali, Ethiopia, Guinea, Pakistan, Rwanda, Mozambique, Malawi, Congo Dem. Rep., Burkina Faso, Bangladesh, Madagascar, Papua New Guinea, Chad, Comoros, Uganda, Kenya, Niger, India, Central African Republic, Solomon Islands, Sudan, South Sudan, Congo Rep., Burundi, Eritrea, Timor Leste, The Gambia, Somalia, Turkmenistan, North Korea, Palau, Cameroon, Nepal , Haiti, Zimbabwe, Angola, Libya, Tajikistan, Kiribati, Iraq, Mauritania, Senegal, Lao DPR, Marshall Islands, Yemen Rep., Equatorial Guinea, Cambodia, Nicaragua, Sri Lanka, Tuvalu, Vanuatu, Cote d'Ivoire, Indonesia, Sao Tome and Principe, Namibia, Ghana, Honduras, Nigeria, Mongolia, San Marino, Micronesia Fed. Sts., Guatemala, Nauru, Syrian Arab Republic, El Salvador, Samoa, Eswatini, Djibouti. The value of the median of Cluster 2 is equal to 29.18. Cluster 2 is the last cluster by IUI value. It is a cluster made up of almost all of Africa, South Asia and the countries of Southeast Asia. In this case, the positive relationship existing between the value of per capita income and the value of IUI is evident. In fact, the countries that have the lowest value in terms of IUI are the countries of Central Africa that also have a low per capita income. It should be considered that the low IUI value is also an indicator of a difficulty in accessing the digital economy. In fact, to increase the development of the digital economy in African and South Asian countries it is necessary to increase the distribution among the population.
Figure 4.
Countries in Cluster 2.
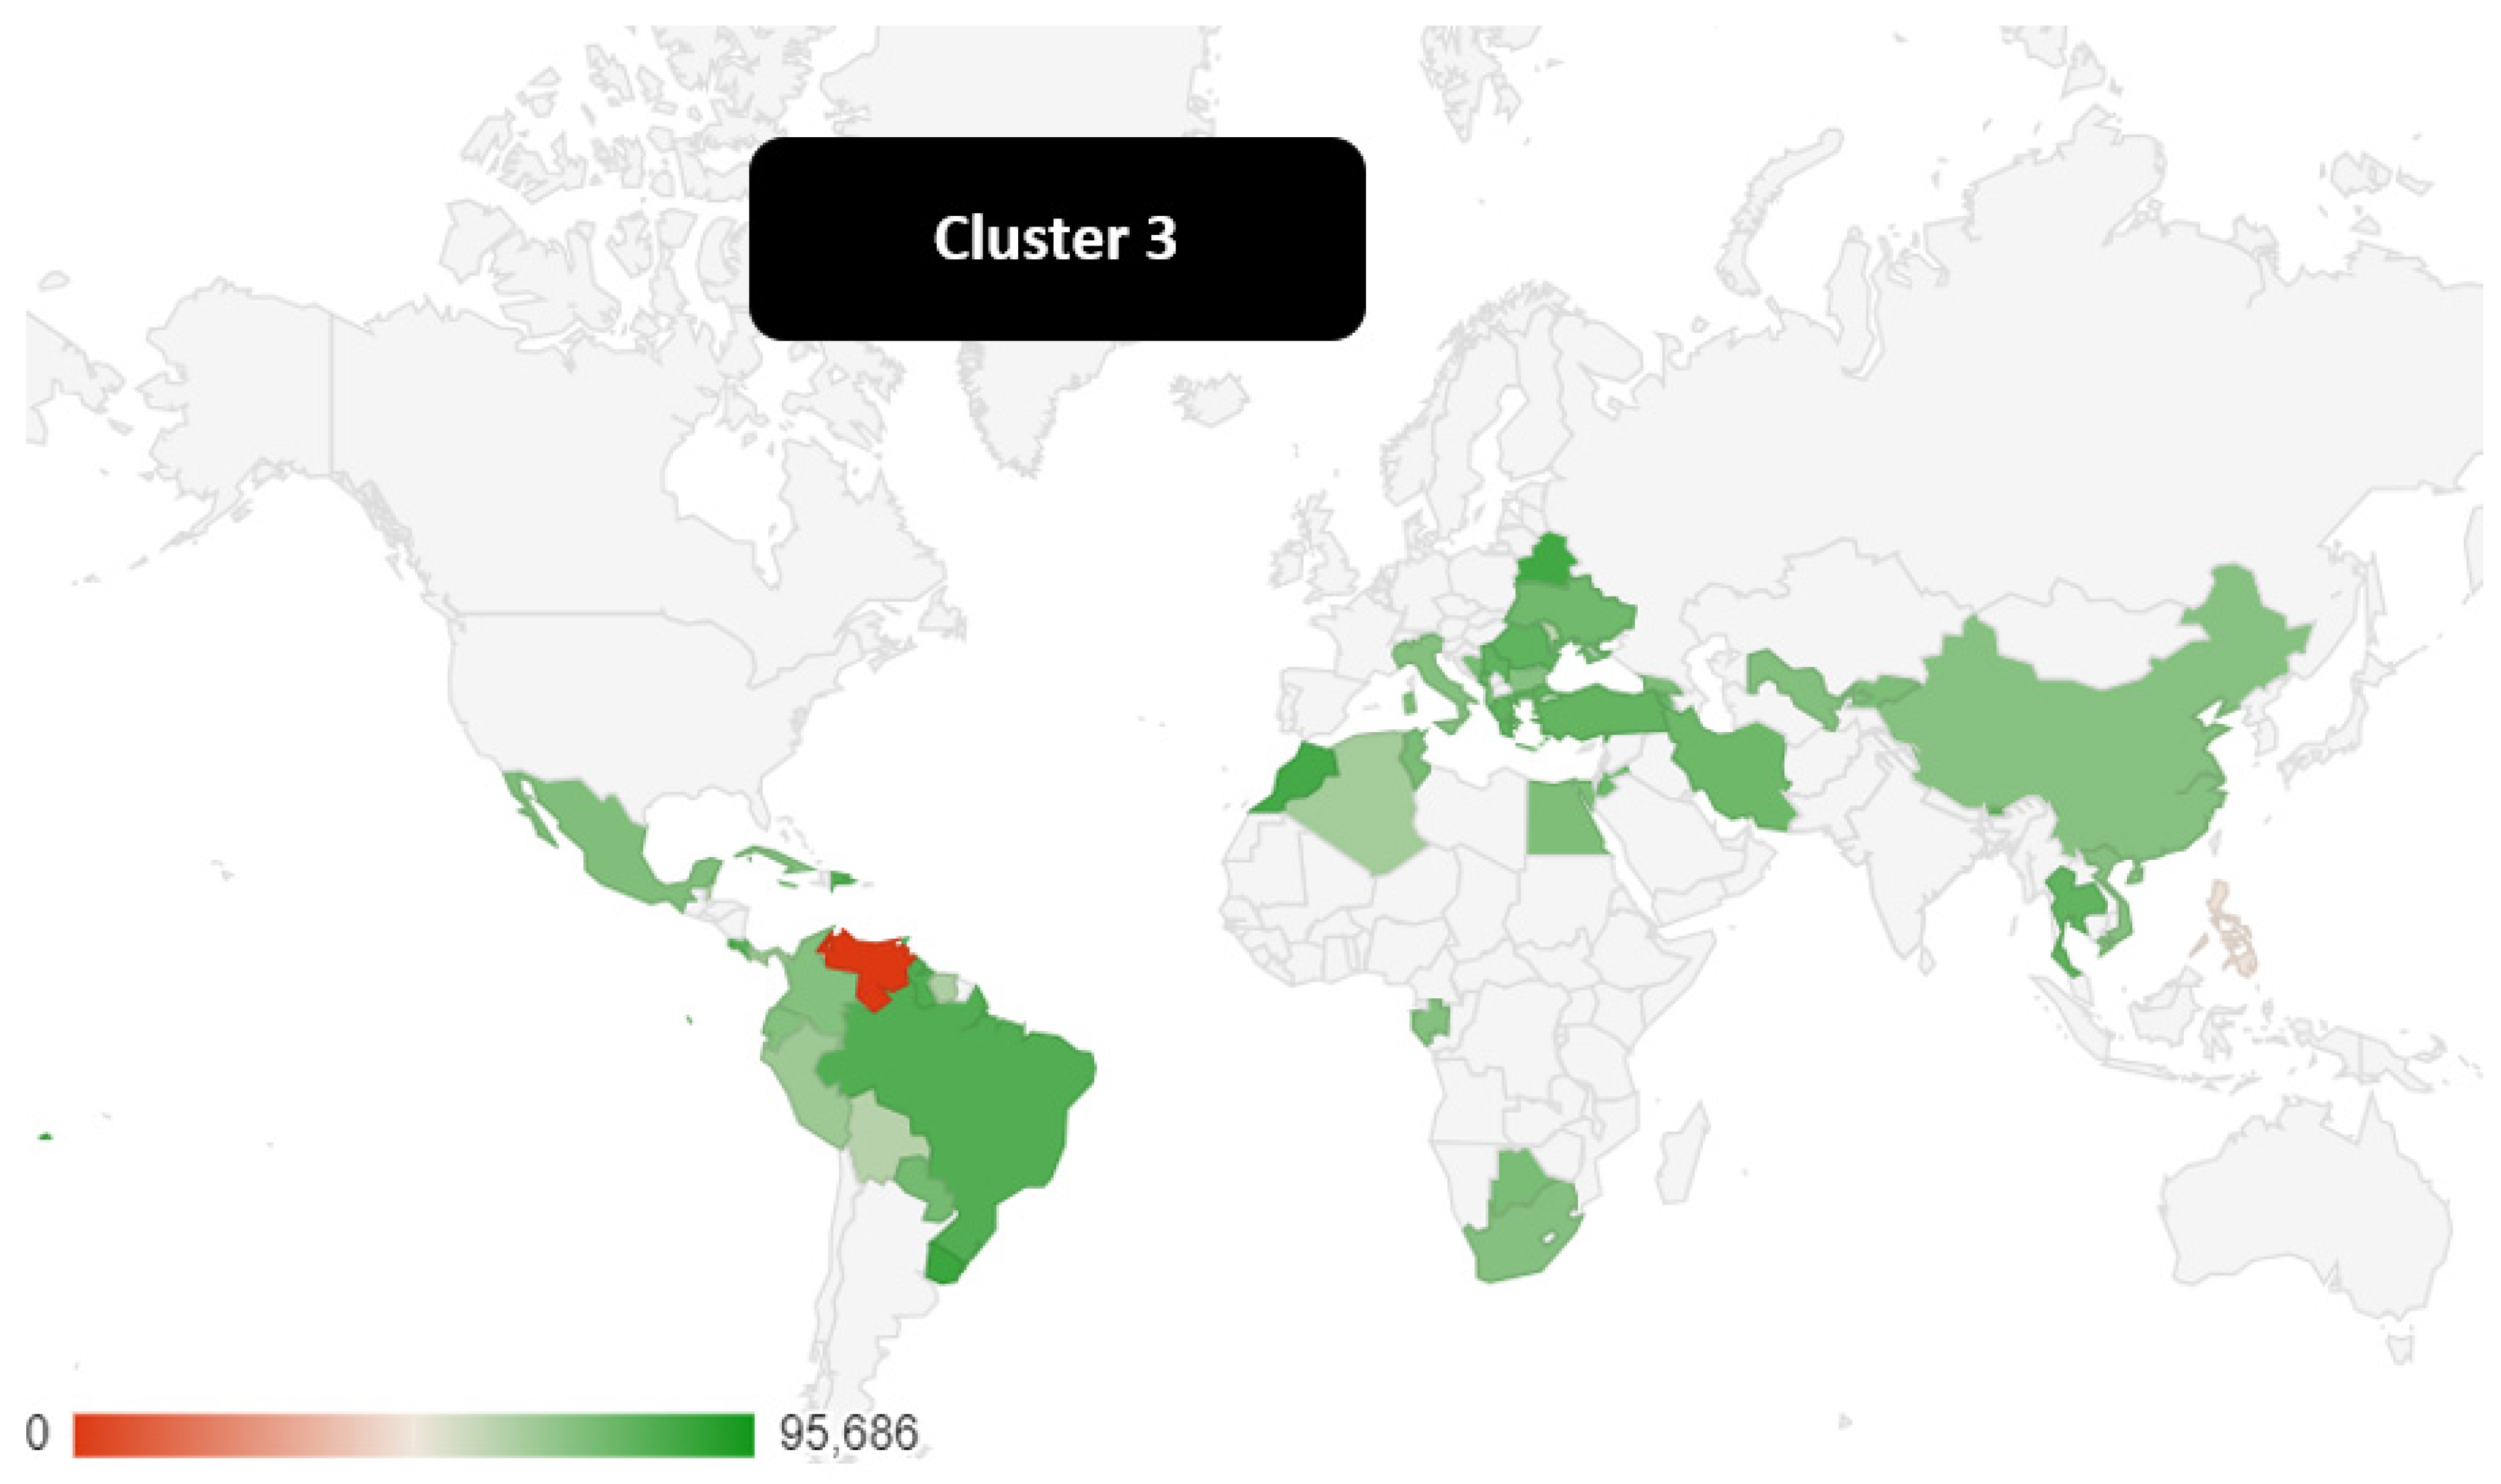
- Cluster 3: Mauritius, Ukraine, Ecuador, Georgia, Paraguay, Grenada, Vietnam, Tunisia, St. Saint Vincent and the Grenadines, South Africa, China, Cabo Verde, Jamaica, Jordan, Panama, Mexico, Fiji, Peru, Maldives, Iran Islamic Rep. , Moldova, Suriname, Armenia, Turkey, Bosnia and Herzegovina, Colombia, Seychelles, Gabon, Thailand, Romania, Belize, St. Lucia, Dominican Republic, Albania, Uzbekistan, Tonga, Bulgaria, Brazil, Cuba, Bhutan, Costa Rica, Egypt Arab Rep., Bolivia, Morocco, Botswana, Kyrgyz Republic, Italy, Dominica, Serbia, Philippines, Algeria, Belarus, Antigua and Barbuda, Montenegro, Venezuela, Trinidad and Tobago, Guyana, Greece, Uruguay. The value of the median of Cluster 3 is equal to 73.21. It should be considered that Cluster 3 is the second cluster by median value placed between Cluster 1, which is the first Cluster, and the Cluster which is the last cluster by median value. From a geographical point of view, cluster 3 is made up of the countries of Central and South America, some African countries, Italy and Eastern Europe, and China and some countries of the Middle East and South Asia. It should be noted that Cluster 3 is made up of both low per capita income countries and high per capita income countries. The distribution of the internet has an impact on the ability to access the digital economy. It is significant to note that despite the technological investment in China, the value of IUI in China has not yet reached the same level as Cluster 1 countries. Furthermore, together with China, in Cluster 3, there are also two other BRICS countries namely Brazil and South Africa.
Figure 5.
Countries in Cluster 3.
5. Machine Learning Algorithms for the Prediction of the Future Level of Individuals Using Internet
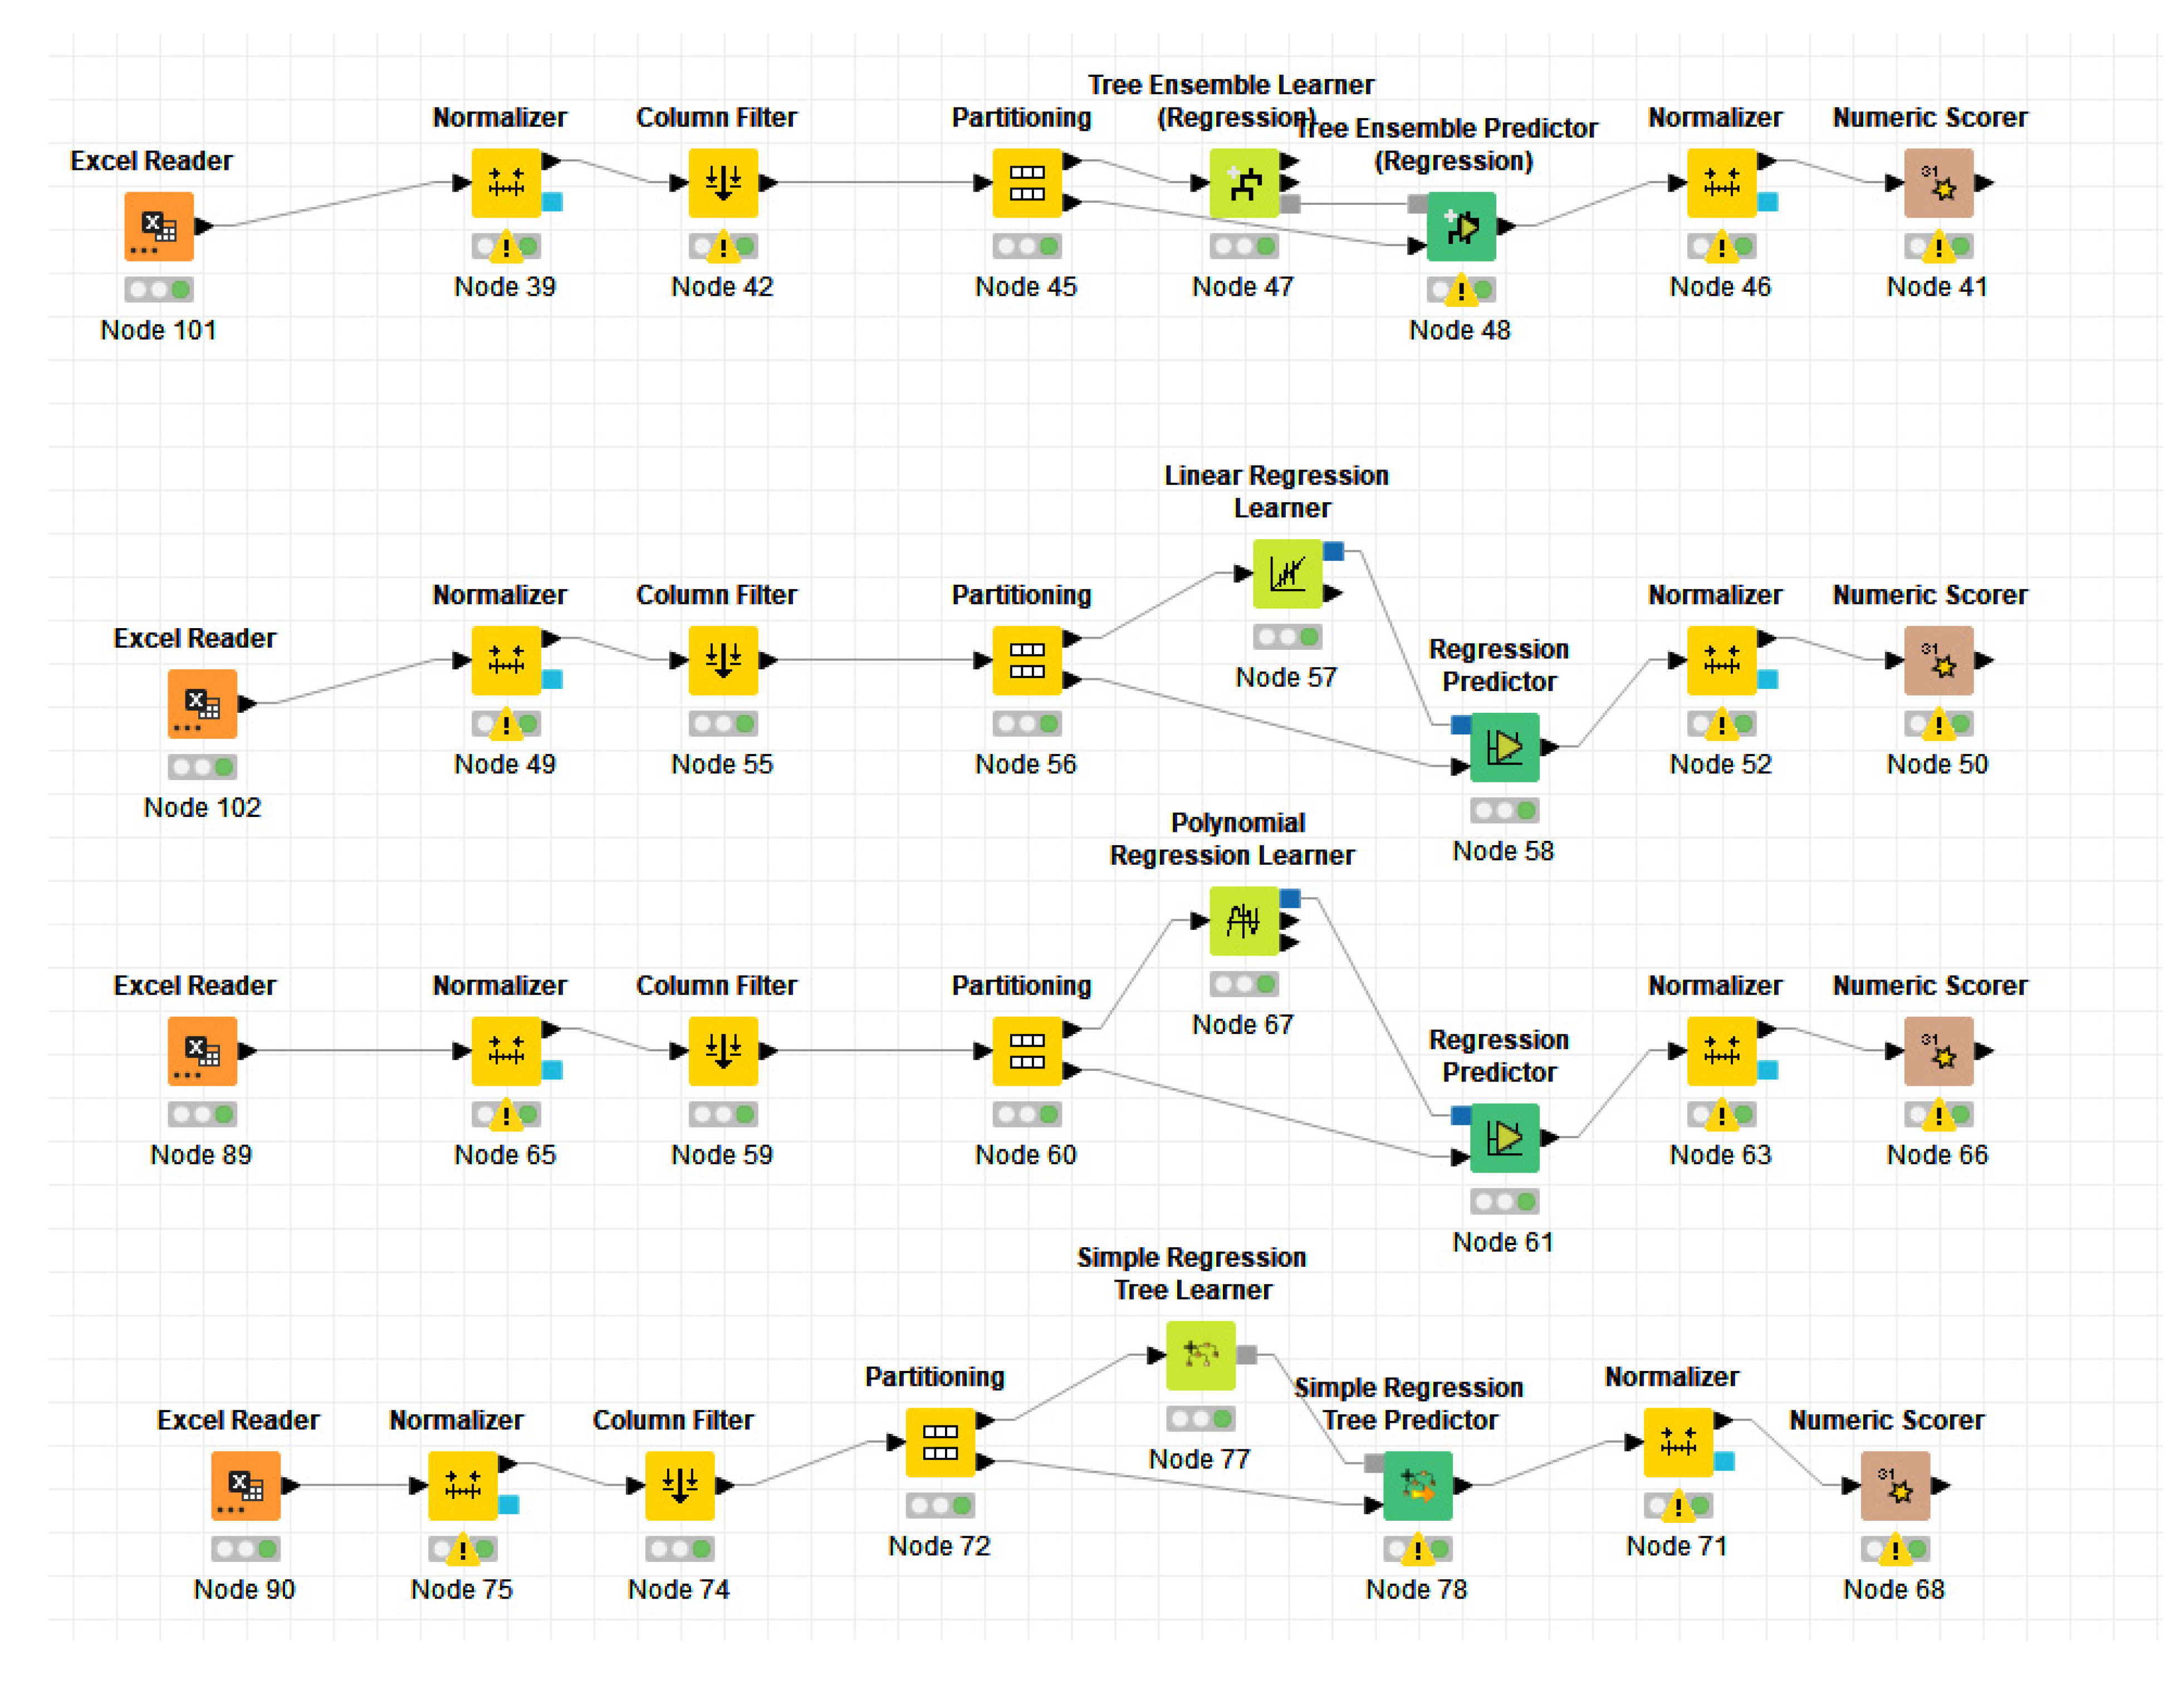
A machine learning analysis for predicting the future value of individuals using the internet is presented below. Specifically, eight different machine learning algorithms were analysed and classified on the basis of their ability to maximize the R-squared and minimize statistical errors, i.e. MAE-Mean Average Error, MSE-Mean Squared Error, RMSE-Root Mean Squared Error. The algorithms were trained using 80% of the data while the remainder was used for the actual prediction. Each algorithm is assigned a ranking based on its position within the ranking of statistical indicators. The ranking is then added up into a single indicator. The algorithm that scores the lowest aggregate ranking is the preferred algorithm in terms of maximizing the R-squared and minimizing statistical errors. Specifically, the following ordering of the algorithms has been identified, namely:
- Linear Regression with a payoff value of 9;
- Gradient Boosted Trees and Polynomial Regression with a payoff value of 11;
- Simple Regression Tree with a payoff value of 13;
- ANN-Artificial Neural Network with a payoff value of 19;
- Random Forest Learner with a payoff value of 23;
- Tree Ensemble Regression with a payoff value of 27;
- PNN-Probabilistic Neural Network with a payoff value of 31.
Figure 6.
Ranking of algorithms for predictive ability in the sense of minimization of statistical errors and maximization of R-squared.
Figure 6.
Ranking of algorithms for predictive ability in the sense of minimization of statistical errors and maximization of R-squared.
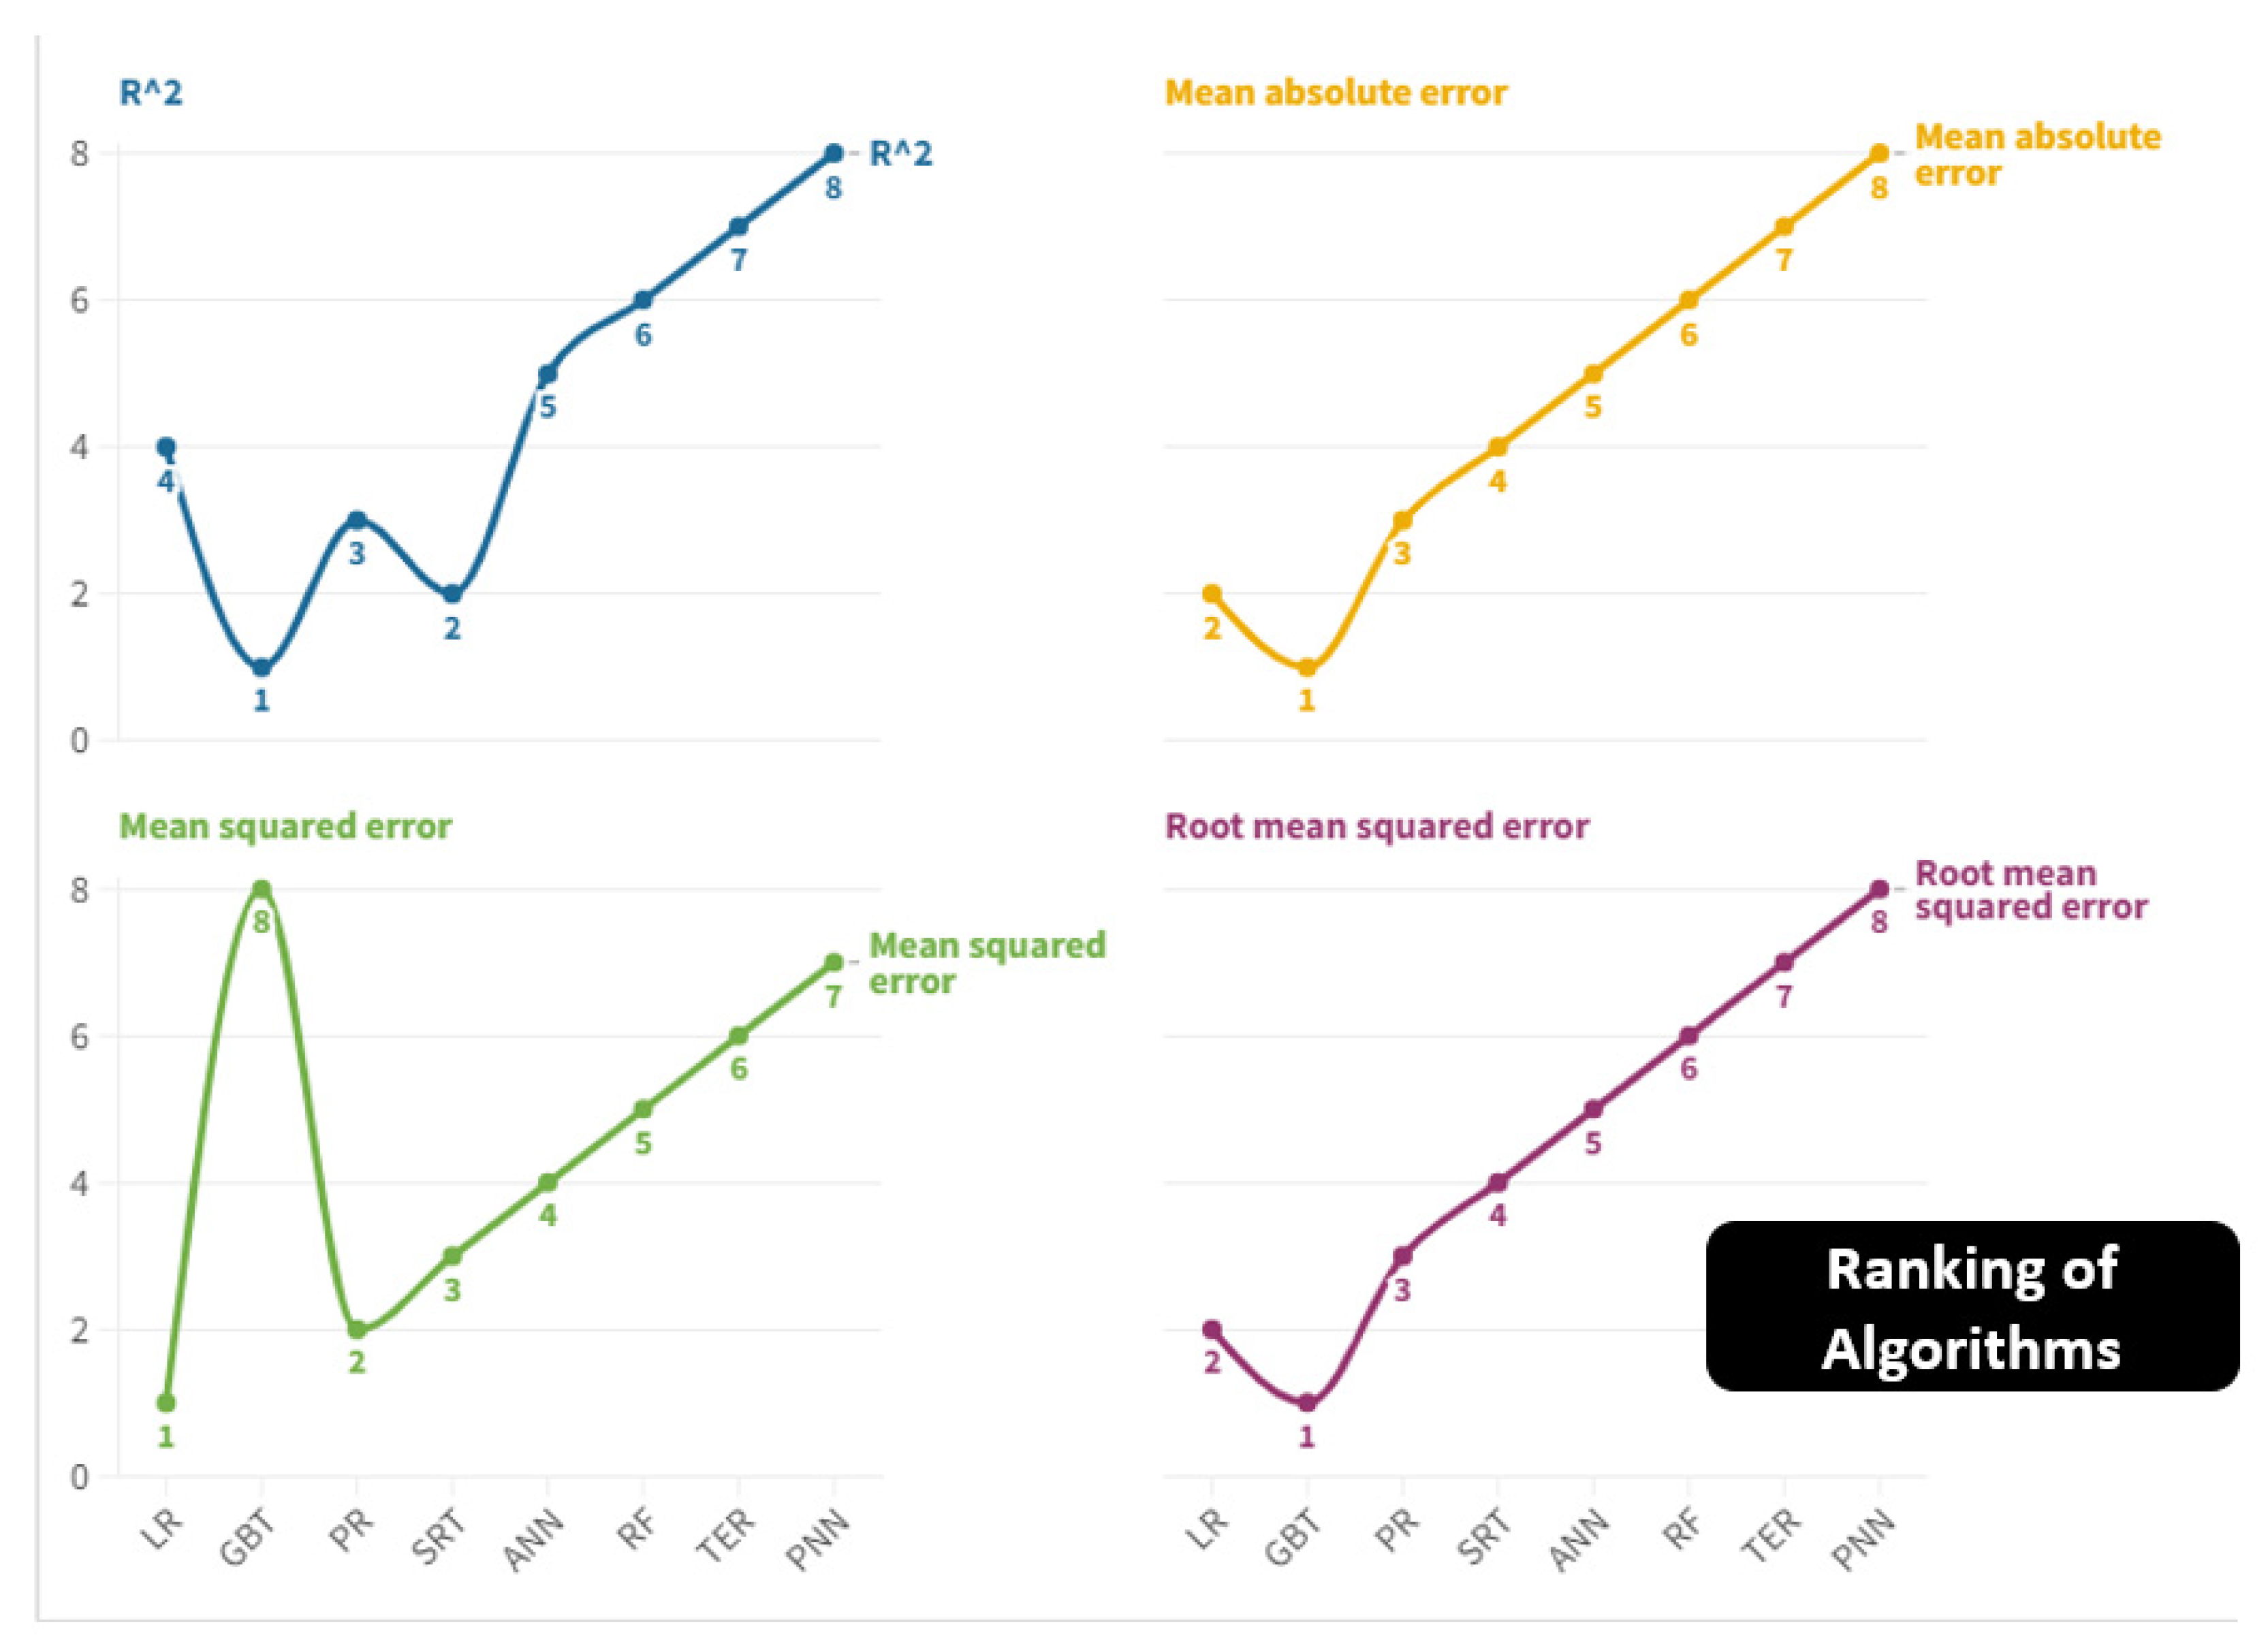
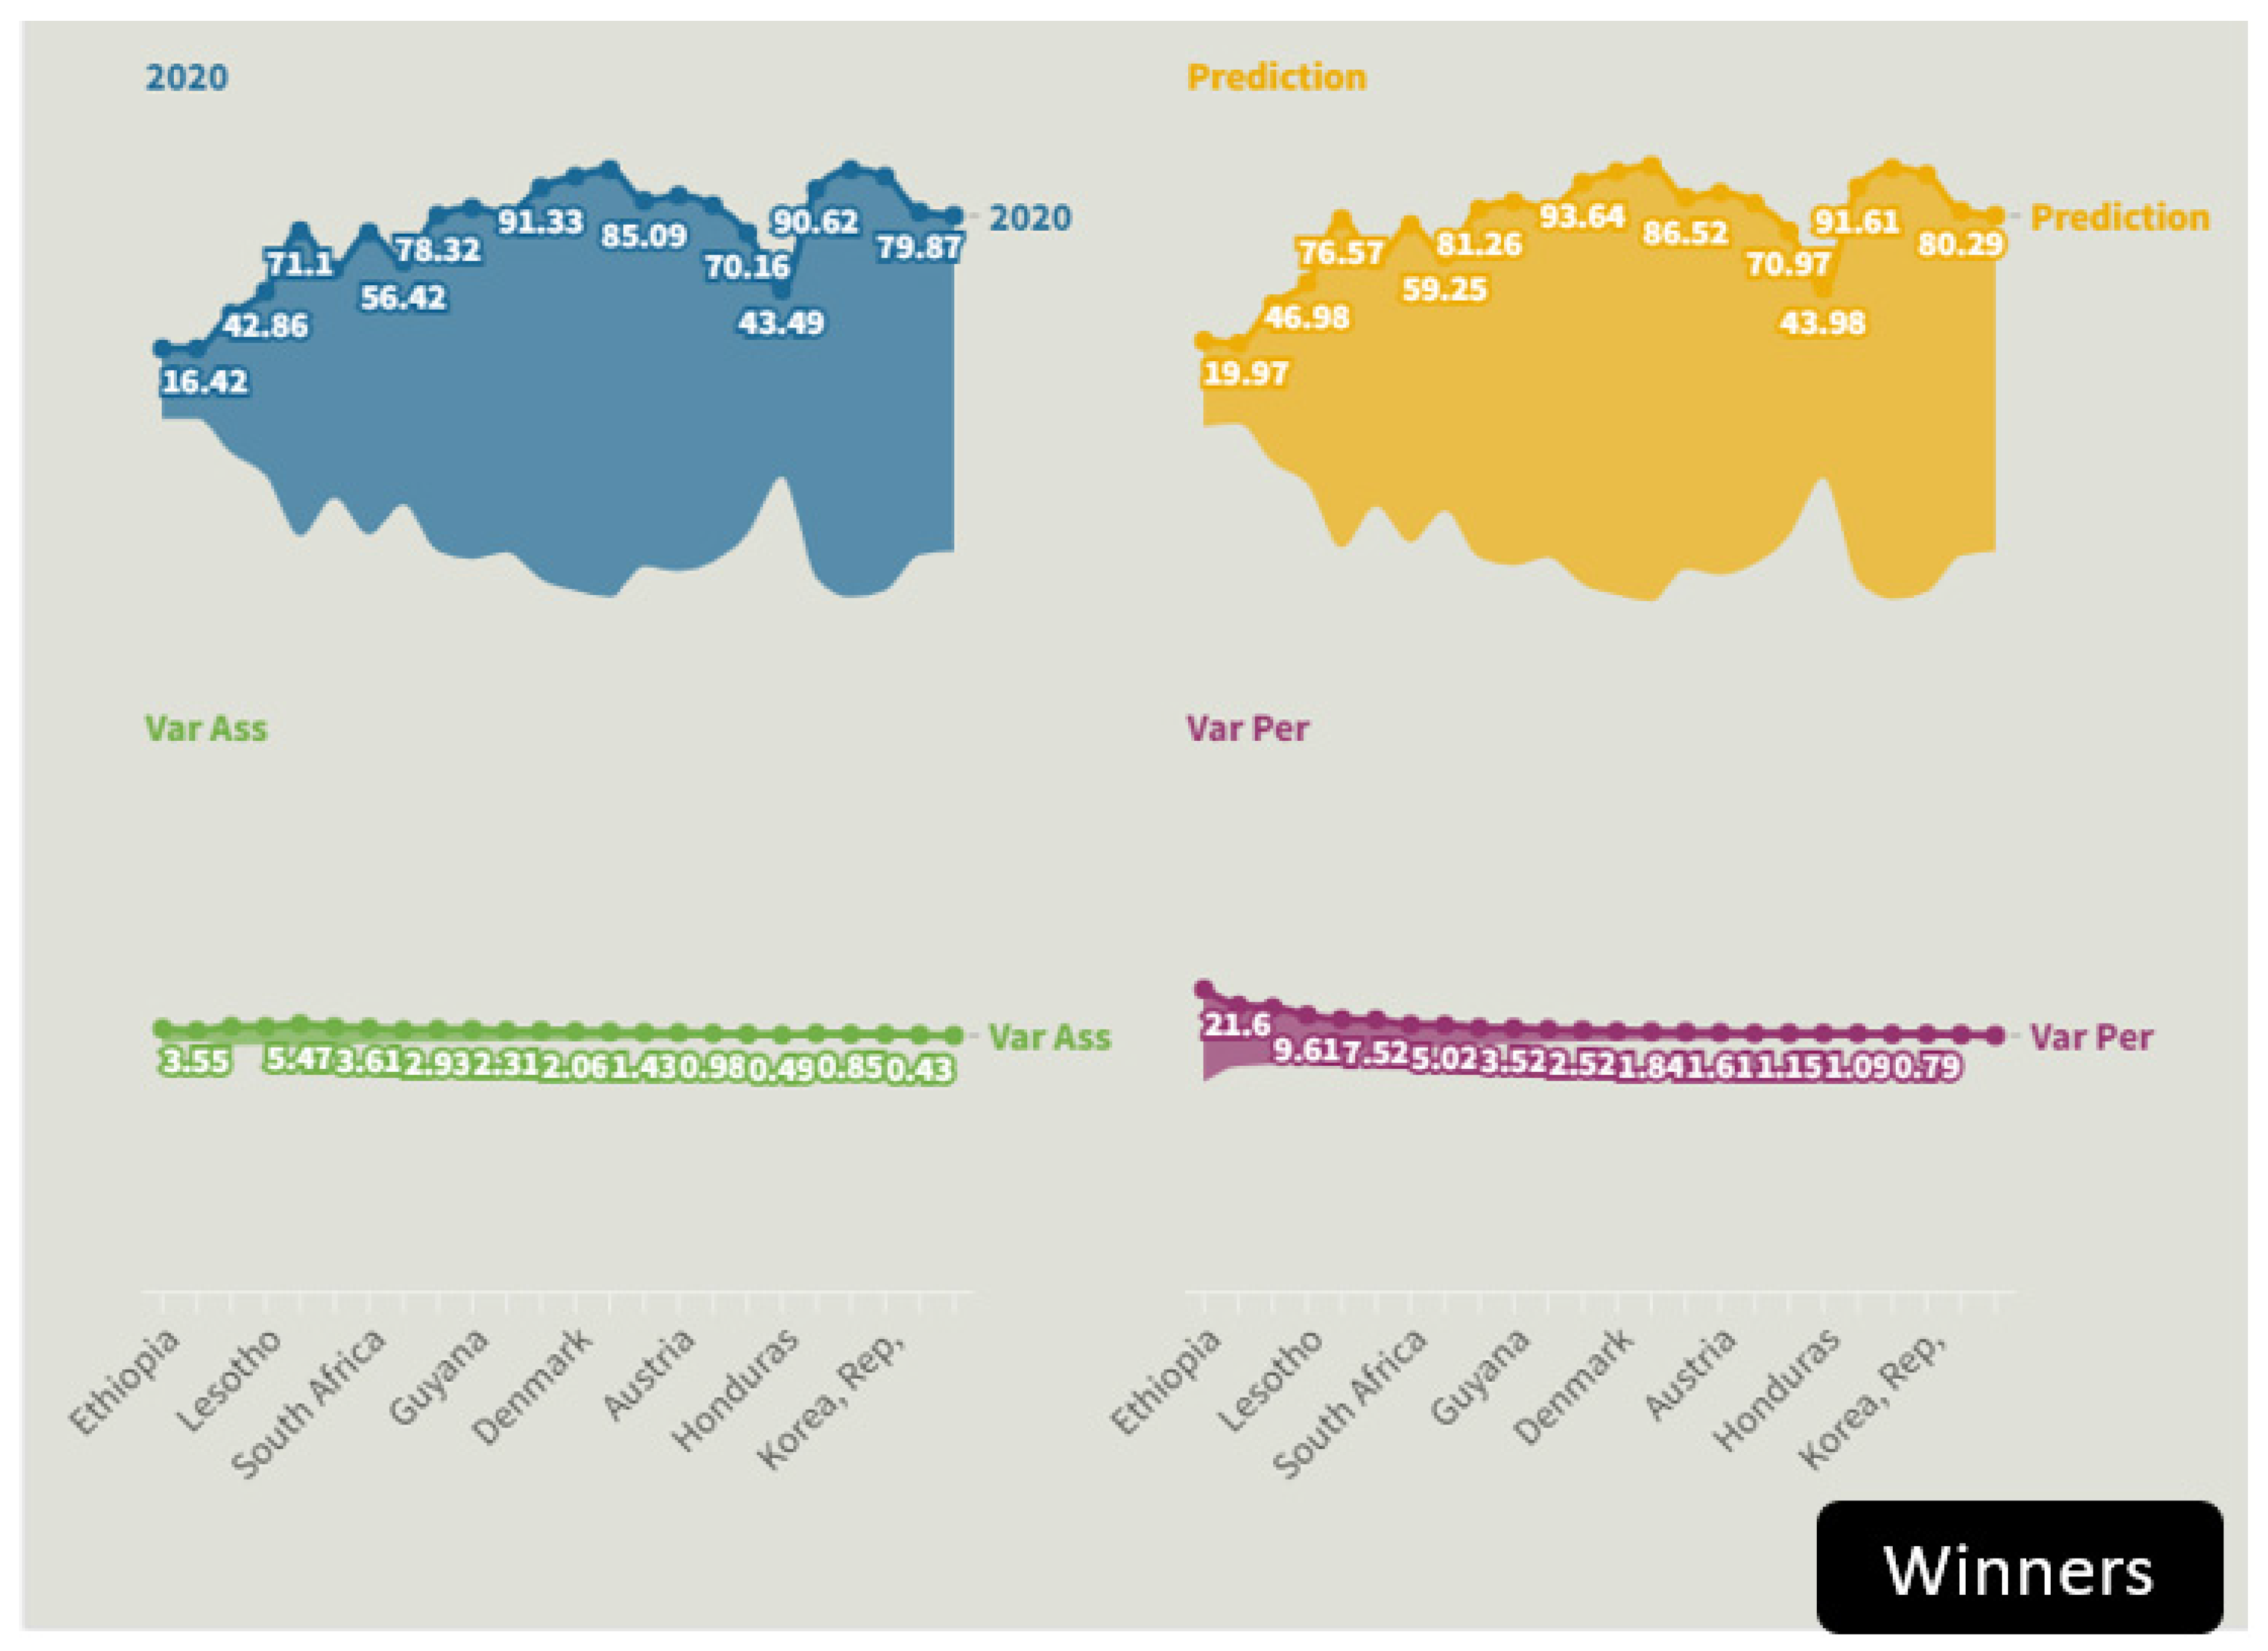
Therefore, by applying the set of statistical indicators it results that the Linear Regression algorithm is the best in the sense of prediction. Below we consider the top ten algorithms that are winners, i.e. countries for which a growth in the value of the IUI is expected, together with the top ten algorithms that are losers, i.e. countries for which a reduction in the value is expected. IUI value. Among the countries for which a significant growth in the value of IUI is expected, there are the following: Ethiopia with a value of +21.60%, Mozambique with +14.14%, Angola with +13.28%, Lesotho with +9.61%, Uzbekistan with 7.69%, Vanuatu with 7.52%, South Africa with 5.14%, Eswatini with 5.02%, Croatia with 3.75%, Guyana with 3.52%, Trinidad and Tobago with a value of 2.93%.
Figure 7.
Winners i.e. countries for which the Linear Regression algorithm predicts an increase in the level of Individual Using Internet.
Figure 7.
Winners i.e. countries for which the Linear Regression algorithm predicts an increase in the level of Individual Using Internet.
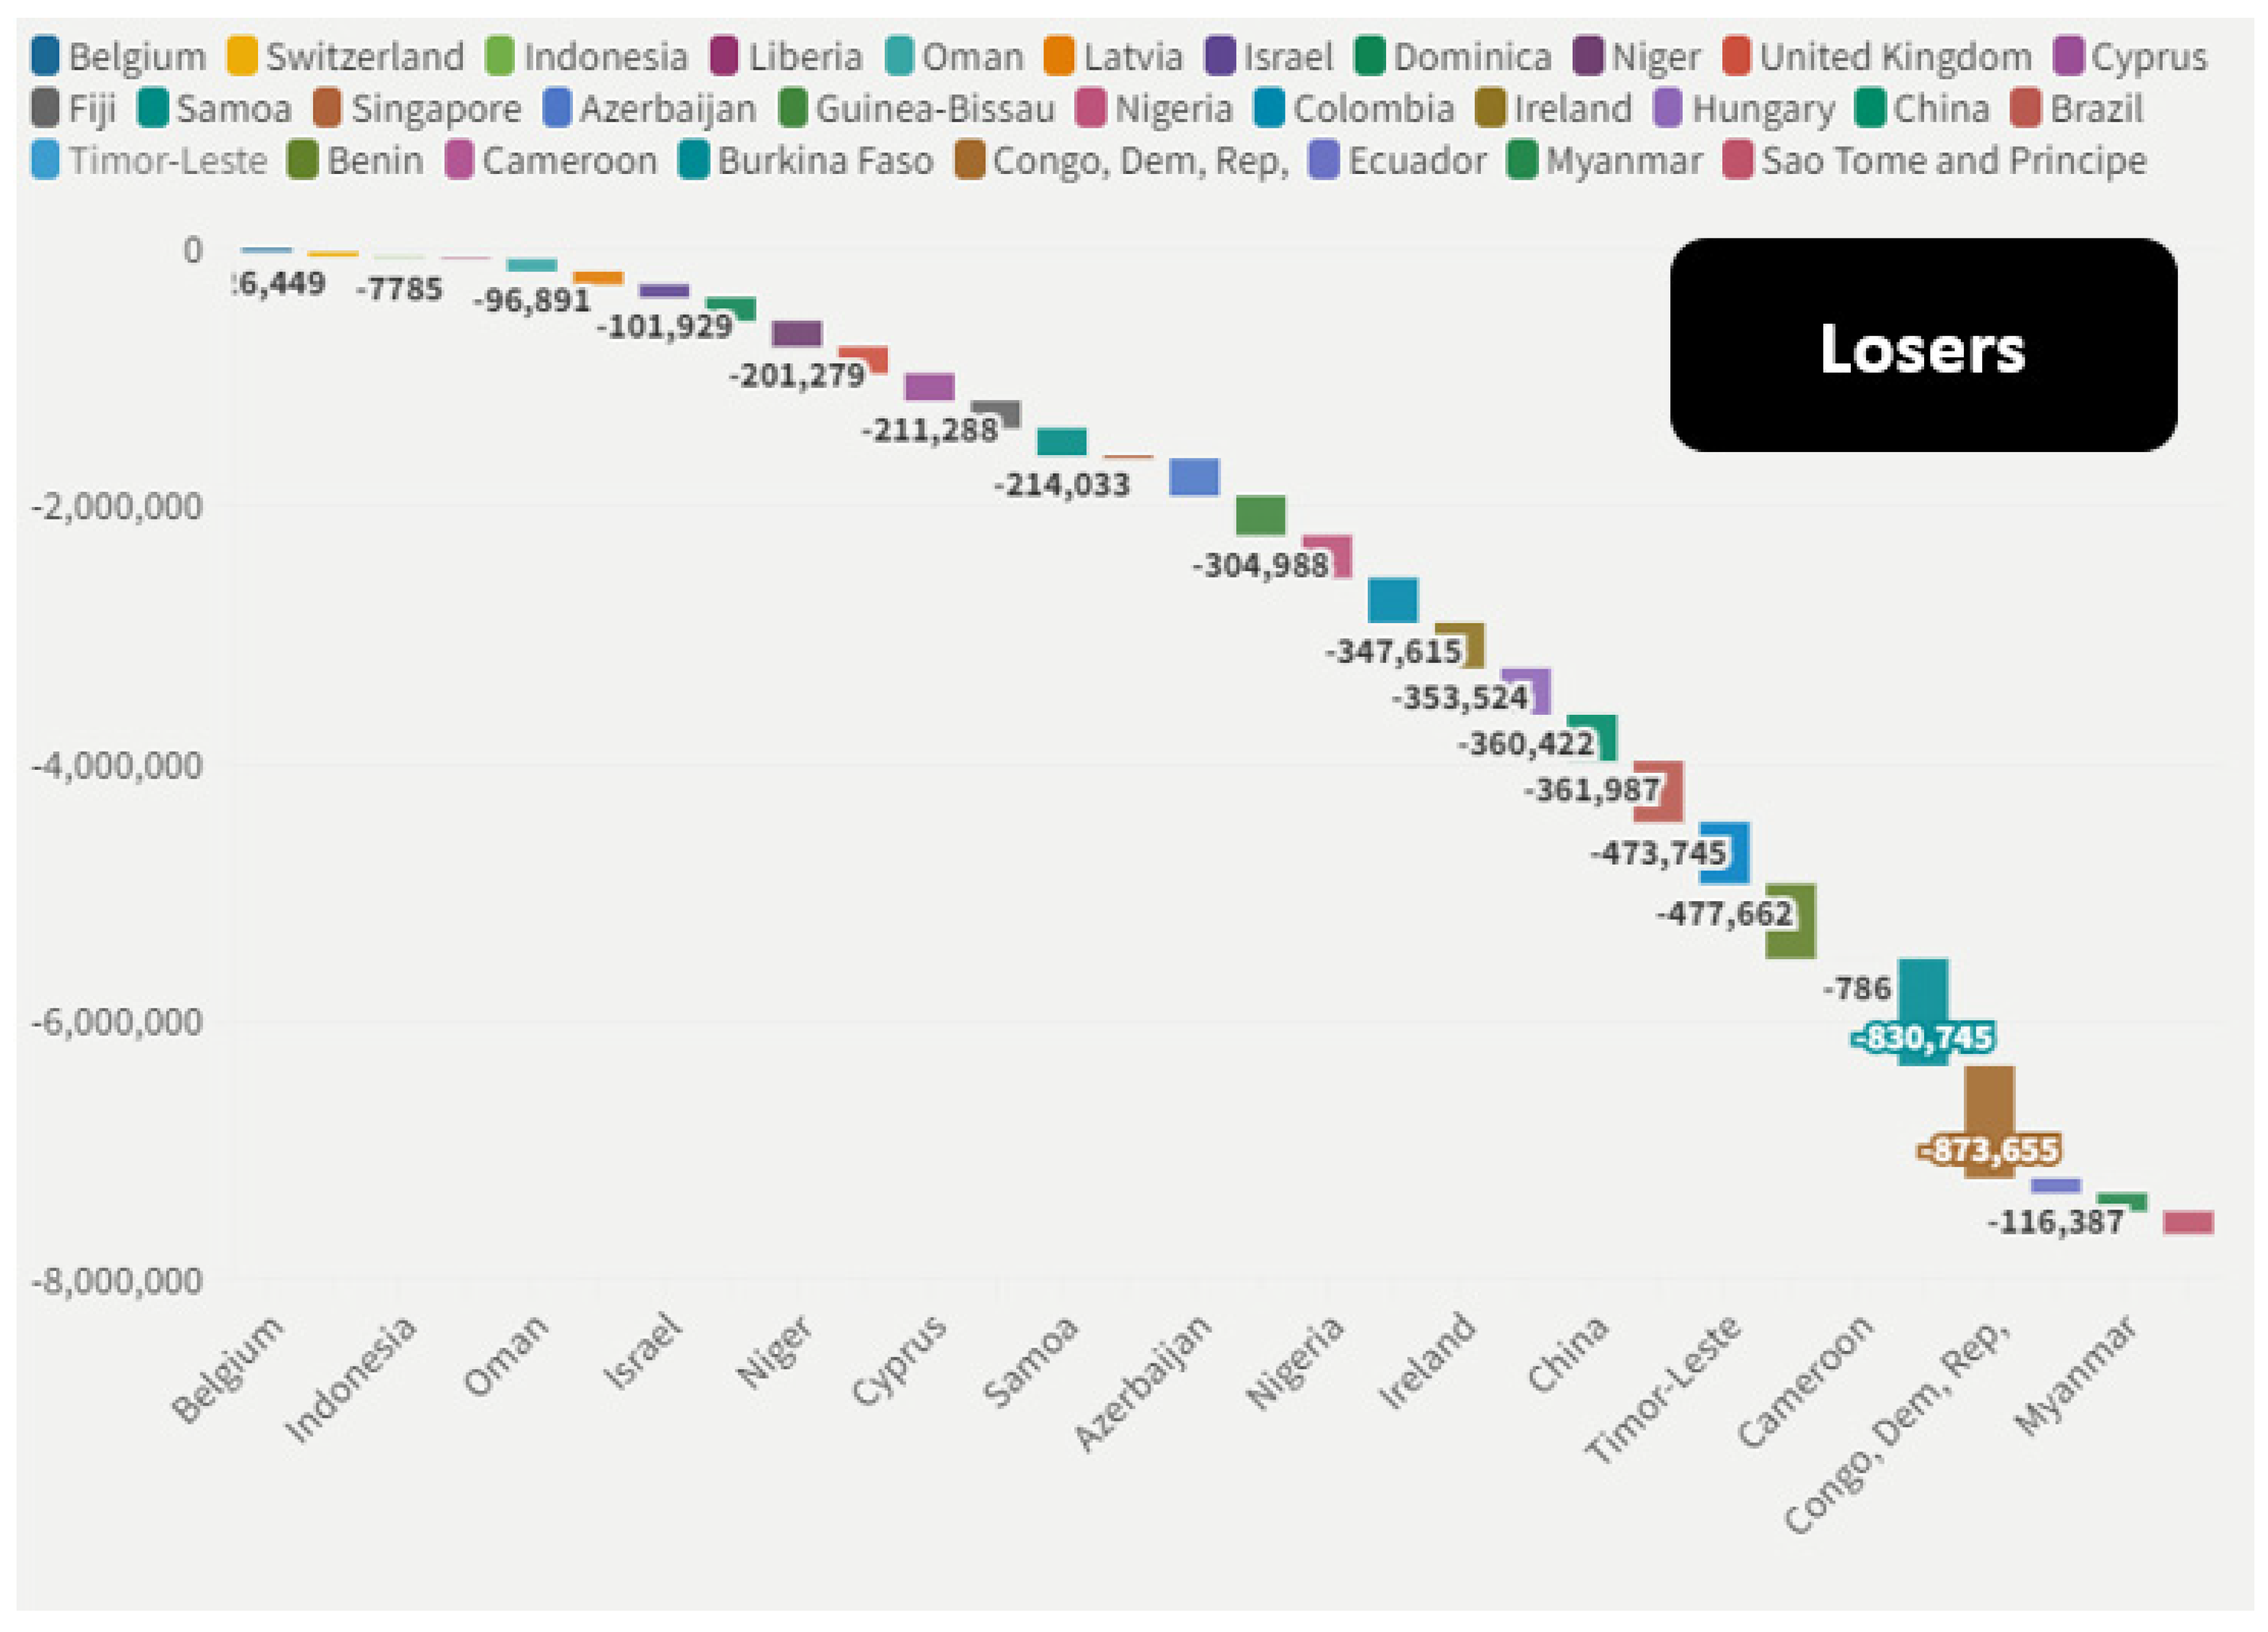
Always applying the Linear Regression algorithm it is also possible to identify the countries that are among the main losers or countries for which a reduction in IUI is predicted, i.e.: Brazil with an amount of -4.74%, Timor Leste with -4.78 %, Benin with -5.82%, Cameroon with -7.86%, Burkina Faso with -8.31, Congo Dem. Rep. with -8.74%, Ecuador with -11.64%, Myanmar with -14 ,12, Sao Tome and Principe with an amount of -17.46%.
Considering the value of the average of the countries analysed, it appears that the value of IUI is expected to decrease from an amount of 67.27 to a value of 67.01 or a reduction equal to an amount of -0.25 units equal to an amount by -0.30%. However, it is highly probable that the prediction is excessively flawed by the presence of missing values within the sample. That is, it cannot be excluded that the effective value of IUI is in any case increasing in the medium-long term.
Figure 8.
Losers i.e. countries for which the Linear Regression predicts a reduction in the level of Individuals Using Internet.
Figure 8.
Losers i.e. countries for which the Linear Regression predicts a reduction in the level of Individuals Using Internet.
6. Conclusions
The analysis show that IUI is positively associated to the ESG model variables except for “Fossil Fuel Energy Consumption” and “Renewable Energy Consumption”. The cluster analysis shows the presence of a positive relationship between GDP-per capita and IUI. Finally the predictive analysis indicates a perspective reduction in the level of IUI for an average value of 0.30%. Ideally internet should be positively associated to the ESG model. But this positive relationship is not a real necessity. In effect internet can also worsen the ESG condition at country level. To create a deep positive connection between IUI and the ESG model it is necessary to invest more in human capital and social capital to show that internet is not only an entertainment tool but it is also a tool to empower individuals and communities with learning and business opportunities.
Funding
The authors received no financial support for the research, authorship, and/or publication of this article.
Data Availability Statement
The data presented in this study are available on request from the corresponding author.
Declaration of Competing Interest
The authors declare that there is no conflict of interests regarding the publication of this manuscript. In addition, the ethical issues, including plagiarism, informed consent, misconduct, data fabrication and/or falsification, double publication.
Acknowledgements
We are grateful to the teaching staff of the LUM University “Giuseppe Degennaro” and to the management of the LUM Enterprise s.r.l. for the constant inspiration to continue our scientific research work undeterred.
Software
The authors have used the following software: Gretl for the econometric models, Orange for clusterization and network analysis, and KNIME for machine learning and predictions. They are all free version without licenses.
Appendix
| Lists of Variables of the Econometric Model | |||
| Acronym | Variable | Definition | |
| IUI | Individuals using the Internet (% of population) | Internet users are individuals who have used the Internet (from any location) in the last 3 months. The Internet can be used via a computer, mobile phone, personal digital assistant, games machine, digital TV etc. | |
| ACFT | Access to clean fuels and technologies for cooking (% of population) | Access to clean fuels and technologies for cooking is the proportion of total population primarily using clean cooking fuels and technologies for cooking. Under WHO guidelines, kerosene is excluded from clean cooking fuels. | |
| AE | Access to electricity (% of population) | Access to electricity is the percentage of population with access to electricity. Electrification data are collected from industry, national surveys and international sources. | |
| FPI | Food production index (2014-2016 = 100) | Food production index covers food crops that are considered edible and that contain nutrients. Coffee and tea are excluded because, although edible, they have no nutritive value. | |
| FFEC | Fossil fuel energy consumption (% of total) | Fossil fuels are non-renewable resources because they take millions of years to form, and reserves are being depleted much faster than new ones are being made. In developing economies growth in energy use is closely related to growth in the modern sectors - industry, motorized transport, and urban areas - but energy use also reflects climatic, geographic, and economic factors (such as the relative price of energy). Energy use has been growing rapidly in low- and middle-income economies, but high-income economies still use almost five times as much energy on a per capita basis. Total energy use refers to the use of primary energy before transformation to other end-use fuels (such as electricity and refined petroleum products). It includes energy from combustible renewables and waste - solid biomass and animal products, gas and liquid from biomass, and industrial and municipal waste. Biomass is any plant matter used directly as fuel or converted into fuel, heat, or electricity. | |
| ME | Methane emissions (metric tons of CO2 equivalent per capita) | Methane emissions are those stemming from human activities such as agriculture and from industrial methane production. | |
| PUSS | People using safely managed sanitation services (% of population) | The percentage of people using improved sanitation facilities that are not shared with other households and where excreta are safely disposed of in situ or transported and treated offsite. Improved sanitation facilities include flush/pour flush to piped sewer systems, septic tanks or pit latrines: ventilated improved pit latrines, compositing toilets or pit latrines with slabs. | |
| RFM | Ratio of female to male labor force participation rate (%) (modeled ILO estimate) | Labor force participation rate is the proportion of the population ages 15 and older that is economically active: all people who supply labor for the production of goods and services during a specified period. Ratio of female to male labor force participation rate is calculated by dividing female labor force participation rate by male labor force participation rate and multiplying by 100. | |
| REC | Renewable energy consumption (% of total final energy consumption) | Renewable energy consumption is the share of renewable energy in total final energy consumption. | |
| Random-effects (GLS), using 1930 observations | |||
| Included 193 cross-sectional units | |||
| Time-series length = 10 | |||
| Dependent variable: A32 | |||
| Coefficient | Std. Error | z | p-value | ||
| const | 8.62575 | 1.83895 | 4.691 | <0.0001 | *** |
| A1 | 0.0595520 | 0.0139070 | 4.282 | <0.0001 | *** |
| A2 | 0.127424 | 0.0218061 | 5.844 | <0.0001 | *** |
| A21 | 0.0532831 | 0.0169305 | 3.147 | 0.0016 | *** |
| A23 | −0.148870 | 0.0149846 | −9.935 | <0.0001 | *** |
| A39 | 1.14775 | 0.257813 | 4.452 | <0.0001 | *** |
| A45 | 0.455231 | 0.0298238 | 15.26 | <0.0001 | *** |
| A54 | 0.0834555 | 0.0266459 | 3.132 | 0.0017 | *** |
| A57 | −0.174714 | 0.0310490 | −5.627 | <0.0001 | *** |
| Mean dependent var | 39.65713 | S.D. dependent var | 32.69885 | |
| Sum squared resid | 1064517 | S.E. of regression | 23.53421 | |
| Log-likelihood | −8830.361 | Akaike criterion | 17678.72 | |
| Schwarz criterion | 17728.81 | Hannan-Quinn | 17697.15 | |
| rho | 0.486541 | Durbin-Watson | 0.959356 |
| 'Between' variance = 201.083 |
| 'Within' variance = 249.699 |
| theta used for quasi-demeaning = 0.667644 |
| Joint test on named regressors - |
| Asymptotic test statistic: Chi-square(8) = 689.44 |
| with p-value = 1.34302e-143 |
| Breusch-Pagan test - |
| Null hypothesis: Variance of the unit-specific error = 0 |
| Asymptotic test statistic: Chi-square(1) = 2028.74 |
| with p-value = 0 |
| Hausman test - |
| Null hypothesis: GLS estimates are consistent |
| Asymptotic test statistic: Chi-square(8) = 108.32 |
| with p-value = 8.4269e-20 |
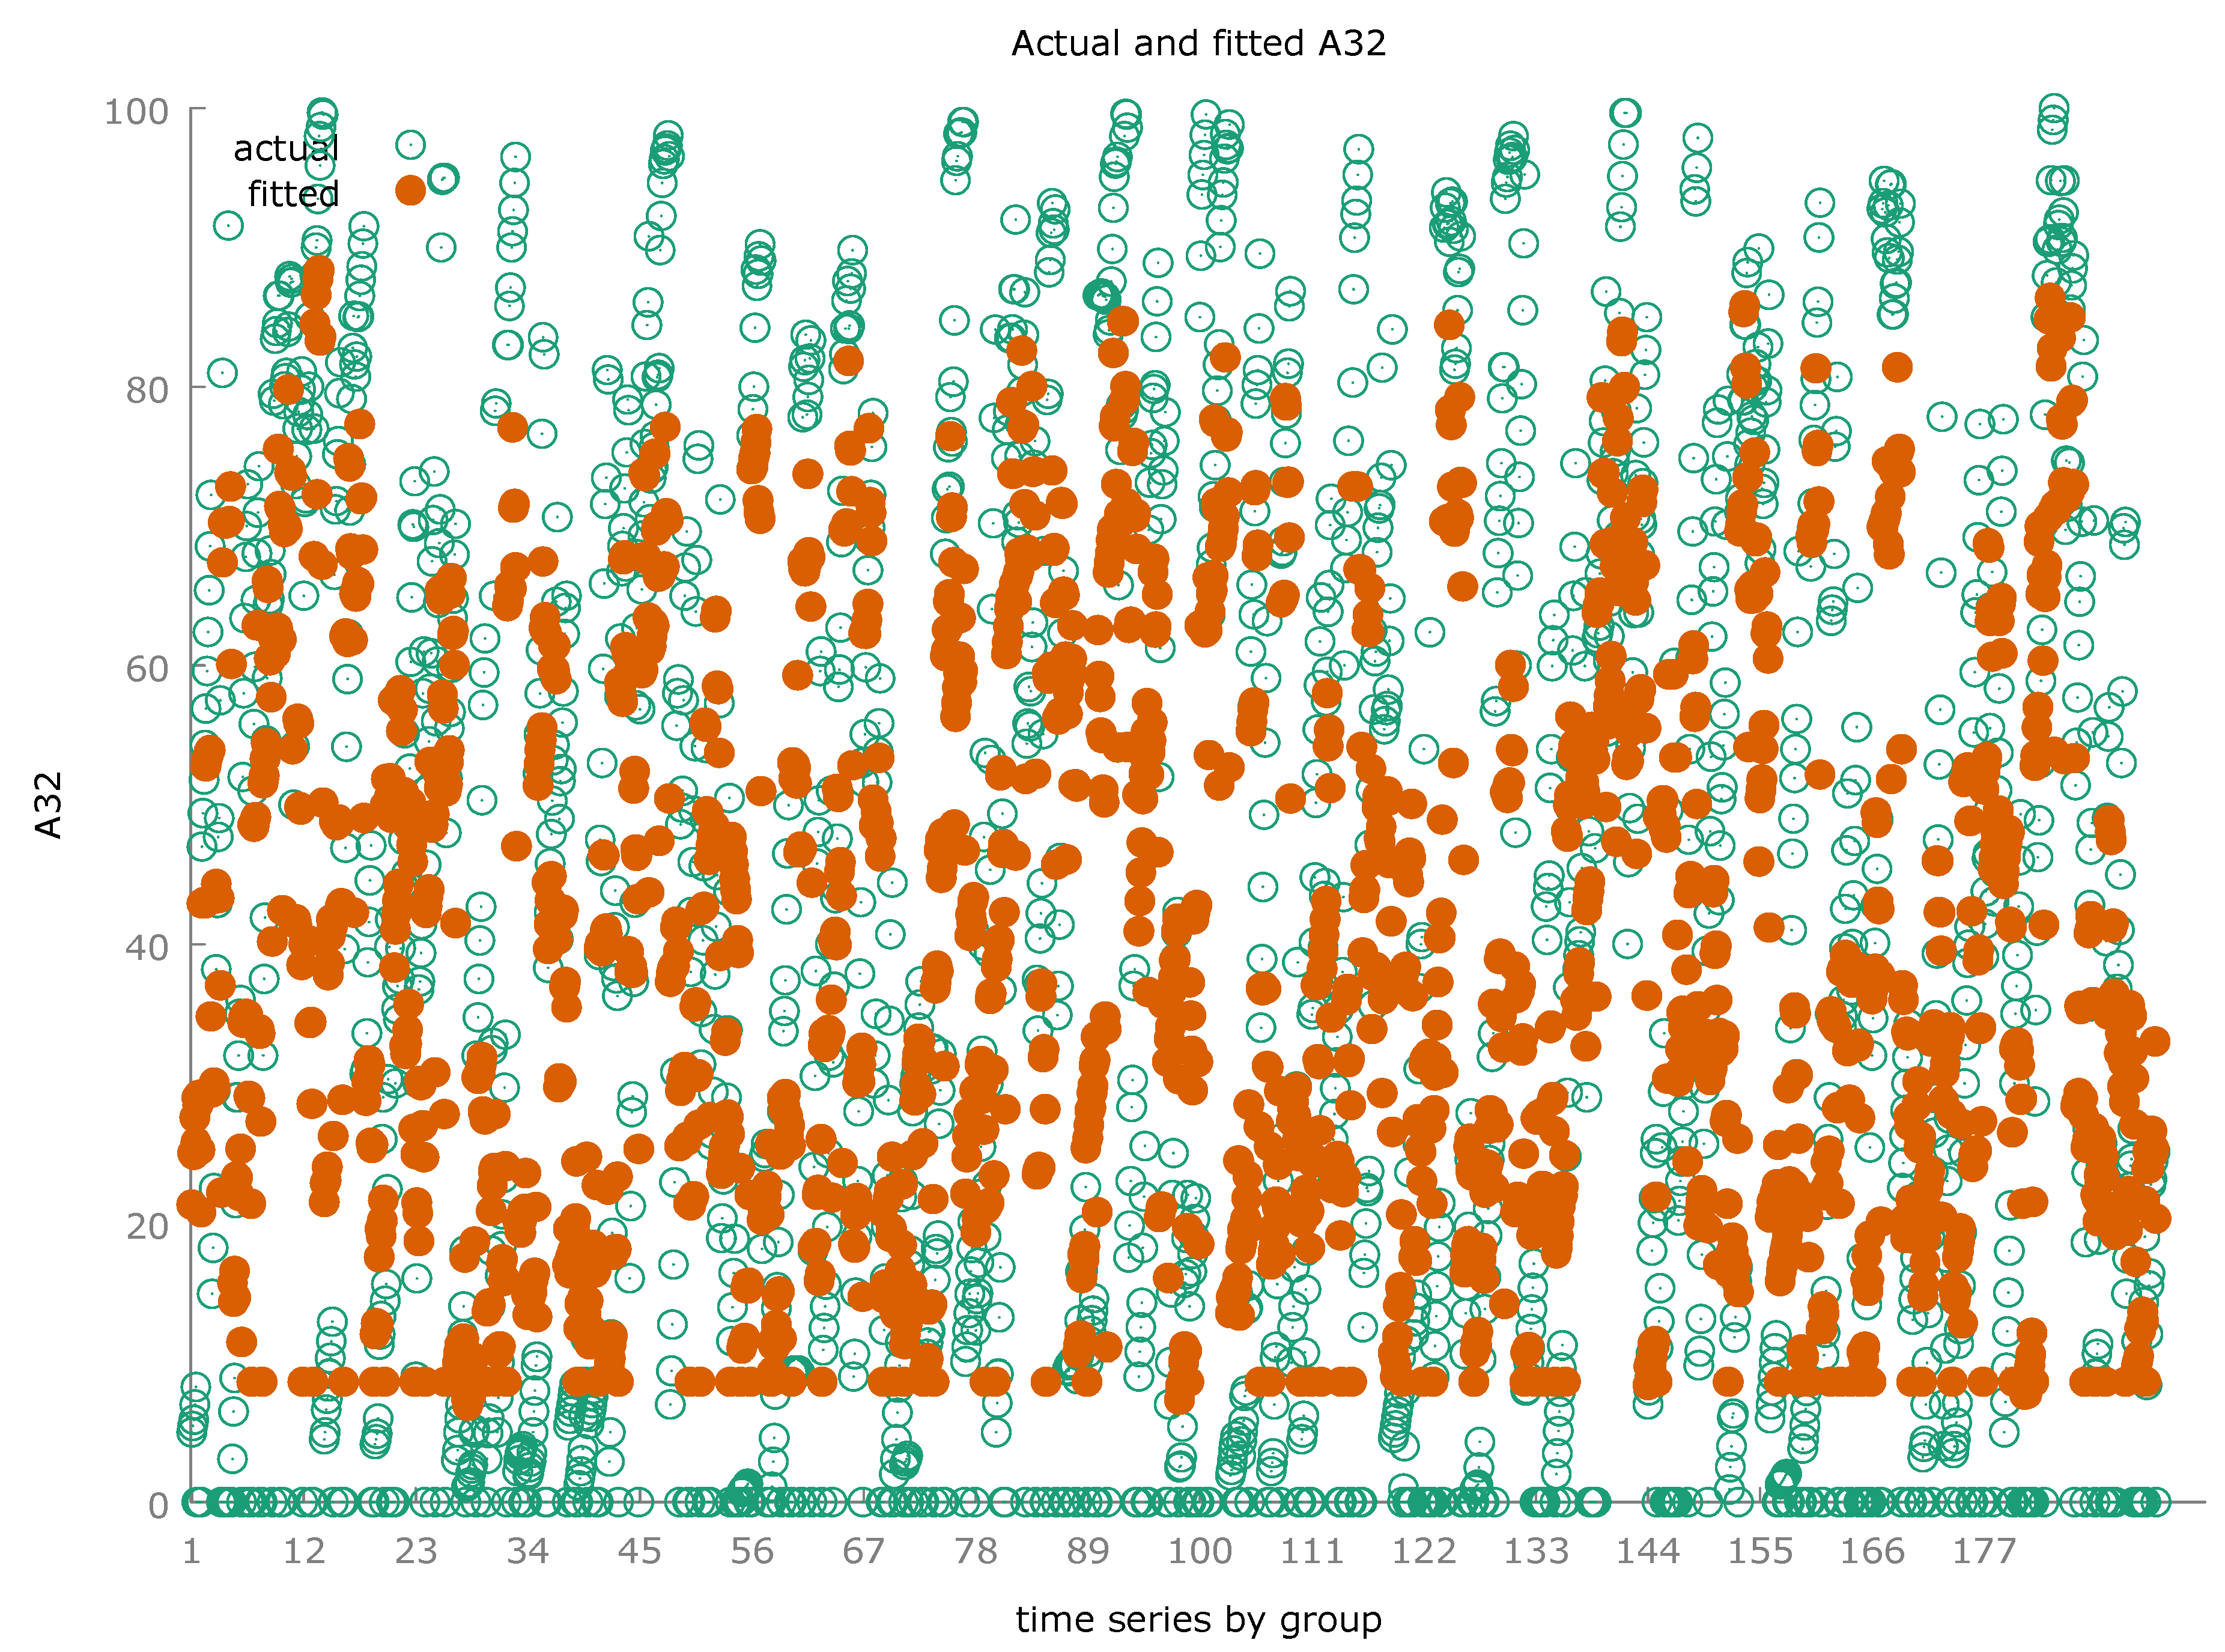
| Fixed-effects, using 1930 observations |
| Included 193 cross-sectional units |
| Time-series length = 10 |
| Dependent variable: A32 |
| Coefficient | Std. Error | t-ratio | p-value | ||
| const | 15.0189 | 3.55394 | 4.226 | <0.0001 | *** |
| A1 | 0.0510607 | 0.0138921 | 3.676 | 0.0002 | *** |
| A2 | 0.119318 | 0.0259196 | 4.603 | <0.0001 | *** |
| A21 | 0.0337348 | 0.0175672 | 1.920 | 0.0550 | * |
| A23 | −0.155182 | 0.0150054 | −10.34 | <0.0001 | *** |
| A39 | 1.18922 | 0.305163 | 3.897 | 0.0001 | *** |
| A45 | 0.313768 | 0.0928271 | 3.380 | 0.0007 | *** |
| A54 | 0.0687515 | 0.0331285 | 2.075 | 0.0381 | ** |
| A57 | −0.0961181 | 0.0339625 | −2.830 | 0.0047 | *** |
| Mean dependent var | 39.65713 | S.D. dependent var | 32.69885 | |
| Sum squared resid | 431730.4 | S.E. of regression | 15.80188 | |
| LSDV R-squared | 0.790678 | Within R-squared | 0.160960 | |
| LSDV F(200, 1729) | 32.65495 | P-value(F) | 0.000000 | |
| Log-likelihood | −7959.473 | Akaike criterion | 16320.95 | |
| Schwarz criterion | 17439.57 | Hannan-Quinn | 16732.42 | |
| rho | 0.486541 | Durbin-Watson | 0.959356 |
| Joint test on named regressors - |
| Test statistic: F(8, 1729) = 41.4612 |
| with p-value = P(F(8, 1729) > 41.4612) = 5.93111e-61 |
| Test for differing group intercepts - |
| Null hypothesis: The groups have a common intercept |
| Test statistic: F(192, 1729) = 12.0954 |
| with p-value = P(F(192, 1729) > 12.0954) = 3.7502e-210 |
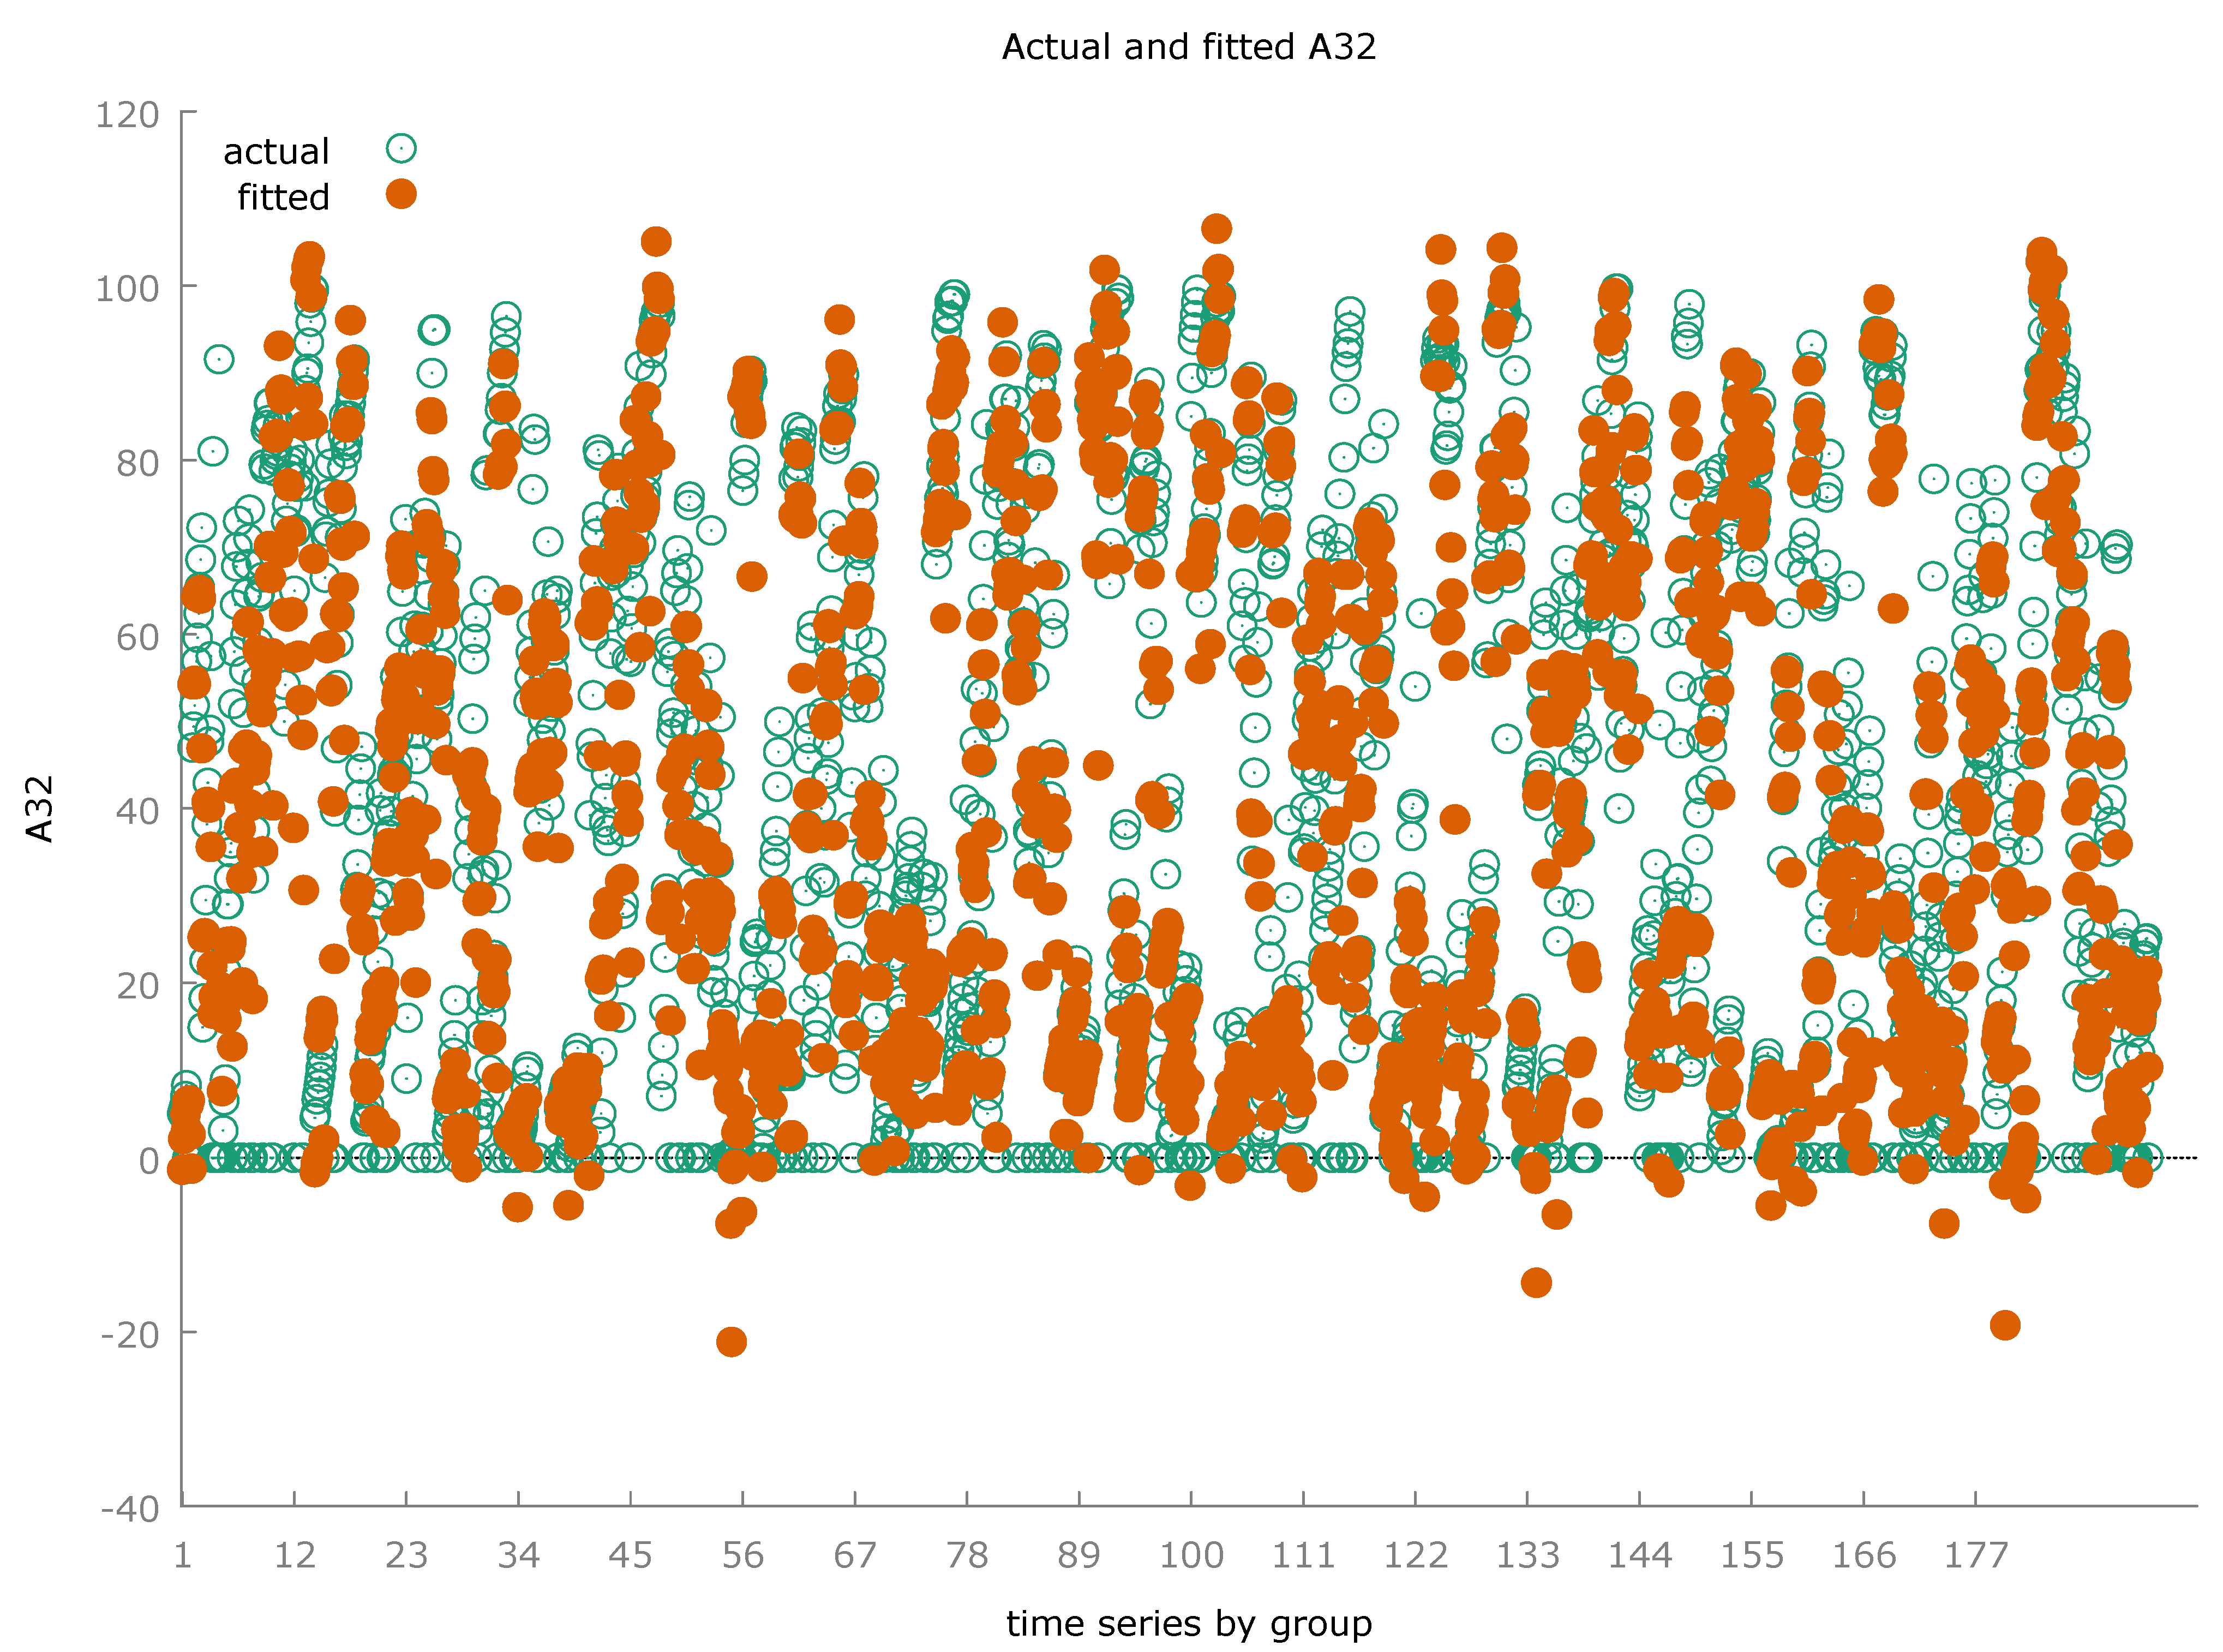
| Pooled OLS, using 1930 observations |
| Included 193 cross-sectional units |
| Time-series length = 10 |
| Dependent variable: A32 |
| Coefficient | Std. Error | t-ratio | p-value | ||
| const | 3.54718 | 1.50606 | 2.355 | 0.0186 | ** |
| A1 | 0.104497 | 0.0170954 | 6.113 | <0.0001 | *** |
| A2 | 0.134299 | 0.0203200 | 6.609 | <0.0001 | *** |
| A21 | 0.0891069 | 0.0189375 | 4.705 | <0.0001 | *** |
| A23 | −0.133426 | 0.0189349 | −7.047 | <0.0001 | *** |
| A39 | 1.09063 | 0.196854 | 5.540 | <0.0001 | *** |
| A45 | 0.420027 | 0.0158854 | 26.44 | <0.0001 | *** |
| A54 | 0.169803 | 0.0204120 | 8.319 | <0.0001 | *** |
| A57 | −0.328740 | 0.0277429 | −11.85 | <0.0001 | *** |
| Mean dependent var | 39.65713 | S.D. dependent var | 32.69885 | |
| Sum squared resid | 1011612 | S.E. of regression | 22.94792 | |
| R-squared | 0.509525 | Adjusted R-squared | 0.507483 | |
| F(8, 1921) | 249.4516 | P-value(F) | 1.4e-290 | |
| Log-likelihood | −8781.169 | Akaike criterion | 17580.34 | |
| Schwarz criterion | 17630.43 | Hannan-Quinn | 17598.76 | |
| rho | 0.830382 | Durbin-Watson | 0.440232 |
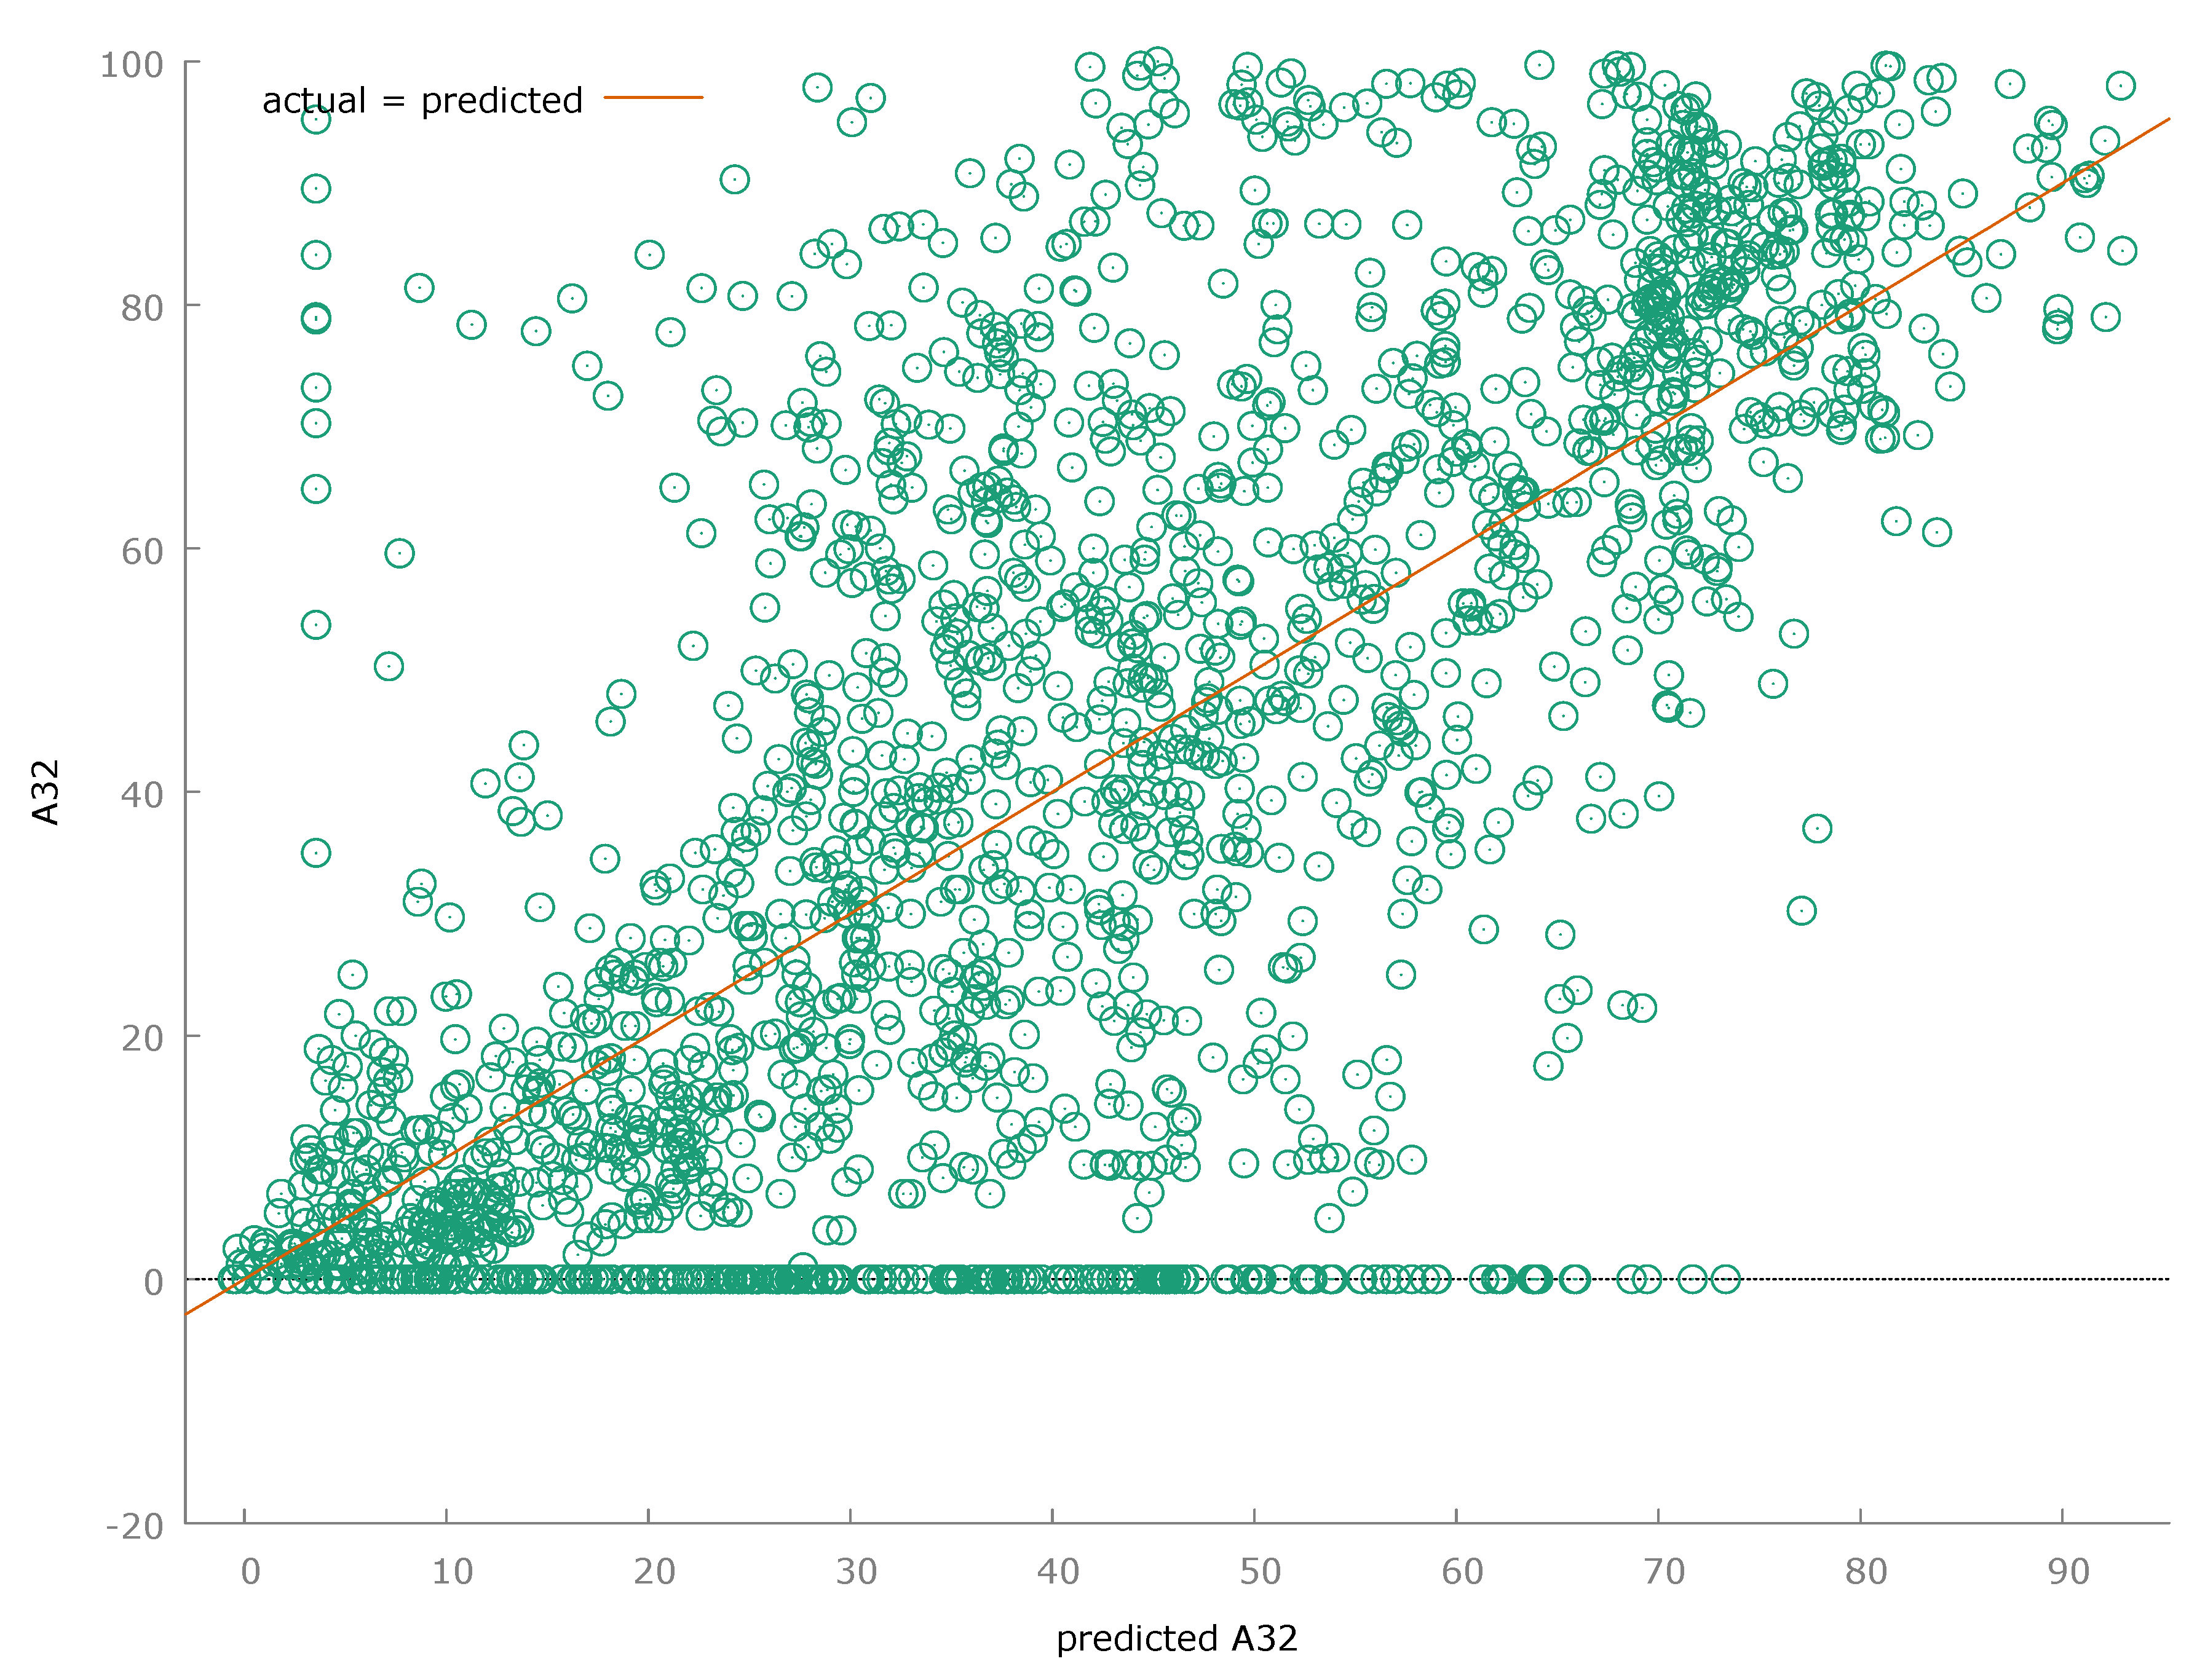

References
- H. Ismail, F. Febiyanto e J. V. Moniaga, «Methods to prevent privacy violations on the internet on the personal level in Indonesia,» Procedia Computer Science, vol. 216, pp. 650-654, 2023. [CrossRef]
- H. S. Ünal, «The Effect of ICT Usage on the Tax Evasion,» Balkan and Near Eastern Journal of Social Sciences, vol. 5, n. 4, 2019.
- A. Lapatinas, «The effect of the Internet on economic sophistication: An empirical analysis,» Economics Letters, vol. 174, pp. 35-38, 2019. [CrossRef]
- T. A. Aderibigbe, «THE EFFECTS OF TRADE FACILITATION ON TRADE FLOWS IN NIGERIA,» ACU Journal of Social and Management Sciences, vol. 3, n. 1, 2022.
- M. S. Al-Ani, «ICT Parameters: Comparative Study for Future Aspects,» International Journal of Business and ICT, vol. 3, n. 1-2, 2017.
- M. N. Çoban, «The Effect of the Internet on Inflation: A Research on ASEAN-5 Countries,» JAS-Journal of ASEAN Studies, vol. 10, n. 1, 2022. [CrossRef]
- N. Abdul Wahab, S. Nayan e Y. K. Cheah, «Internet user and economic selected Southeast Asia nations: a panel data analysis,» Journal of Emerging Economies & Islamic Research, vol. 8, n. 3, pp. 17-25, 2020. [CrossRef]
- N. Adeleye e C. Eboagu, «Evaluation of ICT development and economic growth in Africa.,» NETNOMICS: Economic research and electronic networking, vol. 20, pp. 31-53, 2019. [CrossRef]
- T. Garín-Muñoz, T. Pérez-Amaral e Á. Valarezo, «Evolution of the internet gender gaps in Spain and effects of the Covid-19 pandemic,» Telecommunications Policy, vol. 46, n. 8, p. 102371, 2022. [CrossRef]
- M. Oesterreich, «Dynamics of changes in the level of propensity to use the Internet in European Union countries in 2010-2019,» Prace Naukowe Uniwersytetu Ekonomicznego we Wrocławiu, vol. 64, n. 7, pp. 102-117, 2020. [CrossRef]
- S. Gomes e J. M. Lopes, «ICT access and entrepreneurship in the open innovation dynamic context: Evidence from OECD countries,» Journal of Open Innovation: Technology, Market, and Complexity, vol. 2, n. 102, p. 8, 2022. [CrossRef]
- Y. Tan e X. Li, «The impact of internet on entrepreneurship,» International Review of Economics & Finance, vol. 77, pp. 135-142, 2022. [CrossRef]
- P. C. Widianto, H. P. Sari e D. Fadhilawati, «The The Role of the Internet on the Learning Ability of Elementary School Students,» Advances in Educational Technology, vol. 2, n. 1, pp. 18-24, 2023.
- M. Hedvicakova e L. Svobodova, «Internet use by elderly people in the czech republic,» Digital Nations–Smart Cities, Innovation, and Sustainability: 16th IFIP WG 6.11 Conference on e-Business, e-Services, and e-Society, I3E 2017, n. Delhi, India, , 2017. [CrossRef]
- D. F. Mueller e I. Bertschek, «Political Ignorance and the Internet.,» ZEW-Centre for European Economic Research Discussion Paper, pp. 21-106, 2021. [CrossRef]
- C. H. R. I. S. CHAO SU, J. LIU e B. ZHOU, «Two Levels of Digitalization and Internet Use Across Europe, China, and the US,» International Journal of Communication , vol. 19328036, n. 14, 2020.
- M. Hedvicakova e L. Svobodova, «The Use of Internet Banking in the Czech Republic». [CrossRef]
Disclaimer/Publisher’s Note: The statements, opinions and data contained in all publications are solely those of the individual author(s) and contributor(s) and not of MDPI and/or the editor(s). MDPI and/or the editor(s) disclaim responsibility for any injury to people or property resulting from any ideas, methods, instructions or products referred to in the content. |
© 2023 by the authors. Licensee MDPI, Basel, Switzerland. This article is an open access article distributed under the terms and conditions of the Creative Commons Attribution (CC BY) license (http://creativecommons.org/licenses/by/4.0/).
Copyright: This open access article is published under a Creative Commons CC BY 4.0 license, which permit the free download, distribution, and reuse, provided that the author and preprint are cited in any reuse.


