
Submitted:
21 June 2023
Posted:
22 June 2023
You are already at the latest version
Abstract
The possibility of increasing the resource of steel fingers working in tandem with bronze bushings by plasma-electrolytic nitrocarburizing of the surface of medium carbon steel is shown. The phase composition, microhardness, morphology and surface roughness were studied. Tribological tests were carried out under dry friction conditions according to the shaft-pad scheme. It has been established that plasma-electrolytic nitrocarburizing of the surface of medium carbon steel at a temperature of 700 °C for 5 minutes leads to a decrease in a friction coefficient by 2.3 times, weight wear of steel by 24.9 times, and bronze counterbody by 5.9 times. At the same time, the contact stiffness increases 2.6 times. The type of wear is fatigue with dry friction and plastic contact. Changes in tribological characteristics are associated with the high hardness of the hardened steel surface together with the influence of dispersed nitrides and iron carbonitrides distributed in it.
Keywords:
plasma electrolyte nitrocarburizing
; medium carbon steel
; bronze
; friction
; wear
; microhardness
; roughness
1. Introduction
The main indicators of the quality of machines are their reliability and durability. To ensure higher reliability of machine parts and mechanisms, it is often necessary to select the material, sacrificing its wear resistance. In friction units and joints, the friction of hardened steel on hardened steel is widely used. Meanwhile, in some cases, such a combination of metals can be catastrophic due to the occurrence of scuffing and subsequent seizing. The transition to bronze counterbodies worsens the wear resistance of the friction pair, but at the same time increases its reliability. At the same time, it is often important to avoid increased wear of the counterbody, which is not a consumable part and has a high cost.
Technologies of plasma electrolytic treatment have found application in applying protective ceramic coatings on the surfaces of metals of the valve group, polishing metal surfaces, and also forming hardened diffusion layers on steels and titanium alloys [3,4,5,6,7,8,9,10,11,12,13,14].
In this paper, we solve the problem of increasing the resource of fingers made of structural medium carbon steel 45, which work in tandem with bronze bushings. For this, the steel surface is hardened by plasma electrolytic treatment, which ensures maximum wear resistance of the friction pair.
A promising direction for increasing the resource of metal parts is high-speed plasma electrolytic nitrocarburizing (PENC). The duration of hardening is only a few minutes, no preliminary preparation of the surface is required. The part is connected to the positive terminal of a power source and is an anode during processing. Heating of the anode part in aqueous electrolytes to temperatures from 400 to 1100 °C is a consequence of local boiling of the electrolyte near the anode surface, which leads to the formation of a continuous and stable vapor-gas envelope. The speed of heating the part in the vapor-gas envelope to the desired temperature is hundreds of degrees per second. The emission of electrolyte components into the vapor-gas envelope makes diffusion saturation of the part surface possible. High heating rates contribute to a reduction in the size of the austenite grain, as well as to the refinement of blocks inside the austenite grain, which increases its diffusion susceptibility [15,16,17,18]. Simultaneous diffusion saturation with nitrogen and carbon provides an increase in hardness, wear resistance, fatigue strength, ductility and impact strength of steel products [19,20].
The above arguments justify the use of PENC to increase the life of medium carbon steel pins, working in tandem with bronze bushings with severe wear of both pins and bushings. The aim of the work was to study the features of friction and wear of medium carbon steel after PENC when working on tin-lead bronze.
2. Materials and Methods
2.1. Samples Processing
PENC samples from medium carbon steel (0.42-0.5 C, 0.17-0.37 Si, 0.5-0.8 Mn, ≤ 0.25 Ni, ≤ 0.04 S, ≤ 0.035 P, ≤ 0.25 Cr, ≤ 0.25 Cu, ≤ 0.08 As, and balance Fe) was carried out at various control parameters of the process to find the optimal processing modes that provide a certain set of required properties. PENC was carried out in an aqueous electrolyte solution of the composition: ammonium chloride NH4Cl (10%), carbamide (NH2)2CO (20%). The electrolyte based on carbamide was chosen because this substance is both a source of nitrogen and carbon and is characterized by low cost and environmental safety. The treatment temperature was varied from 550 to 850°C in steps of 50°C. The PENC time was 5 minutes.
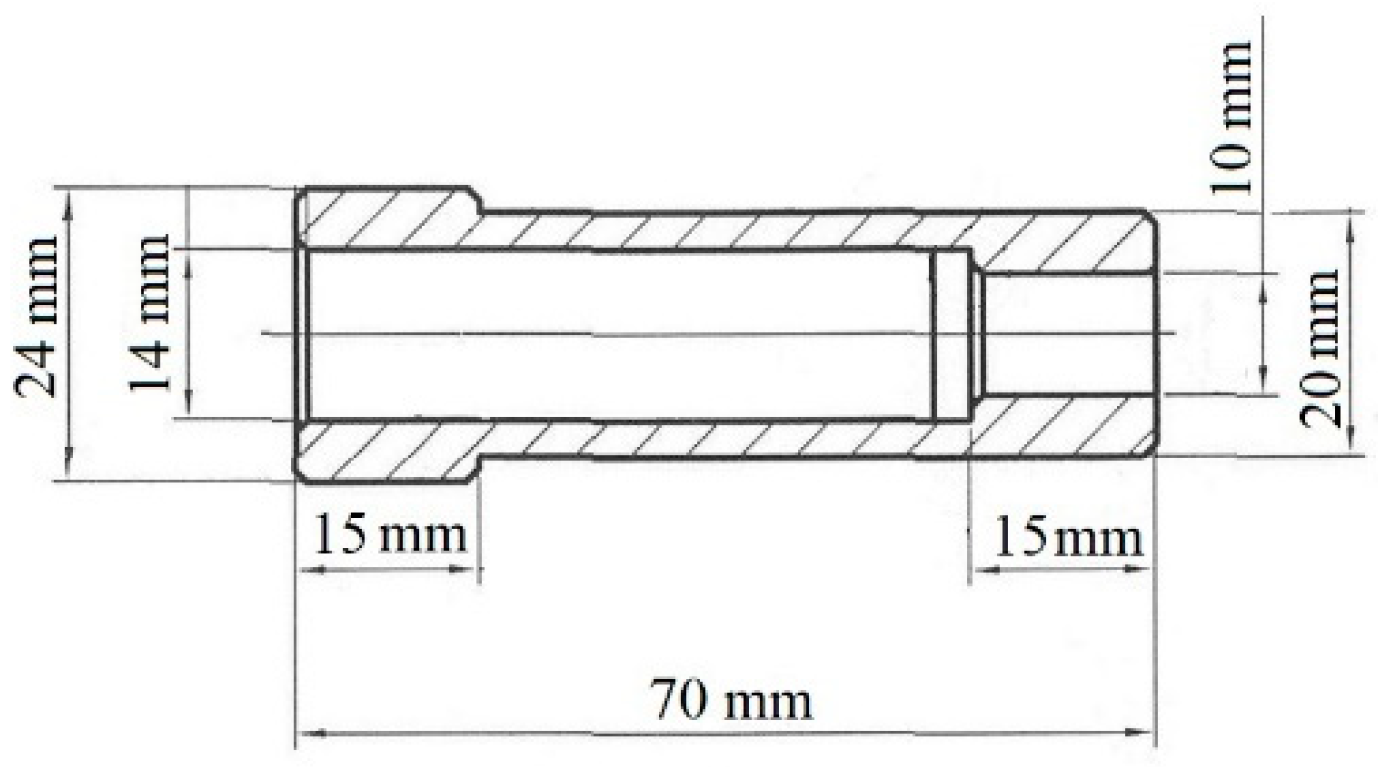
Testing of PENC regimes, as well as friction tests, were carried out on small cylindrical samples, 10 mm in diameter and height, to select the PENC regime, which provides the minimum values of the friction coefficient and weight wear of both the steel sample itself and the bronze counterbody working in tandem with it. The length of the working surface of the finger is 55 mm with a diameter of 10 mm (Figure 1). The fingers work in a friction pair with a bronze bushing (4-6% Pb, 4-6% Zn, 4-6% Sn, ≤ 0.4 Fe, ≤ 0.05 Si, ≤ 0.1 P, ≤ 0.05 Al, ≤ 0.5 Sb, and balance Cu) (Figure 2). The counterbodies were made from the same material during test tribological tests to find the optimal processing modes.
Figure 1.
Image of a medium carbon steel finger
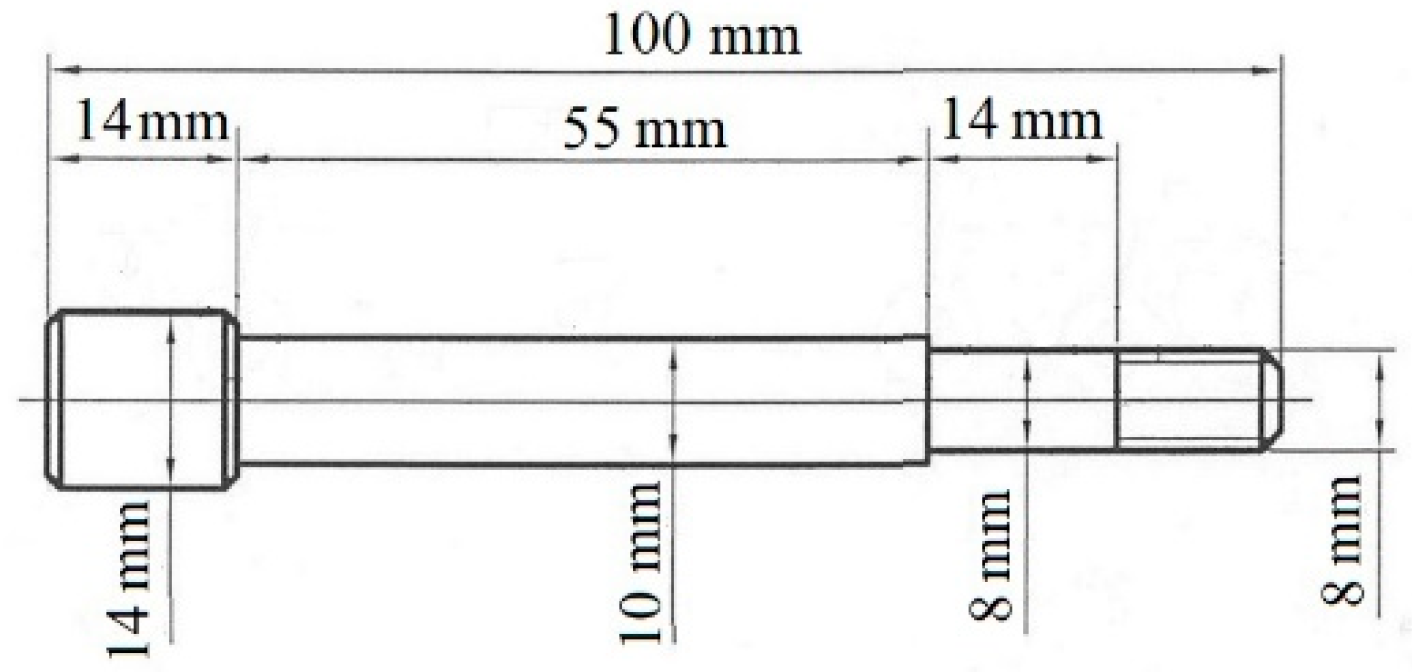
Figure 2.
Image of a bronze bushing
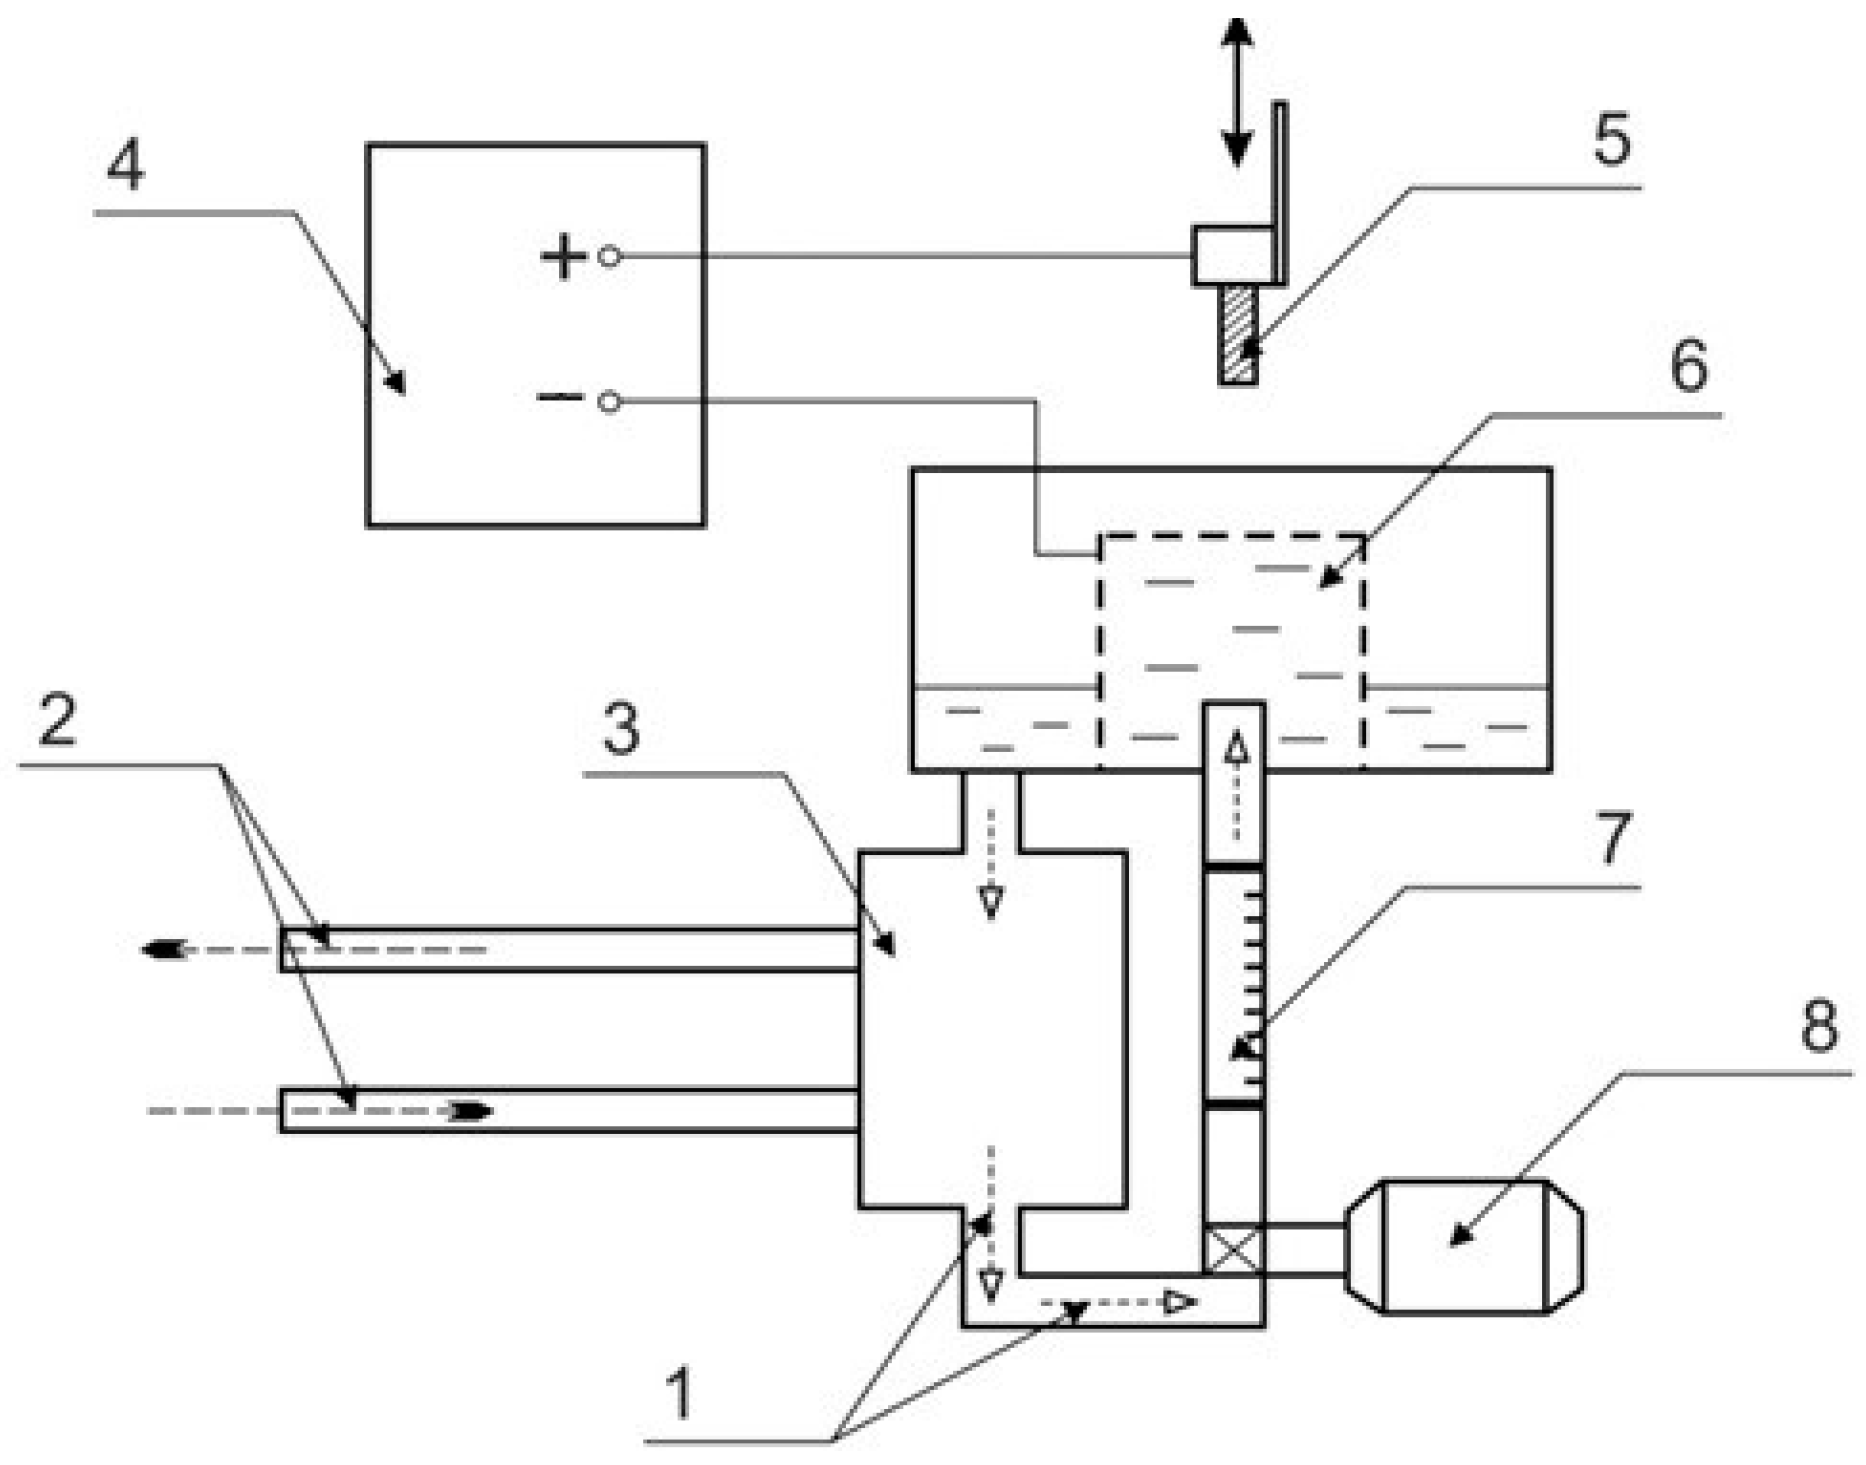
Processing was carried out on a plasma electrolytic treatment setup with two types of working chambers (Figure 3). The samples were attached to the positive output of the power source, and the electrolyzer was attached to the negative output. After voltage was applied to the system, the samples were immersed in the electrolyte to a depth equal to their height. The electrolyte was fed into the working chamber with a pump, and the flow rate was controlled by a float rotameter with an accuracy of ±2.5%. The electrolyte temperature at the outlet of the heat exchanger was recorded with an MS-6501 multimeter using a chromel-alumel thermocouple (accuracy ±3%) and maintained at 20±1 °C. The sample temperature was measured with a MS8221 multimeter using an M89-K1 thermocouple with an accuracy of 2% in the temperature range from 400 to 1000°C. The thermocouple was placed in the axial hole and was in direct contact with the sample at a point 2 mm away from its end. Quenching of samples was carried out by switching off the voltage, which led to the collapse of the vapor-gas envelope and the restoration of contact between the sample and the cooled electrolyte.
Figure 3.
Schematic diagram of the plasma electrolytic treatment setup: 1—electrolyte; 2—cold water; 3—heat exchanger; 4—power supply; 5—treated sample; 6—electrolytic cell; 7—flowmeter; 8—pump.
Figure 3.
Schematic diagram of the plasma electrolytic treatment setup: 1—electrolyte; 2—cold water; 3—heat exchanger; 4—power supply; 5—treated sample; 6—electrolytic cell; 7—flowmeter; 8—pump.
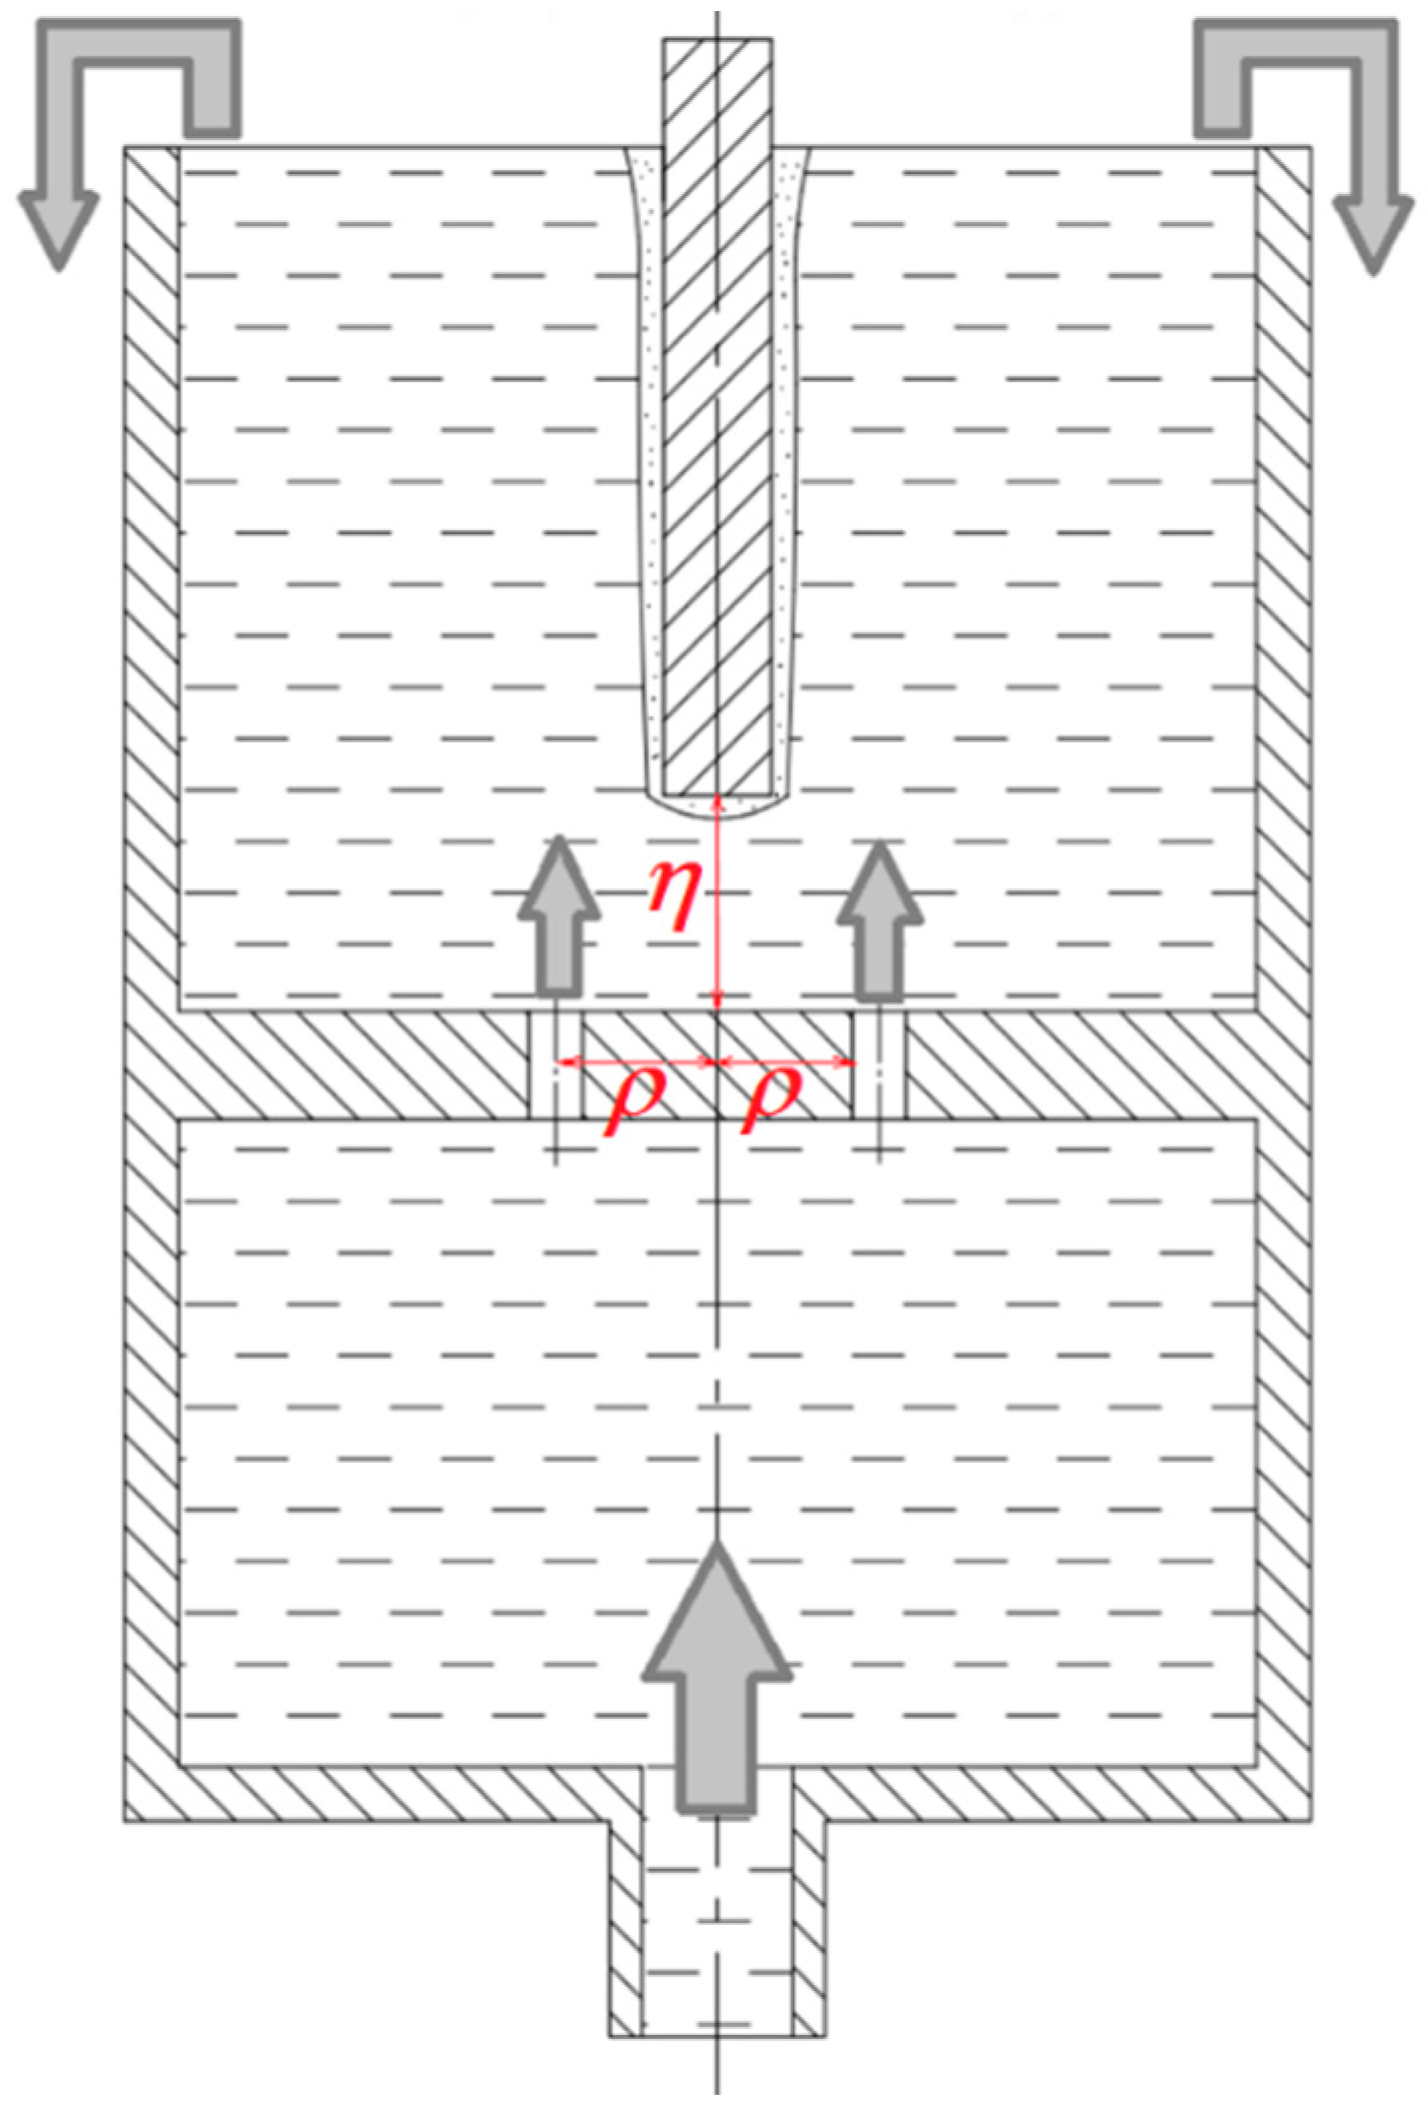
PENC of test samples 10 mm high was carried out in an axisymmetric cylindrical electrolyzer with injection of a cooled electrolyte solution from below through a central axial hole. In the upper part of the electrolyzer, the heated electrolyte overflowed and fell into a special tray, from where it then entered the heat exchanger (Figure 4).
With PENC, the vapor-gas envelope separating the part from direct contact with the electrolyte solution expands in the bottom-up direction due to the evacuation of vapor into the atmosphere. Due to the expansion of the gas-vapor envelope, the heating of the finger can be non-uniform, which is expressed in the presence of a vertical temperature gradient. The temperature gradient leads to an uneven distribution of hardness and other properties over the working surface of the finger. To treatment fingers with a working surface 55 mm long according to the chosen optimal saturation mode, the design of the working chamber was modernized (Figure 5). This version of the working chamber contains a polymer partition with holes inside the cylindrical cathode cup. The presence of a baffle makes it possible to replace the concentrated solution flow around the finger with a distributed flow around the finger by several jets. This design significantly changes the distribution of liquid velocities at the vapor-gas enevelope and solution interface: the highest velocity is now achieved not around the lower end of the anode, but around its upper half. The heat exchange conditions in the system change, and the temperature field of the anode changes along with them: the temperature of the lower end decreases, and in the upper half the temperature increases with the appearance of a local maximum. The temperature distribution along the axis is determined by the parameters η and ρ, the choice of values of which is determined by the dimensions of the workpiece. The rate of exit of the solution from the holes in the partition is also decisive. In the case of an axisymmetric anode, the holes in the partition are located at equal distances from each other, and their centers lie on a circle of radius ρ. The larger the anode diameter, the more holes are required to maintain uniform flow around the entire generatrix of the anode. This design of the working chamber made it possible to significantly reduce the vertical temperature gradient and increase the uniformity of heat treatment along with the uniform distribution of hardness and other properties over the surface of the finger.
Figure 4.
Schematic diagram of the electrolytic cell: 1 – anode sample, 2 – thermocouple, 3 – cathode, 4 – conductor with fastening system, 5 – vapor-gas enevelope.
Figure 4.
Schematic diagram of the electrolytic cell: 1 – anode sample, 2 – thermocouple, 3 – cathode, 4 – conductor with fastening system, 5 – vapor-gas enevelope.
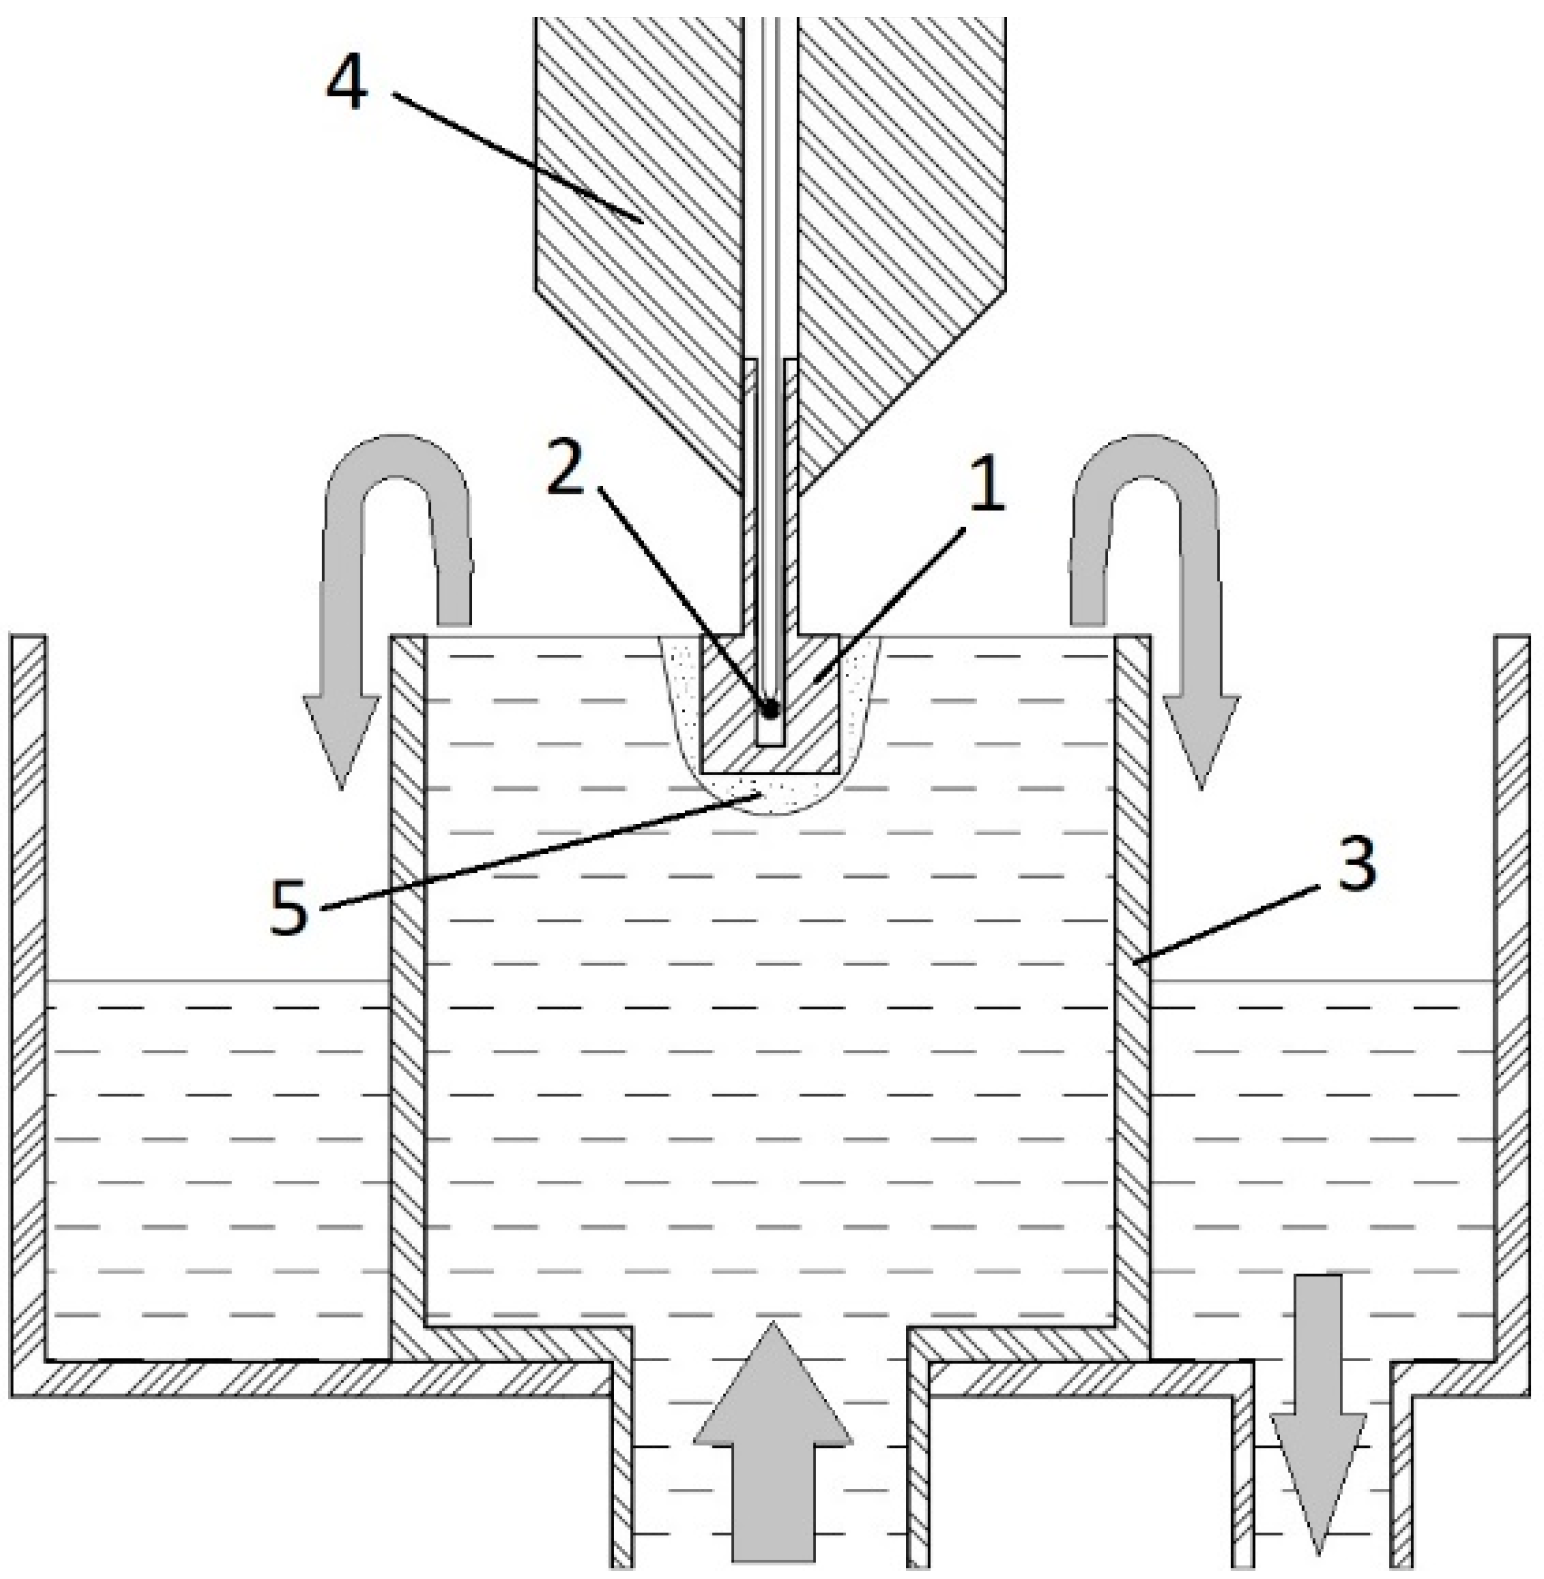
Figure 5.
Schematic diagram of modified electrolytic cell.
2.2. Study of Phase Composition
X-ray diffraction (XRD) analysis was used to determine the phase composition of the samples. The XRD patterns were obtained by PANalytical Empyrean X-ray diffractometer (Malvern Panalytical, Malvern, UK) with CoKα radiation by a simple scanning mechanism in the theta-2theta-mode with a step of 0.026° and a scanning rate of 4.5°/min. Phase composition analysis was performed using the PANalytical High Score Plus software [21] and the ICCD PDF-2 and COD databases [22].
2.3. The Microhardness Measurement
The microhardness of the cross-sections of the treatment sample was measured using a Vickers microhardness tester (Falcon 503, Innovatest Europe BV, Maastricht, The Netherlands) under a 0.1 N load. According to 5 measurements, the average value of microhardness was found.
2.4. Study of the Surface Morphology and Microstructure
The Phenom g2 pro scanning electron microscope (Phenom-World B.V., Eindhoven, The Netherlands) with digital image visualization served to study the surface morphology and microstructure of the cross-section of the steel samples.
2.5. Surface Roughness and Weight of Samples Measurement
The surface roughness and parameters of the microgeometry of the friction tracks’ surface were measured with a Hommel tester t8000 profilometer (Jenoptik, Jena, Germany). The change in the weight of the samples was determined on a CitizonCY224C electronic analytical balance (ACZET (Citizen Scale), Mumbai, India) with an accuracy of ±0.0001 g after removing traces of salts by washing the samples in distilled water and subsequently drying.
2.6. Study of Tribological Properties
Figure 6.
Friction scheme. 1—sample; 2—counter body; 3—pendulum; 4—strain gauge. M—frictional moment; N—force acting on the counter body and the pendulum from the side of the sample; F—force acting on the pendulum from the strain gauge; L—distance from the axis of rotation to the axis of symmetry of the strain gauge, R – radius of the sample.
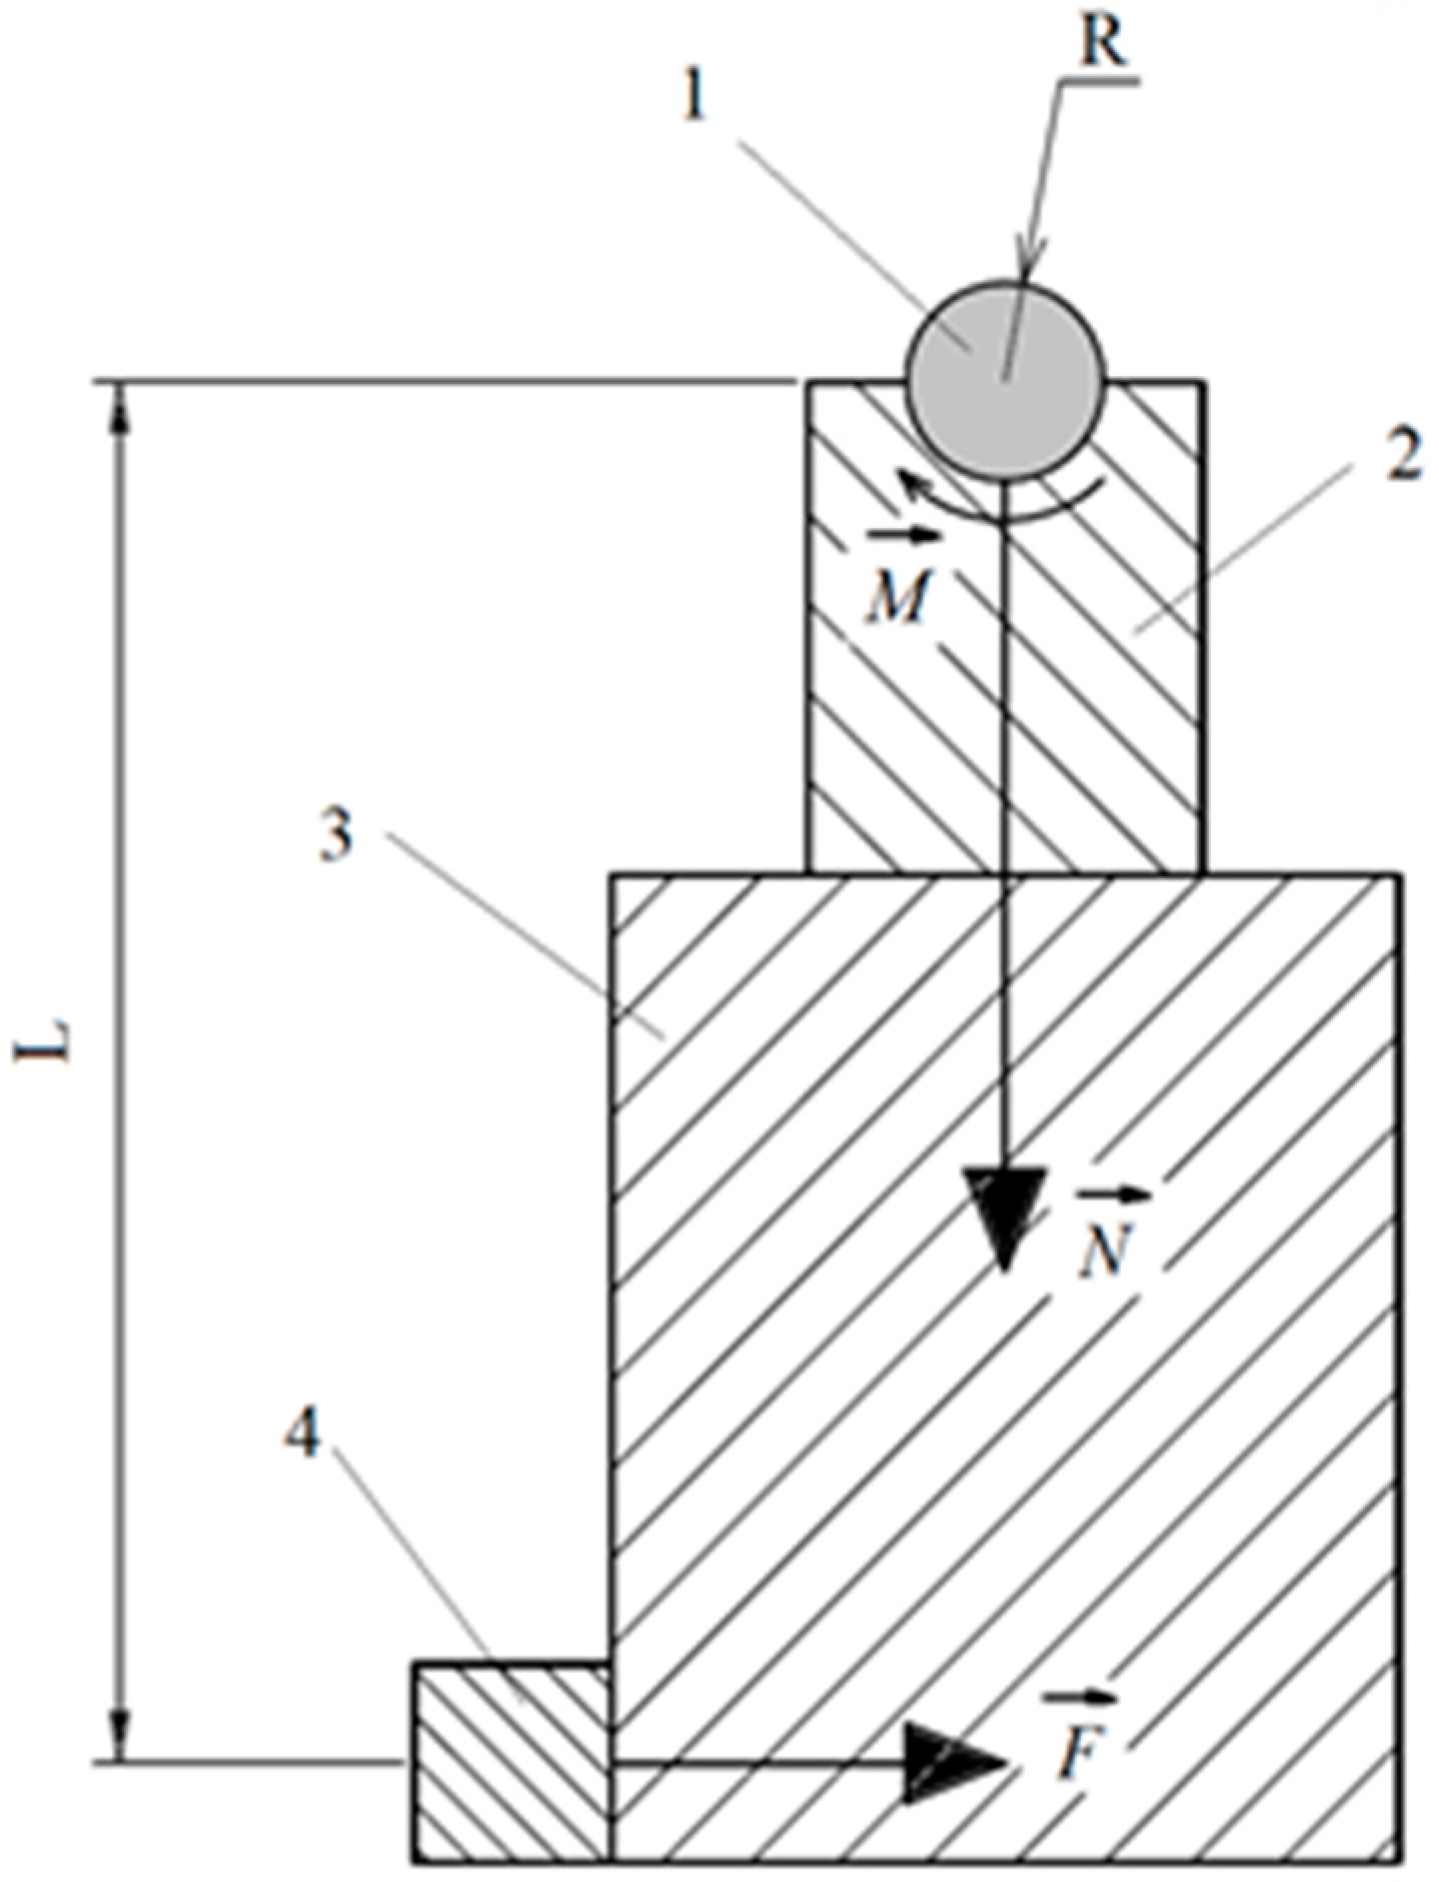
The sample was mounted on a shaft driven by an electric motor. The counter body was mounted on a platform sliding along cylindrical guides. The platform was moved using a pneumatic cylinder. The cylinder, guides and the platform were able to rotate with the pendulum. The pendulum shaft was located coaxially with the sample. Such a scheme makes it possible to preserve the common rotation axis for the sample and the counter body as they exhaust and to avoid the influence of misalignment on the results of measurements of the frictional moment. Friction tests were carried out in dry friction mode under a load of 10 N. The sliding speed of the sample along the counter body was 1.555 m/s. The friction path was 5000 m. Throughout the entire 5 km, the values of the friction coefficient and temperature in the tribocoupling were recorded every 0.3 s. After 1, 3, and 5 km of friction, the steel sample and the bronze counterbody were weighed on an analytical balance to determine the weight loss during the friction tests.
2.7. Contact Stiffness Calculation
The most important indicators characterizing the quality of parts (accuracy, reliability and durability) largely depend on the operational properties of the mating surfaces of the parts, and in particular on the contact stiffness.
Contact stiffness determines the ability of the surface layers of parts in contact to resist the action of forces tending to deform them. Contact stiffness, as well as other operational properties, is characterized by the state of the surface layer of the part, determined by the PENC technology.
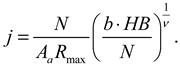
To evaluate the contact stiffness j before and after PENC, we calculated the specific load per nominal (geometric) area of contact between the sample and the counterbody in tribological tests Λ and the absolute approach h of the surfaces of the sample and the counterbody:

 where N is the value of the normal load during friction tests, Aa is the nominal (geometric) area of contact between the sample and the counterbody.
The calculation is performed in relation to the contact of a rough surface (Figure 7) with a smooth solid one [23].
Figure 7.
Rough surface scheme.
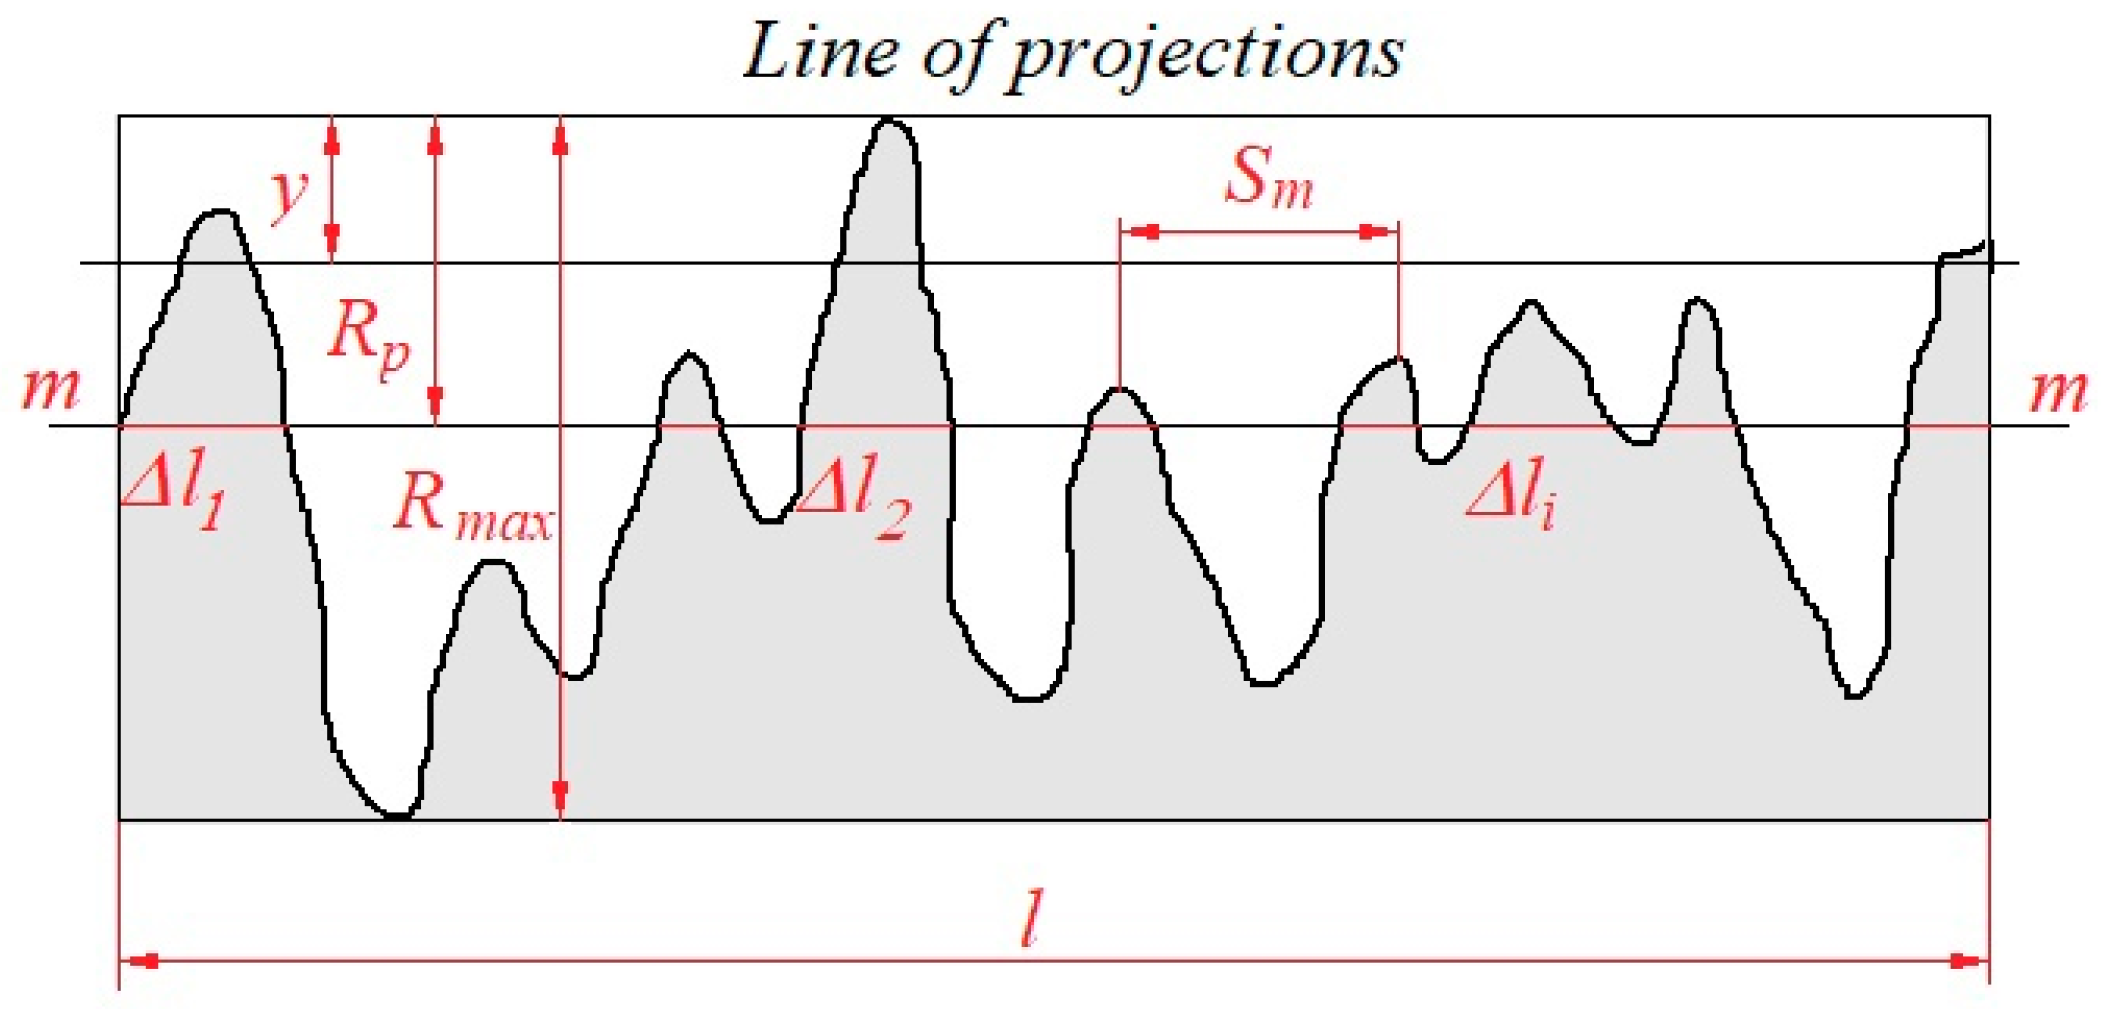
The convergence of surfaces h has a significant effect on the stress-strain state of the contact, the nature of the interaction and the deformation of the roughness ridges. Roughness protrusions formed during friction have different height distributions. To find the distribution of the material over the height of the rough layer, the experimental curves of the supporting surface are approximated by power functions of the form [24]:
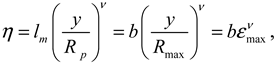 where y is the level of the profile section, measured from the line of protrusions; Rmax is the maximum height of irregularities; ε = y/Rmax is the relative profile height.
To ensure the best fit of the model curve of the support surface to the experimental data, its parameters ν and b are determined experimentally from the results of measurements on the friction track profilometer. For each friction track on all the samples under study, 30 profilograms were taken and ν and b were determined from them using the formulas:
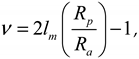
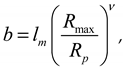 where Ra is the arithmetic mean profile deviation; Rp is the smoothing height or the distance from the ledge line to the center line within the base length, lm is the relative reference length of the profile at the level of the center line:
 where l is the base length, Δli are the lengths of the segments cut off by the middle line (figure 7) in the profile.
Due to the discrete nature of the contact, the contact of the protrusions of roughness occurs only on separate areas, which in total form the actual contact area. The reference length of the profile characterizes the actual contact area. Therefore, the change in the actual contact area is traced using the curve of the supporting surface [25].
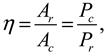 where Ar is the actual contact area; Ac is the contour area of the contact, Pr is the average actual pressure on the friction contact; Pc is the contour pressure. The contour area is determined by the waviness of the surface.
To calculate the actual pressure Pr at the tops of microprotrusions, the type of contact is determined: elastic or plastic [26]. The most widely used is the Williamson-Greenwood criterion, or the so-called plasticity criterion:
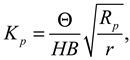 where Θ is the reduced modulus of elasticity:
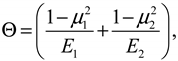 where μi and Ei are Poisson’s ratios and moduli of elasticity of interacting bodies, r is the microroughness radius determined by modeling protrusions by bodies of double curvature:
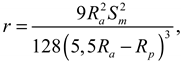 where Sm is the average step of irregularities (Figure 7).
If the values of the criterion Kp exceed one, then plastic contact is realized between the body and the counterbody, regardless of the load [27]. In our case, the values of the Williamson-Greenwood criterion (8) for all samples, both after PENC and raw control, are greater than one (Table 1). The obtained values of the criterion make it possible to consider the contact plastic and take the stress on the contact equal to the hardness, i.e. Pr ≈ HB. The surfaces of the samples and the counterbody did not have waviness, so the contour pressure is determined by the applied load N.

Table 1.
Characteristics of tribological contact of nitrocarburized steel with bronze.
| Parameter | Untreated (control) | PENC temperature (°С) | ||||||
| 550 | 600 | 650 | 700 | 750 | 800 | 850 | ||
| r (μm) | 67± 2 |
39± 1 |
43± 1 |
58± 1 |
155± 4 |
153± 4 |
127± 3 |
147± 4 |
| h (μm) | 6.4± 0.2 |
3.6± 0.1 |
3.8± 0.1 |
3.9± 0.1 |
2.5± 0.1 |
2.8± 0.1 |
2.9± 0.1 |
2.6± 0.1 |
| Δ | 0.88± 0.05 |
0.29± 0.02 |
0.28± 0.02 |
0.30± 0.02 |
0.10± 0.01 |
0.11± 0.01 |
0.10± 0.01 |
0.11± 0.01 |
| Kp | 16.8± 5.7 |
5.2± 0.2 |
4.1± 0.2 |
2.8± 0.1 |
1.4± 0.1 |
3.1± 0.1 |
2.1± 0.1 |
1.9± 0.1 |
| j (МPa/ μm) | 0.045± 0.001 |
0.080± 0.002 |
0.076± 0.002 |
0.074± 0.002 |
0.116± 0.003 |
0.103± 0.003 |
0.100± 0.003 |
0.111± 0.003 |
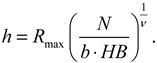
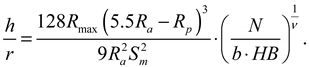
Equating the equation approximating the reference curve in the form (3) to the ratio of the contour and actual pressures (7) at the level y = h, we obtain the following expression for the absolute convergence of the contacting surfaces:
Substituting the expressions for absolute approach (11) and specific load (2) into (1) allows us to obtain an estimate of the contact stiffness in the form:
The values of topographic characteristics, obtained experimentally as a result of tretment surface profilograms, make it possible to determine another important parameter characterizing the type of stress state of a tribological contact. Expressions (11) and (10) allow one to calculate the relative penetration of the roughness of the compressed surfaces:
Relative penetration makes it possible to determine the mechanism of destruction of friction surfaces or the type of violation of the frictional connection [28]. If h/r < 0.01, the friction surfaces are destroyed as a result of elastic displacement. Fracture has a fatigue character with a large number of cycles before failure. At h/r < 0.1, plastic displacement of the material occurs in tribological contact with residual deformation of the surface. h/r > 0.1 is typical for microcutting and microchip formation.
For a comprehensive assessment of the quality of the sample surface after PENC, the Kragelsky-Kombalov parameter is used [23].

Of all the surface roughness characteristics, only the average value of the Ra profile irregularities is most often used. However, with the same value of the average roughness, the step characteristics of the profile can differ significantly. The radii of curvature of the tops of the irregularities can also be sharp or blunt. The smoothing height and the maximum height of the roughness profile can differ significantly for the same Ra values of the profile. Profiles with the same average roughness, but very different other height and pitch characteristics, will affect the friction and wear of the surfaces differently. Therefore, it is important to give a complex parameter of roughness, the physical essence of which is explained from the standpoint of the bearing capacity. The smaller the value of Δ, the higher the bearing capacity of the rough surface in tribological contact.
3. Results
3.1. Friction Coefficient
Figure 8 shows the dependence of the friction coefficient on the friction path during the first kilometer of testing for samples after PENC at temperatures from 550 to 850 °C. During the first kilometer of testing, the friction coefficient of an untreated (control) sample of steel on bronze is higher than that of samples after PENC at any temperature. Figure 9 shows the dependence of the friction coefficient of the sample on the path traveled along the counterbody during the second and third kilometers of testing. As can be seen, the values of the friction coefficient increase during the second and third kilometers of the test. At the lowest PENC temperature of 550°C, the curve of the dependence of the friction coefficient on the path closely fits and sometimes overlaps with a similar curve of the control sample (Figure 9). At the fourth and fifth friction kilometers, the friction coefficients of the samples after PENC decrease at all processing temperatures (Figure 10). It should be noted that the values of friction coefficients at the fourth and fifth kilometers are the lowest for the entire time of testing (Figure 8, Figure 9 and Figure 10).
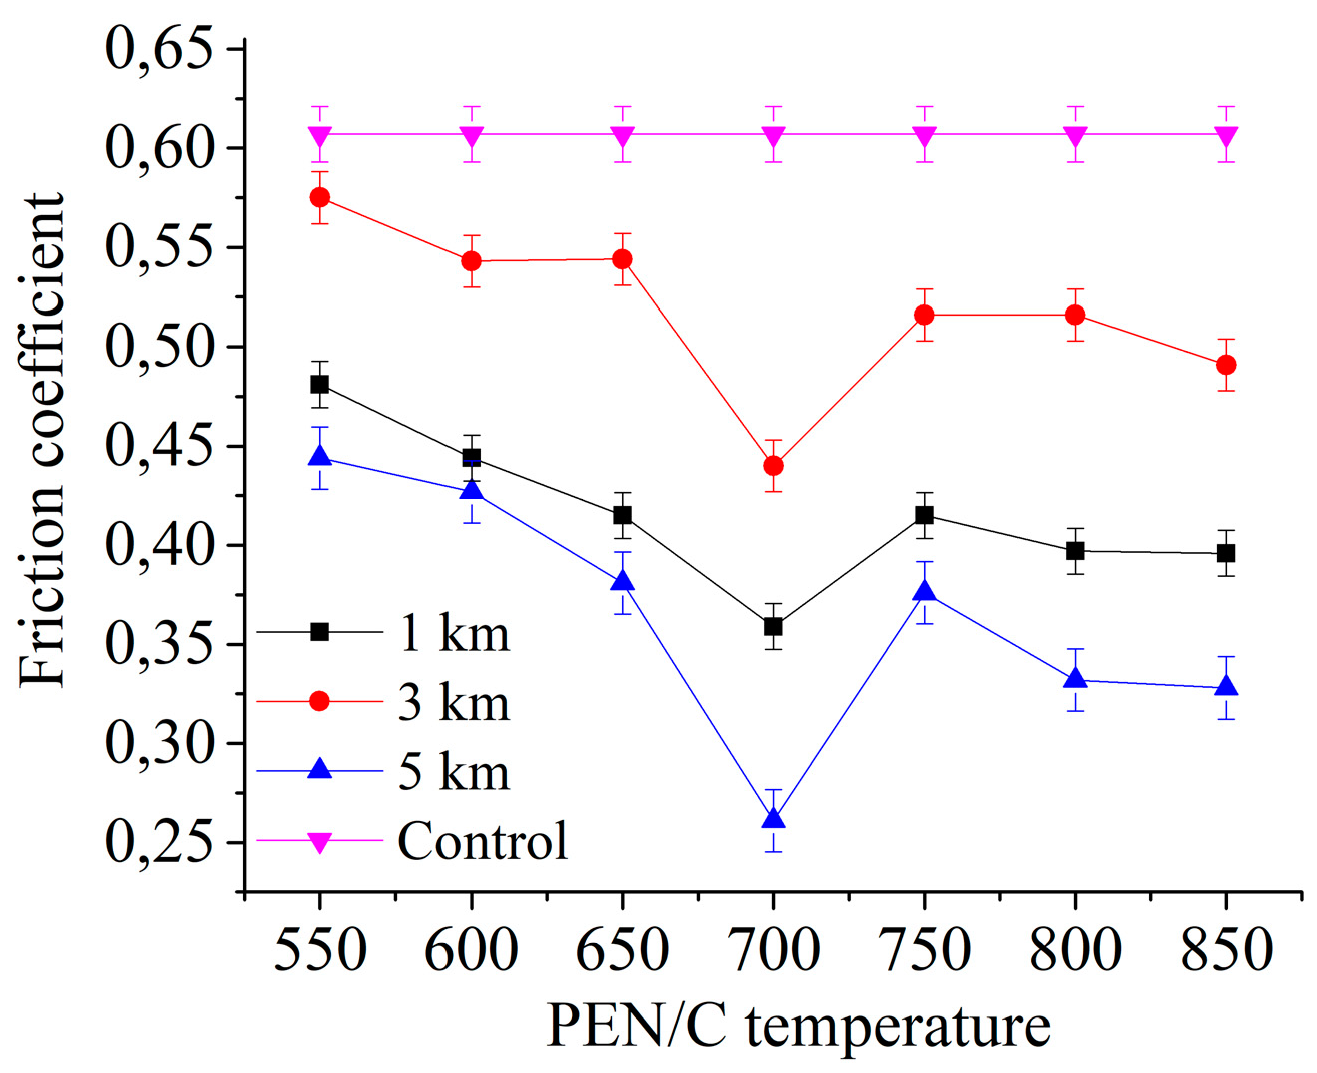
Figure 11 shows the average friction coefficients for the last 100 m of track after 1, 3 and 5 km friction for various PENC temperatures. Let’s start with the results of friction per 1 km. An increase in the temperature of the PENC from 550 to 700 °C leads to a decrease in the friction coefficient for the first kilometer from 0.48 to 0.36, while the friction coefficient of the control sample is 0.61. The minimum value of the friction coefficient on the first kilometer of the path of 0.36 is achieved for the sample after PENC at a temperature of 700 °C, which is 1.7 times less than that of the untreated control. Increasing the PENC temperature to 750°C leads to an increase in the friction coefficient to 0.42. A further increase in the PENC temperature to 850 °C reduces the friction coefficient to a value of 0.40. Upon completion of the first kilometer of the friction path, the minimum value of the friction coefficient was reached for the sample after PENC at a temperature of 700 °C; higher PENC temperatures from 750 to 850 °C lead to lower values of the friction coefficient than temperatures from 550 to 650 °C.
At the end of the third kilometer of the test (Figure 11), the average values of the friction coefficient increase in comparison with the first kilometer of the friction path, but remain lower than that of the control sample. The general nature of the dependence of the average value of the friction coefficient on the PENC temperature remains the same as after one kilometer. The minimum value of the friction coefficient of 0.44 is fixed for the sample after PENC at a temperature of 700 °C. This value is 1.4 times less than the untreated control and 18% more than the value after 1 km of friction. Higher values of the friction coefficient from 0.52 to 0.49 correspond to temperatures from 750 to 850 °C; with an increase in temperature in this range, the friction coefficient decreases. The highest friction coefficients, as in the case of friction per 1 km, are observed in samples after PENC at temperatures from 550 to 650 °C and range from 0.58 to 0.54, which is lower than the friction coefficient of the control sample by 5 and 10%, respectively.
The lowest values of the friction coefficient are observed at the end of the fifth kilometer of the friction path (Figure 10 and Figure 11). Its smallest value of 0.26 is achieved after PENC at a temperature of 700 °C, which is 2.3 times or 57% less than that of the control. Friction at 1 and 3 km also gives the lowest values of the friction coefficient at the PENC temperature of 700 °C. The highest values of the friction coefficient at the end of the fifth kilometer, from 0.44 to 0.38, correspond to the lowest PENC temperatures from 550 to 650°C. With an increase in the PENC temperature from 750 to 850 °C, the friction coefficient decreases from 0.38 to 0.33.
The general nature of the dependence of the friction coefficient on the PENC temperature does not change over five kilometers of the friction path. A tendency to a decrease in the friction coefficient with increasing temperature is revealed. The maximum value of the friction coefficient is fixed at a minimum temperature of 550 °C. Then the friction coefficient decreases with increasing temperature up to 650 °C. The temperature of 700 °C corresponds to the minimum value of the friction coefficient for all five kilometers of tribological tests. An increase in the PENC temperature to 750 °C leads to a higher value of the friction coefficient in comparison with the minimum, but lower than in the temperature range of 550-650 °C. A further increase in the PENC temperature from 750 to 850°C leads to a decrease in the friction coefficient. Over 5 km of testing, the friction coefficients of nitrocarburized samples at any temperature are lower than the friction coefficient of the control sample.
Figure 8.
Dependence of the friction coefficient on the friction distance for the first kilometer of testing for samples after PENC at various temperatures and an untreated control.
Figure 8.
Dependence of the friction coefficient on the friction distance for the first kilometer of testing for samples after PENC at various temperatures and an untreated control.
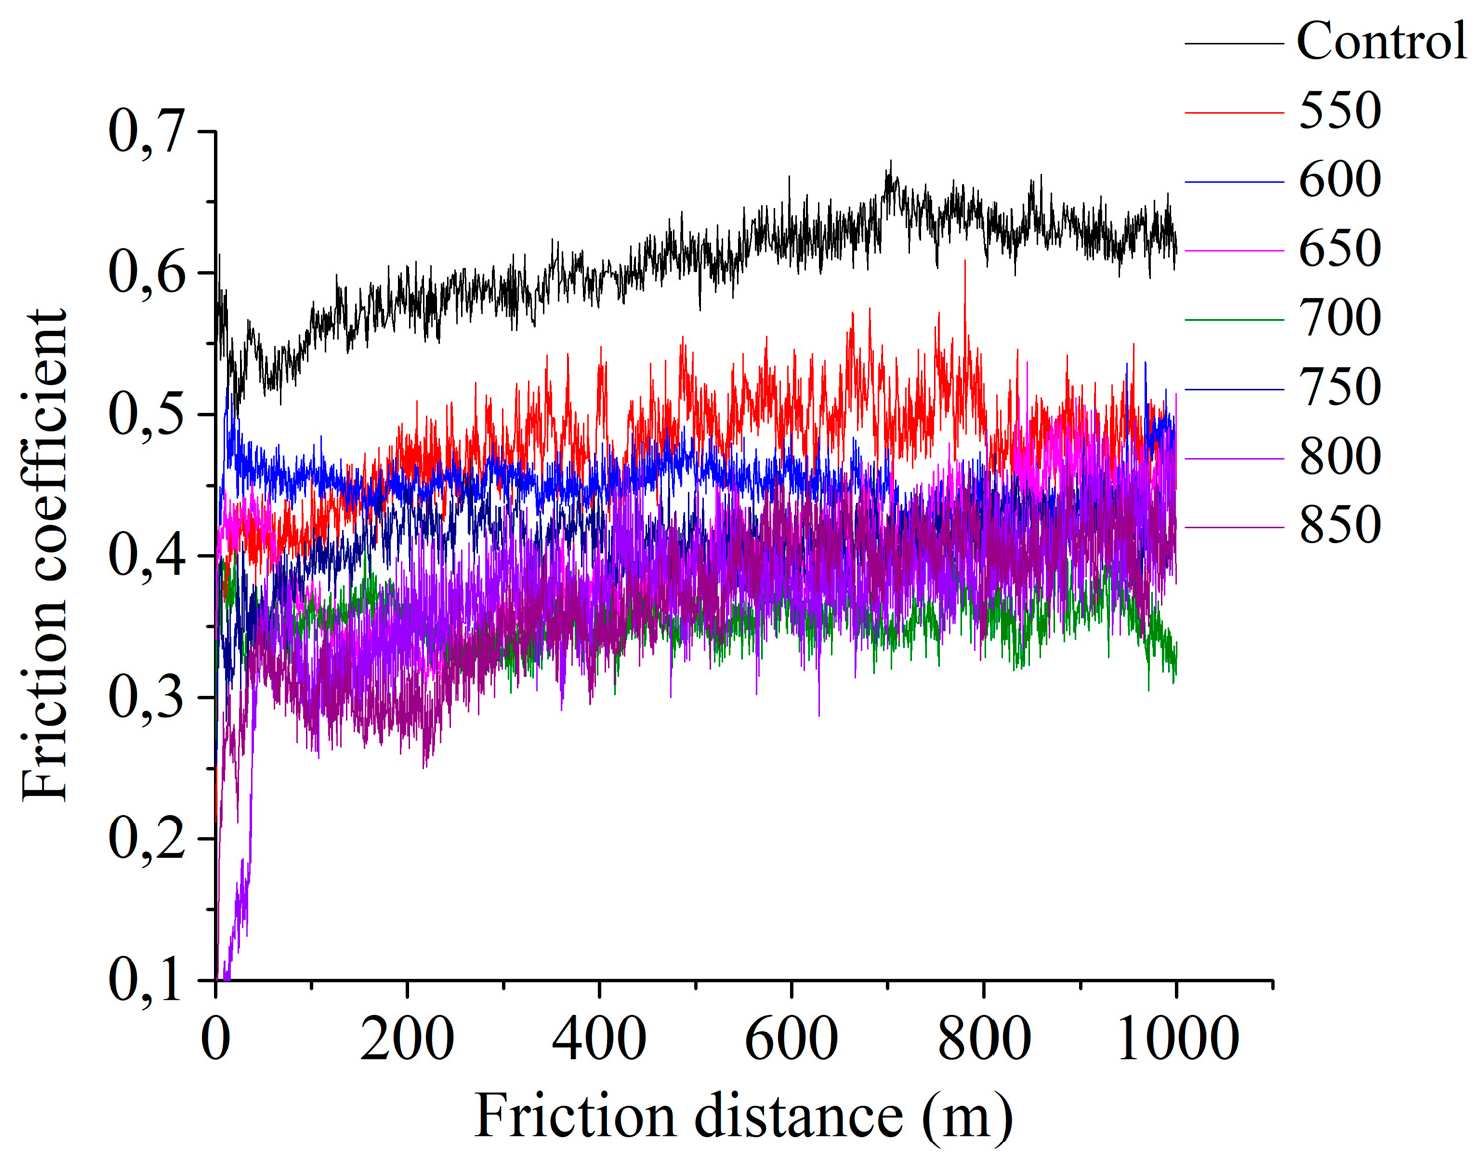
Figure 9.
Dependence of the friction coefficient on the friction distance for the second and third kilometers of testing for samples after PENC at various temperatures and the untreated control.
Figure 9.
Dependence of the friction coefficient on the friction distance for the second and third kilometers of testing for samples after PENC at various temperatures and the untreated control.
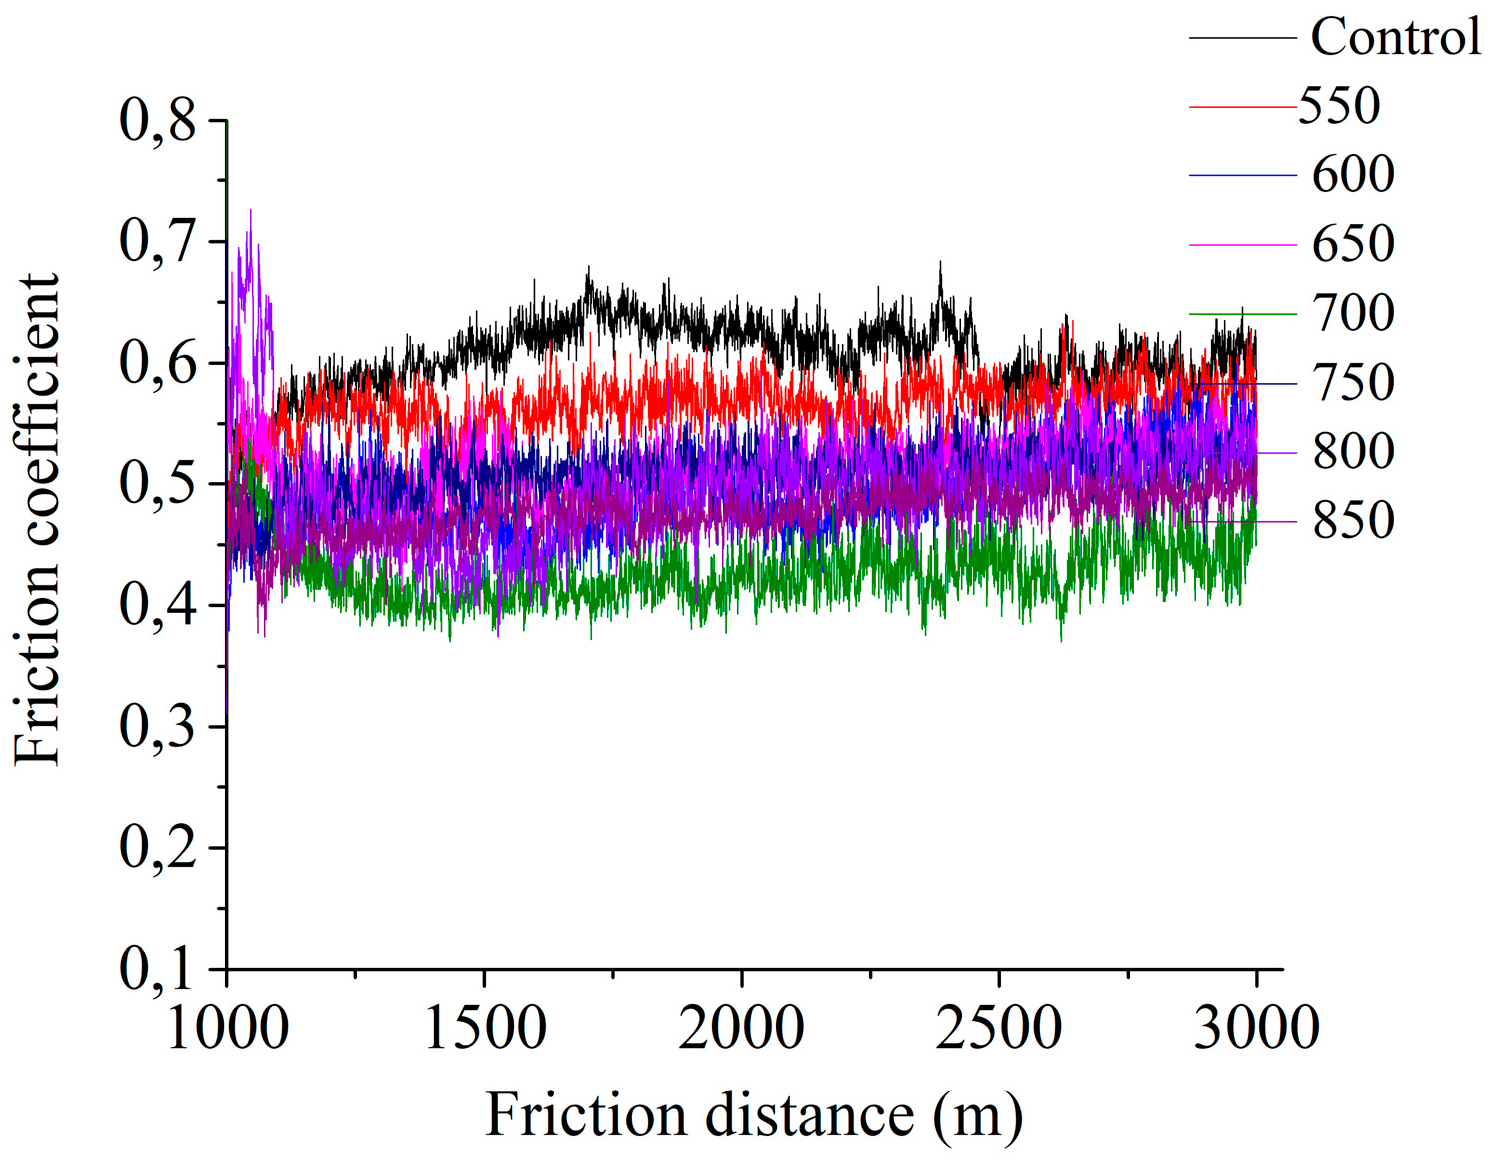
Figure 10.
Dependence of the friction coefficient on the friction distance for the fourth and fifth kilometers of the test for samples after PENC at various temperatures and the untreated control.
Figure 10.
Dependence of the friction coefficient on the friction distance for the fourth and fifth kilometers of the test for samples after PENC at various temperatures and the untreated control.
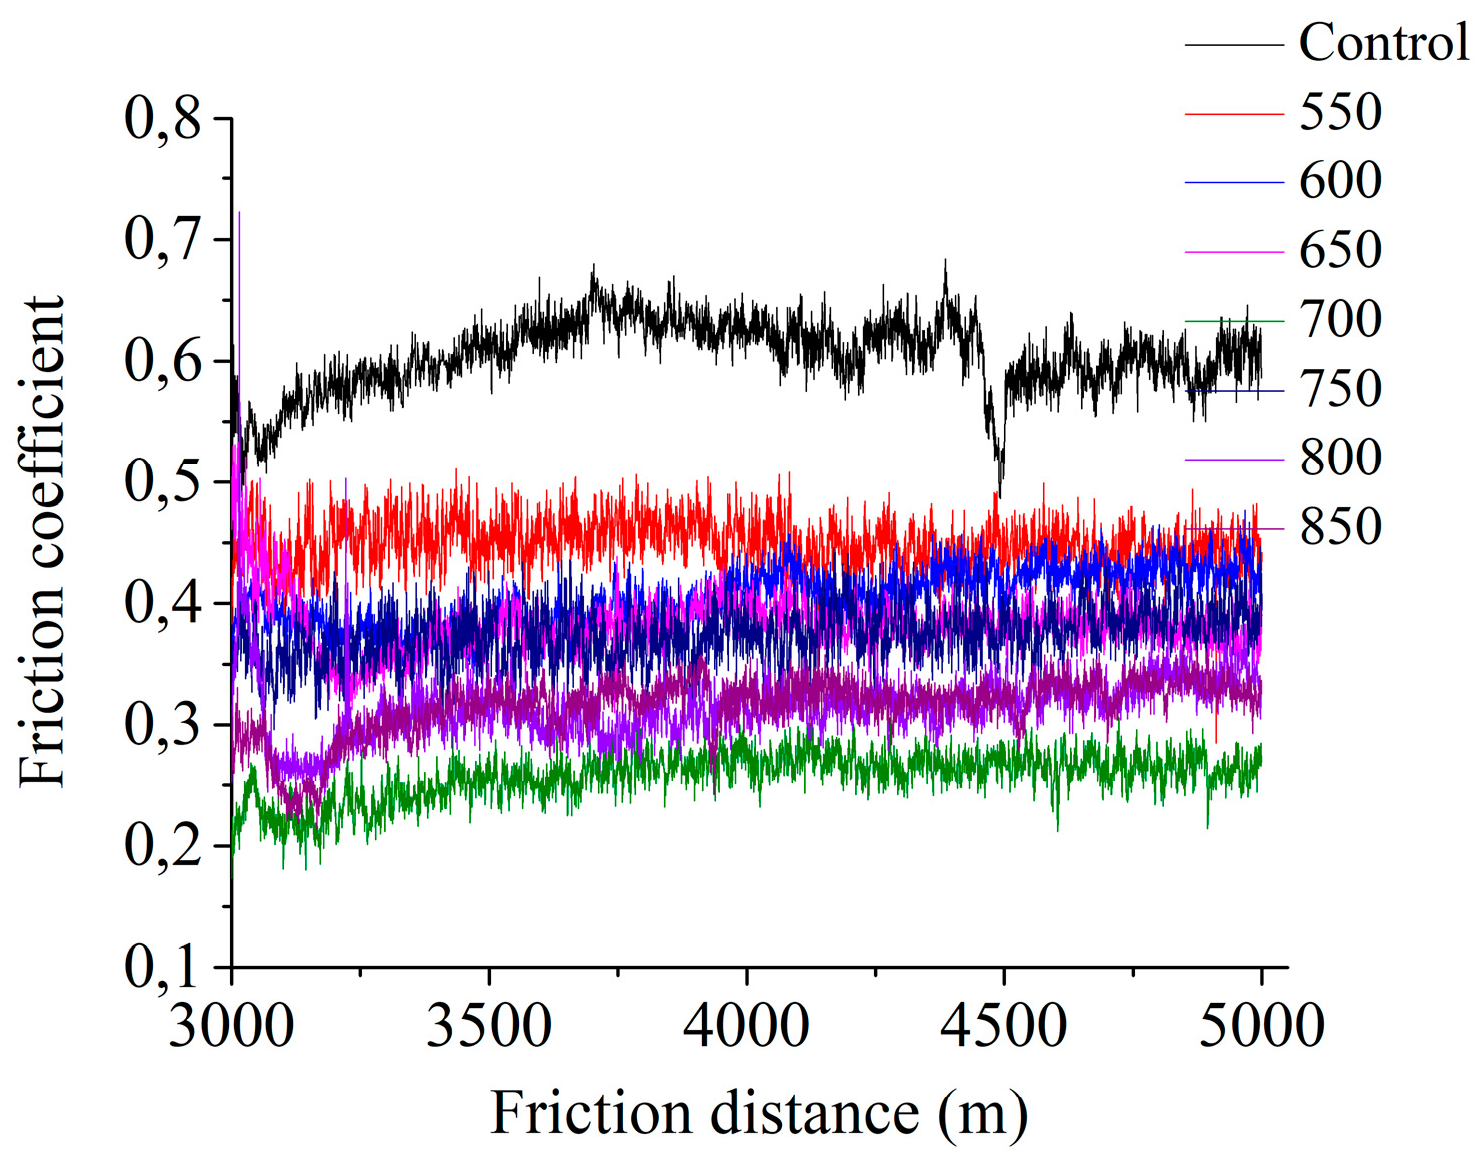
Figure 11.
The average friction coefficient over the last 100 meters of the friction distance after 1, 3 and 5 km of tests for samples after PENC at various temperatures and the control untreated.
Figure 11.
The average friction coefficient over the last 100 meters of the friction distance after 1, 3 and 5 km of tests for samples after PENC at various temperatures and the control untreated.
3.2. Wear Resistance
The dependences of the friction coefficient on the PENC temperature are in good agreement with the weight loss data during friction tests (Figure 12, Figure 13, Figure 14, Figure 15, Figure 16 and Figure 17).
After the first kilometer of testing (Figure 12 and Figure 13), the weight loss of the sample during friction decreases with increasing temperature of the PENC. The maximum value of weight loss is observed after PENC at a temperature of 550 °C, which is 8.7 times less than that of the control sample. An increase in temperature to 700 °C reduces weight losses to 0.20 mg per 1 km, or 21.7 times compared to the control. A further increase in the PENC temperature to 850°C gives a slightly higher, but within the error, little distinguishable mass loss from the minimum at 700°C.
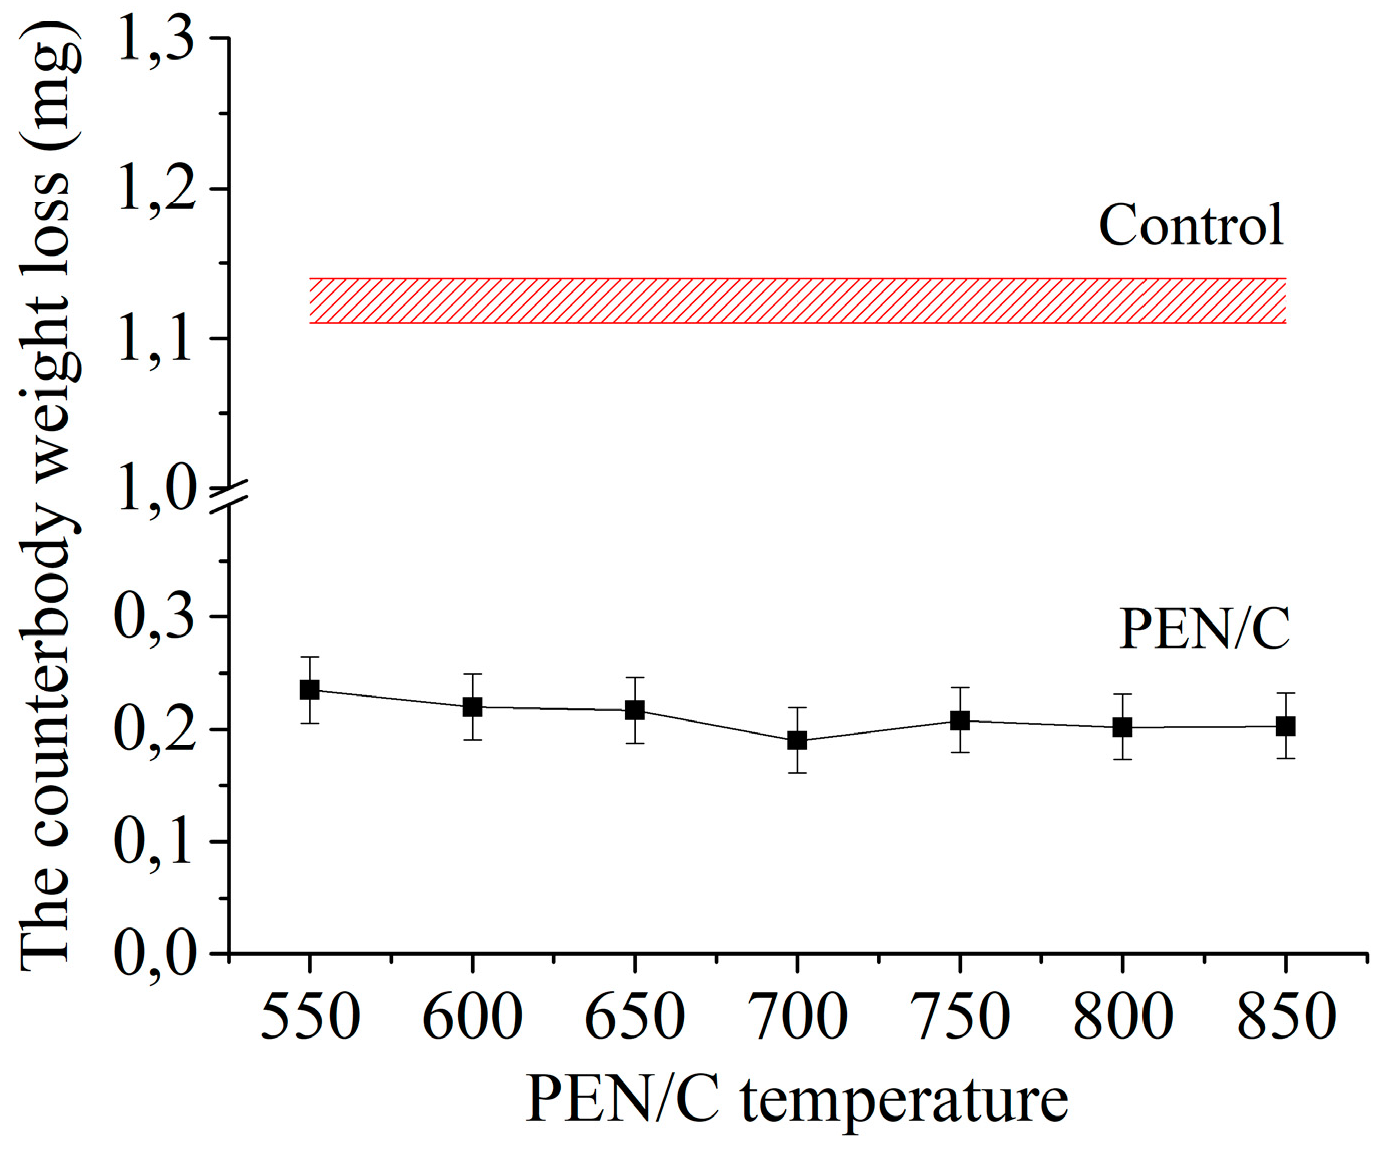
The weight loss of the bronze counterbody operating in tandem with samples after PENC is noticeably lower than in tandem with the control (Figure 13). On the first kilometer of testing, the weight loss of the counterbody in a pair with samples after PENC at temperatures in the range of 550–650 °C decreases by 3.0–3.2 times. Samples after treatment at higher temperatures from 700 to 850°C lead to even lower weight loss of the counterbody when working in frictional contact. In comparison with the work of a pair of a control untreated sample with a bronze counterbody, the PENC of the sample in the temperature range of 700–850 °C reduces the weight loss of the counterbody by 3.9–4.3 times in the first kilometer of testing.
The weight loss on the second and third kilometers of tests increases in comparison with the first kilometer of the friction path, which correlates with the maximum values of the friction coefficient on this section of the path (Figure 14). The greatest weight losses in the friction pair, both in the sample and in the counterbody, are observed after PENC at temperatures from 550 to 650°C. The sample loses from 1.03 mg per 2 km at 550°C to 0.92 mg at 650°C, that is, 9-10 times less than the control. In this case, the weight of the counterbody decreases with increasing temperature of the PENC sample from 0.43 mg per 2 km at 550°C to 0.37 mg at 650°C, which is 3.5 and 4.0 times less, respectively, than in the control pair with the untreated sample. Minimum weight loss for the second and third kilometers of the test for the sample processed at a temperature of 700 °C and for the counterbody working in tandem with it. The weight loss of the sample at this temperature is 19.6 times less than that of the untreated sample. In the counterbody, the weight decreases 5.2 times slower than in the control pair. According to Figure 9 and Figure 11, the temperature of 700 °C in this section of the friction path corresponds to the lowest value of the friction coefficient, which correlates with the minimum weight losses during friction. An increase in the PENC temperature from 750 to 850°C leads to a greater weight loss in the friction pair than at a temperature of 700°C, but less than in the range of 550-650°C. As the PENC temperature increases from 750 to 850°C, the sample loses 13.2˗14.5 times less weight per 2 km of the friction path than the control. At the same time, the counterbody loses in weight 4.9-5.1 times less than the control pair. Smaller frictional weight loss of the samples after PENC in the temperature range of 750-850°C in comparison with the range of 550-650°C is consistent with the values of the friction coefficients, which are lower at higher temperatures (Figure 9 and Figure 11).
The fourth and fifth friction kilometers are characterized, in addition to the lowest friction coefficients during the test (Figure 10 and Figure 11), and the lowest weight losses of both the sample and the counterbody (Figure 16 and Figure 17). The minimum weight loss of both bodies of the friction pair, as in the previous three kilometers, is recorded after PENC at 700 °C. The sample at this temperature loses 24.9 times less weight than the control. The counterbody decreases over 2 km by 0.19 mg, that is, 5.9 times less than the pair with the control untreated sample (Figure 16 and Figure 17). The general nature of the dependence of weight losses during friction on the temperature of the PENC of the sample is maintained over all five kilometers of the test. The greatest weight losses in the friction pair are observed at low PENC temperatures from 550 to 650 °C, and with increasing temperature, the weight loss decreases from 0.554 mg to 0.491 mg per 2 km of friction. This is followed by a minimum corresponding to an PENC temperature of 700 °C. Temperatures of 750-850 °C provide weight loss above the minimum point, but below the temperature range of 550-650 °C, namely, 19.6-22.1 times less than the control sample. The weight loss of the counterbody in the friction pair with the sample after PENC at different temperatures repeats the nature of the weight loss of the sample. After PENC of the sample in the range of 550–650°C, the counterbody loses in weight 4.8–5.2 times less than the pair with the control, then follows at least at 700°C. PENC of the sample at higher temperatures in the range from 750 to 850 °C leads to a decrease in the decrease in the weight of the counterbody during friction by 5.4-5.6 times compared to the control pair.
Figure 12.
The weight loss during the first kilometer of friction tests of samples after PENC at various temperatures and a control untreated sample.
Figure 12.
The weight loss during the first kilometer of friction tests of samples after PENC at various temperatures and a control untreated sample.
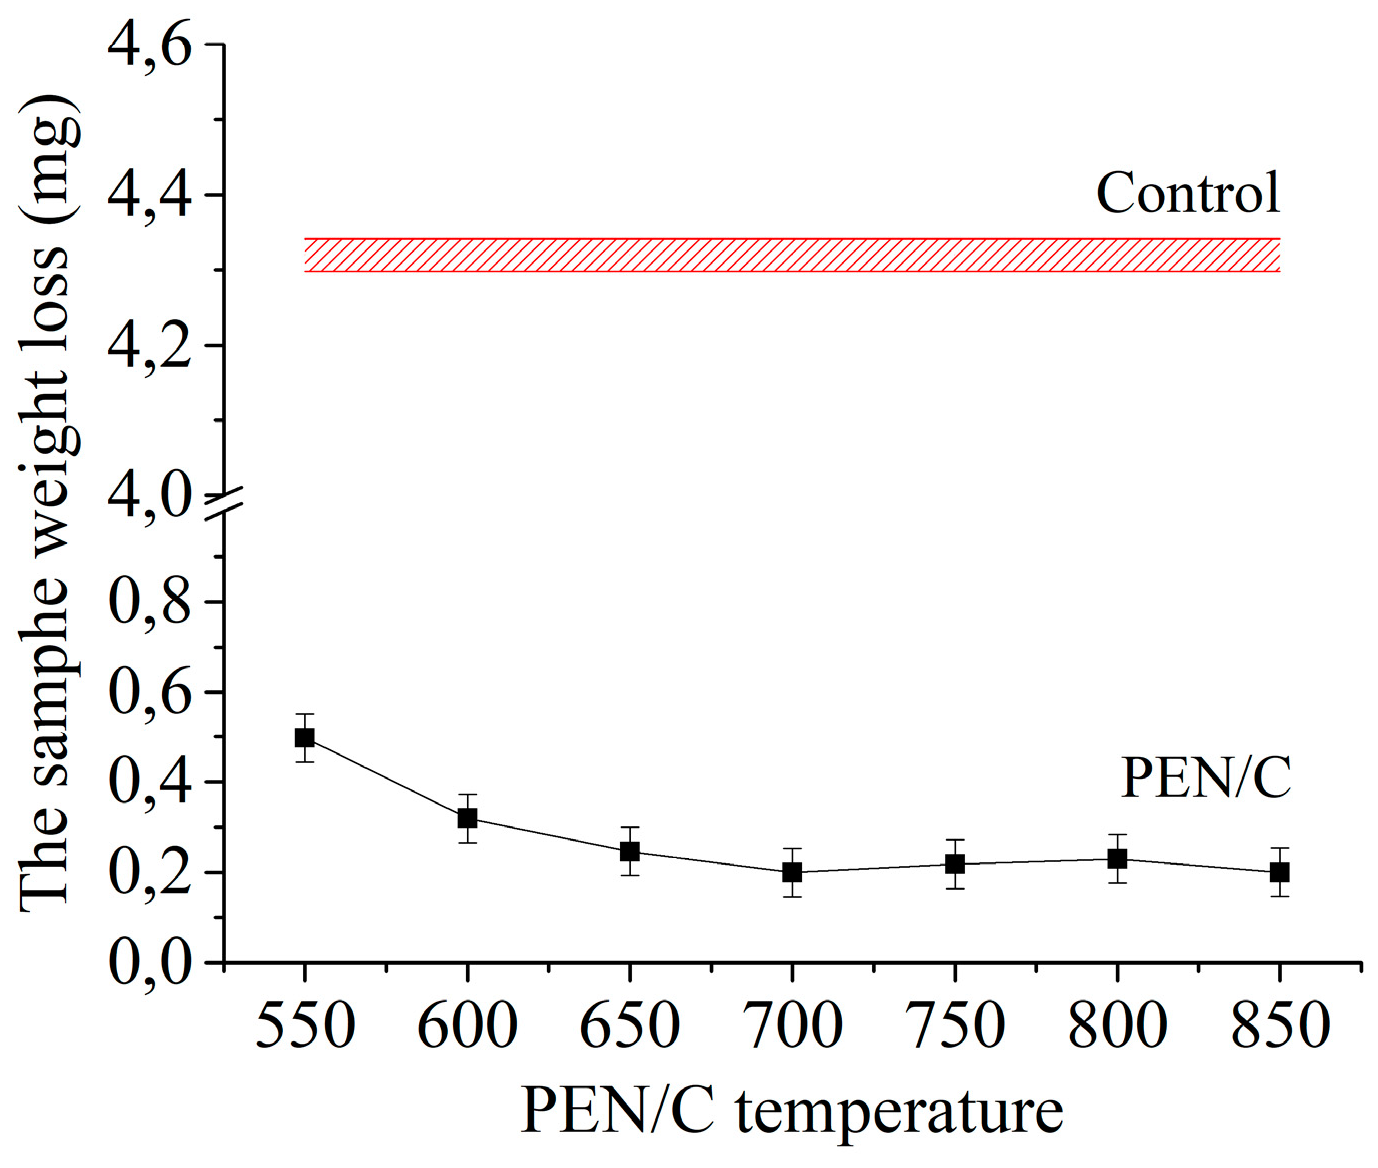
Figure 13.
The weight loss of a bronze counterbody operating in tandem with steel sample after PENC at different temperatures and a control one during the first kilometer of friction tests.
Figure 13.
The weight loss of a bronze counterbody operating in tandem with steel sample after PENC at different temperatures and a control one during the first kilometer of friction tests.
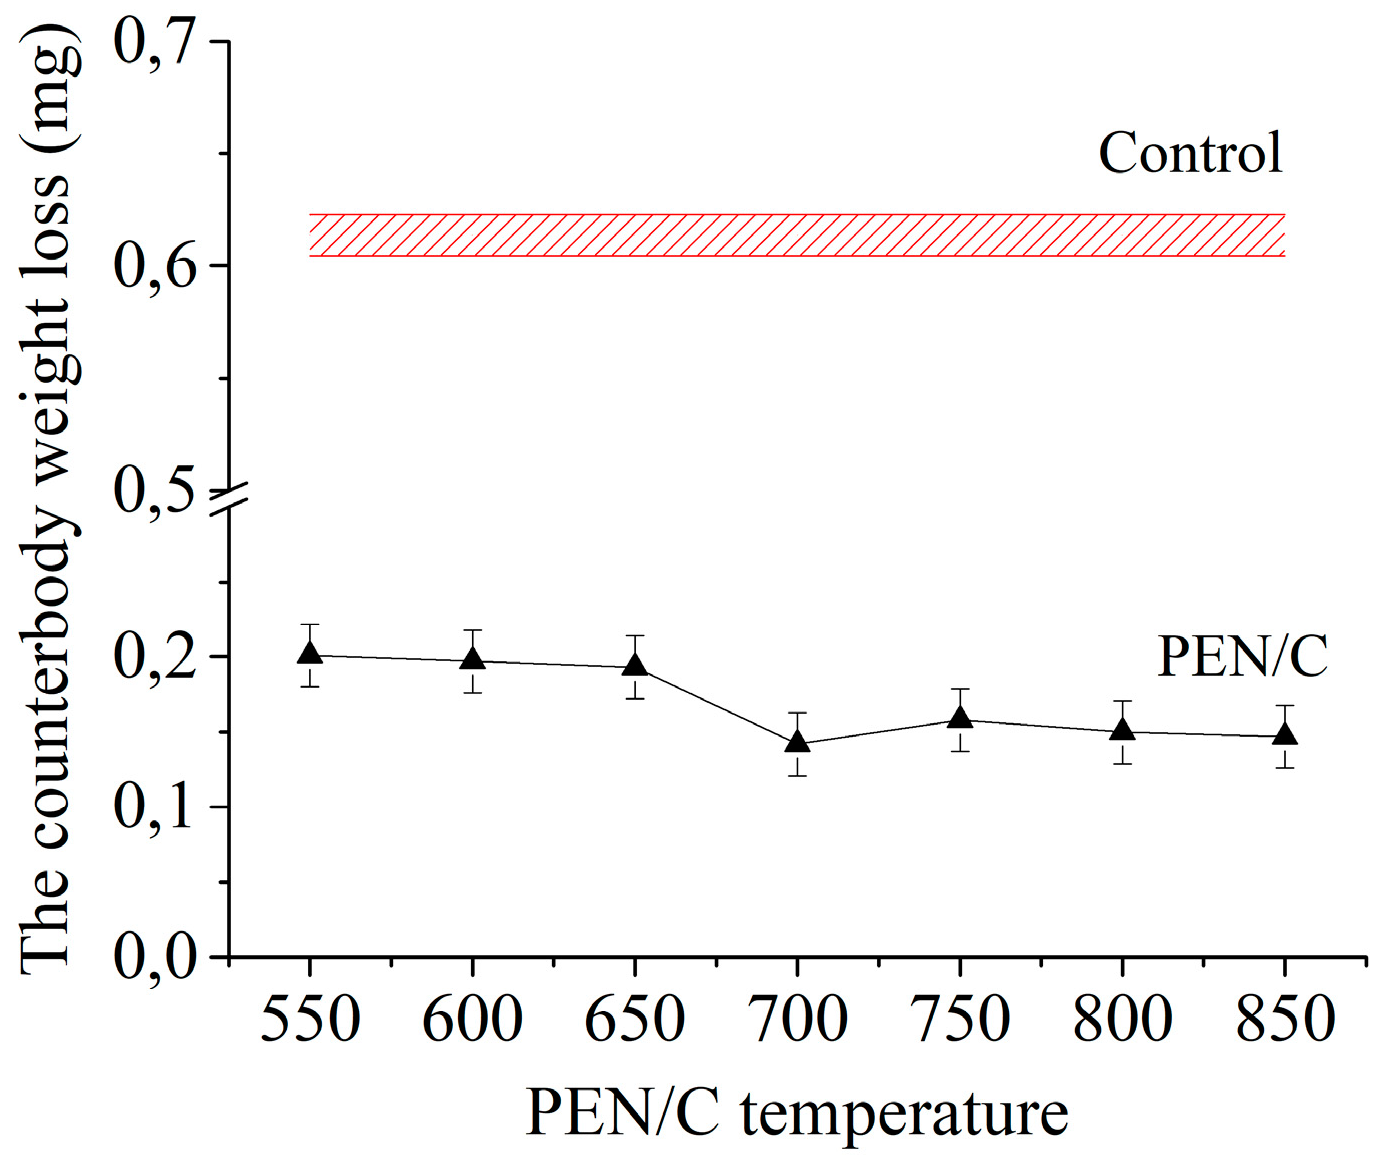
Figure 14.
The weight loss during the second and third kilometers of friction tests of samples after PENC at various temperatures and a control untreated sample.
Figure 14.
The weight loss during the second and third kilometers of friction tests of samples after PENC at various temperatures and a control untreated sample.
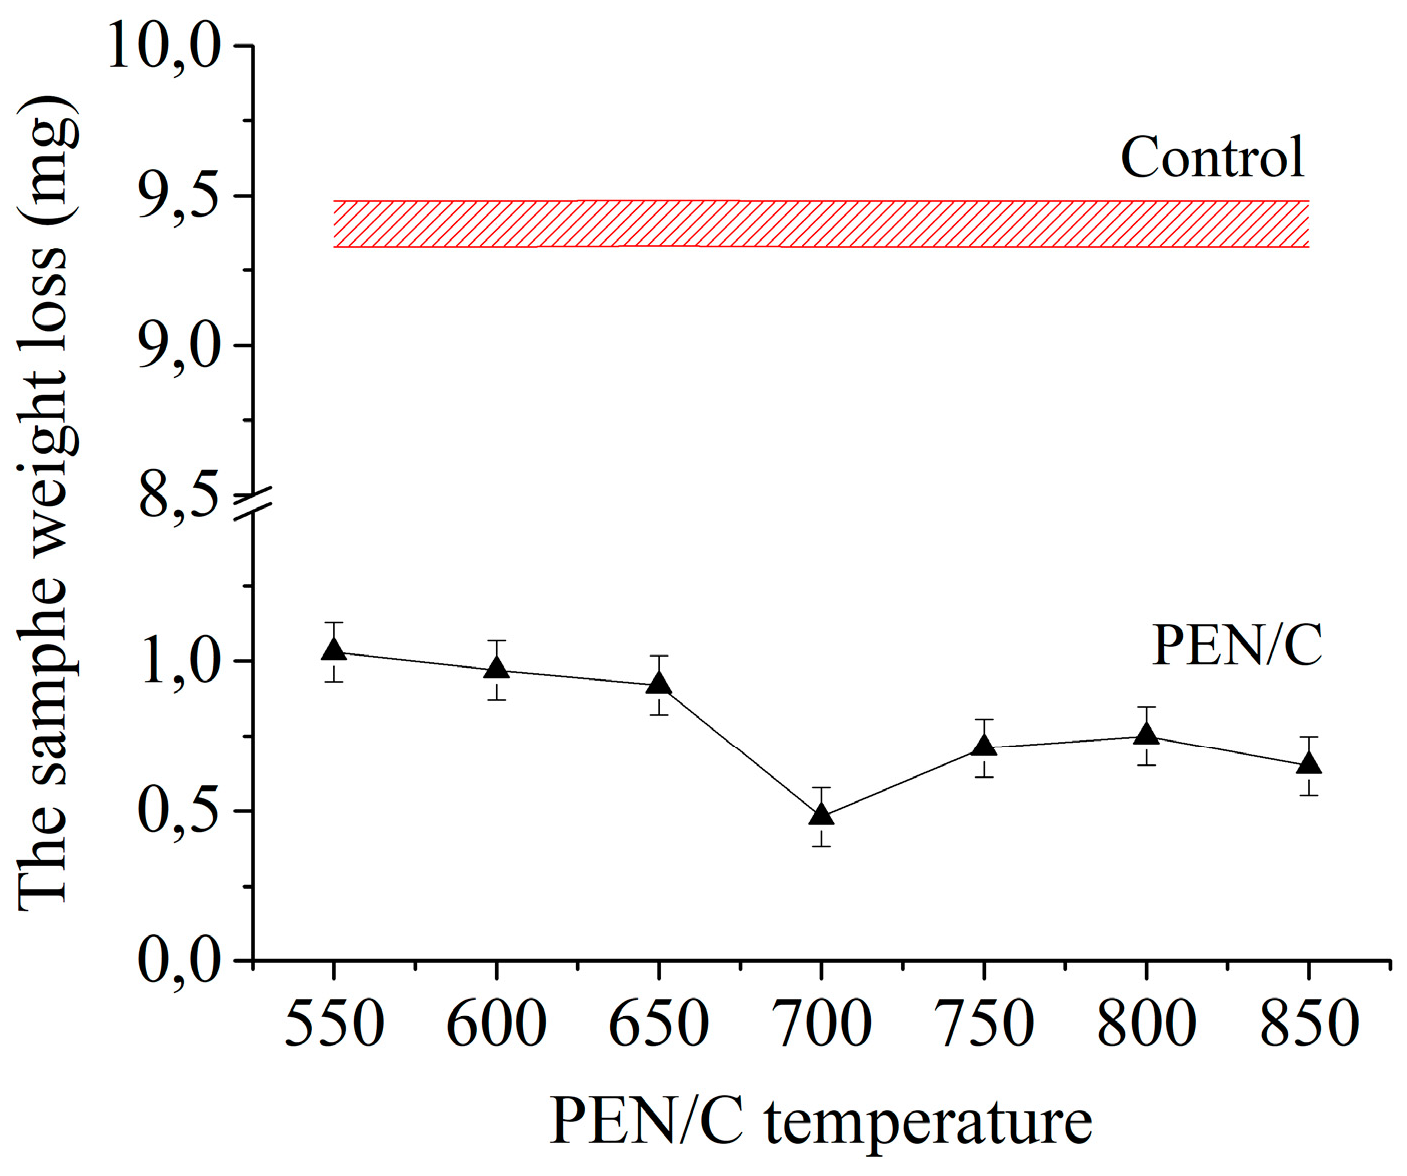
Figure 15.
The weight loss of a bronze counterbody operating in tandem with steel samples after PENC at different temperatures and control one during the second and third kilometers of friction tests.
Figure 15.
The weight loss of a bronze counterbody operating in tandem with steel samples after PENC at different temperatures and control one during the second and third kilometers of friction tests.
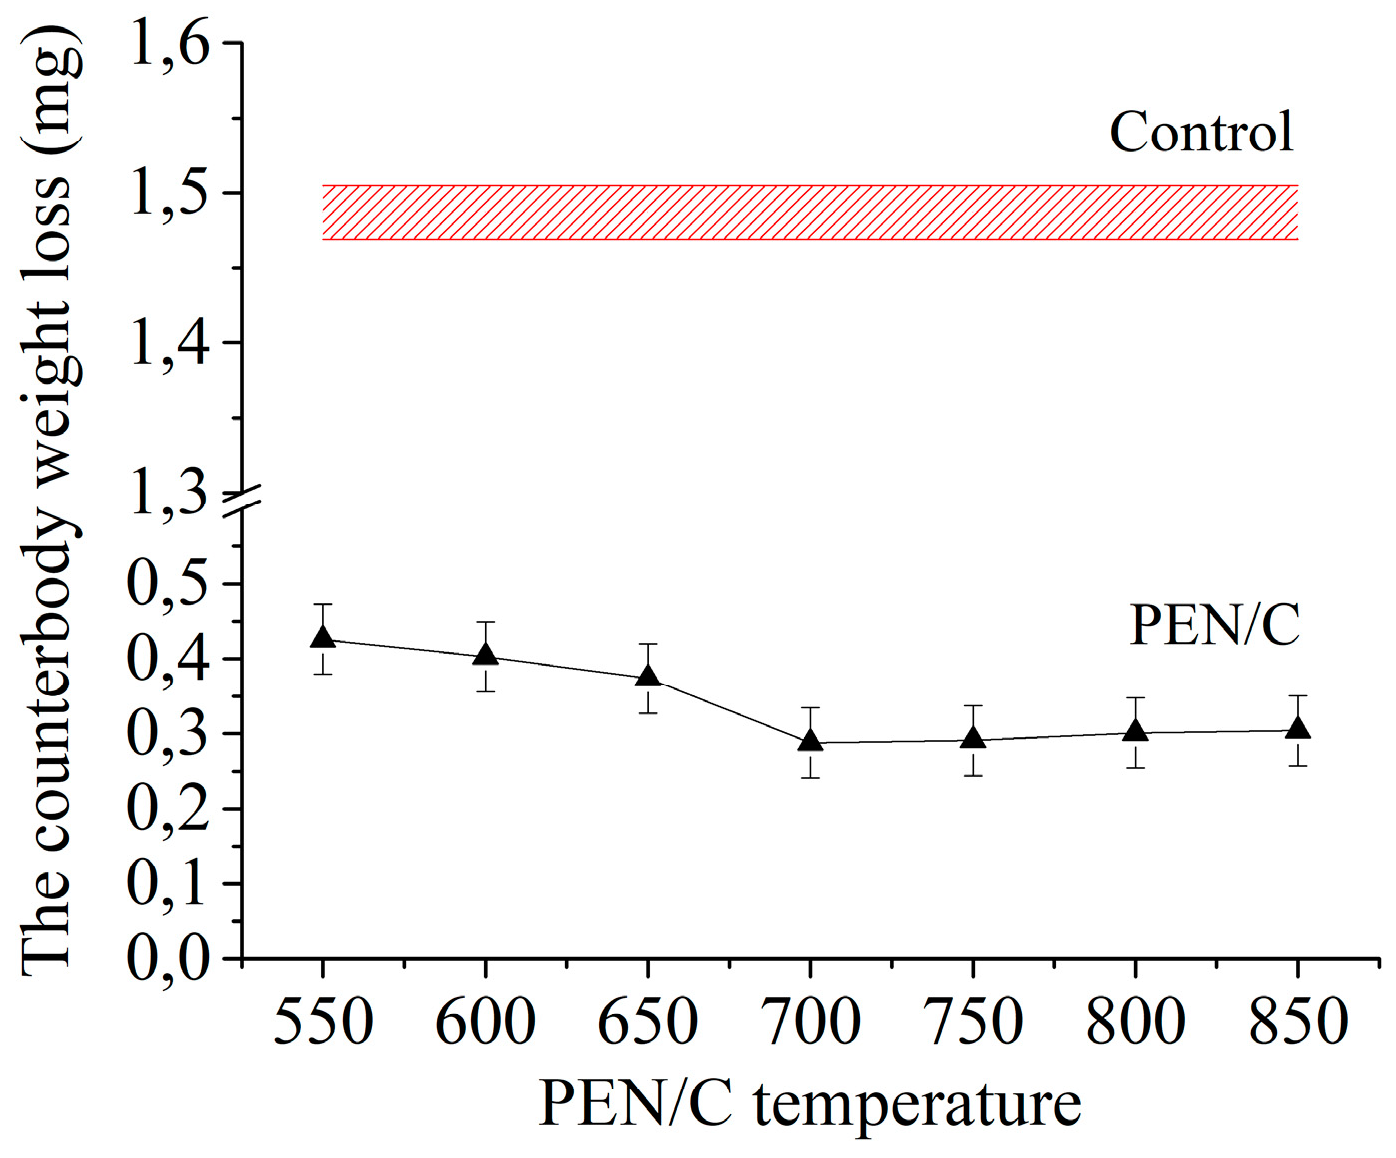
Figure 16.
The weight loss during the fourth and fifth kilometers of friction tests of samples after PENC at various temperatures and a control untreated sample.
Figure 16.
The weight loss during the fourth and fifth kilometers of friction tests of samples after PENC at various temperatures and a control untreated sample.
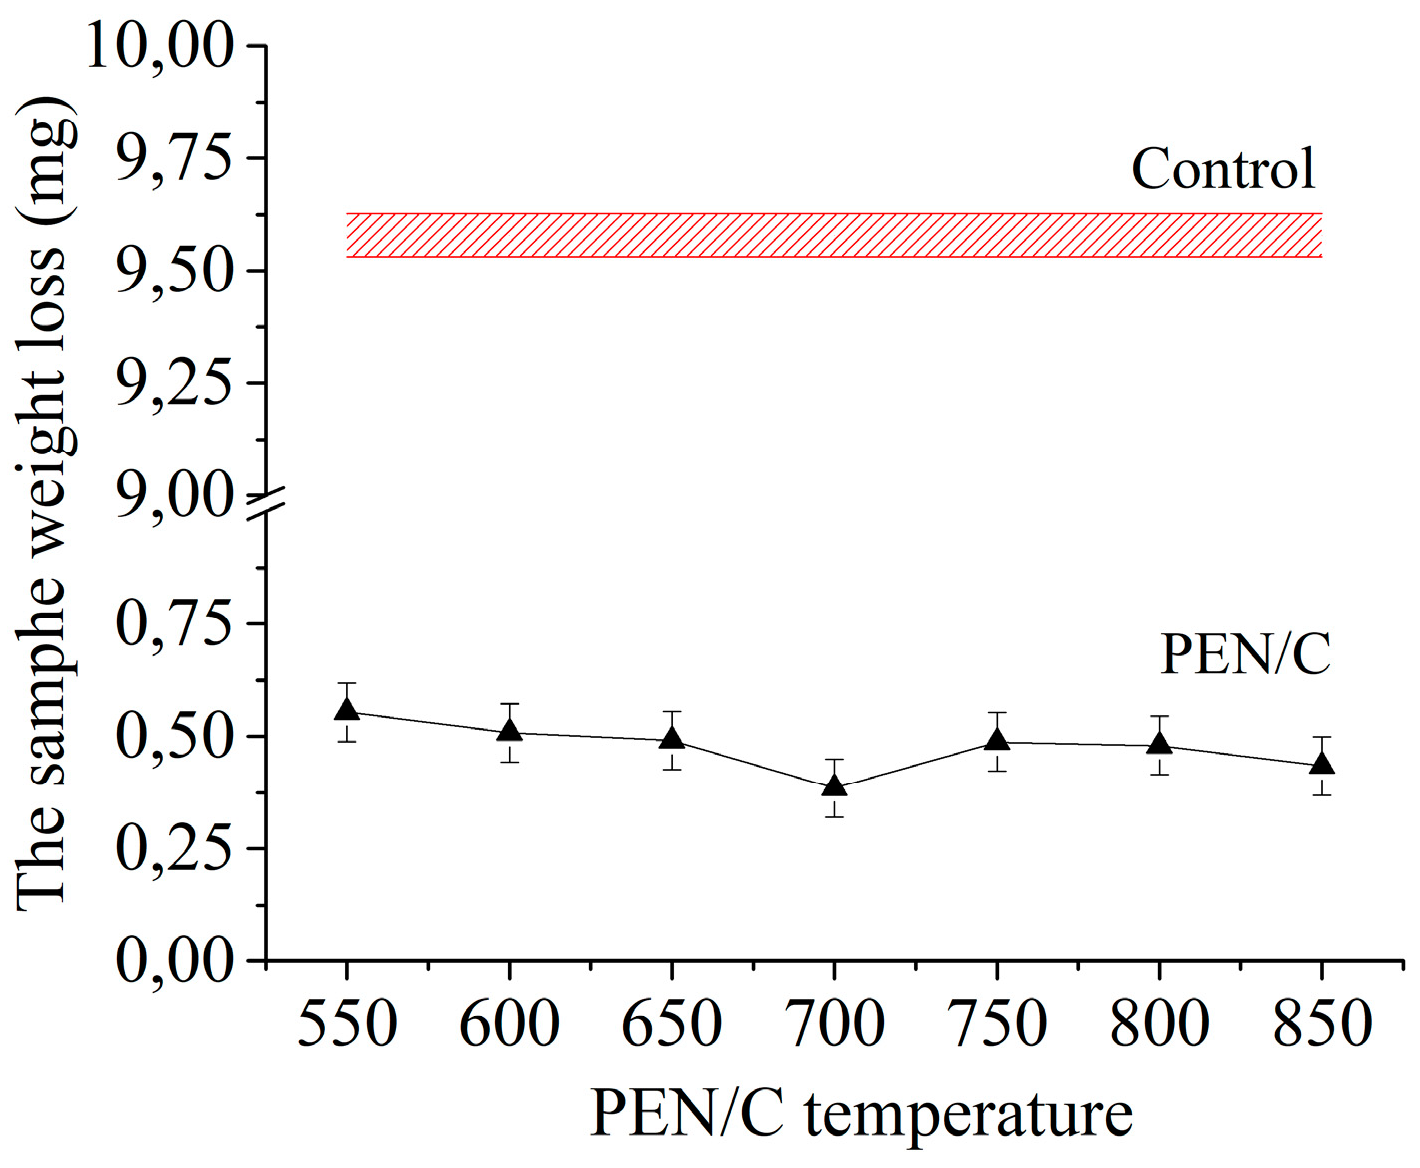
Figure 17.
The weight loss of a bronze counterbody operating in tandem with steel samples after PENC at different temperatures and control one during the fourth and fifth kilometers of friction tests.
Figure 17.
The weight loss of a bronze counterbody operating in tandem with steel samples after PENC at different temperatures and control one during the fourth and fifth kilometers of friction tests.
3.3. Friction Track Analysis
The friction tracks of samples after PENC at temperatures of 500, 700 and 850 °C are shown in Figure 18, Figure 19, Figure 20, Figure 21, Figure 22 and Figure 23. According to the calculations of the relative approach of friction surfaces (13) and the Williamson-Greenwood criterion (8), plastic deformations are realized in the friction contact zone during testing. Traces of plastic deformation are recorded on electron microscopic photographs of friction tracks in the form of stripes in the sliding direction without sharp boundaries. From this it reliably follows that, according to the nature of the deformation of the surface layer, the wear in the tests carried out refers to wear during plastic contact. By the nature of the intermediate medium, this is wear during dry friction without lubrication. Wear is characterized by the successive formation and breaking off microscopic sections of the material of the sample and the counterbody. Thus, the wear in the tests carried out should be defined as dry friction fatigue wear and plastic contact.
On the friction tracks of the samples after PENC at temperatures of 550 and 700 °C, dark gray fragments of oxide films are visible. Elemental analysis reveals the presence of bronze adhering from the counterbody. It can be seen from the Figure 19, Figure 21 and Figure 22 that, up to a saturation temperature of 700 °C, no sticking of bronze from the counterbody to the sample surface occurs. In the sample after PENC at 850°C, in the field of view of the microscope, the adhering bronze occupies 39% of the surface area of the friction track.
Figure 18.
SEM image of the friction track of the sample after PENC at 550 °C.
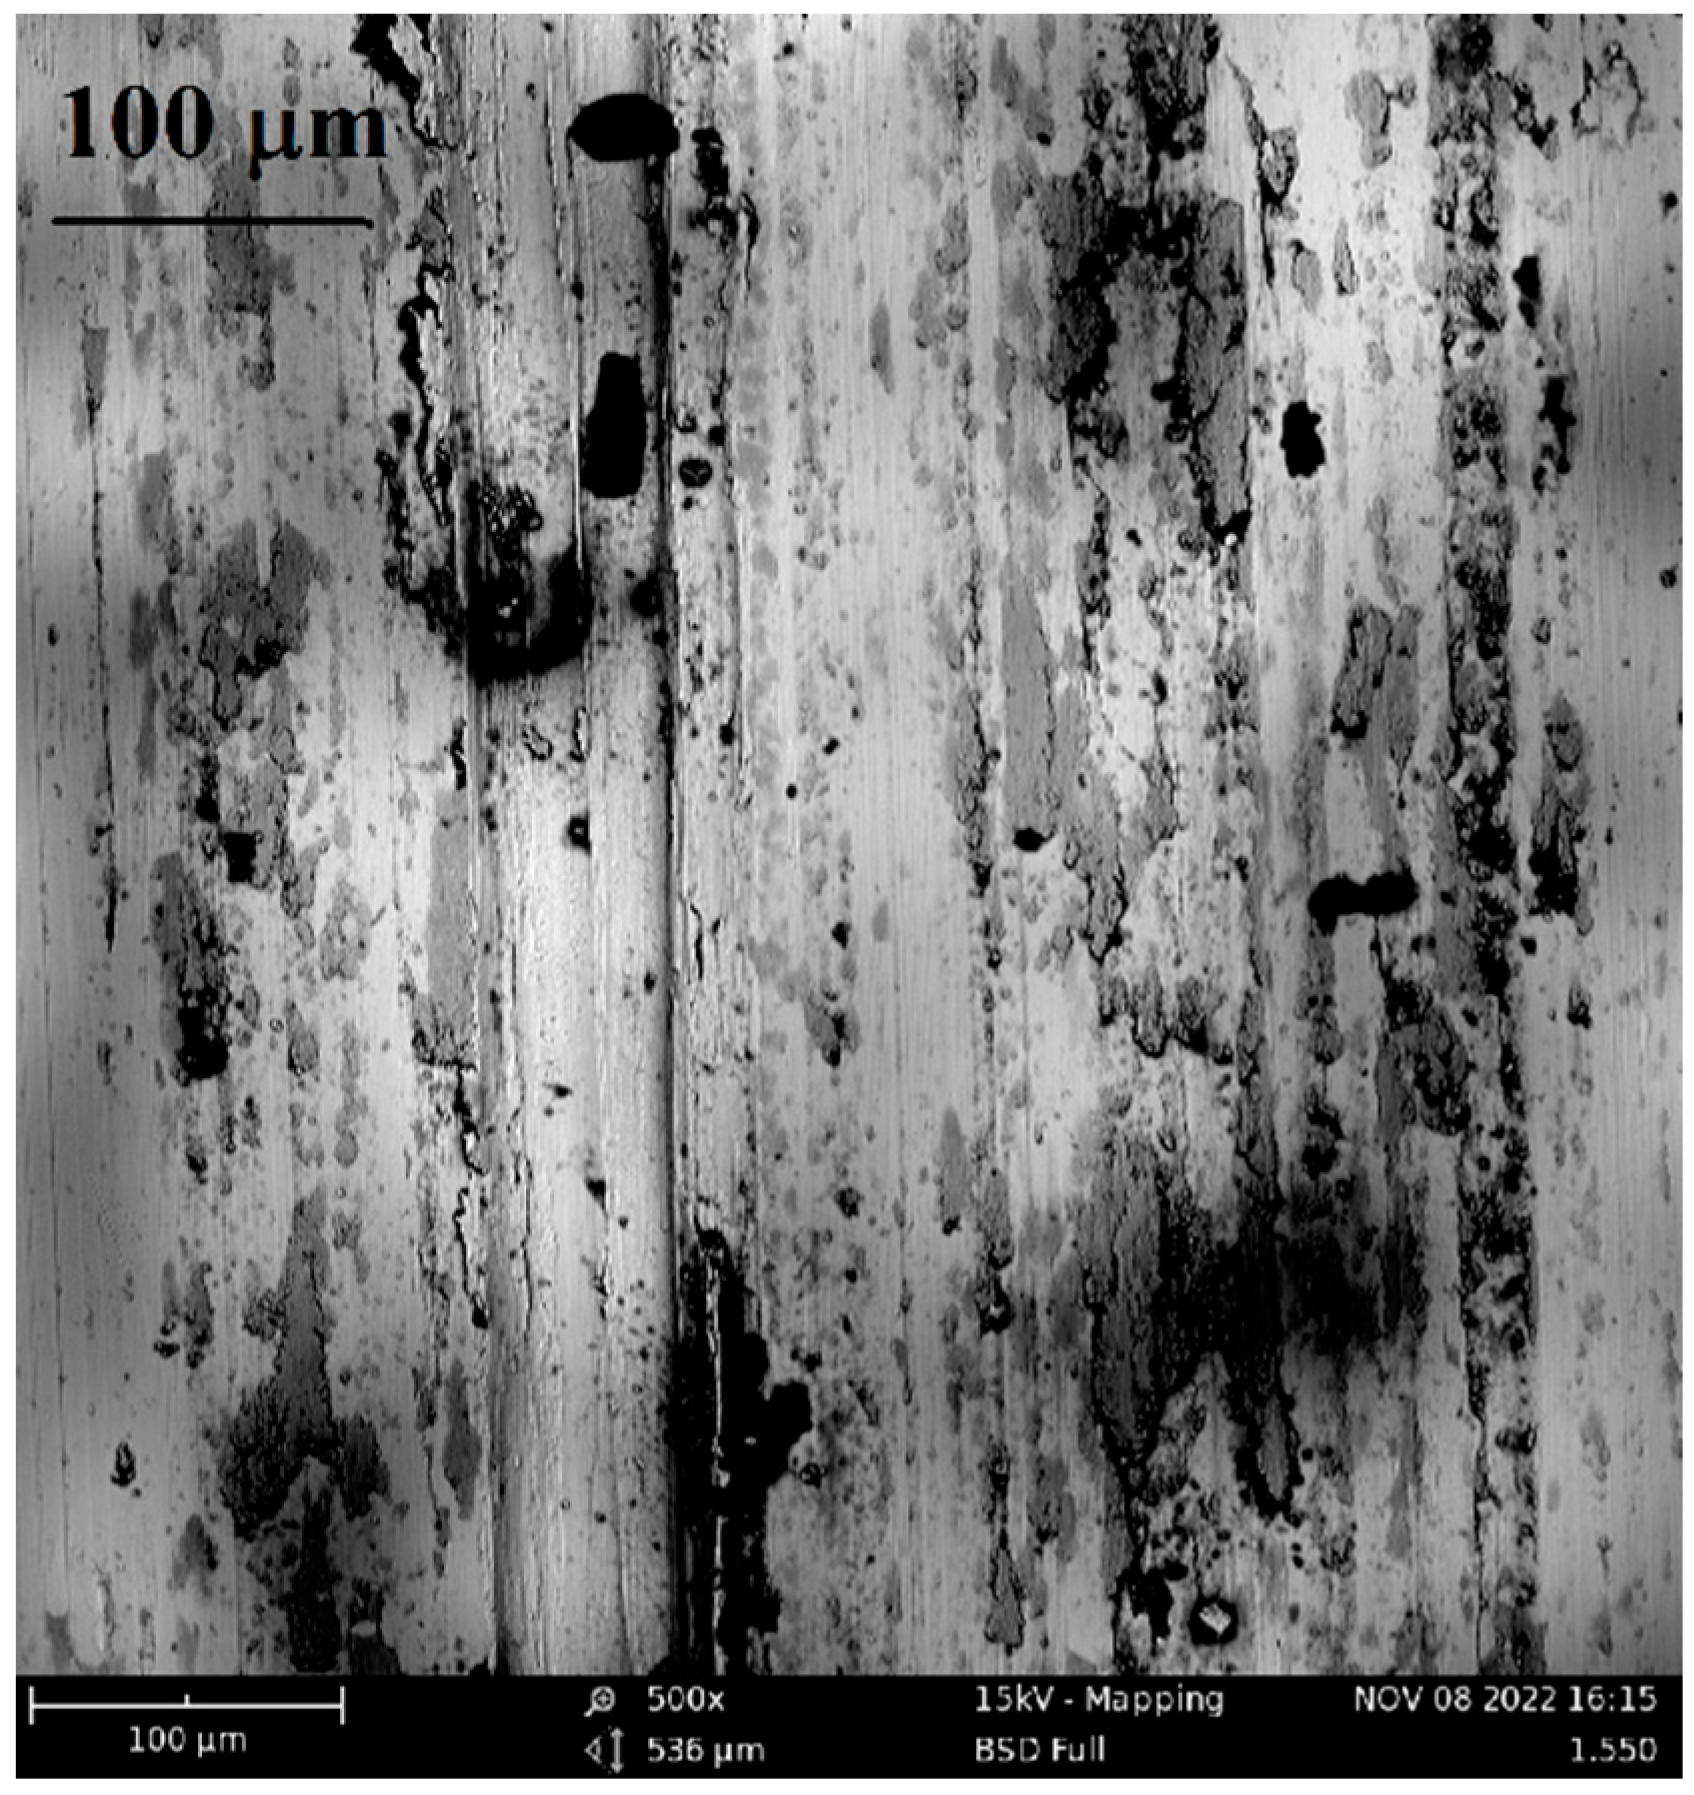
Figure 19.
SEM image of the friction track of the sample after PENC at 550 °C with the results of elemental analysis for the content of traces of copper.
Figure 19.
SEM image of the friction track of the sample after PENC at 550 °C with the results of elemental analysis for the content of traces of copper.

Figure 20.
SEM image of the friction track of the sample after PENC at 700 °C.
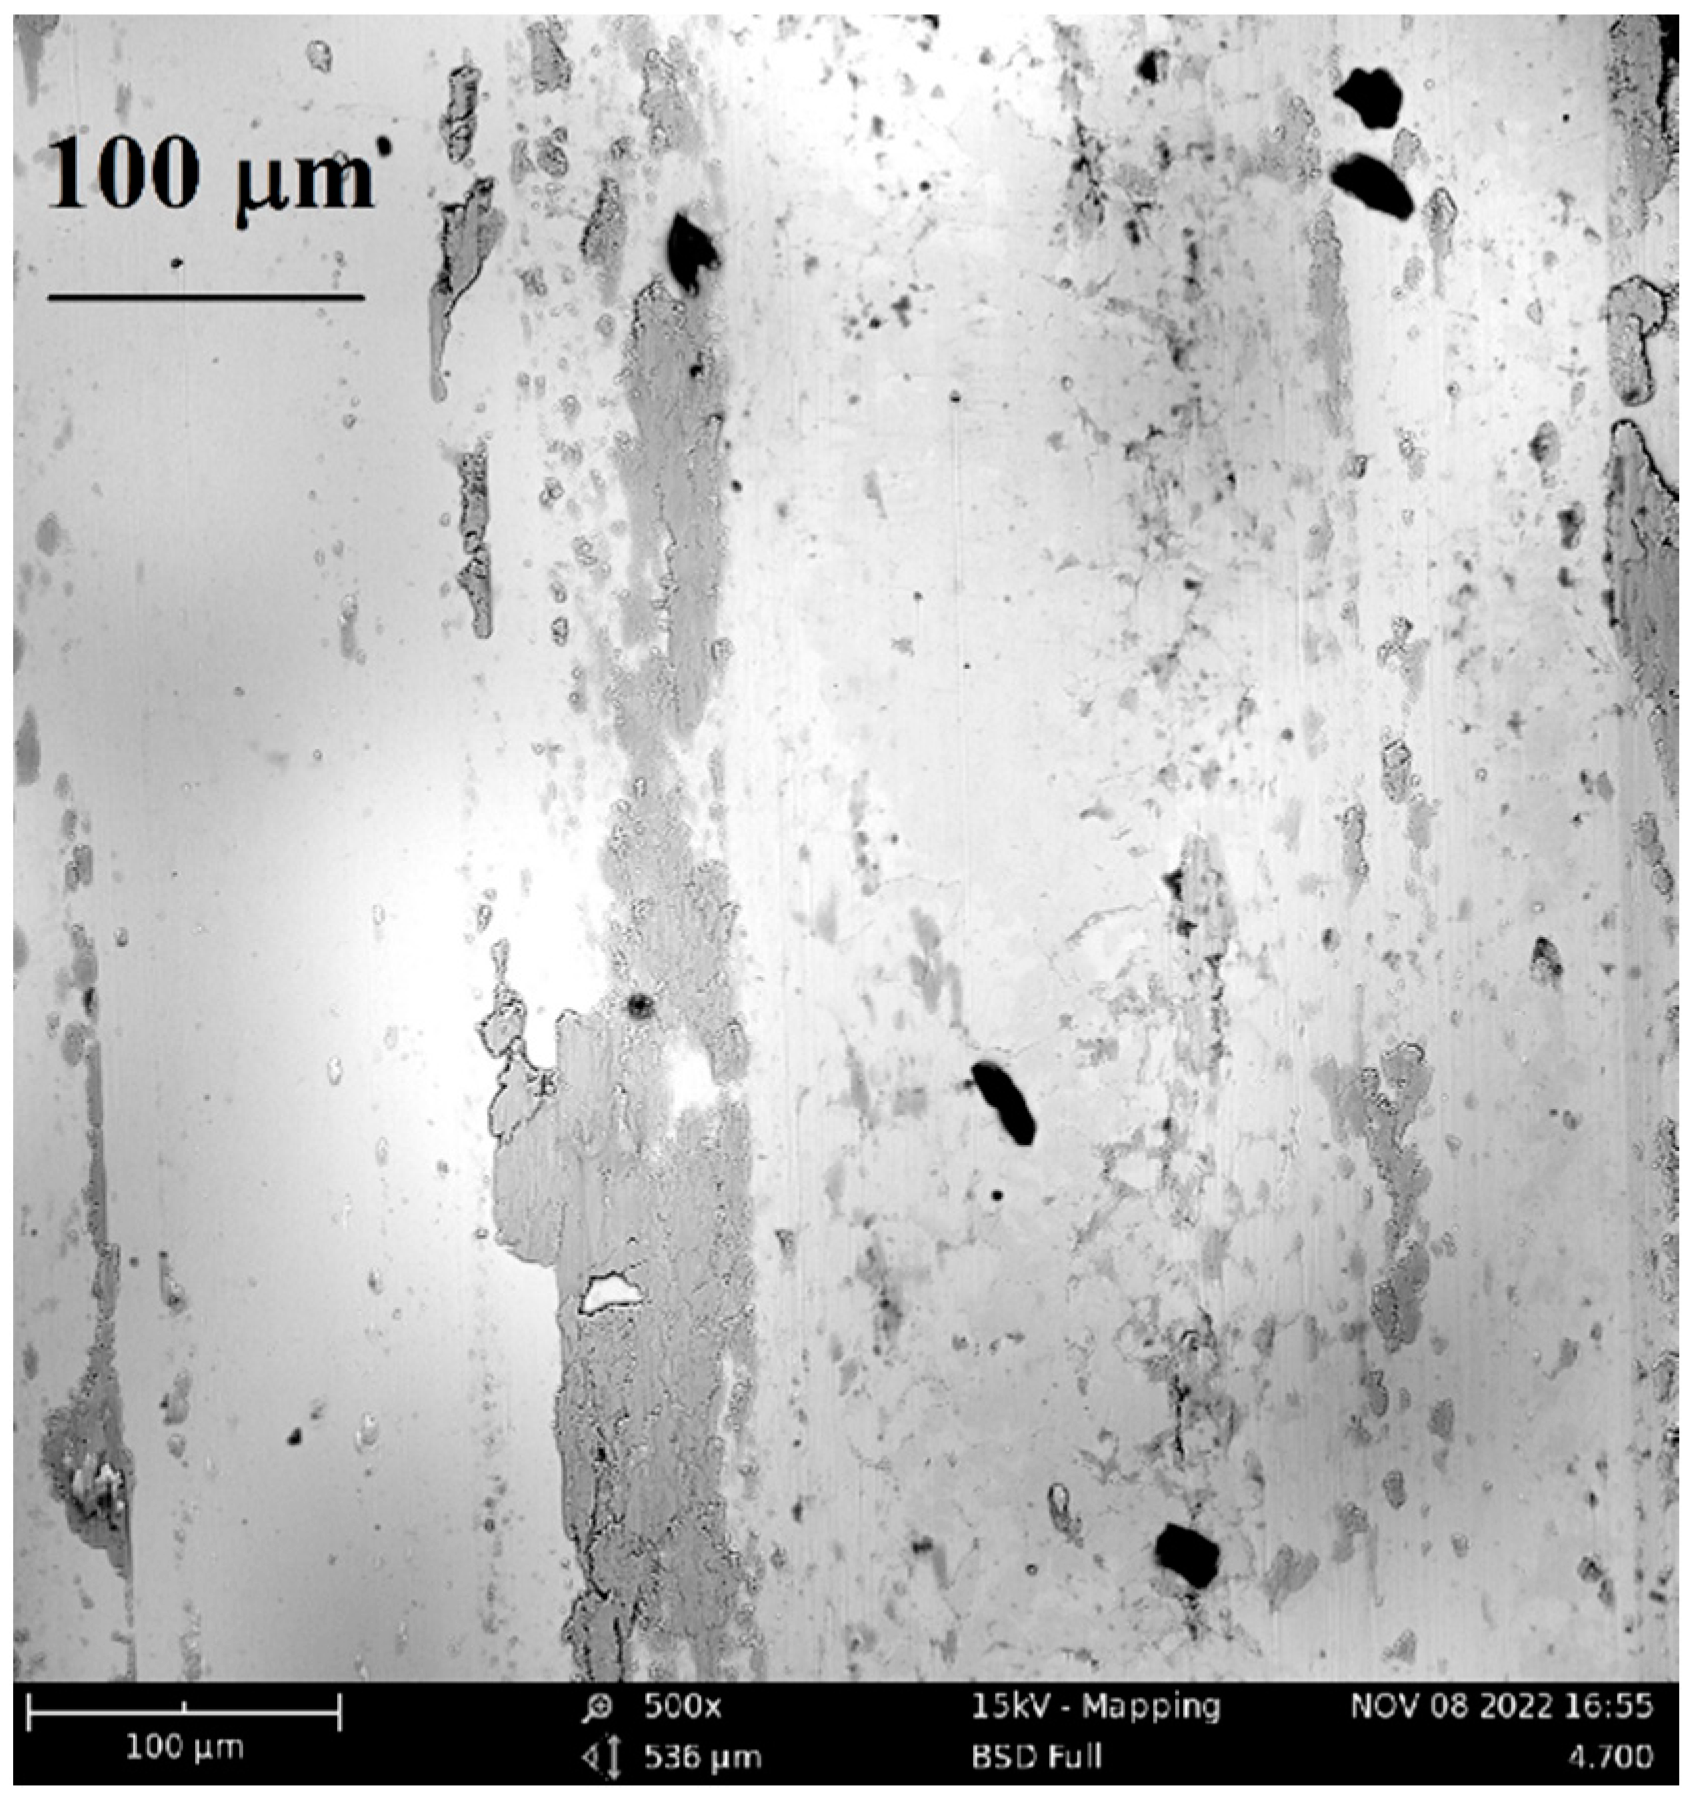
Figure 21.
SEM image of the friction track of the sample after PENC at 700 °C with the results of elemental analysis for the content of traces of copper.
Figure 21.
SEM image of the friction track of the sample after PENC at 700 °C with the results of elemental analysis for the content of traces of copper.
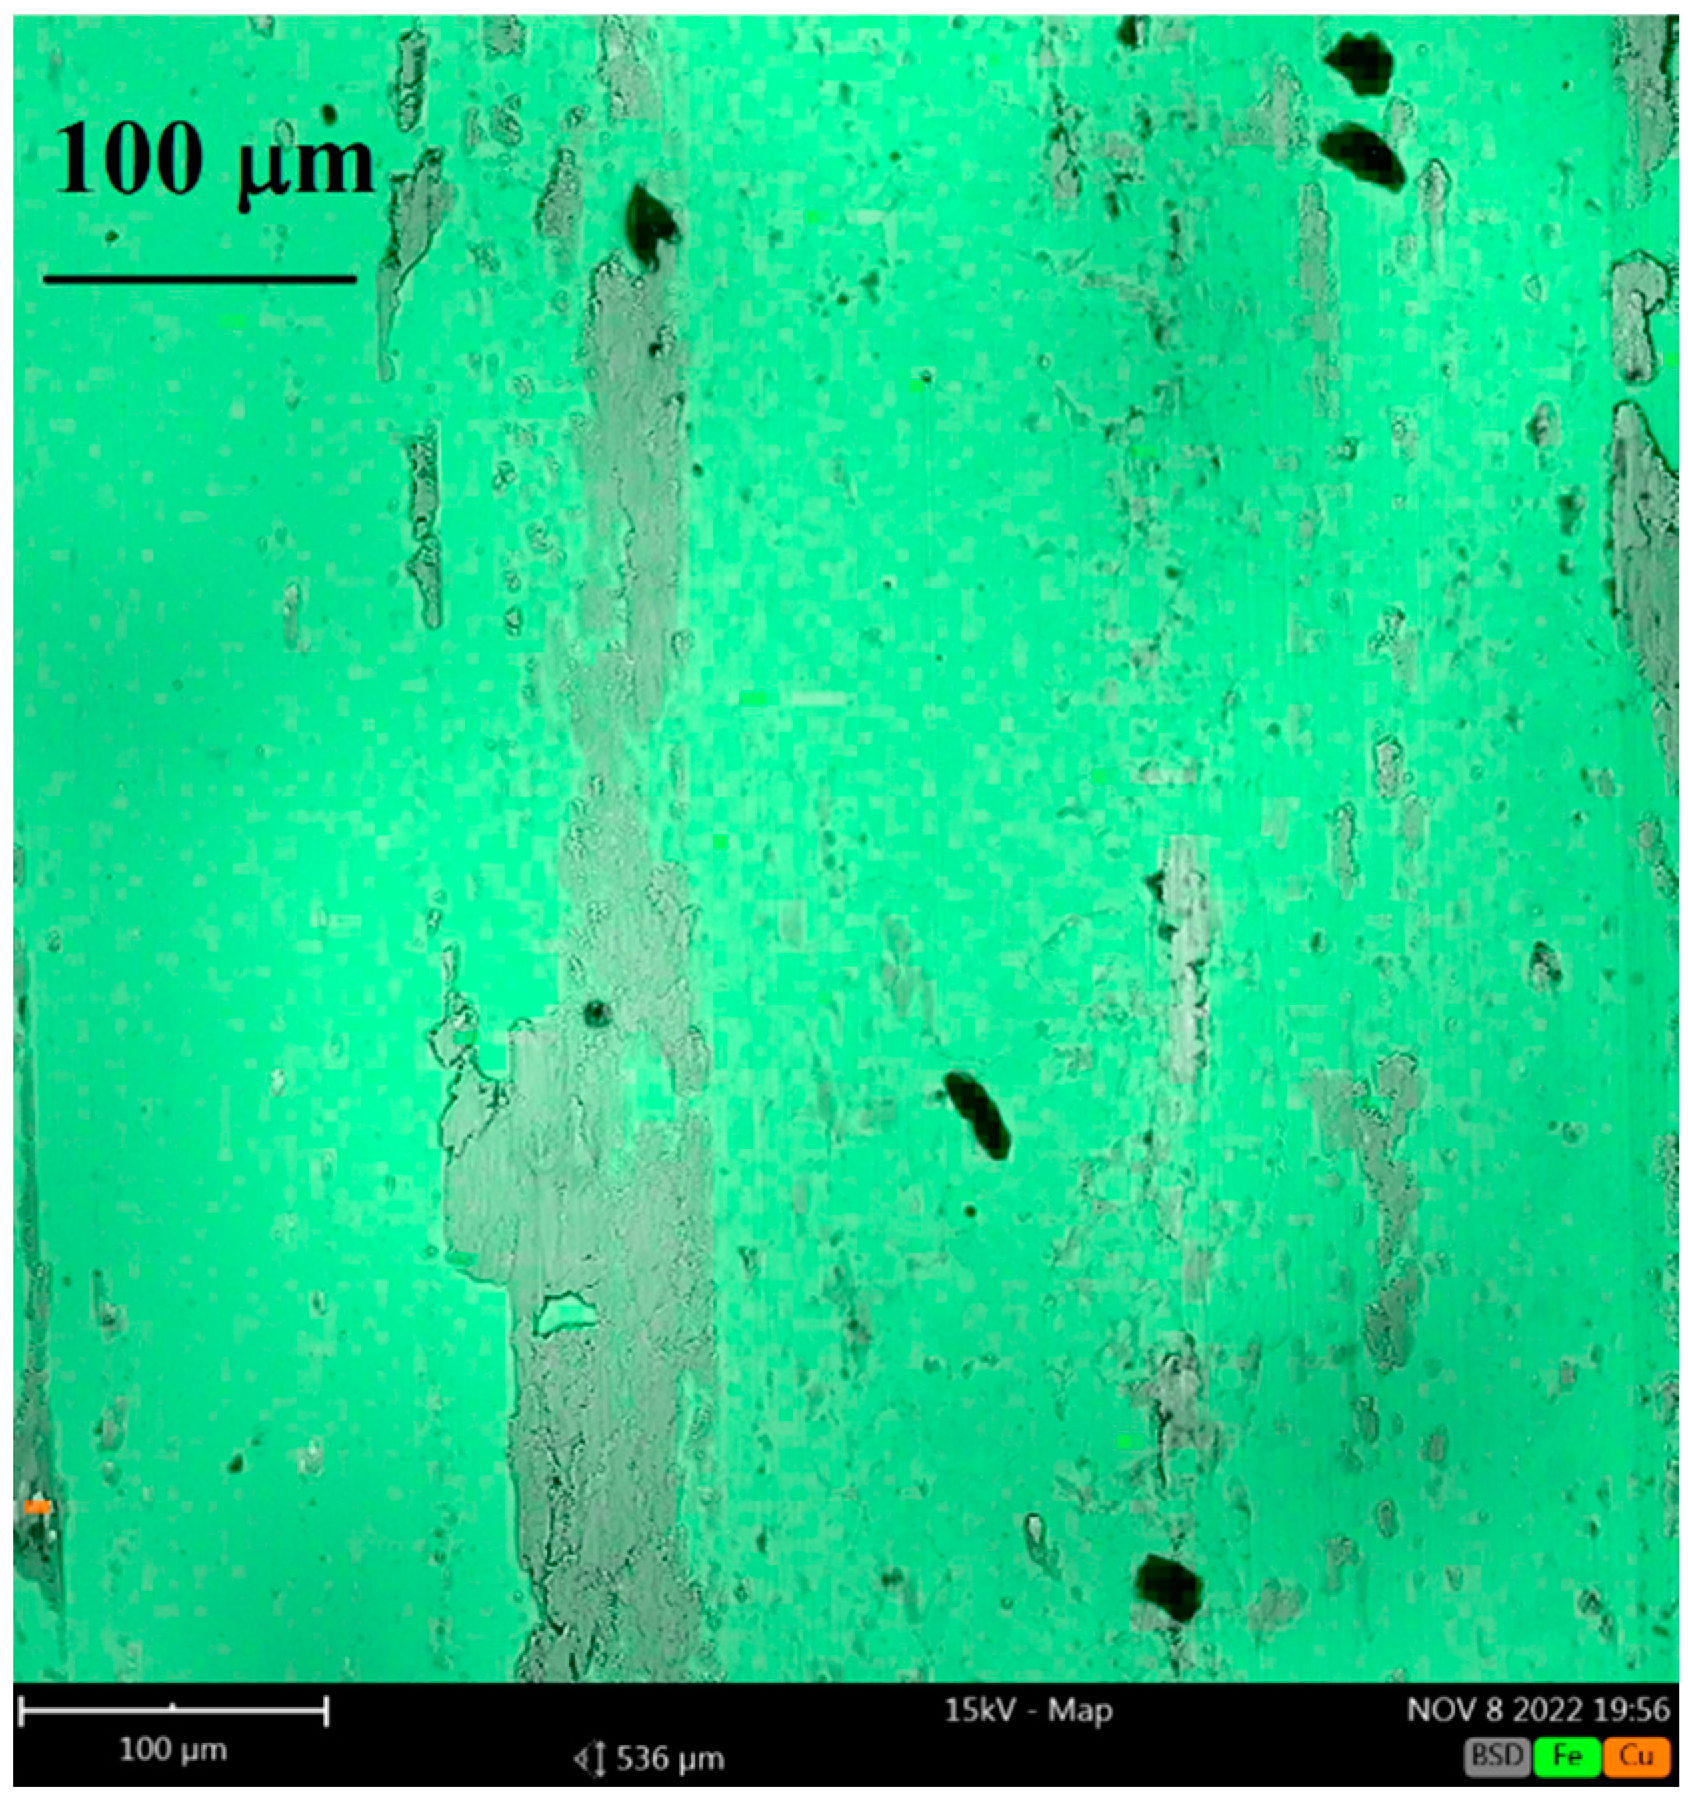
Figure 22.
SEM image of the friction track of the sample after PENC at 850 °C.
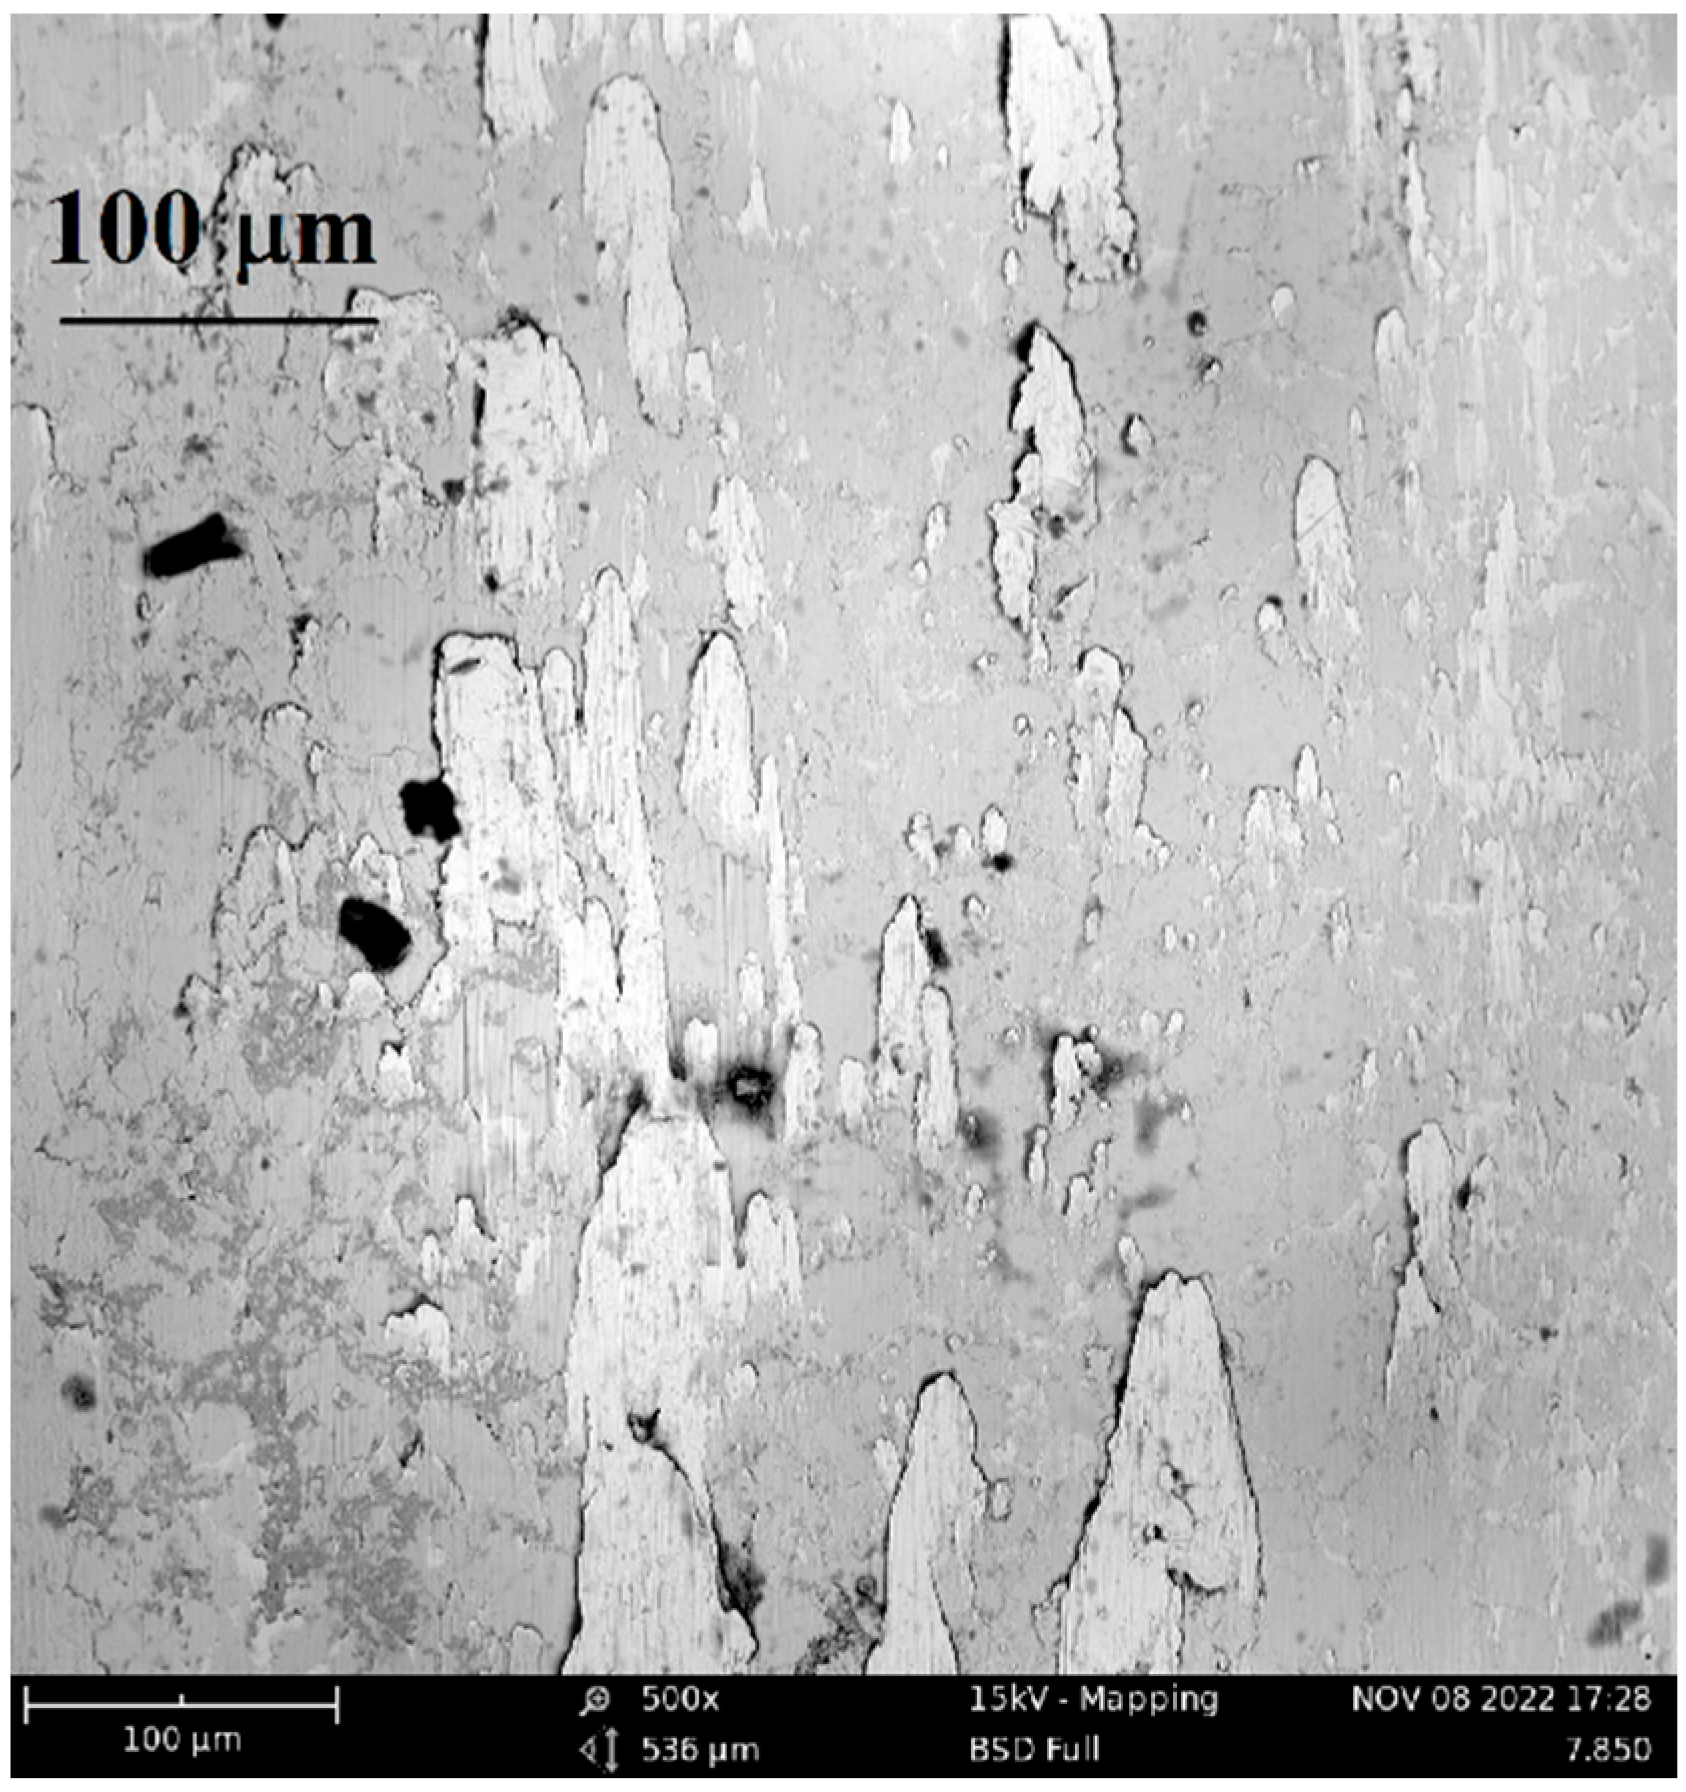
Figure 23.
SEM image of the friction track of the sample after PENC at 850 °C with the results of elemental analysis for the content of traces of copper.
Figure 23.
SEM image of the friction track of the sample after PENC at 850 °C with the results of elemental analysis for the content of traces of copper.

3.4. Surface Microgeometry Parameters
The results of calculating the parameters of the surface microgeometry and the contact stiffness of steel samples on bronze counterbodies are shown in Table 1.
At higher PENC temperatures from 700 to 850°C, the radii of rounding of the tops of roughness microprotrusions are smaller than at lower temperatures in the range of 550–650°C. An increase in the radii of the tops of microasperities contributes to their less deep penetration into the volume of the deformable counterbody.
A higher bearing capacity, according to the calculations of the Kragelsky-Kombalov criterion, is also possessed by samples after PENC in a higher temperature range from 700 to 850 °C.
PENC at all temperatures leads to an increase in contact stiffness by a factor of 1.6-2.6 compared to a friction pair with a control untreated sample.
3.5. Structure and Microhardness of the Nitrocarburized Layer
The results of tribological tests are in good agreement with microhardness measurements. Lower friction coefficients and weight losses over all five kilometers of the test are shown by samples after PENC at higher temperatures from 700 to 850 °C. This temperature range corresponds to the highest values of microhardness (Figure 24). The maximum microhardness is shifted from the edge of the sample to a depth of 30–40 µm. The maximum value of microhardness increases with an increase in the PENC temperature from 1380 HV at 700 °C to 1419 HV at 850 °C, while the hardness at the edge of the sample in the same temperature range increases from 1110 HV to 1194 HV.
Low temperatures of PENC provide microhardness at the sample edge from 652 HV at 550 °C to 790 HV at 650 °C. The PENC temperature of 550 °C gives the maximum microhardness at the very edge of the sample with a smooth decrease to 551 HV at a distance of 300 µm from the surface. After PENC at temperatures of 600 and 650°C, the maximum microhardness is shifted deep into the sample by 10 and 20 µm, respectively, and amounts to 826 and 903 HV, which is 36 and 42% less than the maximum microhardness after PENC at 850°C.
The distribution of microhardness over the depth of the diffusion zone is explained by the structure of the surface layer of the samples after PENC.
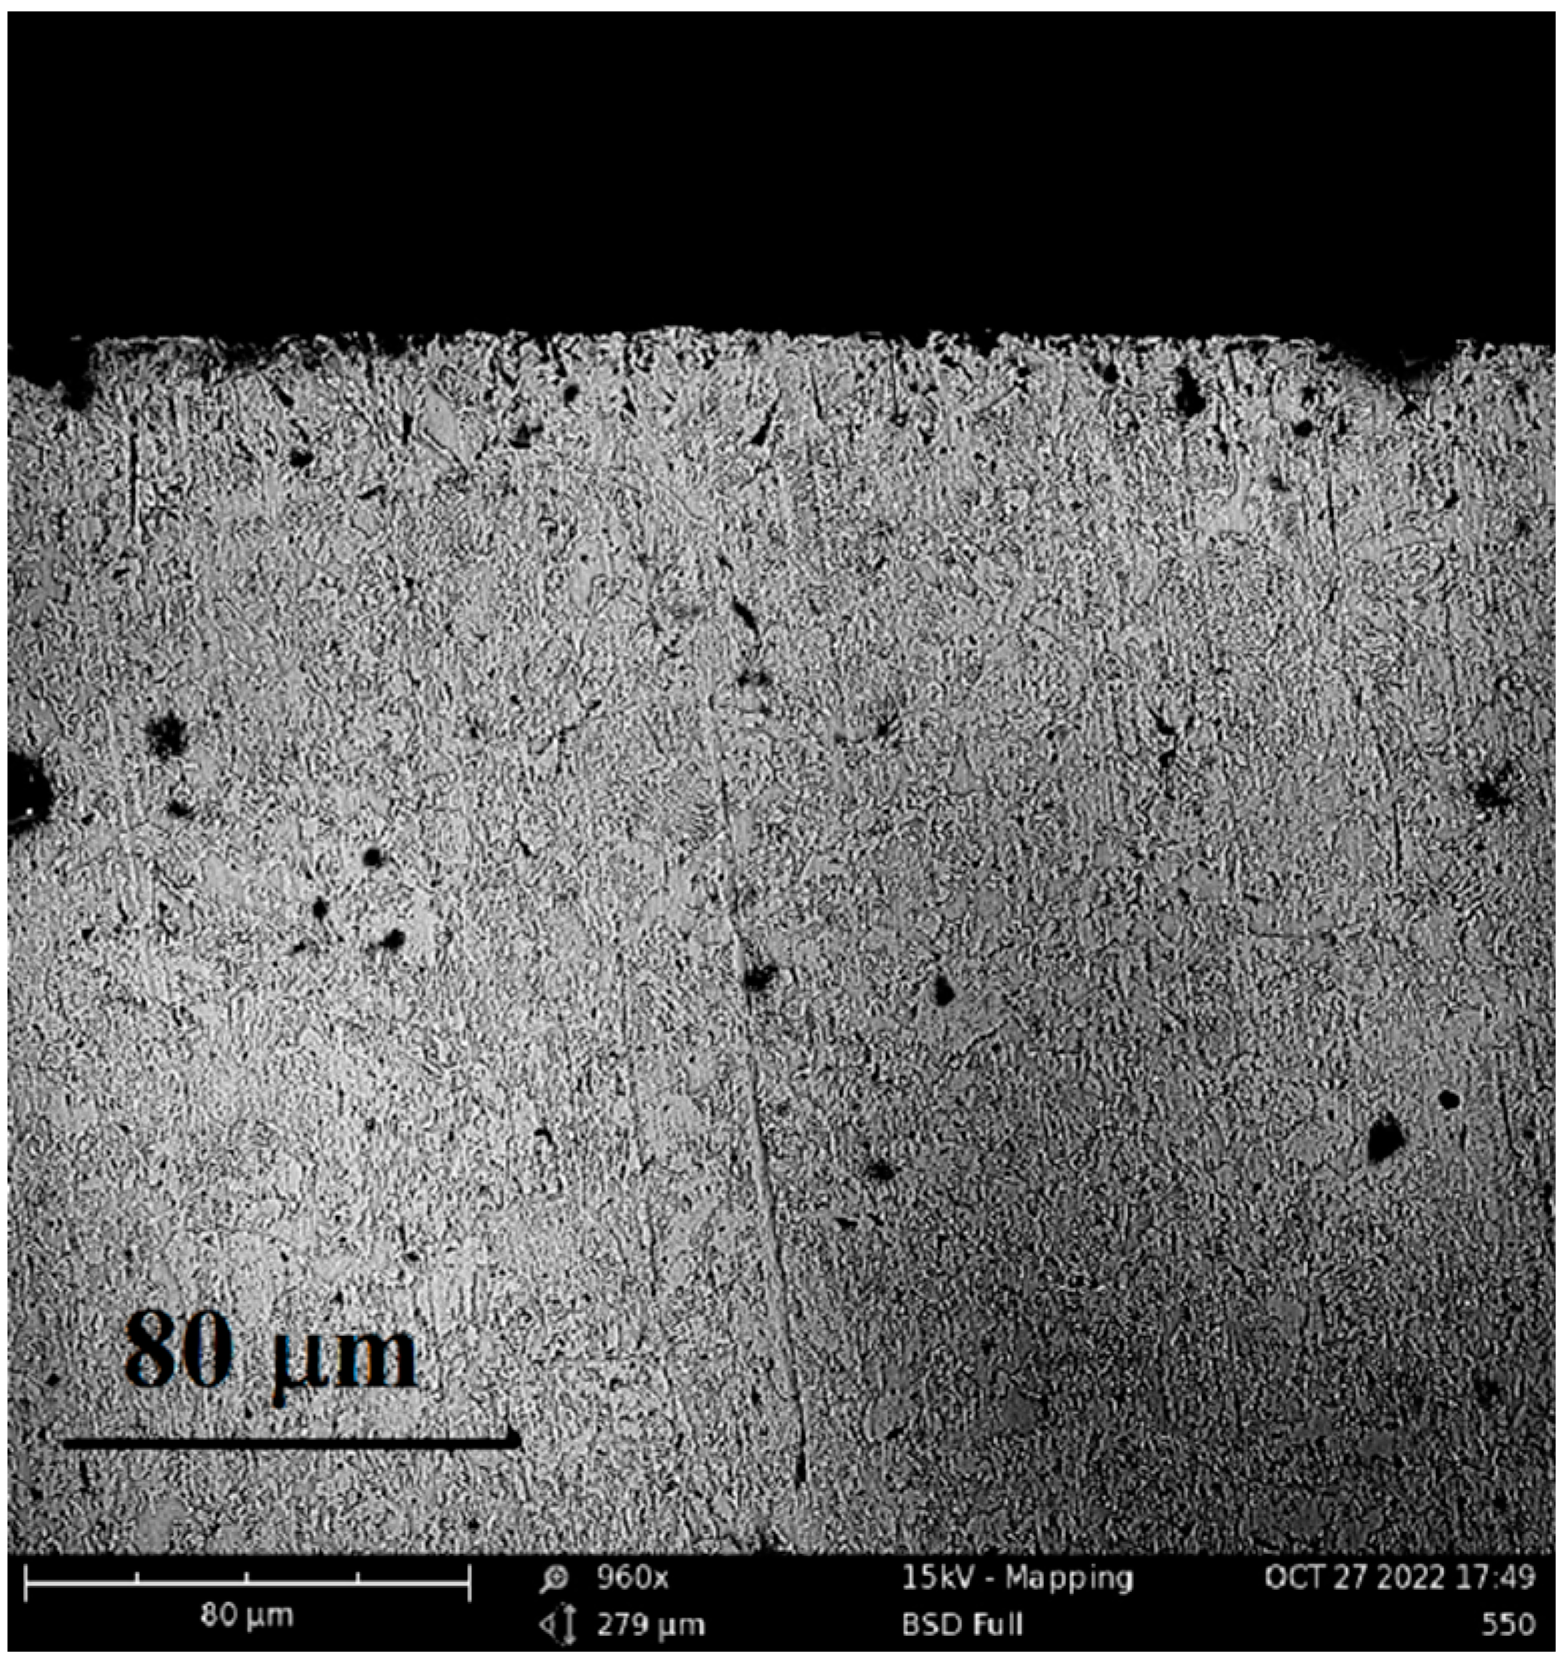
Figure 25, Figure 26 and Figure 27 show the cross sections of samples after PENC at temperatures of 550, 700, and 850 °C. The outer layer enriched with iron oxides may not be preserved when polishing samples for metallographic analysis. The oxide layer is formed as a result of high-temperature oxidation of a steel sample in water vapor in a vapor-gas envelope. On figures, it appears as a thin black stripe at the very edge of the sample; a separate number does not indicate it. The oxide layer is noticeable after PENC at temperatures of 550 and 850°C and is almost invisible for the sample after treatment at 700°C.
Figure 25 and Figure 26 reveal a thin light layer (layer 1). This layer is enriched with retained austenite. The sample after PENC at 850 °C in layer 1, in addition to retained austenite, contains iron nitrides, and after PENC at 700 °C, iron nitrides and carbonitrides. Under this layer there is a hardened zone containing finely acicular nitrogenous martensite with dispersed iron nitrides (layer 2 on figures 25 and 26). Solid solutions of carbon and nitrogen with a concentration higher than the initial one follow even further. On the cross-section of the sample after PENC at 550 °C, only the ferrite-pearlite structure is visible under the oxide layer.
In the surface regions (Figures 25,26), the retained austenite has a predominant effect on the hardness of the structure. The highest hardness is provided by the martensitic phase, so the highest hardness is not on the surface, but at a distance of 30-40 m from it (Figure 24). It is important to note that nitrogen diffusion greatly lowers the iron austenitization temperature. Already 0.07% nitrogen reduces the eutectoid temperature to 700°C, and at 0.1% nitrogen it drops to 590°C [29]. Acicular martensite in the structure of the sample after PENC at a temperature of 550 °C is not observed (Figure 27), therefore, high microhardness values were not achieved for this sample (Figure 24). The absence of retained austenite on the surface and the homogeneous structure provide a smooth decrease in hardness towards the core (Figure 24 and Figure 27).
Figure 24.
Microhardness distribution in the surface layer of steel sample after PENC at different treatment temperatures.
Figure 24.
Microhardness distribution in the surface layer of steel sample after PENC at different treatment temperatures.
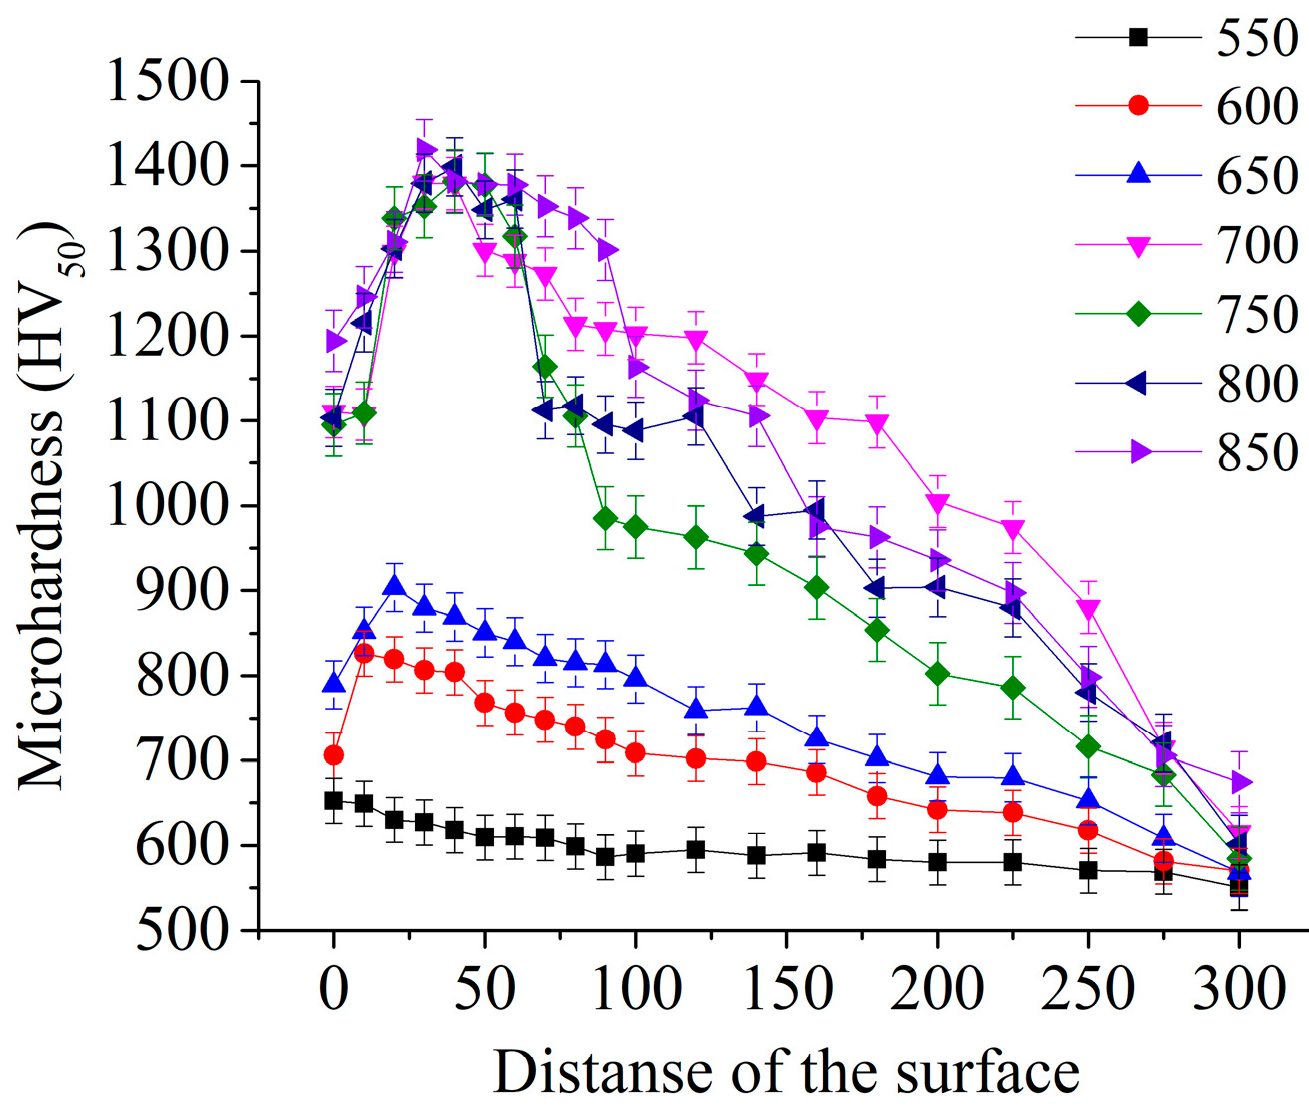
Figure 25.
Microstructure of the steel sample after PENC at 850 °C. 1 – nitride zone with residual austenite and iron nitrides, 2 – nitride-martensite zone, 3 – martensite.
Figure 25.
Microstructure of the steel sample after PENC at 850 °C. 1 – nitride zone with residual austenite and iron nitrides, 2 – nitride-martensite zone, 3 – martensite.
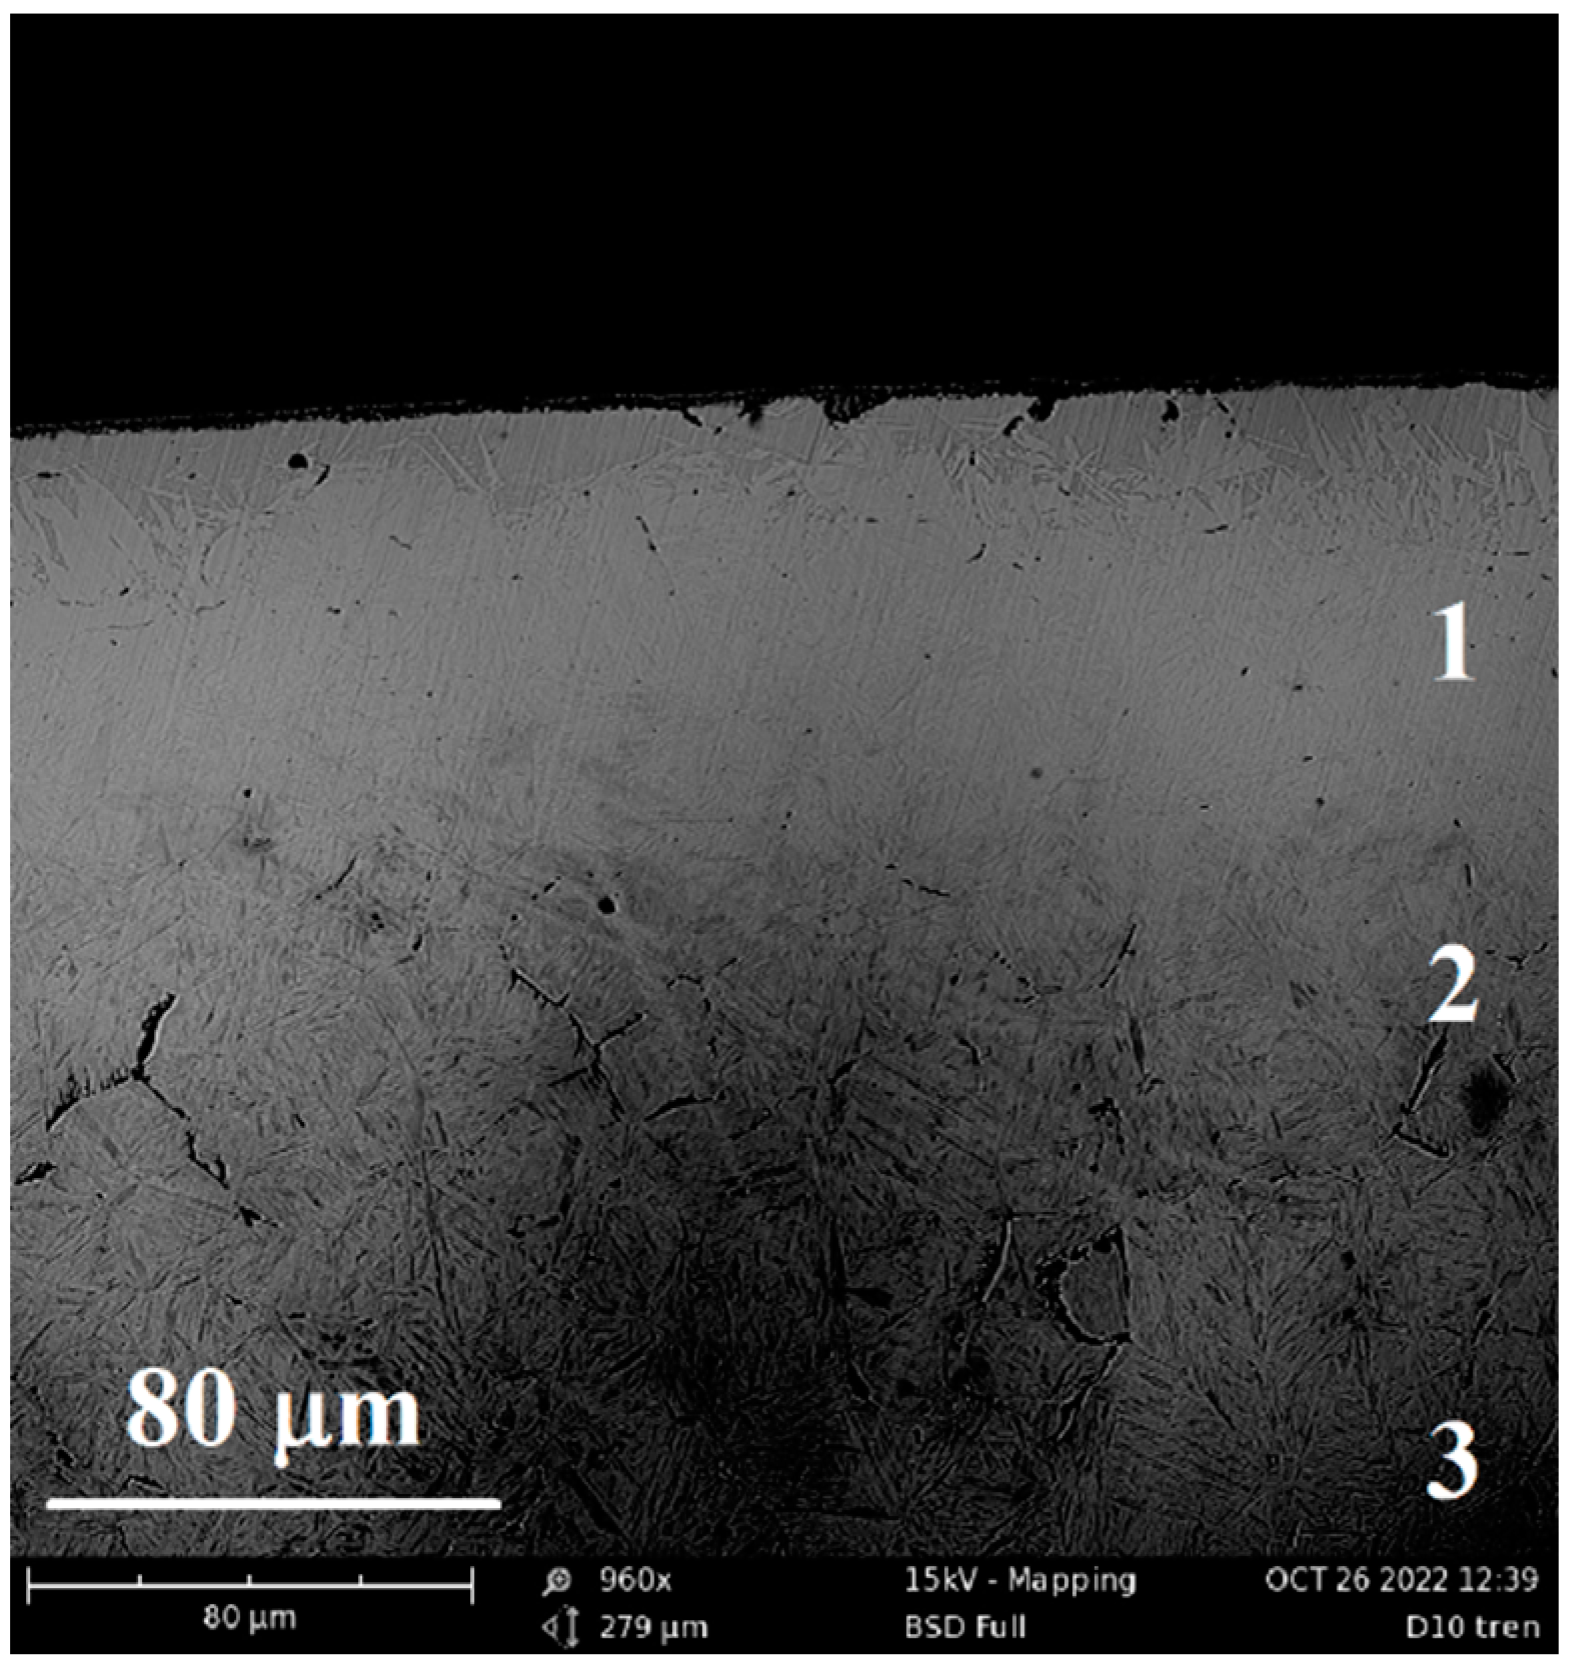
Figure 26.
Microstructure of the steel sample after PENC at 700 °C. 1 – nitride zone with residual austenite and iron nitrides, 2 – nitride-martensite zone, 3 – martensite.
Figure 26.
Microstructure of the steel sample after PENC at 700 °C. 1 – nitride zone with residual austenite and iron nitrides, 2 – nitride-martensite zone, 3 – martensite.
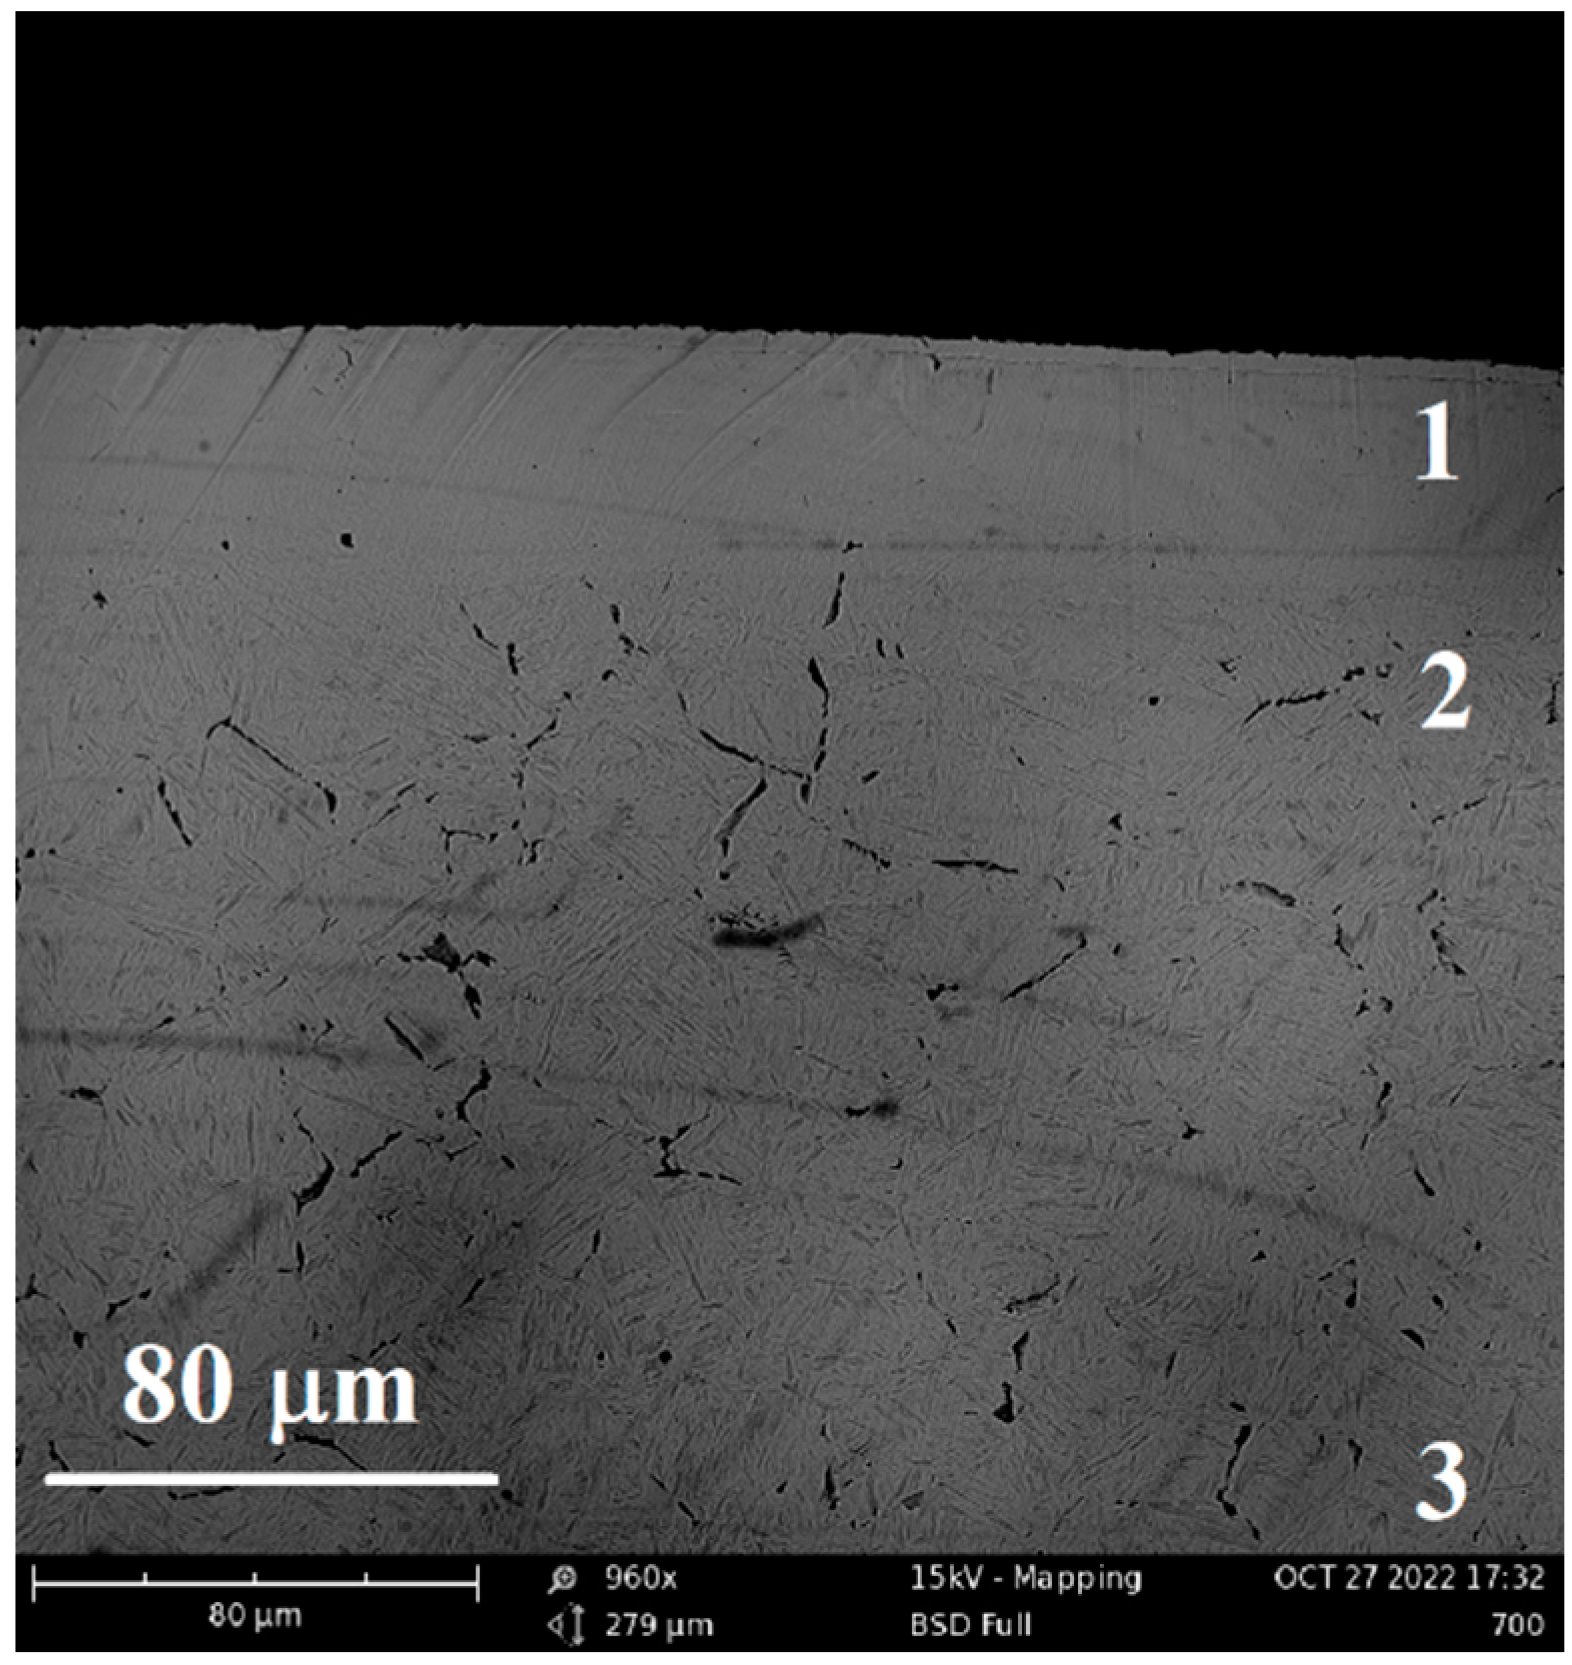
Figure 27.
Microstructure of the steel sample after PENC at 550 °C (ferrite-pearlite structure).
3.6. Phase Composition of the Nitrocarburized Surface
According to the data of X-ray diffraction analysis, the surface layer of samples after PENC consists mainly of iron oxides Fe3O4, Fe2O3 and FeO (Figure 28, Figure 29, Figure 30, Figure 31 and Figure 32). The presence of these oxides is typical for this type of processing [5,11,16,17,18]. It has been shown that, with an increase in the PENC temperature, the relative amount of oxide Fe3O4 decreases, while FeO increases. Iron nitrides were found in all samples. After PENC at 700 ºС, a significant amount of iron carbonitrides of the ε–Fex[NC] type is observed in the structure of the samples.
Figure 28.
X-ray diffraction pattern of the steel sample after PENC at 600 °C.
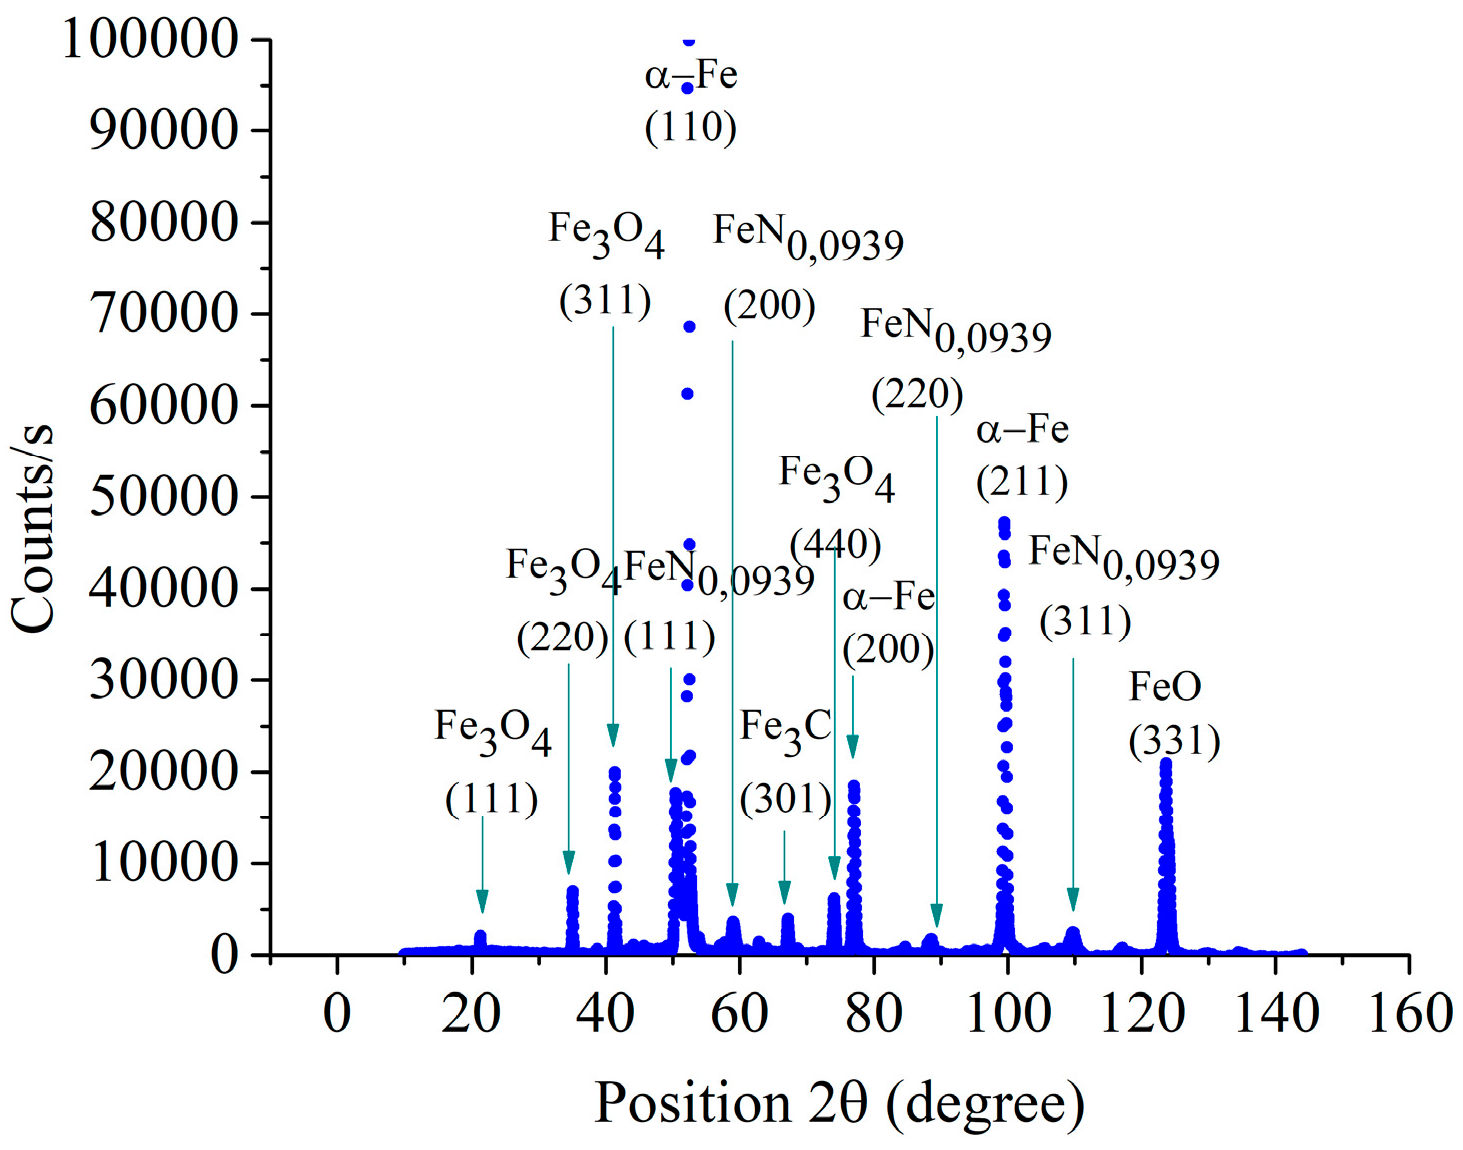
Figure 29.
X-ray diffraction pattern of the steel sample after PENC at 650 °C.
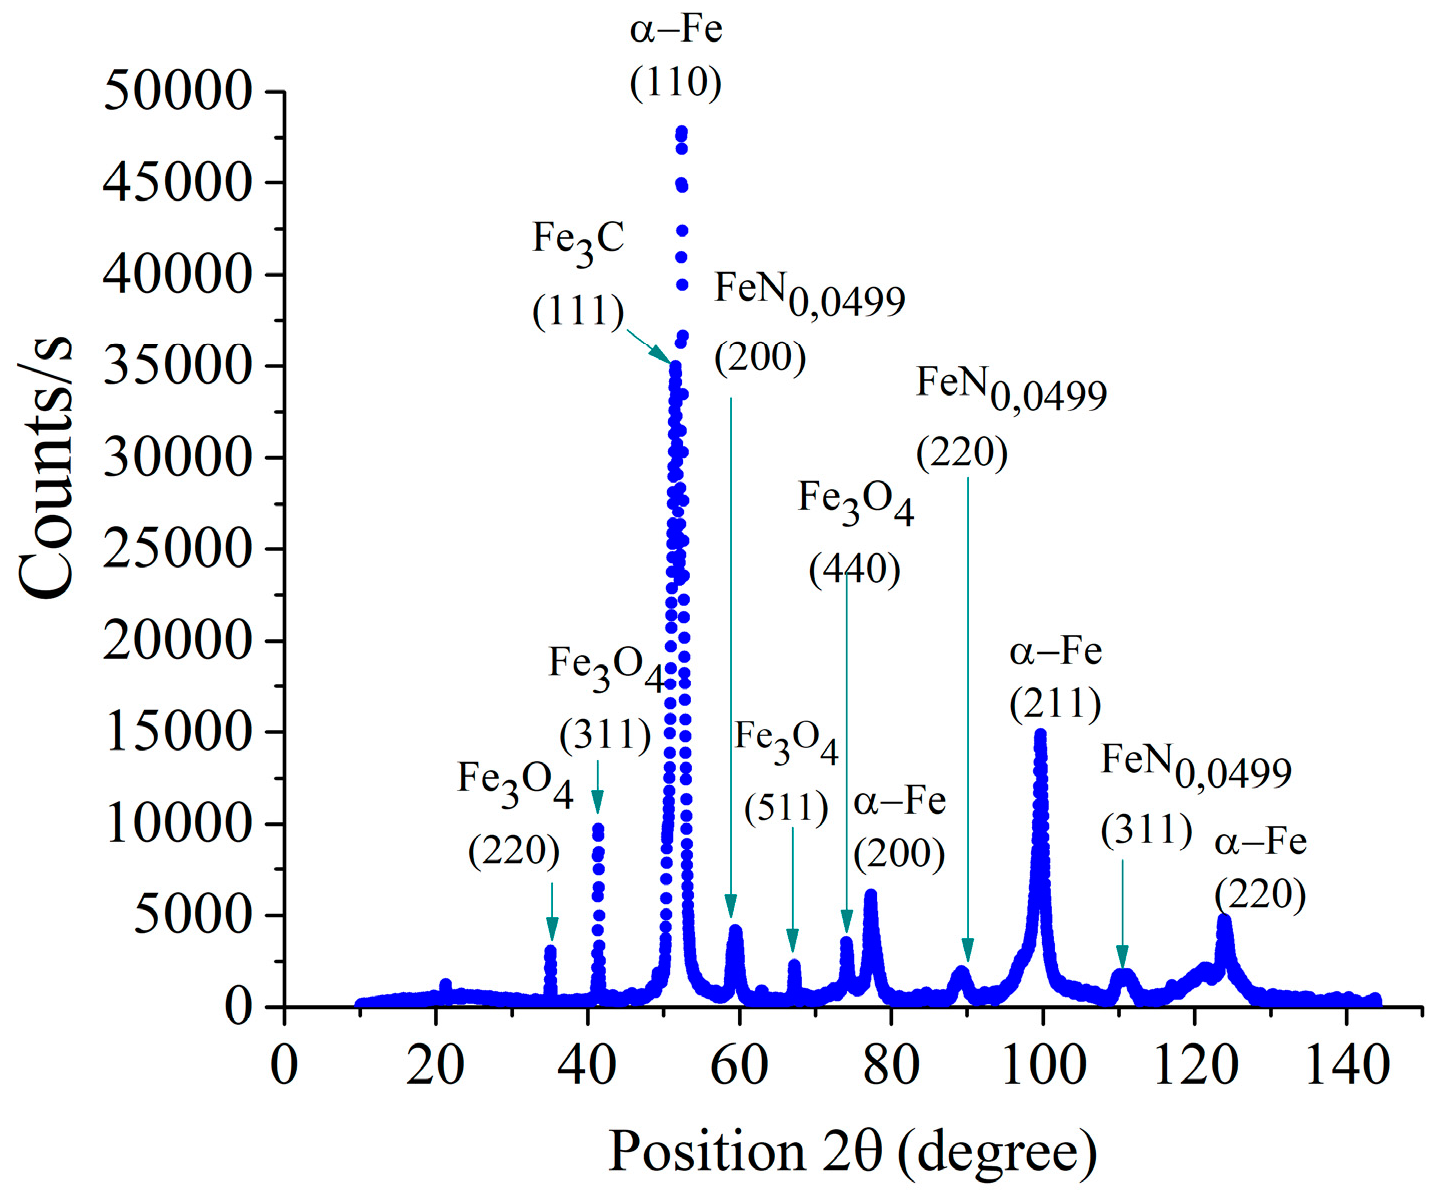
Figure 30.
X-ray diffraction pattern of the steel sample after PENC at 700 °C.
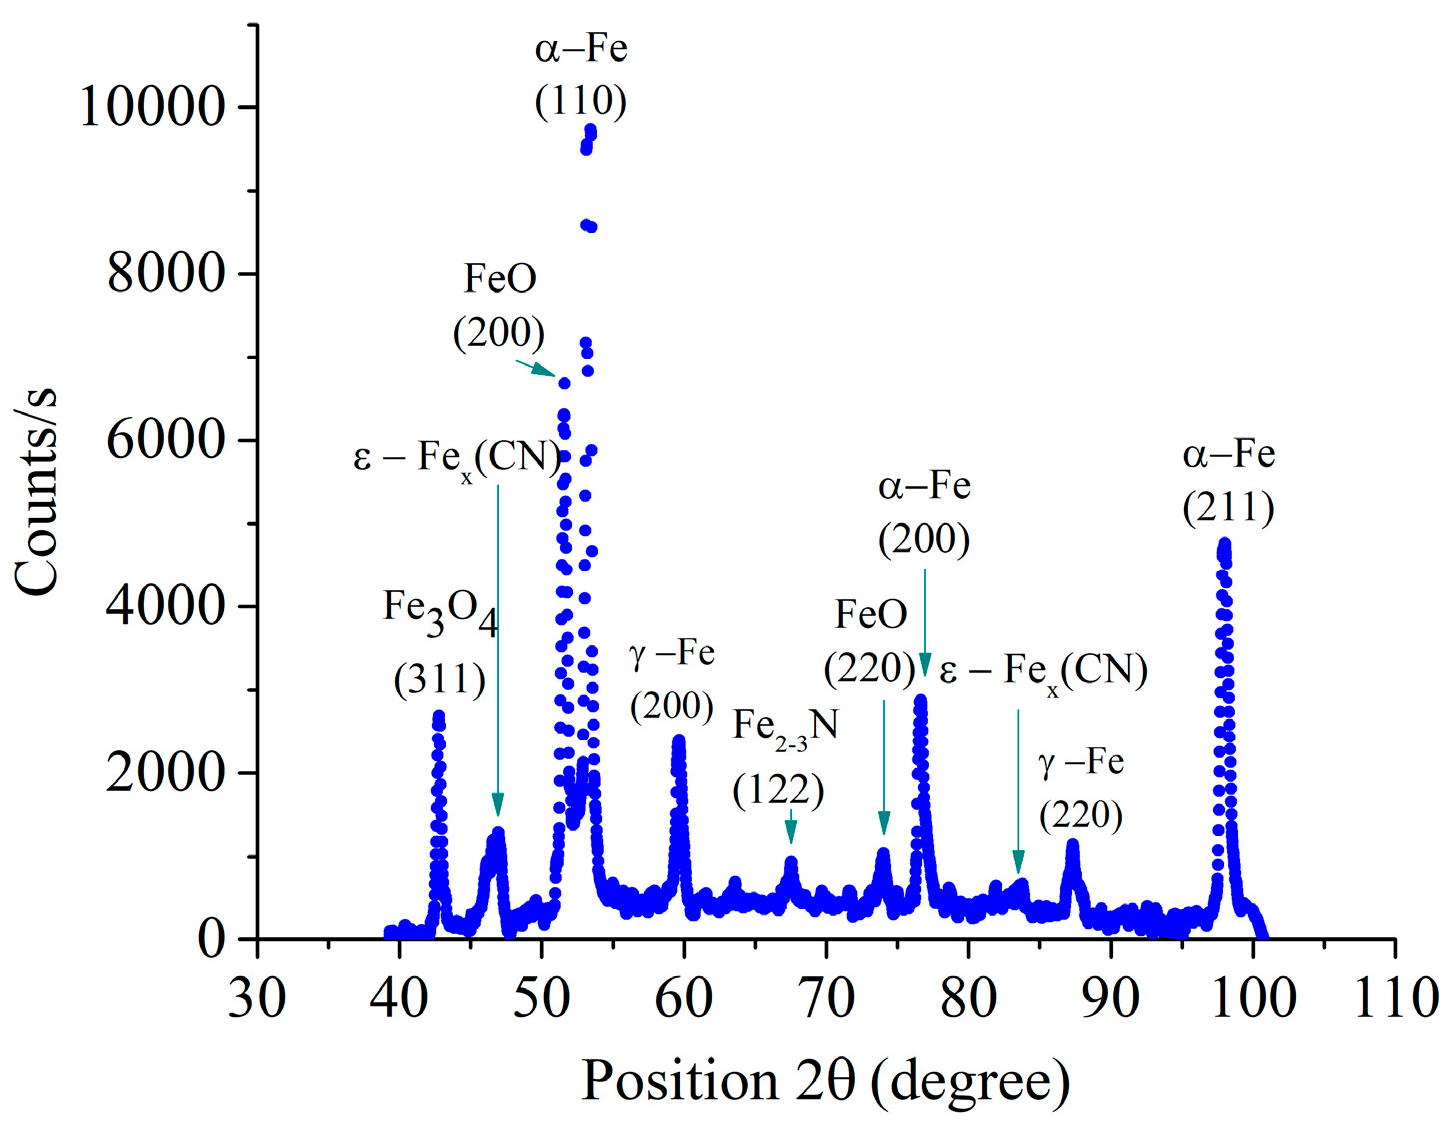
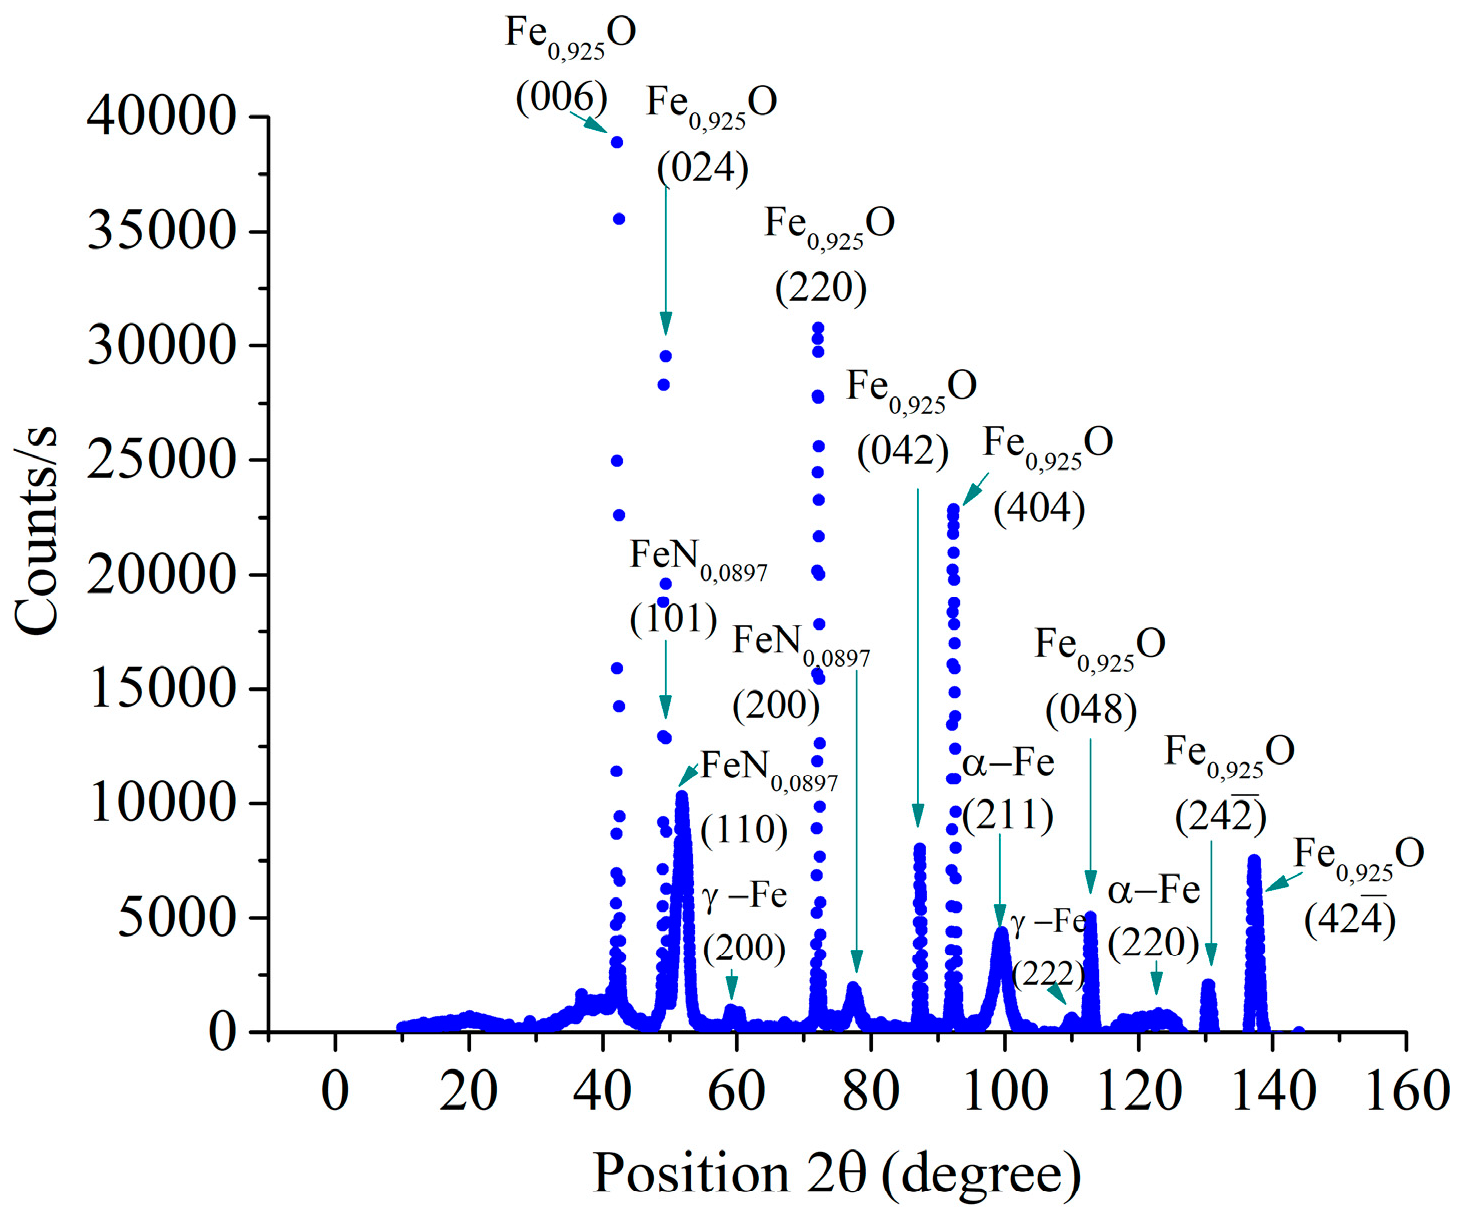
Figure 31.
X-ray diffraction pattern of the steel sample after PENC at 800 °C.
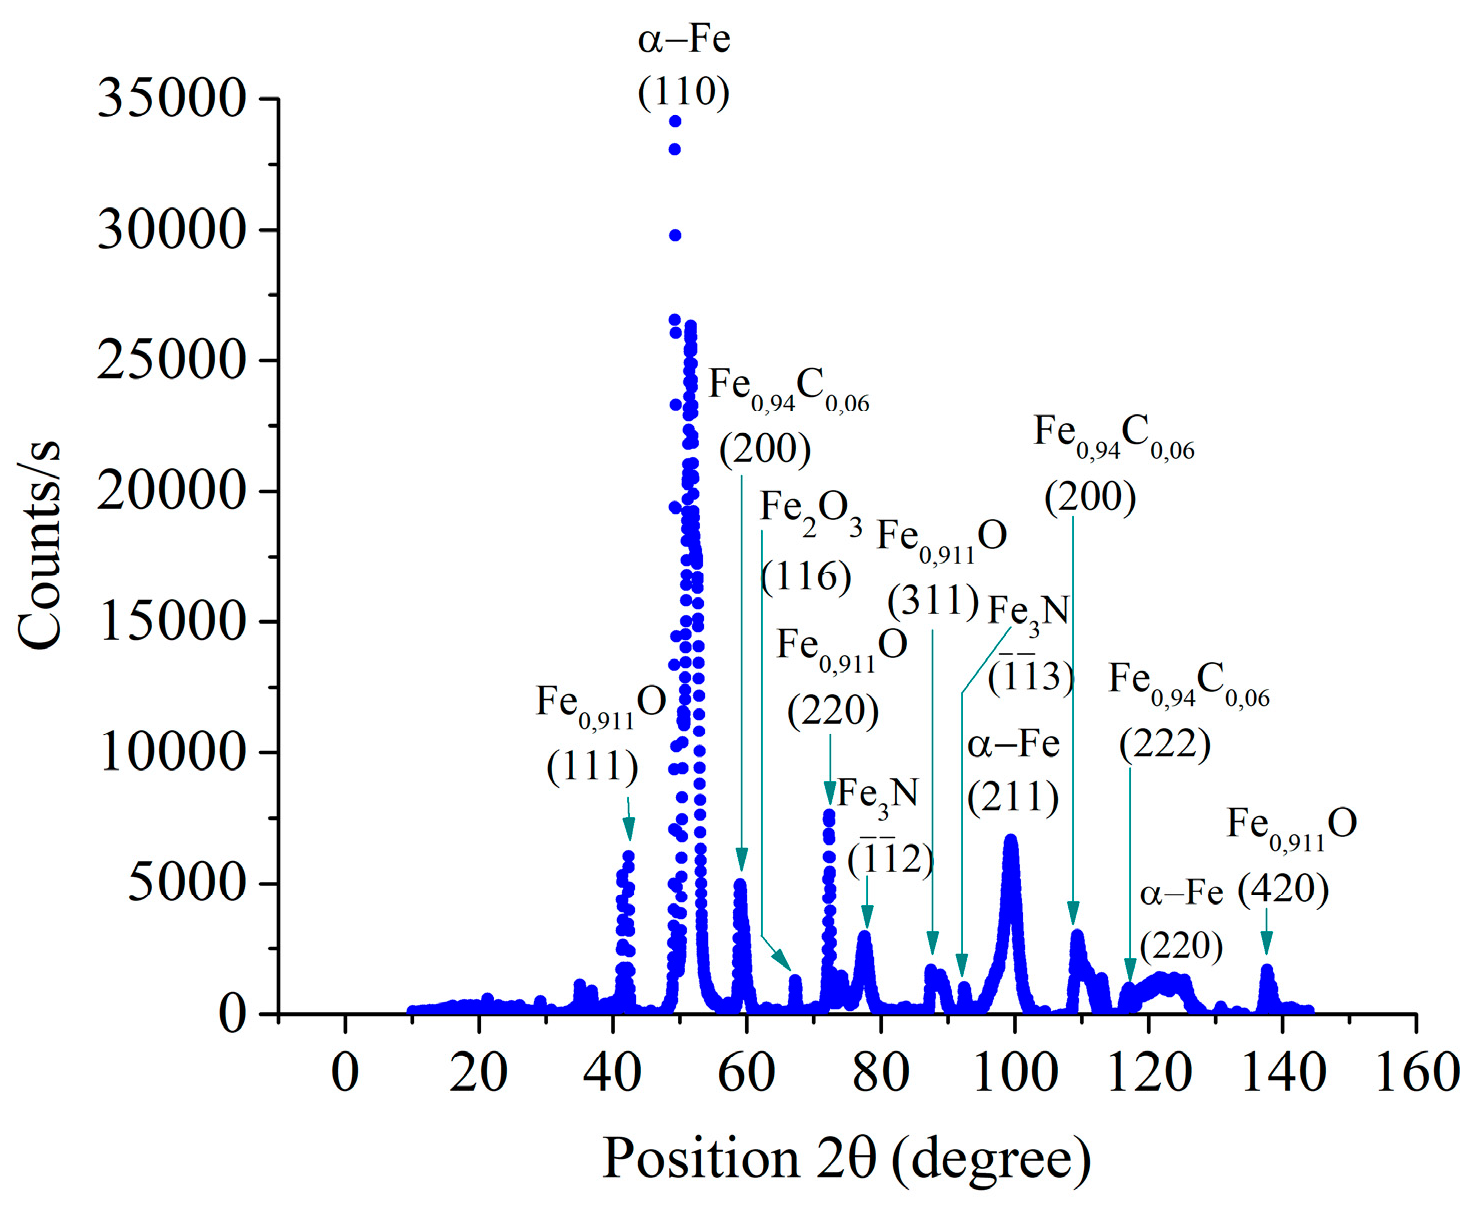
Figure 32.
X-ray diffraction pattern of the steel sample after PENC at 850 °C.
4. Discussion
An analysis of the structure and phase composition of the samples after PENC explains the change in the wear resistance and friction coefficients with an increase in the friction path traveled. On the first kilometer of tribological tests, friction is carried out on the outer layer of oxides. Oxides on the surface during friction act as a lubricant, so the friction coefficients and weight wear for samples after PENC at all temperature are reduced. At the second and third kilometers of testing, friction occurs along a layer enriched with residual austenite. Residual austenite degrades the wear resistance of the nitrocarburized layer. Therefore, at the second and third kilometers of the friction path, the friction coefficients increase along with weight wear in comparison with the first kilometer of the test. The best results are achieved by the end of the fifth kilometer of testing. In the last section of the test, friction occurs along a hardened zone containing finely acicular nitrogenous martensite with dispersed iron nitrides. The hardened zone for samples after PENC at temperatures from 700 to 850 °C is characterized by the maximum values of microhardness achieved in the experiment. The high hardness of the hardened zone, together with the influence of dispersed iron nitrides and carbonitrides distributed in it, ensures minimum friction coefficients and weight losses both from the side of the sample and from the side of the counterbody at the fourth and fifth kilometers of the test.
The best results were shown by the sample after PENC at a temperature of 700 °C for all kilometers of tribological tests. Only samples that have been treated at this temperature reveal the presence in the structure, in addition to iron nitrides, of carbonitrides. The presence of iron carbonitrides additionally increases the antifriction properties of the modified layer. On the one hand, PENC at 700 °C makes it possible to obtain a high microhardness of the surface for effective abrasion resistance. On the other hand, the microhardness is lower than that of the samples after PENC at temperatures in the range of 750-850 °C, does not lead to smearing of copper from the counterbody onto the surface of the sample, as, for example, in Figure 23. Thus, high microhardness without copper sticking in the zone frictional contact and iron nitrides and carbonitrides distributed over the modified layer together make a significant positive effect on the tribotechnical characteristics of the mating of the bronze counterbody and the steel sample after PENC at a temperature of 700 °C.
5. Conclusions
(a) It is shown that PENC of medium carbon steel in a carbamide-based electrolyte solution at temperatures from 550 to 850 °C reduces the friction coefficient in pair with bronze, and the weight loss of both the sample and the bronze counterbody. PENC of the steel surface provides an increase in the contact stiffness and wear resistance of the steel-bronze friction pair.
(b) The friction coefficient and weight loss of the sample and counterbody decrease as the friction path increases. The minimum values of the friction coefficient for the entire time of testing are recorded at the end of the fifth kilometer of the friction path. The smallest weight loss of both the sample after PENC and the bronze counterbody working with it in pairs is also achieved at the fifth kilometer of testing.
(c) The change in the tribological characteristics of the mating with increasing friction path is explained by the structure and phase composition of gradually abraded layers. The high hardness of the hardened zone, together with the influence of dispersed iron nitrides and carbonitrides distributed in it, ensures minimum friction coefficients and weight losses both from the side of the sample and from the side of the counterbody at the fourth and fifth kilometers of the test.
(d) It is found that in the friction tests carried out, the type of wear is fatigue in dry friction and plastic contact.
(e) The optimal PENC mode has been established, which provides the minimum values of both the friction coefficient and weight loss of the sample and the counterbody at any test kilometer. PENC at a temperature of 700 °C makes it possible to obtain a friction coefficient of 0.261 by the end of 5 km of testing, which is 2.3 times less than the control untreated sample. The weight loss of the sample after PENC at a temperature of 700 °C for the fourth and fifth kilometers of the test is 24.9 times less than that of the control. Over the last 2 km of the test, the counterbody loses 5.9 times less weight in comparison with the control pair. The contact stiffness after PENC at 700°C is 2.6 times greater than in a friction pair with an untreated sample. The optimal tribotechnical characteristics of the sample after PENC at a temperature of 700°C are explained by the high microhardness of the surface without copper sticking in the friction contact zone and by the iron nitrides and carbonitrides distributed over the modified layer.
Author Contributions
Conceptualization, A.B. and T.M.; methodology, T.M., I.S. and S.K.; validation, A.B., I.S. and S.G.; formal analysis, S.G.; investigation, T.M. and Ya.M.; resources, S.G.; writing—original draft preparation, T.M. and S.K.; writing—review and editing, A.B. and I.S.; visualization, T.M. and Ya.M.; supervision, A.B.; project administration, I.S.; funding acquisition, S.G. All authors have read and agreed to the published version of the manuscript.
Funding
This work is funding by the state assignment of the Ministry of Science and Higher Education of the Russian Federation, Project No. FSFS-2023-0003. The study was carried out on the equipment of the Center of collective use of MSUT “STANKIN” supported by the Ministry of Higher Education of Russian Federation.
Institutional Review Board Statement
Not applicable.
Informed Consent Statement
Not applicable.
Data Availability Statement
Not applicable.
Conflicts of Interest
The authors declare no conflict of interest.
References
- Shugurov, A.R.; Kuzminov, E.D.; Garanin, Yu.A. Structure and Mechanical Properties of Ti-Al-Ta-N Coatings Deposited by Direct Current and Middle-Frequency Magnetron Sputtering. Metals 2023, 13, 512. [Google Scholar] [CrossRef]
- Shugurov, A.R.; Kuzminov, E.D. Mechanical and tribological properties of Ti-Al-Ta-N/TiAl and Ti-Al-Ta-N/Ta multilayer coatings deposited by DC magnetron sputtering. Surf. Coat. Technol. 2022, 441, 128582. [Google Scholar] [CrossRef]
- Mora-Sanchez, H.; Pixner, F.; Buzolin, R.; Mohedano, M.; Arrabal, R.; Warchomicka, F.; Matykina, E. Combination of Electron Beam Surface Structuring and Plasma Electrolytic Oxidation for Advanced Surface Modification of Ti6Al4V Alloy. Coatings 2022, 12, 1573. [Google Scholar] [CrossRef]
- Perez, H.; Vargas, G.; Magdaleno, C.; Silva, R. Article: Oxy-Nitriding AISI 304 Stainless Steel by Plasma Electrolytic Surface Saturation to Increase Wear Resistance. Metals 2023, 13, 309. [Google Scholar] [CrossRef]
- Marcuz, N.; Ribeiro, R.P.; Rangel, E.C.; Cristino da Cruz, N.; Correa, D.R.N. The Effect of PEO Treatment in a Ta-Rich Electrolyte on the Surface and Corrosion Properties of Low-Carbon Steel for Potential Use as a Biomedical Material. Metals 2023, 13, 520. [Google Scholar] [CrossRef]
- Belkin, P.N.; Kusmanov, S.A.; Zhirov, A.V.; Belkin, V.S.; Parfenyuk, V.I. Anode Plasma Electrolytic Saturation of Titanium Alloys with Nitrogen and Oxygen. J. Mat. Sci. Tech. 2016, 32, 1027–1032. [Google Scholar] [CrossRef]
- Belkin, P.N.; Kusmanov, S.A. Plasma electrolytic nitriding of steels. J. Surf. Investig. X-ray Synchrotron Neutron Tech. 2017, 11, 767–789. [Google Scholar] [CrossRef]
- Kuzin, V.V.; Grigor’ev, S.N.; Volosova, M.A. Effect of a TiC Coating on the Stress-Strain State of a Plate of a High-Density Nitride Ceramic Under Nonsteady Thermoelastic Conditions. Refract. Ind. Ceram. 2014, 54, 376–380. [Google Scholar] [CrossRef]
- Vereschaka, A.; Tabakov, V.; Grigoriev, S.; Sitnikov, N.; Milovich, F.; Andreev, N.; Bublikov, J. Investigation of wear mechanisms for the rake face of a cutting tool with a multilayer composite nanostructured Cr–CrN-(Ti,Cr,Al,Si)N coating in high-speed steel turning. Wear 2019, 438-439, 203069. [Google Scholar] [CrossRef]
- Grigoriev, S.; Vereschaka, A.; Milovich, F.; Tabakov, V.; Sitnikov, N.; Andreev, N.; Sviridova, T. Bublikov, J. Investigation of multicomponent nanolayer coatings based on nitrides of Cr, Mo, Zr, Nb, and Al. Surf. Coat. Technol. 2020, 401, 126258. [Google Scholar] [CrossRef]
- Volosova, M.; Grigoriev, S.; Metel, A.; Shein, A. The Role of Thin-Film Vacuum-Plasma Coatings and Their Influence on the Efficiency of Ceramic Cutting Inserts. Coatings 2018, 8, 287. [Google Scholar] [CrossRef]
- Grigoriev, S.N.; Volosova, M.A.; Vereschaka, A.A.; Sitnikov, N.N.; Milovich, F.; Bublikov, J.I.; Fyodorov, S.V.; Seleznev, A.E. Properties of (Cr,Al,Si)N-(DLC-Si) composite coatings deposited on a cutting ceramic substrate. Ceram. Int. 2020, 46, 18241–18255. [Google Scholar] [CrossRef]
- Apelfeld, A.; Borisov, A.; Dyakov, I.; Grigoriev, S.; Krit, B.; Kusmanov, S.; Silkin, S.; Suminov, I.; Tambovskiy, I. Enhancement of Medium-Carbon Steel Corrosion and Wear Resistance by Plasma Electrolytic Nitriding and Polishing. Metals 2021, 11, 1599. [Google Scholar] [CrossRef]
- Grigoriev, S.; Peretyagin, N.; Apelfeld, A.; Smirnov, A.; Morozov, A.; Torskaya, E.; Volosova, M.; Yanushevich, O.; Yarygin, N.; Krikheli, N.; Peretyagin, P. Investigation of Tribological Characteristics of PEO Coatings Formed on Ti6Al4V Titanium Alloy in Electrolytes with Graphene Oxide Additives. Materials 2023, 16, 3928. [Google Scholar] [CrossRef]
- Kusmanov, S.A.; Dyakov, I.G.; Belkin, P.N.; Gracheva, I.A.; Belkin, V.S. Plasma electrolytic modification of the VT1-0 titanium alloy surface. J. Surf. Investig. X-ray Synchrotron Neutron Tech. 2015, 9, 98–104. [Google Scholar] [CrossRef]
- Belkin, P.N.; Borisov, A.M.; Kusmanov, S.A. Plasma Electrolytic Saturation of Titanium and Its Alloys with Light Elements. J. Surf. Investig. X-ray Synchrotron Neutron Tech. 2016, 10, 516–535. [Google Scholar] [CrossRef]
- Kusmanov, S.A.; Tambovskii, I.V.; Korableva, S.S.; Mukhacheva, T.L.; D’yakonova, A.D.; Nikiforov, R.V.; Naumov, A.R. Wear resistance increase in Ti6Al4V titanium alloy using a cathodic plasma electrolytic nitriding. Surf. Eng. Appl. Electrochem. 2022, 58(5), 451–455. [Google Scholar] [CrossRef]
- Mukhacheva, T.; Kusmanov, S.; Suminov, I.; Podrabinnik, P.; Khmyrov, R.; Grigoriev, S. Increasing Wear Resistance of Low-Carbon Steel by Anodic Plasma Electrolytic Sulfiding. Metals 2022, 12, 1641. [Google Scholar] [CrossRef]
- Kusmanov, S.A.; Kusmanova, Y.V.; Smirnov, A.A.; Belkin, P.N. Modification of steel surface by plasma electrolytic saturation with nitrogen and carbon. Mater. Chem. Phys. 2016, 175, 164–171. [Google Scholar] [CrossRef]
- Tambovskiy, I.; Mukhacheva, T.; Gorokhov, I.; Suminov, I.; Silkin, S.; Dyakov, I.; Kusmanov, S.; Grigoriev, S. Features of Cathodic Plasma Electrolytic Nitrocarburizing of Low-Carbon Steel in an Aqueous Electrolyte of Ammonium Nitrate and Glycerin. Metals 2022, 12, 1773. [Google Scholar] [CrossRef]
- Shelekhov, E.V.; Sviridova, T.A. Programs for X-ray analysis of polycrystals. Metal Sci. Heat Treat. 2000, 42, 309–313. [Google Scholar] [CrossRef]
- Grazulis, S.; Chateigner, D.; Downs, R.T.; Yokochi, A.T.; Le Bail, A. Crystallography open database—An open-access collection of crystal structures. J. Appl. Cryst. 2009, 42, 726–729. [Google Scholar] [CrossRef] [PubMed]
- Kragelsky, I.V.; Dobychin, M.N.; Kombalov, V.S. Friction and Wear Calculation Methods; Pergamon Press Ltd.: Oxford, UK, 1982; Available online: https://books.google.ru/books?id=QLcgBQAAQBAJ&hl=ru (accessed on 24 May 2023).
- Demkin, N.B.; Izmailov, V.V. Surface topography and properties frictional contacts. Trib. Int. 1991, 24, 21–24. [Google Scholar] [CrossRef]
- National standard of the Russian Federation. Geometrical Product Specifications (GPS). Moscow, Standartinform, 2015. http://docs.cntd.ru/document/1200116337.
- Mukhacheva, T.L.; Belkin, P.N.; Dyakov, I.G.; Kusmanov, S.A. Wear mechanism of medium carbon steel after its plasma electrolytic nitrocarburising. Wear 2020, 462–463, 203516. [Google Scholar] [CrossRef]
- Matlin, M.M.; Kazankina, E.M.; Kazankin, V.A. Calculation of the actual contact area between a single microasperity and the smooth surface of a part when the hardnesses of their materials are similar. J. Frict. Wear 2011, 32, 140. [Google Scholar] [CrossRef]
- I.V. Kragelsky, N.М. Mihin, Friction units of machines: Reference, Engineering manufacture, Moscow, 1984.
- Du, E.H., Van Voorthuysen Marchie, Boerma, D.O., Chechenin, N.C. Low-temperature extension of the Lehrer diagram and the iron-nitrogen phase diagram. Metallurgical and Materials Transactions. A. 2002. V. 33A.
Disclaimer/Publisher’s Note: The statements, opinions and data contained in all publications are solely those of the individual author(s) and contributor(s) and not of MDPI and/or the editor(s). MDPI and/or the editor(s) disclaim responsibility for any injury to people or property resulting from any ideas, methods, instructions or products referred to in the content. |
© 2023 by the authors. Licensee MDPI, Basel, Switzerland. This article is an open access article distributed under the terms and conditions of the Creative Commons Attribution (CC BY) license (http://creativecommons.org/licenses/by/4.0/).
Copyright: This open access article is published under a Creative Commons CC BY 4.0 license, which permit the free download, distribution, and reuse, provided that the author and preprint are cited in any reuse.


