
Submitted:
22 July 2023
Posted:
25 July 2023
You are already at the latest version
Abstract
The influence of diet and nutritional status of milk donors on the nutritional composition of donor human milk (DHM) is unknown. The present study aimed to determine the nutritional profile of DHM and the associations of donors’ dietary intake and nutritional status with micronutrient and lipid composition in DHM. For this purpose, 113 donors completed a food frequency questionnaire, provided a 5-day weighed dietary record, and collected milk for 5 consecutive days. Nutrient determinations in donors’ erythrocytes, plasma, urine, and milk were performed. Multiple linear regressions were conducted for the evaluation of the associations. We highlight the following results: DHM docosahexaenoic acid (DHA) was positively associated with donors’ plasma DHA content and donors’ DHA intake (R2 0.45, p < 0.001). For every 1 g/day of DHA intake, the percentage of DHA in DHM increased by 0.38% (% of total fat) and the percentage of total omega-3 in DHM increased by 0.78% (R2 0.29, p < 0.001). DHM saturated fatty acids were positively associated with erythrocyte dimethyl acetals, plasma stearic acid, trans fatty acids intake, and breastfeeding duration, and negatively associated with erythrocyte margaroleic acid (R2 0.34, p < 0.01). DHM cholecalciferol was associated with plasma cholecalciferol levels and dairy intake (R2 0.57, p < 0.01). Other weaker associations were found for free thiamine, free riboflavin, pyridoxal, dehydroascorbic acid, and lipid profile in DHM. In conclusion, the diet and nutritional status of donors influences the fatty acid profile and micronutrient content of DHM.
Keywords:
breast milk
; human milk bank
; associations
; donors
; diet
; nutritional status
; lipid profile
; vitamins
; minerals
; docosahexaenoic acid
1. Introduction
Donor human milk (DHM) is considered the best feeding option for preterm infants when their mother´s own milk is not available. Its use is increasing in neonatal units, primarily for infants at high risk of developing necrotizing enterocolitis or feeding intolerance, such as those weighing <1500 g and/or those at less than 32 weeks of gestational age (GA), infants with congenital heart disease, or those with severe intestinal disorders [1,2,3,4,5]. These infants are in a situation of "nutritional emergency"; therefore, knowledge of the essential nutrients in DHM and research into the factors contributing to its composition should be a priority.
According to studies carried out in different geographical areas of the world, there is evidence that the content of fatty acids (FAs) and some micronutrients in human milk (HM) depends on the maternal deposits of each nutrient at the end of gestation and maternal intake during the lactation period [6,7,8,9]. However, most studies have assessed the FA profile while information on micronutrients is much more limited.
In this respect, micronutrients can be classified in a simplified way into two groups with respect to their secretion patterns in milk in relation to maternal intake and maternal status and the response to supplementation. In general, water-soluble vitamins (except folate), fat-soluble vitamins, iodine, and selenium are considered to belong to a group of micronutrients for which their secretion into HM is dependent on maternal intake or status, and maternal supplementation may increase their concentrations in milk [8,9,10,11]. Accordingly, priority nutrients for breastfeeding women include thiamine, riboflavin, vitamins B6, B12, vitamin A, and iodine [12]. The behavior of vitamin E is somewhat different, as neither plasma or serum concentrations nor the maternal intake of vitamin E by ingesting the usual diet affects the vitamin E concentration in HM, although studies have shown increased levels of alpha-tocopherol in colostrum in situations of supplementation [7,13]. On the other hand, the concentration in the HM of folate and other minerals and trace elements remains relatively unaffected by maternal intake or status, although the mother may become depleted when her nutrient intake is lower than necessary; maternal supplementation with the nutrients of this second group is particularly beneficial for the mother rather than for her infant [8,9,10,11,12]. Nevertheless, the results of the different surveys on this topic were not always concordant [7], and the authors of two systematic reviews on this topic [8,9] highlighted the small sample size and the large heterogeneity of the studies.
In addition, women's diets vary over time and according to the country in which they live and their cultural environment [14,15,16,17]. For this reason, it is essential to have updated references in each country on the nutrients in HM.
Moreover, HM is a very complex and dynamic fluid, and its nutritional composition depends not only on maternal or infant factors but also on the chronobiology of HM (i.e., it varies with the stage of lactation, the time of day, the length of time elapsed between feedings, the time within the feeding, and the circadian rhythm) [7,18,19,20,21]. All these factors can act as confounders when studying changes in HM content in relation to diet or maternal nutritional status, which interferes with the interpretation of the data.
Furthermore, the findings in breast milk should not be extrapolated to DHM [22]. Firstly, HM donors constitute a particular population for several reasons. Milk donors comprise a heterogeneous population of breastfeeding mothers in terms of the duration of pregnancy and stage of lactation. Studies carried out in Spain and other countries showed how the sociodemographic characteristics of donor women differ from that of the general population [23]. Also, in addition to breastfeeding their own child, donors express surplus milk for donation, which might lead to increased maternal nutritional needs and a different nutritional milk profile. Secondly, DHM is subjected to procedures that may alter its nutritional profile [22]. Therefore, because of the great importance of nutrition in the development of very preterm or critically ill newborns, it is essential to have information on the nutritional composition of the DHM and the factors that may influence it, such as diet, in order to improve our recommendations to donors. However, to our knowledge, the only study in which a dietary assessment of milk donors was performed is a randomized controlled trial of docosahexaenoic acid (DHA) supplementation in human milk donors conducted in the United States [24].
Hence, the aim of this study is to determine not only the composition of raw DHM but also the associations of dietary intake and nutrient status with micronutrient and lipid composition in the breast milk of a population of donors from a human milk bank in Madrid, Spain.
2. Materials and Methods
2.1. Study Design and Subjects
This is part of a cross-sectional observational study conducted at the Regional Human Milk Bank Aladina MGU (RHMB) at the “12 de Octubre” University Hospital in Madrid, Spain.
One of the main aims of this work was to study the correlations between intake, nutritional status, and human milk nutritional composition of lactating mothers. For this purpose, we recruited 3 groups of women: a) milk donors who donated milk to the RHMB at least once in the last 2 months, b) healthy vegetarian/vegan lactating mothers with a milk expression routine who were lactating 3 weeks or more postpartum, and c) mothers of very preterm and/or very low-birth weight infants—i.e., babies < 32 weeks gestational age and/or < 1500g—who were admitted to the neonatal unit of the “12 de Octubre” University Hospital at the time of the study and more than 3 weeks had elapsed after birth.
It was calculated that a sample of 115 participants (85 milk donors, 15 healthy lactating women on a vegetarian/vegan diet, and 15 mothers of preterm infants admitted to the neonatal unit) would guarantee estimates with sufficient precision for the models of the global study, in which 10 predictors of interest were included, the need of at least 10 cases per predictor was assumed, and an additional 5% was considered for possible losses.
Participants were recruited between August 2017 and February 2020. In the present manuscript, we report the data and results of the group of milk donors.
The study procedure was endorsed by the “12 de Octubre” University Hospital Clinical Research Ethics Committee (protocol code 15/269) and all participants provided written informed consent, which could be withdrawn at any time. Furthermore, the study was conducted in accordance with the Declaration of Helsinki.
2.2. Protocol Study
To date, two articles based on this project have been published, and they include further results, with one focusing on the study of iodine in the DHM [25] and the other focusing on the comparison of the results of milk donors with those of vegetarian/vegan lactating women [26]. Thus, the full study protocol and laboratory studies have been previously described in detail [25,26].
Figure 1 shows the study’s protocol.
In summary, the study of participating donors comprised a health and socio-demographic survey; somatometric measurements; blood and urine determinations to study their nutritional status; a dietary study comprising a food frequency questionnaire (FFQ) and a 5-day weighed dietary record, taking into account the intake of pharmacological nutrient supplements; and a detailed study of the nutritional composition of their milk.
Within the following 15 days after blood and urine sample collection for assessment of baseline nutritional status, the 5-day dietary recording and the collection of the 5-day milk samples were carried out almost concomitantly for 6 days in a row, with milk collection starting 1 day after the start of the dietary recording and ending 1 day after the end of the dietary recording. As the purpose was to reproduce the conditions of the donors’ routine in terms of daily milk pumping, participants were asked not to change their expression routine, no request was made for a time schedule, and the same transparent glass containers were used as for donations. Milk could be expressed from one or both breasts, with the only requirement being a complete emptying of the breast. A 25 ml milk sample from each expression from days 2 to 5, which was collected in a transparent bottle under sterile conditions, and the complete milk extraction from the last day (day 6) without handling, were frozen at −20 °C at the donors' home. The only exception was the 3 donors with premature babies admitted to the neonatal unit, and they carried out an instance of 24-hour milk collection, taking an aliquot from each milk extraction from days 2 to 5. On day 6, they collected and froze one complete milk extraction in the same way as the other participants. Donors were requested to bring their dietary records and milk samples to the RHMB within the following 15 days after the study’s completion. Different milk samples of the same day were mixed and aliquoted at the RHMB, but the milk of different days was not mixed as the composition of the milk on each day was analyzed individually. After processing at the RHMB, plasma, erythrocytes, urine, and milk samples were frozen at −80 °C until analysis. The milk samples collected from days 2 to 5 were used for the study of vitamins and minerals, and the complete milk collection sample from day 6 was used for the integral characterization of the lipid fraction.
The data on the intake of food, beverages, and pharmacological nutrient supplements obtained from the 5-day dietary record were analyzed using DIAL® software (DIAL.EXE Version 3, February 2014, Alce Ingeniería, Madrid, Spain) to calculate the daily energy and nutrient intake [27].
2.3. Nutrients Analysis
A full description of the analyses carried out for each of the nutrients is available in a previous paper, as mentioned above [26]. The techniques used for the most important nutrients for this study are outlined below.
2.3.1. Fatty Acids Analysis
Lipid analyses were conducted by the Food Lipid Biomarkers and Health Group at the Institute of Food Science Research (CIAL, CSIC-UAM).
Fatty acid methyl esters (FAMEs) were directly prepared from the plasma and erythrocyte samples, without prior lipid extraction. However, in the case of the milk samples, previously obtained lipid extracts were used. Two independent derivatization processes were carried out for each sample following the direct acid–base methylation method. FAMEs analysis was performed by GC-MS using an Agilent 6890 series gas chromatograph, which was coupled to an Agilent 5973 series mass spectrometer (Agilent Technologies Inc., Palo Alto, CA, USA).
The lipid class profile, such as the distribution of neutral and polar lipids, the relative composition of phospholipids, and the molecular species of triacylglycerols, were determined in the milk samples from a randomly selected subgroup of 20 donors. After fat extraction from human milk samples, the separation and quantification of lipid classes was accomplished by using an HPLC evaporative light-scattering detector (ELSD), and the determination of TAG molecular species was carried out using GC-FID.
2.3.2. Vitamins and Minerals Analysis
Vitamins and mineral analyses were conducted by the NUTREN-Nutrigenomics Group of the Department of Experimental Medicine at the University of Lleida, Spain.
Water-Soluble Vitamins and Vitamin-B12-Associated Biomarkers
Water-soluble vitamins were studied in plasma, erythrocytes, and milk. Cobalamin was analyzed using a competitive immunoassay method (Ref. 33000, Acces B12 assay, Beckman Coulter, Brea, CA, USA). Plasmatic holotranscobalamin was determined by an immunoassay using an Active-B12 (Holotranscobalamin) ELISA kit (Ref. AX53101, IBL-International Gmbh, Hamburg Germany). The plasmatic homocysteine was determined by an enzymatic assay kit (Ref. 41057, Spinreact, Barcelona Spain). Methylmalonic acid was determined directly in the diluted urine samples by UPLC-MS/MS, following the procedure described by Boutin et al. (2020) [28]. The glutathione reductase activity in erythrocytes was determined by an Abcam ab83461 assay kit (Abcam, Cambridge, UK). Ascorbic acid was determined by HPLC-DAD. The rest of the analysis for water-soluble vitamins was performed by UPLC–MS/MS.
Fat-Soluble Vitamins
Fat-soluble vitamins were studied in plasma and milk samples. The concentrations of retinol, α-tocopherol, and γ-tocopherol were analyzed by HPLC with a fluorescence and UV detector. Vitamin D metabolites were determined by UPLC electrospray ionization/tandem MS.
Minerals
Minerals were studied in urine and milk by ICP-MS.
2.3.3. Blood Biochemistry, Hemoglobin, and Urine Creatinine
Blood biochemistry was determined by the NUTREN-Nutrigenomics Group via enzymatic kinetic colorimetric methods. The total cholesterol, HDL and LDL cholesterol, and triacylglycerols were analysed via enzymatic assays (Refs. 1001090, 1001096, 41023, and 1001310, respectively; Spinreact, Barcelona, Spain). Hemoglobin was determined by the Drabkin colorimetric method following the manufacturer’s instructions from the commercial assay kit (Ref. 1001230, Spinreact, Barcelona, Spain). Urine creatinine was determined via the Jaffé colorimetric kinetic method using a commercial assay kit (Ref. 1001110, Spinreact, Barcelona, Spain).
2.4. Statistics
Statistical analysis was performed with the STATA 14 program.
For descriptive analysis, qualitative variables were reported as absolute and relative frequencies, and quantitative variables were reported as medians and interquartile range (IQR) or as means and standard deviation (SD), according to their distribution established by carrying out the Shapiro-Wilk normality test.
For the multivariate analysis of associations, multiple linear regressions (MLRs) were performed using each of the macro- and micronutrients in DHM as dependent variables; the independent variables were as follows: the clinical characteristics; the level of nutrients in donors’ plasma, erythrocytes, and urine; the results of intake from the FFQ; and the average intake of nutrients recorded by donors in the 5-day dietary record. The independent variables that had significant associations (p<0.05) with milk content in the bivariate analysis were entered into the models. Once the independent variables and their probable interactions were introduced in each of the models, the variables with p > 0.05 were removed, and confounding variables were evaluated until the most parsimonious model was obtained. Each model was diagnosed, and some outliers were removed to improve the fit.
3. Results
3.1. Population Studied
From 146 women recruited into the general study, 114 were milk donors: 109 were omnivores (93 with full-term infants and 16 with preterm infants that were not hospitalized), 2 were ovo-lactovegetarians (1 with a preterm infant of 36+4 weeks of gestational age and the other with a full-term infant), and 3 were mothers of preterm infants < 32 weeks gestational age and/or < 1500g birthweight admitted to the neonatal unit. One of the omnivore donors with full-term infants left the study early; thus, complete data were obtained from 113 donor women.
Table 1, Table 2, Table 3 and Table 4 show the results of the socio-demographic and health survey, including the characteristics of the donors’ breastfed infant and breastfeeding habits.
The median age of donors was 35.6 years, with a median body mass index (BMI) of 22.9 kg/m2, similarly to their pre-pregnancy BMI (22.1 kg/m2). BMI at the time of the study was classified as normal for 71% of the sample (Table 1). In terms of dietary habits, 28% reported having changed eating habits in the last two years, one third of which restricted dairy intake and one third restricted meat intake. There were 18 donors with some type of food restriction: dairy (n = 6), fish (n = 3), meat (n = 3), eggs (n = 2), nuts (n = 1), and others (n = 3). In total, 87 of the 109 donors who specified the type of salt consumed (79.8%) reported taking iodized salt.
Fifty-five percent of donors reported having no previous children. Four donors had a twin pregnancy, two of whom lost a fetus (one ovo-lactovegetarian donor with a term infant and one omnivore donor with a preterm infant of 24+4 weeks of gestational age) and one lost one of her twins at 27+0 weeks of gestational age during the 1st week of life. Another donor had one stillbirth at 22+6 weeks of gestational age 2 months ago (Table 2).
Five percent of donors were breastfeeding more than one child (tandem or twin breastfeeding) at the moment of the study. The median gestational age at birth was 39+4 weeks, and 47% of children were male. At the time of the study, the post-menstrual/corrected age of the infants of the 19 donors with preterm delivery ranged from 30+6 weeks with respect to “post-menstrual age” (in the case of the stillbirth at 22+6 weeks of gestational age) to 17.5 months with respect to corrected age. Seventy-two percent of mothers employed simple electrical breast pumps for their infants or donation (Table 3 and Table 4).
Regarding nutrient supplementation, 112 of 113 donors (99.1%) reported consuming pharmacological supplements during pregnancy, and 102 of 113 donors (90.3%) reported consuming pharmacological supplements during lactation. Most participants took supplements of vitamin B12, folic acid, and iodine during pregnancy. The number of donors who took supplements of each nutrient, both during gestation and lactation, and the median daily dose that they consumed are available in Table S1 in the supplementary material.
3.2. Diet Survey and Nutritional Status
The results of the 5-day dietary record, the FFQ, and the analysis of nutrients in the erythrocytes, plasma, and urine of the donors for the assessment of their nutritional status are displayed as supplementary data (Tables S2–S7). References [26,28,31,32,33,34,35,36,37,38,39,40,41,42,43,44,45,46,47,48,49,50,51,52,53,54,55,56,57,58] are cited in the supplementary Materials.
3.3. Donor Human Milk Composition
Data on the nutritional composition of the DHM are presented in Table 5, Table 6 and Table 7. Table 5 presents the macronutrient composition, the lipid classes’ profile, the relative composition of phospholipids, and the molecular species of triacylglycerols in DHM. Table 6 presents the concentrations of 29 FA, and Table 7 shows the concentrations of 16 micronutrients in DHM.
3.4. Associations between Clinical Characterisitics, Donors’ Daily Nutrient Intake, Their Plasma and Erythrocyte Nutrient Levels, and Nutrient Levels in DHM: Multivariate Analysis
Models in which significant associations were found are described as follows.
3.4.1. Lipid Associations in DHM
Levels of fatty acids (FA) in DHM are expressed as % of fat (Table 8).
The percentage of total saturated fatty acids (SFAs) in DHM was associated with the donors’ erythrocyte deposits of dimethyl acetals (DMA), plasma C18:0 (stearic acid) levels, erythrocyte levels of C17:1 (margaroleic acid), trans fatty acids (TFA) consumed in the diary record, and breastfeeding time. For each 1% of DMA in erythrocytes, SFA-adjusted levels in DHM increased by 2.7%. In addition, for each 1% increase in plasma C18:0 levels, the SFA-adjusted content in DHM increased by 2%, and for each 0.1% of TFA consumed in the dietary record, the adjusted percentage of SFAs in DHM increased by almost 0.6%. On the other hand, for each 0.1% increase in erythrocyte levels of C17:1, SFA-adjusted levels in DHM decreased by approximately 1.4%. Finally, for each month of breast-feeding duration, the adjusted percentage of SFA in DHM increased by 0.2%.
The amount of monounsaturated fatty acids (MUFAs) in DHM was positively associated with donors’ plasma MUFA levels and erythrocyte levels of C17:1 (margaroleic acid). MUFA-adjusted levels in DHM increased by approximately 0.5% per each 1% of plasma MUFAs and by almost 1.4% for each 0.1% of erythrocyte C17:1 level.
PUFA levels in DHM were weakly associated with average daily donors’ PUFAs intake according to the 5-day dietary record. For each 5 g/day of PUFAs in the daily diet, PUFAs in DHM increased by nearly 0.7%.
A positive association was found between linoleic acid levels in DHM with linoleic acid-adjusted levels in donors’ erythrocytes and the average rations of meat, fish, and eggs in the 5-day dietary record. For every 1% increase in the percentage of linoleic acid in erythrocytes, adjusted levels in DHM increased by 0.6%. Moreover, per the average daily serving of meat, fish, or eggs, the adjusted percentage of linoleic acid in DHM increased by 0.7%. For linolenic acid (C18:3), no significant associations were found between donor levels with respect to plasma or erythrocytes and DHM contents nor with respect to lactation characteristics.
DHA levels in DHM were associated with DHA donors’ plasma levels and the average daily DHA intake according to the 5-day dietary record. For every 1% increase in DHA in donors’ plasma, the percentage of DHA in DHM increased by approximately 0.2%, and for every 1 g/day of DHA intake, the adjusted percentage of DHA in DHM increased by almost 0.4%.
The association between total omega-3 in DHM and donors’ DHA intake was positive and significant. For every 1 gram of DHA per day in the 5-day dietary record, the percentage of omega-3 in DHM increased by 0.8%.
3.4.2. Vitamins, Minerals, and Trace Elements Associations in DHM
Water-Soluble Vitamins (Table 9)
Associations were found between free thiamine levels in DHM and donors’ thiamine plasma levels, daily dairy intake in the 5-day dietary record, and breastfeeding time.
For each 0.1 mcg/L of plasma thiamine, adjusted free thiamine levels in DHM increased by 1.1 mcg/L. On the other hand, for each dairy serving/day during the dietary record, adjusted free thiamine levels in DHM decreased by 2.9 mcg/L, and for every month of lactation, thiamine levels in DHM decreased by 0.5 mcg/L.
Regarding riboflavin, a positive association was found between DHM-free riboflavin and the daily intake of riboflavin in the 5-day dietary record and the fact of receiving vitamin B2 supplementation during lactation. For 1 mg/day of riboflavin intake, the adjusted levels of this vitamin in DHM increased by 21 mcg/L and if donors received riboflavin supplementation during lactation, the adjusted levels in DHM increased by approximately 40 mcg/L.
In relation to pyridoxal levels in DHM, associations were observed with respect to vitamin B6 supplementation during pregnancy and breastfeeding time. If donors received vitamin B6 supplements during lactation, pyridoxal adjusted levels in DHM increased by 11.6 mcg/L, and for each month of breastfeeding, pyridoxal adjusted levels in DHM decreased by 0.8 mcg/L.
No significant associations were found for nicotinamide, pantothenic acid, folic acid, or cobalamin levels in DHM.
There were associations between dehydroascorbic acid in DHM and donors’ plasma ascorbic acid levels, average daily fruit ration in the dietary record, and breastfeeding time. For each average daily serving of fruit ingested in the 5-day dietary record, adjusted dehydroascorbic acid levels in DHM increased by 0.3 mg/dL. Breastfeeding time and plasma ascorbic acid levels were negatively associated with dehydroascorbic acid levels in DHM, but the adjusted levels were too low and not clinically significant.
Fat-Soluble Vitamins (Table 9)
There was a positive association between cholecalciferol levels in DHM, donors’ cholecalciferol plasma levels, and daily dairy intake. For each 10 ng/mL of plasma cholecalciferol, adjusted cholecalciferol levels in DHM increased by 173 pg/mL. According to the 5-day dietary record, for each average daily serving of milk and dairy products, adjusted cholecalciferol levels in DHM increased by 521 pg/mL, equivalent to almost 21 UI/L.
There was a positive association between 25 (OH) D3 in DHM and donors’ 1,25 (OH)2 D3 plasma levels, vitamin D supplementation, and breastfeeding time. For each 10 pg/mL of 1,25 (OH)2 D3 in donors’ plasma, 25 (OH) D3 in DHM increased by 1.6 pg/mL; in addition, if donors received vitamin D supplementation during lactation, 25(OH)D3 in DHM increased by 35.7 pg/mL, and for each month of breast-feeding, 25(OH)D3 in DHM increased by 2.2 pg/mL.
Minerals and Trace Elements
The association found between iodine levels in DHM and iodine supplementation was previously published [25]. No significant associations were found for selenium, calcium or phosphorus levels in DHM.
3.4.3. Macronutrients
No associations were found between total lipid, carbohydrate, and protein content in DHM and donors' clinical characteristics or dietary content of these nutrients.
4. Discussion
This cross-sectional study investigates the associations between lipids and micronutrients in raw DHM and the diet as well as the nutritional status of 113 milk donors from the Regional Human Milk Bank in Madrid, Spain. To the best of our knowledge, this is the first study in which these associations have been evaluated in the context of a human milk bank. For this purpose, donors completed an FFQ, provided a 5-day weighed dietary record, and collected milk for 5 consecutive days. In addition, somatometric measurements and nutrient determinations in donors’ erythrocytes, plasma, urine, and milk were performed.
One of the most important contributions of the present study is the demonstration of the association between donors’ DHA intake and donor’s DHA plasma levels, and the DHA content of the raw DHM. This finding is important because, in a recent study, the DHA levels were significantly lower in DHM than in the mother's own milk for preterm infants born before than 32 weeks of gestation, concluding that DHM provides an insufficient supply of DHA to very preterm infants [77], which comprise an already DHA-deficient population [78]. Our results are in line with the only study that determined the DHA content of DHM in relation to the DHA intake of milk donors. In that randomized controlled trial conducted in Ohio and published in 2013 [24], milk donors supplemented with an algal-derived product providing a DHA dose of 1 g/day had significantly higher DHA content in their milk than baseline samples, and DHA content was more than four times higher than the placebo group after 14 days of supplementation. However, the sample size was very small, and the dietary intake of DHA at baseline was only 23 mg/day. In our observational study, the median donor’s DHA intake was 310 mg/day, and for every 1 g/day of DHA intake, the adjusted percentage of DHA in relation to fat in DHM increased by 0.38%. This increase is rather smaller than that reported by Makrides in 1996 [79] in a randomized clinical study of maternal supplementation with preformed algae-derived DHA at different doses, where the DHA content of breast milk increased by 0.1% (g/100 g of fat) at approximately every 0.1 g DHA intake. In this sense, our approach adds information with respect to the real operating conditions of a milk bank without modifying the dietary and supplementation habits of the donors. Since pasteurization does not significantly affect the DHA content of DHM [80,81], it could be inferred that increasing donors’ DHA intake is a feasible strategy to achieve a higher DHA content in pasteurized DHM. In addition, we found a positive association between DHA intake and the percentage of omega-3 in the DHM. Enhanced donors’ DHA intake can be achieved by both increasing oily fish intake and/or pharmacological supplementation [82]. In our previous study comparing the nutritional milk composition of vegetarian or vegan lactating women vs. omnivore human milk donors, the milk DHA content was one half in the vegetarian/vegan women group in relation to their lower intake of DHA [26]. The availability of DHA supplements from algal oil offers vegetarian or vegan donors the possibility to increase their DHA intake from a plant-based source. On the other hand, we found no association between the content of DHA in DHM and the intake of its precursor, such as ⍺ -linolenic acid. In a previous study, supplementing mothers with flaxseed oil, which is very rich in linolenic acid, did not increase the DHA content of their milk [83]. Thus, with the evidence available at present, it could be deduced that a method for increasing the DHA content of DHM from vegetarian/vegan mothers is the intake of algae-derived DHA supplements.
The association found between PUFA maternal intake and the PUFAs content in DHM was previously reported in the mature breast milk of non-donors during the first month of lactation [84]. However, other correlations found in this study regarding lipid contents had not been identified before. The DHM linoleic acid content increased with its erythrocyte content as well as, interestingly, the combined intake of meat, fish, and eggs. The proportion of DHM MUFAs increased with plasma MUFA levels and the erythrocyte C17:1 level. The proportion of DHM SFAs increased with erythrocyte DMA content, plasma stearic acid, TFA intake, and breastfeeding time, but decreased with erythrocyte margaroleic acid content.
In terms of micronutrients, various associations were found between the donors’ diet/nutritional status and the DHM composition.
Regarding B-group vitamins, we found associations with the content of free thiamin, free riboflavin, and pyridoxal in milk. We were not able to demonstrate positive associations between the milk content of other B-group vitamins and maternal intake or plasma levels, although all of them (except folate) are considered to be dependent on diet and maternal stores [11]. Free thiamine in DHM was positively associated with plasma thiamine levels and negatively associated with breastfeeding time and the daily intake of milk and milk product servings. Free riboflavin in DHM was positively associated with riboflavin intake and vitamin B2 supplementation during lactation. Pyridoxal in DHM was positively associated with vitamin B6 supplementation during pregnancy and negatively associated with breastfeeding time. In the literature, the content of these three vitamins in breast milk is strongly associated with maternal intake [7,8,9,85]. However, the influence of maternal nutritional status on milk content depends on whether the mother has adequate or poor status in the case of thiamine; it is controversial in the case of riboflavin, and it is positive in the case of vitamin B6 [7]. Our donor population showed low plasma thiamine levels and riboflavin deficiency data of 28% according to the erythrocyte glutathione reductase activity coefficient study, but nevertheless the population showed adequate levels of plasma riboflavin. The content of these three vitamins in DHM can be considered low compared to previously published data [61,62,65], considering that free thiamine should comprise about 30% of the total thiamine content in HM [7], free riboflavin should comprise about 39% of the total riboflavin content, and pyridoxal is the predominant form of vitamin B6 in breast milk [10]. In addition, both plasma nicotinamide levels and milk levels in our donor population were low [63]. It remains uncertain whether the low content of free thiamine, free riboflavin, nicotinamide, and pyridoxal in DHM is due to a deficient maternal status; prolonged average breastfeeding time; or the depletion of vitamins exposed to photodegradation, freezing, and storage. On the other hand, the levels of cobalamin in DHM were adequate with respect to the reference values in HM [64,66] and donors' intakes and plasma levels of this micronutrient were also adequate. Available evidence suggests a positive association between maternal vitamin B-12 intake and milk concentration in marginally nourished women [7,9,86]. It is possible that in a population such as ours, with adequate cobalamin intake and stores, the usual diet is not reflected in the cobalamin content of milk.
Donors' fruit consumption was associated with dehydroascorbic acid content in DHM. One of the most consistent findings of the two systematic reviews conducted about the impact of diet and maternal nutrition on the composition of breast milk [8,9] was the association between vitamin C intake and its content in milk, although the total number of studies in which this result was found was only three [85,87,88]. Interestingly, the study published by Hoppu in 2005 [88] reported that the vitamin C content in the milk of mothers with atopic disease was associated with their vitamin C intake but not with vitamin C supplementation. We also found no association between vitamin C supplementation and vitamin C content in DHM. It should be noted that both our study and Hoppu's (2005) were observational studies in which the rates of the use of vitamin-C-containing supplements were 43.5% and 50%, and the median daily doses of vitamin C supplementation were 80 mg and 75 mg, respectively.
For fat-soluble vitamins, associations were found only with vitamin D. Their content in DHM was withing the reported values for HM and donors’ status was deficient at a very high percentage (87.7%). The content of cholecalciferol in DHM was positively correlated with the plasma cholecalciferol levels (but not with plasma 25(OH)D3 levels) and the daily consumption of milk and dairy products. Furthermore, the content of 25(OH)D3 in DHM increased with the intake of vitamin D supplements during lactation. These findings are in line with observations from previous studies [7,9]. Neither retinol nor vitamin E in DHM was associated with donors’ intake or status. In the case of vitamin A, donors’ stores were adequate and it has been reported that both maternal intake and maternal status influence milk content when maternal stores are depleted [7]. The α-tocopherol content of DHM was adequate in relation to the reference values for HM, although the status of the donors was deficient. Both the maternal status and intake of this vitamin with respect to the usual diet did not affect the vitamin E concentrations in HM in most of the studies, although some surveys have shown increased levels of alpha-tocopherol in colostrum in situations of supplementation [7,13].
Finally, among the studied minerals, only a positive association was found between the iodine content in DHM and the donors’ intake of iodine supplements, and this finding is in accordance with the literature [89]. The results on iodine were previously published in a document dedicated to this nutrient [25]. The selenium content in DHM was not associated with dietary intake in the present study, although it is known that the diet influences selenium HM contents [90]. Calcium and selenium contents in DHM were low, and phosphorus content was adequate, according to the reference values in HM [65,73,74,75].
In summary, we have studied the factors that might influence the nutritional content of DHM, and we highlight the following as strengths: a detailed study of the supplementation habits of donors since gestation, the 5-day weighed dietary record, and the determination of nutrients in donors’ erythrocytes, plasma, and urine. In addition, the dietary study was carried out concomitantly with the collection of milk for 5 consecutive days. Milk was not pooled between donors or days to allow us to establish relationships between the content of each nutrient in DHM and donors’ intake, status, and characteristics. However, our study has some limitations. It should be noted that the studied DHM comprised raw milk, and although the effect of pasteurization on the concentration of nutrients in DHM has been previously studied [91,92], we do not know if all the associations observed will remain after the pasteurization of milk. Nevertheless, although we controlled for an important number of covariates that could act as confounders, the large number of factors that can influence the nutritional content of human milk, as well as the complexity of nutrient metabolism—which is also influenced by the genetics of the mother-infant dyad itself—makes it very difficult to study interactions between maternal diet and milk composition. Given that the behavior of some nutrients in human milk with respect to the maternal diet is different depending on the socio-economic status of lactating mothers, access to food, and maternal nutritional status, the findings from our population of donors that exhibit a high educational level and that live in a developed country, may not be generalizable to other environments.
However, we consider that the results obtained in this study are relevant since we have shown that there are associations between the nutritional composition in DHM and the diet as well as the nutrient deposits of donors, despite the heterogeneity of donors regarding the duration of pregnancy and breastfeeding time, and the procedures to which raw DHM is subjected, which can affect the content of DHM; for example the use of glass containers that do not protect photosensitive vitamins from light, freezing, mixing, and storage [93,94].
The study of the composition of DHM and the factors that influence it is essential. Children receiving DHM are in a state of nutritional emergency, and it would therefore be desirable that the milk they receive is in accordance with their needs. On the other hand, the development of personalized medicine will allow us to better understand the variability in the composition of DHM and the different needs of children. It is probably in this new field that we will find answers to open questions.
Supplementary Materials
The following supporting information can be downloaded at the website of this paper posted on Preprints.org. Table S1: Consumption of the pharmacological supplements during pregnancy and the lactation of the human milk donors (n=113); Table S2: Diet survey: five-day dietary record. Daily nutrients intake of the human milk donors; Table S3: Prevalence of inadequate intakes of specific nutrients in human milk donors; Table S4: Diet survey: 5-day dietary diaries. Number of food servings per day consumed by the participants, healthy eating index (HEI), and records of supplement and iodized salt intake of the human milk donors; Table S5: Diet survey: food consumption frequency questionnaire (FFQ, the number of food servings per day or week that were consumed by the participants) of the human milk donors; Table S6: Erythrocytes and plasma fatty acid composition (g/100 g of total FAs) of the human milk donors; Table S7: Erythrocytes, plasma, and urine concentrations of nutrients and biochemical determinations of the human milk donors.
Author Contributions
Conceptualization, N.U.-V., D.E.-V., N.R.G.-L. and C.R.P.-A.; methodology, N.U.-V., D.E.-V., J.F., M.V.C., J.M.-T. and J.S.; formal analysis, N.U.-V. and A.M.-P.; investigation, N.U.-V., K.K, D.E.-V., J.F., M.V.C., J.M.-T. and J.S.; writing—original draft preparation, N.U.-V. and A.M.-P.; writing—review and editing, N.U.-V., A.M.-P., K.K., D.E.-V., J.F., M.V.C., J.M.-T., J.C.E.S., N.R.G.-L., C.R.F. and C.R.P.-A.; project administration, N.U.-V., N.R.G.-L. and C.R.P.-A.; funding acquisition, N.U.-V., D.E.-V., N.R.G.-L. and C.R.P.-A. All authors have read and agreed to the published version of the manuscript.
Funding
This research was funded by grant from the Spanish Research Projects in Health funded by Instituto de Salud Carlos III (ISCIII)—the State Plan for Scientific and Technical Research and Innovation (grant FIS PI15/00995). Furthermore, this work received support from RETICS “Maternal and Child Health and Development Network” (SAMID Network) (RD16/0022/0015) and from the Spanish Ministry of Science, Innovation, and Universities (Project PDI2020-114821RB-I00).
Institutional Review Board Statement
The study was conducted in accordance with the Declaration of Helsinki and approved by the Hospital 12 de Octubre’s Clinical Research Ethics Committee (protocol code 15/269, 29/09/2015).
Informed Consent Statement
Informed consent was obtained from all subjects involved in the study.
Data Availability Statement
The data presented in this study are available on request from the corresponding author. The data are not publicly available due to privacy issues.
Acknowledgments
We wish to thank our donors who took the time to participate in this study and to kindly donate their human milk. Thank you for your generosity, which made this research possible. We also want to acknowledge the contribution of RETICS “Maternal and Child Health and Development Network” (SAMID Network).
Conflicts of Interest
The authors declare no conflict of interest.
References
- Arslanoglu, S.; Corpeleijn, W.; Moro, G.; Braegger, C.; Campoy, C.; Colomb, V.; Decsi, T.; Domellöf, M.; Fewtrell, M.; Hojsak, I.; et al. Donor human milk for preterm infants: Current evidence and research directions. J. Pediatr. Gastroenterol. Nutr. 2013, 57, 535–542. [Google Scholar] [CrossRef]
- Moro, G.E.; Billeaud, C.; Rachel, B.; Calvo, J.; Cavallarin, L.; Christen, L.; Escuder-Vieco, D.; Gaya, A.; Lembo, D.; Wesolowska, A.; et al. Processing of Donor Human Milk: Update and Recommendations From the European Milk Bank Association (EMBA). Front. Pediatr. 2019, 7, 1–10. [Google Scholar] [CrossRef] [PubMed]
- Weaver, G.; Bertino, E.; Gebauer, C.; Grovslien, A.; Mileusnic-Milenovic, R.; Arslanoglu, S.; Barnett, D.; Boquien, C.Y.; Buffin, R.; Gaya, A.; et al. Recommendations for the establishment and operation of Human Milk Banks in Europe: A consensus statement from the European Milk Bank Association (EMBA). Front. Pediatr. 2019, 7, 53. [Google Scholar] [CrossRef] [PubMed]
- AAP Comittee on Nutrition, AAP Section on breastfeeding, AAP Comittee on fetus and newbornborn, D. Donor human milk for the high- risk infant: Preparation, safety, and usage options in the United States. Pediatrics 2017, 139, e20163440. [CrossRef]
- Martini, S.; Beghetti, I.; Annunziata, M.; Aceti, A.; Galletti, S.; Ragni, L.; Donti, A.; Corvaglia, L. Enteral Nutrition in Term Infants with Congenital Heart Disease: Knowledge Gaps and Future Directions to Improve Clinical Practice. Nutrients 2021, 13, 932. [Google Scholar] [CrossRef] [PubMed]
- National Academies of Sciences; Engineering; and Medicine; Health and Medicine Division; Food and Nutrition Board Nutrition During Pregnancy and Lactation: Exploring New Evidence: Proceedings of a Workshop; The National Academies Press (US): Washington (DC), 2020; ISBN 9780309679244.
- Dror, D.K.; Allen, L.H. Overview of nutrients in human milk. Adv. Nutr. 2018, 9, 278S–294S. [Google Scholar] [CrossRef]
- Bravi, F.; Wiens, F.; Decarli, A.; Dal Pont, A.; Agostoni, C.; Ferraroni, M. Impact of maternal nutrition on breast-milk composition: A systematic review. Am. J. Clin. Nutr. 2016, 104, 646–662. [Google Scholar] [CrossRef]
- Keikha, M.; Bahreynian, M.; Saleki, M.; Kelishadi, R. Macro- and Micronutrients of Human Milk Composition: Are They Related to Maternal Diet? A Comprehensive Systematic Review. Breastfeed. Med. 2017, 12. [Google Scholar] [CrossRef]
- Allen, L.H. B Vitamins in Breast Milk: Relative Importance of Maternal Status and Intake, and Effects on Infant Status and Function. Adv. Nutr. An Int. Rev. J. 2012, 3, 362–369. [Google Scholar] [CrossRef]
- Smilowitz, J.T.; Allen, L.H.; Dallas, D.C.; McManaman, J.; Raiten, D.J.; Rozga, M.; Sela, D.A.; Seppo, A.; Williams, J.E.; Young, B.E.; et al. Ecologies, synergies, and biological systems shaping human milk composition—a report from “Breastmilk Ecology: Genesis of Infant Nutrition (BEGIN)” Working Group 2. Am. J. Clin. Nutr. 2023, 117, S28–S42. [Google Scholar] [CrossRef]
- Allen, L.H. Multiple micronutrients in pregnancy and lactation: An overview. Am. J. Clin. Nutr. 2005, 81, 1206–1212. [Google Scholar] [CrossRef]
- Lima, M.S.R.; Dimenstein, R.; Ribeiro, K.D.S. Vitamin e concentration in human milk and associated factors: A literature review. J. Pediatr. (Rio. J). 2014, 90, 440–448. [Google Scholar] [CrossRef] [PubMed]
- Barrera, C.; Valenzuela, R.; Chamorro, R.; Bascuñán, K.; Sandoval, J.; Sabag, N.; Valenzuela, F.; Valencia, M.P.; Puigrredon, C.; Valenzuela, A. The impact of maternal diet during pregnancy and lactation on the fatty acid composition of erythrocytes and breast milk of chilean women. Nutrients 2018, 10, 839. [Google Scholar] [CrossRef] [PubMed]
- Bu, T.; Tang, D.; Liu, Y.; Chen, D. Trends in Dietary Patterns and Diet-related Behaviors in China. Am. J. Health Behav. 2021, 45, 371–383. [Google Scholar] [CrossRef] [PubMed]
- Grech, A.; Rangan, A.; Allman-Farinelli, M. Macronutrient Composition of the Australian Population’s Diet; Trends from Three National Nutrition Surveys 1983, 1995 and 2012. Nutrients 2018, 10, 1045. [Google Scholar] [CrossRef]
- Fulgoni, K.; Fulgoni, V.L. Trends in total, added, and natural phosphorus intake in adult americans, nhanes 1988–1994 to nhanes 2015–2016. Nutrients 2021, 13, 2249. [Google Scholar] [CrossRef]
- Christian, P.; Smith, E.R.; Lee, S.E.; Vargas, A.J.; Bremer, A.A.; Raiten, D.J. The need to study human milk as a biological system. Am. J. Clin. Nutr. 2021, 113, 1063–1072. [Google Scholar] [CrossRef]
- Hampel, D.; Shahab-Ferdows, S.; Islam, M.M.; Peerson, J.M.; Allen, L.H. Vitamin Concentrations in Human Milk Vary with Time within Feed, Circadian Rhythm, and Single-Dose Supplementation. J. Nutr. 2017, 147. [Google Scholar] [CrossRef]
- Dawodu, A.; Tsang, R.C. Maternal Vitamin D Status: Effect on Milk Vitamin D Content and Vitamin D Status of Breastfeeding Infants. Adv. Nutr. An Int. Rev. J. 2012, 3, 353–361. [Google Scholar] [CrossRef]
- Ortega, R.M.; López-Sobaler, A.M.; Martínez, R.M.; Andrés, P.; Elena Quintas, M. Influence of smoking on vitamin E status during the third trimester of pregnancy and on breast-milk tocopherol concentrations in Spanish women. Am J Clin Nutr 1998, 68, 662–667. [Google Scholar] [CrossRef]
- Perrin, M.T.; Belfort, M.B.; Hagadorn, J.I.; McGrath, J.M.; Taylor, S.N.; Tosi, L.M.; Brownell, E.A. The nutritional composition and energy content of donor human milk: A systematic review. Adv. Nutr. 2020, 11, 960–970. [Google Scholar] [CrossRef]
- Sierra-Colomina, G.; García-Lara, N.R.; Escuder-Vieco, D.; Alonso-Díaz, C.; Andrés Esteban, E.M.; Pallás-Alonso, C.R. Donor milk volume and characteristics of donors and their children. Early Hum. Dev. 2014, 90, 209–212. [Google Scholar] [CrossRef] [PubMed]
- Valentine, C.J.; Morrow, G.; Pennell, M.; Morrow, A.L.; Hodge, A.; Haban-Bartz, A.; Collins, K.; Rogers, L.K. Randomized Controlled Trial of Docosahexaenoic Acid Supplementation in Midwestern U. S. Human Milk Donors. Breastfeed Med 2013, 8, 86–91. [Google Scholar] [CrossRef]
- Ureta-Velasco, N.; Keller, K.; Escuder-Vieco, D.; Serrano, J.C.E.; García-Lara, N.R.; Pallás-Alonso, C.R. Assessment of Iodine Concentration in Human Milk from Donors: Implications for Preterm Infants. Nutrients 2022, 14, 4304. [Google Scholar] [CrossRef] [PubMed]
- Ureta-Velasco, N.; Keller, K.; Escuder-Vieco, D.; Fontecha, J.; Calvo, M. V.; Megino-Tello, J.; Serrano, J.C.E.; Romero Ferreiro, C.; García-Lara, N.R.; Pallás-Alonso, C.R. Human Milk Composition and Nutritional Status of Omnivore Human Milk Donors Compared with Vegetarian/Vegan Lactating Mothers. Nutrients 2023, 15, 1855. [Google Scholar] [CrossRef]
- Ortega, R.; López-Sobaler, A.; Andrés, P.; Requejo, A.; Aparicio, A.; Molinero, L. DIAL software for assessing diets and food calculations 2013.
- Boutin, M.; Presse, N.; Martineau, T.; Perreault, A.; Gaudreau, P.; Auray-Blais, C. Mass spectrometry analysis of urinary methylmalonic acid to screen for metabolic vitamin B12 deficiency in older adults. Bioanalysis 2020, 12, 693–705. [Google Scholar]
- Olsen, I.E.; Groveman, S.A.; Lawson, M.L.; Clark, R.H.; Zemel, B.S. New intrauterine growth curves based on United States data. Pediatrics 2010, 125, 214–224. [Google Scholar] [CrossRef]
- World Health Organization WHO Child Growth Standards: Length/height-for-age, weight-for-age, weight-for-length, weight-for-height and body mass index-for-age: Methods and development; World Health Organization: Geneva, 2006; ISBN 92 4 154693 X.
- Allen, L.H.; Carriquiry, A.L.; Murphy, S.P. Perspective: Proposed Harmonized Nutrient Reference Values for Populations. Adv Nutr 2020, 11, 469–483. [Google Scholar] [CrossRef]
- Ortega Anta, R.; Requejo Marcos, A. Nutriguía. Manual de nutrición clínica; Editorial Médica Panamericana: Madrid, 2015; ISBN 9788498358674. [Google Scholar]
- Kennedy, E.T.; Ohls, J.; Carlson, S.; Fleming, K. The Healthy Eating Index: design and applications. J. Am. Diet. Assoc. 1995, 95, 1103–1108. [Google Scholar] [CrossRef]
- Dapcich, V.; Salvador Castell, G.; Ribas Barba, L.; Pérez Rodrigo, C.; Aranceta-Bartrina, J.; Serra Majem, L. Embarazo y lactancia. Necesidades especiales. In Guía de la alimentación saludable; Sociedad Española de Nutrición Comunitaria, Ed.; Madrid, 2004; p. 82 ISBN https://www.nutricioncomunitaria.org/es/otras-publicaciones (accessed on Feb 02, 2023).
- Giuffrida, F.; Fleith, M.; Goyer, A.; Samuel, T.M.; Elmelegy-Masserey, I.; Fontannaz, P.; Cruz-Hernandez, C.; Thakkar, S.K.; Monnard, C.; De Castro, C.A.; et al. Human milk fatty acid composition and its association with maternal blood and adipose tissue fatty acid content in a cohort of women from Europe. Eur. J. Nutr. 2022, 61, 2167–2182. [Google Scholar] [CrossRef]
- Graham, J.; Peerson, J.; Haskell, M.; Shrestha, R.; Brown, K.; Allen, L. Erythrocyte riboflavin for the detection of riboflavin deficiency in pregnant Nepali women. Clin. Chem. 2005, 51, 2162–2165. [Google Scholar] [CrossRef]
- Berger, M.M.; Shenkin, A.; Schweinlin, A.; Amrein, K.; Augsburger, M.; Biesalski, H.K.; Bischoff, S.C.; Casaer, M.P.; Gundogan, K.; Lepp, H.L.; et al. ESPEN micronutrient guideline. Clin. Nutr. 2022, 41, 1357–1424. [Google Scholar] [CrossRef] [PubMed]
- Institute of Medicine Dietary Reference Intakes for Thiamin, Riboflavin, Niacin, Vitamin B6, Folate, Vitamin B12, Pantothenic Acid, Biotin, and Choline; The National Academies Press: Washington, DC, 1998; ISBN 9780309064118.
- Ehsanian, R.; Anderson, S.; Schneider, B.; Kennedy, D.; Mansourian, V. Prevalence of low plasma vitamin B1 in the stroke population admitted to acute inpatient rehabilitation. Nutrients 2020, 12. [Google Scholar] [CrossRef] [PubMed]
- Petteys, B.J.; Frank, E.L. Rapid determination of vitamin B2 (riboflavin) in plasma by HPLC. Clin. Chim. Acta 2011, 412, 38–43. [Google Scholar] [CrossRef] [PubMed]
- Andraos, S.; Jones, B.; Wall, C.; Thorstensen, E.; Kussmann, M.; Smith, D.C.; Lange, K.; Clifford, S.; Saffery, R.; Burgner, D.; et al. Plasma B vitamers: Population epidemiology and parent-child concordance in children and adults. Nutrients 2021, 13, 1–15. [Google Scholar] [CrossRef]
- Allen, L.H.; Miller, J.W.; De Groot, L.; Rosenberg, I.H.; Smith, A.D.; Refsum, H.; Raiten, D.J. Biomarkers of Nutrition for Development (BOND): Vitamin B-12 Review. J. Nutr. 2018, 148, 1995S–2027S. [Google Scholar] [CrossRef]
- Pawlak, R.; Parrott, S.J.; Raj, S.; Cullum-Dugan, D.; Lucus, D. How prevalent is vitamin B12 deficiency among vegetarians? Nutr. Rev. 2013, 71, 110–117. [Google Scholar] [CrossRef]
- Sobczyńska-Malefora, A.; Harrington, D.J. Laboratory assessment of folate (Vitamin B9) status. J. Clin. Pathol. 2018, 71, 949–956. [Google Scholar] [CrossRef]
- Bailey, L.B.; Stover, P.J.; McNulty, H.; Fenech, M.F.; Gregory III, J.F.; Mills, J.L.; Pfeiffer, C.M.; Fazili, Z.; Zhang, M.; Ueland, P.M.; et al. Biomarkers of nutrition for development-Folate review. J. Nutr. 2015, 145, 1636S–1680S. [Google Scholar] [CrossRef]
- Institute of Medicine Dietary Reference Intakes for Vitamin C, Vitamin E, Selenium, and Carotenoids; Press, T.N.A., Ed.; Washington, DC, 2000; ISBN 9780309069496.
- De Pee, S.; Dary, O. Biochemical indicators of vitamin A deficiency: Serum retinol and serum retinol binding protein. J. Nutr. 2002, 132, 2895–2901. [Google Scholar] [CrossRef]
- World Health Organization Serum retinol concentrations for determining the prevalence of vitamin A deficiency in populations; World Health Organization: Geneva, 2011; ISBN (WHO/NMH/NHD/MNM/11.3), (http://www.who.int/vmnis/indicators/retinol.pdf, accessed on Feb 28, 2023).
- Institute of Medicine Dietary reference intakes for calcium and vitamin D; Ross, C. A., Taylor, C.L., Yaktine, A.L., Del Valle, H.B., Medicine, I. of, Eds.; National Academies Press: Washington, D.C, 2011; ISBN 978-0-309-16395-8. [Google Scholar]
- U.S. Centers for Disease Control and Prevention Second National Report on Biochemical Indicators of Diet and Nutrition in the U.S. Population; Atlanta, GA, 2012; ISBN 1499234783.
- Dietary Guidelines Advisory Committee Scientific Report of the 2015 Dietary Guidelines Advisory Committee: Advisory Report to the Secretary of Health and Human Services and the Secretary of Agriculture; Washington, D.C. 2015.
- Dror, D.K.; Allen, L.H. Vitamin E deficiency in developing countries. Food Nutr. Bull. 2011, 32, 124–143. [Google Scholar] [CrossRef]
- Henjum, S.; Manger, M.; Hampel, D.; Brantsæter, A.L.; Shahab-Ferdows, S.; Bastani, N.E.; Strand, T.A.; Refsum, H.; Allen, L.H. Vitamin B12 concentrations in milk from Norwegian women during the six first months of lactation. Eur. J. Clin. Nutr. 2020, 74, 749–756. [Google Scholar] [CrossRef] [PubMed]
- Norman, E.J.; Morrison, J.A. Screening elderly populations for cobalamin (vitamin B12) deficiency using the urinary methylmalonic acid assay by gas chromatography mass spectrometry. Am. J. Med. 1993, 94, 589–594. [Google Scholar] [CrossRef] [PubMed]
- World Health Organization Urinary iodine concentrations for determining iodine status deficiency in populations. Vitamin and Mineral Nutrition Information System. Available online: https://apps.who.int/iris/bitstream/handle/10665/85972/WHO_NMH_NHD_EPG_13.1_eng.pdf (accessed on Mar 8, 2023).
- Ahn, J.; Lee, J.H.; Lee, J.; Baek, J.Y.; Song, E.; Oh, H.S.; Kim, M.; Park, S.; Jeon, M.J.; Kim, T.Y.; et al. Association between urinary sodium levels and iodine status in Korea. Korean J. Intern. Med. 2020, 35, 392–399. [Google Scholar] [CrossRef] [PubMed]
- Foley, K.F.; Boccuzzi, L. Urine calcium: Laboratory measurement and clinical utility. Lab. Med. 2010, 41, 683–686. [Google Scholar] [CrossRef]
- Fernández-Ruiz, L.; Rodelo Haad, C.; Rodríguez-Portillo, M.; Santamaría-Olmo, R. Variation of phosphaturia according to phosphorus intake. Actual. Medica 2020, 105, 18–26. [Google Scholar] [CrossRef]
- Zhang, Z.; Wang, Y.; Yang, X.; Cheng, Y.; Zhang, H.; Xu, X.; Zhou, J.; Chen, H.; Su, M.; Yang, Y.; et al. Human Milk Lipid Profiles around the World: A Systematic Review and Meta-Analysis. Adv. Nutr. 2022, 13, 2519–2536. [Google Scholar] [CrossRef]
- Gibson, R.S.; Rahmannia, S.; Diana, A.; Leong, C.; Haszard, J.J.; Hampel, D.; Reid, M.; Erhardt, J.; Suryanto, A.H.; Sofiah, W.N.; et al. Association of maternal diet, micronutrient status, and milk volume with milk micronutrient concentrations in Indonesian mothers at 2 and 5 months postpartum. Am. J. Clin. Nutr. 2020, 112, 1039–1050. [Google Scholar] [CrossRef]
- EFSA NDA Panel; Turck, D. ; Bresson, J.L.; Burlingame, B.; Dean, T.; Fairweather-Tait, S.; Heinonen, M.; Hirsch-Ernst, K.I.; Mangelsdorf, I.; McArdle, H.J.; et al. Dietary reference values for thiamin. EFSA J. 2016, 14, 4653. [CrossRef]
- EFSA NDA Panel; Turck, D. ; Bresson, J.-L.; Burlingame, B.; Dean, T.; Fairweather-Tait, S.; Heinonen, M.; Hirsch-Ernst, K.; Mangelsdorf, I.; McArdle, H.; et al. Dietary Reference Values for riboflavin. EFSA J. 2017, 15, 4919. [CrossRef]
- EFSA NDA Panel Scientific Opinion on Dietary Reference Values for niacin. EFSA J. 2014, 12, 3759. [CrossRef]
- EFSA NDA Panel Scientific Opinion on Dietary Reference Values for pantothenic acid. EFSA J. 2014, 12, 3581. [CrossRef]
- EFSA NDA Panel Scientific Opinion on nutrient requirements and dietary intakes of infants and young children in the European Union. EFSA J. 2013, 11, 3408. [CrossRef]
- EFSA NDA Panel Scientific Opinion on Dietary Reference Values for cobalamin (vitamin B12). EFSA J. 2015, 13, 4150. [CrossRef]
- EFSA NDA Panel Scientific Opinion on Dietary Reference Values for vitamin C. EFSA J. 2013, 11, 3418. [CrossRef]
- EFSA NDA Panel Scientific Opinion on Dietary Reference Values for vitamin A. EFSA J. 2015, 13, 4028. [CrossRef]
- EFSA NDA Panel Scientific opinion on dietary reference values for vitamin D. EFSA J. 2016, 14, 4547. [CrossRef]
- EFSA NDA Panel Scientific Opinion on Dietary Reference Values for vitamin E as α-tocopherol. EFSA J. 2015, 13, 4149. [CrossRef]
- Semba, R.D.; Delange, F. Iodine in human milk: Perspectives for infant health. Nutr. Rev. 2001, 59, 269–278. [Google Scholar] [CrossRef]
- Andersson, M.; Braegger, C.P. The role of iodine for thyroid function in lactating women and infants. Endocr. Rev. 2022, 43, 469–506. [Google Scholar] [CrossRef]
- EFSA NDA Panel Scientific Opinion on Dietary Reference Values for calcium. EFSA J. 2015, 13, 4101. [CrossRef]
- EFSA NDA Panel Scientific Opinion on Dietary Reference Values for phosphorus. EFSA J. 2015, 13, 4185. [CrossRef]
- EFSA NDA Panel Scientific Opinion on Dietary Reference Values for selenium. EFSA J. 2014, 12, 3846. [CrossRef]
- LASER Analytica Comprehensive literature search and review of breast milk composition as preparatory work for the setting of dietary reference values for vitamins and minerals. EFSA Support. Publ. 2014, 11, EN–629; 154 pp. [CrossRef]
- Castillo, F.; Castillo-Ferrer, F.J.; Cordobilla, B.; Domingo, J.C. Inadequate content of docosahexaenoic acid (DHA) of donor human milk for feeding preterm infants: A comparison with mother’s own milk at different stages of lactation. Nutrients 2021, 13, 1300. [Google Scholar] [CrossRef] [PubMed]
- Castillo Salinas, F.; Montaner Ramón, A.; Castillo Ferrer, F.-J.; Domingo-Carnice, A.; Cordobilla, B.; Domingo, J.C. Erythrocyte Membrane Docosahexaenoic Acid (DHA) and Lipid Profile in Preterm Infants at Birth and Over the First Month of Life: A Comparative Study with Infants at Term. Nutrients 2022, 14, 4956. [Google Scholar] [CrossRef]
- Makrides, M.; Neumann, M.; Gibson, R. Effect of maternal docosahexaenoic (DHA) supplementation on breast milk composition. Eur. J. Clin. Nutr. 1996, 50, 352–357. [Google Scholar] [PubMed]
- Valentine, C.J.; Morrow, G.; Fernandez, S.; Gulati, P.; Bartholomew, D.; Long, D.; Welty, S.E.; Morrow, A.L.; Rogers, L.K. Docosahexaenoic acid and amino acid contents in pasteurized donor milk are low for preterm infants. J. Pediatr. 2010, 157, 906–910. [Google Scholar] [CrossRef] [PubMed]
- Baack, M.L.; Norris, A.W.; Yao, J.; Colaizy, T. Long Chain Polyunsaturated Fatty Acid Levels in U. S. Donor Human Milk: Meeting the Needs of Premature Infants? J Perinatol 2012, 32, 598–603. [Google Scholar] [CrossRef]
- Valentine, C.J. Maternal Dietary DHA Supplementation to Improve Inflammatory Outcomes in the Preterm Infant. Adv. Nutr. 2012, 3, 370–376. [Google Scholar] [CrossRef]
- Francois, C.A.; Connor, S.L.; Bolewicz, L.C.; Connor, W.E. Supplementing lactating women with flaxseed oil does not increase docosahexaenoic acid in their milk. Am. J. Clin. Nutr. 2003, 77, 226–233. [Google Scholar] [CrossRef]
- Scopesi, F.; Ciangherotti, S.; Lantieri, P.B.; Risso, D.; Bertini, I.; Campone, F.; Pedrotti, A.; Bonacci, W.; Serra, G. Maternal dietary PUFAs intake and human milk content relationships during the first month of lactation. Clin Nutr 2001, 20, 393–397. [Google Scholar] [CrossRef] [PubMed]
- Kodentsova, V.M.; Vrzhesinskaya, O.A. Evaluation of the vitamin status in nursing women by vitamin content in breast milk. Bull. Exp. Biol. Med. 2006, 141, 323–327. [Google Scholar] [CrossRef] [PubMed]
- Dror, D.K.; Allen, L.H. Vitamin B-12 in humanmilk: A systematic review. Adv. Nutr. 2018, 9, 358S–366S. [Google Scholar] [CrossRef] [PubMed]
- Salmenperä, L. Vitamin C nutrition during prolonged lactation: optimal in infants while marginal in some mothers. Am. J. Clin. Nutr. 1984, 40, 1050–1056. [Google Scholar] [CrossRef]
- Hoppu, U.; Rinne, M.; Salo-Väänänen, P.; Lampi, A.-M.; Piironen, V.; Isolauri, E. Vitamin C in breast milk may reduce the risk of atopy in the infant. Eur. J. Clin. Nutr. 2005, 59, 123–128. [Google Scholar] [CrossRef]
- Dror, D.K.; Allen, L.H. Iodine in humanmilk: A systematic review. Adv. Nutr. 2018, 9, 347S–357S. [Google Scholar] [CrossRef]
- Dorea, J.G. Selenium and breast-feeding. Br. J. Nutr. 2002, 88, 443–461. [Google Scholar] [CrossRef]
- Peila, C.; Moro, G.E.; Bertino, E.; Cavallarin, L.; Giribaldi, M.; Giuliani, F.; Cresi, F.; Coscia, A. The effect of holder pasteurization on nutrients and biologically-active components in donor human milk: A review. Nutrients 2016, 8, 1–19. [Google Scholar] [CrossRef]
- Escuder-Vieco, D.; Rodríguez, J.M.; Espinosa-Martos, I.; Corzo, N.; Montilla, A.; García-Serrano, A.; Calvo, M.V.; Fontecha, J.; Serrano, J.; Fernández, L.; et al. High-Temperature Short-Time and Holder Pasteurization of Donor Milk: Impact on Milk Composition. Life 2021, 11, 114. [Google Scholar] [CrossRef]
- Nessel, I.; Khashu, M.; Dyall, S.C. The effects of storage conditions on long-chain polyunsaturated fatty acids, lipid mediators, and antioxidants in donor human milk — A review. Prostaglandins Leukot. Essent. Fat. Acids 2019, 149, 8–17. [Google Scholar] [CrossRef]
- Leaf, A.; Lansdowne, Z. Vitamins--conventional uses and new insights. World Rev. Nutr. Diet. 2014, 110, 152–166. [Google Scholar] [CrossRef] [PubMed]
Figure 1.
Flow chart of the study’s protocol. * Delivered to the RHMB within the following 15 days. Abbreviations: S-D, socio-demographic; FFQ, food frequency questionnaire.
Figure 1.
Flow chart of the study’s protocol. * Delivered to the RHMB within the following 15 days. Abbreviations: S-D, socio-demographic; FFQ, food frequency questionnaire.
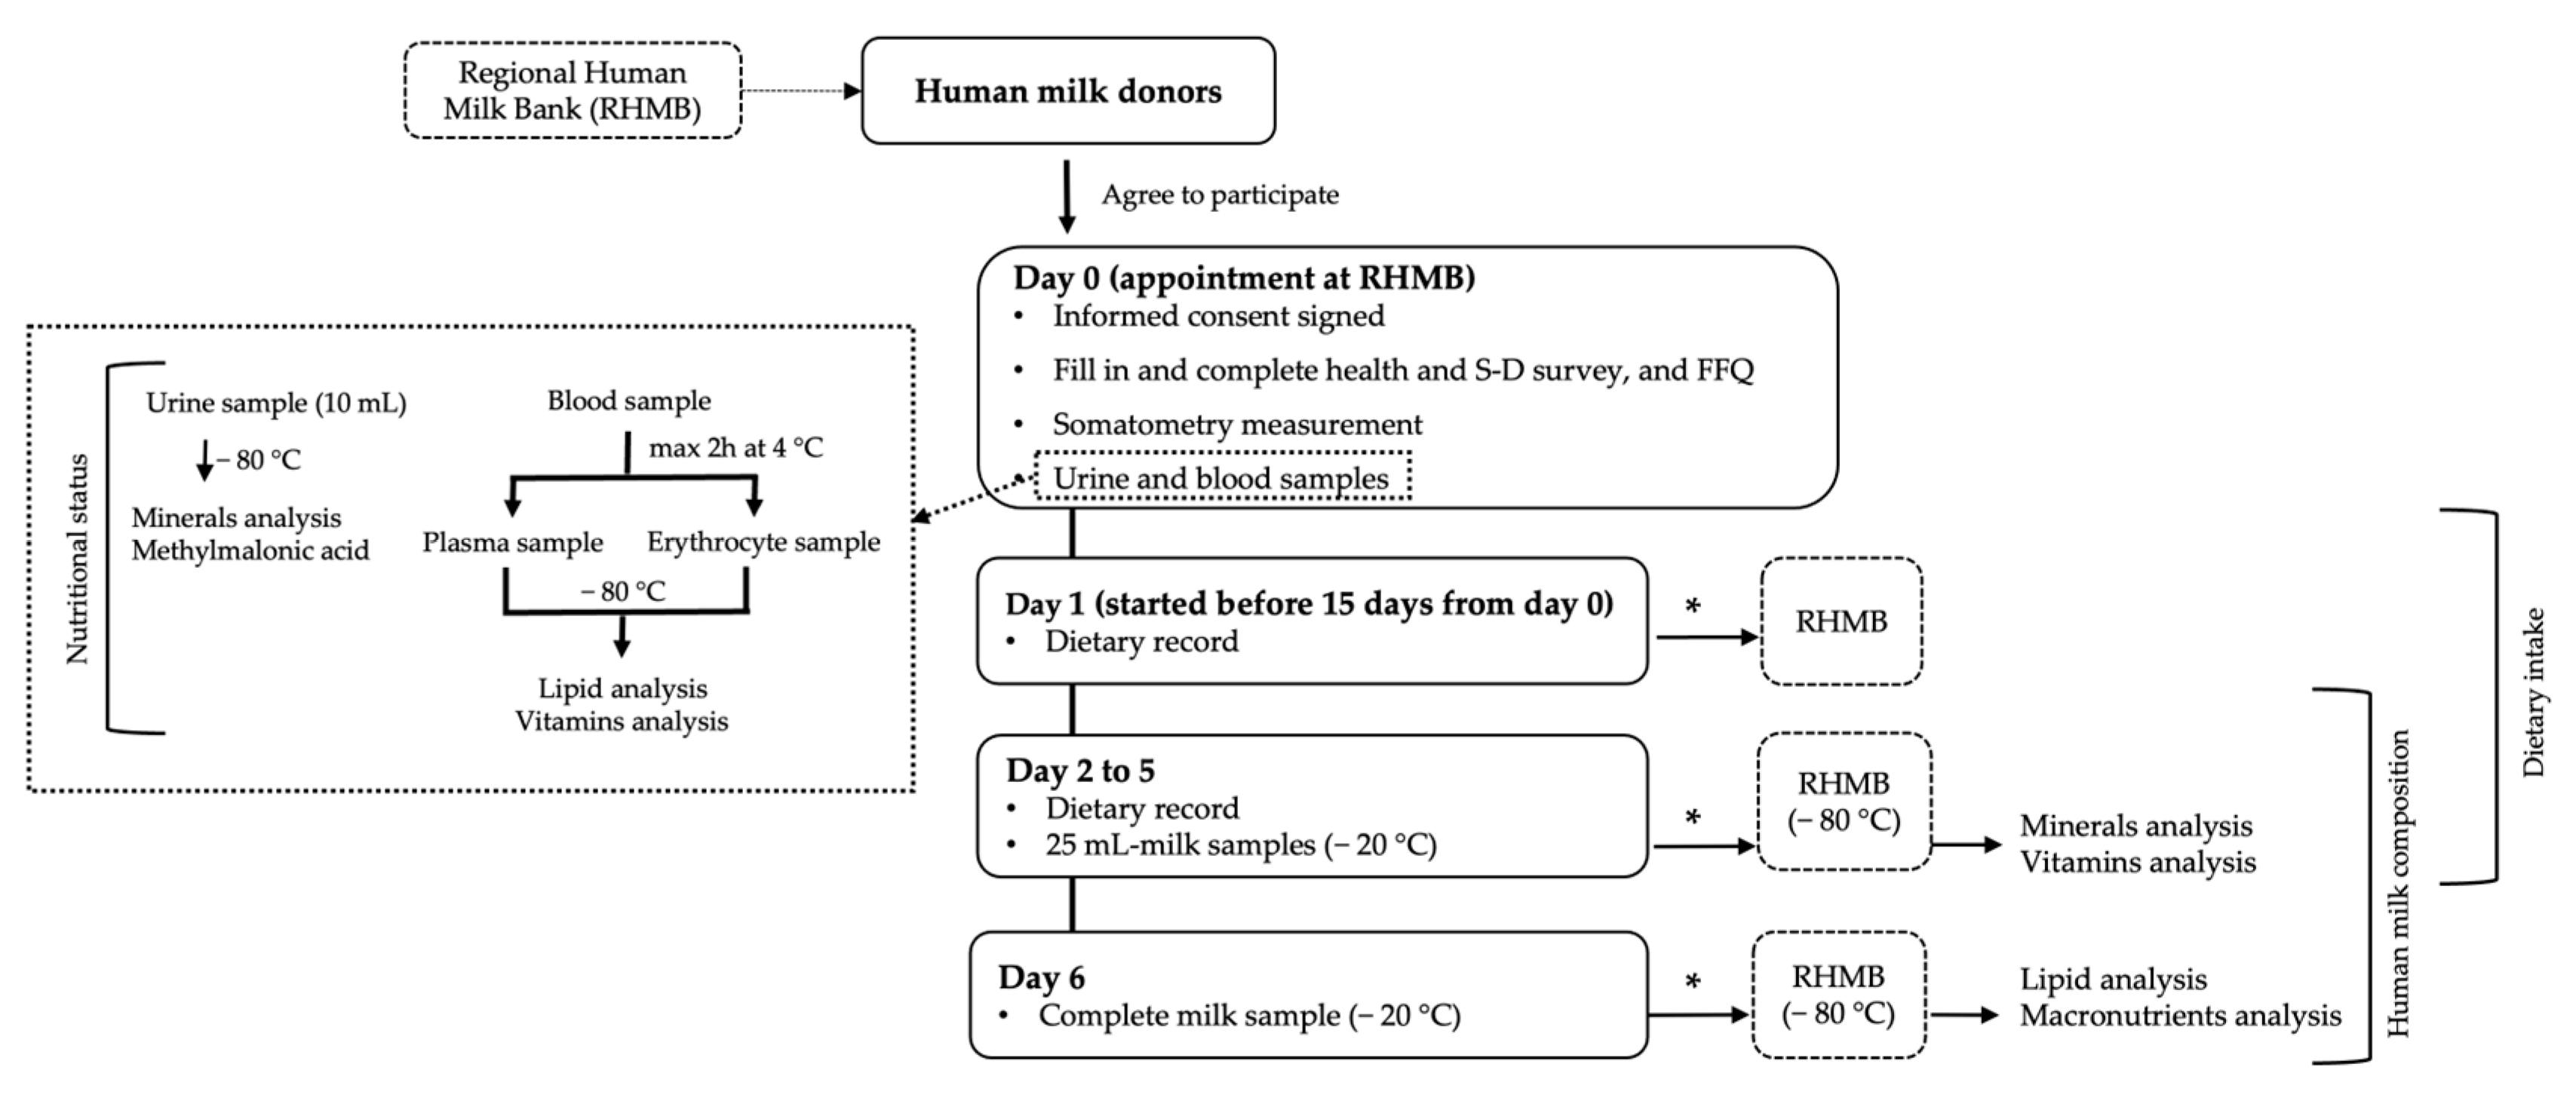

Table 1.
Characteristics of the human milk donors (n = 114).
| Characteristic | |
|---|---|
| Age (years) | 35.6 (32.9, 38.7) |
| Weight (kg) | 60.5 (55.2, 70.6) |
| Height (cm) | 164.1 (6.5) |
| Pre-pregnancy BMI (kg/m2) | 22.1 (20.6, 24.8) |
| Pre-pregnancy BMI (kg/m2) category | |
| Underweight (<18.5) | 4 (3.5%) |
| Normal (18.5-24.9) | 84 (73.7%) |
| Overweight (25-29.9) | 15 (13.2%) |
| Obese (≥30) | 11 (9.6%) |
| Current BMI (kg/m2) | 22.9 (21.1, 25.1) |
| Current BMI (kg/m2) category | |
| Underweight (<18.5) | 4 (3.5%) |
| Normal (18.5-24.9) | 81 (71.1%) |
| Overweight (25-29.9) | 16 (14.0%) |
| Obese (≥30) | 13 (11.4%) |
| Gestational weight gain (kg) | 11.3 (9.0, 14.0) |
| Postpartum weight retention (kg) | 1.0 (−0.6, 2.5) |
| Number of living children | |
| 0 a–1 | 63 (55.3%) |
| 2 | 39 (34.2%) |
| ≥3 | 12 (10.5%) |
| Country of origin: Spain | 102 (89.5%) |
| Education level | |
| Secondary studies | 2 (1.8%) |
| Technical studies | 14 (12.3%) |
| University studies | 98 (86.0%) |
| Currently working | 50 (43.9%) |
| Physical activity | |
| Sedentary | 26 (22.8%) |
| Low active | 60 (52.6%) |
| Active/very active | 28 (24.6%) |
| Tobacco consumption | |
| Previously | 28 (24.6%) |
| Currently | 1 (0.9%) |
| Passive smoking | 24 (21.1%) |
| Active smoking | 1 (0.9%) |
| Alcohol consumption | |
| Prior to pregnancy | 55 (48.2%) |
| During pregnancy | 1 (0.9%) |
| Currently | 4 (3.5%) |
| Season during the study | |
| Spring | 30 (26.3%) |
The quantitative variables are presented as means (standard deviations) when they followed a parametric distribution and as medians (25th, 75th percentiles) when they followed a nonparametric distribution. The qualitative variables are expressed as the absolute and relative frequencies (%). a Due to a fetal death at 22+6 weeks of gestational age and 450 g of birthweight. Abbreviations: BMI, Body mass index.
Table 2.
Diseases, medication intake, and characteristics of the last pregnancy of donors (n = 114).
Table 2.
Diseases, medication intake, and characteristics of the last pregnancy of donors (n = 114).
| n (%) | ||
|---|---|---|
| Diseases 1 | 41 (36.0%) | |
| Endocrinological and metabolic diseases* | 10 (8.8%) | |
| Cardiovascular diseases (hypertension) | 1 (0.9%) | |
| Respiratory diseases (asthma) | 6 (5.3%) | |
| Immune diseases (allergy, psoriasis, atopia) | 7 (6.1%) | |
| Spinal/medullary pathology | 6 (5.3%) | |
| Miscellaneous ** | 13 (11.4%) | |
| Medication intake 1 | 12 (10.5%) | |
| Oral contraceptives | 4 (3.5%) | |
| Thyroid hormone replacement therapy | 4 (3.5%) | |
| Other medicines *** | 5 (4.4%) | |
| Twin pregnancy | 4 (3.5%) | |
| Problems in the last pregnancy 1 | 36 (31.6%) | |
| Thyroid disorders | 17 (14.9%) | |
| Preeclampsia | 2 (1.8%) | |
| Gestational diabetes | 2 (1.8%) | |
| Intrauterine fetal growth restriction | 6 (5.3%) | |
| Intrauterine fetal death | 3 (2.6%) | |
| Other problems **** | 11 (9.6%) |
1 The categories do not exclude each other. *Endocrinological and metabolic diseases include 4 cases of well-controlled hypothyroidism, 4 cases of subclinical thyroid disorders, and 2 cases of hypercholesterolemia. ** Miscellaneous includes congenital amylase–sucrase deficiency, fatty liver, esophagitis, antiphospholipid syndrome, uveitis, migraines, polycystic ovary syndrome, cholesteatoma, venous insufficiency, recurrent urinary tract infections, human papillomavirus infection, and depression. *** Other medicines include antihistamines, antidepressants, proton-pump inhibitors, antivertiginous, and oral bronchodilators. **** Others problems include the threat of abortion, threat of premature birth, feto-fetal transfusion syndrome, chorioamnionitis, oligohydramnios, intrahepatic cholestasis, cytomegalovirus infection, bronchitis, and urinary tract infections.
Table 3.
Characteristics of infants (n = 116).
| Characteristic | n* | |
|---|---|---|
| Gestational age (weeks) | 114 | 39+4 (38+2, 40+2); 22+6–42+3 |
| Boy | 116 | 55 (47.4%) |
| Birth weight (grams) | 3195.0 (2795.0, 3472.5); 450.0-4640.0 | |
| Birth weight percentile 1 | ||
| ≤25 | 32 (27.6%) | |
| 25–75 | 73 (62.9%) | |
| ≥75 | 11 (9.5%) | |
| Age of infant (months) | ||
| 0–6 | 45 (39.5%) | |
| 6–12 | 43 (37.7%) | |
| 12–50 | 26 (22.8%) | |
| Postmenstrual age of preterm infants (weeks) | 19 | 50.3 (38.6, 78.2) |
| Weight percentile of breastfed child 2 | 113 | |
| ≤15 | 17 (15.0%) | |
| 15–85 | 77 (68.1%) | |
| ≥85 | 19 (16.8%) |
The quantitative sociodemographic variables are presented as means (standard deviations) when they followed a parametric distribution and as medians (25th, 75th percentiles) when they followed a nonparametric distribution. The ranges are displayed after the semicolons. The qualitative variables are expressed as the absolute and relative frequencies (%). * n = 116 includes a stillbirth at 22+6 weeks of gestational age and two pairs of twins; n = 114 is due to the number of gestations; n=113 excludes the stillbirth, a twin baby who died in the first week of life and 1 missing data. 1 Taking as reference the Olsen intrauterine growth curves [29]. 2 Taking as reference the World Health Organization (WHO)’s child growth standards [30].
Table 4.
Characteristics of the lactation of the donors (n = 114).
| Characteristic | n | n (%) |
|---|---|---|
| Donor previously | 114 | 20 (17.5%) |
| Duration of lactation of the previous child (months) |
51 a |
|
| 0 | 1(2.0%) | |
| 3-6 | 2 (3.9%) | |
| 6-12 | 10 (19.6%) | |
| 12-24 | 22 (43.1%) | |
| ≥24 | 16 (3.3%) | |
| Current lactation stage (months) | 114 | 7.0 (4.8, 12.0); 1.8-50 |
| Type of lactation |
113 b |
|
| Exclusive | 52 (46.0%) | |
| Partial | 61 (54.0%) | |
| Sum of child direct breastfeeding times plus daily pumped sessions <5 5–10 >10 Missing data |
114 |
12 (10.5%) 66 (57.9%) 33 (28.9%) 3 (2.6%) |
| Tandem breastfeeding | 114 | 5 (4.4%) |
| Breastfeeding twins | 114 | 1 (0.9%) |
| Type of milk expression * Manual Mechanical breast pump Simple electric breast pump Double electric breast pump |
114 |
7 (6.1%) 12 (10.5%) 82 (71.9%) 15 (13.2%) |
The quantitative variables are presented as means (standard deviations) when they followed a parametric distribution, and as medians (25th, 75th percentiles) when they followed a nonparametric distribution. The ranges are displayed after the semicolons. The qualitative variables are expressed as the absolute and relative frequencies (%). a Number of donors with previous children. b Due to one stillbirth. * The categories do not exclude each other.
Table 5.
Macronutrient composition (g/100 mL milk), lipid classes’ profile (g/100 g fat), relative composition of phospholipids (g/100 g polar lipids), and molecular species of triacylglycerols content (g/100 g fat) according to their carbon number (CN) of donor human milk.
Table 5.
Macronutrient composition (g/100 mL milk), lipid classes’ profile (g/100 g fat), relative composition of phospholipids (g/100 g polar lipids), and molecular species of triacylglycerols content (g/100 g fat) according to their carbon number (CN) of donor human milk.
| Nutrient | Donors | |
|---|---|---|
| n | Mean (SE) | |
| Macronutrients (g/100 mL milk) | ||
| Lipids | 103 | 3.13 (0.17) |
| Carbohydrates | 7.73 (0.03) | |
| Proteins | 1.17 (0.03) | |
| Lipid classes (g/100 g fat) | ||
| Triacylglycerols | 20 | 96.19 (93.87, 97.26) |
| Diacylglycerols | 3.43 (2.47, 5.50) | |
| Monoacylglycerols | 0.03 (0.02, 0.07) | |
| Free fatty acids + cholesterol | 0.31 (0.22, 0.51) | |
| Polar lipids | 0.05 (0.01) | |
| Phospholipids (g/100 g of polar lipids) | ||
| Phosphatidylethanolamine | 20 | 24.63 (7.88) |
| Phosphatidylcholine | 30.95 (5.00) | |
| Sphingomyelin | 44.43 (11.09) | |
| Triacylglycerols (g/100 g fat) | ||
| CN24 | 20 | 0.01 (0.01, 0.02) |
| CN26 | 0.10 (0.03) | |
| CN28 | 0.07 (0.05, 0.12) | |
| CN30 | 0.19 (0.14, 0.27) | |
| CN32 | 0.26 (0.19, 0.41) | |
| CN34 | 0.33 (0.13, 0.44) | |
| CN36 | 0.36 (0.22, 0.65) | |
| CN38 | 1.57 (0.68) | |
| CN40 | 2.02 (0.54) | |
| CN42 | 2.70 (0.91) | |
| CN44 | 5.02 (1.37) | |
| CN46 | 7.51 (1.50) | |
| CN48 | 10.72 (1.43) | |
| CN50 | 14.71 (2.16) | |
| CN52 | 36.89 (4.83) | |
| CN54 | 17.30 (5.10) | |
Variables are presented as means (standard deviations) when they followed a parametric distribution, and as medians (25th, 75th percentiles) when they followed a nonparametric distribution.
Table 6.
Fatty acid composition (g/100 g fat) of donor human milk.
| Fatty Acid (%) | Common Name | Donors (n = 108) | Reference Values | |
|---|---|---|---|---|
| European [35] 1 | World [59] 2 | |||
| Saturated Fatty Acids (SFAs) | ||||
| C6:0 | Caproic | 0.11 (0.02) | 0.08 ± 0.02 | 0.13 ± 0.47 |
| C8:0 | Caprylic | 0.18 (0.16, 0.21) | 0.22 ± 0.06 | 0.21 ± 0.22 |
| C10:0 | Capric | 1.20 (0.29) | 1.44 ± 0.34 | 1.37 ± 0.86 |
| C12:0 | Lauric | 5.42 (1.58) | 5.46 ± 1.84 | 5.7 ± 2.81 |
| C14:0 | Myristic | 5.88 (4.91, 7.75) | 6.19 ± 1.93 | 6.56 ± 3.05 |
| C15:0 | Pentadecanoic | 0.18 (0.13, 0.25) | ||
| C15:0 ai | C15:0 anteiso | 0.02 (0.02, 0.03) | ||
| C15:0 i | C15:0 iso | 0.03 (0.02, 0.05) | ||
| C16:0 i | C16:0 iso | 0.02 (0.01, 0.03) | ||
| C16:0 | Palmitic | 19.61 (2.45) | 21.94 ± 2.92 | 21.5 ± 4.82 |
| C17:0 ai | C17:0 anteiso | 0.04 (0.03, 0.06) | ||
| C17:0 i | C17:0 iso | 0.27 (0.06) | ||
| C17:0 | Margaric | 0.19 (0.15, 0.23) | 0.31 ± 0.15 | |
| C18:0 | Stearic | 5.72 (4.96, 6.49) | 6.68 ± 1.59 | 6.36 ± 2.07 |
| C20:0 | Arachidic | 0.16 (0.11, 0.21) | 0.17 ± 0.04 | 0.23 ± 0.17 |
| Monounsaturated Fatty Acids (MUFAs) | ||||
| C14:1 cis-9 (n5) | Myristoleic | 0.07 (0.04, 0.11) | ||
| C16:1 cis-9 (n7) | Palmitoleic | 1.47 (1.19, 1.76) | 2.21 ± 0.64 | 2.3 ± 0.92 |
| C17:1 | Margaroleic | 0.07 (0.03) | ||
| ∑ C18:1 trans | 0.22 (0.13, 0.34) | 0.66 ± 0.35 | ||
| C18:1 cis-9 (n9) | Oleic | 38.23 (4.98) | 35.59 ± 4.17 | 32.6 ± 5.84 |
| C18:1 cis-11 (n7) | Cis vaccenic | 1.61 (0.28) | 2.38 ± 0.53 | |
| C20:1 (n9) | Gondoic | 0.53 (0.36, 0.82) | 0.38 ± 0.12 | 0.46 ± 0.28 |
| n-6 Polyunsaturated Fatty Acids (n-6 PUFAs) | ||||
| C18:2 (n6) | Linoleic (LA) | 14.79 (12.37, 17.19) | 14.00 ± 4.95 | 15.7 ± 7.15 |
| C20:2 (n6) | Eicosadienoic | 0.25 (0.19, 0.35) | 0.26 ± 0.07 | 0.37 ± 0.19 |
| C20:3 (n6) | Dihomo-γ-linolenic | 0.33 (0.23, 0.44) | 0.31 ± 0.09 | 0.37 ± 0.18 |
| C20:4 (n6) | Arachidonic (AA) | 0.54 (0.18) | 0.44 ± 0.12 | 0.50 ± 0.25 |
| n-3 Polyunsaturated Fatty Acids (n-3 PUFAs) | ||||
| C18:3 (n3) | Linolenic (ALA) | 0.50 (0.40, 0.62) | 0.94 ± 0.55 | 1.11 ± 1.05 |
| C22:5 (n3) | Docosapentaenoic (DPA) | 0.07 (0.05, 0.11) | ||
| C22:6 (n3) | Docosahexaenoic (DHA) | 0.28 (0.17, 0.45) | 0.34 ± 0.35 | 0.37 ± 0.31 |
| n-7 Polyunsaturated Fatty Acids (n-7 PUFAs) | ||||
| C18:2 c9, t11 (n7) | Rumenic | 0.08 (0.04, 0.12) | ||
| Fatty acid families | ||||
| Not identified | 0.20 (0.15, 0.25) | |||
| SFAs | 39.83 (37.0, 42.1) | 42.23 ± 5.29 | 42.2 ± 7.73 | |
| MUFAs | 42.49 (5.22) | 41.34 ± 4.48 | 36.3 ± 6.46 | |
| PUFAs | 16.71 (14.83, 19.37) | 16.43 ± 5.07 | 21.2 ± 8.18 | |
| SCFAs | 0.11 (0.10, 0.12) | |||
| MCFAs (C8-C15) | 13.02 (11.13, 16.18) | |||
| LCFAs (C16-C18) | 84.0 (80.71, 86.35) | |||
| VLCFAs (C20-C24) | 2.34 (2.02, 3.16) | |||
| n-6 PUFAs | 15.77 (13.46, 18.44) | 17.8 ± 7.51 | ||
| n-3 PUFAs | 0.87 (0.72, 1.17) | 1.88 ± 2.63 | ||
| n-6 PUFAs/n-3 PUFAs | 17.21 (13.31, 24.81) | |||
| LA/ALA ratio | 28.68 (22.52, 40.31) | |||
| ARA/DHA ratio | 1.83 (1.32, 3.06) | 1.68 ± 0.89 | ||
The quantitative variables are presented as means (standard deviations) when they followed a parametric distribution and as medians (25th, 75th percentiles) when they followed a nonparametric distribution. 1 Data are presented as the mean ± standard deviation, from 223 lactating mothers at a lactation stage of 120 ± 5 days. 2 Data of the mature milk are presented as the mean ± standard deviation. Abbreviations: SCFAs, short-chain fatty acids; MCFAs, medium-chain fatty acids; LCFAs, long-chain fatty acids; VLCFAs, very-long-chain fatty acids.
Table 7.
Vitamin, mineral, and trace element composition of donor human milk (n = 113).
| Nutrient 1 | Donors | Mature Milk Nutrient Concentration Reference |
|
|---|---|---|---|
| n | Concentration | ||
| Free thiamin, B1 (UPLC-MS/MS) mcg/L | 113 | 18.10 (10.03, 28.43) | Free thiamin 18.5 [60] Total thiamin 180 [61] |
| Free riboflavin, B2 (UPLC-MS/MS) mcg/L | 113 | 47.30 (23.58, 99.90) | Free riboflavin 11.2 [60] Total riboflavin 364 [62] |
| Nicotinamide, B3 (UPLC-MS/MS) mcg/L | 113 | 46.73 (28.50, 82.58) | Nicotinamide 275 [60] Total niacin 2100 [63] |
| Pantothenic acid, B5 (UPLC-MS/MS) mcg/L | 113 | 2264.90 (1864.90, 2540.00) | 2500 [64] 1304 [60] |
| Pyridoxal, B6 (UPLC-MS/MS) mcg/L | 113 | 36.73 (27.80, 53.30) | Pyridoxal 96 [60] B6 130 [65] |
| Folic acid, B9 (UPLC-MS/MS) mcg/L | 113 | 19.88 (7.02) | Folate 80 [65] |
| Cobalamin, B12 (Competitive immunoassay) | 113 | ||
| pM | 490.63 (74.30) | ||
| mcg/L | 0.66 (0.10) | 0.5 [66] | |
| Ascorbic acid (HPLC-DAD) mg/dL | 112 | 3.91 (1.71) | |
| Dehydroascorbic acid (HPLC-DAD) mg/dL | 112 | 1.91 (1.29, 3.38) | |
| Vitamin C * (HPLC-DAD) | 112 | ||
| mg/dL | 6.37 (1.41) | ||
| mg/L | 63.70 (14.10) | 35–90 [67] | |
| Retinol (HPLC with fluorescence and UV detector) | 112 | ||
| mcg/dL | 41.15 (26.80, 72.48) | ||
| mcg/L | 411.50 (268.00, 724.80) | 530 [68] | |
| Vitamin D3 (UPLC–electrospray ionization/tandem MS) | 112 | ||
| pg/mL | 1603.65 (373.83, 5279.93) | ||
| mcg/L | 1.60 (0.37, 5.28) | 0.25–2 [69] | |
| 25(OH)D3 (UPLC–electrospray ionization/tandem MS) | 112 | ||
| pg/mL | 53.90 (27.13, 109.85) | ||
| mcg/L | 0.05 (0.03, 0.11) | ||
| α-tocopherol (HPLC with fluorescence and UV detector) | 112 | ||
| mcg/dL | 463.80 (373.33, 586.76) | ||
| mg/L | 4.64 (3.73, 5.87) | 4.6 [70] | |
| γ-tocopherol (HPLC with fluorescence and UV detector) | 112 | ||
| mcg/dL | 50.19 (36.43, 67.08) | ||
| mg/L | 0.50 (0.36, 0.67) | 0.45 [60] | |
| Vitamin E (as TE) ** | 112 | ||
| mcg/dL | 488.02 (163.13) | ||
| mg/L | 4.88 (1.63) | 5.2 [60] | |
| Iodine (ICP-MS) ppb (mcg/L) | 113 | 148.45 (98.95, 204.98) | 50–100 [65] 100–200 [71,72] |
| Calcium (ICP-MS) ppm (mg/L) | 113 | 99.10 (59.70, 127.35) | 200–300 [73] |
| Phosphorous (ICP-MS) ppm (mg/L) | 113 | 132.47 (114.00, 150.40) | 120–140 [65,74] |
| Selenium (ICP-MS) ppb (mcg/L) | 113 | 10.88 (9.30, 12.68) | 18 [75] |
The quantitative variables are presented as means (standard deviations) when they followed a parametric distribution and as medians (25th, 75th percentiles) when they followed a nonparametric distribution. n is the total number of women in each group with data for the studied nutrient. 1 For the purpose of comparison, the units of our results were converted to those used in the references for the nutrients in human milk * Vitamin C = ascorbic acid + dehydroascorbic acid. ** Vitamin E is calculated as the sum of each vitamer expressed as tocopherol equivalents (TE) (mg) = α-tocopherol (mg) + 0.25 × γ-tocopherol (mg) [76]. Abbreviations: UPLC, ultra-performance liquid chromatography; MS/MS, tandem mass spectrometry; HPLC, high-performance liquid chromatography; DAD, diode array detector; UV, ultraviolet; MS, mass spectrometry; TE, tocopherol equivalents; ICP, inductively coupled plasma; ppb, parts per billion; ppm, parts per million.
Table 8.
Multivariate analysis of lipids in donor human milk.
| Fatty Acids (% of Total Fatty Acids) |
Associated Variables | Beta | Std. Err. | t | P>|t| | 95% CI |
|---|---|---|---|---|---|---|
| SFAs a Observations = 105 R2 = 0.34 |
DMA in erythrocytes (% of fat in erythrocytes) |
2.700 | 0.795 | 3.40 | 0.001 | [1.122, 4.277] |
| Plasma C18:0 (% of fat in plasma) |
2.023 | 0.550 | 3.68 | <0.001 | [0.932, 3.114] | |
| C17:1 in erythrocytes (% of fat in erythrocytes) |
-13.556 | 3.565 | -3.80 | <0.001 | [-20.629, -6.483] | |
|
Trans fatty acids (average % intake per day during the dietary record) |
5.789 | 2.171 | 2.67 | 0.009 | [1.481, 10.097] | |
| Breastfeeding time (months) | 0.203 | 0.071 | 2.86 | 0.005 | [0.062, 0.344] | |
| Total MUFAs b Observations = 103 R2 = 0.16 |
Plasma MUFAs (% of fat in plasma) |
0.458 | 0.165 | 2.77 | 0.007 | [0.130, 0.786] |
| C17:1 in erythrocytes (% of fat in erythrocytes) |
13.523 | 4.895 | 2.76 | 0.007 | [3.810,23.235] | |
| Total PUFAs Observations = 108 R2 = 0.04 |
PUFAs (average intake g/day during the dietary record) |
0.139 | 0.062 | 2.23 | 0.028 | [0.015, .263] |
| Linoleic Acid c Observations = 106 R2 = 0.10 |
Linoleic acid in erythrocytes (% of fat in erythrocytes) |
0.633 | 0.209 | 3.02 | 0.003 | [0.217, 1.048] |
| Meat, fish, eggs (average servings/day during the dietary record) |
0.684 | 0.281 | 2.44 | 0.016 | [0.128, 1.241] | |
| DHA d Observations = 104 R2 = 0.45 |
Plasma DHA (% of fat in plasma) |
0.164 | 0.334 | 4.91 | <0.001 | [0.098, 0.230] |
| DHA (average intake g/day during the dietary record) |
0.382 | 0.075 | 5.12 | <0.001 | [0.234, 0.530] | |
| Total Omega-3 e Observations = 106 R2 = 0.29 |
DHA (average intake g/day during the diet diary) |
0.783 | 0.120 | 6.51 | <0.001 | [0.544, 1.021] |
a After a diagnosis of the model, the data 2 and 32 were removed. b After a diagnosis of the model, the data 2, 32, and 71 were removed. c After a diagnosis of the model, the data 19 and 135 were removed. d After diagnosis of the model, data 6, 68, and 73 were removed. e After a diagnosis of the model, the data 6 and 68 were removed. Abbreviations: SE, Standard error; SFAs, saturated fatty acids; DMA, dimethyl acetals, MUFAs, monounsaturated fatty acids; PUFAs, polyunsaturated fatty acids; DHA, docosahexaenoic acid.
Table 9.
Multivariate analysis on vitamins, minerals, and trace elements in donor human milk.
| Vitamins | Associated Variables | Beta | Std. Err. | t | P>|t| | 95% CI |
|---|---|---|---|---|---|---|
| Free thiamin, B1 (mcg/L) Observations = 113 R2 = 0.12 |
Plasma thiamin (mcg/L) | 10.817 | 4.915 | 2.20 | 0.030 | [1.075, 20.559] |
| Milk and dairy products (average servings/day during the diet diary) | -2.880 | 1.090 | -2.64 | 0.009 | [-5.040, -0.720] | |
| Breastfeeding time (months) |
-0.494 | 0.210 | -2.35 | 0.021 | [-0.911, -0.077] | |
| Free riboflavin, VB2 (mcg/L) a Observations = 100 R2 = 0.21 |
Riboflavin intake (average mg/day during the dietary record) | 20.991 | 8.758 | 2.40 | 0.018 | [3.609, 38.373] |
| Vitamin B2 supplementation during lactation (receiving or not) | 39.742 | 15.258 | 2.60 | 0.011 | [9.459, 70.024] | |
| Pyridoxal, B6 (mcg/L) b Observations = 106 R2 = 0.17 |
Vitamin B6 supplementation during pregnancy (receiving or not) |
11.629 | 3.114 | 3.73 | <0.001 | [5.454, 17.804] |
| Breastfeeding time (months) | -0.776 | 0.273 | -2.84 | 0.005 | [-1.318, -0.234] | |
| Dehidroascorbic acid (mg/dL) Observations = 112 R2 = 0.15 |
Plasma ascorbic acid (mcM) | -0.014 | 0.005 | -2.92 | 0.004 | [-0.024, -0.005] |
| Fruits (average servings/day during the dietary record) |
0.271 | 0.128 | 2.12 | 0.036 | [0.018, 0.524] | |
| Breastfeeding time (months) | -0.062 | 0.025 | -2.47 | 0.015 | [-0.112, -0.012] | |
| Cholecalciferol (pg/mL) c Observations = 32 R2 = 0.57 |
Plasma cholecalciferol (pg/mL) | 17.342 | 4.238 | 4.09 | <0.001 | [3.178, 23.510] |
| Milk and dairy products (average servings/day during the dietary record) | 520.533 | 168.819 | 3.08 | 0.005 | [174.722, 866.343] | |
| 25 (OH) D3 (pg/mL) d Observations = 99 R2 = 0.24 |
Plasma 1,25 (OH)2 D3 (pg/mL) | 0.156 | 0.042 | 3.73 | <0.001 | [0.073, 0.238] |
| Vitamin D supplementation during lactation (receiving or not) |
35.673 | 12.569 | 2.84 | 0.006 | [10.720, 60.625] | |
| Breastfeeding time (months) | 2.225 | 1.076 | 2.07 | 0.041 | [0.089, 4.360] |
a After a diagnosis of the model, data 110 and 51 were removed. b After a diagnosis of the model, the data 2, 32, 37, 46, 55, and 110 were removed. c Adjusted for the average amount of vitamin D supplementation during the dietary record. After a diagnosis of the model, the data 22, 26, 40, 41, 53, 102, and 115 were removed. d Adjusted for vitamin D supplementation during lactation (receiving or not). After diagnosis of the model, the data 4, 32, and 102 were removed. Abbreviations: SE, Standard error.
Disclaimer/Publisher’s Note: The statements, opinions and data contained in all publications are solely those of the individual author(s) and contributor(s) and not of MDPI and/or the editor(s). MDPI and/or the editor(s) disclaim responsibility for any injury to people or property resulting from any ideas, methods, instructions or products referred to in the content. |
© 2023 by the authors. Licensee MDPI, Basel, Switzerland. This article is an open access article distributed under the terms and conditions of the Creative Commons Attribution (CC BY) license (http://creativecommons.org/licenses/by/4.0/).
Copyright: This open access article is published under a Creative Commons CC BY 4.0 license, which permit the free download, distribution, and reuse, provided that the author and preprint are cited in any reuse.


