Submitted:
20 June 2023
Posted:
21 June 2023
Read the latest preprint version here
Abstract
Four decades of snooker rankings are analyzed in terms of prize money distributions. In particular, it is investigated how much these rankings are dominated by the top players, and also by players from the UK. The main conclusions are that (1) with an increasing total amount of available prize money, the rankings are less dominated by the top players, and (2) players from the UK have historically earned a significantly larger share of the available prize money than could reasonably be expected based on the overall percentage of UK players.
Keywords:
snooker
; ranking
; prize money distribution
1. Introduction
There have been many public discussions about issues related to prize money distributions in professional snooker [1], or whether the tour is perhaps too UK-centric. A detailed analysis of snooker prize money rankings is presented here, focusing specifically on (1) how dominated these rankings are by the top players, and (2) the share of UK players in them. Seasonal data over a time range of more than four decades (1980-2023) is considered. These analyses and results aim at providing an objective basis for any further discussions on the mentioned issues.
2. Methods
The data used in the analysis was obtained online from CueTracker [2]. In particular, the prize money rankings at the end of each season starting from the 1980-1981 season up to and including the most recent completed season (2022-2023) were used. For each season, the full list of players who earned any prize money in a professional tournament during that season (ranked from largest to smallest amount) was retrieved. To illustrate, Figure 1 shows the top 10 of the prize money ranking at the end of the 2022-2023 season.
In addition, a list of the total number of professional tournaments held in each season was retrieved. All data analyses were then performed with the R language for statistical computing [3].
3. Results
3.1. Number of tournaments
Figure 2 shows the number of professional tournaments held in each season for the four decades considered. This number fluctuates between 15 and 35, but without any particular trend.
3.2. Total prize money
Figure 3 shows the total amount of prize money earned in each season (combined over all players), in million GBP. There clearly is an overall upward trend, but with two notable exceptions: shortly after the turn of the millennium, and in recent years as a result of lockdowns and other restrictions.
3.3. Number of players
Figure 4 shows the number of players that have earned any prize money in a professional tournament in a given season (no matter how much or little). After a drastic increase in the early 1980s, the number has steadily declined again, but with some fluctuations.
3.4. Player earnings range
Figure 5 shows the average (dots) and range (bars) of prize money earned by individual players in each season. These amounts range from a minimum of 50 GBP to a maximum of just over one million GBP. Note that the vertical axis is on a logarithmic scale: every next value going up along the vertical axis is ten times larger than the previous one. Therefore, although the fluctuations at the low and high ends of the range seem visually similar, in absolute value they are several orders of magnitude larger at the high end. The average amount of prize money earned per player (dots) has increased by about one order of magnitude (from around 5,000 to around 50,000 GBP) over the four decades.
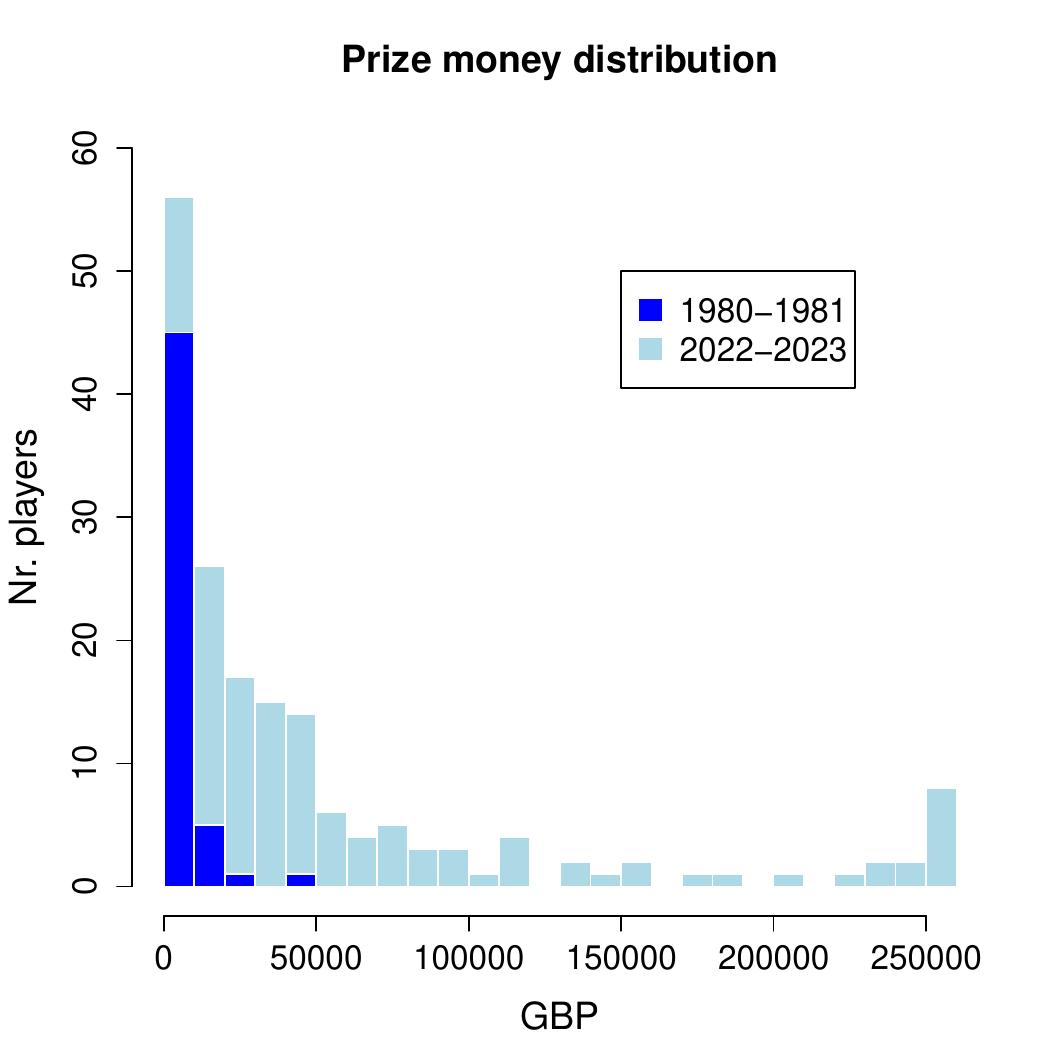
3.5. Prize money distribution
Given the highly skewed distribution of prize money among the players, though, with many players earning very little and a few players earning a large amount, a simple average is unfortunately quite meaningless. Figure 6 shows these skewed distributions in a histogram for the first season (1980-1981) and the last season (2022-2023) considered. The bin width is 10,000 GBP, with the rightmost bar representing the eight players earning more than 250,000 GBP during the most recent season (see the image of the top ten in the data section above). Note that all presented data is for actual prize money earned, not including the 20,000 GBP minimum income guarantee introduced in the last season.
3.6. 80% prize money rank
With such a skewed distribution, a more informative statistic (rather than a simple average) is a measure of how much a prize money ranking is dominated by the top players. One such measure is how many of the top players it takes to earn 80% of the total prize money, referred to here as the “80% prize money rank”. First express each player’s earnings as a percentage of the total, and then add up these percentages, starting at rank 1 and going down the ranking (i.e., up in rank number), until this subtotal becomes equal to or larger than 80%. Table 1 shows a simple example with just ten players, where the 80% prize money rank (indicated in blue) is equal to four.
Figure 7 shows these 80% prize money ranks (vertical axis) against the total amount of prize money (horizontal axis) for each season. Clearly there is an upward trend: if the total amount of prize money increases, the 80% prize money rank becomes larger (i.e., the ranking is less dominated by the top players). For example, if the total prize money is less than one million GBP, it takes less than the top 20 players to earn 80% of it. With a total amount of six million GBP in prize money, though, it may take more than the top 50 to earn 80% of it. However, this effect seems to level out once the total amount of prize money becomes more than about nine or ten million GBP.
Since the number of players that earned any prize money is not the same in each season, it may be more informative to express the 80% prize money rank relative to the total number of players in the ranking. In other words, rather than using the absolute 80% prize money rank, it is calculated as a percentage of the total length of the ranking list. This relative 80% prize money rank is shown against the total prize money in Figure 8.
The result is very similar, except for the small cluster of points on the left (with less than 2 million GBP total prize money). These data points are from the first half of the 1980s, when the total number of players was still quite small. Otherwise, there is again a very clear increasing trend with increasing total prize money, which seems to level off once the total prize money becomes about 10 million GBP or more.
3.7. UK players share
Finally, Figure 9 shows the share of UK players (i.e., players from England, Wales, Scotland, or Northern Ireland) in professional snooker. The dark blue line represents the percentage of UK players among all the players who earned any prize money in a given season. This percentage fluctuates between 50% and 90%, and is currently around 65%. The light blue line represents the percentage of the total amount of prize money that was earned by UK players. This percentage fluctuates between 70% and 90%, but with a slowly decreasing trend since the turn of the millennium.
As Figure 9 seems to indicate, the share of prize money earned by UK players is generally larger than the percentage of UK players, as the light-blue line is mostly above the dark-blue line. Figure 10 shows this more clearly, where the UK players prize money share (in percentage) is plotted against the corresponding percentage of UK players in each season. The diagonal line indicates where they would be equal.
Clearly, the majority of points is to the left of this diagonal line, where the share in prize money is indeed larger than the percentage of players. Only a few points are to the right of the diagonal line, and mostly by a relatively small distance.
The average share in prize money earned by UK players (over all seasons) is 81%, while the average percentage of UK players is 74%. A t-test [4] on the hypothesis that these means are equal results in a p-value of 0.0001, and can thus be rejected with full confidence. So, the average UK share in prize money is indeed significantly larger than the average percentage of UK players. In other words, historically UK players have earned a significantly larger share of the available prize money than what could be reasonably expected given the percentage of UK players among all players.
4. Conclusions
There is no discernible trend over time in the number of tournaments per season, but there is a fairly steady decline in the number of players since the rapid initial increase during the 1980s. With a clear and significant overall increase in total amount of prize money per season, this means that the average amount of prize money both per tournament and per player has increased. In fact, the average amount of prize money earned per player in one season has increased by about one order of magnitude, from around 5,000 GBP to around 50,000 GBP.
However, given the highly skewed distribution of prize money among the players, a simple average is not very meaningful. A more informative measure is the 80% prize money ranking, which indicates how much a ranking is dominated by the top players. Clearly, the 80% prize money ranking has increased with an increasing total amount of prize money, at least up to a certain point. In other words, with an increasing amount of total prize money, the lower-ranked players are able to earn an increasingly larger share of this total amount. A similar conclusion was already drawn earlier [5], but from a mathematically more complicated analysis. Here, a more straightforward and easier to understand analysis has been presented, and on a more complete data set.
Finally, the snooker tour is still mostly dominated by UK players, both in terms of the number of players (50-90%) and their share in the prize money earned (70-90%), but with a declining trend in the latter. Moreover, their share in prize money is significantly larger than what could be expected given the percentage of UK players. Although it is not immediately obvious what an expected or “fair” percentage would be, it may be insightful to compare these statistics with for example badminton, another individual sport that was originally brought over from British India and then further developed into its modern form in the UK. Although snooker shares a similar history in that respect [6], badminton seems to have become much more internationalized.
Hopefully these analyses and results can be helpful in any future discussions about prize money distributions in snooker, or whether the tour is too UK-centric or not, by providing some solid and relevant statistics over the past four decades related to these issues.
Funding
This research received no external funding.
Acknowledgments
Thanks to the many professional snooker players who provide regular inspiration and entertainment, and occasional controversial topics for discussion...
Conflicts of Interest
The author declares no conflict of interest.
References
- Hendon, D. The big snooker debate that will not go away: prize money distribution in a sport that rewards excellence. Eurosport 2022. Available online: https://eurosport.com/snooker/the-great-snooker-debate-that-will-not-go-away-prize-money-distribution-in-a-sport-that-rewards-exce_sto8855369/story.shtml.
- Florax, R. CueTracker. 2023. Available online: https://cuetracker.net.
- R Core Team. R: A Language and Environment for Statistical Computing. 2022. Available online: https://R-project.org.
- Kalpić, D.; Hlupić, N.; Lovrić, M. Student’s t-tests. International Encyclopedi of Statistical Science; Lovrić, M., Ed. Springer, 2011.
- Hordijk, W. Snooker statistics and Zipf’s law. Stats 2022, 5, 985–992. [Google Scholar] [CrossRef]
- Everton, C. The History of Snooker and Billiards; Partridge Press, 1986.
Figure 1.
The top 10 of the 2022-2023 prize money ranking. Source: CueTracker.
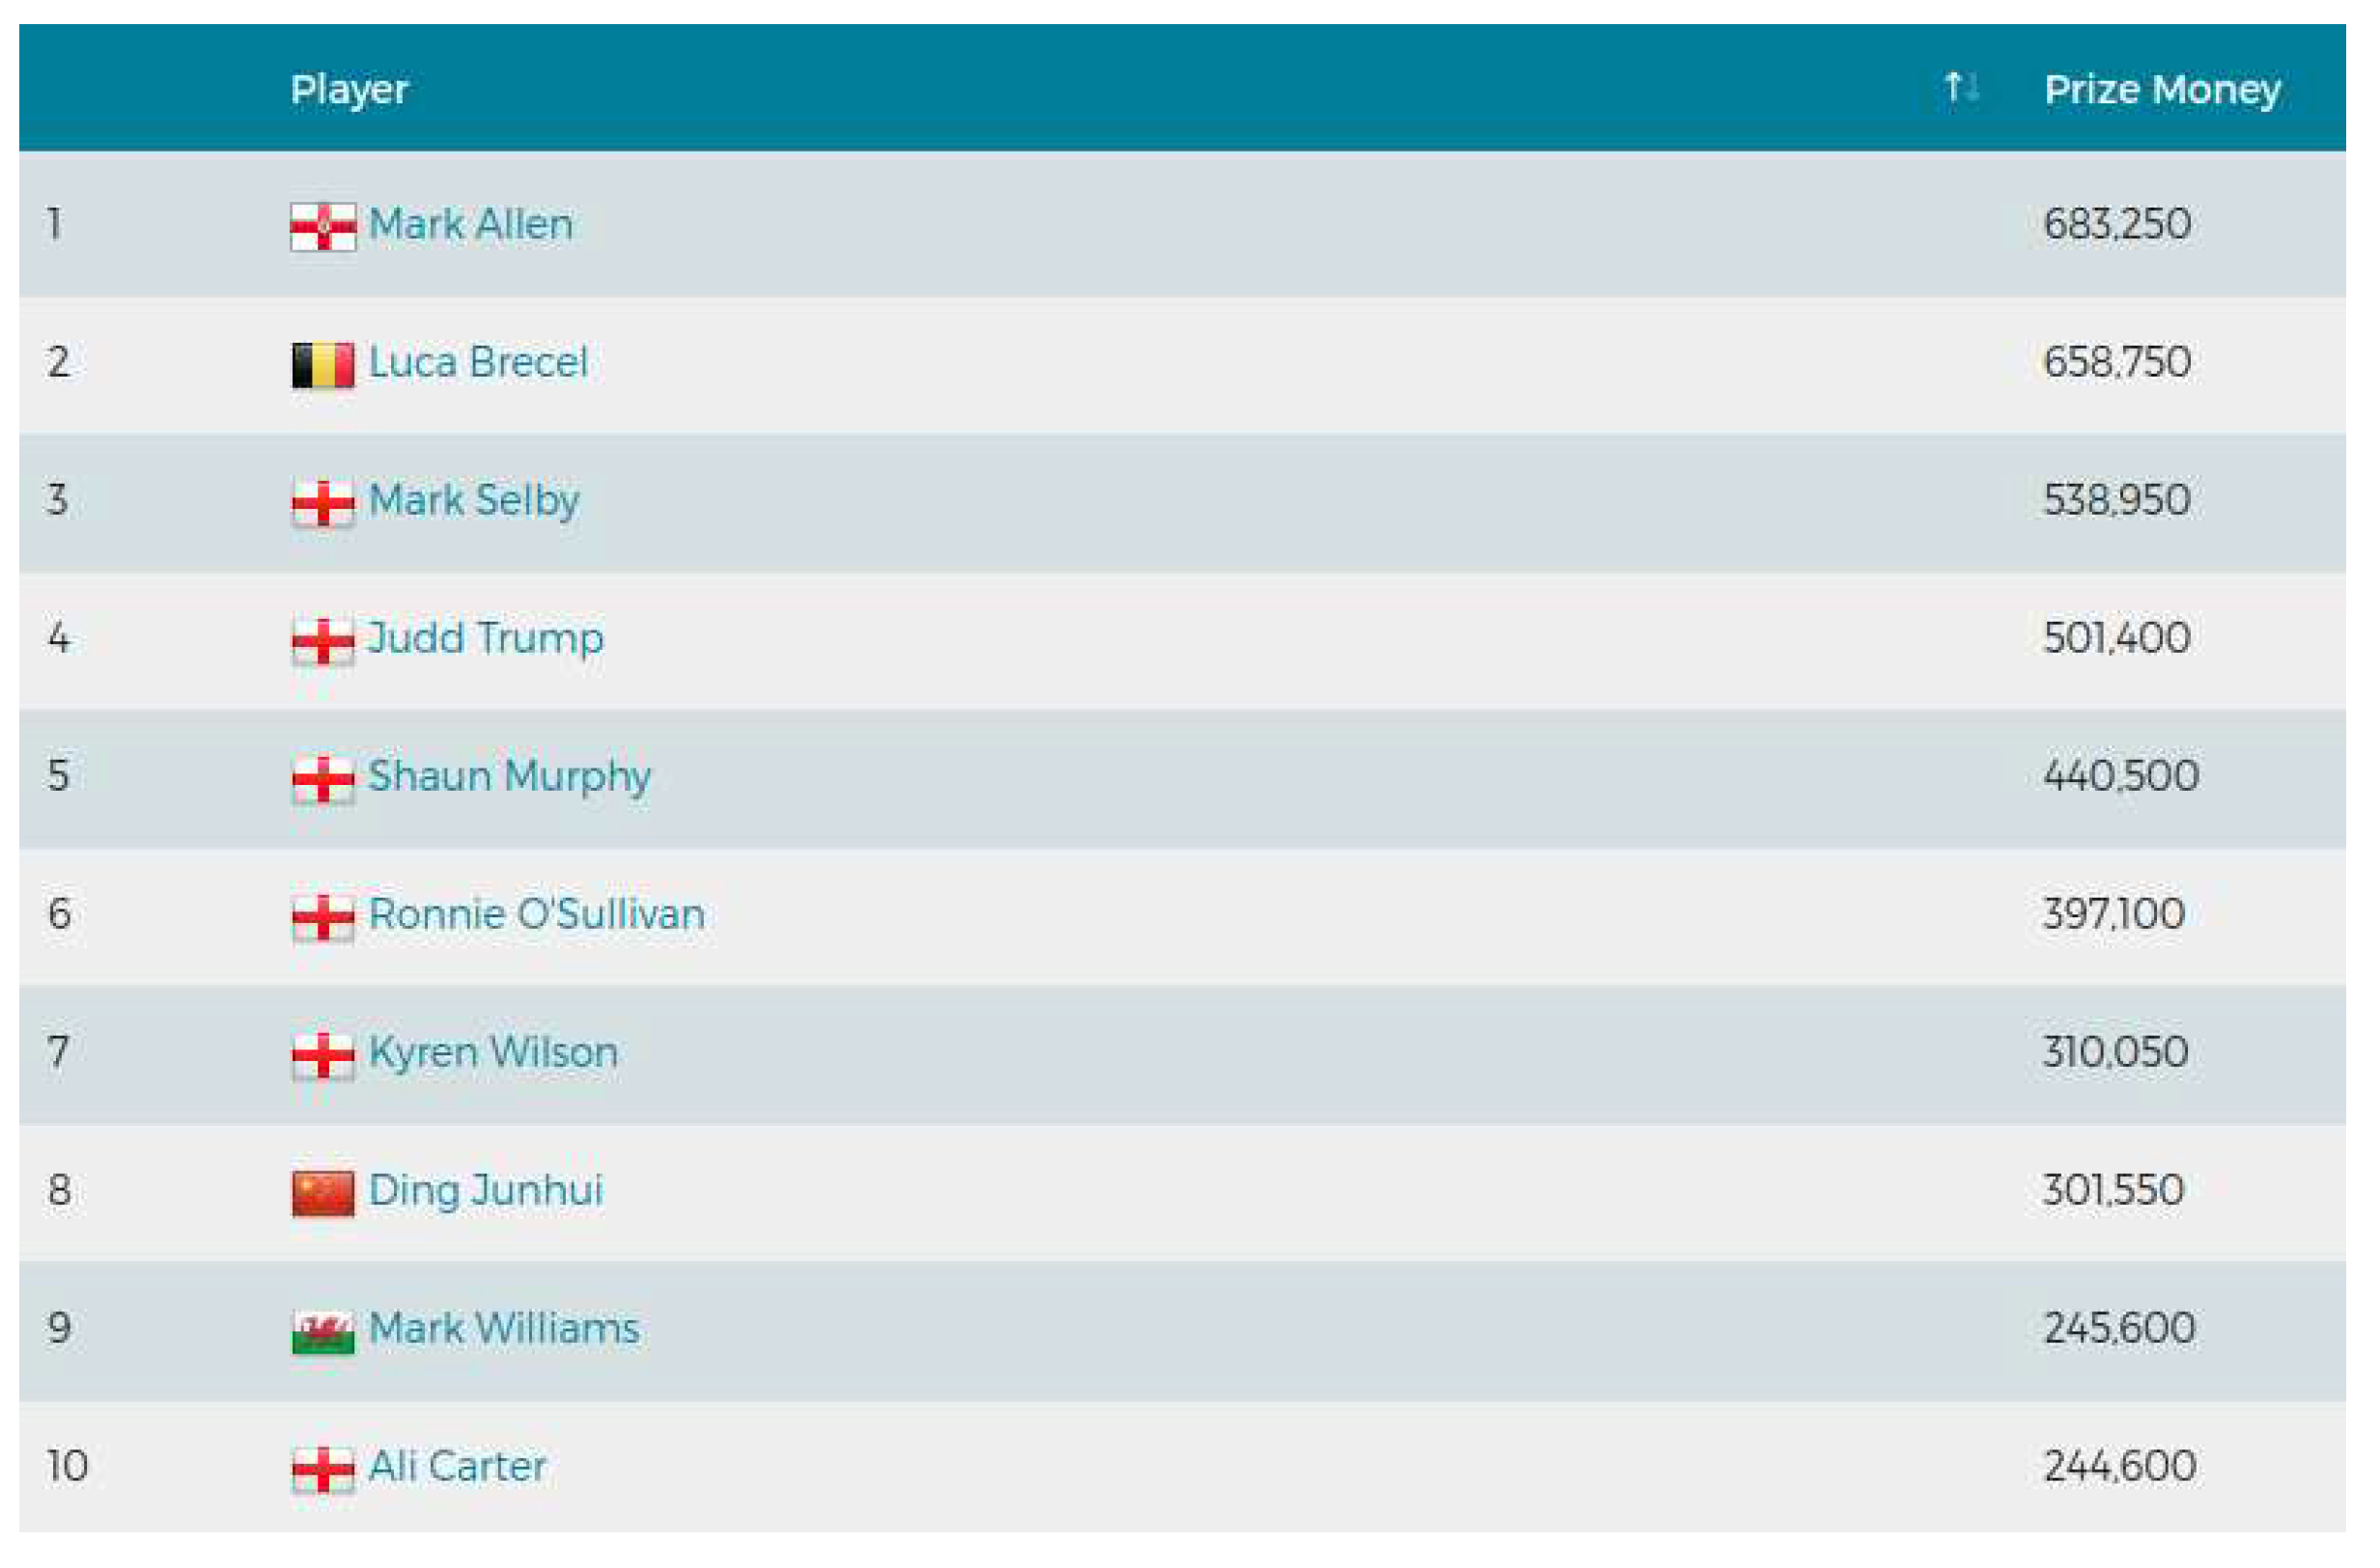
Figure 2.
The number of professional tournaments held in each season.
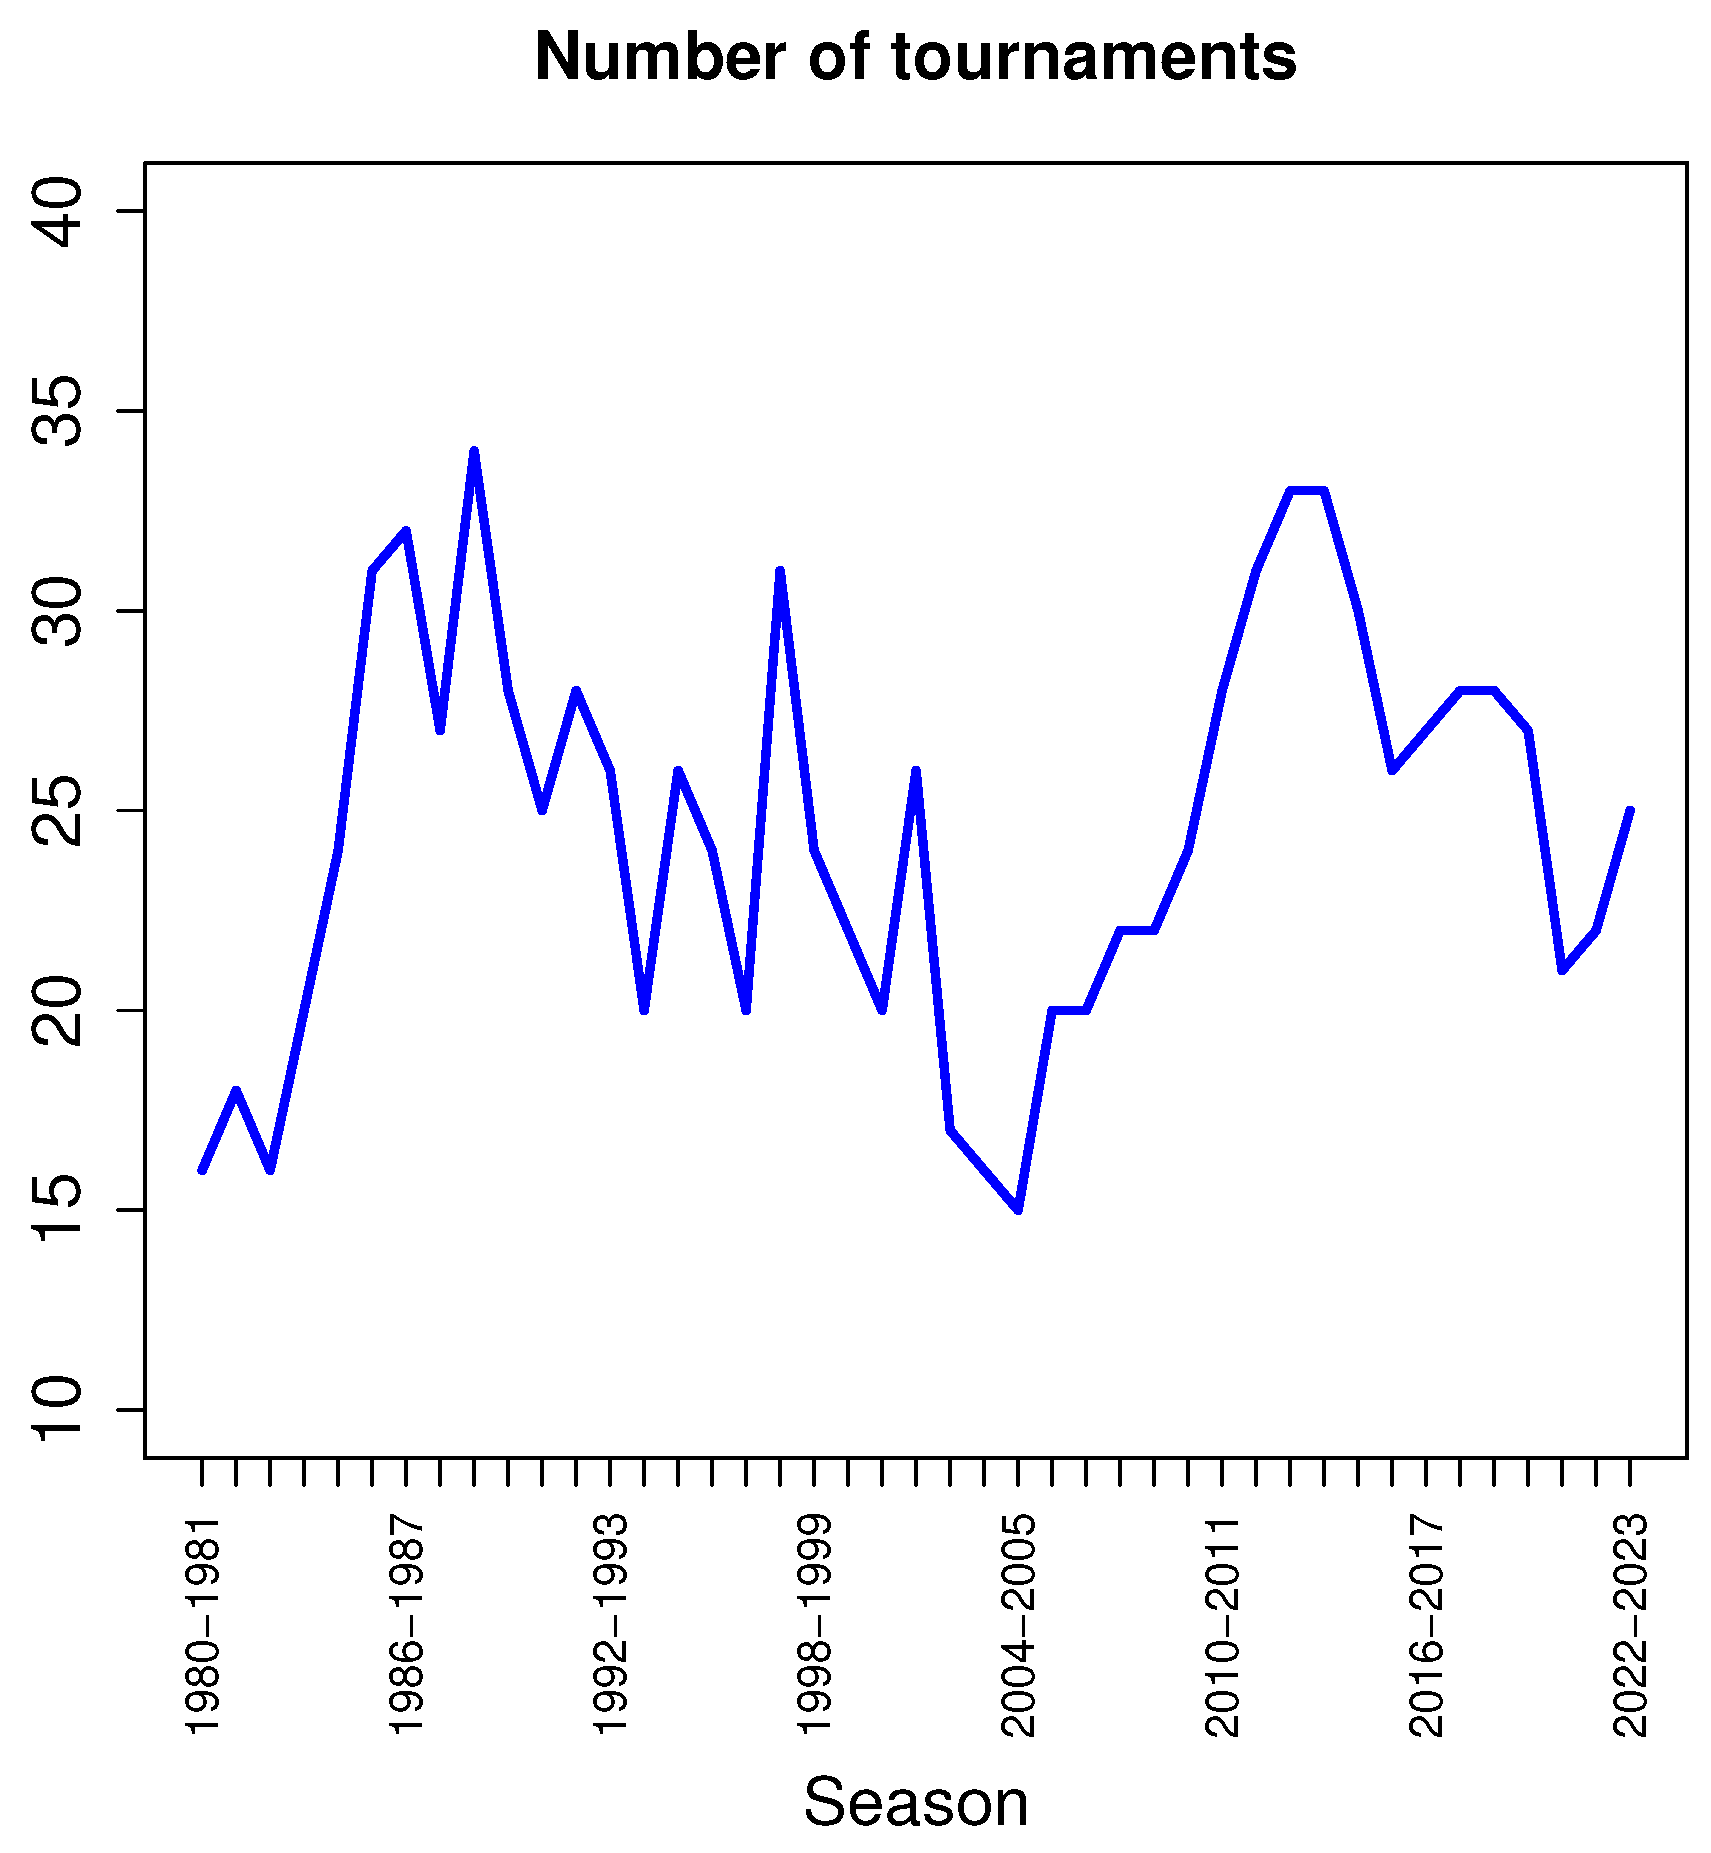
Figure 3.
The total amount of prize money in each season.
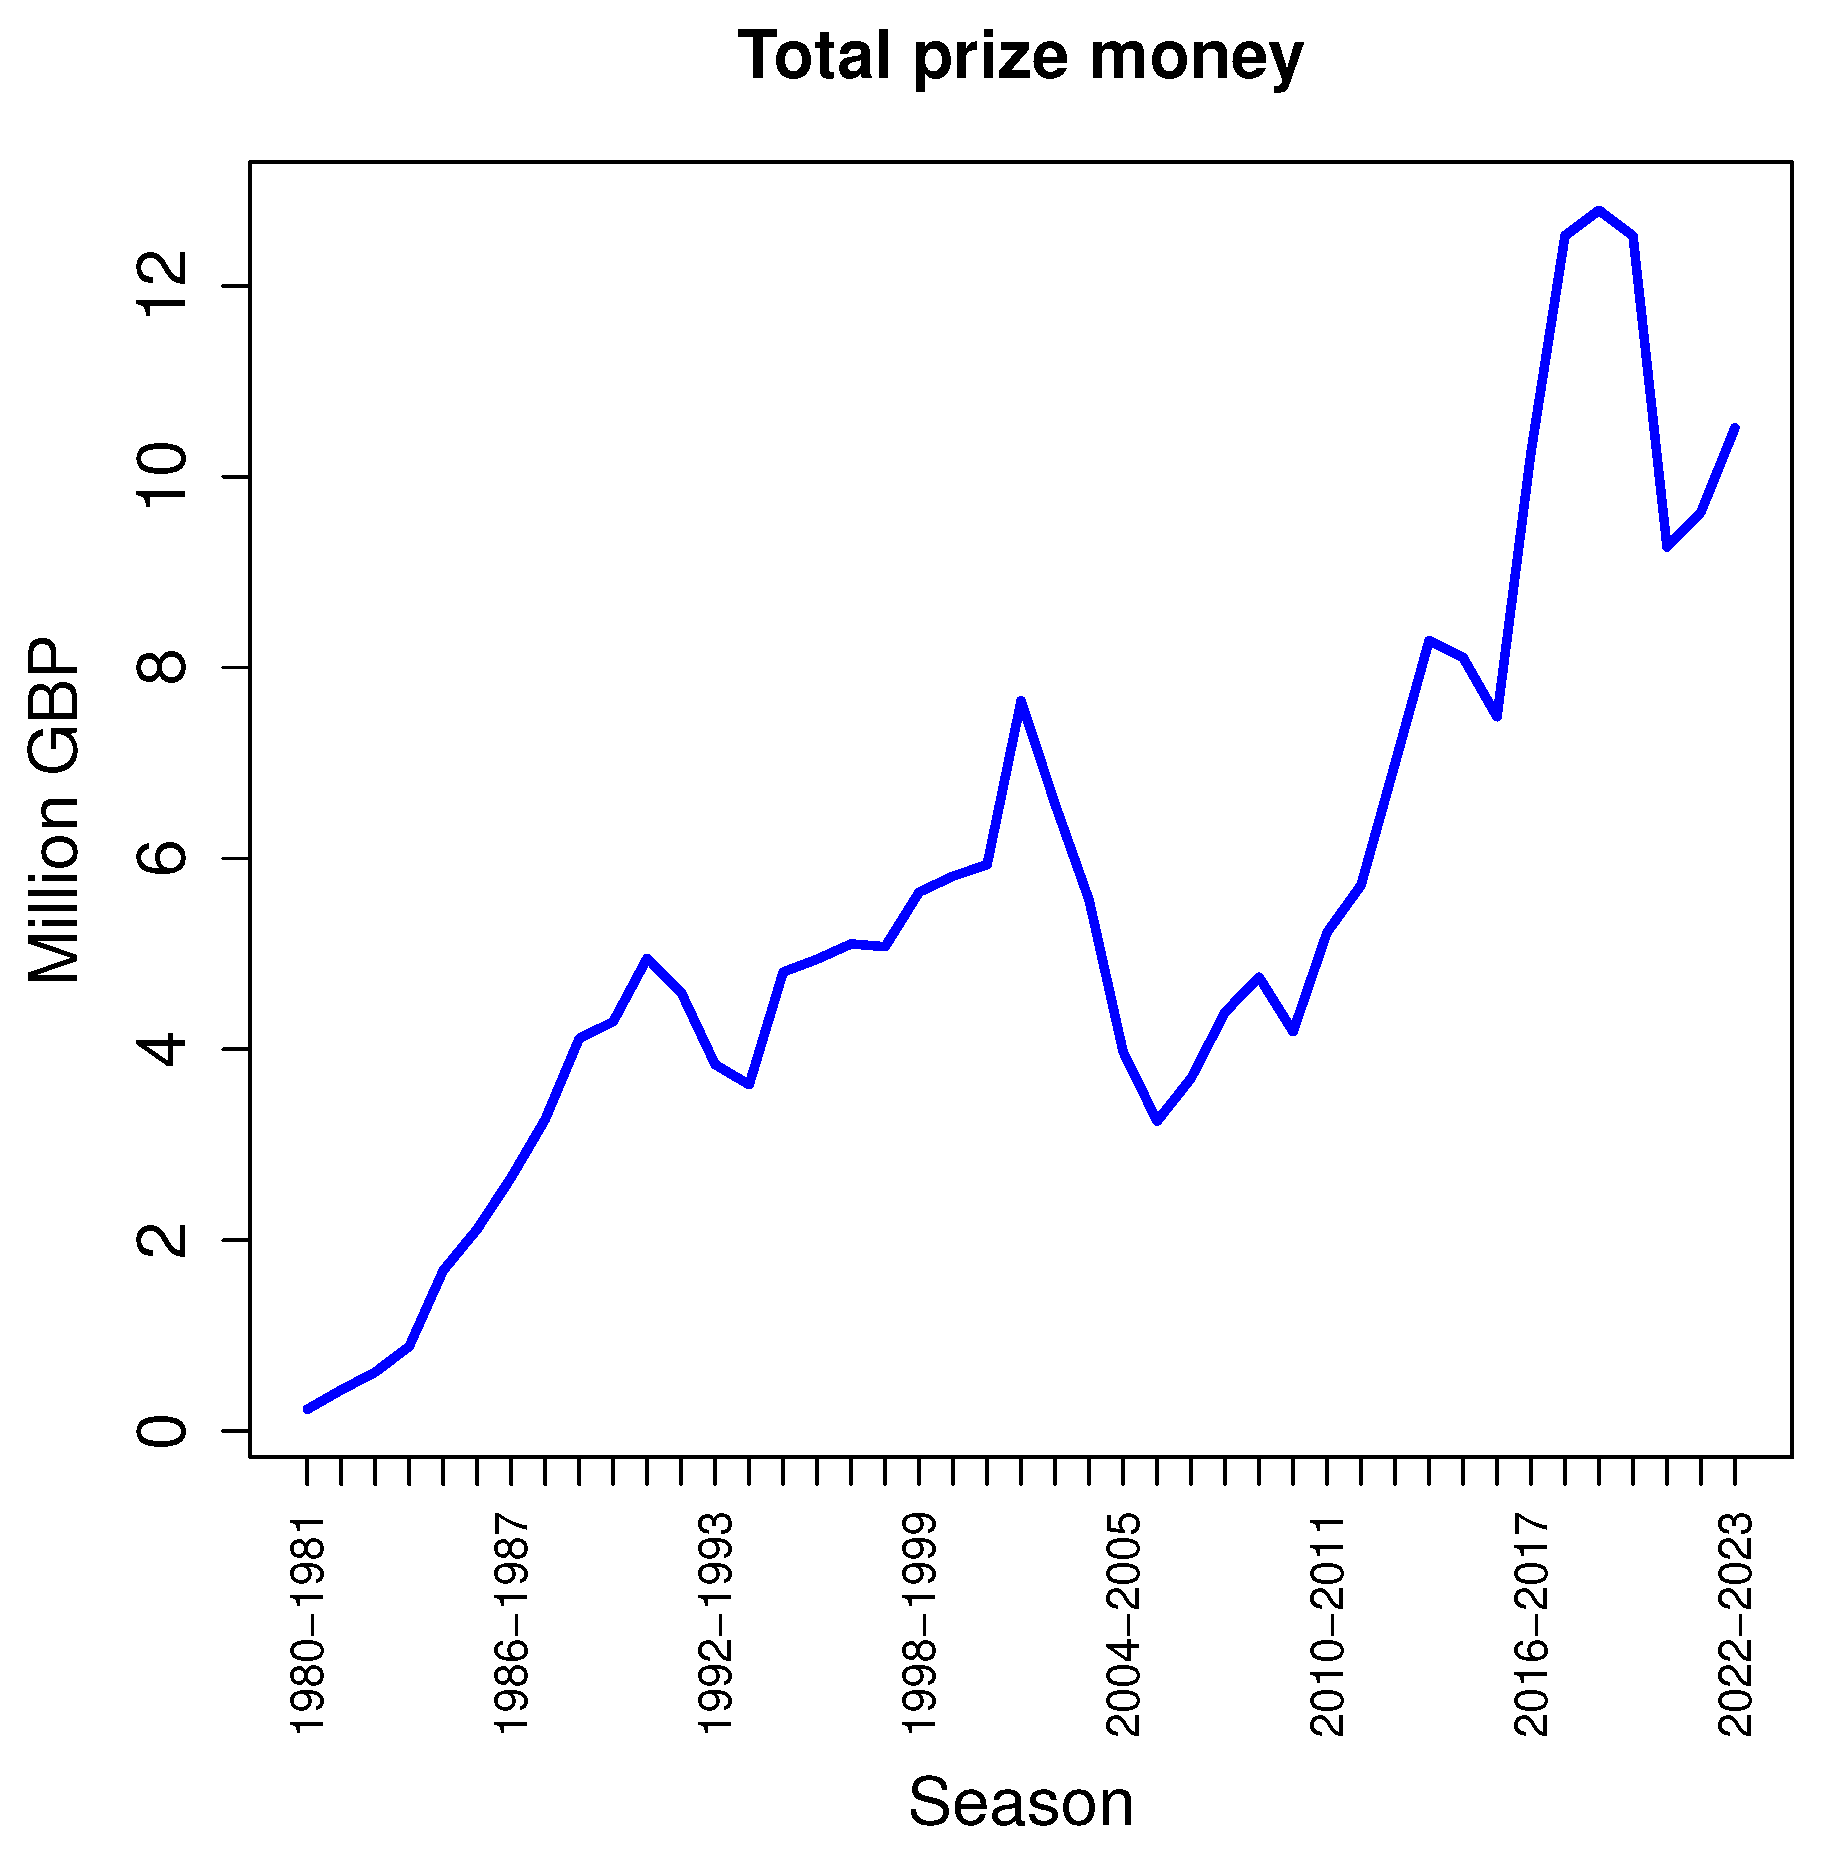
Figure 4.
The number of players in each season.
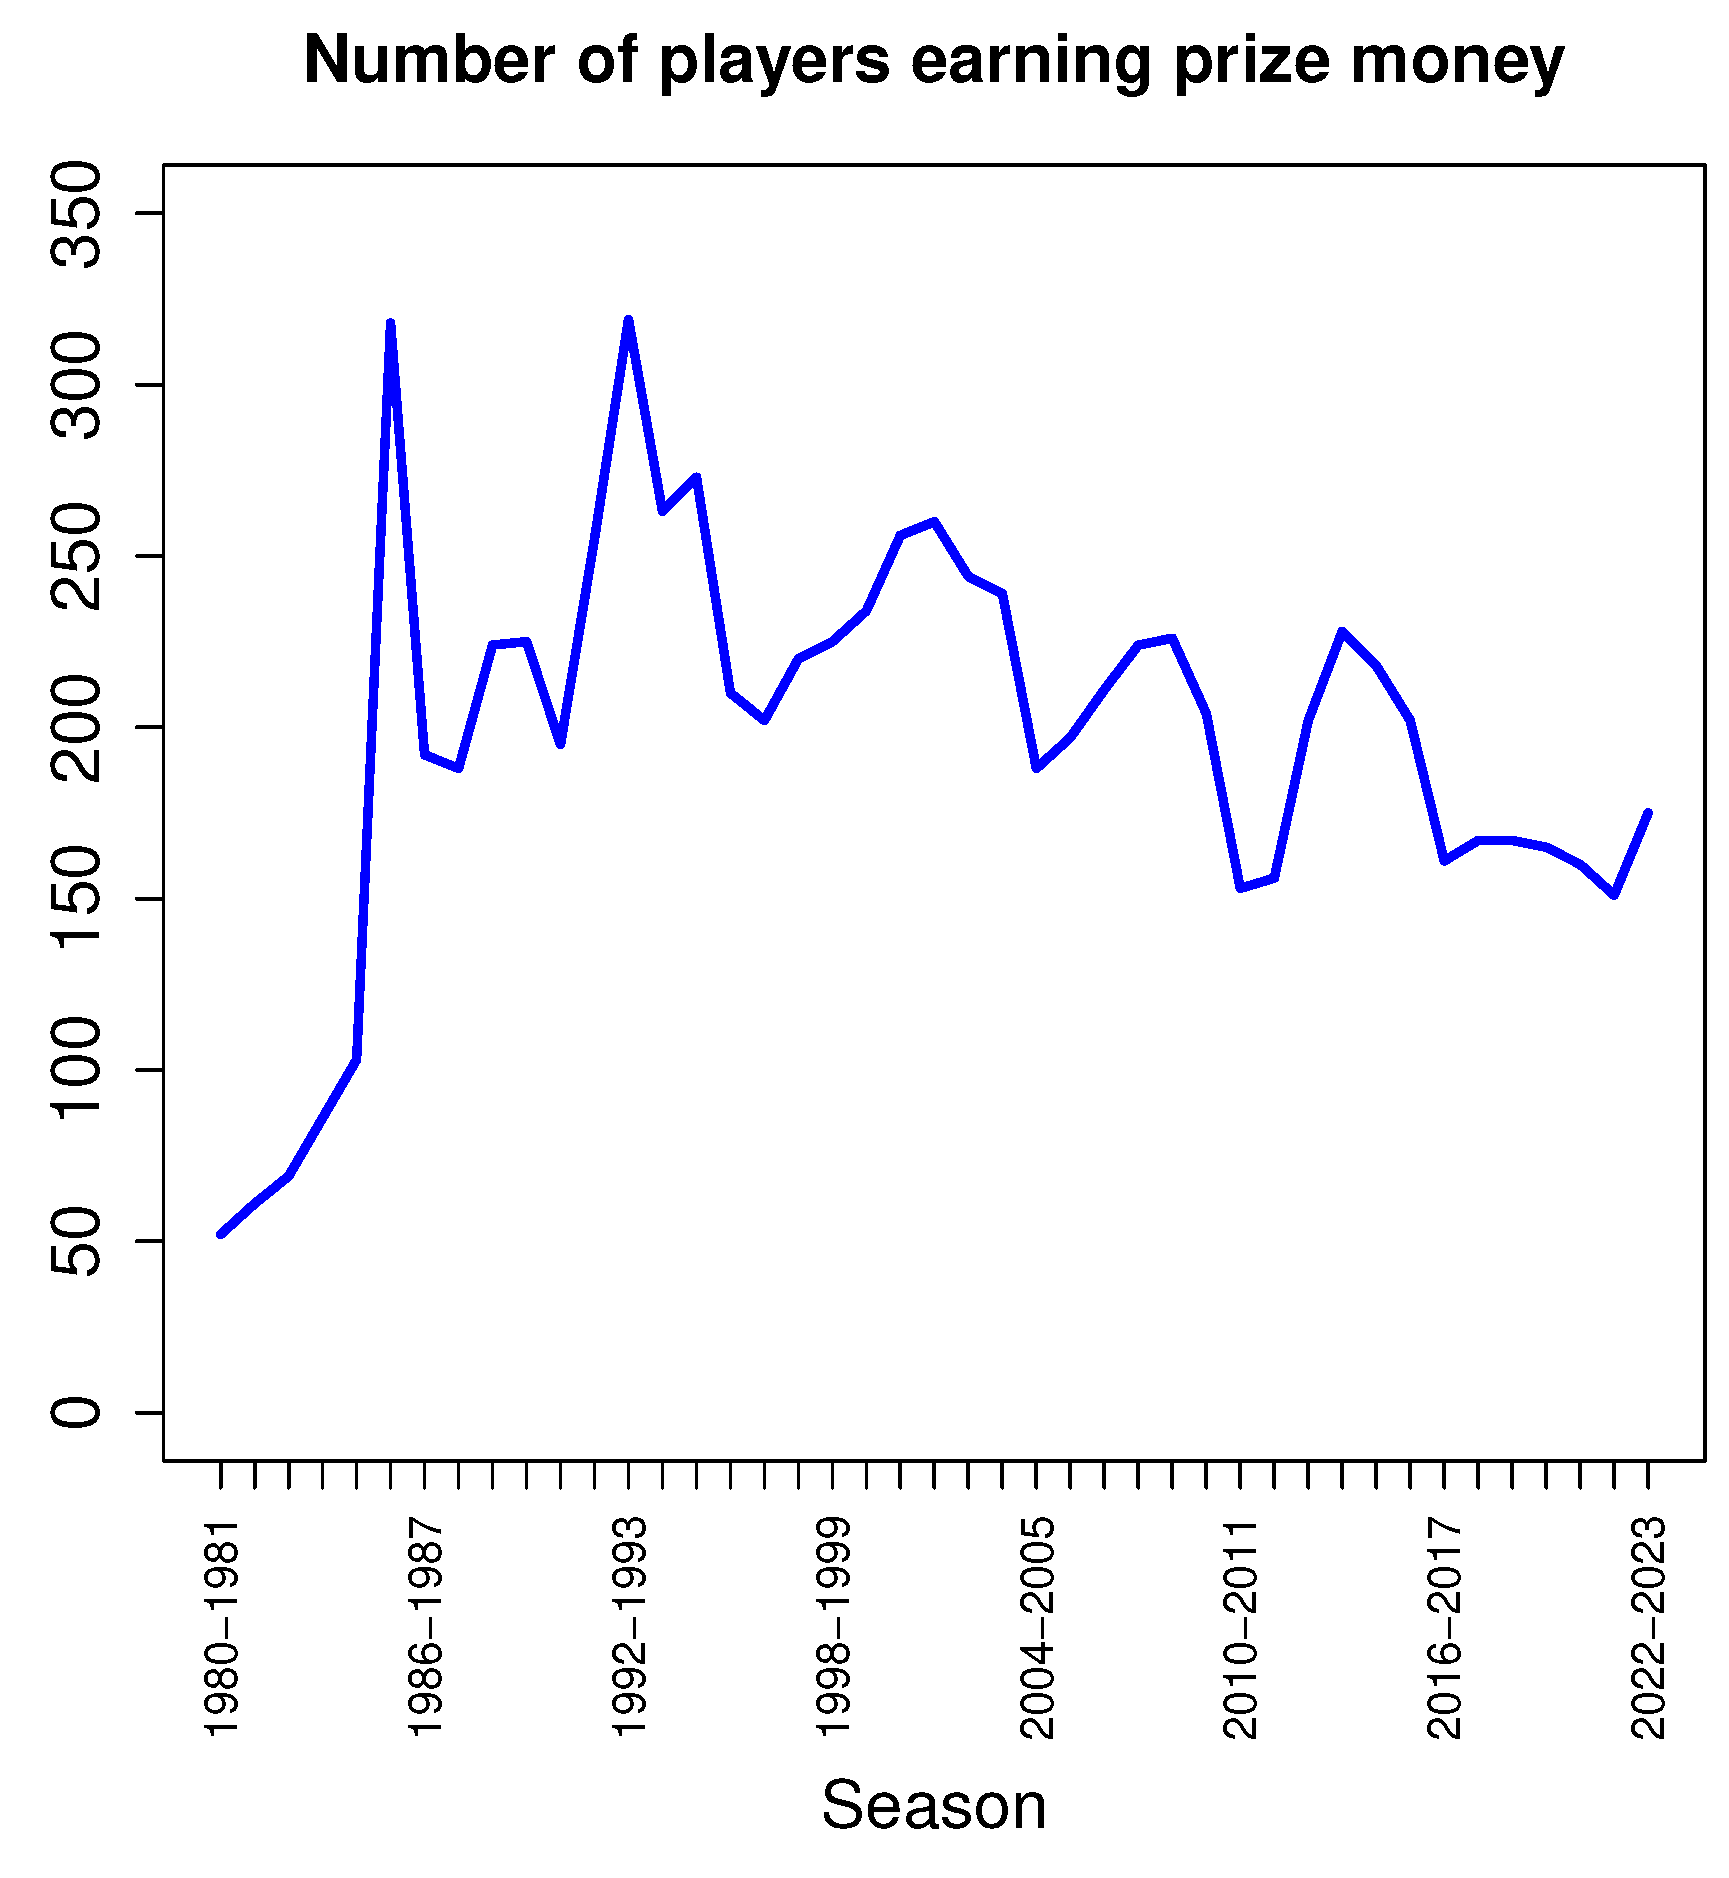
Figure 5.
The range of player earnings in each season.
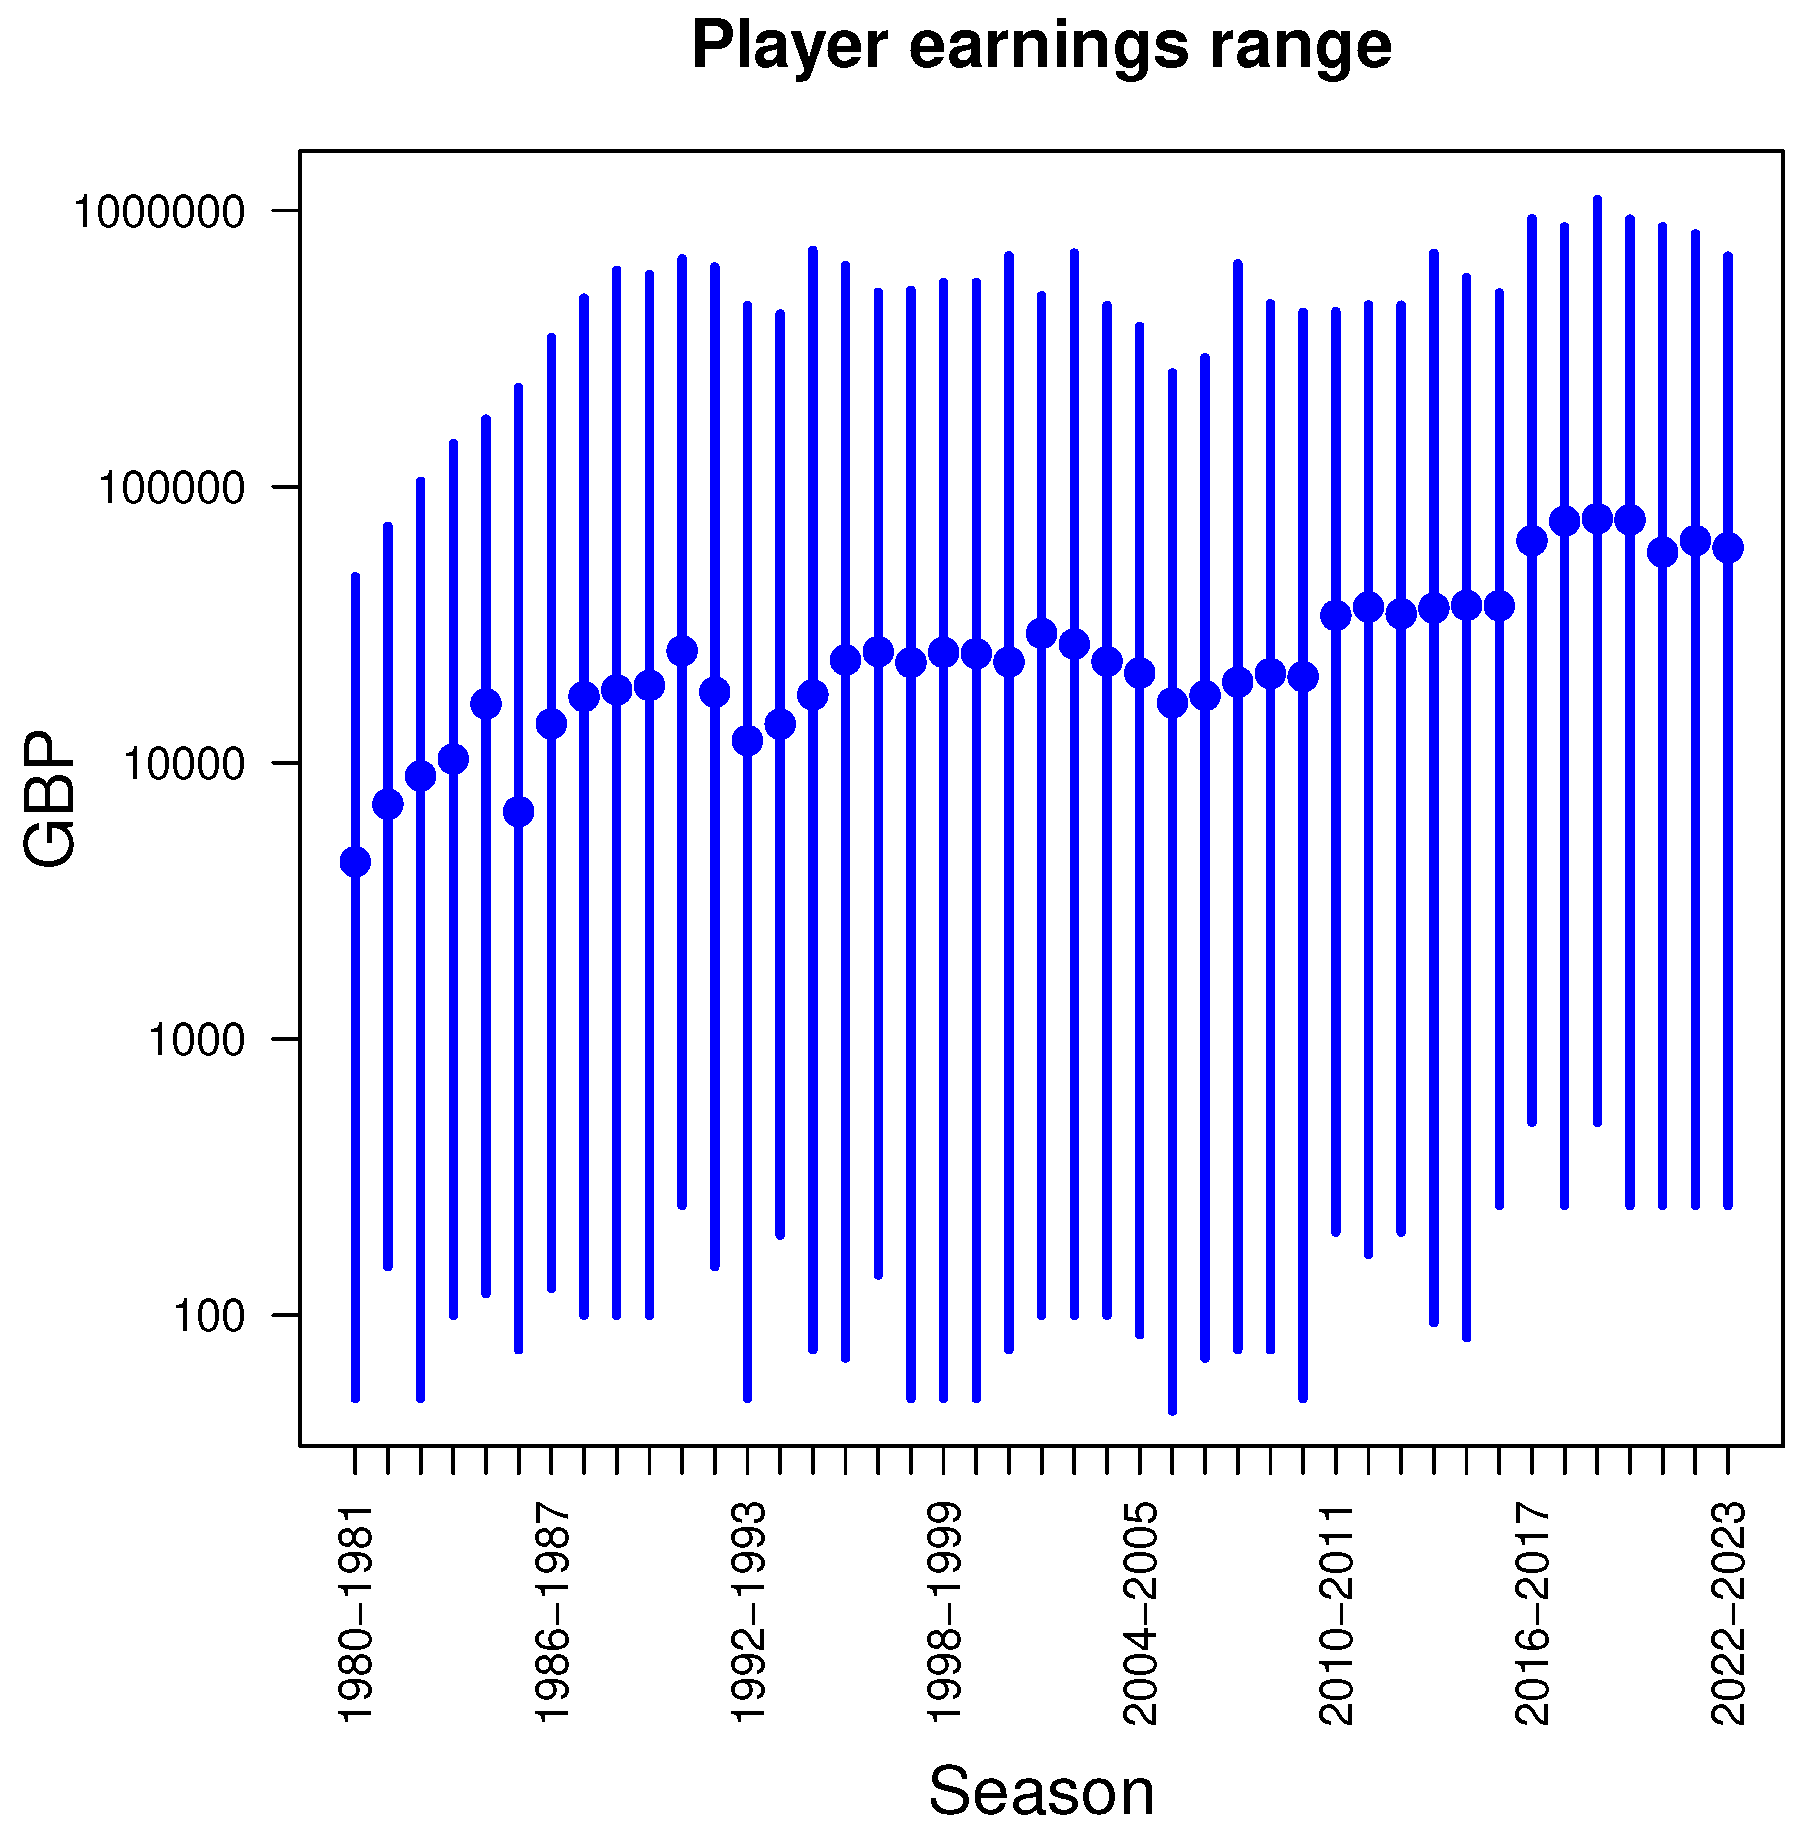
Figure 6.
The prize money distribution for the first and last seasons considered.
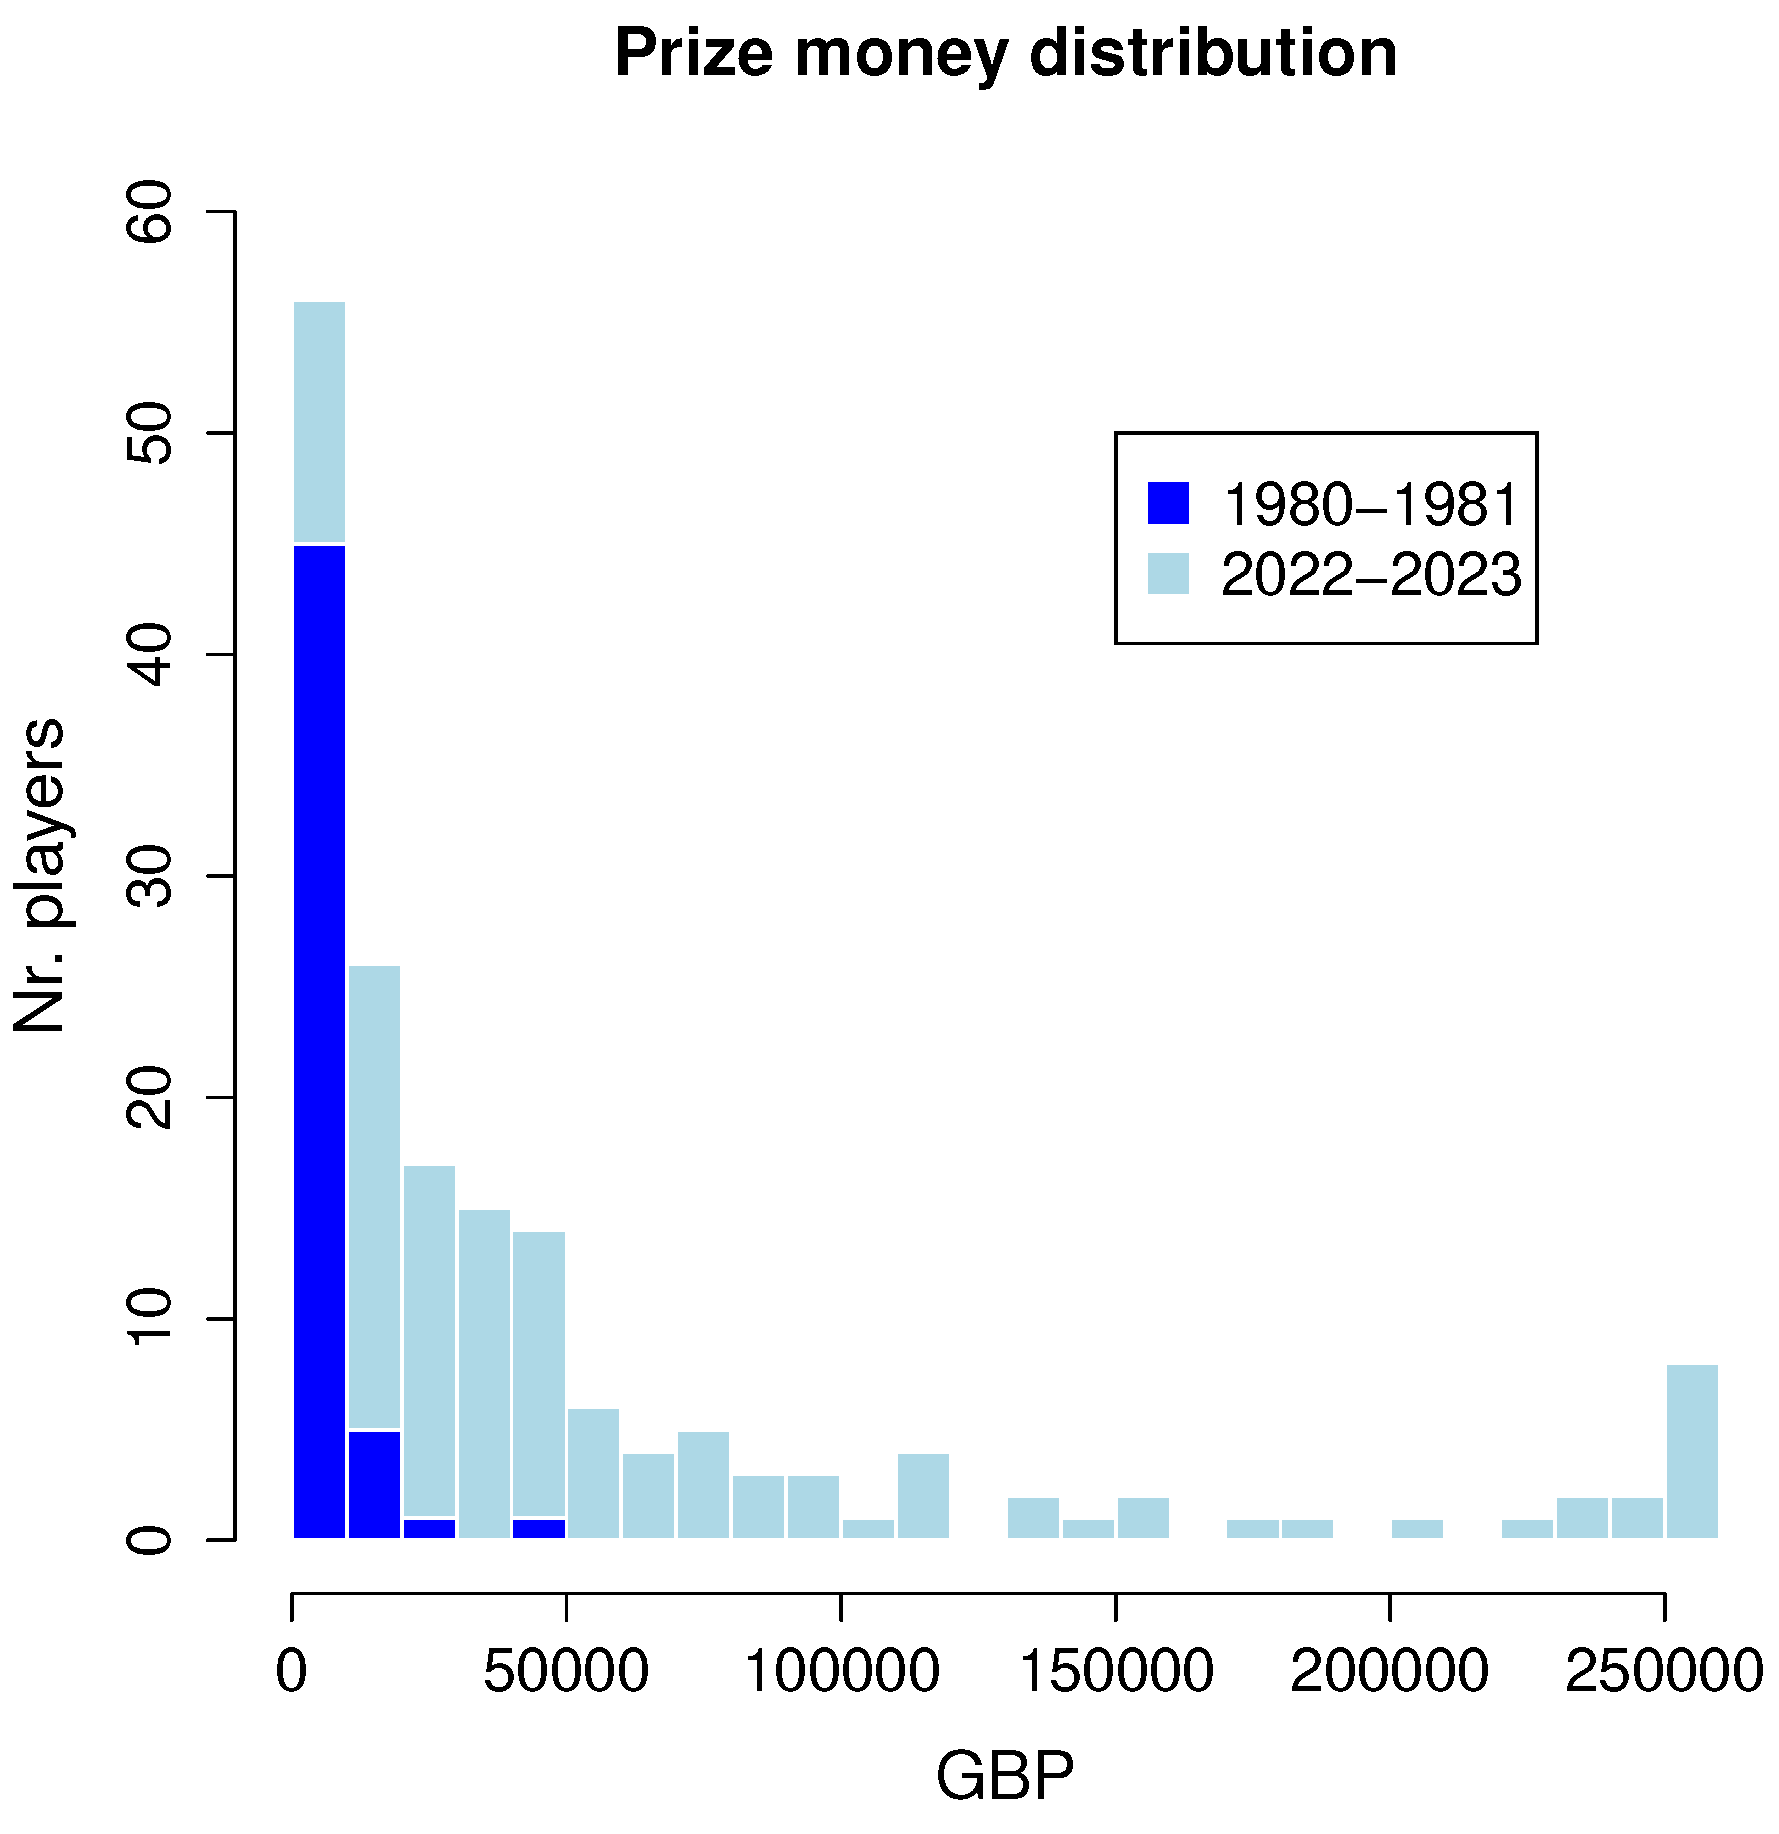
Figure 7.
The 80% ranks against the total amount of prize money.
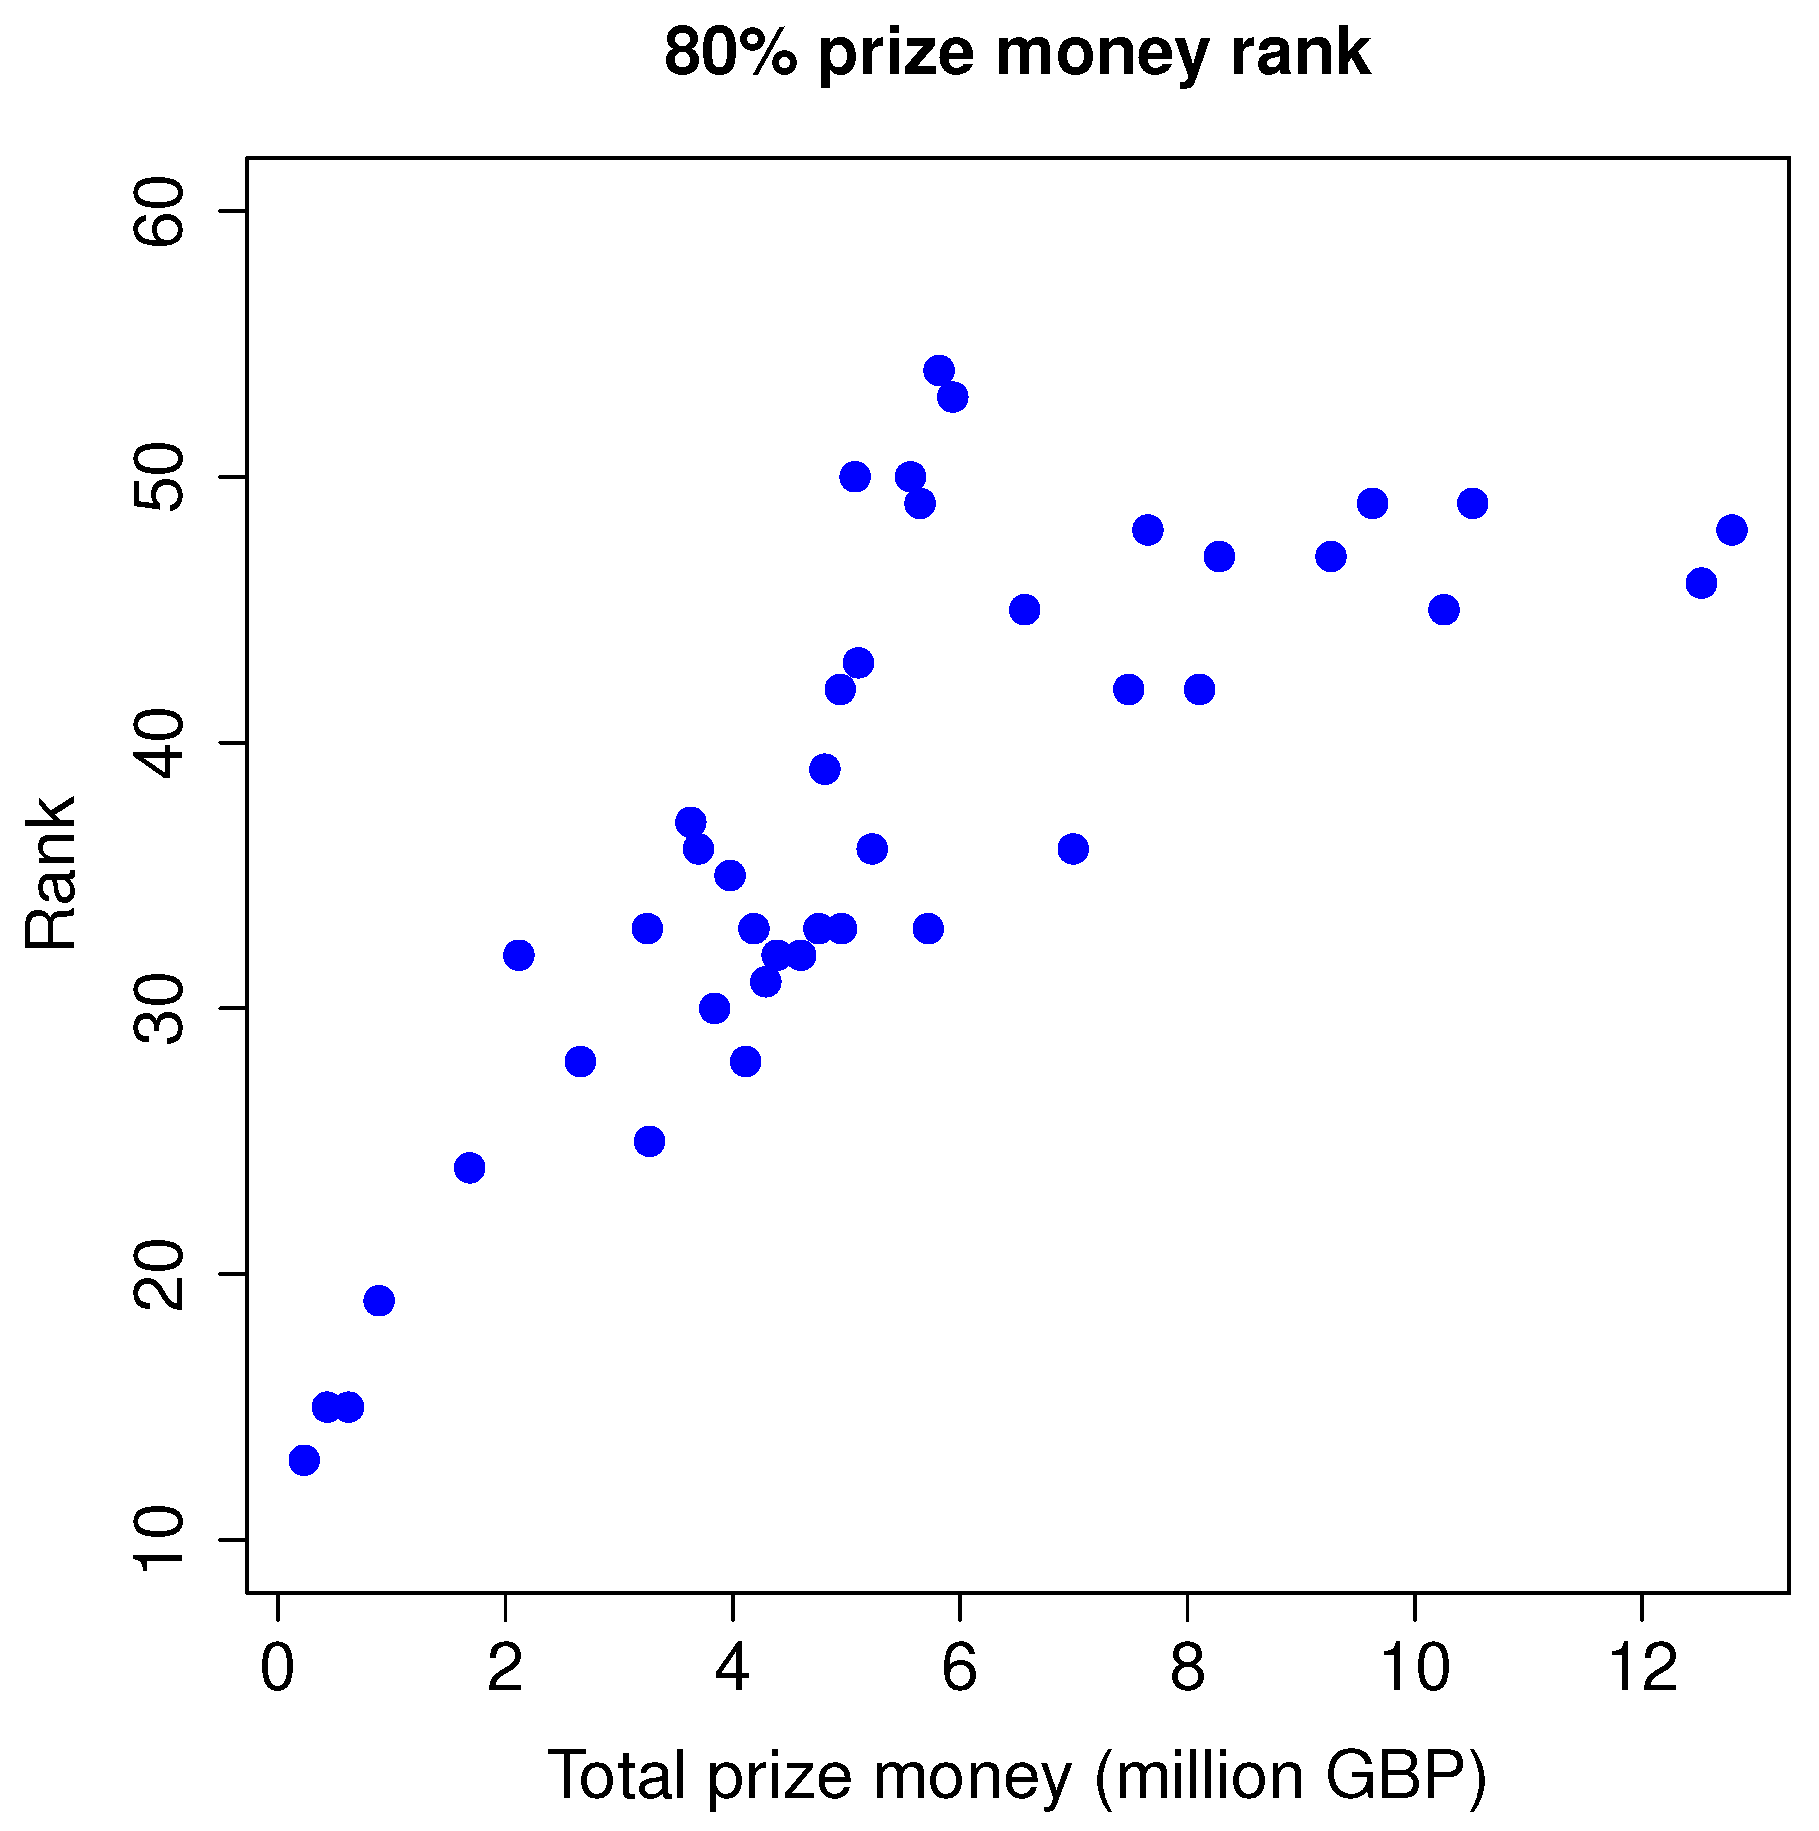
Figure 8.
The relative 80% ranks against the total amount of prize money.
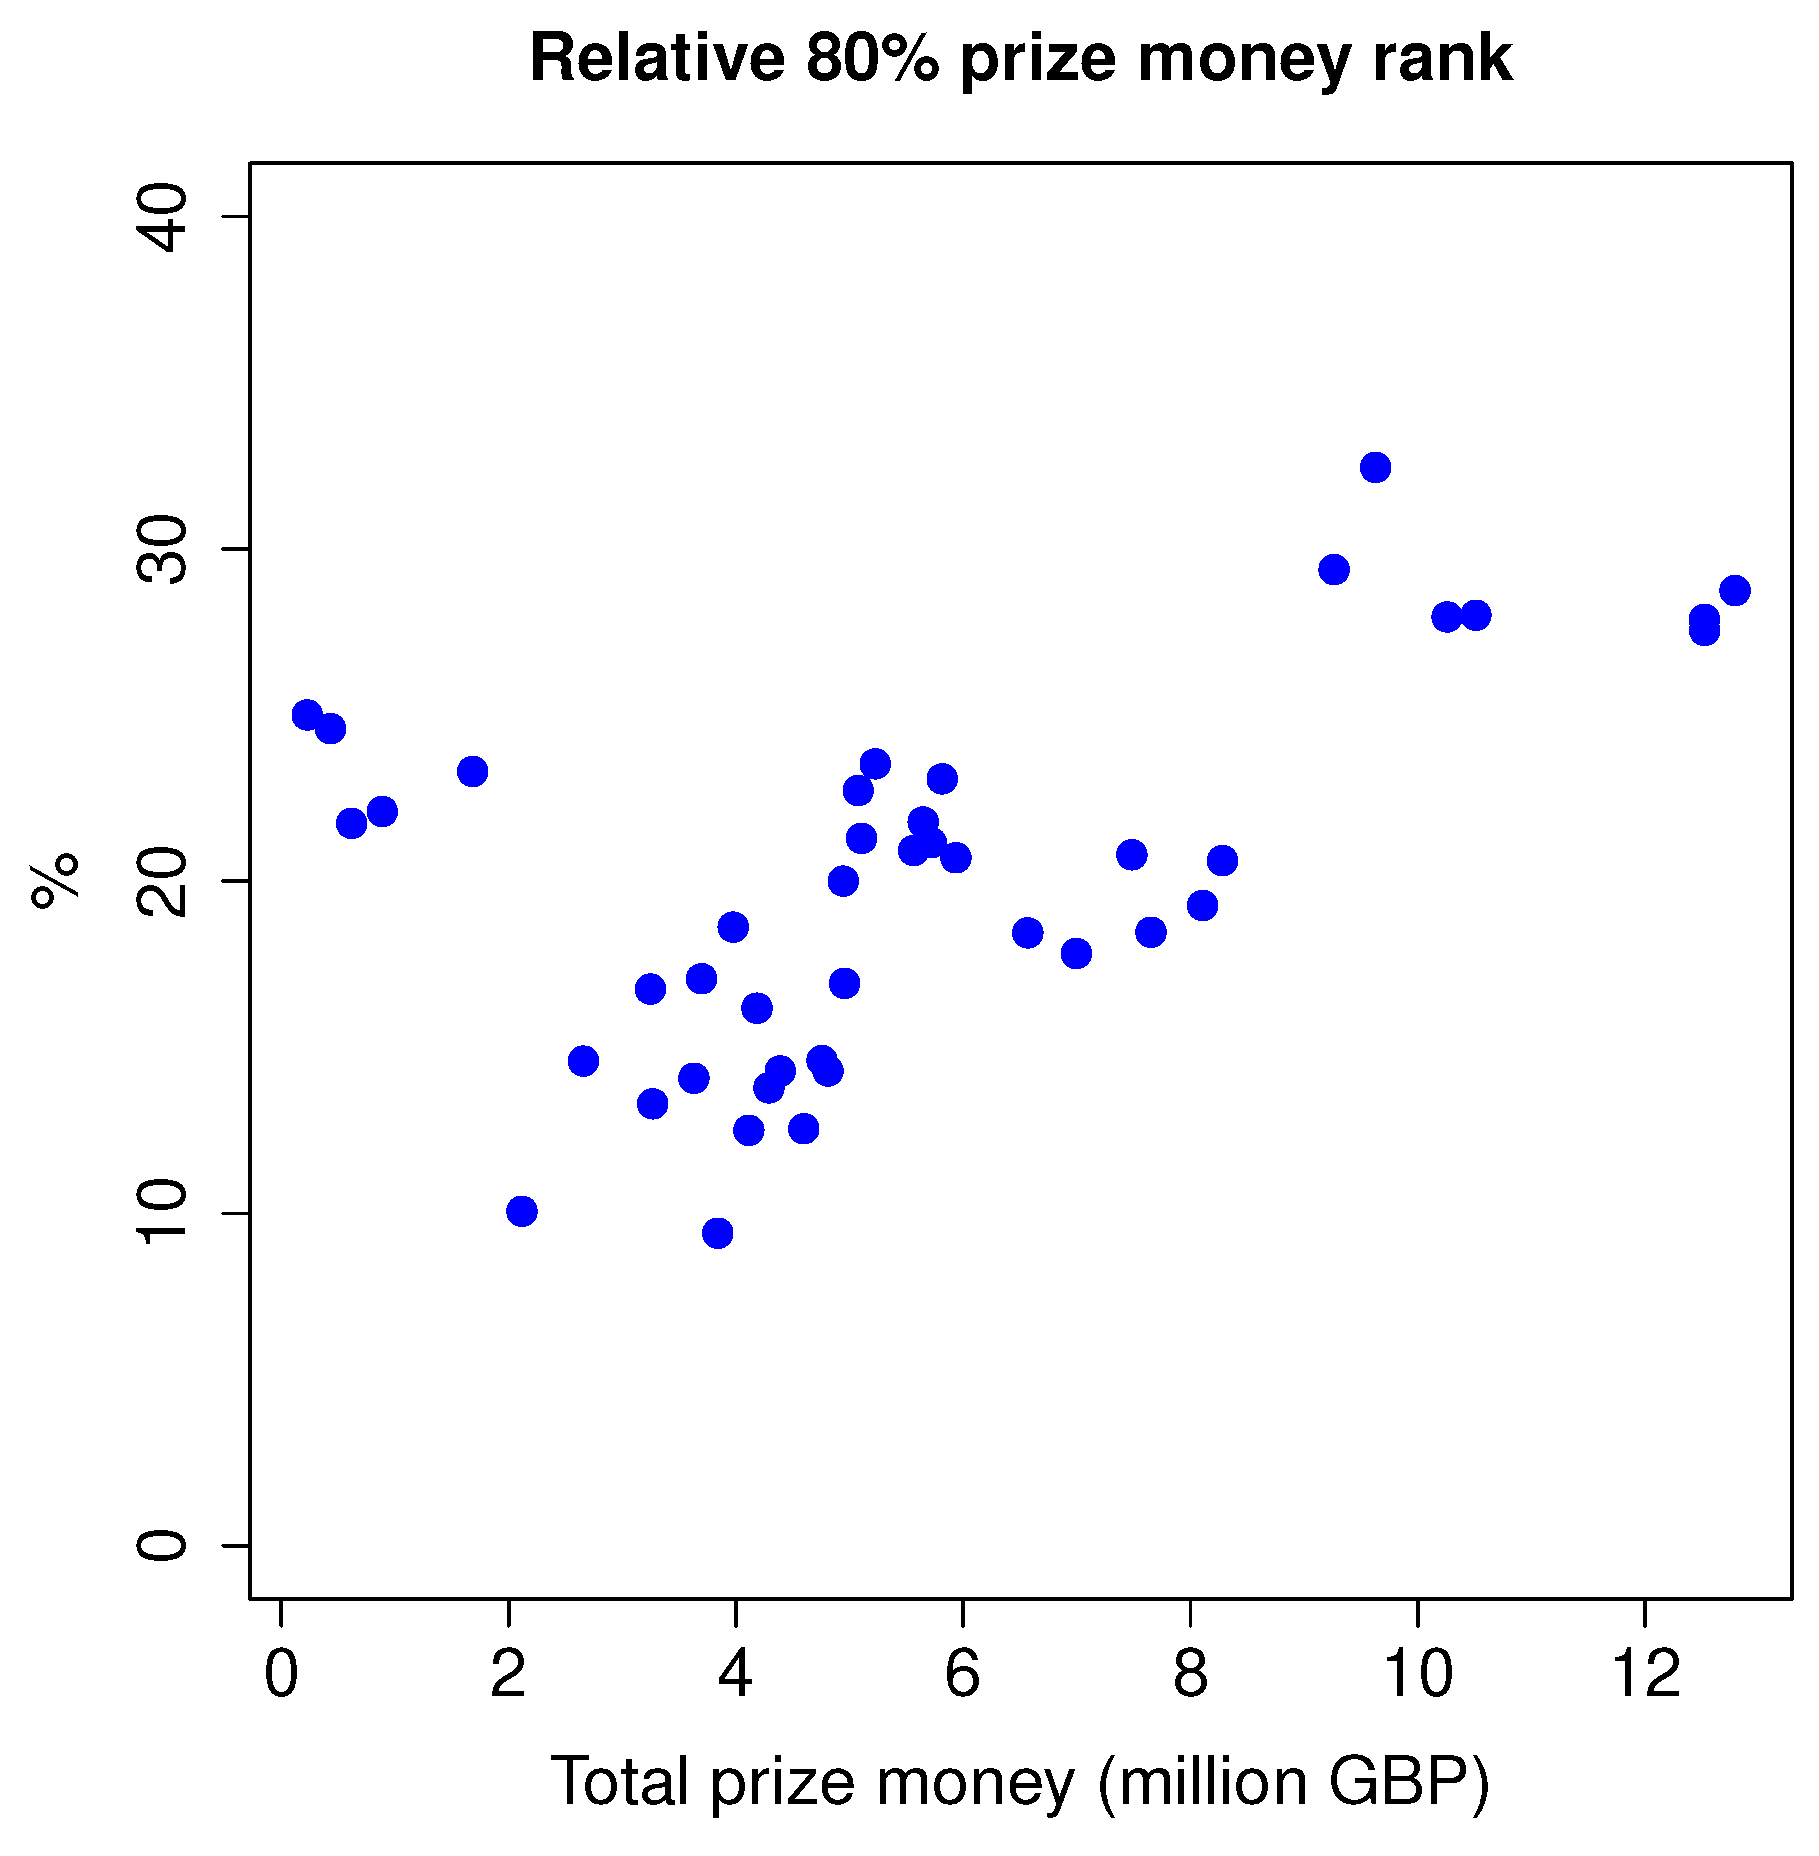
Figure 9.
The share of UK players in prize money and total number of players.
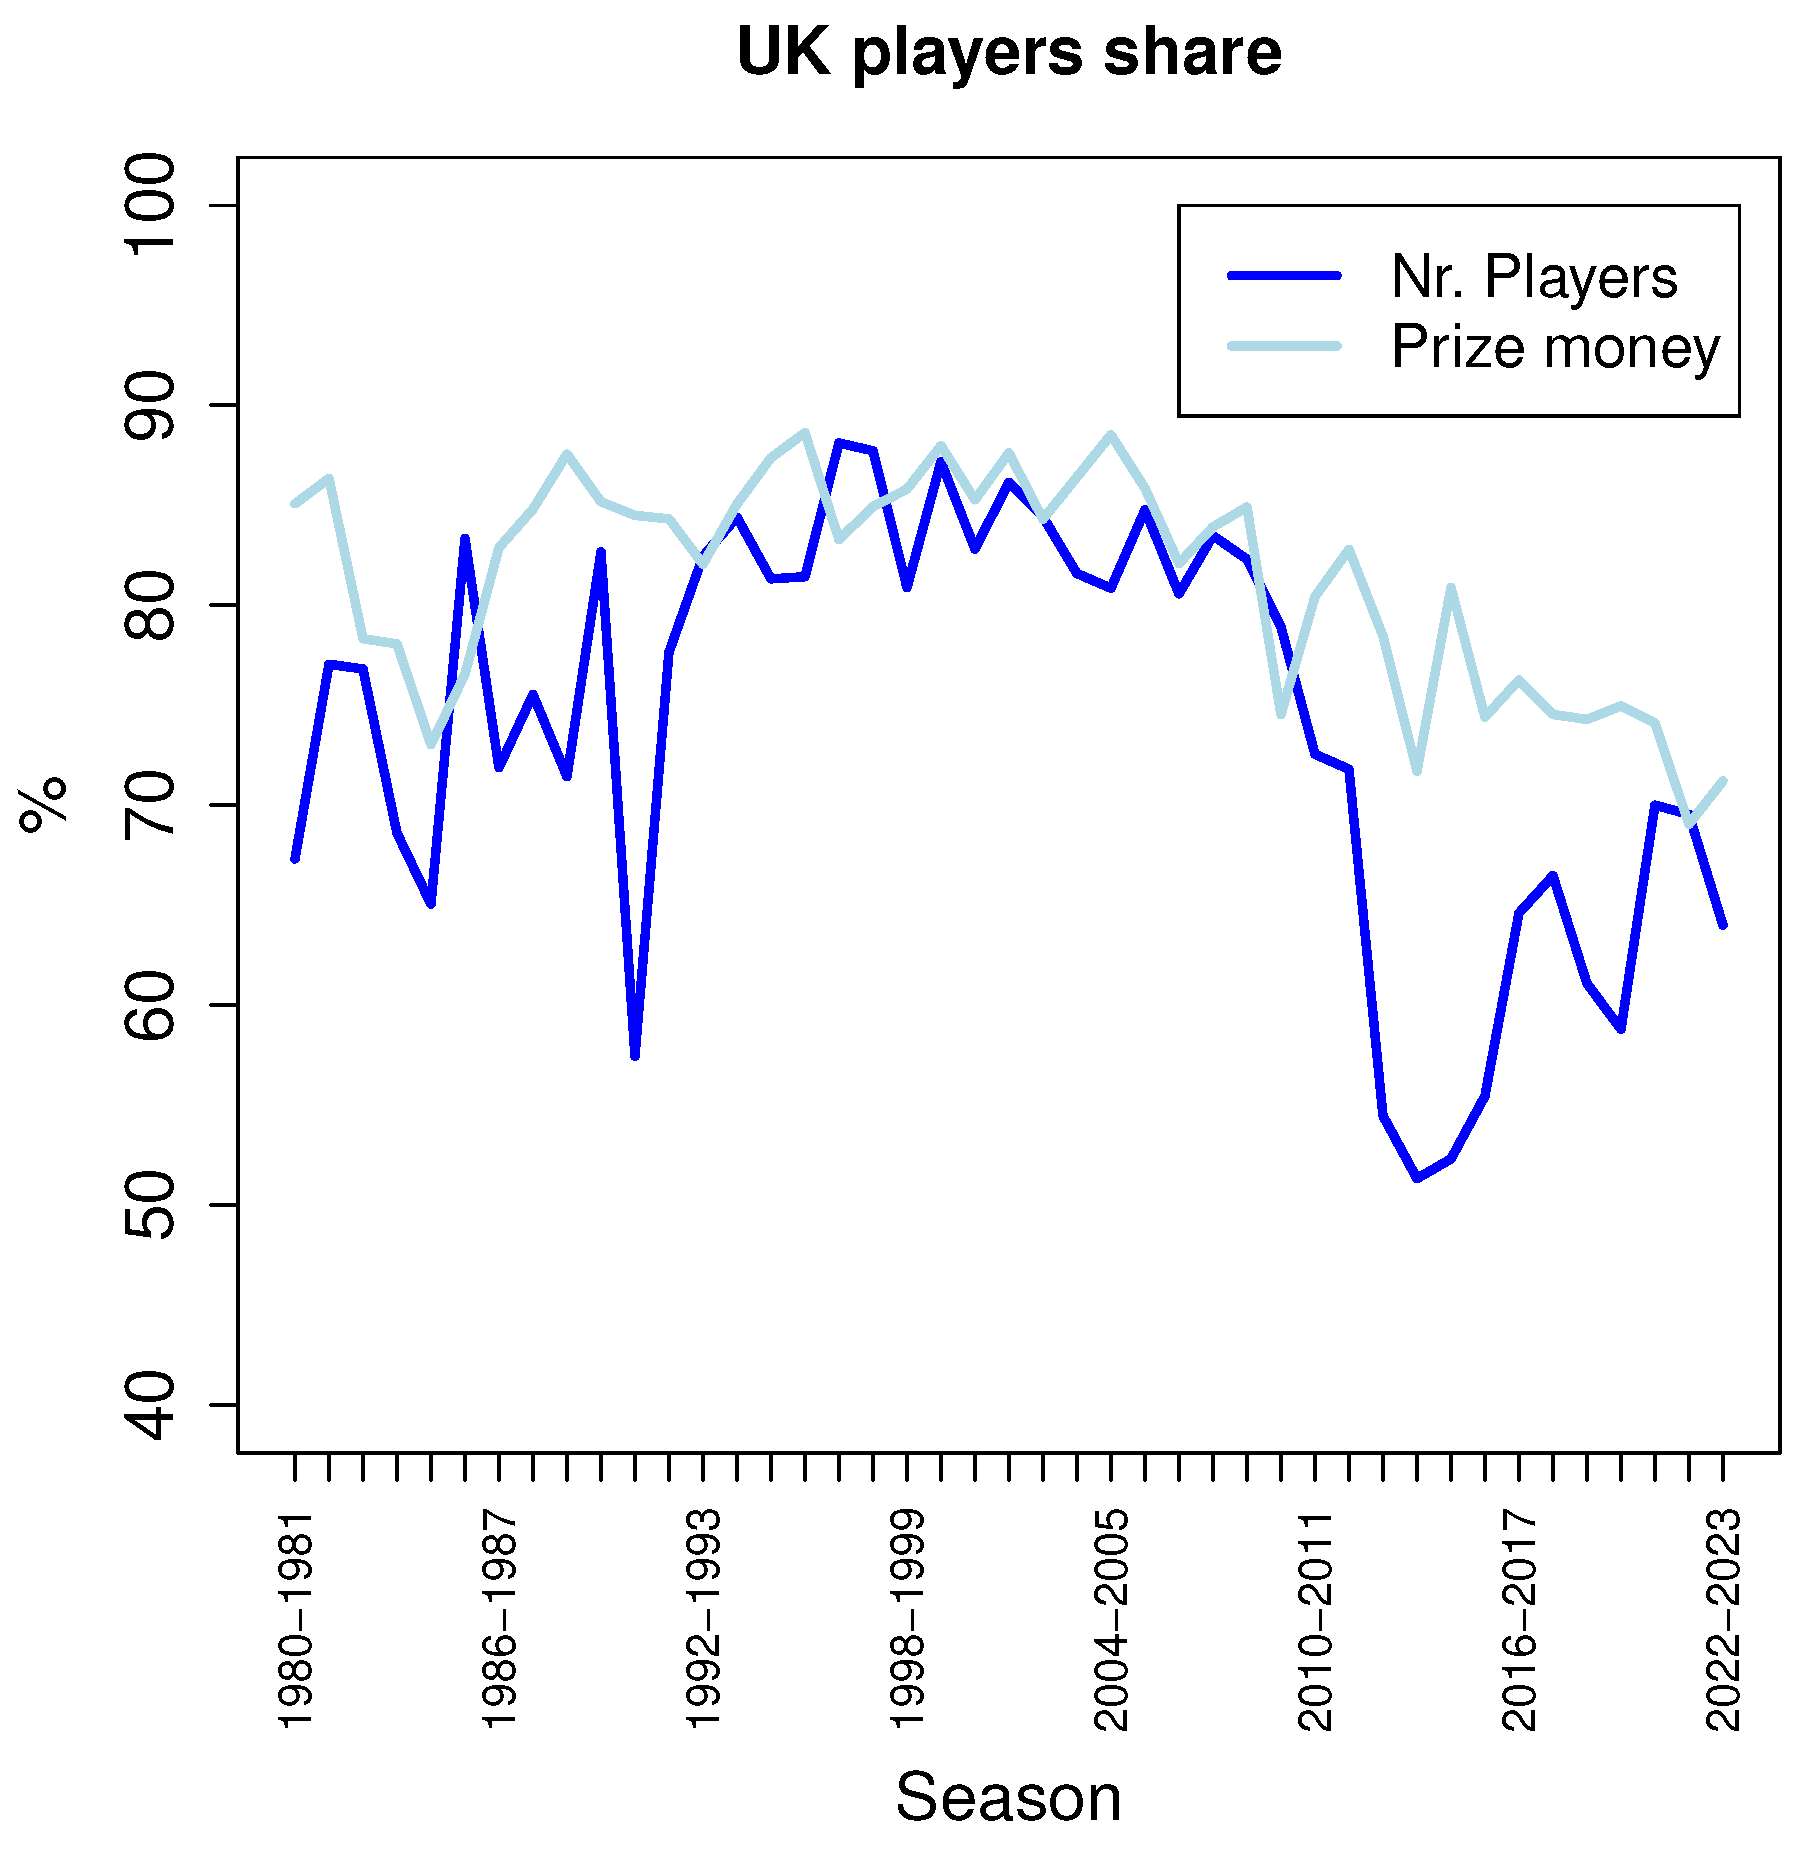
Figure 10.
The share of prize money against the percentage of UK players.
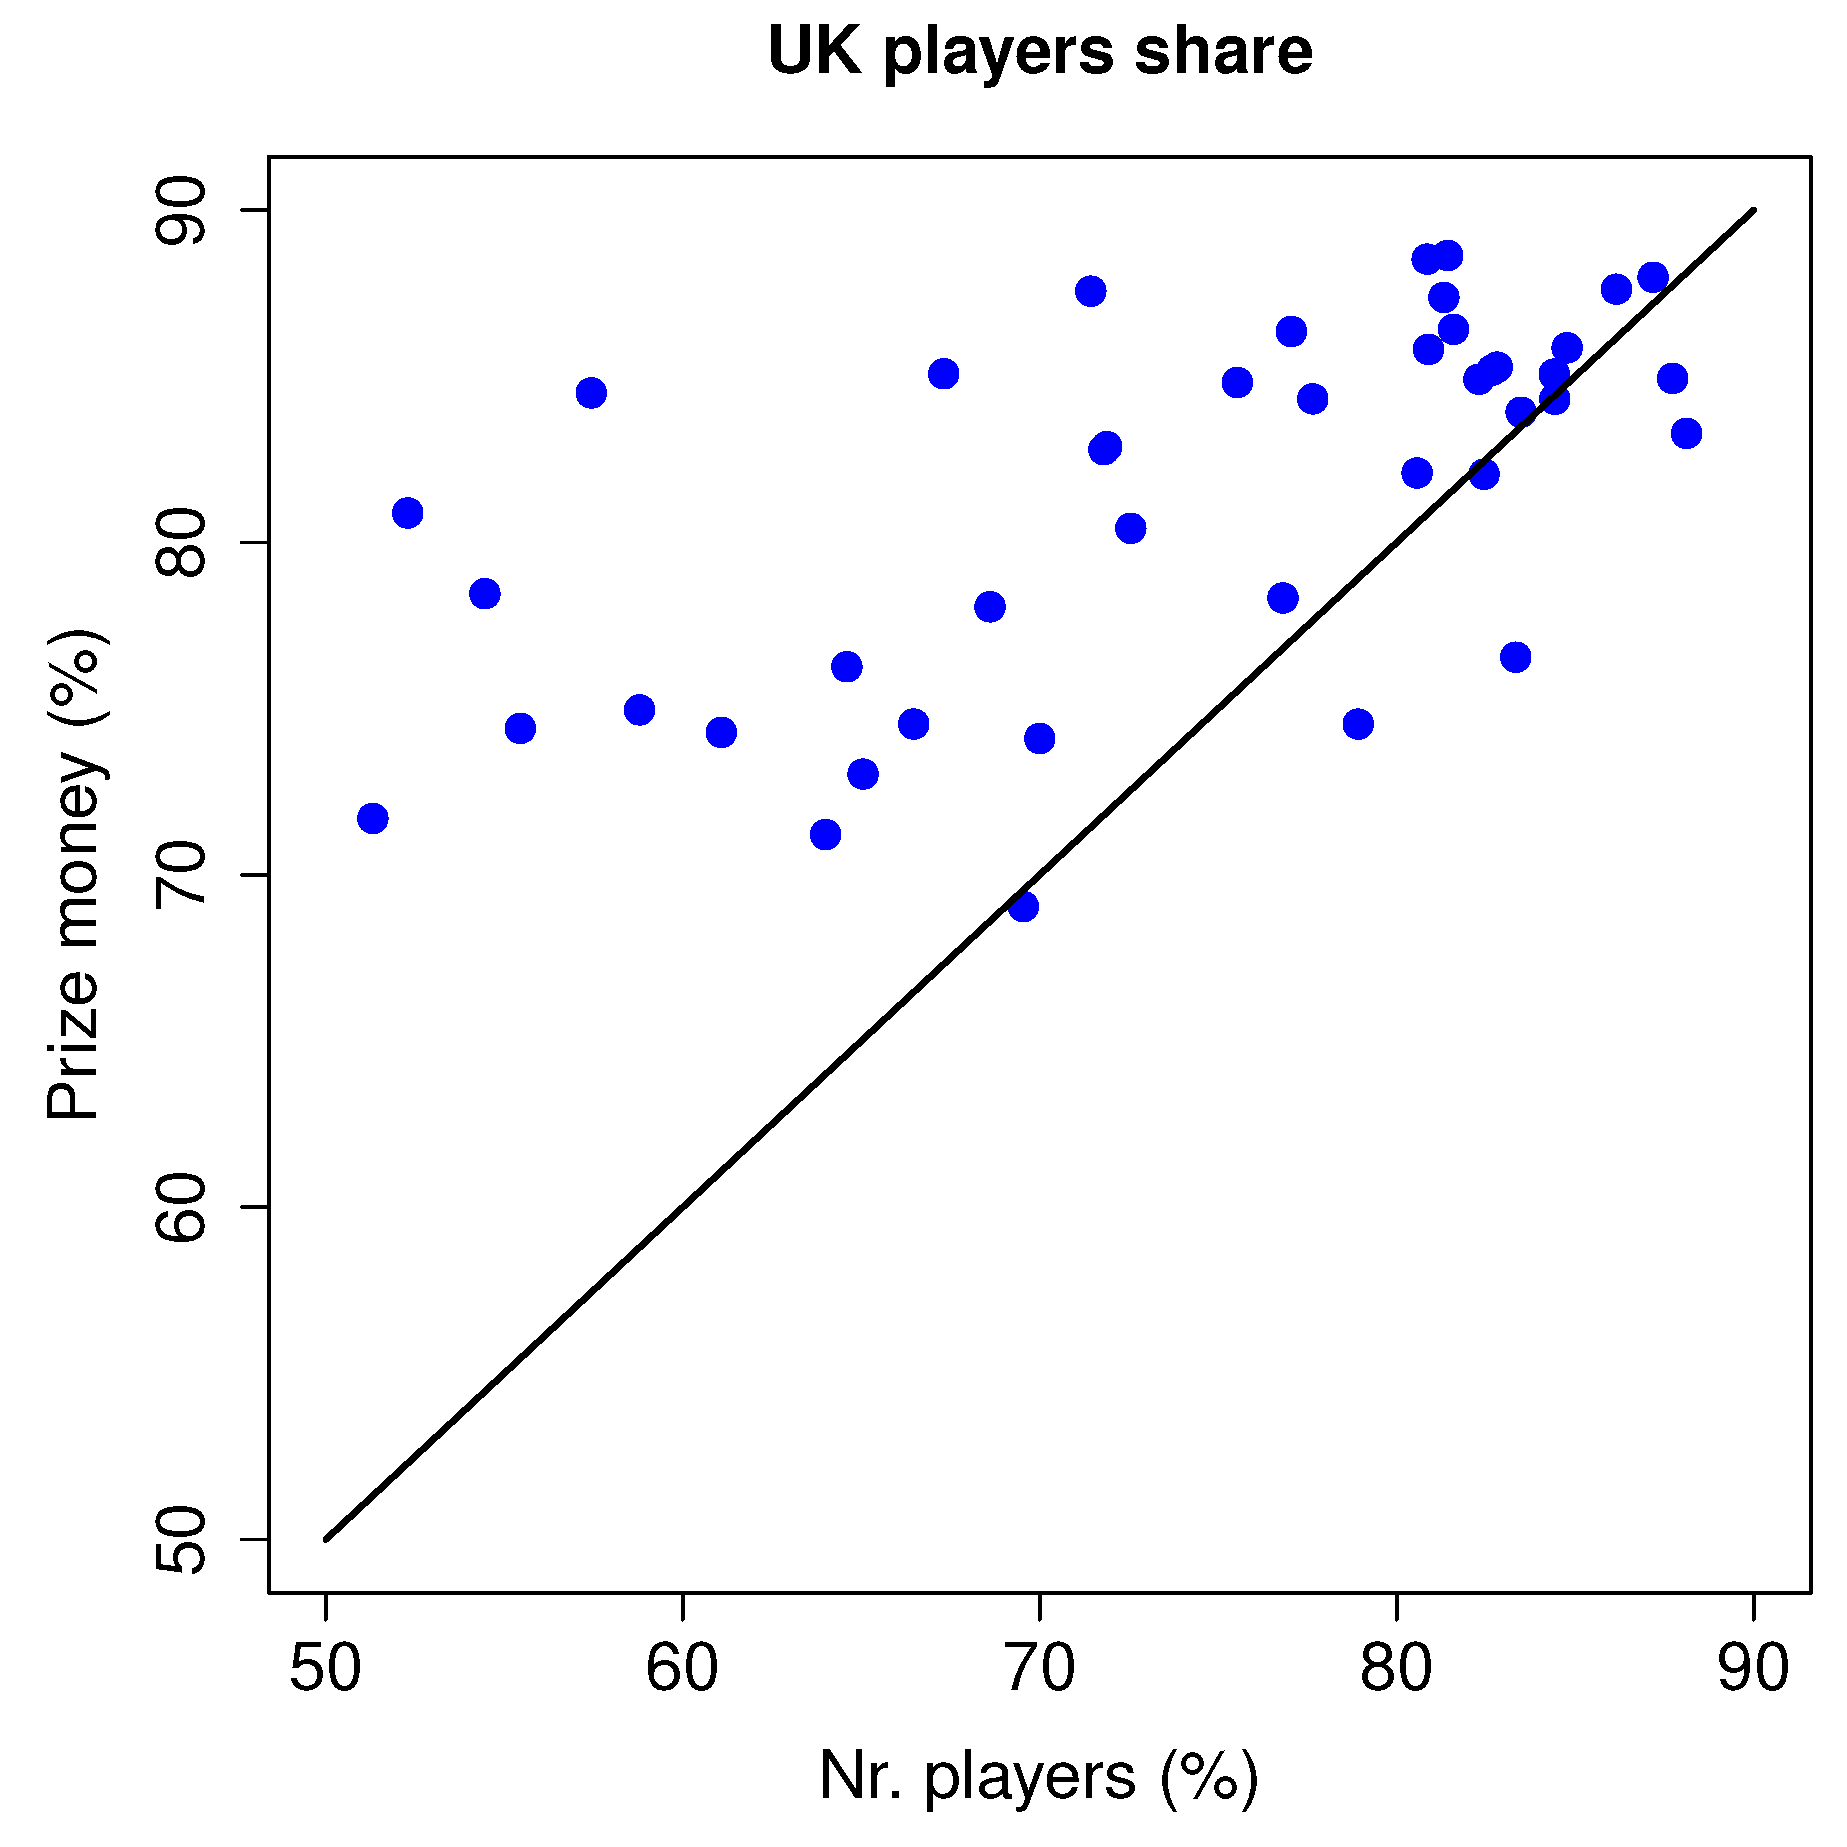

Table 1.
A simple example illustrating the 80% prize money rank, here being rank four.
| Rank | 1 | 2 | 3 | 4 | 5 | 6 | 7 | 8 | 9 | 10 |
|---|---|---|---|---|---|---|---|---|---|---|
| Prize money (%) | 40 | 25 | 10 | 7 | 5 | 4 | 3 | 3 | 2 | 1 |
| Subtotal | 40 | 65 | 75 | 82 | 87 | 91 | 94 | 97 | 99 | 100 |
Disclaimer/Publisher’s Note: The statements, opinions and data contained in all publications are solely those of the individual author(s) and contributor(s) and not of MDPI and/or the editor(s). MDPI and/or the editor(s) disclaim responsibility for any injury to people or property resulting from any ideas, methods, instructions or products referred to in the content. |
© 2023 by the authors. Licensee MDPI, Basel, Switzerland. This article is an open access article distributed under the terms and conditions of the Creative Commons Attribution (CC BY) license (http://creativecommons.org/licenses/by/4.0/).
Copyright: This open access article is published under a Creative Commons CC BY 4.0 license, which permit the free download, distribution, and reuse, provided that the author and preprint are cited in any reuse.


