Submitted:
21 June 2023
Posted:
21 June 2023
You are already at the latest version
Abstract
Flexibility is perceived as a primary reason for working as a gig worker. However, there are not enough studies that investigate gig workers' motivations. Hence, this study aims to examine the motivation of white-collar gig workers using a sample size of 327 gig workers in Mongolia, a developing country’s labor market. The purpose of this study is to investigate intrinsic and extrinsic motivation factors for white-collar gig workers and their impact on behavioral intentions such as those of remote workers, freelancers, and any representatives of digital gig workers, not location-based gig workers. The primary data used in this study were collected through questionnaires from an online platform that attracts white-collar gig workers. The characteristics of this group are analyzed using Smart PLS4.0 software through the PLS-SEM technique to test the hypothesized relationships. Overall, the study contributes to an extension of current literature by understanding the white-collar digital gig workforce’s motivations and reasons behind it.
Keywords:
gig workers
; platform work
; gig economy
; remote work
; employee motivation
; Mongolia
; well-being
; white-collar workers
1. Introduction
All business areas and work have shifted to digital due to the digital transformation. The recent rise of the so-called "gig economy" has created online global labor markets and digital employment practices. However, it is still in the primitive phase, different theories and paradigms has been proposed. Freelancers and remote workers, also called gig workers, now make up a larger portion of the global workforce and are connected by digital platforms globally. The gig economy could be any type of job that people discover and access through online platforms. It can be partially online or fully remote; both are considered online labor markets. Online labor markets are rapidly growing and gaining importance due to time savings and flexible work schedules with no commute. One of the highest gig economy markets for gig workers is the United States, which accounts for 62% of global volume and is where most consumers and gig platforms are available. As stated, [1], CEO of Upwork, gig workers contribute around $700 billion to the US national economy. After the US, UK, France, Australia, India, Indonesia, UAE, Pakistan, and other Asian countries, so forth [2]. The demand and workforce are growing rapidly due to technological advances, and all the work-related processes are now either online or platform-based, such as the hiring process, task allocation, performance review, etc. [3]
Since the gig economy was introduced to the labor market almost more than a decade ago, it is not a nascent topic but still an opaque one. As mentioned by Upwork, which is one of the popular gig work platforms, 50% of the global gig workforce is composed of skilled workers such as engineers, consultants, marketers, designers, and computer programmers. The gig economy can be classified into two types of employment: unskilled, which consists of drivers, food couriers, and other manual labor workers, and white-collar, who do professional jobs such as engineers, consultants, and management executives. However, those digital gig workers are less explored, and their life satisfaction and motivations are undiscovered. A few studies have explored about work engagement and gig workers’ performance. According to [1], gamification enhances the gig worker’s performance and positive impact on motivation as well.
There is a lack of understanding of why flexible working arrangements attract white-collar gig workers. Most studies focused on physical or location-based gig workers such as transportation service providers, food couriers, taxi drivers, healthcare workers, caregivers, or delivery workers, there has been less research into digital gig workers. The location-based type of gig working class has been investigated overwhelmingly enough. The studies have shown that physical gig work’s drawbacks are mainly mentioned more than its advantages, such as poor working conditions, underpayment, high physical risks, shift allocation, and work overload [4,5,6,7,8,9,10,11]. Between 2021 and 2023, only 13 articles in Scopus, 47 articles in the Web of Science, and 3 articles in Springer have been published about gig workers motivation. Although only 13 papers were intended for digital gig workers and the rest were for physical gig workers, it remains unclear why the gig economy is increasing rapidly even though it has many flaws and disadvantages. Most articles mentioned that the main reason for working as a gig is independence, but the type of independence and the reason behind the independence were not explored [12].
The downsides of gig work are quite numerous. For instance; employees receive no benefits, work overload, no work-life balance, social-distancing, discrimination, dangerous working conditions, well-being, sustainable working life, and job burnout, risky riding behavior [13,14,15,16] Beside the fact that gig work has few downsides, the gig economy increases job opportunities, broadens the middle-income group, narrows the wealth gap, and raises the social fairness and justice. According to [17] the two main technology-induced stressors are workload and job insecurity, as those directly impact job motivation. Moreover, job satisfaction is the main factor affecting work productivity and overall wellbeing. Another study has proposed a conceptual model of gig work perception. As mentioned in the study [18], the gig economy is classified as having push and pull factors that impact job satisfaction, wellbeing, and motivation. Push factors include family and financial needs and employment status; pull factors are interest, flexibility, and preferences. As denoted in [19], the gig worker's educational attainment does not increase their income, but performance reviews and the gig worker's location have a big impact on salary. Also, it is implied that, depending on the gender, the income fluctuates. The male gig workers’ income level is higher than the females.
In contrast, high-skilled/ white-collar gig workers have lower health and safety risks compared to location-dependent gig workers. The less location-independent they are, the more trust and transparency they have. Moreover, highly skilled people are able to choose their jobs, tasks and they can get their desired pay. Per se, they have more freedom to control the work and adapt their skills for the work. White-collar gig workers have more positive perceptions of trust and transparency. The negative side of platform work is workers’ ratings which algorithms evaluate based on clients’ reviews and ratings [20]. Type of work doesn’t only affect work motivation and perception of work. Work motivation does not only depend on the task, wage, or client but on the individual as well. A study found that age, working experience, life disturbances, and relocation affect an individual’s technostress and work motivation. For instance, those who worked remotely for longer felt less of a lack of autonomy, and those who worked remotely for less than a year, had insecure employment feelings. Similarly, traditional human resource management, office social interaction, corporate reputation, and transportation quality do not matter any longer for remote workers [21].
Some scholars denoted that there are intrinsic and extrinsic motivation, both of which are important for work motivation. Furthermore, when people are satisfied with their fundamental needs for psychological, autonomy, competence, and relatedness, they often feel motivated. On the other hand, the more desire they have, the more they are intrinsically motivated [22,23]. Some researchers mentioned that non-standard work time reduces intrinsic and extrinsic motivation. There are no sufficient studies available about white-collar gig workers’ motivations [24]. Furthermore, the quality of work and motivation depend on whether gig workers are doing it voluntarily or involuntarily. A study created five types of gig workers based on their motivations and purposes: searchers, lifers, short-timers, long-rangers, and dabblers. Searchers are actively looking for permanent work; lifers are to increase their pay and are also called freelancers. Short-timers are just earning some extra income while long-rangers’ financial situation is insecure, so they look for secondary income. Dabblers do gig work for non-economic reasons [25]. Therefore, this study aimed to explore the motivations of white-collar gig workers based on the model of [25,26]: work characteristics, personal characteristics, reasons of gig work. The main target was white-collar gig workers in Mongolia, especially engineers and high-skilled gig workers.
2. Materials and Methods
The questionnaire survey approach was used in this empirical research. The questionnaire survey is mostly used to obtain primary data when conducting empirical research. The questionnaire and investigation must be rigorous in order to get reliable and valid research results [27]. The questionnaire was intended to collect responses from engineers and other highly skilled professionals via an online platform. The primary data were collected from an online platform that currently engages white-collar gig workers and other corporate employees in either one or more platforms. We used Google form, https://www.google.com/forms/about/ which is flexible and accessible from anytime and anywhere, to get responses from respondents. The result of the study would extend theoretical knowledge if our hypothesis approved. As mentioned in the [28,29], an online survey combined with the quota sampling method is one of the most efficient and appropriately utilized internet-based questionnaires. A large amount of literature was reviewed in order to build a questionnaire survey. A similar or relevant literature also guided the investigation and analysis for these questions.
2.1. Hypotheses Development
From a psychological perspective, human motives can be distinguished into three essential categories: affiliation, power, and achievement. According to motivational theories, motivation can be categorized into two classes: explicit, which means rational information processing and reasoning, and implicit, which refers to the unconscious mind. Intrinsic motivation is a fundamental motivator for learning, adapting, and competing, which are essential for career development [30,31]. Based on the literature reviews, this paper investigates the incentives and whether those theories and studies will apply the same reasoning or not. In this paper, we tested explicit motivations that classified the necessities of white-collar gig workers into two main groups: work characteristics, and personal characteristics as shown in figure 1.
H1a:
Personal characteristics has a significant impact on behavioral intention.
Personal characteristics include medical reasons, gap coverage, and family necessities. Also included are having extra income and having time for their own hobbies. Whereas, full-time job vacancies, career growth, flexibility, visa or relocation issue, short-term contracts, and entrepreneurship are considered work characteristics. Therefore, this paper proposes the following research hypotheses: A person’s fundamental needs, such as health, income, and other necessities impact to specific behaviors. It may lead to stress, excitement, or the determination to follow the path.
H2:
Work characteristics has a significant impact on behavioral intention.
The joy of work is affiliated with motivational factors, while work performance is driven by an employee’s interest and effort [26]. The authors also stated that basic needs build an initial level of job satisfaction that includes career development, challenge, responsibility, and so on. The other motivational factors are salary, work environment, strategies, and so forth. According to [32] theory, autonomy, or level of independence, is considered one of the five work characteristics, for work satisfaction and job performance. As for well-qualified gig workers, working conditions, remunerations, and opportunities are improving. Also, they can work from anywhere they want, unlike location-based gig workers. In contrast, it may have a negative impact on low-skilled workers, for instance; through job loss or increasing involuntary atypical employment. On the other hand, it may instigate social stratification, and social inequality [33]. Figure 1 shows the hypothesized research framework based on the literature review.
2.2. Respondents and measurement scales
As for the first stage of the survey, we considered the ethics and transparency of the process that was carried out, participant awareness of privacy statements in the online questionnaire, and data confidentiality. The population in this study was mostly IT engineers, managers and other white-collar gig workers and corporate workers who might do gig work in Mongolia. We defined two criteria for respondents. First, the respondents must have a bachelor’s degree or higher from their educational background. Second, the respondents must be either gig workers, or corporate employees who are willing to do a gig job. We decided to use two sampling methods, quota sampling and judgment sampling, since there are two types of respondents. Because quota sampling is a non-probability sampling method, it is not random selection of people. So, it was used for selecting corporate employees. And judgment sampling used for selecting a group of people that works as a gig [34]. Sample size was determined by the survey sample size method according to below formula.
- n is the required sample size
- p is the percentage occurrence of a state or condition
- E is the percentage maximum error required
- Z is the value corresponding to level of confidence required [35].
This study used partial least squares structural equation modelling (PLS-SEM) for data analysis as PLS-SEM is a commonly used approach among researchers and scholars. The data were analyzed using the Smart-PLS 4.0 software, which is simple, easy, and commonly applicable [36]. We have chosen 95% as a confidence level, and 5% of margin error. P as for population size of Mongolia is 3.2 million. Thus, our ideal sample size is 385 according to the formula. The sample size used in this study 327 is comparably greater than the minimum required size estimation and prevalent methods for PLS-SEM. Also, the sample size meets minimum sample adequacy proposal, and the estimations are a lot larger than the required minimum sample sizes [37].
Online survey activities were carried out within 8 weeks through the most commonly used social media sites, and the snowball technique was also used. In conducting this questionnaire survey, two additional research assistants were involved and helped with distributing the questionnaire online. The questionnaire consisted of a total of 20 questions and had two sections; The first part of the questionnaire included respondents’ demographic information (gender, age, sex, level of education, occupational status, and total working hours in a week) shown in below Table 1. The second part of the questionnaire described the purpose of the study and contained instructions. The second part’s scale items were rated using a form of a five-point Likert scale. The ranges were (1) strongly disagree; (2) disagree; (3) neither agree nor disagree; (4) agree; and (5) strongly agree.
All English scales and questions were translated to Mongolian. The questionnaire was sent to 385 prospective respondents to complete. A total of 327 (84%) responses were returned and response rate was acceptable. The online questionnaire was intended to be asked of Mongolian professionals to empirically test our hypotheses and research model. The entire dataset did not contain any missing value. As shown in Table 1, the average age was between 30 and 49, and 50% was male and 49% was female respondents. As for their working experience, respondents were highly experienced and having a good education background as 92% of them has bachelor’s or master’s degree. As expected, majority of participants (92.7%) were willing to work as a gig in near future even though they all have full-time job.
2.3. Data analysis
To analyze the conceptual model, “Partial Least Squares” approach to “Structural Equation Modeling” (PLS-SEM) with Smart PLS 4.0 software was used. It is downloadable from https://www.smartpls.com/. It has become a standard approach for analyzing complex inter-relationships between experimental and undeveloped variables [38]. Most researchers are agree on PLS-SEM is suitable technique for exploring a complex model and testing a relationship between variables. This approach also advocate in evaluating the models with two techniques (inner and outer) [39]. A structural equation model (SEM) is generally recommended for estimating, testing, and determining the relationship models which is useful method to analyze the relationship among variables [40]. PLS is also well established technique to estimate the path-coefficients in the structural modesl and is being used and accepted Human Resource Management studies due to its capability to model latent constructs under the conditions of non-normality and large and small sample sizes [37].
3. Results
3.1. Outer measurement model
Our measurement model comprises three reflective latent constructs and a total of 14 indicators. While examining the outer model for assessing the validity and reliability of all the constructs, convergent validity needs to be tested. According to the studies, the outer loading should be greater than 0.7. And if the outer loading value is less than 0.40, then the item should be removed. Three items were too low (below 0.5), so those three items were removed in order to qualify for the required minimum value. Composite reliability must be above 0.60 and above 0.70 is a general guideline according to [41]. After removing the low values once, general loadings exceeded the value and were considered fairly fit and satisfactory for the model.
When examining Composite Reliability (CR) values and Cronbach Alpha values, all of them were satisfactory and fulfilled the recommended value of greater than 0.70, as shown below in Table 2 [37,41]. Cronbach’s alpha (CA), composite reliability (CR) (rho_a), (rho_c) and average variance extracted (AVE) were calculated to measure the internal consistency and validity as shown in Table 2. The AVE is a measurement of convergence that represents a reflectively measured latent construct [36]. All constructs’ values were reliable as those Average variance extracted (AVE) were greater than 0.50, which meets the standard validity criterion [42]. Therefore, all constructs were appropriate for further analysis.
The second step is to investigate discriminant validity, which refers to the extent to which it is a subtype of construct validity. It shows how a test measures the concept and computes the constructs. Discriminant validity means that latent variables cannot be gauged for variances in the observed variables associated with them. However, they should not be related to each other. The result for the Heterotrait-Monotrait ratio (HTMT) is shown in Table 3, which qualifies the value of correlation for the construct as acceptable range (<0.90) [43].
As shown in Table 4, The Fornell-Larcker test indicates that the diagonal values are the greatest for a construct as compared with the other values. Whereas, Heterotrait-Monotrait ratio (HTMT) analysis was calculated to examine discriminant validity.
3.2. Structure Model
After validation of the outer model, the inner model is examined for its relationship mapping between constructs. The R2 and the corresponding values are in the suggested values bracket; the corresponding T-statistics taken through the bootstrapping method with at least 5000 are to be assessed. Figure 2 illustrates the structural equation model after processing the structural equation modeling for all latent constructs. When the p-value is less than 0.05 in negative terms, then the research hypothesis should be rejected. Whereas, as defined in positive terms, if the p-value is less than 0.05, then the research hypothesis should be accepted. The study adopted positive terms.
As can be seen from this SEM model, it can be inferred that both personal and work characteristics are significantly impacting the behavior intention (β=0.354 and β=0.323, respectively). [44] suggested that R2 values of 0.02 are small, 0.13 are medium, and above 0.26 are large. So, applying Cohen’s standard interpretation, our R2 value exceeds the recommended value of 0.26, which indicates a fairly substantial model. The coefficient of R2 value were 0.332 for Behavioral Intention. Therefore, this model can be considered good. As for Variance Inflation Factor (VIF) was used with inner reflective model, and if the result is less than 3, then it considered as acceptable. Table 5 shows the VIF was less than 3 in all constructs, which means no collinearity issues in the model.
The bootstrapping is used for evaluating the significance of the hypothesis and it shows relationship between personal and work characteristics and behavioral intention. The effect sizes are assessed by F square values; if the values are below 0.02, it means small effects; between 0.02 and 0.15 are medium effects; and 0.35 or greater values surmise large effects [37]. The hypothesis testing has been executed and shown in Table 6. According to [41] recommendation, the bootstrapping calculation was used with 5,000 iterations to obtain the path coefficient and bias-corrected confidence interval. The effect size f-square was large for both hypothesis 1 and 2. The results were 0.150 and 0.325 respectively. Two hypotheses are supported significantly, with p values of 0.000 as shown in Table 6.
4. Conclusions
Two hypotheses were investigated in this study to assess the reasons and motivation of the gig work, and both hypotheses were supported by the results of the study. It can be concluded that both personal and work characteristics are impacting the increasing number of gig workers. Not only flexibility but also many other factors impacted the decision to take a gig job. Further, it is observed from the analysis of the study that both personal and work characteristics significantly explain 33% of the variance in behavioral intentions, which means that there are plenty of other reasons to work as a gig worker. This study was carried out on IT professionals and other potential gig workers based on purposive sampling, so it is recommended to comprehend the results before further generalization. Although this study may contribute to explaining the two main, distinct motivations and intentions, several mediators can be studied for further research. As the gig economy grows rapidly worldwide, it is important for organizations to know the components of motivation in order to attract talented and highly skilled workers.
Author Contributions
“Conceptualization, A.B. and Z.L methodology, A.B; software, A.B.; validation, A.B; formal analysis, A.B.; investigation, A.B.; resources, A.B.; data curation, A.B.; writing—original draft preparation, A.B.; writing—review and editing, A.B.; visualization, A.B.; supervision, Z.L project administration, A.B.; All authors have read and agreed to the published version of the manuscript.
Funding
This research received no external funding
Informed Consent Statement
Informed consent was obtained from all subjects involved in the study.
Data Availability Statement
Available.
Conflicts of Interest
The authors declare no conflict of interest.
References
- Behl, A.; Jayawardena, N.; Ishizaka, A.; Gupta, M.; Shankar, A. Gamification and gigification: A multidimensional theoretical approach. J. Bus. Res. 2021, 139, 1378–1393. [Google Scholar] [CrossRef]
- Mastercard, Fueling the global gig economy Mastercard, 2020.
- Rosenblat, A.; Stark, L. Algorithmic Labor and Information Asymmetries: A Case Study of Uber's Drivers. International Journal Of Communication 2016, 10, 27. [Google Scholar] [CrossRef]
- Tassinari, A.; Maccarrone, V. Riders on the Storm: Workplace Solidarity among Gig Economy Couriers in Italy and the UK. Work. Employ. Soc. 2019, 34, 35–54. [Google Scholar] [CrossRef]
- Anwar, M.A.; Graham, M. Between a rock and a hard place: Freedom, flexibility, precarity and vulnerability in the gig economy in Africa. Competition Chang. 2020, 25, 237–258. [Google Scholar] [CrossRef]
- Gregory, K. ‘My Life Is More Valuable Than This’: Understanding Risk among On-Demand Food Couriers in Edinburgh. Work. Employ. Soc. 2020, 35, 316–331. [Google Scholar] [CrossRef]
- Apouey, B.; Roulet, A.; Solal, I.; Stabile, M. Gig Workers during the COVID-19 Crisis in France: Financial Precarity and Mental Well-Being. J. Urban Heal. 2020, 97, 776–795. [Google Scholar] [CrossRef]
- Webb, R.M.S.R.A. Employment in the informal economy: implications of the COVID-19 pandemic. International Journal of Sociology and Social Policy 2020, 40, 1005–1019. [Google Scholar] [CrossRef]
- Al-Dossary, R. Investigating the feasibility of applying the gig economy framework in the nursing profession towards the Saudi Arabian Vision 2030. Informatics Med. Unlocked 2022, 30, 100921. [Google Scholar] [CrossRef]
- Hasegawa, Y.; Ido, K.; Kawai, S.; Kuroda, S. Who took gig jobs during the COVID-19 recession? Evidence from Uber Eats in Japan. Transp. Res. Interdiscip. Perspect. 2022, 13. [Google Scholar] [CrossRef]
- Melian-Gonzalez, S. Gig economy delivery services versus professional service companies: Consumers’ perceptions of food-delivery services. Technology in Society 2022, 69. [Google Scholar] [CrossRef]
- Ruthirakuhan, M.; Herrmann, N.; Vieira, D.; Gallagher, D.; Lanctôt, K.L. ; The Roles of Apathy and Depression in Predicting Alzheimer Disease: A Longitudinal Analysis in Older Adults With Mild Cognitive Impairment. Am. J. Geriatr. Psychiatry 2019, 27, 873–882. [Google Scholar] [CrossRef]
- Qiao, S.; Huang, G.; Yeh, A.G.-O. Who are the gig workers? Evidence from mapping the residential locations of ride-hailing drivers by a big data approach. Cities 2023, 132. [Google Scholar] [CrossRef]
- Christie, N.; Ward, H. Delivering hot food on motorcycles: A mixed method study of the impact of business model on rider behaviour and safety. Saf. Sci. 2023, 158. [Google Scholar] [CrossRef]
- Nilsen, M.; Kongsvik, T. Health, Safety, and Well-Being in Platform-Mediated Work – A Job Demands and Resources Perspective. Safety Science 2023, 163, 106130. [Google Scholar] [CrossRef]
- Nguyen-Phuoc, D.Q.; Nguyen, L.N.T.; Su, D.N.; Nguyen, M.H.; Oviedo-Trespalacios, O. Deadly meals: The influence of personal and job factors on burnout and risky riding behaviours of food delivery motorcyclists. Saf. Sci. 2023, 159. [Google Scholar] [CrossRef]
- Umair, A.; Conboy, K.; Whelan, E. UNDERSTANDING THE INFLUENCE OF TECHNOSTRESS ON WORKERS’ JOB SATISFACTION IN GIG-ECONOMY: AN EXPLORATORY INVESTIGATION. The 27th European Conference on Information Systems (ECIS), no. https://aisel.aisnet.org/ecis2019_rip/34, p. 34, 2019.
- Ruthirakuhan, M.; Herrmann, N.; Vieira, D.; Gallagher, D.; Lanctôt, K.L. The Roles of Apathy and Depression in Predicting Alzheimer Disease: A Longitudinal Analysis in Older Adults With Mild Cognitive Impairment. Am. J. Geriatr. Psychiatry 2019, 27, 873–882. [Google Scholar] [CrossRef]
- Andrea, M.; Petra, M.; Maryse, M.; Brita, S.; Amelie, L. We don't need no (higher) education - How the gig economy challenges the education-income paradigm. Technological Forecasting & Social Change 2023, 186, 122136. [Google Scholar]
- Dunn, M.; Munoz, I.; Jarrahi, M.H. Dynamics of flexible work and digital platforms: Task and spatial flexibility in the platform economy. Digit. Bus. 2023, 3. [Google Scholar] [CrossRef]
- Ewers, M.; Kangmennaang, J. New spaces of inequality with the rise of remote work: Autonomy, technostress, and life disruption. Applied Geography 2023, 152, 102888. [Google Scholar] [CrossRef]
- Woolley, K.; Fishbach, A. It’s about time: Earlier rewards increase intrinsic motivation. Journal of Personality and Social Psychology 2018, 114, 877–890. [Google Scholar] [CrossRef]
- Grant, A.M. Does intrinsic motivation fuel the prosocial fire? Motivational synergy in predicting persistence, performance, and productivity. Journal of Applied Psychology 2008, 93, 48–58. [Google Scholar] [CrossRef]
- Giurge, L.M.; Wooley, K. Working during non-standard work time undermines intrinsic motivation. Organizational Behavior and Human Decision Processes 2022, 170, 104134. [Google Scholar] [CrossRef]
- Dunn, M. Making gigs work: digital platforms, job quality and worker motivations. New Technology, Work and Employment 2020, 35, 232–249. [Google Scholar] [CrossRef]
- Zaman, U.; Nawaz, S.; Javed, A.; Rasul, T. Having a whale of a time: Linking self-determination theory (SDT), job characteristics model (JCM) and motivation to the joy of gig work. Cogent Bus. Manag. 2020, 7. [Google Scholar] [CrossRef]
- Xiongtao, H.; Wenzhu, L.; Haibin, L.; Shanshi, L. How Gig Worker Responds to Negative Customer Treatment: The Effects of Work Meaningfulness and Traits of Psychological Resilience. Front. Psychol. 2021, 12, 783372. [Google Scholar] [CrossRef]
- Futri, I.N.; Risfandy, T.; Ibrahim, M.H. Quota sampling method in online household surveys. Methodsx 2022, 9, 101877. [Google Scholar] [CrossRef]
- Moser, C.A.; Stuart, A. An Experimental Study of Quota Sampling. Journal of the Royal Statistical Society 1953, 116, 349–405. [Google Scholar] [CrossRef]
- Yoo, S.J.; Han, S.-H.; Huang, W. The roles of intrinsic motivators and extrinsic motivators in promoting e-learning in the workplace: A case from South Korea. Comput. Hum. Behav. 2012, 28, 942–950. [Google Scholar] [CrossRef]
- Slabbinck, H.; Witteloostuijn, A.V. Explicit and Implicit Basic Human Motives, and Public Service. Motivation Organizational Psychology 2020, 11. [Google Scholar] [CrossRef]
- Hackman, J.R.; Oldham, G.R. Development of the Job Diagnostic Survey. Journal of Applied Psychology 1975, 60, 159–170. [Google Scholar] [CrossRef]
- Dabić, M.; Maley, J.F.; Švarc, J.; Poček, J. Future of digital work: Challenges for sustainable human resources management. J. Innov. Knowl. 2023, 8, 100353. [Google Scholar] [CrossRef]
- S. Rahi, F.M.I. S. Rahi, F.M.I.Alnaser and M. A. Ghani, DESIGNING SURVEY RESEARCH: RECOMMENDATION FOR QUESTIONNAIRE DEVELOPMENT, CALCULATING SAMPLE SIZE AND SELECTING RESEARCH PARADIGMS in 37th International Scientific Conference on Economic and Social Development – Socio Economic Problems of Sustainable Development, Baku, 2019.
- Taherdoost, H. Determining Sample Size; How to Calculate Survey Sample Size. International Journal of Economics and Management Systems 2017, 2, 237–239. [Google Scholar]
- Alabdali, M.A.; Salam, M.A. The Impact of Digital Transformation on Supply Chain Procurement for Creating Competitive Advantage: An Empirical Study. Sustainability 2022, 14, 12269. [Google Scholar] [CrossRef]
- Seema, M.; Sachdeva, D. Moonlighting intentions of i.t. professionals: impact of organizational commitment and entrepreneurial motivation. Journal of Critical Reviews 2020, 7, 214–220. [Google Scholar] [CrossRef]
- H. Jr.Joseph.F, H.G. H. Jr.Joseph.F, H.G. M, R.C. M, S. Marko, D.N. P and R. Soumya, Partial Least Squares Structural Equation Modeling (PLS-SEM) Using R, Springer Nature, 2021.
- Bajunaied, K.; Hussin, N.; Kamarudin, S. Behavioral intention to adopt FinTech services: An extension of unified theory of acceptance and use of technology. J. Open Innov. Technol. Mark. Complex. 2023, 9. [Google Scholar] [CrossRef]
- Chen, T.; Song, W.; Song, J.; Ren, Y.; Dong, Y.; Yang, J.; Zhang, S. Measuring Well-Being of Migrant Gig Workers: Exampled as Hangzhou City in China. Behav. Sci. 2022, 12, 365. [Google Scholar] [CrossRef]
- Hair, J.F.; Ringle, C.M.; Sarstedt, M. Editorial - Partial Least Squares Structural Equation Modeling: Rigorous Applications, Better Results and Higher Acceptance. Long Range Planning 2013, 46, 1–12. [Google Scholar]
- Naveed, Q.N.; Alam, M.M.; Tairan, N. Structural Equation Modeling for Mobile Learning Acceptance by University Students: An Empirical Study. Sustainability 2020, 12, 8618. [Google Scholar] [CrossRef]
- Farrell, A.M. Insufficient discriminant validity: A comment on Bove, Pervan, Beatty, and Shiu (2009). Journal of Business Research 2010, 63, 324–327. [Google Scholar] [CrossRef]
- Cohen, J. A power primer. Psychological Bulletin 1992, 112, 155–159. [Google Scholar] [CrossRef]
Figure 1.
Conceptual Model and hypothesized relationships.
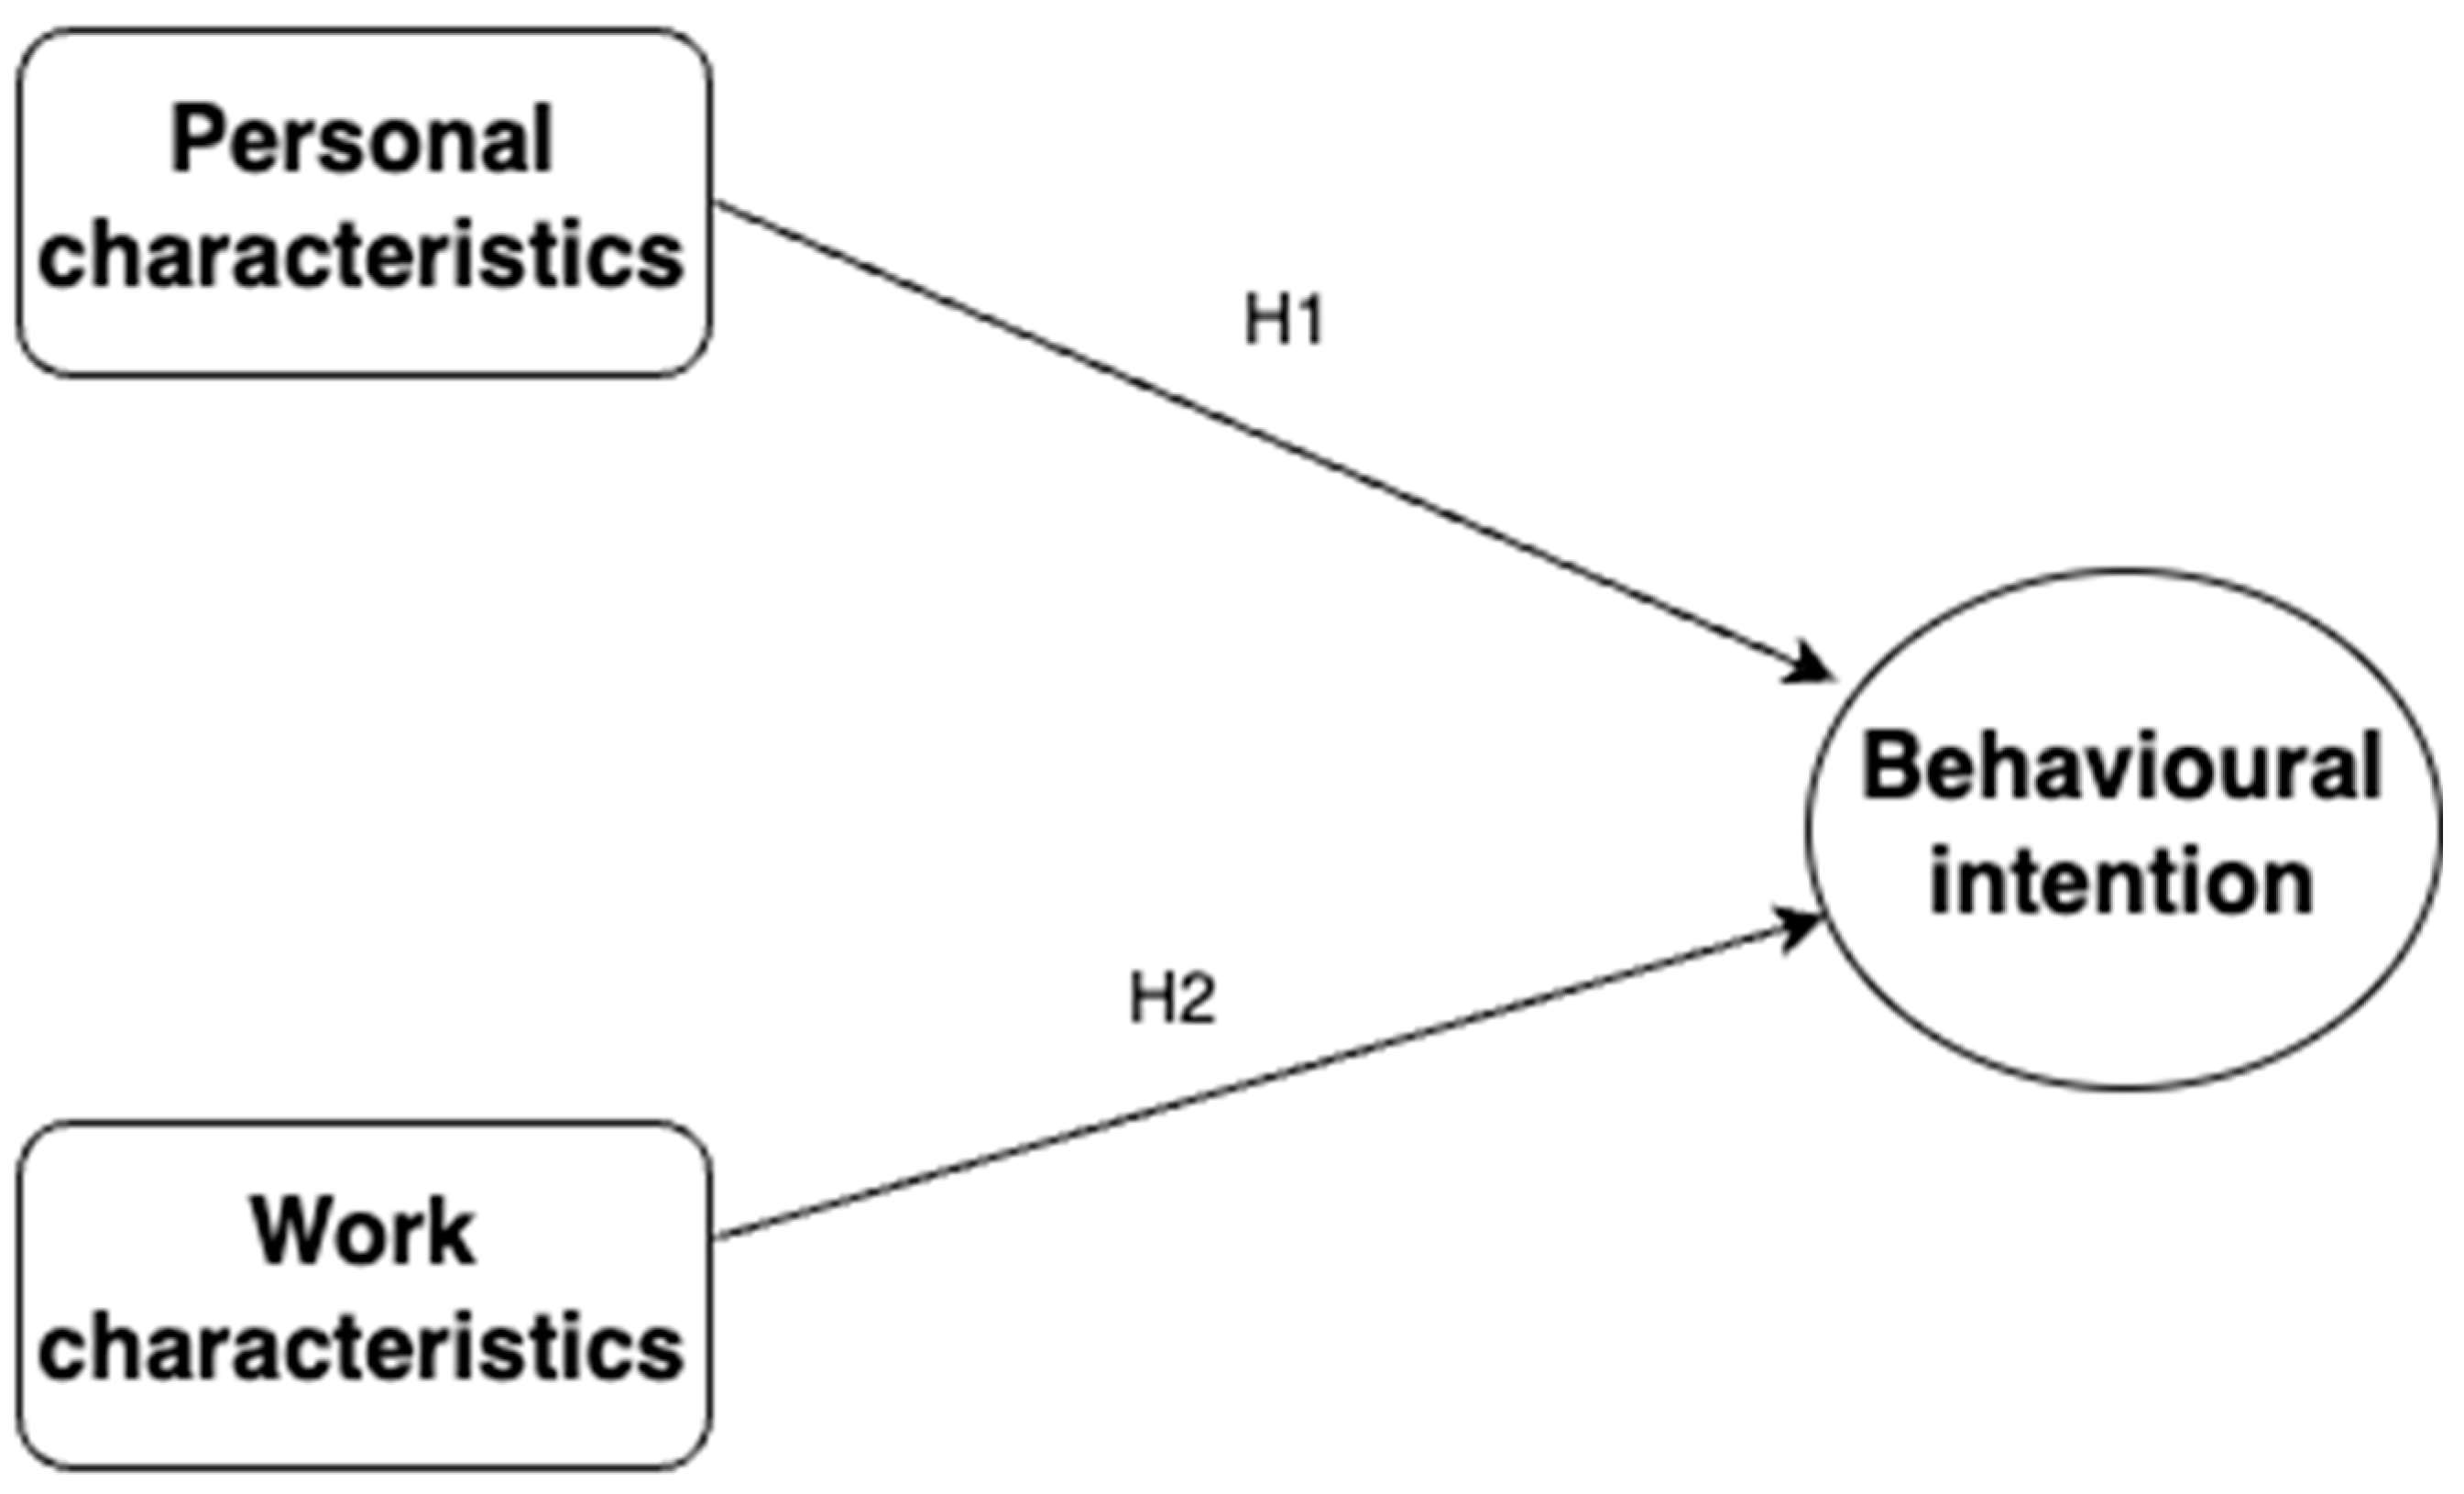
Figure 2.
Structural Equation Model from SmartPLS4.0.
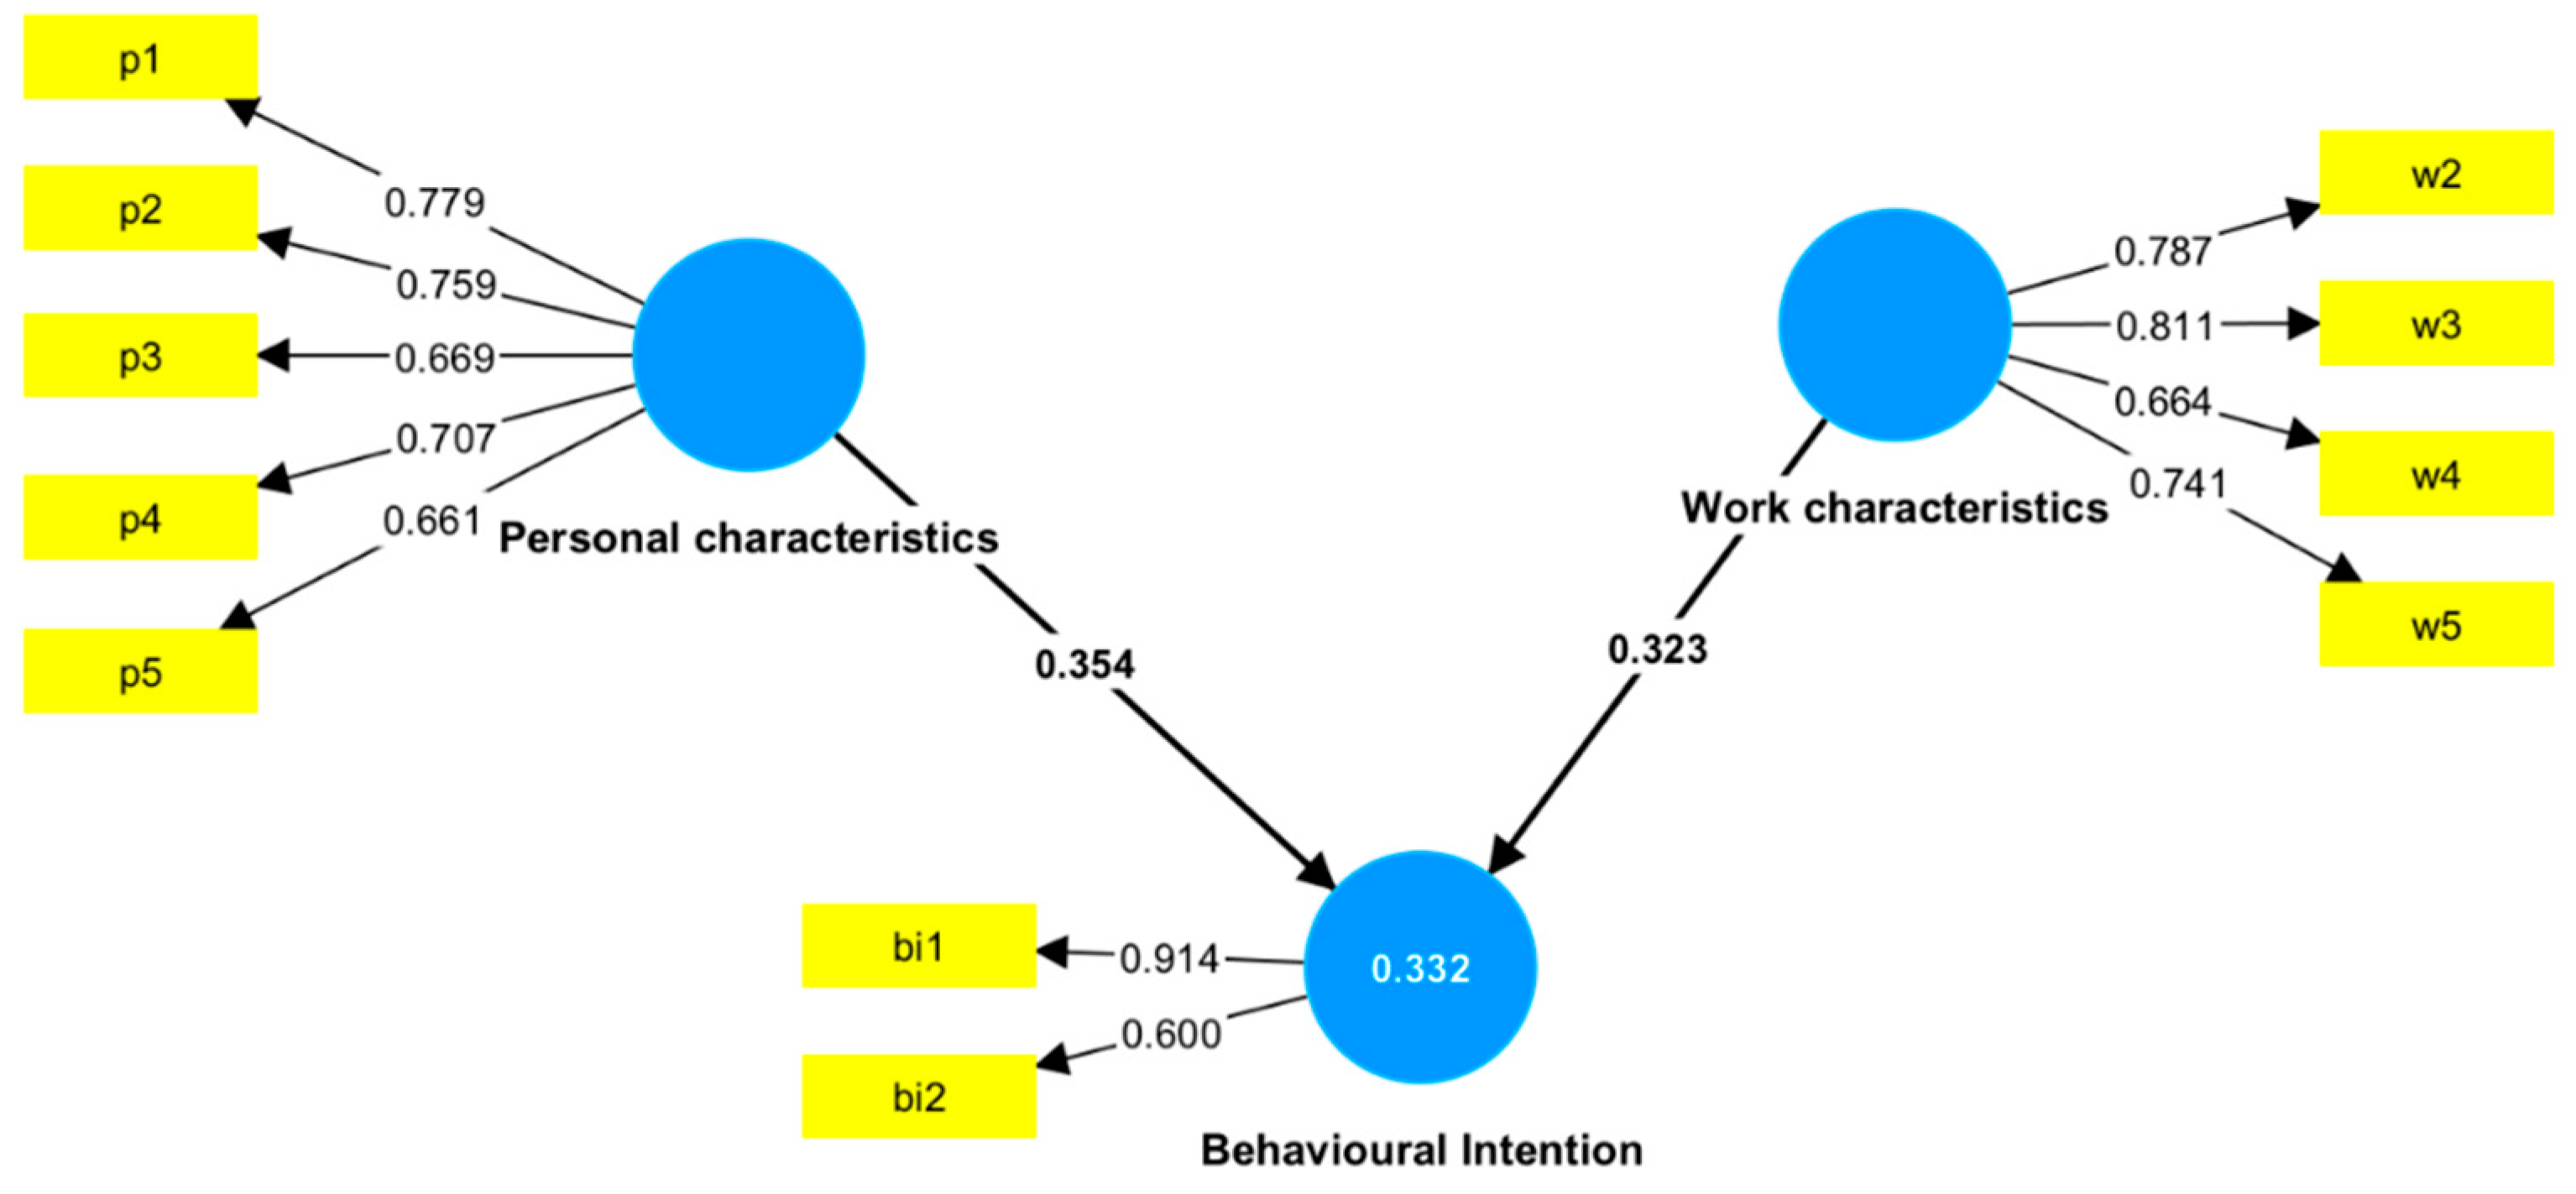

Table 1.
Demographic Item.
| Measure | Item | Count | Percentage |
|---|---|---|---|
| Gender | Male | 162 | 49.5 |
| Female | 164 | 50.2 | |
| Other | 1 | 0.3 | |
| Age | 18-29 | 74 | 22.6 |
| 30-49 | 244 | 74.6 | |
| 50-65 | 9 | 2.8 | |
| 65+ | 0 | 0 | |
| Education | High school | 11 | 3.4 |
| College | 11 | 3.4 | |
| Bachelor | 160 | 48.9 | |
| Master | 141 | 43.1 | |
| Ph.D. | 4 | 1.2 | |
| Occupation | Student | 41 | 12.5 |
| Full-time employee | 222 | 67.9 | |
| Part-time employee | 31 | 9.5 | |
| Entrepreneur/Freelancer | 33 | 10.1 | |
| Total working hours per week | Less than 10h | 209 | 63.9 |
| 10-20h | 38 | 11.6 | |
| 21-40h | 58 | 17.7 | |
| 41-48h | 7 | 2.1 | |
| 49-60h | 5 | 1.5 | |
| More than 60h | 10 | 3.1 | |
| Desire to work as a gig now/ future | Yes | 303 | 92.7 |
| No | 24 | 7.3 |
Table 2.
Reliability and validity for constructs:.
| Item | Loading | CA | rho_a | rho_c | AVE | |
|---|---|---|---|---|---|---|
| Behavioral Intention | Bi1 | 0.914 | 0.767 | 0.773 | 0.741 | 0.598 |
| Bi2 | 0.600 | |||||
| Personal characteristics | P1 | 0.779 | 0.764 | 0.772 | 0.840 | 0.514 |
| P2 | 0.759 | |||||
| P3 | 0.669 | |||||
| P4 | 0.707 | |||||
| P5 | 0.661 | |||||
| Work characteristics | W2 | 0.787 | 0.746 | 0.760 | 0.839 | 0.567 |
| W3 | 0.811 | |||||
| W4 | 0.664 | |||||
| W5 | 0.741 |
Table 3.
Discriminant validity for constructs (Heterotrait-Monotrait ratio (HTMT) - Matrix):.
| Behavioural Intention | Personal characteristics | Work characteristics | |
|---|---|---|---|
| Behavioral Intention | |||
| Personal characteristics | 0,834 | ||
| Work characteristics | 0,484 | 0,590 |
Table 4.
Discriminant validity (Fornell-Larcker criterion).
| Behavioural Intention | Personal characteristics | Work characteristics | |
|---|---|---|---|
| Behavioural Intention | 0,773 | ||
| Personal characteristics | 0,499 | 0,717 | |
| Work characteristics | 0,481 | 0,447 | 0,753 |
Table 5.
VIF inner model.
| VIF | |
|---|---|
| Personal characteristics -> Behavioral Intention | 1.250 |
| Work characteristics -> Behavioral Intention | 1.250 |
Table 6.
Structural estimates (Hypothesis testing):.
| Hypothesis | Std Beta | T-Statistics | p-Value | F square | Effect size | Decision |
|---|---|---|---|---|---|---|
| H1: PC | 0.354 | 6.376 | 0.000 | 0.150 | Medium | Supported |
| H2: WC | 0.323 | 5.839 | 0.000 | 0.325 | Medium | Supported |
Disclaimer/Publisher’s Note: The statements, opinions and data contained in all publications are solely those of the individual author(s) and contributor(s) and not of MDPI and/or the editor(s). MDPI and/or the editor(s) disclaim responsibility for any injury to people or property resulting from any ideas, methods, instructions or products referred to in the content. |
© 2023 by the authors. Licensee MDPI, Basel, Switzerland. This article is an open access article distributed under the terms and conditions of the Creative Commons Attribution (CC BY) license (http://creativecommons.org/licenses/by/4.0/).
Copyright: This open access article is published under a Creative Commons CC BY 4.0 license, which permit the free download, distribution, and reuse, provided that the author and preprint are cited in any reuse.


