
Submitted:
13 June 2023
Posted:
14 June 2023
You are already at the latest version
Abstract
Spectrally weighed irradiance on the corneal plane is often used to determine the visual and non-visual potency of light. Spectral irradiance or illuminance is measured with a diffuser in the so-called 2π geometry (i.e., a hemispheric measurement). Due to anatomical conditions, the human binocular field of view (FOV) does not correspond to a hemisphere but is occluded upwards and downwards. FOV-restricted measurements are scarce, however, and thus the error when using hemispheric measurements is yet to be determined. For our study, we designed and 3D printed FOV occlusions as attachments to spectral measurement devices. Measurements with and without the occlusion were taken in different lighting situations in the laboratory (light from different directions) and in real-world conditions (light typically from above). Our measurements show a reduction of visual and melanopic values due to the FOV occlusion ranging from negligible to over 60% for realistic scenarios. Further, the reduction was comparable for visual and melanopic parameters, as the distribution of light in the FOV was generally spectrally homogeneous. In the case of an exemplary and artificial laboratory situation, however, the melanopic daylight (D65) efficacy ratio changed by more than a factor of 2 only due to the FOV occlusion. Finally, head orientation showed a marked impact on all quantities. Our results reveal the potential for considerable error when just evaluating and comparing vertical, hemispheric measurements in experiments and non-visual lighting design projects. We thus encourage the (additional) use of a FOV occlusion for eye-level measurements in typical viewing directions and provide open-source 3D-print files.
Keywords:
Field of View
; FOV
; non-visual effect of light
; non-image-forming effect of light
; NIF
; ipRGC
; melanopsin
; corneal illuminance
; retinal illuminance
; head orientation
; gaze
1. Introduction
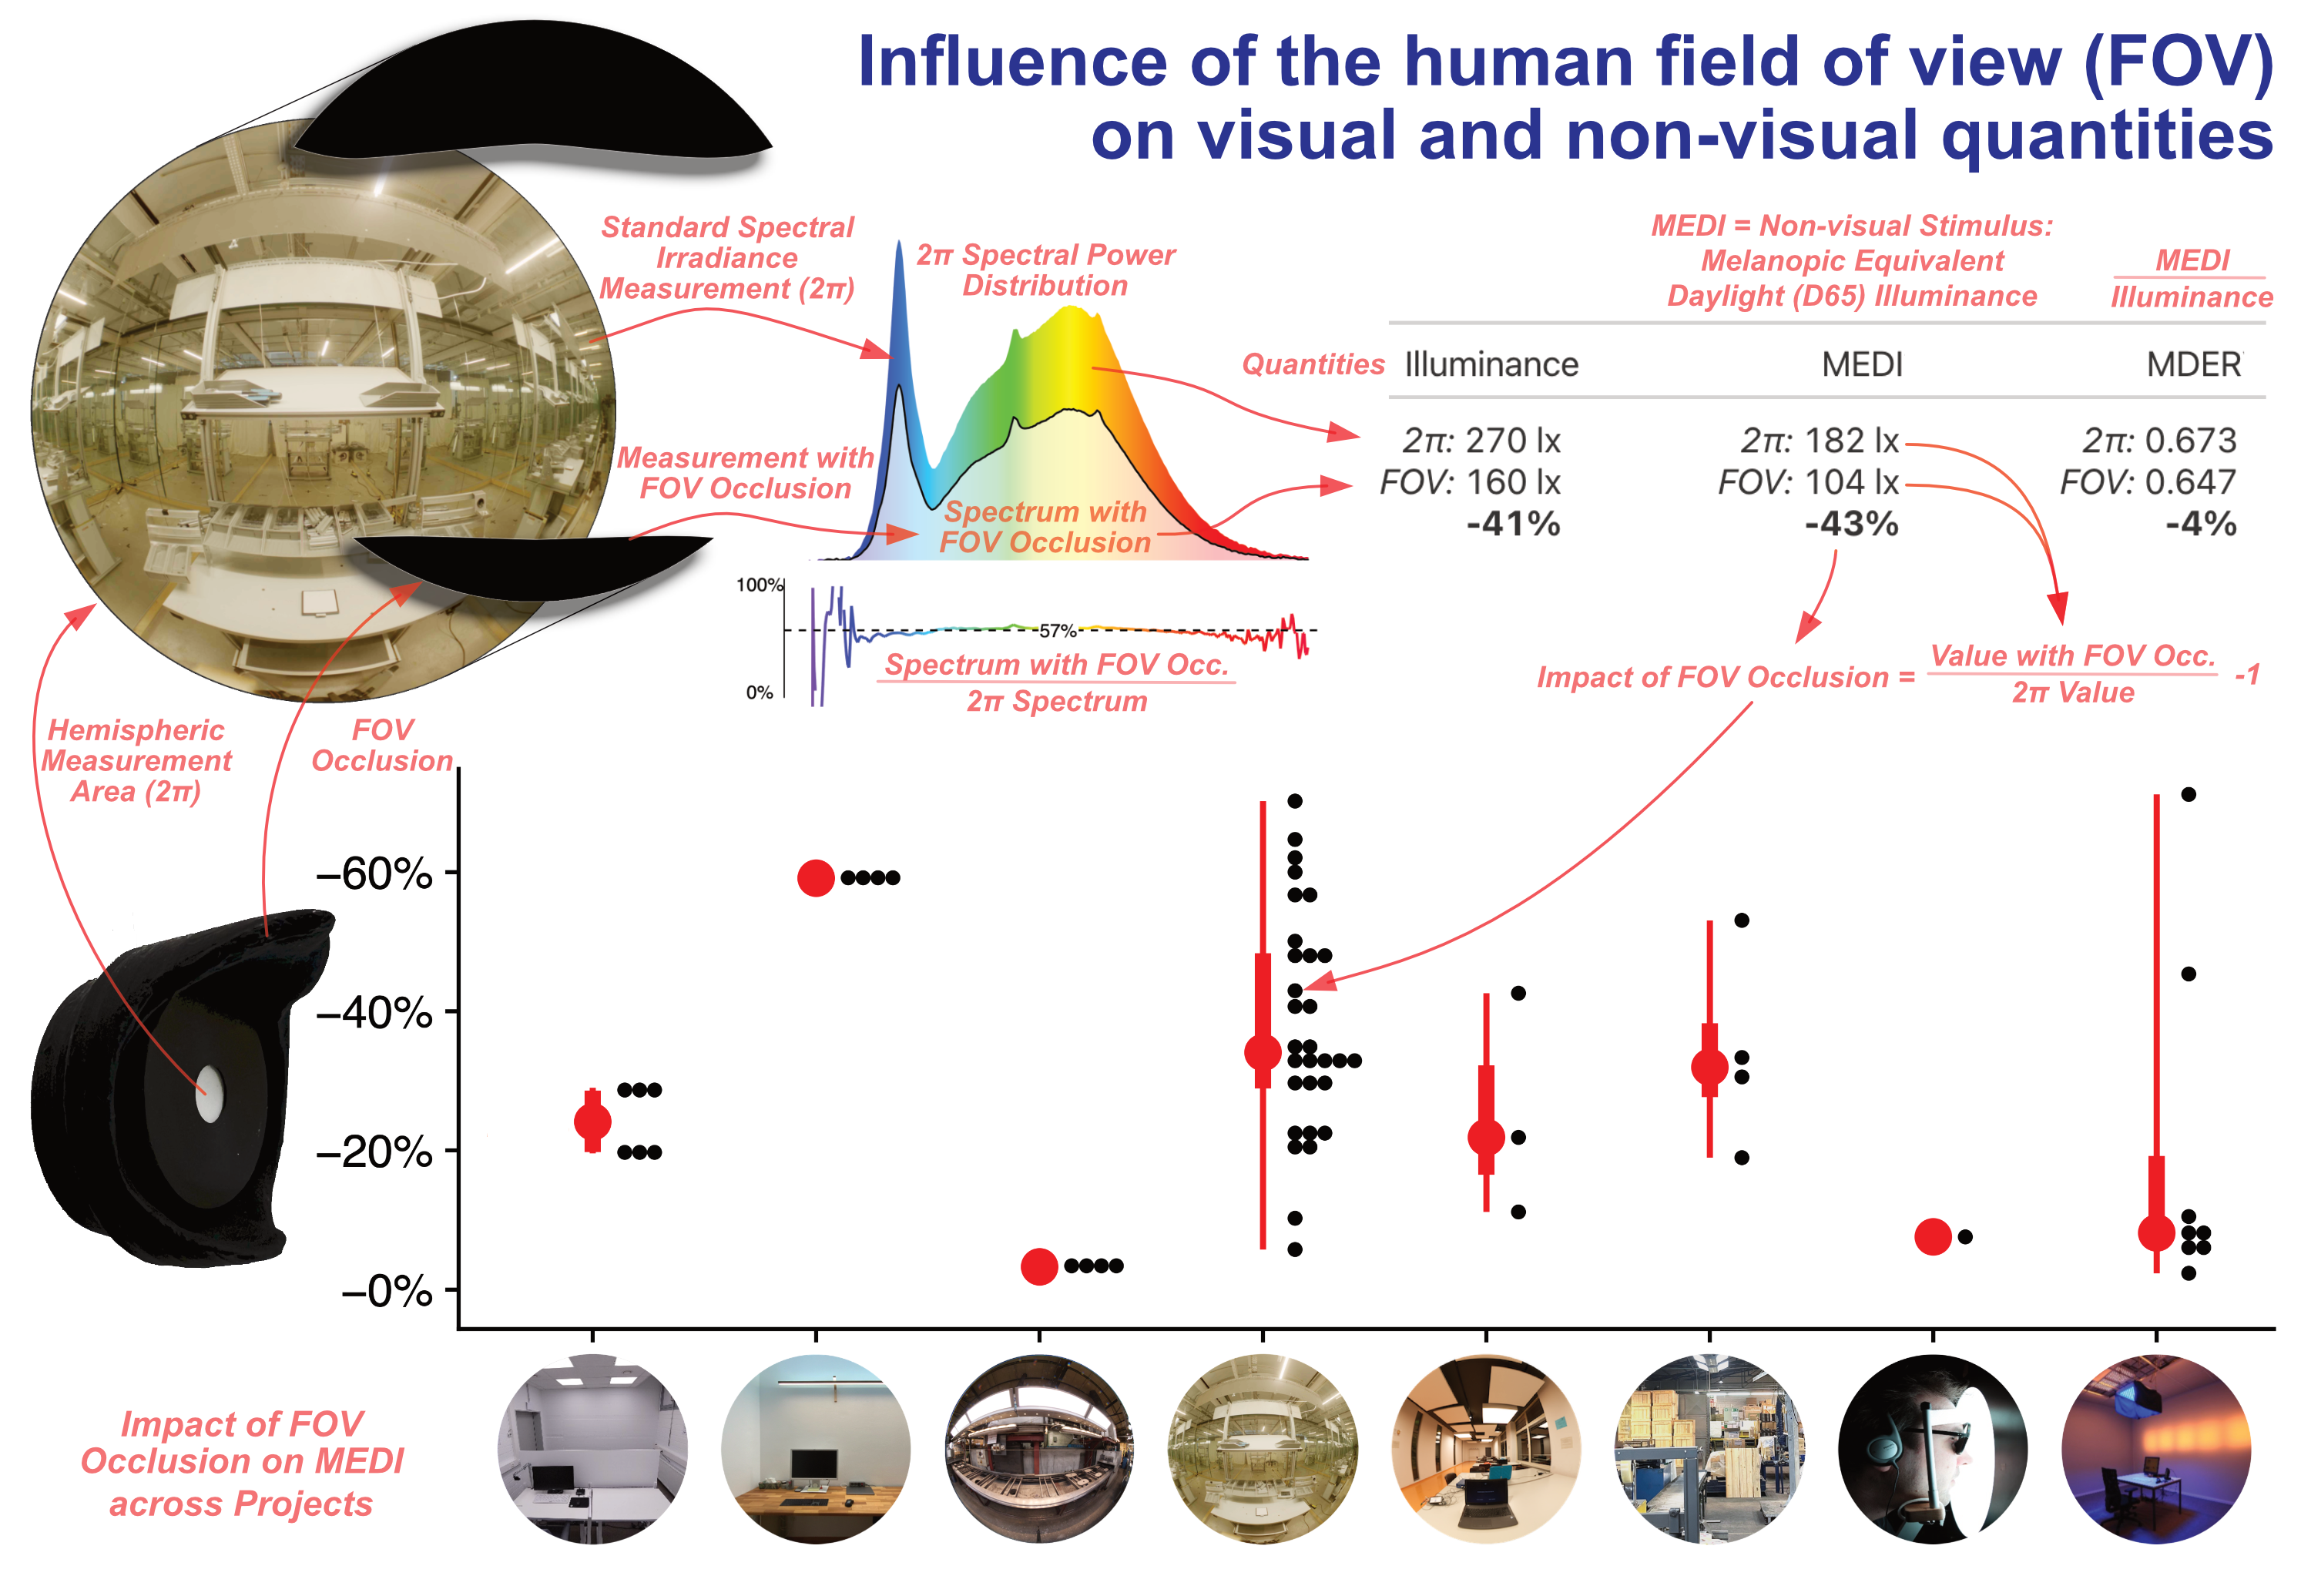
Light that reaches the photoreceptors in the retina elicits visual and non-visual effects in humans [1]. However, measuring the illuminance on the retina to precisely predict those effects is not possible for practical reasons [2]. Instead, corneal illuminance is typically used as a proxy for non-visual effects by measuring illuminance or spectral irradiance at the position of an observer’s eye and in the orthogonal plane to the straight gaze. These measurements integrate the inciding luminous flux or spectral radiant flux from the whole hemisphere in front of the measurement device. This is sometimes called a 2π geometry, due to the solid angle of a half- or hemisphere. A hemispheric measurement at eye level thus includes incidence angles that are occluded by human anatomy, such as the brow, eylids, or the cheekbone. It would be more precise to only consider light that can enter the eye, i.e., light that reaches the eye´s pupil through the binocular visual field of view (FOV). The CIE recommends this approach in Annex A.6 of the standard CIE S 026:2018 [3]. This either requires an occlusion (which the CIE termed radiance hoods) to reduce the detection areas of photometers and spectroradiometers to that of the FOV. Alternatively, an imaging measurement can be used, e.g., from a luminance camera, where only relevant angles inside the FOV are included in postprocessing [4-6]. While both approaches are currently possible, they are not common practice when designing and reporting projects and studies. This poses a problem of replication and standardization for the non-image-forming effects of light (NIF). In the following paragraphs we will go into more detail on the differences between the FOV and current 2π measurements, before we go into the resulting problem and our first tentative steps in solving it.
The human binocular visual field results from the superimposition of the monocular visual fields of the left and right eye. The maximum possible visual field of the individual eyes without head or eye movements is limited by the anatomical conditions of the eyes in the orbit (eye socket) and the position of the eyelids [7]. In Figure 1(a), the overlapping visual fields (in the hemisphere) of a simplified set of eyes are shown in red and blue, where the binocular visual field is composed from all filled areas. This is based on Guth's representation of the binocular visual field [8]. Similar representations also exist in Taylor [9]. It should be emphasized that the individual visual field can be larger or smaller. It is influenced by many factors, such as the observer (age, health, gender, experience, etc.) and the stimulus (size, luminance, contrast, etc.). The areas shown in Figure 1(a) thus only provide orientation.
The informative part of the standard CIE S 026:2018 [3] also recommends limitations for incidence angles based on the FOV. According to the standard, the vertical field of view can be assumed to extend up to +50° and down to -70° relative to the line of sight. Those values are given for indoor environments and at low illuminance. The horizontal field of view is limited for each eye on one side by the nose. Temporally, the visual field extends over approximately ±90°. For binocular vision, the horizontal field of view should be assumed as 180° [3]. Figure 1(b) represents this FOV. It should be noted that the visual field extends beyond 180° in the horizontal direction, as Strasburger [10] lays out in Seven Myths on Crowding and Peripheral Vision. Based on measurements by Rönne [11], the horizontal FOV reaches ±107° or 214°, but regularly ends at ±90° in many publications due to measurement technology and/or stimulus presentation [10].
Any way the FOV is defined, differences arise between the incident light on the cornea and on a 2π geometry. For the same vertical illuminance, the spatial distribution of light sources – and thus their proportion of incident light within the FOV - can differ significantly [4]. A light source with high luminance can make up a large proportion of the (unrestricted) vertical illuminance but is possibly outside of the FOV. One example of such a situation is the typical office lighting with luminaires high at the ceiling. The given scenario would systematically overestimate the perceived illuminance or the non-visual stimulus when we measure with a 2π geometry. This effect is further amplified when considering that in offices, people typically spend most of their time working with their heads slightly tilted downward, looking at the screen, and thus excluding even larger ceiling areas with lights from their FOV [12].
This exemplary real-world scenario clearly deviates from the experimental setups of some of the most relevant studies in NIF research [1] as summarized in Table 1. Those studies are also a basis for our current understanding of recommended light exposure during the day, evening, and nighttime [13]. In those studies, most stimuli are presented either as a Ganzfeld illumination or in the central field of view. This means that most if not all light is within the FOV of the observer. Thus, the 2π-measurement of illuminance at the eye level is likely a valid measure for the light entering the eye.
As the field moves from artificial experimental setups (Table 1) to more realistic setups [33, 34] and especially field studies [35-39], we have to expect FOV occlusion to play a bigger role. If not considered, FOV occlusion can introduce unintended and unaccounted for variance when replicating a study setup, comparing results across publications, or just implementing recommended stimulus intensities in the lighting design. At present, however, there is scarce literature on how much deviation can be expected in common scenarios between established measures of (visual and) non-visual stimulus intensity and their FOV occluded versions.
We thus designed FOV occlusions according to the standard CIE S 026:2018 [3] to measure the actual corneal illuminance or irradiance reaching the eye more precisely. These occlusions were 3D printed from matte-black plastic. In addition, adapters were constructed that allow for the combination of the field of view aperture with commercially available models of spectroradiometers. In principle, the FOV occlusions can also be used on photometer measurement heads.
In this exploratory and multicentric experiment, we measured the effect of FOV occlusion on spectral irradiance and it´s derived quantities in various scenarios and lighting situations. We wanted to know whether such an occlusion is relevant for those quantities and under which circumstances. Further we wanted to get a sense for the magnitude and range of the impact of FOV occlusion overall. To this end, we took measurements with and without a FOV occlusion in 60 scenarios across 8 projects. The projects span artificial and realistic lighting situations in lab experiments and real-world workplaces.
We made the 3D print files for the FOV occlusion publicly available as part of this paper [40]. We hope that this will encourage other researchers to use them for non-visual light measurements and report their results alongside the established parameters. In time, this will allow for a far better estimate of the effects of FOV occlusion than our first exploratory analysis of scenarios provides in the next section.
2. Results
2.1. Overview
Table 2 and Table 3 contain the results for 20 out of the 60 measured scenarios across eight projects (A-D). The twenty scenarios were chosen based on their relevance and are numbered (1-20). Each project result will be summarized in the next subsection, project descriptions are in Appendix A. Projects are ordered narratively, starting with realistic or real workplaces (Project A-F), followed by artificial laboratory settings (Projects G-H). Results for all 60 scenarios are summarized in Figure 2 and can be found in the Supplementary Information S1.
All measurements were taken at the observer´s eye position and are vertical if not otherwise stated. Further, all scenarios are limited to artificial light. No daylight was present, even if some are named after times of the day. From the measured spectral irradiance, the main quantities were calculated and relative differences for the FOV occlusion determined (see Section 4, Material and Methods, for details). The analysis includes illuminance as a visual quantity and Melanopic Equivalent Daylight (D65) Illuminance (MEDI) [3] as a quantity for the non-visual stimulus strength. Lastly, the Melanopic Daylight (D65) Efficacy Ratio (MDER) [3] is given as the fraction of non-visual to visual quantity.
2.2. Project Results for Scenarios 1-20
2.2.1. Project A: Realistic Office Lab Study, Scenarios 1-3
The FOV occlusion leads to a sizable reduction of the visual and non-visual quantities (-28 to -29% reduction), with little to no variation between scenarios. The occlusion is further nonspecific to spectral wavelength and thus MDER (0% change).
2.2.2. Project B: Home Office Workplace, Scenarios 4-6
The FOV occlusion reduces the visual and non-visual quantities by more than half (-58 to -60%). Further, even though the directionality of light (and spectrum) changes, we see the exact same behavior as in project A, i.e., very little variation of occlusion impact between scenarios. This can be attributed to the luminaire being mounted quite high above the observer, outside the FOV. Distributional changes between scenarios thus happen outside the FOV and have no impact on the proportion of light within to outside (changes in MDER 0 to -2%).
2.2.3. Project C: Industry Field Study (Machine Workplace), Scenarios 7-8
The FOV occlusion leads to a negligible reduction of the visual and non-visual quantities (-3 to -4%). Further, even though the directionality of light (spectrum) changes, we again see very little variation of occlusion impact between scenarios. Both aspects can be attributed to the workplace lighting, which is the dominant illuminant and within the FOV of the observer, while all surrounding areas are quite dark. Almost all light thus comes from within the FOV and changes of spectrum and light distribution don´t matter for the FOV occlusion (changes in MDER 0 to 1%).
2.2.4. Project D: Industry Workplace, Scenarios 9-10
The FOV occlusion leads to a very high reduction of the visual and non-visual quantities (-41 to -60%). Further, this is the first project where we see variation in the impact of FOV occlusion between scenarios. This is because the proportion of light within the FOV increases by turning on the individual task lighting (from 40% to 57%, see the relative spectral power distribution (rSPD) between scenario 9 and 10). The spectral impact of the FOV between scenarios is still negligible, however (changes in MDER -2 to -4%).
2.2.5. Project E: Learning Space, Scenarios 11-13
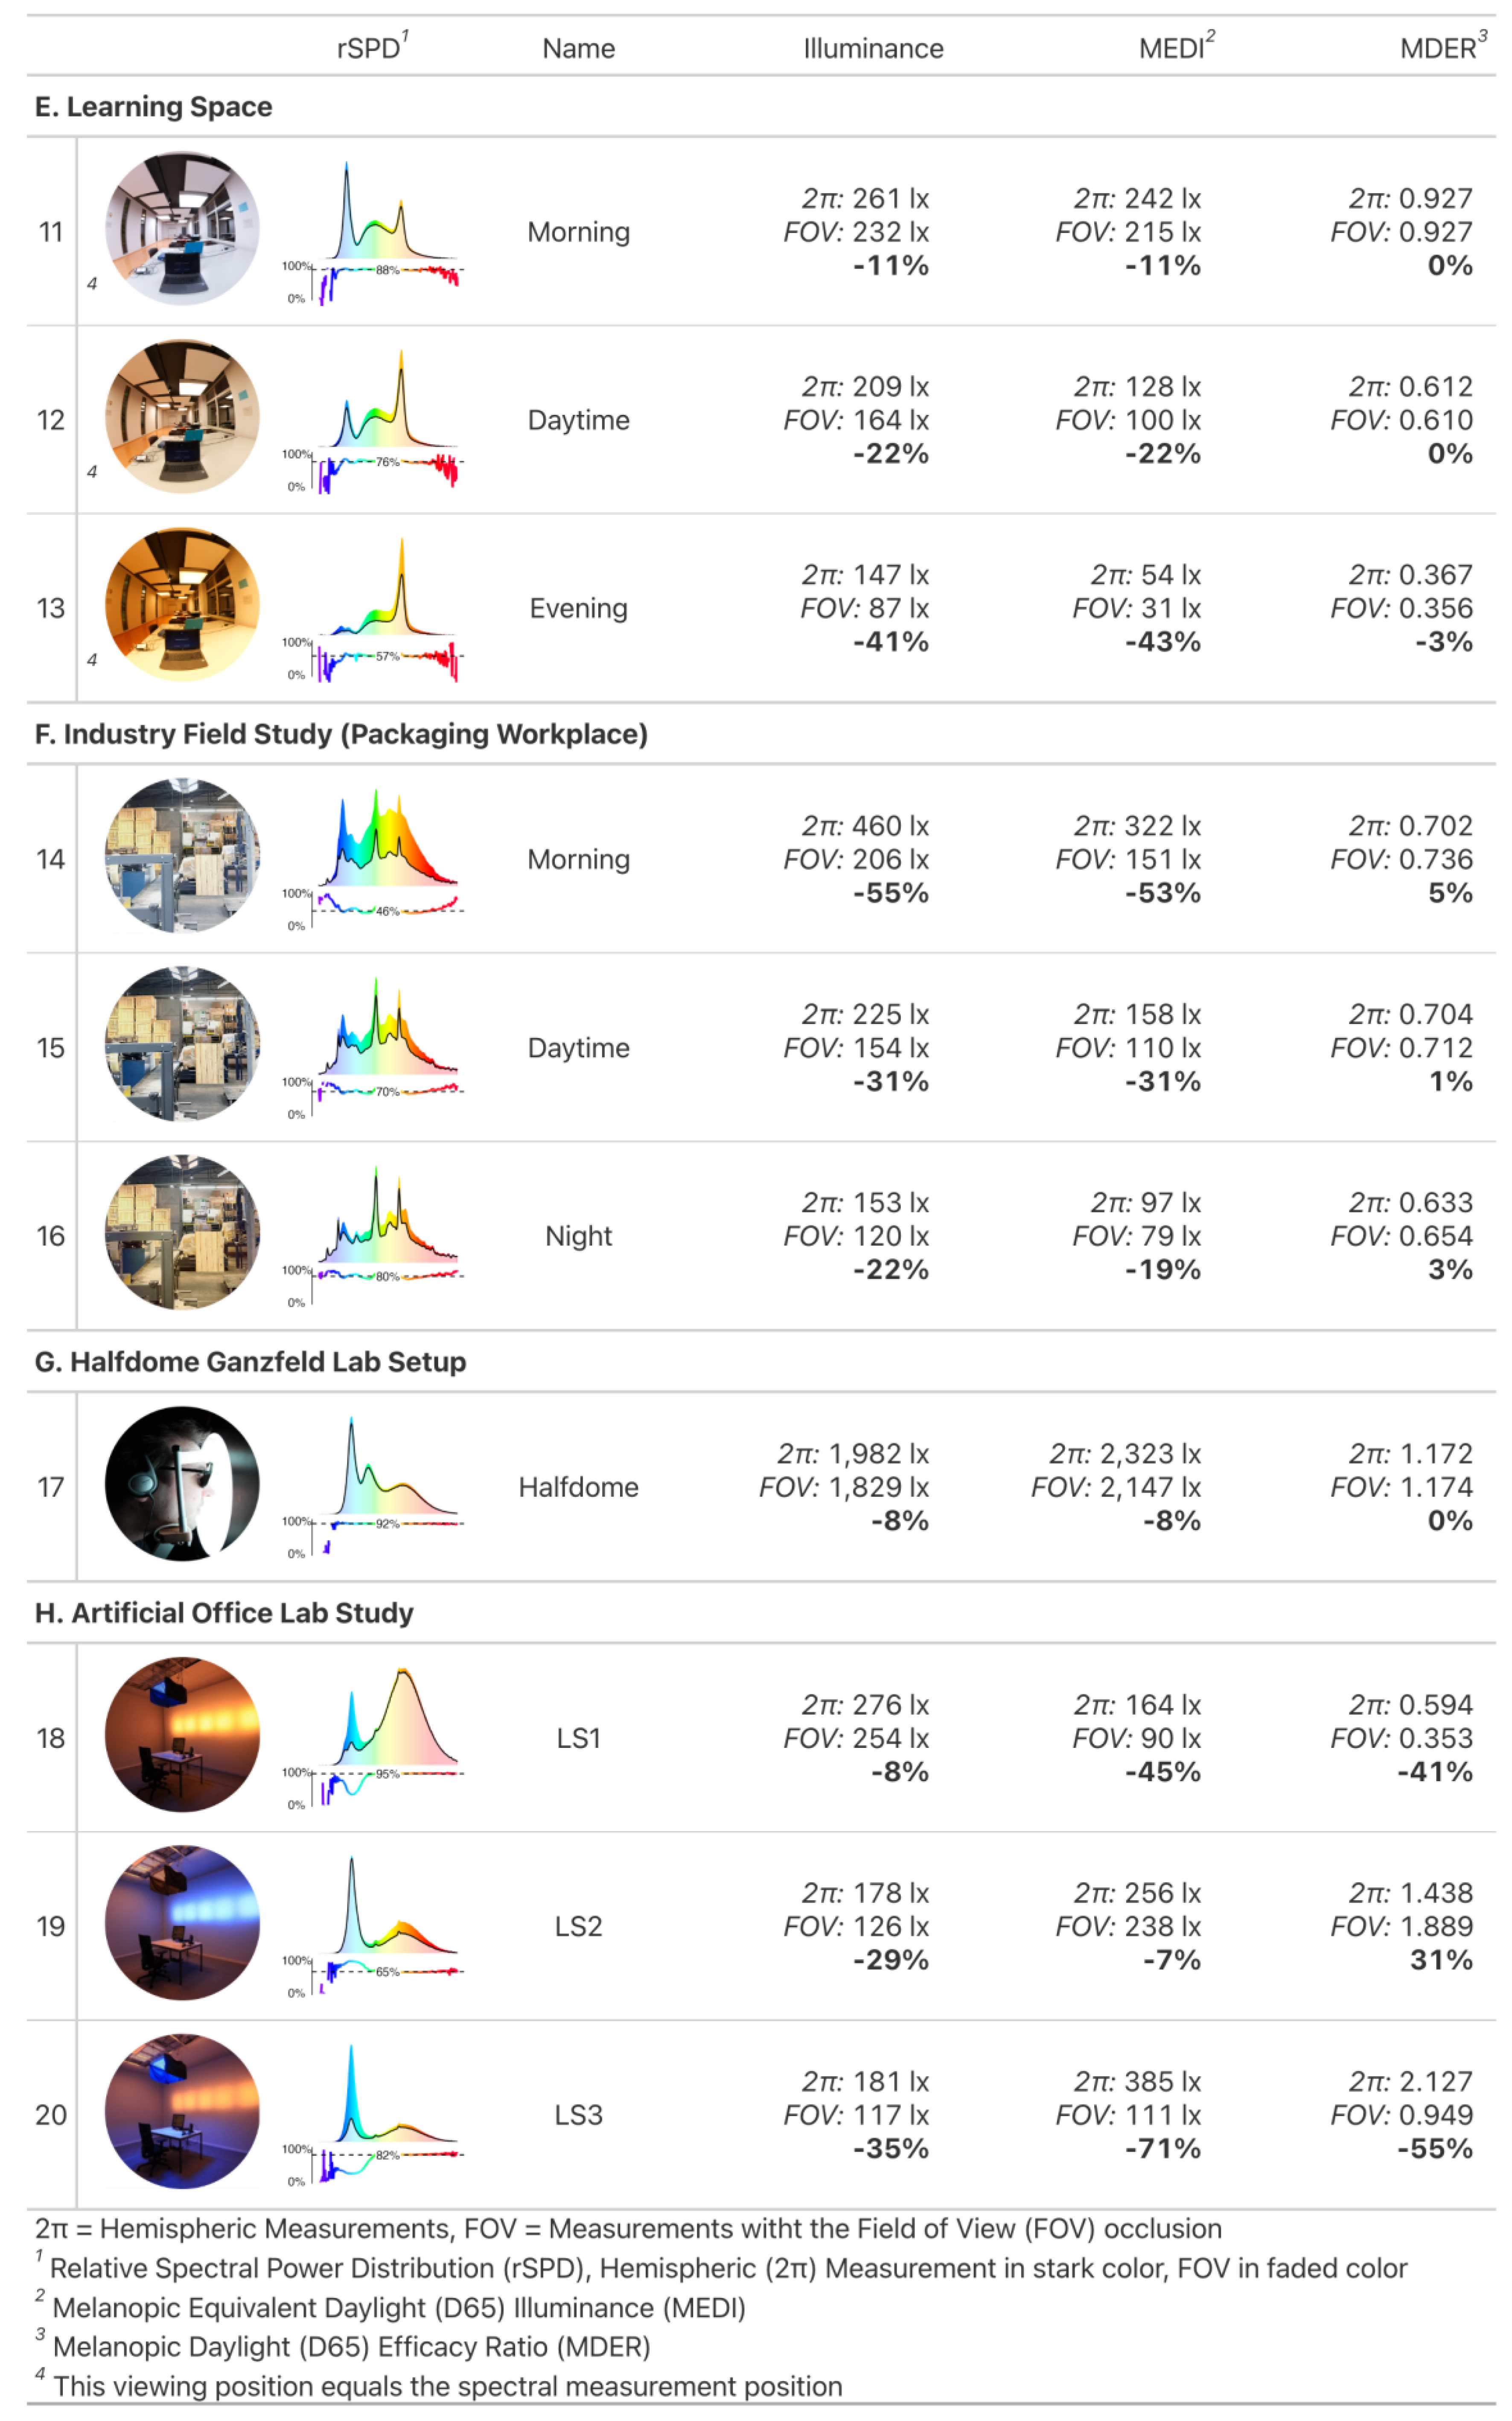
The FOV occlusion leads to a range of small to high reduction of the visual and non-visual quantities (-11 to -43%), depending on the scenario. This is quite a variation and can be attributed to the changing light settings between panel-light and spotlight fixtures. The spotlight fixtures above the observers’ table are outside the FOV, and their increasing contribution to quantities from unoccluded measurements also changes the impact of the FOV occlusion quite dramatically. Whereas the dominant panel lights illuminate the vertical surfaces of the walls within the field of view in scenario 11, their relative contribution compared to the spotlights is gradually reduced over scenarios 12 and 13. Despite the variation of the impact of FOV occlusion, spectral differences remain negligible (changes in MDER 0 to -3%).
2.2.6. Project F: Industry Field Study (Packaging Workplace), Scenarios 14-16
The FOV occlusion again leads to a small to high reduction of the visual and non-visual quantities (-19 to -55%). But even though the different light settings follow the same principles as described in project E, the order of impact levels from FOV occlusion is reversed from high to small! In this case, the dynamic lighting is mounted higher, and the observer’s position is on the periphery of the workspace. The singular dynamic light above the observer thus has a high impact on visual and non-visual quantities without a FOV occlusion, but not with (scenario 14). As the luminous flux coming from the dynamic light is gradually reduced across the day (scenarios 15 & 16), the static stock lighting in the FOV becomes more dominant. The impact of FOV occlusion is thus also gradually reduced. Despite this variation of the impact of FOV occlusion, spectral differences remain negligible to small (changes in MDER 1 to 5%).
2.2.7. Project G: Halfdome Ganzfeld Lab Setup, Scenario 17
The FOV occlusion leads to a very small reduction of the visual and non-visual quantities (-8%), with no spectral differences (changes in MDER 0%).
2.2.8. Project H: Artificial Office Lab Study, Scenarios 18-20
The FOV occlusion leads to the largest variation in reduction of the visual and non-visual quantities (-8 to -71%). This is because the artificial laboratory setup is designed to evoke stark spectral contrasts, and here it pays to look at the graphs of rSPD in Table 3.
Scenario 18 shows almost no change on the visual side (-8%), because the dominant source of brightness comes from the wall straight ahead. It contributes little, however, to short wavelengths of high melanopic efficacy. Most of those spectral parts come from the panel straight above, outside the FOV. MDER and MEDI are thus highly affected by a FOV occlusion (-41% and -45%, respectively).
Scenario 19 flips the spectra for wall lights and ceiling panel, and the effects are flipped as well. Illuminance is highly reduced by the FOV occlusion (-29%), but MEDI are not (-7%). This leads to an increase in MDER by 31%.
Scenario 20 is a variant of scenario 18, but with flipped luminous intensities between wall and ceiling luminaires. This means that the general effects between visual and non-visual quantities and MDER are the same, but since most of the light now comes from the ceiling panel (instead of the wall), FOV occlusion restricts proportionally more light overall. Thus, illuminance is reduced by 35%, MEDI by 71%, and MDER by 55%.
2.3. Impact of head orientation (Project D)
In project D, 14 head orientations were measured in 15° increments besides the view straight ahead (used in scenarios 9 and 10). Figure 3 summarizes the results for MEDI and all 15 orientations, when individual task lighting is turned on.
In the horizontal direction, there is considerable variation in the relative impact of FOV occlusion (-22 to -50%), but not MEDI (104 to 118 lx). This means that different proportions of light are occluded by the FOV (impact), but that this is offset by overall light levels. The same characteristic can be observed for horizontal steps with the head 15° lowered (Y:-15° in Figure 3).
In the vertical direction, MEDI values rise when looking up and fall when looking down (68 to 391 lx). Further, as the head is directed upwards by 15°, the impact of FOV occlusion gets more prominent (-57% at Y:15°, compared to -43% at Y:0°), before it lessens with greater angles (-34% at Y:30°, and -6% at Y:45°). As the head is directed downward, the impact generally lessens, even if there is a small rise at the last step (-22% at Y:-15°, -20% at Y:-30°, and -29% at Y:-45°).
All of this may be explained by looking at the room layout. When looking straight ahead (or slightly upwards), workplace lighting straight above the observer will have a high impact on illuminance and MEDI, but it´s position is outside the FOV, thus the impact of FOV occlusion is high. As the observer looks further up, more and more ceiling lights move into the FOV, thereby decreasing the impact of FOV occlusion, but increasing light levels and MEDI at the eye. When looking downwards, ceiling lights will move outside not only the FOV, but also the 2π geometry, which reduces the impact of occlusion, while reducing light levels and MEDI at the same time. As the observer looks further down, parts of the illuminated table surface move outside the FOV and the darker floor comes into the view. This leads to a slight increase in the impact of FOV occlusion and further decrease in MEDI.
3. Discussion
In the last section, effects of the human field of view in measurements regarding the corneal plane were demonstrated. We wanted to know whether and when a FOV occlusion according to the standard CIE S 026:2018 [3] was relevant for indoor environments. We designed a FOV occlusion for spectral irradiance measurement devices and took measurements from eight projects across laboratory and real-world workplace setups to get a first tentative answer to those questions. To the best of our knowledge, there are no other publications that have taken on this topic with the focus on melanopic parameters. Our endeavor might sound trivial, as most takeaways in this section can be deduced from geometric principles of light measurement, FOV occlusion angles, and the specifics of luminaires in a scene. It is true that very little (but not none) of the results have surprised us in their general shape. Now, however, we have a first numeric basis for the effect size of FOV occlusion on the quantities we work with regularly for non-visual research.
We first want to give a high-level summary, before we get to overarching project results, limitations of our study, and the further discussion of results in a wider context:
- FOV occlusion is highly relevant for the visual and non-visual stimulus intensities in the context of realistic light-source positioning (mostly 20% to 60% reduction).
- Notable Edge cases lead to a particularly high or low impact from occlusion (as low as -3% impact, to as high as -71%).
- FOV occlusion seems largely irrelevant for the spectral distribution (MDER). Only artificially constructed scenarios mattered in that regard, but it might also matter in spectrally diverse scenarios that were outside the scope of our projects.
- FOV occlusion is highly relevant in interaction with the head orientation. (as low as -6% impact, to as high as -57% for the same scenario, just by tilting the sensor)
3.1. Summarizing project results
Several more specific points can be drawn from the project results. If not otherwise stated, impact scores for the FOV occlusion reference MEDI.
- Dimming and tunable white:
-
Changing the spectrum of light (correlated color temperature (CCT) shift) across all lights in a scene the same way does not change the impact of FOV occlusion (Scenario 1-2, all about -29%).Changing the light output across all lights in a scene the same way does not change the impact of FOV occlusion (Scenario 2-3, all about -29%).
- Direct/indirect lighting:
- Changing the direction of light and spectral distribution outside the FOV does not necessarily change the impact of FOV occlusion (Scenario 4-6, all about -60%), but see below under Spotlights and panels.
- Changing the direction of light and spectral distribution within the FOV does not necessarily change the impact of FOV occlusion (Scenario 7-8, all about -3%)
- Installation height:
- High mounted lights will have a large impact on FOV occlusion (Scenario 4-6 & 9, up to -60%), but the impact can be reduced by wide beam lights in larger rooms, where more lights are visible at a lower viewing angle (Scenario 1-3, about -29%; scenario 12, about -22%).
- Low mounted or desk lighting will reduce the impact on FOV occlusion (Scenario 7-8, about -3%; scenario 10: -43% compared to scenario 9: -60%)
- Spotlight and panel-light fixtures:
- Mixing spot and panel-light fixtures in dynamic lighting can produce beneficial effects through FOV occlusion. In scenario 11 the goal is to maximize MEDI: The dominant panel lights illuminate the room evenly and lead to little FOV occlusion impact (-11%). In scenario 13 the goal is to minimize MEDI: The dominant spotlights illuminate mainly the desk surface, but the light source above the desk is also a large contributor to the standard 2π geometry. The FOV occludes this part, however, and thus reduces the MEDI further (-43%). The resulting dynamic MEDI range thus increases from the 2π geometry (242 lx/54 lx: factor 4.5) when adjusting for the FOV occlusion (215 lx/31 lx: factor 6.9)
- Mixing spot and panel-light fixtures in dynamic lighting can produce detrimental effects through FOV occlusion. In scenario 14 the goal is to maximize MEDI: the dominant light panels are only above the observer, however, and don´t illuminate the large hall (-53%). As MEDI values are supposed to get lower (Scenario 15-16), the panel lights are dimmed in favor of the spotlight fixtures – those do little, however, in lowering the light coming from the rest of the production hall (-19%). The resulting dynamic MEDI range is thus reduced from the 2π geometry (322 lx/97 lx: factor 3.3) when adjusting for the FOV occlusion (151 lx/79 lx: factor 1.9).
- Head orientation (subsection 2.3):
- (Near) vertical measurements lead to the highest FOV occlusion impact (Y±0: -43; Y+15: -57%), whereas large tilts up- and downwards reduce the impact considerably (Y+45°: -6%; Y-45°: -29%). We find it likely that this tendency is generalizable for typical workplace settings with overhead lighting (see 2.3 for more on this reasoning). While changes along the horizontal axis influenced FOV occlusion as well, we don´t believe this can be generalized beyond our measurements.
- Miscellaneous:
- Ganzfeld setups are small but not negligible in terms of the FOV occlusion impact (Scenario 17, -8%), and real-world settings can have lower occlusion (Scenario 7-8, about -3%).
-
The FOV occlusion reduces spectral irradiance by about the same amount regardless of wavelength (rSPD for scenarios 1-18). Thus visual, and non-visual quantities are also reduced in the same manner and changes in MDER are negligible.This was not obvious to us as a common staple from the start. We believed that different spectral light or reflectance properties inside the FOV compared to outside might lead to significant deviations across the spectrum and thus MDER. While the surfaces in some projects are all neutral in their reflectance properties (Scenario 1-3, 7-10), in others they are not (e.g., wooden desk in scenario 4-6; or wooden crates within the FOV in scenario 14-16). However, only when artificially forcing strong differences in spectral distribution, did we see an effect (Scenario 18-20). Similar effects might happen in very colorful settings.
3.2. Limitations
There are several limitations of note when interpreting and generalizing the results from this study. Firstly, the selection of projects and subsequent scenarios are the very definition of an opportunity sample. All of them were existing projects where we had the opportunity to perform the necessary measurements. We do not claim that they are representative for workplaces in general and have thus refrained from calculating overall means or variance parameters. That said, we believe the projects provide a decent starting point with various lighting solutions. Special caution should be taken in situations with very colorful surface materials or lights (see scenario 18-20).
Secondly, there is some evidence that differing incidence angles of light in the eye can change the non-visual effect to an otherwise identical stimulus. Our results cannot contribute to this line of investigation, however. Lasko et al. [41], e.g., showed a significantly higher melatonin suppression when 500 lx of light came from above the gaze compared to below. However, both stimuli originated within the FOV (upper vs. lower FOV). Our measurements integrate either over the full FOV (with occlusion) or the 2π hemisphere (without). Any information about the directionality of light within the FOV is thus lost, as we were only interested in the proportion of light within to outside. Project C provides a nice example, as the direction of light changes from the panel light above in scenario 6 to the reflection of the spotlight from the workbench below in scenario 7. None of this is reflected in the impact of FOV occlusion that remains at -3% between scenarios.
Thirdly, the eye can rotate in the orbit, which determines the gaze direction in a stricter sense. This limits the FOV even further as He and colleagues recently showed with a mathematical model and accompanying measurements [42,43]. Our FOV occlusions do not account for any gaze directions other than straight ahead (Figure 1). We thus avoided the term gaze direction in favor of the more specific head orientation or horizontal view.
Lastly, beyond the FOV occlusion, another aspect arises from the definition of illuminance, which evaluates incident light from the hemisphere with the cosine function [44]. Thus, the higher the incidence angle (compared to the direction of gaze), the lower the relative contribution to illuminance and MEDI. The human eye does not behave like a cos-adapted lux meter in this regard, however, even if the overall curve shape of the dependency is similar [44, 45]. Compared to a cosine correction, the eye´s optical components reduce the incident light at any given angle less than a cosine correction would. Our FOV occlusion only cuts off angles outside the FOV but does not correct at angles within (see Supplemental Figure S3 for details). In a situation with a homogeneous luminance distribution in the visual field, this can lead to a difference of up to 6% compared to the integral measurement of the complete hemisphere [46]. Larger differences are to be expected in real situations, and neither we nor the common measurement standards for visual and non-visual quantities account for those. The angles with the largest differences between the two curves (cos-adapted and eye) are at least shaded vertically by the FOV [45]. Some work in this direction was carried out by Van Derlofske et al. (46) in 2000, taking into account the angle-dependent characteristic of the eye, as well as the FOV limitations. An improvement in 2002 also enabled scotopic measurement [46,47].
3.3. Further Discussions and Outlook
Previous solutions to the topic of FOV occlusion in measurements include the above described apparatus by Van Derlofske and colleagues [46, 47], using specially adapted optics in front of a photometer. Another solution that we only briefly touched upon in the introduction is based on luminance measurement cameras, as described, e.g., by Broszio et al. (4) and Babilon et al. (5). Both methods have disadvantages, due to high costs (Van Derlofske: approx. $1,000 for photopic and scotopic measurements; luminance camera: >>10,000 $), limited or no spectral resolution, and limited availability (Van Derlofske: complex replica). The setup from He et al. [42, 43] involves two cameras, and while this allows for a ‘real’ FOV larger than 180° in the horizontal direction, it further increases cost and complexity. Other measurement methods that include spatial resolution, e.g., as described by Knoop et al. (6), have at least potentially similar capabilities to luminance cameras by simply choosing the measurement angles of relevance for the FOV. However, it is likely that they suffer the same downsides. An upside for measurements with spatial resolution in general is the possibility to add correction mappings that account for the non-cosine-adapted eye (see above). Another benefit is the flexibility regarding the FOV used in analysis. The CIE, for example, offers two FOV occlusion angles based on the overall luminance level that determines the state of the eyelids (indoor/outdoor scenarios) [3], and many more FOV models are described in the literature [10]. Fixed spatial approaches (such as ours) require an additional occlusion and measurement for each FOV, instead of applying (multiple) FOV’s after the fact in computation.
The method presented in this publication offers the advantage of spectral measurement if used with a spectroradiometer, but it can also be adapted to illuminance measurement devices. It is further low cost (material costs in 3D printing shouldn’t exceed a few euros), easy availability (public print files [40], short 3D printing duration), and adaptable to different geometries using CAD software to construct other mounting mechanisms. This provides researchers in the field of non-visual effects of light the opportunity to describe their lighting situations in laboratory and field studies more precisely with relatively little additional effort [6, 48]. By using the FOV occlusion on simple measuring devices like photometers, it also enables measurements of corneal illuminance in cases where a spectroradiometer is not available or practical.
We started out this publication with reference to some of the most relevant studies on non-visual effects of light that help us to define dose-response relationships and recommendations for stimulus levels across the day [1, 13]. As Table 1 clearly shows, those studies were conducted using predominantly Ganzfeld geometries or lights in the central FOV. Based on our results, we would expect a small (Scenario 17: -8%) or negligible (Scenario 7-8) impact for the FOV occlusion in those cases, respectively. Even this assumption might not hold, as Zauner et al. [49] report a 24% reduction of stimulus size when considering the FOV in the Ganzfeld dome of their study. This means there is at least some variation in the light distribution of Ganzfeld conditions. In practical situations with ceiling mounted lights, however, the deviation to the dominant conditions detailed in Table 1 is much higher. Our measurements show a significant reduction of up to 60% for illuminance and MEDI when considering the FOV (at horizontal view and realistic settings, see Table 2 and Table 3). These results are consistent with the still sparse literature on this topic [5, 46] and have a high relevance towards study design and replicability.
Let us imagine, e.g., that a lighting situation in an experiment was supposedly set to 250 lx MEDI, but only 150 lx MEDI can reach the eye (this would equal a FOV occlusion impact of -40%). If no corrections are made and only the 2π measurement is reported, the significant variance shown in Section 2 remains hidden, e.g., in a deduced dose-response relationship. If, on the other hand, corrections are made purely through luminous flux to achieve the target value, approximately 1.7 times the luminous flux would have to be applied. This raises the (unrestricted) vertical MEDI value to around 420 lx, which might be an acceptable solution for an experimental setting. However, it is hardly practical as a general recommendation, as it is energy consuming and might lead to other undesirable side effects. Rather, it should be solved through the types and arrangement of light sources, at least in real-world settings.
Another relevant aspect is the importance of head orientations. It seems that the standard vertical measurement direction (horizontal view) is particularly undesirable with realistic light settings. This is because it leads to a far greater error than other viewing directions, which are typically downwards at a monitor (about -15° tilt) or a workpiece on the desk (about -45° tilt), at least in our projects. Because the impact of FOV occlusion and MEDI change in a major way with the head orientation, we strongly recommend including typical viewing directions in addition to vertical measurements.
Finally, our results have other implications for (non-visual) lighting design, besides energy efficiency. Existing recommendations do mention the importance of light-source placement within the FOV (e.g., [50]). But as this aspect is not integrated in the standard MEDI measurements, it can be easily forgotten along the design process. The results of this study clearly show that even very bright light sources directly above the observers' eye point do not or only slightly contribute to corneal illuminance (see, e.g., scenario 4, 9, 13, or 14.). This can be advantageous for an evening lighting situation when a work surface needs to be illuminated, but the non-visual stimulus intensity at the eye should be limited (scenario 13). For activating situations such as morning hours, it is much more beneficial to bring light from the front or diagonally above the eye (scenario 11). In these cases, the FOV occlusion has only minimal influence. In general, this can be achieved through low-mounted luminaires and indirect lighting on walls or more distant ceiling surfaces. Considering the FOV occlusion in this way thus supports a targeted and energy-efficient non-visual stimulus for experimental and practical designs.
In conclusion, we have shown that the FOV occlusion is an important factor when determining the visual and non-visual stimulus intensity. Even if our investigation can only be considered tentative in terms of how representative our settings are for real-world scenarios, the results strongly hint at a high relevance for the topic. We have also provided the means for others to extend this research with their own measurements [40]. Lastly, we believe that FOV occlusion should be considered as a mainline entry for future iterations of the standard CIE S026 instead of the informative part, alongside such relevant factors as age [3]. This would encourage further adoption among researchers and practitioners.
4. Materials and Methods
4.1. FOV occlusion
The FOV occlusion was constructed according to the standard CIE S 026:2018 [3]. The aperture was designed so that the entire diffuser surface is shaded at the given angle. The aperture shape was then obtained by a line with the angle from a point on the edge of the diffuser to the corresponding point on the opposite side of the aperture's diameter. Figure 4(a) and 4(b) show some of these construction points. In 4(c) and 4(d), the resulting aperture is shown. 3D print files for the FOV occlusions and mounting clamps for Jeti spectrometers can be downloaded freely from an online repository [40]. The FOV occlusions were 3D printed from matte-black plastic. Finally, we verified the correct behavior of the FOV occlusion towards the cutoff angles through measurements of the relative illuminance from a narrow beam light from different directions (Supplementary Figure S3).
For the projects B-F, a simpler preliminary version of the FOV occlusion was used (see Figure 5(c)). In practice, this is of little relevance, as both occlusions show about the same angle-dependent characteristics (see Supplementary Figure S3 for the comparison). Further, projects A, G, and H were measured with both variants, and the median absolute deviation for quantities between the two occlusions was small at 2% FOV occlusion impact. Due to the small differences and some projects available exclusively with measurements from the preliminary aperture, we decided to include measurements from the prototype in the analysis. For reasons of reproducibility and transparency, this prototype is included in the online repository [40].
4.2. Measurement Apparatus
Spectral irradiance measurements with a 1-nm resolution were performed using a JETI Specbos 1201 or 1211 spectroradiometer (JETI Technische Instrumente GmbH, Jena), with the JETI LiVal V6.14.2 software running on a connected personal computer. The software also allows for the calculation of illuminance and MEDI based on the measurement. MEDI are calculated according to the standard CIE S 026:2018 [3]. The spectroradiometer’s relative measurement accuracy is 2%. Raw data and derived quantities were saved in comma-separated value (CSV) files and can be found in the Supplementary Information S2.
4.3. Projects and Measurements
All measurements in this study were collected from eight projects available to the authors. Each project consists of a workplace situation that comes from a range of laboratory or field studies. Measurements were taken with a spectroradiometer at the observers’ eye level at a height of 1.2 m for seated workplaces and at a height of 1.6 m or 1.5 m for standing individuals. All measurements were done twice, once without the FOV occlusion, and a second time with the occlusion. Appendix A gives a brief description of each project, the light and light settings, and the relevant observer. Only artificial light was used, no daylight is present in the measurements.
4.4. Data Analysis
We used the R software (Version 4.2.3) [51] for data analysis. Besides image and table generation, only few analysis steps were performed. First, the Melanopic Daylight (D65) Efficacy Ratio (MDER) was calculated from photometric illuminance and MEDI, according to the standard CIE S 026:2018 [3]. Further, each quantity (illuminance, MEDI, and MDER) consists of a pair of measurements, one with the 2π geometry (unoccluded) and one with the FOV occlusion. An impact score of FOV occlusion was calculated for each pair with:
The impact score specifies in percent, how much the FOV occlusion reduces the value of the given quantity in scenario , compared to the respective 2π geometry. I.e., an impact score of -28% for MEDI () states that MEDI values are 28% lower when using the FOV occlusion in scenario 1, compared to a standard measurement. Only in case of MDER are positive impact scores possible, as MDER is a relative quantity. The number given in each relative spectral power distribution plot (rSPD) of Table 2 and Table 3 is the median according to eq (2), for wavelengths between 380 to 780 nm. All scripts for data analysis and image generation are in the Supplementary Information S4.
Supplementary Materials
The following supporting information can be downloaded at the website of this paper posted on Preprints.org.
Author Contributions
Conceptualization, JZ, KBr and KBi; methodology, JZ, KBr and KBi; software, JZ and KBr; validation, KBr and KBi; formal analysis, JZ; investigation, JZ, KBr and KBi; resources, JZ, KBr and KBi; data curation, JZ, KBr and KBi; writing—original draft preparation, JZ and KBr; writing—review and editing, JZ, KBr and KBi; visualization, JZ; supervision, JZ, KBr and KBi; project administration, JZ, KBr and KBi; All authors have read and agreed to the published version of the manuscript.
Funding
This research received no external funding.
Data Availability Statement
The data presented in this study are available in Supplementary Information S2. The 3D-print files for the FOV occlusions are openly available from: https://doi.org/10.14279/depositonce-17076 [40].
Acknowledgments
While no funding was given for the measurements (or any other part) of this study, the measurements would not have been possible without the projects themselves. All authors would thus like to thank the funders of and partners in those projects (see Appendix A for more information on the projects). KBr would like to thank Hannah Rolf for providing access to the lab and the possibility to conduct measurements of her study lighting settings. KBr would like to acknowledge the work done by bachelor thesis writing student Maximilian Lutz (implementation of the 3D design; conduction of evaluation measurements of the FOV occlusions) and by student worker Noah Pütz (conduction of evaluation measurements of the FOV occlusions).
Conflicts of Interest
The authors declare no conflict of interest.
Appendix A – Project Descriptions
Project A: Realistic Office Lab Study, Scenarios 1-3
The measurements in the first project come from a laboratory study on non-visual effects over the course of a workday in an office-like environment [52, 53]. Luminaires integrated into the ceiling allowed for control of the spectral composition of light. The three investigated light situations differed in vertical illuminance and MEDI value. The light situations "warm low" and "cold low" have the same vertical illuminance of 300 lx at the eye. However, they differ by approximately a factor of 2 in the MEDI value. The "cold bright" light situation increases the vertical illuminance and the MEDI value compared to the "cold low" situation by 2.8 times. Measurements were taken from the observers’ perspective seated at the desk, 1.2m above floor level. For every scenario, measurements were taken with a horizontal view (Table 2) and with an 20° angle downwards from the horizontal plane (not shown in Table 2).
Project B: Home Office Workplace, Scenarios 4-6
A self-constructed luminaire from a teaching project used in a real-world home office allows settings for different lighting scenes depending on the time of day. The lighting scenes differ in light output, light color, and light direction from direct and indirect light components in the linear luminaire. Morning (direct: 7000 K, high luminous flux (LF); indirect: 5000 K, high LF), Daytime (direct: 4000 K, normal LF; indirect: 7000 K, normal LF), Evening (not shown in Table 3, direct: 4000 K normal LF; indirect: 2700 K low LF), and Night (direct: 2700 K, normal LF; indirect: 2700 K, low LF). The directionality of light thus changes between scenarios. E.g., in scenario 4, high LF comes from the ceiling and with a cooler light spectrum than from the direct component. Whereas in scenario 6, the LF of the indirect component is minimal and has the same warm white light spectrum as the direct component. Measurements were taken with a horizontal view from the observers’ perspective sitting at the desk, 1.2 m above the floor.
Project C: Industry Field Study (Machine Workplace), Scenarios 7-8
In this project, carried out jointly with the German Social Accident Insurance Institution for the Administrative Sector (vbg), an industrial workplace for quality control in a continuous 3-shift operation was consistently designed and executed with a focus on the non-visual effects of light. A detailed overview of the project and the lighting is given in Zauner and Plischke (37). In brief, the specially developed Drosa luminaire allows the adjustment of wing-panel luminaires in spectrum and brightness, as well as the brightness of 4000 K spotlight fixtures that shine directly on the workplace. Depending on the time of day, transitions are made between different lighting scenes. In all cases, the direct illumination of the spots provides horizontal illuminance on the visual task of at least 900 lx. In the Morning scenario, mainly the wing-panel luminaires are active with a daylight white light spectrum (6500 K). In the Daytime scenario (not shown in Table 2), the wing-panel luminaires are slightly dimmed, and the CCT is adjusted to 4000 K. During the Night scenario, the wing-panel luminaires are highly dimmed and mainly provide a general illumination level with a warm white light color (3000 K). In the second half of the night, the illuminance is gradually increased until the end of the night (not shown in Table 2). The measurements were carried out from the observers' position at a typical workstation in quality control. This is a machine workplace in a standing position, with the eye level 1.5 m above the floor and a horizontal view.
Project D: Industry Workplace, Scenarios 9-10
In this study, a laboratory room with a workplace was set up and designed to resemble real-world conditions, based on measurement results at assembly workplaces in an industrial hall. The real-world mockup further extends to the LED light for general and task specific lighting (individual task lighting). Mirrored walls on three sides of the laboratory room create the impression of a larger room geometry. The settings for the lights were chosen so that comparable values to the assembly workplaces were measured in the working plane and vertically in the eye position. The dimmable ceiling light has a variable color temperature between 2700 K and 6500 K, and was set to 4500 K. The luminous flux of the luminaires was adjusted so that the horizontal illuminance was at 500 lx. The non-dimmable task specific light (termed APL in the data) has a static color temperature of 4000 K and increases illuminance on the horizontal work plane by 450 lx. Even though the accompanying investigation of this workplace involving humans is a laboratory study, for this publication we will categorize it as a field study. This is because the lighting in the laboratory room can be considered a 1:1 mockup of an existing real-world workplace, not an abstraction or generalization of industry workplaces. Measurements were taken at the observers’ point of view, with a height of 1.6 m above the floor. A total of thirty measurements were taken in this project. Half of those measurements were with APL turned on, half turned off. The measurements further varied the head orientation vertically and horizontally in 15° increments. An overview of all head orientations is found in Figure 3. Table 2 only shows results for a 0°/0° view.
Project E: Learning Space, Scenarios 11-13
As part of the "Learning Space of the Future" project, an existing learning space at Munich University of Applied Sciences was equipped with a dynamic lighting solution. A detailed overview of the project and the lighting is given by Zauner [54]. In brief, in addition to dimmable and spectrally variable panel luminaires, spotlight fixtures on the ceiling above the table can also be controlled. Depending on the time of day, transitions between various lighting scenarios are made, all of which lead to a horizontal illuminance of 500 lx on the work surface. In the Morning scenario, predominantly panel luminaires are active, and all luminaires have a CCT of 7000 K. In the Daytime scenario, the panel luminaires are slightly dimmed, and the CCT is adjusted to 4000 K. The Evening scenario is dominated by the spotlights, while the panel luminaires provide little light output and mainly create a general illuminance level. All luminaires in this scenario have a warm white light color and are set to 2700 K. The measurement was carried out for a typical user workstation in the room, with a sitting observer’ eye position 1.2 m above floor level and a horizontal view.
Project F: Industry Field Study (Packaging Workplace), Scenarios 14-16
This project is in the same industrial workspace as project C [15], but located in the periphery. The general conditions for lighting and measurement are thus almost identical. One difference is the target illuminance level for the visual task at 300 lx. Another difference is that the lighting is mounted higher by about 1 m. The final difference is in the view at the worker’s position (1.5 m above floor level, measured horizontally), which is open and overlooking the other areas in the industrial hall. This includes the stock illumination in all other areas, which consist of fluorescent tube lights.
Project G: Halfdome Ganzfeld Lab Setup, Scenario 17
As part of a laboratory study on non-visual effects of light, test stations with Ulbricht hemispheres were examined [55]. The hemispheres allow for a 2π geometry of illuminance in the subject's field of view, i.e., the Ulbricht hemispheres were illuminated in such a way that a constant luminance prevailed inside. The test subjects looked into the opening of the hemispheres using a chinrest. Measurements were taken vertically at the eye level of the test subjects, which was centered on the hemisphere.
Project H: Artificial Office Lab Study, Scenarios 18-20
As part of a laboratory study on nocturnal non-visual effects of light, a test station was set up in a room that represents an office-like environment. Different lighting scenarios could be realized using ceiling and wall-integrated luminaires. The project investigated whether a lighting solution using the spectral properties and spatial arrangement of the luminaires could be designed to maintain melatonin secretion at night while simultaneously supporting the acute attention of night shift workers [56]. Three lighting conditions, which differed in direction and spectral composition of the light, as well as a DIM-Light condition (not shown in Table 3), were examined. Light scene LS1 has warm white illuminated walls and dim blue light from a central ceiling panel above the observer. The ceiling panel is occluded sideways, so that it only shines light straight down at the observers’ desk. LS2 has blue light on the wall and dim warm light from the ceiling panel. LS3 has dim warm white light at the wall and bright blue light from the ceiling panel. Measurements were taken at sitting height 1.2 m above floor level, with a horizontal view (Table 3) and with an 20° angle downwards from the horizontal plane (not shown in Table 3).
References
- Brown TM. Melanopic illuminance defines the magnitude of human circadian light responses under a wide range of conditions. J Pineal Res. 2020:e12655. Epub 2020/04/06. [CrossRef]
- Spitschan M, Smolders K, Vandendriessche B, Bent B, Bakker JP, Rodriguez-Chavez IR, et al. Verification, analytical validation and clinical validation (V3) of wearable dosimeters and light loggers. Digit Health. 2022;8:20552076221144858. Epub 20221225. [CrossRef]
- CIE. CIE S 026/E:2018. CIE system for metrology of optical radiation for ipRGC-influenced responses of light. In: CIE, editor. CIE S 026/E:2018. Vienna: CIE; 2018.
- Broszio K, Knoop M, Niedling M, Völker S. Effective radiant flux for non-image forming effects—Is the illuminance and the melanopic irradiance at the eye really the right measure. Light Eng. 2018;26(2):68-74. [CrossRef]
- Babilon S, Beck S, Kunkel J, Klabes J, Myland P, Benkner S, et al. Measurement of Circadian Effectiveness in Lighting for Office Applications. Applied Sciences. 2021;11(15). [CrossRef]
- Knoop M, Broszio K, Diakite A, Liedtke C, Niedling M, Rothert I, et al. Methods to Describe and Measure Lighting Conditions in Experiments on Non-Image-Forming Aspects. Leukos. 2019;15(2-3):163-79. [CrossRef]
- Sliney DH, Mellerio J. Safety with lasers and other optical sources: a comprehensive handbook: Springer Science & Business Media; 2013. [CrossRef]
- Guth, S. Light and comfort. Industrial medicine & surgery. 1958;27(11):570-4.
- Parker Jr JF, West VR. Bioastronautics data book. NASA, 1973.
- Strasburger, H. Seven Myths on Crowding and Peripheral Vision. Iperception. 2020;11(3):2041669520913052. Epub 2020/06/04. [CrossRef]
- Rönne, H. Zur theorie und technik der Bjerrumschen gesichtsfelduntersuchung. Archiv für Augenheilkunde. 1915;78(4):284-301.
- Bieske K, Schuppert B, Schierz C, editors. Einfluss der Blickrichtung auf die Messung von nichtvisuellen Lichtwirkungen. LICHT2023: 25 europäischer Lichttechnischer Kongress; 2023; Salzburg2023.
- Brown TM, Brainard GC, Cajochen C, Czeisler CA, Hanifin JP, Lockley SW, et al. Recommendations for daytime, evening, and nighttime indoor light exposure to best support physiology, sleep, and wakefulness in healthy adults. PLoS Biol. 2022;20(3):e3001571. Epub 20220317. [CrossRef]
- Cajochen C, Zeitzer JM, Czeisler CA, Dijk D-J. Dose-response relationship for light intensity and ocular and electroencephalographic correlates of human alertness. Behavioural Brain Research. 2000;115(1):75-83. [CrossRef]
- Zeitzer JM, Dijk DJ, Kronauer R, Brown E, Czeisler C. Sensitivity of the human circadian pacemaker to nocturnal light: melatonin phase resetting and suppression. The Journal of physiology. 2000;526 Pt 3(Pt 3):695-702. [CrossRef]
- Brainard GC, Hanifin JP, Greeson JM, Byrne B, Glickman G, Gerner E, et al. Action Spectrum for Melatonin Regulation in Humans: Evidence for a Novel Circadian Photoreceptor. The Journal of Neuroscience. 2001;21(16):6405-12. [CrossRef]
- Brown TM, Thapan K, Arendt J, Revell VL, Skene DJ. S-cone contribution to the acute melatonin suppression response in humans. J Pineal Res. 2021:e12719. Epub 2021/01/30. [CrossRef]
- Wright HR, Lack LC. Effect of Light Wavelenght on Suppression and Phase Delay of the Melatonin Rhythm. Chronobiology International. 2001;18(5):801-8. [CrossRef]
- Revell VL, Skene DJ. Light-Induced Melatonin Suppression in Humans with Polychromatic and Monochromatic Light. Chronobiology International. 2007;24(6):1125-37. [CrossRef]
- Brainard GC, Sliney D, Hanifin JP, Glickman G, Byrne B, Greeson JM, et al. Sensitivity of the Human Circadian System to Short-Wavelength (420-nm) Light. Journal of Biological Rhythms. 2008;23(5):379-86. [CrossRef]
- Gooley JJ, Rajaratnam SMW, Brainard GC, Kronauer RE, Czeisler CA, Lockley SW. Spectral Responses of the Human Circadian System Depend on the Irradiance and Duration of Exposure to Light. Science Translational Medicine. 2010;2(31):31ra3-ra3. [CrossRef]
- Revell VL, Barrett DCG, Schlangen LJM, Skene DJ. Predicting Human Nocturnal Nonvisual Responses to Monochromatic and Polychromatic Light with a Melanopsin Photosensitivity Function. Chronobiology International. 2010;27(9-10):1762-77. [CrossRef]
- Santhi N, Thorne HC, van der Veen DR, Johnsen S, Mills SL, Hommes V, et al. The spectral composition of evening light and individual differences in the suppression of melatonin and delay of sleep in humans. Journal of Pineal Research. 2012;53(1):47-59. [CrossRef]
- Papamichael C, Skene DJ, Revell VL. Human nonvisual responses to simultaneous presentation of blue and red monochromatic light. J Biol Rhythms. 2012;27(1):70-8. [CrossRef]
- Chellappa SL, Steiner R, Blattner P, Oelhafen P, Götz T, Cajochen C. Non-visual effects of light on melatonin, alertness and cognitive performance: can blue-enriched light keep us alert? PLOS ONE. 2011;6(1):e16429. [CrossRef]
- Ho Mien I, Chua EC, Lau P, Tan LC, Lee IT, Yeo SC, et al. Effects of exposure to intermittent versus continuous red light on human circadian rhythms, melatonin suppression, and pupillary constriction. PLoS One. 2014;9(5):e96532. Epub 20140505. [CrossRef]
- Najjar RP, Chiquet C, Teikari P, Cornut PL, Claustrat B, Denis P, et al. Aging of non-visual spectral sensitivity to light in humans: compensatory mechanisms? PLoS One. 2014;9(1):e85837. Epub 2014/01/28. [CrossRef]
- Brainard GC, Hanifin JP, Warfield B, Stone MK, James ME, Ayers M, et al. Short-wavelength enrichment of polychromatic light enhances human melatonin suppression potency. Journal of pineal research. 2015;58(3):352-61. [CrossRef]
- Rahman SA, St. Hilaire MA, Lockley SW. The effects of spectral tuning of evening ambient light on melatonin suppression, alertness and sleep. Physiology & Behavior. 2017;177:221-9. [CrossRef]
- Hanifin JP, Lockley SW, Cecil K, West K, Jablonski M, Warfield B, et al. Randomized trial of polychromatic blue-enriched light for circadian phase shifting, melatonin suppression, and alerting responses. Physiology & Behavior. 2019;198:57-66. [CrossRef]
- Nagare R, Rea MS, Plitnick B, Figueiro MG. Nocturnal Melatonin Suppression by Adolescents and Adults for Different Levels, Spectra, and Durations of Light Exposure. J Biol Rhythms. 2019;34(2):178-94. Epub 20190225. [CrossRef]
- Phillips AJK, Vidafar P, Burns AC, McGlashan EM, Anderson C, Rajaratnam SMW, et al. High sensitivity and interindividual variability in the response of the human circadian system to evening light. Proc Natl Acad Sci U S A. 2019;116(24):12019-24. Epub 2019/05/30. [CrossRef]
- Zauner J, Plischke H, Stijnen H, Schwarz UT, Strasburger H. Influence of common lighting conditions and time-of-day on the effort-related cardiac response. PloS One. 2020;15(10). [CrossRef]
- Ru T, Smolders K, Chen Q, Zhou G, de Kort Y. Diurnal effects of illuminance on performance: Exploring the moderating role of cognitive domain and task difficulty. Lighting Research & Technology. 2022;0(0):1477153521990645. [CrossRef]
- Baandrup L, Jennum PJ. Effect of a dynamic lighting intervention on circadian rest-activity disturbances in cognitively impaired, older adults living in a nursing home: A proof-of-concept study. Neurobiology of Sleep and Circadian Rhythms. 2021;11. [CrossRef]
- van Duijnhoven J, Aarts M, Kort H. Personal lighting conditions of office workers: An exploratory field study. Lighting Research & Technology. 2020;0(0):1477153520976940. [CrossRef]
- Zauner J, Plischke H. Designing Light for Night Shift Workers: Application of Nonvisual Lighting Design Principles in an Industrial Production Line. Applied Sciences. 2021;11(22). [CrossRef]
- Plischke H, Linek M, Zauner J. The opportunities of biodynamic lighting in homes for the elderly. Current Directions in Biomedical Engineering. 2018;4(1):123-6. [CrossRef]
- Van de Putte E, Kindt S, Bracke P, Stevens M, Vansteenkiste M, Vandevivere L, et al. The influence of integrative lighting on sleep and cognitive functioning of shift workers during the morning shift in an assembly plant. Applied Ergonomics. 2022;99:103618. [CrossRef]
- SpectroMasks [Internet]. 2023. [CrossRef]
- Lasko TA, Kripke DF, Elliot JA. Melatonin Suppression by Illumination of Upper and Lower Visual Fields. Journal of Biological Rhythms. 1999;14(2):122-5. [CrossRef]
- He S, Li H, Yan Y, Cai H. Capturing Luminous Flux Entering Human Eyes with a Camera, Part 1: Fundamentals. Leukos. 2022:1-19. [CrossRef]
- He S, Li H, Yan Y, Cai H. Capturing Luminous Flux Entering Human Eyes with a Camera, Part 2: A Field Verification Experiment. Leukos. 2023:1-27. [CrossRef]
- Kooijman, AC. Light distribution on the retina of a wide-angle theoretical eye. J Opt Soc Am. 1983;73(11):1544-50. [CrossRef]
- Schierz C, editor Zur Photometrie nichtvisueller Lichtwirkungen. Proc 2008 Symposium “Licht und Gesundheit; 2008.
- Van Derlofske JF, Bierman A, Rea MS, Maliyagoda N, editors. Design and optimization of a retinal exposure detector. Novel Optical Systems Design and Optimization III; 2000: SPIE.
- John Van D, Andrew B, Mark SR, Janani R, John DB. Design and optimization of a retinal flux density meter. Measurement Science and Technology. 2002;13(6):821. [CrossRef]
- Veitch JA, Knoop M. CIE TN 011:2020. What to document and report in studies of ipRGC-influenced responses to light. CIE TN 011:2020. Vienna: CIE; 2020.
- Zauner J, Plischke H, Strasburger H. Spectral dependency of the human pupillary light reflex. Influences of pre-adaptation and chronotype. PLoS One. 2022;17(1):e0253030. Epub 20220112. [CrossRef]
- DIN. DIN SPEC 67600:2022-08. Complementary criteria for lighting design and lighting application with regard to non-visual effects of light. DIN SPEC 67600:2022-08. Berlin: Beuth Publishing Company; 2022.
- R Core Team. R: a language and environment for statistical computing. Vienna, Austria: R Foundation for Statistical Computing; 2017.
- Rolf H, Udovicic L, Völker S, editors. Effects of Light on Attention during the Day: Spectral Composition and Exposure Duration. Lux junior 2021: 15 Internationales Forum für den lichttechnischen Nachwuchs, 04–06 Juni 2021, Ilmenau: Tagungsband; 2021.
- Rolf H, Udovicic L, Völker S, editors. Einfluss des Lichts auf die Aufmerksamkeit am Tag: Spektrale Zusammensetzung und Expositionsdauer. LICHT2021: 24 Europäischer Lichtkongress der lichttechnischen Gesellschaften Deutschlands, der Niederlande, Österreichs und der Schweiz; 2021; Bamberg.
- Zauner, J. Ocular light effects on human autonomous function: the role of intrinsically photosensitive retinal ganglion cell sensitivity and time of day [Dissertation, LMU München]2022.
- Broszio K, Knoop M, Völker S, editors. Einfluss der Lichteinfallsrichtung auf die akute Aufmerksamkeit. 10 Symposium Licht und Gesundheit; 2019.
- Broszio K, Bieske K, Zauner J, editors. Untersuchung zum Einfluss des menschlichen Gesichtsfelds auf nichtvisuelle Größen. Proceedings of LICHT2023: 25 europäischer Lichttechnischer Kongress; 2023.
Figure 1.
Representations of the human binocular field of view (FOV). (a) The overlap of visual fields for the left (red) and right (blue) eye creates the FOV [8]. (b) Recommended cutoff angles for the FOV according to CIE S 026:2018 [3] are +5° and -70° for indoor environments with low light levels.
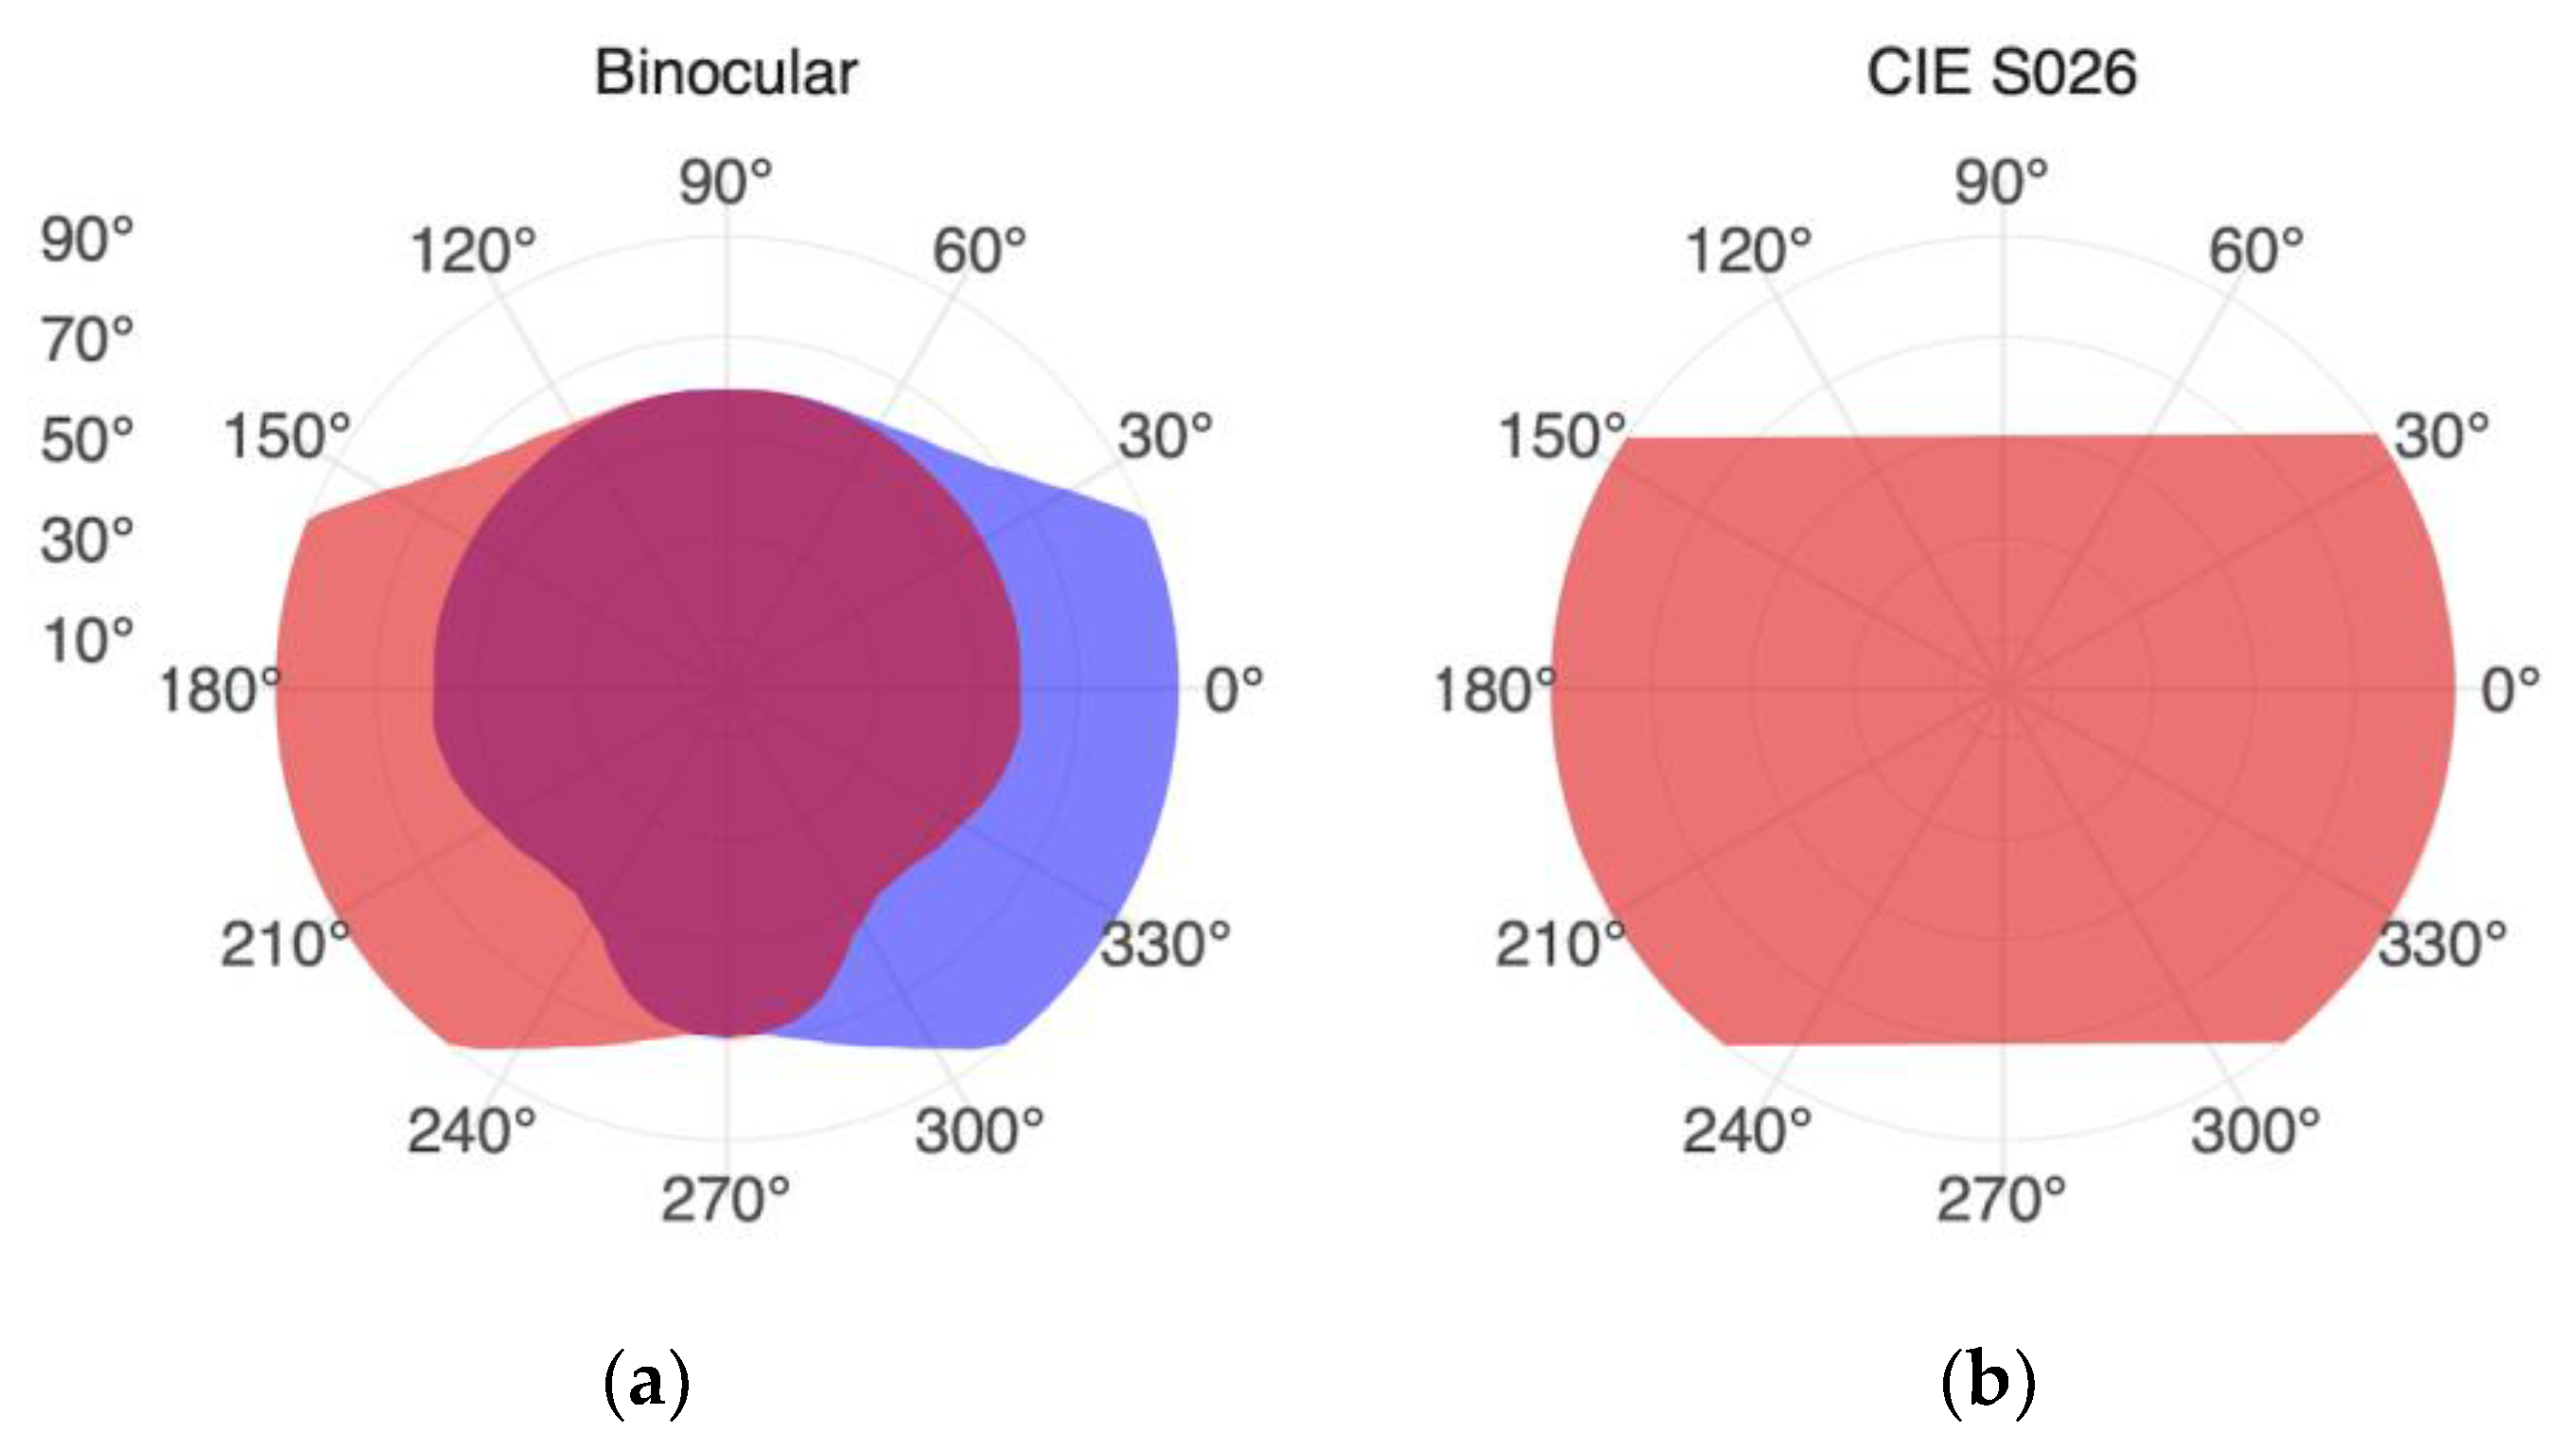
Figure 2.
Summary across projects A-H for the relative reduction of non-visual stimulus intensity (MEDI) when using the FOV occlusion compared to a standard measurement. The red representation corresponds to a boxplot per project, with the median numerically to the left; black dots are individual measurements, stacked in 2% bins.
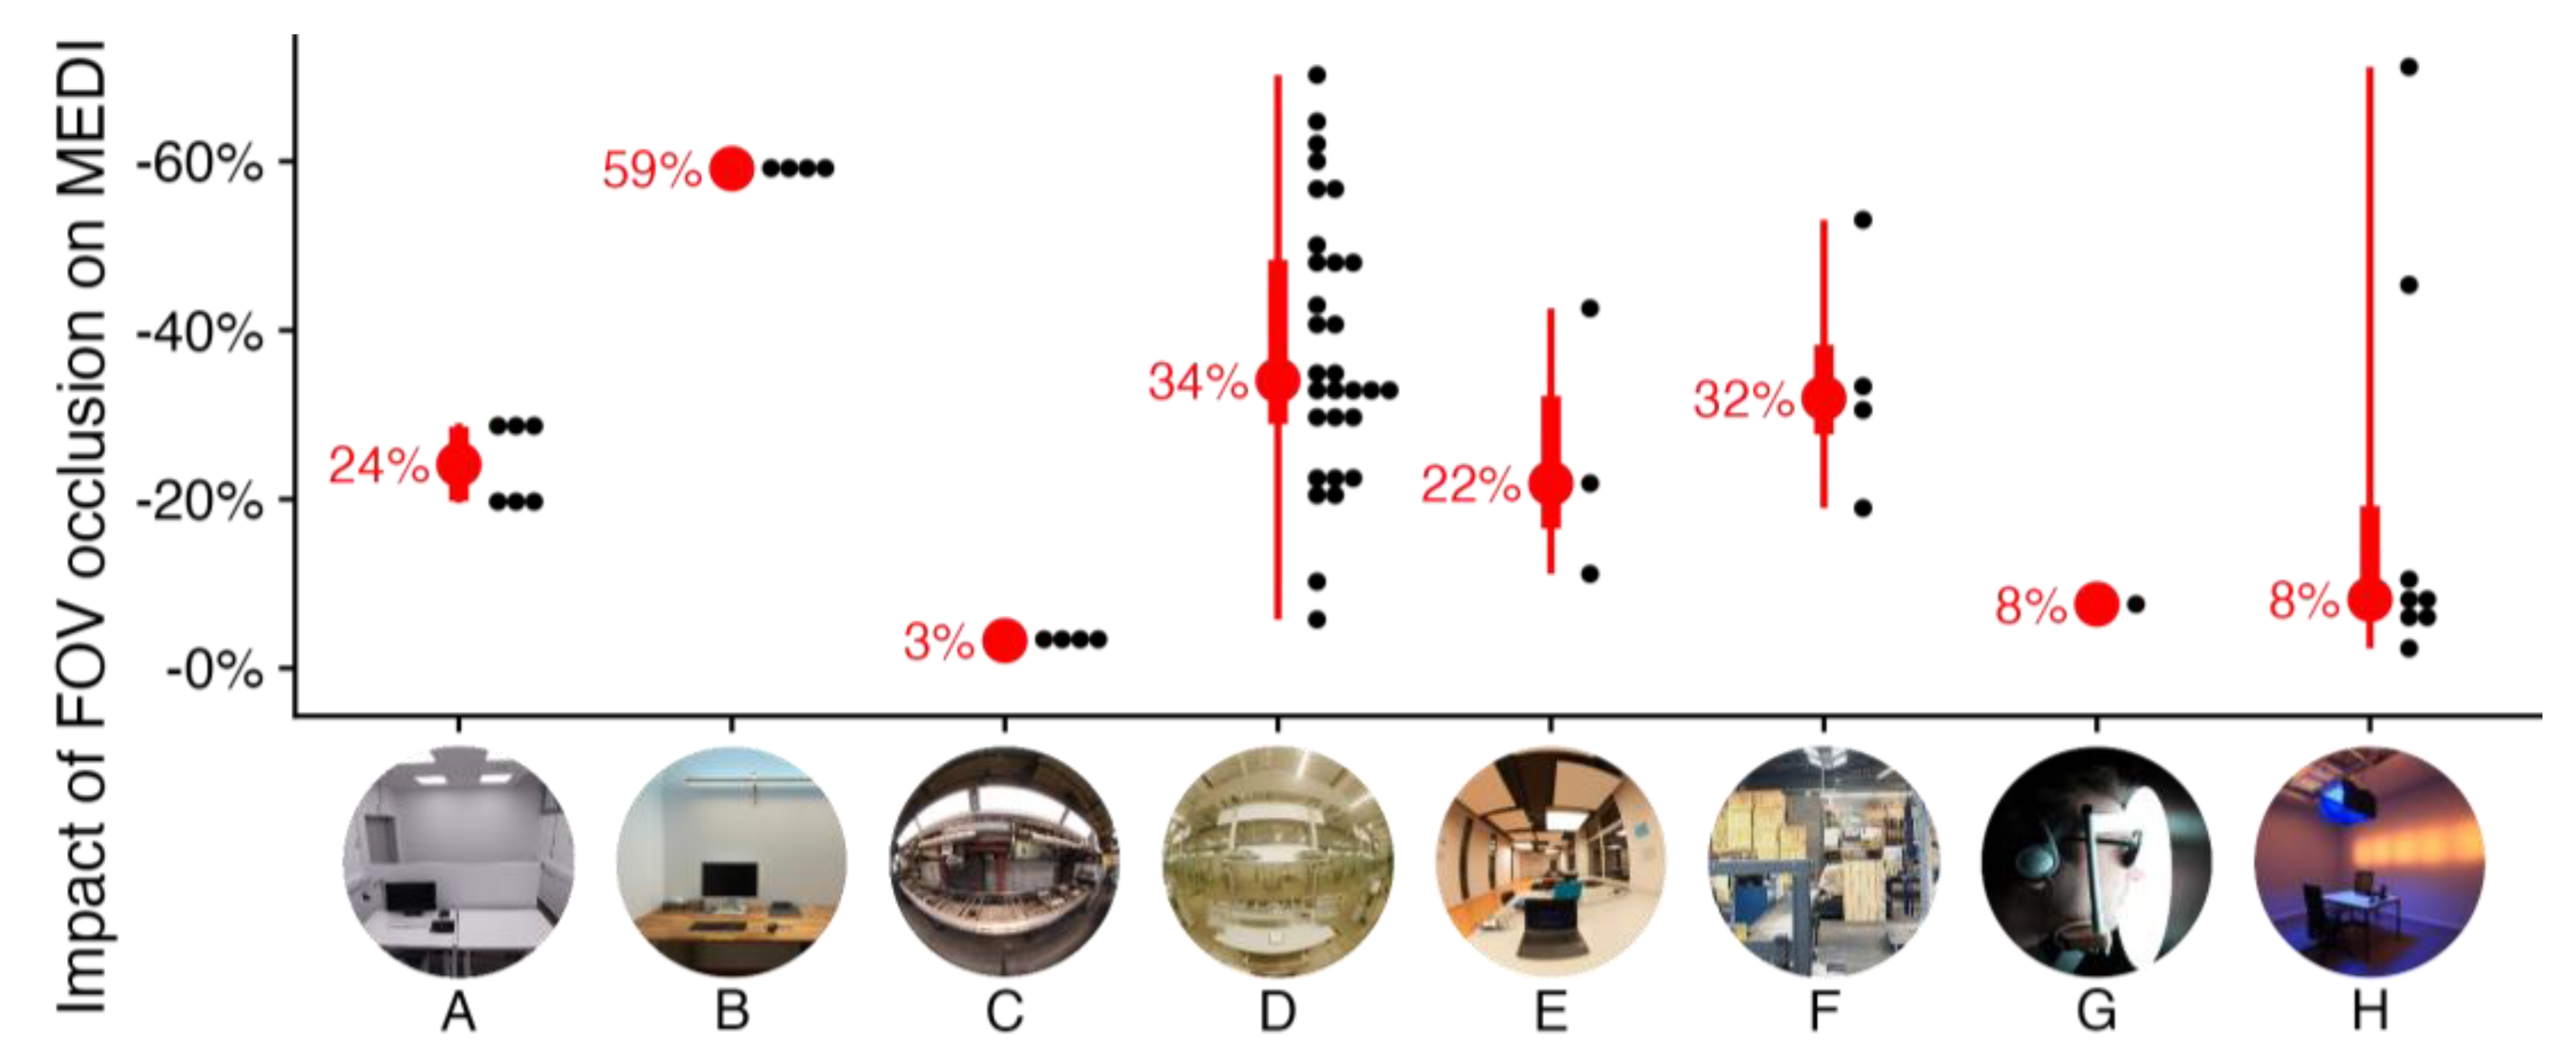
Figure 3.
Graph of MEDI (lx) and the relative reduction of MEDI due to the FOV occlusion (Impact, %), measured in 15° increments from a view straight ahead (0°/0°) in the horizontal (X) and vertical (Y) direction. The labels are scaled by MEDI (color) and Impact (size), so that a high MEDI value and a small Impact is indicated by a small yellow label. On the other hand, a low MEDI value and a high Impact is indicated by a large blue label. Measurements are from project D, with individual task lighting.
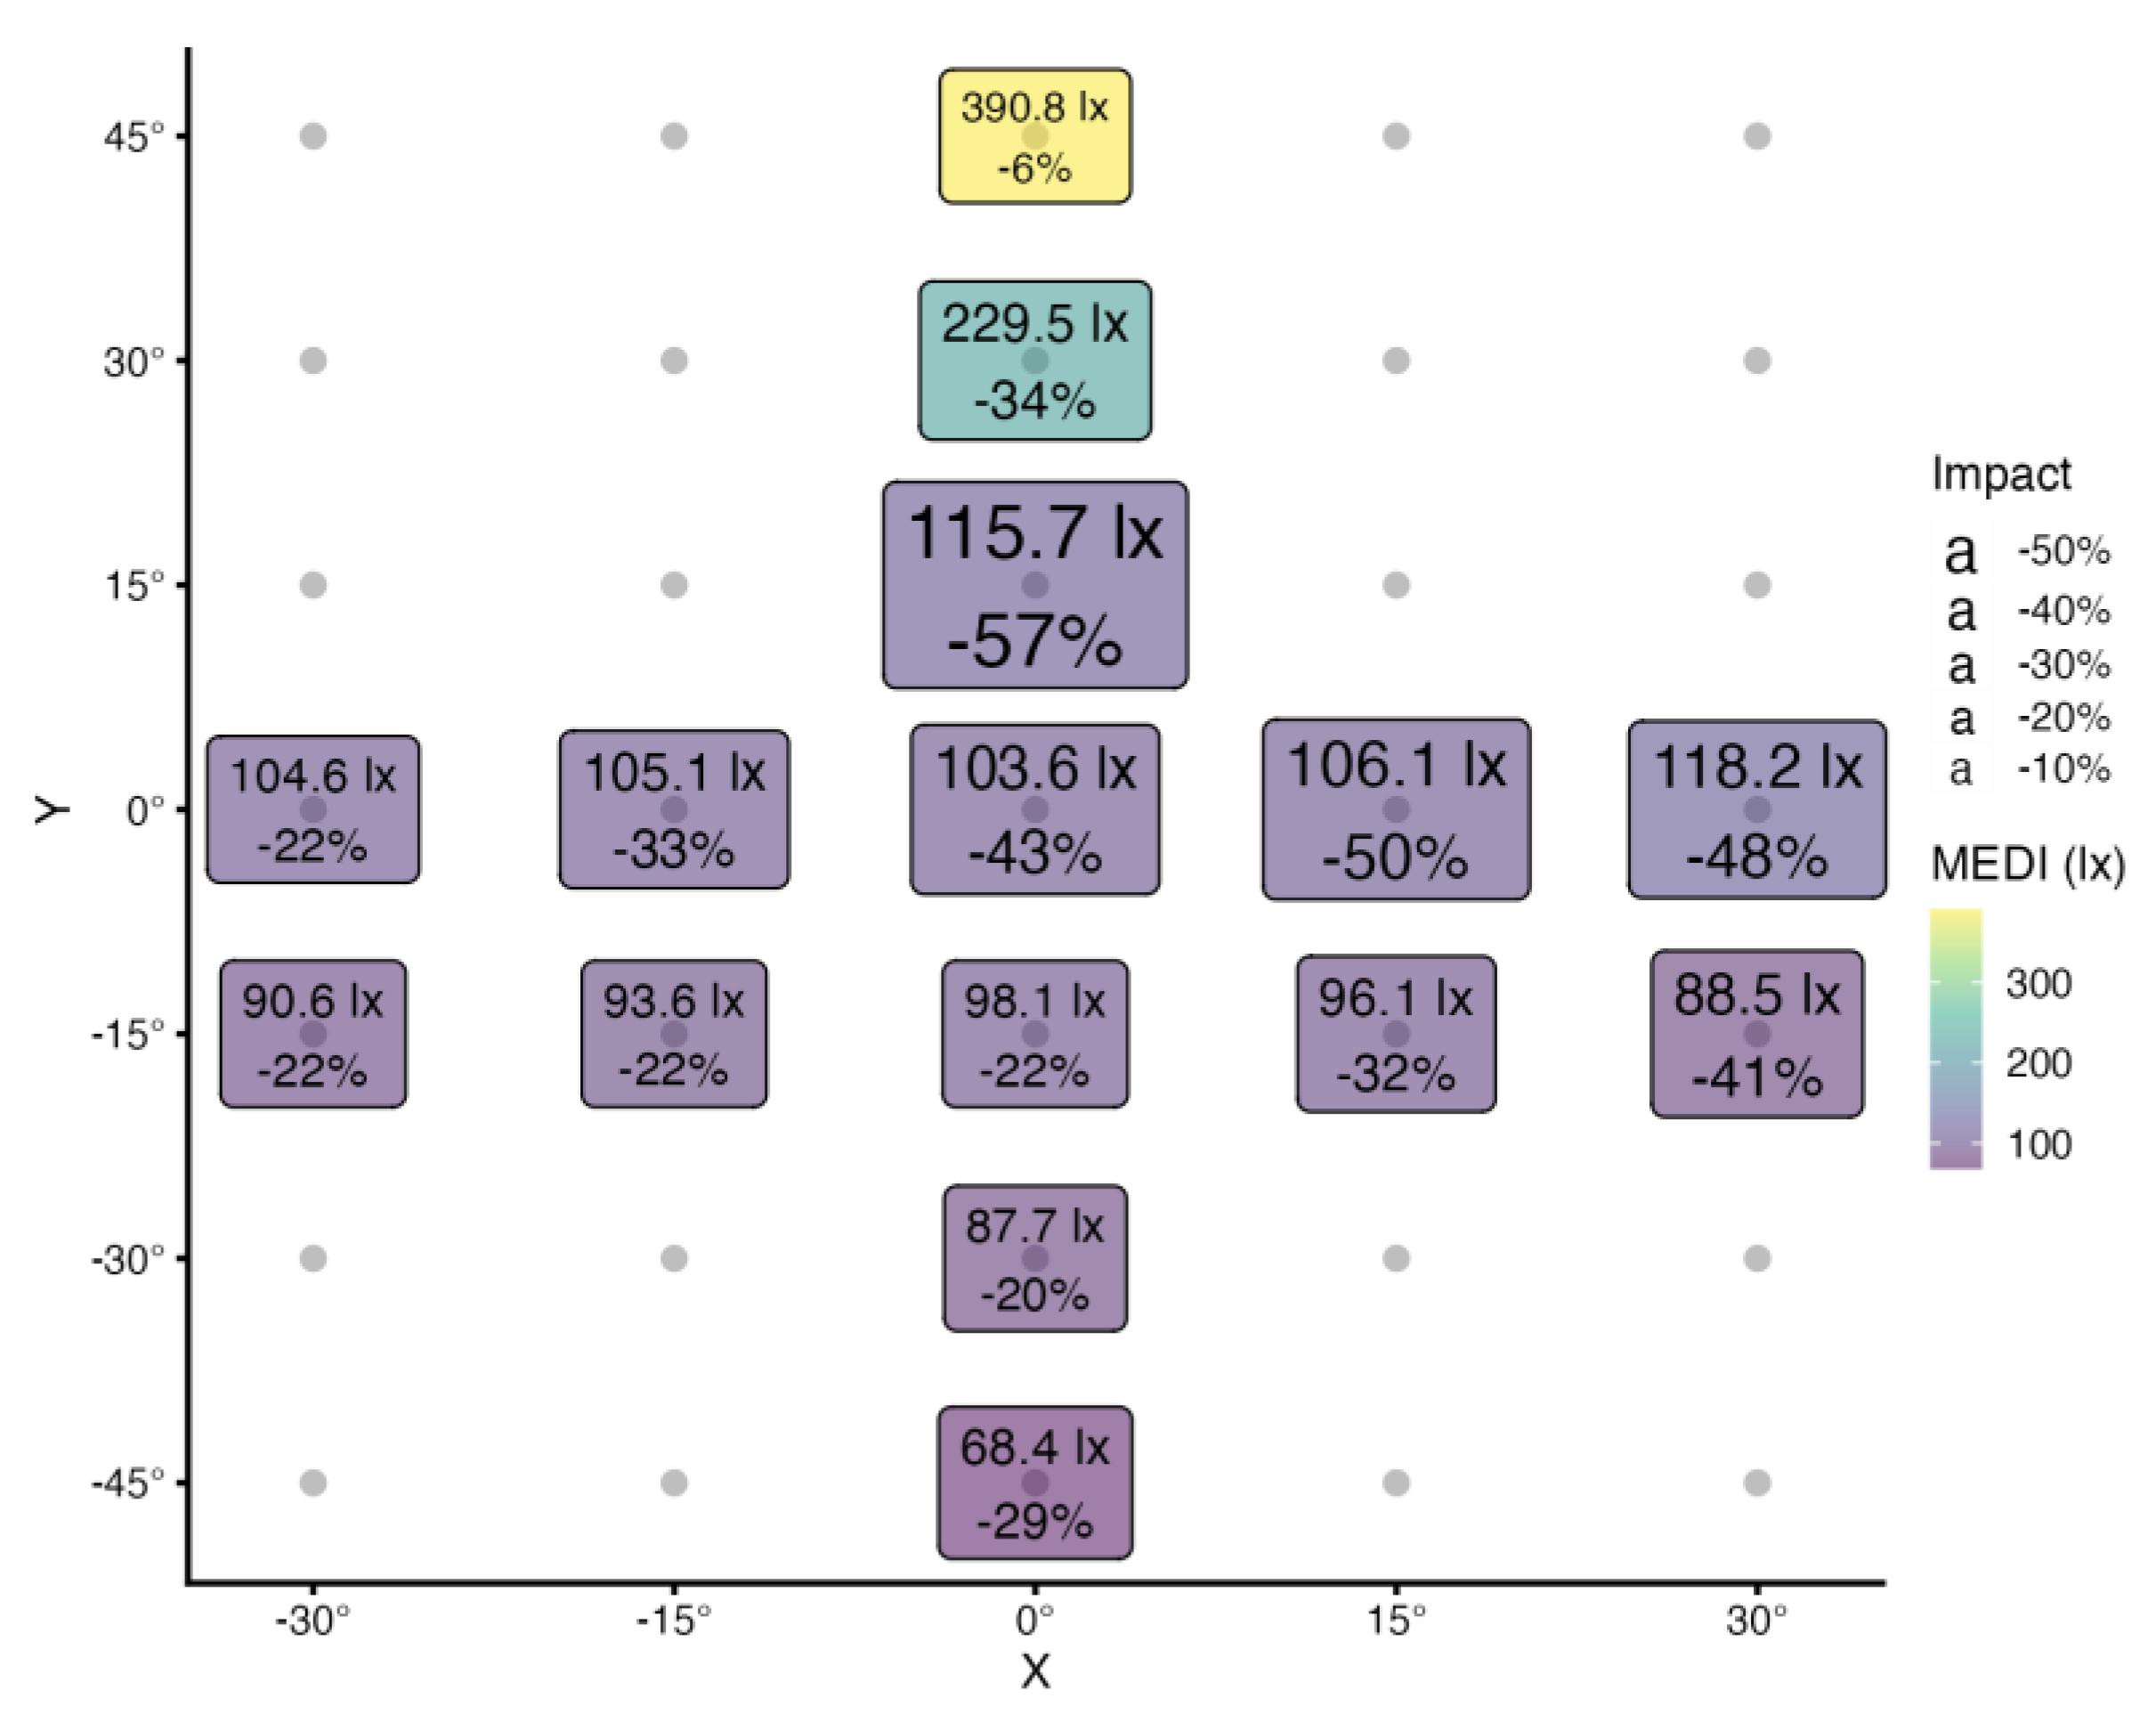
Figure 4.
Design schematics of the FOV occlusion. (a) Vertical section through the aperture construction with dashed orange +50° line and -70° line for limiting the upper and lower visual field. (b) Partial frontal view with selected construction points on the edge of the central diffuser. (c) complete aperture in 3D view with selected construction lines. (d) 180°-fisheye-view schematic through the aperture of the FOV occlusion. White areas represent the FOV, black the occlusion from the 2π geometry. The reason why the upper and lower occlusion areas do not have straight cutoffs horizontally (compare Figure 4(d) to Figure 1(b)), is due to the aperture construction that shades the whole diffuser instead of just the central point.
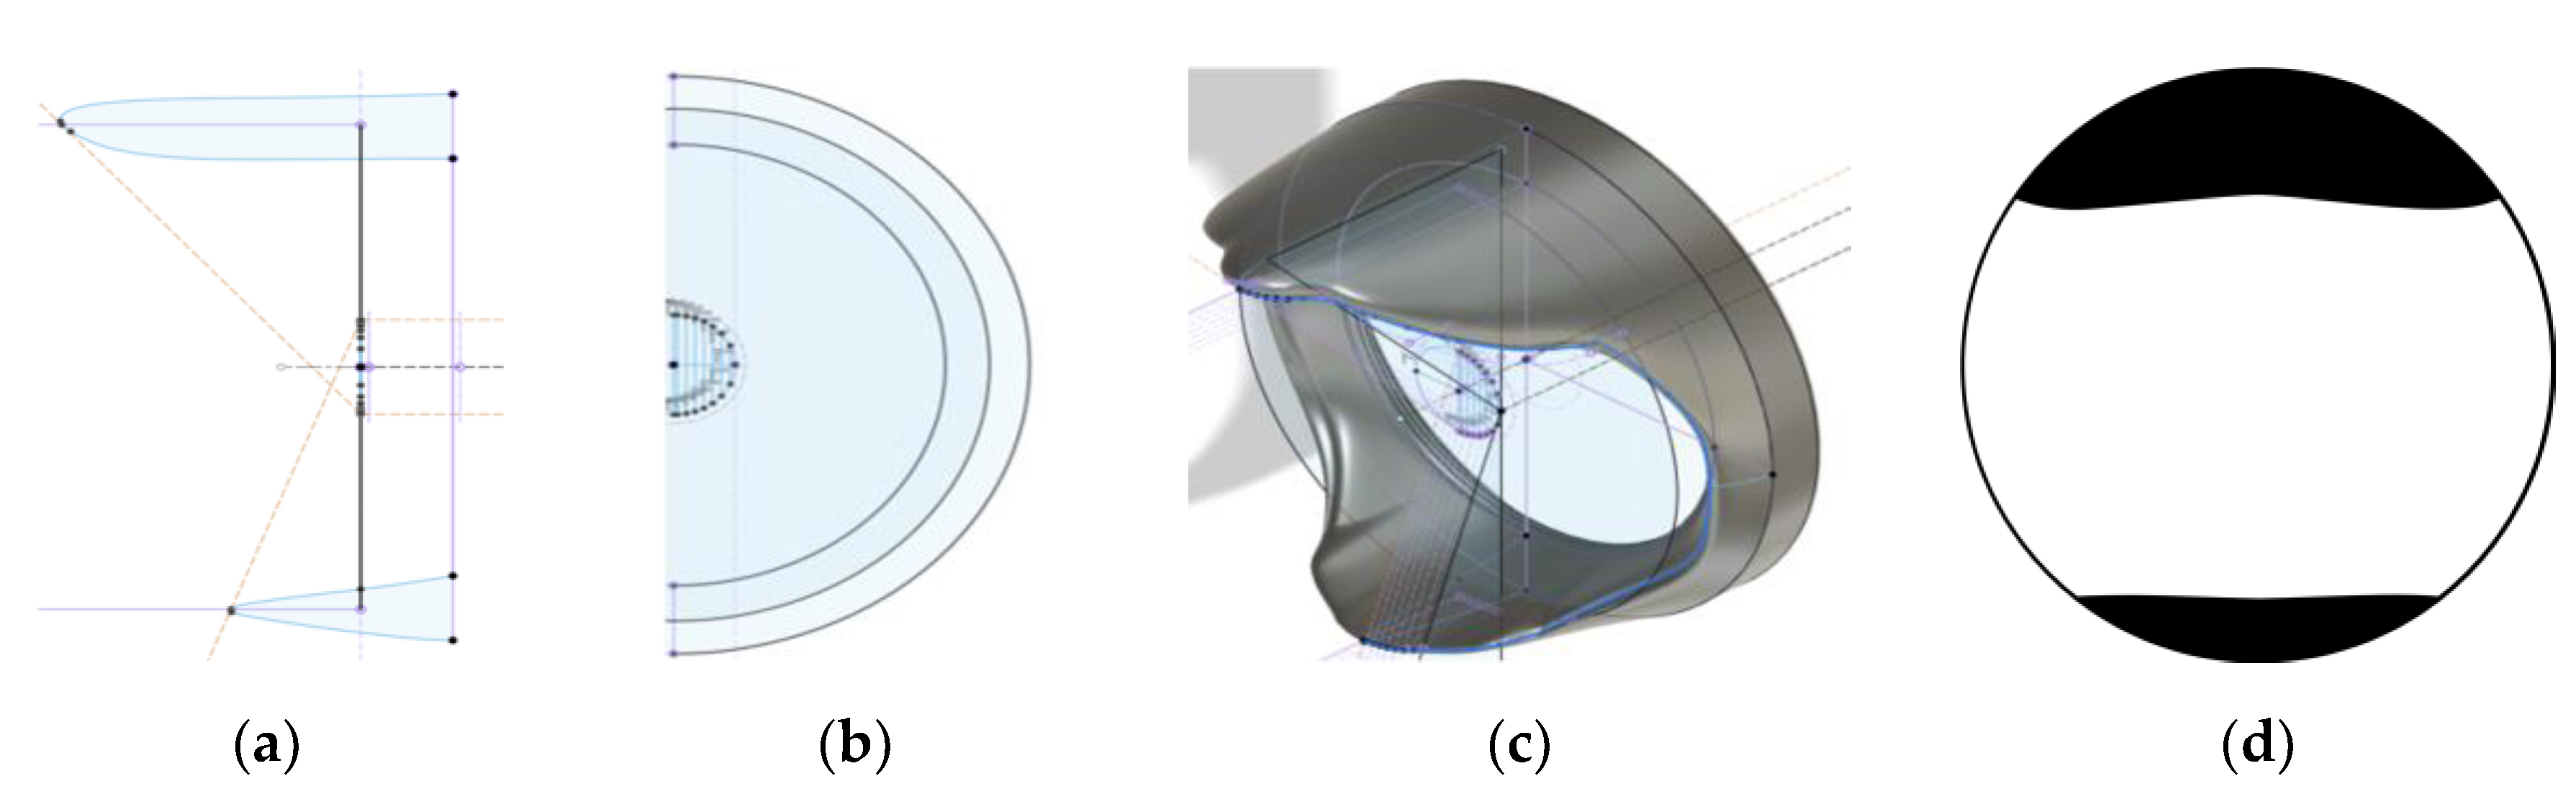
Figure 5.
FOV occlusions: mounting. (a) Mounting principle of the occlusion on a JETI specbos 1211. A mounting clamp on the device attaches to a distance ring before the diffuser is attached. The FOV occlusion then attaches to the distance ring with a reproducible positioning. (b) Picture of the FOV occlusion with the distance ring and diffuser cap. (c) Same as (b), with the prototype FOV occlusion.
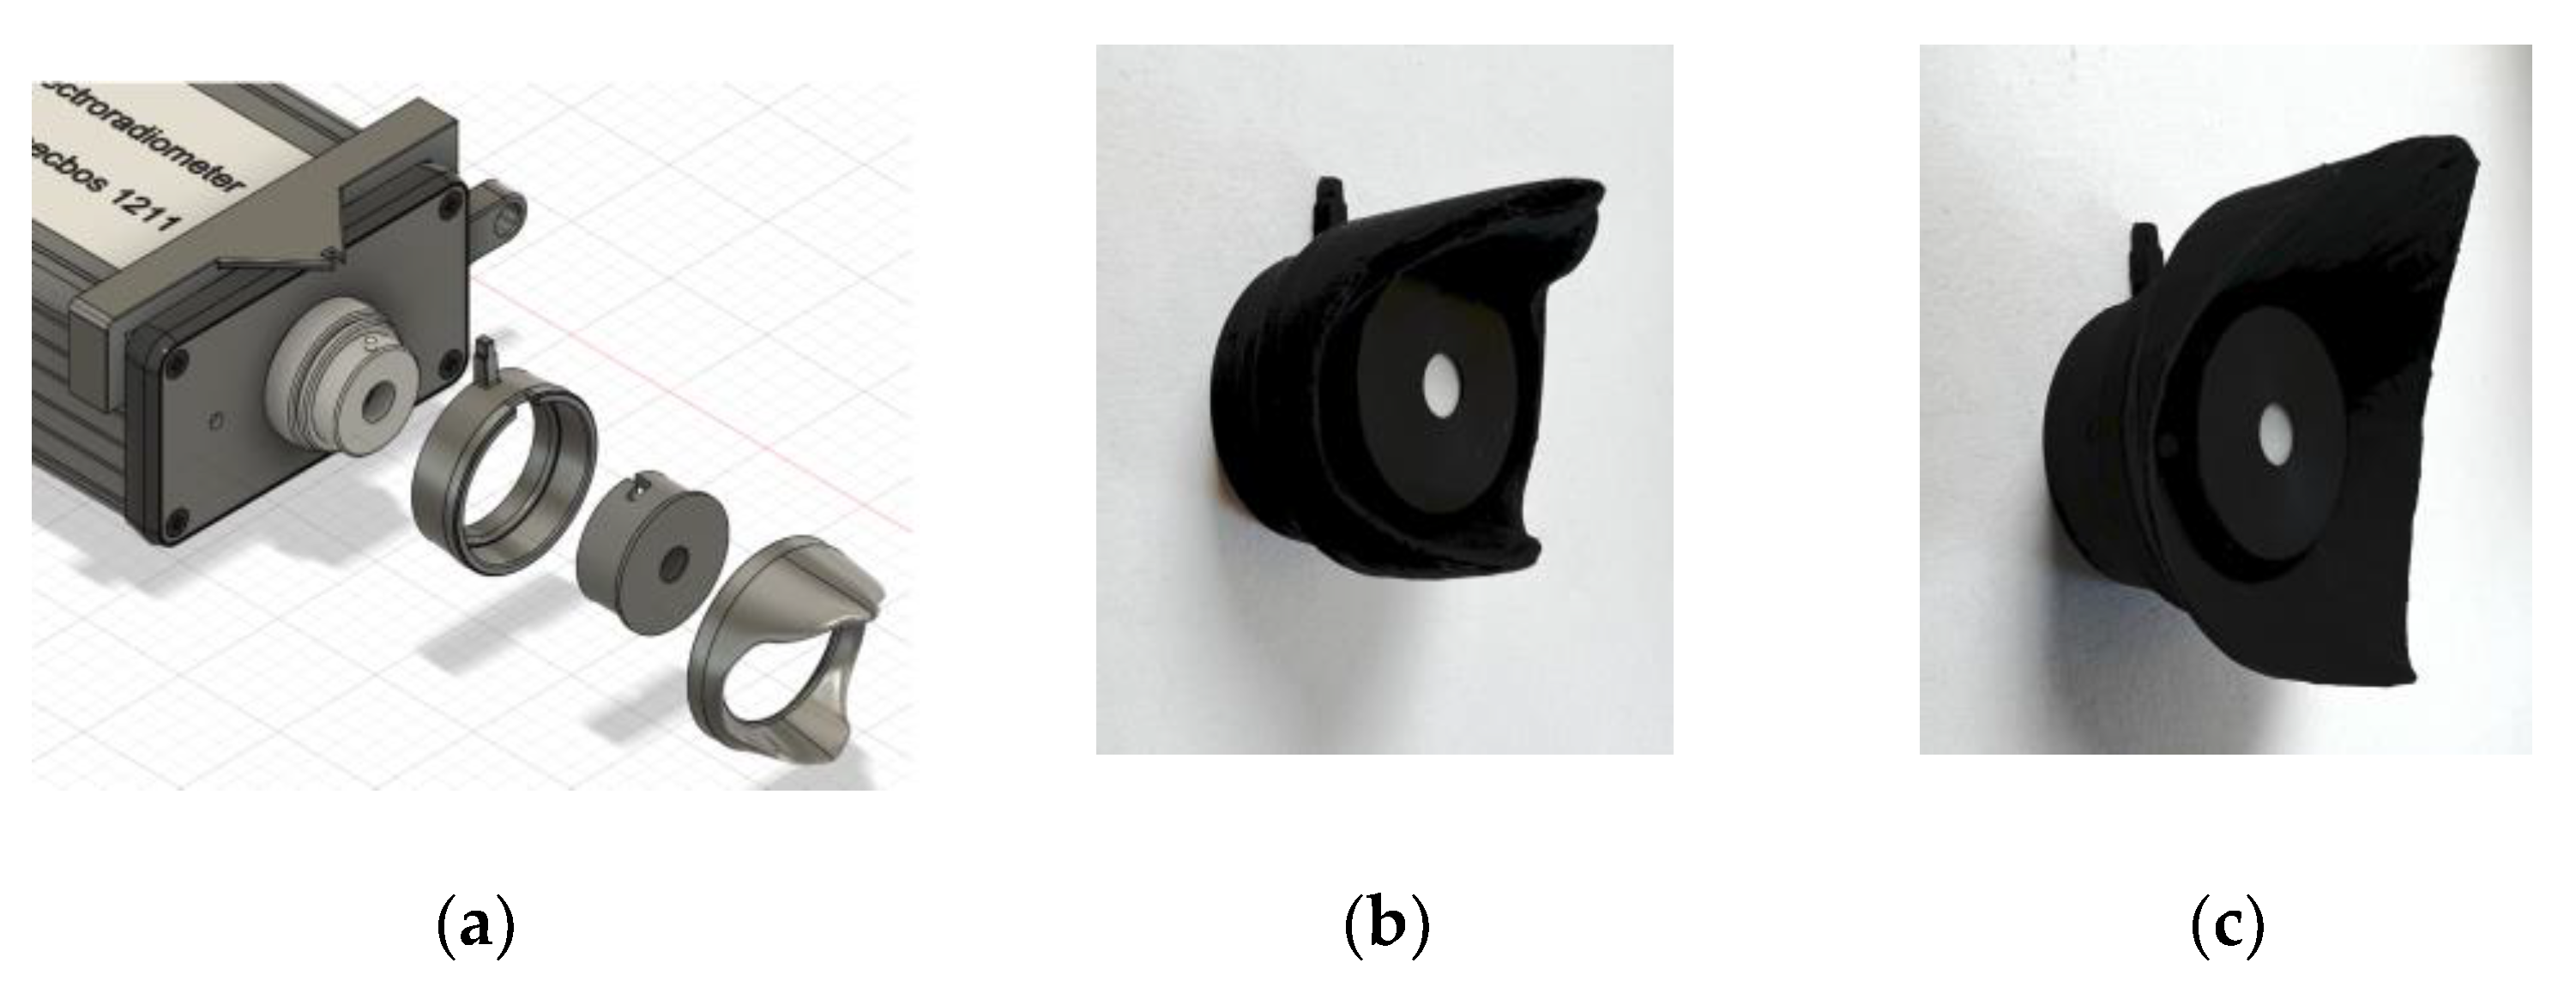

Table 1.
Summary table of light stimulus characteristics in terms of their position and size in the FOV in some of the most relevant studies in NIF research. These studies were analyzed by Brown (1) to show that “melanopic illuminance defines the magnitude of human circadian light responses under a wide range of conditions”.
| Citation | Light Incidence1 |
|---|---|
| Cajochen et al. 2000 [14] | Not stated |
| Zeitzer et al. 2000 [15] | Ceiling Mounted Lights2 |
| Brainard et al. 2001 [16] | Ganzfeld Dome |
| Thapan et al. 2001 [17] | Ganzfeld Dome |
| Wright and Lack 2001 [18] | Low-Central, 20° visual angle |
| Revell and Skene 2007 [19] | Ganzfeld Dome |
| Brainard et al. 2008 [20] | Ganzfeld Dome |
| Gooley et al. 2010 [21] | Ganzfeld Dome |
| Revell et al. 2010 [22] | Ganzfeld Dome |
| Santhi et al. 2010 [23] | Central, Light Box |
| Papamichael et al. 2012 [24] | Ganzfeld Dome |
| Chellapa et al. 2014 [25] | Ganzfeld Room |
| Ho Mien et al. 2014 [26] | Ganzfeld Dome |
| Najjar et al. 2014 [27] | Ganzfeld Dome |
| Brainard et al. 2015 [28] | Central, 63° viewing angle |
| Rahman et al. 2017 [29] | Wall mounted Lights |
| Hanifin et al. 2019 [30] | Central, 63° visual angle |
| Nagare et al. 2019 [31] | Central, 40° viewing angle |
| Phillips et al. 2019 [32] | Ceiling mounted Lights |
Table 2.
Results for part one of the selected projects (Project A-D, Scenarios 1-10).
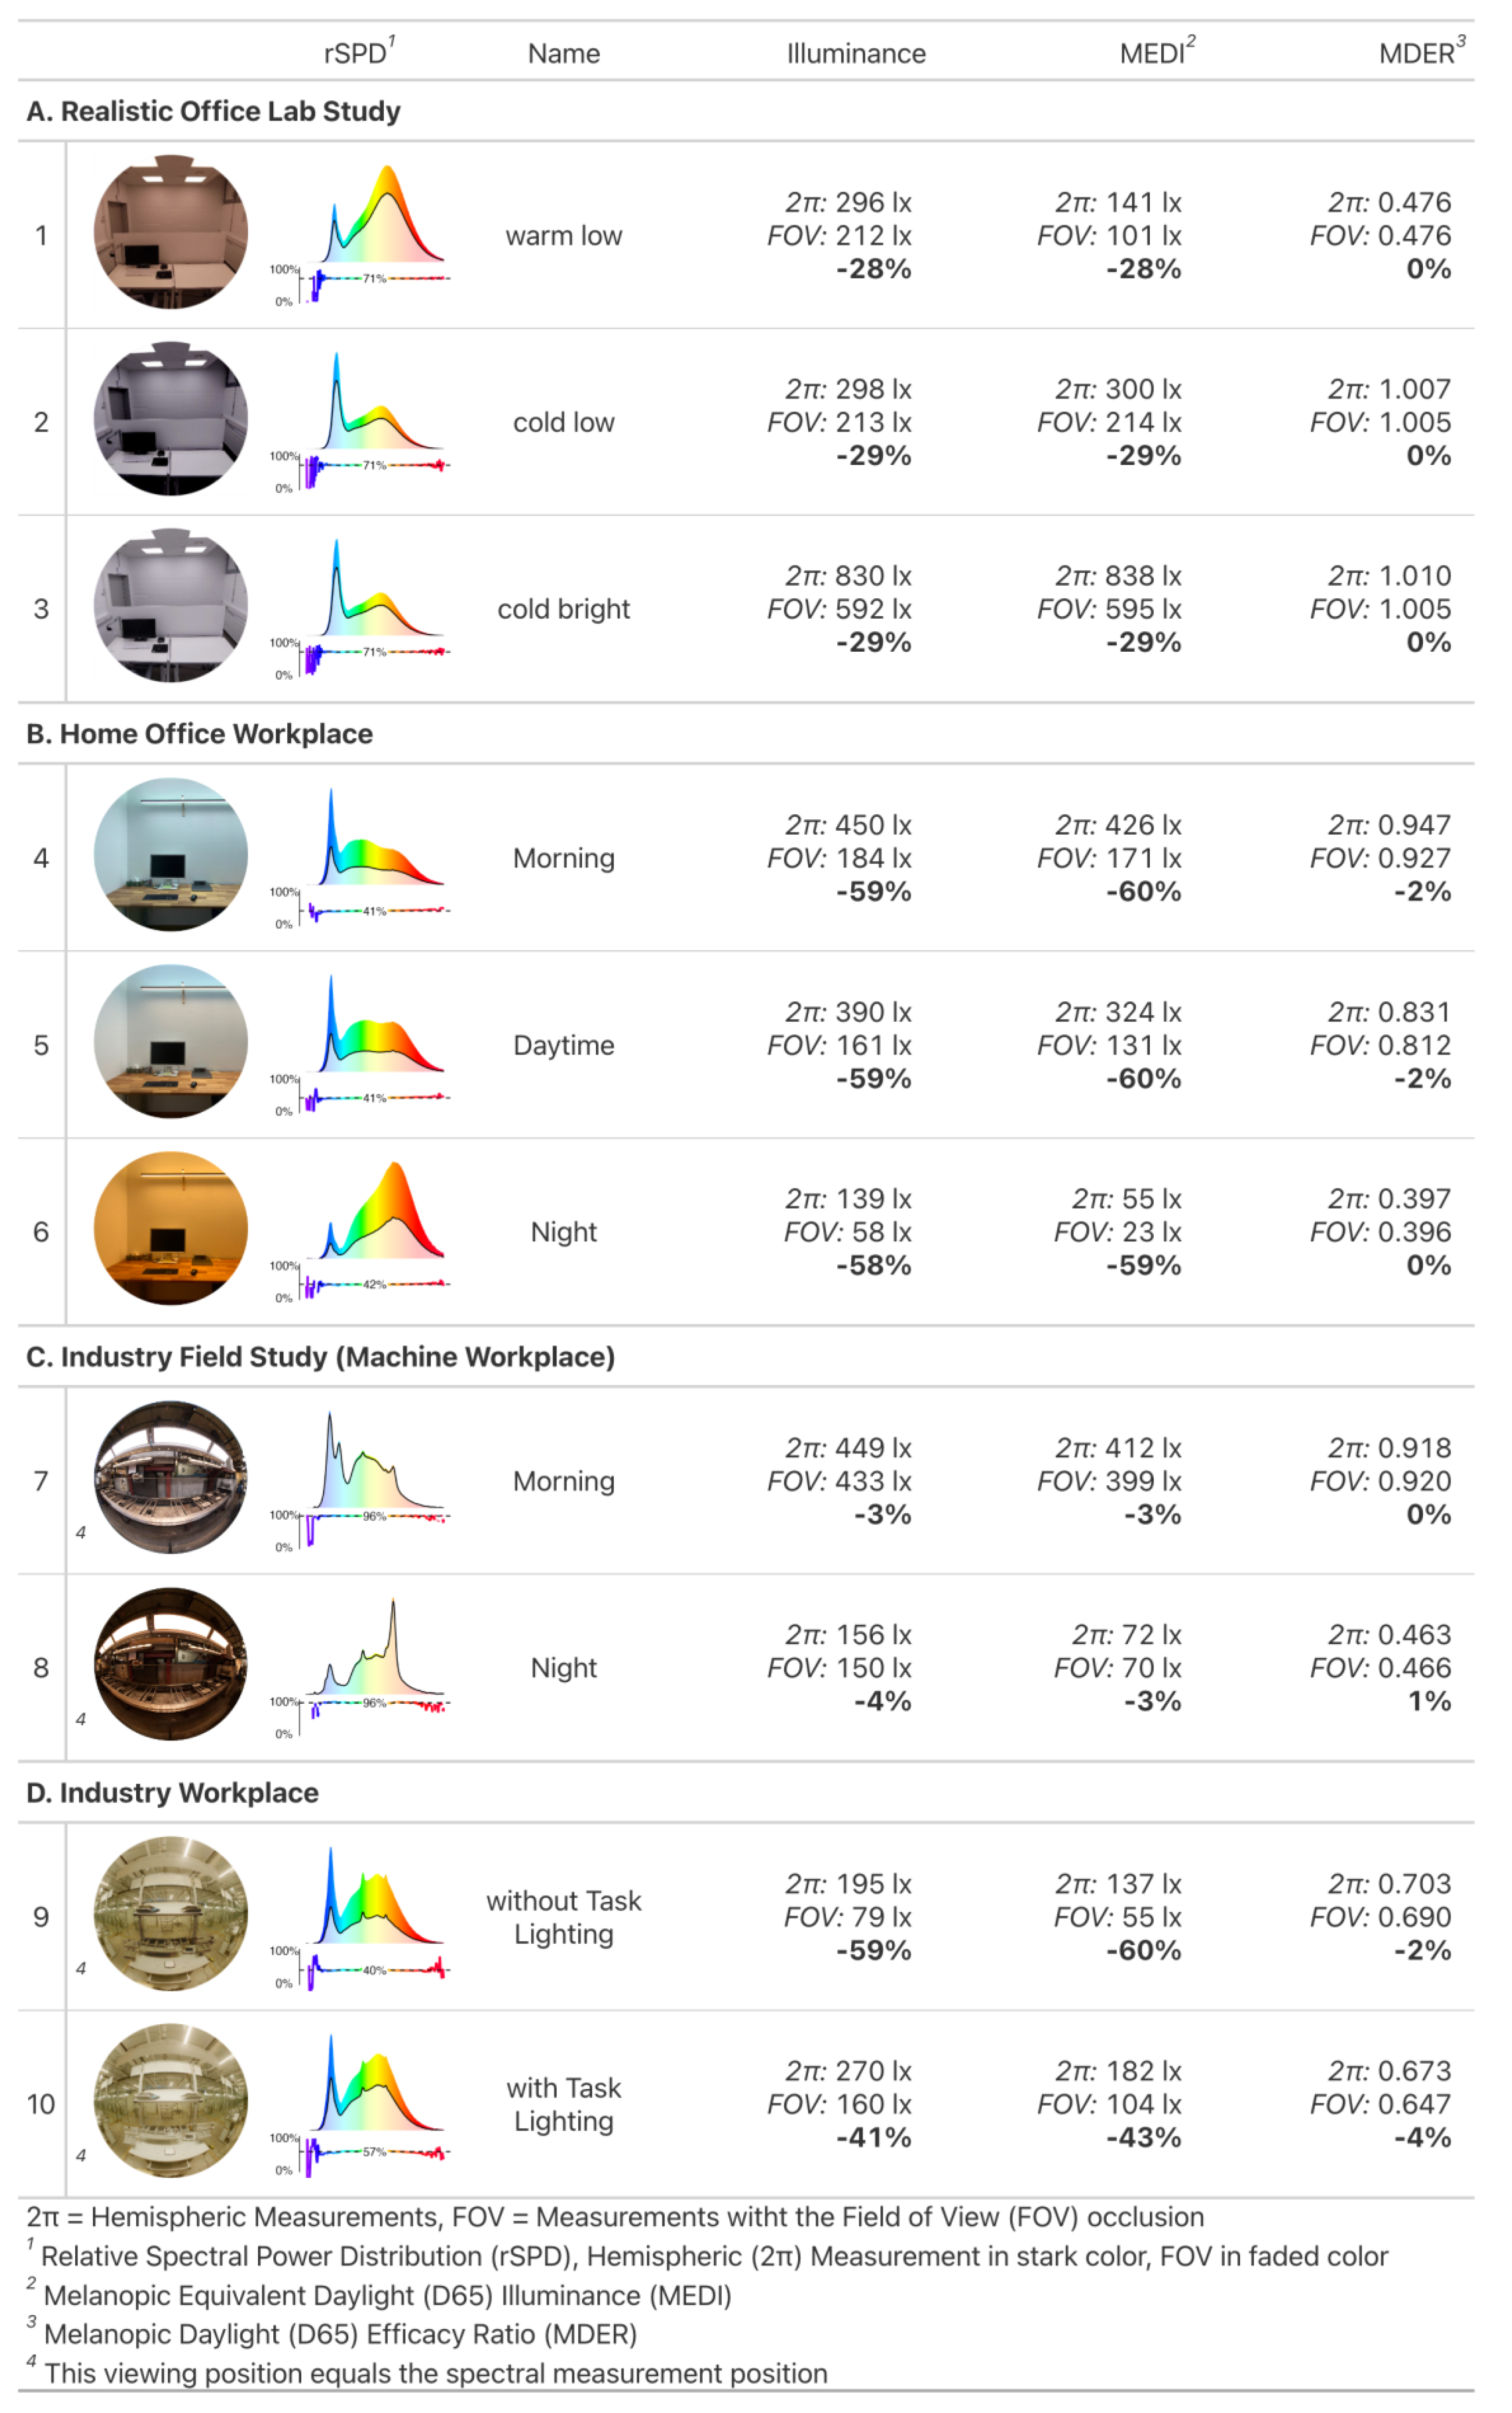
Table 3.
Results for part two of the selected projects (Project E-H, Scenarios 11-20).
Disclaimer/Publisher’s Note: The statements, opinions and data contained in all publications are solely those of the individual author(s) and contributor(s) and not of MDPI and/or the editor(s). MDPI and/or the editor(s) disclaim responsibility for any injury to people or property resulting from any ideas, methods, instructions or products referred to in the content. |
© 2023 by the authors. Licensee MDPI, Basel, Switzerland. This article is an open access article distributed under the terms and conditions of the Creative Commons Attribution (CC BY) license (http://creativecommons.org/licenses/by/4.0/).
Copyright: This open access article is published under a Creative Commons CC BY 4.0 license, which permit the free download, distribution, and reuse, provided that the author and preprint are cited in any reuse.


