
Submitted:
09 June 2023
Posted:
13 June 2023
You are already at the latest version
Abstract
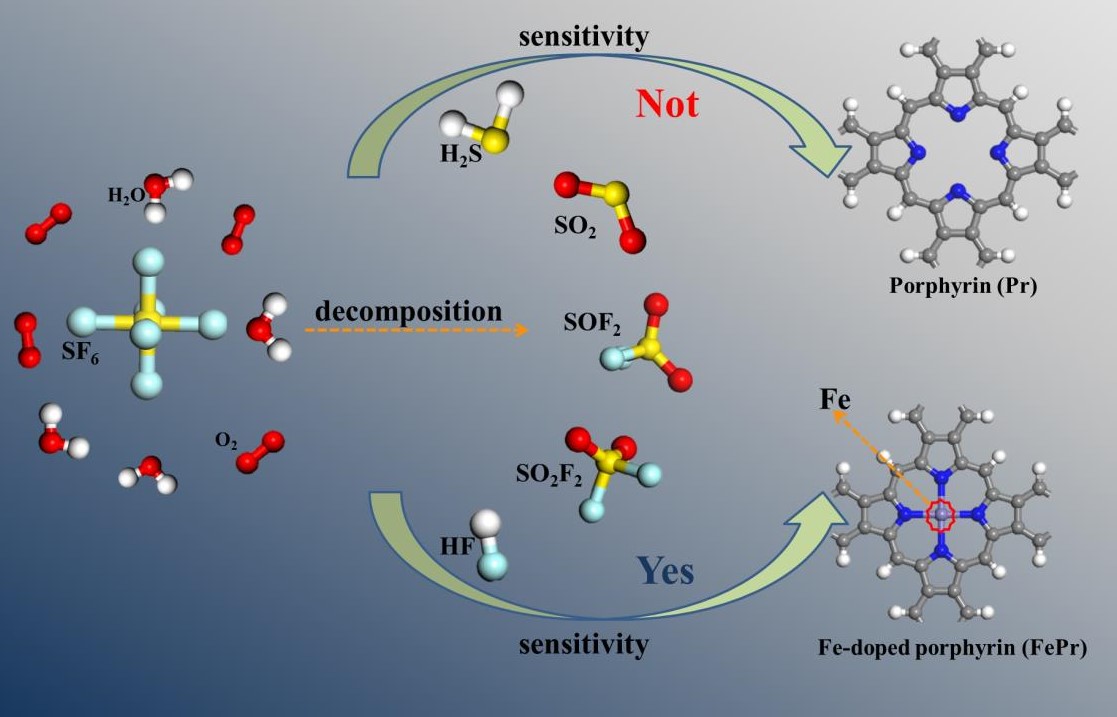
The development of high-performance sensing materials for detecting or removing SF6 decomposition gases is crucial for gas-insulated switchgear (GIS). In this work, the adsorption characteristics of the pristine porphyrin (Pr) and Fe-doped porphyrin (FePr) monolayers towards SF6 decomposition gases were investigated using the first-principles calculations. Additionally, the electronic properties and sensing-mechanism were also examined. The findings indicate that both Pr and FePr monolayers exhibit thermodynamic stability. The intrinsic Pr monolayer only exhibits a moderate affinity towards the SO2 molecule, however, its poor sensitivity of the Pr monolayer renders it unsuitable as the sensing-material. In contrast, the FePr monolayer exhibits favorable adsorption strength towards all five toxic gases (H2S, SO2, SOF2, SO2F2, HF). The FePr monolayer exhibits chemisorption towards SO2/SOF2 gases, Furthermore, the microscopic mechanism of gases-substrate interaction is elucidated through the analysis of charge density difference, charge transfer, and density of states. Moreover, the FePr has excellent sensitivity for H2S, SO2, SO2F2, SOF2 and HF molecules owing to the significant variations of the band gap, electrical conductivity and work function. In addition, the τ of H2S, SO2, and SOF2 is 12.6 μs, 18.5 s and 15.4 s at 298 K, respectively. Our calculated results can offer theoretical guidance for the practical application of FePr-based sensing materials to detect SF6 decompositions gases.
Keywords:
FePr monolayer
; SF6 decomposition gases
; First-principles calculations
; Sensing mechanism
1. Introduction
Sulfur hexafluoride (SF6) is a colorless gas that is primarily non-toxic and non-flammable [1,2]. Due to its high electronegativity, exceptional arc extinguishing properties, superior insulation strength and excellent thermal conductivity, SF6 is widely employed as a dielectric gas in gas-insulated switchgear (GIS) [3,4,5,6]. However, the prolonged operation of gas-insulated equipment inevitably leads to the occurrence of partial discharges (PD), resulting in the decomposition of SF6 into some toxic gases such as H2S, SO2, SOF2, SO2F2 and HF through reactions with oxygen and water vapor [7,8,9]. If these gases are not promptly detected or removed, they may accelerate the deterioration of gas equipment insulation and contribute to air pollution [10,11]. Therefore, it is crucial to detect or eliminate the release of SF6 decomposition component gases from both environmental and health perspectives [12]. This can be accomplished by developing a gas sensing material that exhibits superior performance.
The potential of two-dimensional (2D) materials as adsorbent materials for environmental protection is significant due to their high surface area, controlled interlayer bonding, specific binding capacity, chemical stability and sensitivity [13,14]. In recent years, a variety of 2D materials, including 2D sulfur compounds [2,15], ZnO [16], C3N [17], MXenes [18], graphene [19] and the group III–V nitrides [20] have demonstrated high efficacy in the detecting and capturing harmful gases. For instance, Hu et al. [21] investigated the adsorption characteristics of NH3, CO and NO2 on SnS monolayers, and the results showed that there exists a significant adsorption effect of NO2 on the SnS monolayers. To fully exploit the potential of transition metal-doped InN monolayers as sensors for toxic gases, Guo et al. [22] proposed the utilization of InN monolayers decorated with Pd, Pt, Ag, and Au for NO2 sensing applications. However, they are always plagued by issues of structural instability, limited lifespan, high cost, and susceptibility to external interference, which ultimately restricts the research and application of gas sensors.
Recently, it has become widely recognized that organic macromolecule porphyrins possess significant electron-donating properties due to their abundant p electrons and extended π-bonds. The intrinsic advantages have facilitated the utilization of porphyrins in advanced technological applications, encompassing spintronics, electrocatalysis, and gas sensors [23,24,25,26,27]. For instance, Wang et al. [28] investigated the sensing properties of 2D metal-porphyrin porous nanosheets towards CO, NO, NO2 gases, the results indicated that the FePP-Grid and ZnPP-Grid could be used for the detection of CO, NO and NO2. The redox properties of 2D iron porphyrin nanosheets were investigated through DFT calculations by Luo et al. revealing their electronic structure and potential applications in catalysis [29]. According to previous reports [30], the transition metal (TM) atom in 2D metalloporphyrin molecules exhibits exceptional catalytic activity due to charge transfer between reactant molecules and TM. Therefore, the central TM atom may function as an active site for capturing or detecting SF6 decomposition gases.
In this study, we conducted a first-principles study to investigate the sensing properties of five major gases (H2S, SO2, SOF2, SO2F2, and HF) on the intrinsic porphyrin (Pr) and Fe-doped porphyrin (FePr) monolayers. Firstly, the thermal stability of FePr was verified, followed by a comprehensive analysis of the adsorption energies and electronic properties across various adsorption systems. Furthermore, the gas sensing efficacy of FePr towards five main SF6 decomposition components was assessed by analyzing the variation in band gap and work function. Finally, the magnetic properties and recovery times of a FePr monolayer were examined to assess its suitability for sensing applications in adsorbing or detecting SF6 decomposition gases.
2. Computational methods
All the spin calculations were conducted using the DMol3 package [31] within Materials Studio software, employing the density functional theory (DFT) method. The Perdew-Burke-Ernzerhof (PBE) function under the generalized gradient approximation (GGA) was selected to describe electron-electron interaction [32]. To ensure the precision of calculation results, we employed the DFT-D method proposed by Grimme [33] to correct the interactions between gases and FePr. The DNP basis set with a cutoff radius of 5.2 Å [34] and the DFT semi-core pseudopotential (DSSP) [35] method were employed in the simulation process. For structure optimization and electronic structure calculation, a k-point mesh with dimensions of 5×5×1 was employed [36]. The selection of a vacuum layer with a thickness of 20 Å in the z-direction effectively prevents interactions between adjacent units [37]. The energy tolerance accuracy was set to 1.0 × 10⁻⁵ Ha, while the maximum force and convergence displacement tolerances were set to 0.002 Ha/Å and 0.005 Å, respectively.
To assess the adsorption strength of gas molecules on the substrate, we calculated the adsorption energy (Eads) using the following equation [38]:
where Egas+substrate represents the total energy of the gas adsorbed on the substrate, with Esubstrate and Egas denoting the energies of the substrate and gas, respectively. If the absolute value of adsorption energy is greater than 0.5 eV, the adsorption process can be classified as chemical adsorption, otherwise, it is considered to be physical adsorption [39]. Moreover, the charge transfer from the FePr monolayer to a gas molecule can be calculated based on Mulliken charges by using the following equation [40]:
where Qadsorbed molecule and Qisolated molecule denote the number of charges of before and after adsorption, respectively. When QT > 0, it signifies that the gas molecule donates its electrons to the FePr monolayer, with the gas molecule acting as an electron donor. Moreover, the CDD of various adsorption systems can be computed using the following equation [41]:
where ρFePr/gas, ρFePr, and ρgas represent the charge density of a gas-adsorbed FePr monolayer, FePr monolayer and single gas molecules, respectively.
3. Results and discussion
3.1. Structural and electronic properties of Pr monolayer and FePr monolayer
Figure 1(a) displays the FePr monolayer consisting of 24 carbon (C) atoms, four nitrogen (N) atoms, eight hydrogen (H) atoms, and one transition metal iron (Fe) atom. When Fe atom is introduced into the Pr monolayer, all atoms are coplanar. The calculated lattice parameter of 10.85Å exhibits excellent conformity with other experimentally determined values [42]. Different adsorption styles of gas molecules were taken into account when the SF6 decomposition gases approached the surface of FePr in Figure 1(b). For example, the adsorption of SO2 molecule on FePr monolayer exhibits two distinct patterns, namely S-end and O-end, with S atoms and O atoms oriented, respectively. The definition method was also employed for the remaining molecules investigated in this work.
The binding energy of the FePr monolayer, as presented in Figure 2(a), is observed to be lower than that of bulk Fe. The result indicates that the FePr monolayer exhibits exceptional thermodynamic stability [43]. As depicted in Figure2 (a-b), the intrinsic Pr and FePr monolayers exhibit semi-metallic characteristics due to their zero band gap. It is noteworthy that the introduction of the Fe atom into pristine Pr results in the emergence of magnetic properties in the FePr monolayer. Specifically, the spin-down bands intersect with the Fermi energy level while the spin-up bands are situated at a considerable distance from it.
The CDD analysis and the DOSs analysis for the FePr monolayer are depicted in Figure3. As can be seen that all of the DOSs exhibit asymmetries, indicating that the FePr monolayer is a magnetic material. Figure 3(a) displays the Fe atom loss of electrons, while all four N atoms gain electrons, leading to the formation of coordination bonds between the Fe atom and N atoms. Consequently, a strong Fe-N bonding is established, ensuring structural stability, while the unpaired bonds of C atoms are neutralized through passivation with H atoms. Figure3 (b) shows the spin polarization states near the Fermi level are predominantly hybridized between the Fe-d and N-p orbitals. Moreover, The Fe-d-up displays significant hybridization with N4-p-up over the energy range of −3.26 eV to 2.03 eV, while the Fe-d-down orbital exhibits significant hybridization with N4-p-down orbitals within an energy range of −2.50 eV to 3.14 eV. In summary, the Fe-d orbital exhibits strong hybridization with the N4 of the Pr, resulting in a robust binding force between Fe and Pr monolayer.
3.2. Adsorption of gases on Pr monolayer
The adsorption properties of SF6 decomposition gases (H2S, SO2, SOF2, SO2F2, and HF) on the Pr monolayer were first evaluated. One can be seen from Table 1 that all the adsorption energies are negative, meaning that the adsorption process is an exothermic reaction. It can be also observed that H2S/SO2 are preferentially adsorbed on the Pr monolayer with the S-end, while SOF2 and SO2F2 gas molecules prefer to adsorb on the Pr monolayer with the O-end, and the HF molecules show a preference for adsorption on the Pr monolayer with F-end. Among the tested molecules, the lowest adsorption energy on the Pr monolayer belongs to the SO2 molecule, followed by SOF2, HF, SO2F2 and H2S. The adsorption of SO2 displays favorable strength, with adsorption energies of −0.69 eV. These findings indicate that the intrinsic Pr monolayer exhibits a moderate affinity towards SO2. However, the intrinsic Pr monolayer exhibits poor sensitivity towards SO2 due to its limited changes in Eg and M, as indicated in Table 1. By contrast, the Pr monolayer exhibits a low affinity towards H2S, SOF2, SO2F2 and HF molecules, indicating its poor capture capacity for these four gases. Therefore, the intrinsic Pr nanosheet is not a suitable sensing material for H2S, SOF2, SO2F2 and HF molecules.
The optimal adsorption systems, CDD and EDD for the five toxic gases adsorbed by intrinsic Pr monolayer are presented in Figure 4. The preferential adsorption of SO2, H2S, SOF2, SO2F2 and HF gas molecules is the cavity of the Pr monolayer, as presented in Figure4 (a1−a5). According to Figure 4 (b1−b5), it can be observed that the SO2 and SO2F2 molecules undergo electron gain, while the other three molecules experience varying degrees of electron loss. Furthermore, the EDD analysis indicates a significant overlap in electron density distribution between SO2 molecules and Pr monolayer. However, H2S, SOF2, SO2F2 and HF exhibit only minimal electron sharing with the Pr substrate, as illustrated in Figure 4 (c1-c5). This also indicates that the Pr monolayer exhibits a greater interaction strength with SO2 compared to the other four gases. To further determine the microscopic interactions of gas molecules and Pr monolayer, the corresponding DOSs for the Pr monolayer following gas adsorption are depicted in Figure 5 (a-e). For SO2, there are more resonance peaks observed in the Pr monolayer compared to the other four gases within energy ranging from −5.0 eV ~ 5.0 eV. Thus, the adsorption strength of SO2 is greater than that the H2S, SOF2, SO2F2, and HF, which is consistent with the results obtained for Eads.
3.3. Adsorption of gases on FePr monolayer
The adsorption of H2S, SOF2, SO2, SO2F2, and HF gases on FePr monolayer was thoroughly investigated in this section, Table 2 presents the adsorption parameters and electronic performance of the studied gases. The calculated adsorption energies for H2S, SO2, SOF2, SO2F2, and HF molecules are −0.42 eV, −0.86 eV, −0.78 eV, −0.33 eV and −0.33 eV, respectively. In terms of adsorption energies, the FePr monolayer exhibits a moderate adsorption capacity towards H2S, SO2 and SOF2. However, its capture ability is weaker for SO2F2 and HF molecules. In addition, the FePr substrate receives approximately 0.350 e, 0.066 e, and 0.087 e from H2S, SO2 and SOF2 gas molecules respectively. However, relatively small amounts of 0.027 e and 0.021 e were transferred to the FePr monolayer from SO2F2 and HF gases, respectively. This result implies that all the SF6 decomposition components are electron acceptors. Moreover, a moderate QT leads to an appropriate adsorption capacity for H2S, SOF2 and SO2, suggesting that the FePr monolayer has the potential as a gas capture material. Interestingly, the Eg and M of FePr appeared to change after the adsorption for H2S, SO2 and SOF2, indicating excellent gas sensitivity of the FePr sheet towards these three gases.
The optimal adsorption systems, CDD and EDD for the five toxic gases adsorbed by FePr monolayer are illustrated in Figure 6. As shown in Figure 6(a1−a5), the adsorption strength is SOF2 > SO2 > H2S > SO2F2/HF. The high adsorption energies suggest chemisorption between the SOF2, SO2, and H2S molecules and FePr substrate, while SO2F2 and HF molecules exhibit weak physisorption. From the CDD illustrated in Figure 6 (b1–b3), it is apparent that a significant depletion of electrons occurs around the H2S, SO2 and SOF2, while numerous electrons accumulate around the Fe atoms, this result suggests that the Fe atom received a significant amount of electrons from H2S, SO2, and SOF2. The EDD diagrams depicted in Figure 6(c1-c5) reveal a notable overlap of charge density among the H2S@FePr, SO2@FePr, and SOF2@FePr adsorption systems, indicating a significant interaction between the gases and FePr monolayer. However, for the SO2F2@FePr and HF@FePr systems, no discernible overlap in electron density is observed. Consequently, the FePr monolayer demonstrates a higher affinity towards H2S, SO2 and SOF2 molecules compared to SO2F2 and HF.
The DOSs and PDOSs for the FePr monolayer with adsorption of SF6 decomposition components are presented in Figure 7 and Figure 8. When the HF and SO2F2 are adsorbed onto FePr monolayer (Figure 8(d&e)), the limited number of occupied states near the Fermi level suggests a weak interaction between FePr monolayer and SO2F2/HF. Furthermore, as shown in Figure8(d), the overlap between O-p and FeN4-d orbitals is only confined to the energy level of −10.39 eV, resulting in the feeble interaction of SO2F2 and FePr sheet. From Figure 8(e), no resonance peaks are observed between F-p and FeN4-d orbitals. Therefore, the electronic properties of FePr are not significantly affected by HF molecule. Nevertheless, the H2S, SO2, and SOF2 exert a significant influence on the electronic structure of the FePr monolayer. As shown in Figure8(a), there are five distinct resonance peaks at approximately −6.88 eV, −4.18 eV, −2.36 eV, −0.56 eV and 0.56 eV in the H2S@FePr system. For SO2 and SOF2, the number of observed resonance peaks is greater for both gases when adsorbed on FePr monolayer compared to H2S (Figure 7(a-c)). This indicates that the adsorption strength of SOF2 and SO2 is greater than that of H2S, which is consistent with the results of Eads. In addition, as displayed in Figure 8(b&c), there are significant orbital hybridizations between S-p and FeN4-p/d of SO2/SOF2 within the energy ranging from –10.0 to 7.5 eV. The significant orbital interactions lead to an appropriate adsorption capacity of SOF2 and SO2 molecules with the Eads of –0.78 eV and –0.86 eV, which is advantageous for gas capture. Moreover, the FePr monolayer experiences a transition from a magnetic to a nonmagnetic state upon the adsorption of H2S, SO2, and SOF2 molecules. While the magnetic properties of SO2F2 and HF molecules remain unchanged upon adsorption. The variation in the magnetic moment of the FePr monolayer is advantageous for the detection of diverse toxic gases.
3.4. Sensing performance evaluation of FePr monolayer
In general, the conductivity (σ) of a material is closely related to the band gap (Eg), thus, the FePr nanosheet’s sensitivity towards targeted gases can be assessed by the variations of conductivity, which can be defined as follows [44]:
where Eg is bandgap, KB is Boltzmann constant, and K is temperature.
The band structure of adsorption systems is illustrated in Figure 9. Compared with the zero bandgaps of the FePr monolayer (Figure2), the bandgap of FePr after H2S, SO2, and SOF2 adsorption is changed to 1.013 eV, 0.919 eV and 0.916 eV, respectively. This suggests that the conducting property of intrinsic FePr is transformed into a semiconducting characteristic after gas adsorption. In other words, the FePr monolayer exhibits exceptional sensitivity towards H2S, SO2, and SO2F2. However, the adsorption of SO2F2 and HF molecules has a negligible effect on the Eg of the FePr monolayer, indicating its poor sensitivity towards these gases. Apart from the Eg, the variations in magnetic properties resulting from gas adsorption can be also served as an indicator for evaluating the sensitivity of a gas sensor. Most notably, the M of the FePr monolayer disappears after H2S, SO2, and SOF2 adsorptions. Thus, the FePr monolayer demonstrates potential as a magnetic gas sensor for the detecting of H2S, SO2, and SOF2 detection.
In addition, the sensitivity of the FePr monolayer can also be evaluated by measuring the change of work function (φ) before and after gas adsorption [45,46], where φ is defined as:
The vacuum and Fermi levels of the FePr monolayer after gas adsorption is represented by Evaccum and Efermi, respectively.
The calculated φ of the FePr before and after gas adsorption are depicted in Figure10. It can be observed that the work function of FePr undergoes significant changes upon the adsorption of SF6 decomposition components. Compared to the FePr monolayer with the φ of 4.65 eV, the φ of the FePr monolayer increases to 5.25 eV and 5.22 eV after the SO2 and SOF2 adsorption, respectively. The increase in φ indicates the charge transfer from the FePr monolayer to gases, resulting in the formation of an interface dipole in the same direction [47,48]. In contrast, the adsorption of H2S, SO2F2, and HF on the intrinsic FePr monolayer leads to a reduction in the φ values to 4.57 eV, 4.40 eV, and 4.40 eV, respectively. Therefore, the FePr monolayer can also serve as a φ−type gas sensor for detecting H2S, SO2, SOF2, SO2F2, and HF molecules.
Additionally, the quantification of sensitivity (Se) can provide a more precise evaluation of gas sensor sensitivity [49], which is as follows:
where σFePr/gas and σFePr indicate the conductivity of the FePr monolayer before and after gas adsorption, respectively.
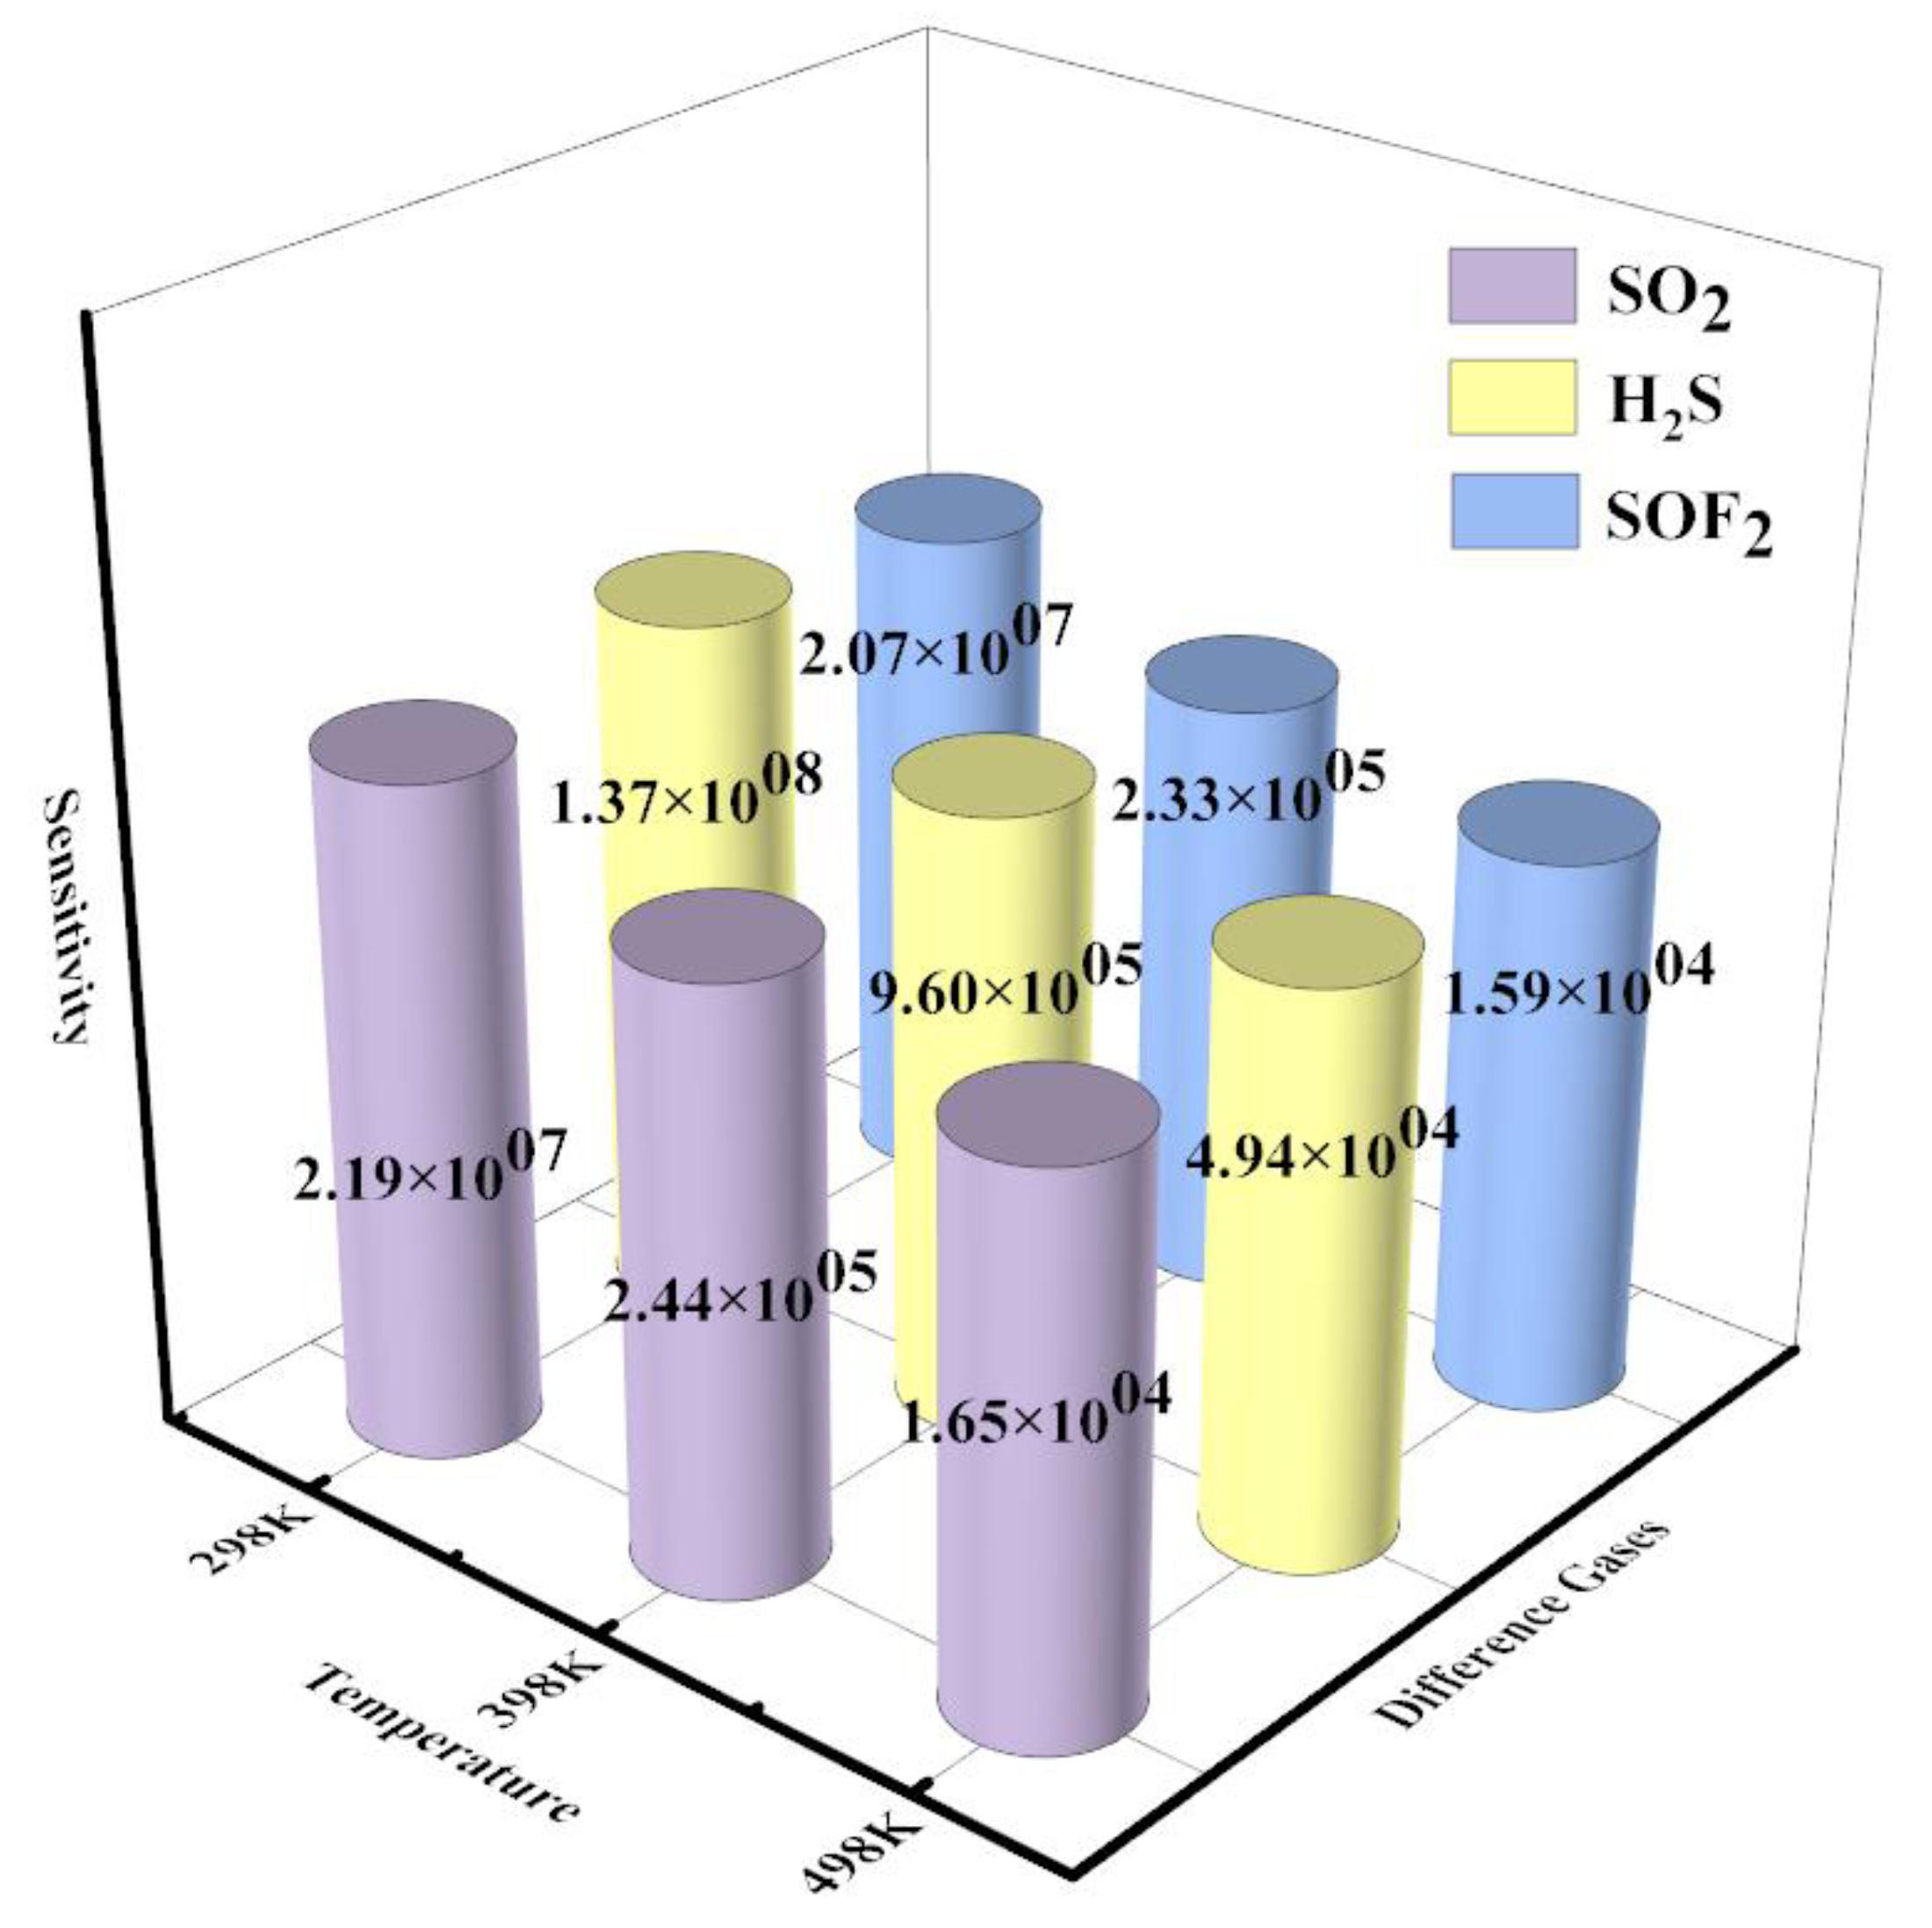
Figure11 shows the sensitivity of the FePr monolayer toward the SO2, H2S, and SOF2 at the range temperatures of 298 to 498 K. The Se of the FePr monolayer towards SO2, H2S and SOF2 at 298 K falls within the range of (2.07–13.7) ×107, which is significantly higher than that of SF6 (approximately 103)[12]. In addition, the FePr monolayer displays the highest sensitivity to H2S at each temperature, followed by SO2 and SOF2. The sensitivity of FePr towards SOF2 was 2.07×10⁷ at 298 K and 1.59×10⁴ at 398 K. However, the sensitivity of FePr to H2S/SO2 exceeded that of SOF2. With the increase in operating temperature, there was a slight decrease in the sensitivity of H2S, SOF2, and SO2F2. In conclusion, the FePr monolayer exhibits excellent sensing capabilities towards H2S, SO2, and SOF2.
Figure 11.
The sensitivity of the FePr monolayer toward the gases at the range temperatures of 298 K to 498 K.
Figure 11.
The sensitivity of the FePr monolayer toward the gases at the range temperatures of 298 K to 498 K.
Finally, the recovery time (τ) is strongly correlated with adsorption energy and can be determined by [50,51]:
where υ0, KB, and T indicate the frequency factor, Boltzmann constant, and temperature, respectively.
Figure 12 displays the τ of H2S, SO2, SOF2, SO2F2, and HF molecules adsorption systems at the range temperatures of 298 K to 498 K. The FePr monolayer exhibits an extremely short recovery time for H2S, SO2, SOF2, SO2F2, and HF molecules at working temperatures, indicating that these gases can be easily desorbed from the FePr monolayer. Interestingly, the τ of H2S, SO2, and SOF2 is estimated to be 12.6 μs, 18.5 s, and 15.4 s at 298K, respectively. Therefore, the FePr is regarded as a promising, reusable gas sensor for detecting H2S, SOF2 and SO2 due to its appropriate adsorption capacity and short desorption time.
4. Conclusions
In this paper, we investigated the adsorption characteristics of five primary SF6 decomposition gases (H2S, SO2, SOF2, SO2F2, HF) on the Pr and FePr monolayers using DFT computations. We also analyzed the electronic properties and sensing mechanisms of different adsorption systems. The main conclusions are succinctly outlined as follows:
(1) The thermodynamic stability of the FePr monolayer is attributed to the significant orbital hybridization between the Fe atom and the Pr monolayer surface.
(2) The FePr monolayer possesses a moderate capture capacity of H2S/SO2/SOF2, while it exhibits weak adsorption ability of SO2F2 and HF gases due to the physical adsorption.
(3) The FePr monolayer has a higher affinity with H2S, SO2 and SOF2 due to the robust orbital hybridizations between these gases and the FePr monolayer within an energy range of −10.0 to 7.5 eV.
(4) Due to its appropriate adsorption strength, exquisite sensitivity, and short recovery time, the FePr monolayer shows great potential as a recyclable gas sensor for detecting H2S, SOF2 and SO2 detection.
Author Contributions
Conceptualization, Z. N.; methodology, E. D; visualization, X. H.; software, H. X.; validation, Q. C.; investigation, X. H.; Formal analysis, R. X.; data curation, E. D.; writing – original draft, X. H. and E. D.; writing - review & editing, Z. N. and H. X.; project administration, Z. N.; Funding acquisition, Z. N. All authors have read and agreed to the published version of the manuscript.
Funding
This work was supported by the National Natural Science Foundation of China (Grant No. 51904137), Special Basic Cooperative Research Programs of Yunnan Provincial Undergraduate Universities’ Association (Grant No. 202101BA070001-032), Basic Research Project of Yunnan Province (202201AT070017), Scientific Research Funds of Yunnan Education Department (2023Y0901 and 2023Y0895), and Science and Technology Project of Yunnan Precious Metals Lab (No.YPML-2022050230). The authors also thank the High-Level Talent Plans for Young Top-notch Talents of Yunnan Province (Grant No. YNWR-QNBJ-2020-017) and High-Level Talent Special Support Plans for Young Talents of Kunming City (Grant No. C201905002).
Institutional Review Board Statement
Not applicable.
Informed Consent Statement
Not applicable.
Data Availability Statement
The data presented in this study is contained within the article.
Acknowledgments
We thank the editor and the reviewers for their useful help for improving this paper, along with the Scientific Innovation Team of Kunming University for helpful discussions on topics related to this work.
Conflicts of Interest
The authors declare no conflict of interest.
References
- Kim, S.; Nagorny, P. Electrochemical Synthesis of Glycosyl Fluorides Using Sulfur(VI) Hexafluoride as the Fluorinating Agent. Org Lett 2022, 24, 2294–2298. [Google Scholar] [CrossRef] [PubMed]
- Hou, W.; Mi, H.; Peng, R.; Peng, S.; Zeng, W.; Zhou, Q. First-Principle Insight into Ga-Doped MoS(2) for Sensing SO(2), SOF(2) and SO(2)F(2). Nanomaterials (Basel) 2021, 11. [Google Scholar]
- Nagarajan, V.; Chandiramouli, R. SF6 and SOF2 interaction studies on novel Tricycle Red Phosphorene sheets based on first-principles studies. Chemical Physics Letters 2022, 800, 139674. [Google Scholar] [CrossRef]
- Paul, T. A.; Porus, M.; Galletti, B.; Kramer, A. SF6 concentration sensor for gas-insulated electrical switchgear. Sensors and Actuators A: Physical 2014, 206, 51–56. [Google Scholar] [CrossRef]
- Xu, L.; Gui, Y.; Li, W.; Li, Q.; Chen, X. Gas-sensing properties of Ptn-doped WSe2 to SF6 decomposition products. Journal of Industrial and Engineering Chemistry 2021, 97, 452–459. [Google Scholar] [CrossRef]
- Kim, K. H.; Ingole, P. G.; Kim, J. H.; Lee, H. K. Experimental investigation and simulation of hollow fiber membrane process for SF6 recovery from GIS. Polymers for Advanced Technologies 2013, 24, 997–1004. [Google Scholar] [CrossRef]
- Liu, D.; Gui, Y.; Ji, C.; Tang, C.; Zhou, Q.; Li, J.; Zhang, X. Adsorption of SF6 decomposition components over Pd (1 1 1): A density functional theory study. Applied Surface Science 2019, 465, 172–179. [Google Scholar] [CrossRef]
- Li, Z.; Jia, L.; Chen, J.; Cui, X.; Zeng, W.; Zhou, Q. Ag-modified hexagonal GaN monolayer as an innovative gas detector toward SF6 decomposed species: Insights from the first-principles computations. Applied Surface Science 2022, 589, 153000. [Google Scholar] [CrossRef]
- Liao, Y.; Zhou, Q.; Peng, R.; Zeng, W. Adsorption properties of InP3 monolayer toward SF6 decomposed gases: A DFT study. Physica E: Low-dimensional Systems and Nanostructures 2021, 130, 114689. [Google Scholar] [CrossRef]
- Wang, D.; Yang, A.; Lan, T.; Fan, C.; Pan, J.; Liu, Z.; Chu, J.; Yuan, H.; Wang, X.; Rong, M.; Koratkar, N. Tellurene based chemical sensor. Journal of Materials Chemistry A 2019, 7, 26326–26333. [Google Scholar] [CrossRef]
- Deng, P.; Cheng, L.; Jiang, P.; Zeng, Z.; Li, A.; Liao, C. Sensing performance of CdPc monolayer toward the SF6 decomposition gases: A DFT study. Chemical Physics Letters 2022, 806, 140030. [Google Scholar] [CrossRef]
- Nie, Z.; Wang, C.; Xue, R.; Xie, G.; Xiong, H. Two-dimensional FePc and MnPc monolayers as promising materials for SF6 decomposition gases detection: Insights from DFT calculations. Applied Surface Science 2023, 608, 155119. [Google Scholar] [CrossRef]
- Ma, S.; Li, D.; Rao, X.; Xia, X.; Su, Y.; Lu, Y. Pd-doped h-BN monolayer: a promising gas scavenger for SF6 insulation devices. Adsorption 2020, 26, 619–626. [Google Scholar] [CrossRef]
- Zhang, H.; Ma, Y.; Xiong, H.; Deng, G.; Yang, L.; Nie, Z. Highly sensitive and selective sensing-performance of 2D Co-decorated phthalocyanine toward NH3, SO2, H2S and CO molecules. Surfaces and Interfaces 2023, 36, 102641. [Google Scholar] [CrossRef]
- Hou, W.; Liu, Y.; Zeng, W.; Zhou, Q. Theoretical screening into Ag-Embedded HfS2 monolayers as gas sensor for detecting SF6 decomposition gases. Journal of Materials Research and Technology 2022, 18, 1991–2000. [Google Scholar] [CrossRef]
- Chen, D.; Zhang, X.; Tang, J.; Cui, H.; Pi, S.; Cui, Z. Adsorption of SF(6) Decomposed Products over ZnO(101̅0): Effects of O and Zn Vacancies. ACS Omega 2018, 3, 18739–18752. [Google Scholar] [CrossRef]
- Faye, O.; Eduok, U.; Szpunar, J. A.; Beye, A. C. Two-dimensional carbon nitride (C3N) nanosheets as promising materials for H2S and NH3 elimination: A computational approach. Physica E: Low-dimensional Systems and Nanostructures 2020, 117, 113794. [Google Scholar] [CrossRef]
- Xiao-Hong, L.; Shan-Shan, L.; Yong-Liang, Y.; Rui-Zhou, Z. Adsorption of NH3 onto vacancy-defected Ti2CO2 monolayer by first-principles calculations. Applied Surface Science 2020, 504, 144325. [Google Scholar] [CrossRef]
- Ding, C.; Hu, X.; Feng, L.; Fernando, G. Study on the Adsorption Characteristics of Mo-Doped Graphene on the Decomposition Products of SF6 Substitute Gas Based on First-Principle Calculations. Advances in Condensed Matter Physics 2022, 2022, 1–9. [Google Scholar] [CrossRef]
- Cui, H.; Zhang, X.; Li, Y.; Chen, D.; Zhang, Y. First-principles insight into Ni-doped InN monolayer as a noxious gases scavenger. Applied Surface Science 2019, 494, 859–866. [Google Scholar] [CrossRef]
- Hu, F.-F.; Tang, H.-Y.; Tan, C.-J.; Ye, H.-Y.; Chen, X.-P.; Zhang, G.-Q. Nitrogen Dioxide Gas Sensor Based on Monolayer SnS: A First-Principle Study. IEEE Electron Device Letters 2017, 38, 983–986. [Google Scholar] [CrossRef]
- Guo, Y.; Zhang, Y.; Wu, W.; Liu, Y.; Zhou, Z. Transition metal (Pd, Pt, Ag, Au) decorated InN monolayer and their adsorption properties towards NO2: Density functional theory study. Applied Surface Science 2018, 455, 106–114. [Google Scholar] [CrossRef]
- Yamamoto, A.; Mizuno, Y.; Teramura, K.; Hosokawa, S.; Shishido, T.; Tanaka, T. Visible-light-assisted selective catalytic reduction of NO with NH3 on porphyrin derivative-modified TiO2 photocatalysts. Catalysis Science & Technology 2015, 5, 556–561. [Google Scholar]
- Ge, R.; Li, X.; Kang, S.-Z.; Qin, L.; Li, G. Highly efficient graphene oxide/porphyrin photocatalysts for hydrogen evolution and the interfacial electron transfer. Applied Catalysis B: Environmental 2016, 187, 67–74. [Google Scholar] [CrossRef]
- Chen, D.; Wang, K.; Hong, W.; Zong, R.; Yao, W.; Zhu, Y. Visible light photoactivity enhancement via CuTCPP hybridized g-C3N4 nanocomposite. Applied Catalysis B: Environmental 2015, 166–167, 366–373. [Google Scholar] [CrossRef]
- Abel, M.; Clair, S.; Ourdjini, O.; Mossoyan, M.; Porte, L. Single layer of polymeric Fe-phthalocyanine: an organometallic sheet on metal and thin insulating film. J Am Chem Soc 2011, 133, 1203–1205. [Google Scholar] [CrossRef] [PubMed]
- Kim, J. H.; Lee, S. H.; Lee, J. S.; Lee, M.; Park, C. B. Zn-containing porphyrin as a biomimetic light-harvesting molecule for biocatalyzed artificial photosynthesis. Chem Commun (Camb) 2011, 47, 10227–10229. [Google Scholar] [CrossRef]
- Wang, X.-Y.; Li, Y.-Q.; Zhu, S.-Y.; He, Q.-W.; Tang, D.-S.; Wang, X.-C. The adsorption characteristics of CO, NO and NO2 on two dimensional metalloporphyrin porous nanosheets: A first-principles study. Applied Surface Science 2022, 582, 152469. [Google Scholar] [CrossRef]
- Luo, G.; Wang, Y.; Li, Y. Two-dimensional iron-porphyrin sheet as a promising catalyst for oxygen reduction reaction: a computational study. Sci Bull (Beijing) 2017, 62, 1337–1343. [Google Scholar] [CrossRef] [PubMed]
- Yu, H.-X.; Mu, H.-M.; Zhu, D.-R.; Zhang, Y.; Wang, X.-C.; Xiao-An Zhang, S. DFT study on the oxygen titanium porphyrin as sustainable cyclic catalyst for water splitting. International Journal of Hydrogen Energy 2019, 44, 19920–19928. [Google Scholar] [CrossRef]
- Delley, B. From molecules to solids with the DMol3 approach. The Journal of Chemical Physics 2000, 113, 7756–7764. [Google Scholar] [CrossRef]
- Zeng, J.; Xu, L.; Luo, X.; Chen, T.; Tang, S.-H.; Huang, X.; Wang, L.-L. Z-scheme systems of ASi2N4 (A = Mo or W) for photocatalytic water splitting and nanogenerators. Tungsten 2021, 4, 52–59. [Google Scholar] [CrossRef]
- Grimme, S. Semiempirical GGA-type density functional constructed with a long-range dispersion correction. J Comput Chem 2006, 27, 1787–1799. [Google Scholar] [CrossRef]
- Delley, B. Hardness conserving semilocal pseudopotentials. Physical Review B 2002, 66. [Google Scholar] [CrossRef]
- Vozzi, C.; Negro, M.; Calegari, F.; Sansone, G.; Nisoli, M.; De Silvestri, S.; Stagira, S. Generalized molecular orbital tomography. Nature Physics 2011, 7, 822–826. [Google Scholar] [CrossRef]
- Monkhorst, H. J.; Pack, J. D. Special points for Brillouin-zone integrations. Physical Review B 1976, 13, 5188–5192. [Google Scholar] [CrossRef]
- Xiong, H.-h.; Zhang, H.-n.; Dong, J.-h. Adhesion strength and stability of TiB2/TiC interface in composite coatings by first principles calculation. Computational Materials Science 2017, 127, 244–250. [Google Scholar] [CrossRef]
- Liu, Y.; Zhou, Q.; Wang, J.; Zeng, W. Cr doped MN (M = In, Ga) monolayer: A promising candidate to detect and scavenge SF6 decomposition components. Sensors and Actuators A: Physical 2021, 330, 112854. [Google Scholar] [CrossRef]
- Yong, Y.; Cui, H.; Zhou, Q.; Su, X.; Kuang, Y.; Li, X. C2N monolayer as NH3 and NO sensors: A DFT study. Applied Surface Science 2019, 487, 488–495. [Google Scholar] [CrossRef]
- Gui, X.; Zhou, Q.; Peng, S.; Xu, L.; Zeng, W. Adsorption behavior of Rh-doped MoS2 monolayer towards SO2, SOF2, SO2F2 based on DFT study. Physica E: Low-dimensional Systems and Nanostructures 2020, 122, 114224. [Google Scholar] [CrossRef]
- Xu, L.; Zeng, J.; Li, Q.; Luo, X.; Chen, T.; Liu, J.; Wang, L.-L. Multifunctional silicene/CeO2 heterojunctions: Desirable electronic material and promising water-splitting photocatalyst. Chinese Chemical Letters 2022, 33, 3947–3950. [Google Scholar] [CrossRef]
- Sun, Q.; Dai, Y.; Ma, Y.; Li, X.; Wei, W.; Huang, B. Two-dimensional metalloporphyrin monolayers with intriguing electronic and spintronic properties. Journal of Materials Chemistry C 2015, 3, 6901–6907. [Google Scholar] [CrossRef]
- Xiong, H.; Liu, B.; Zhang, H.; Qin, J. Theoretical insight into two-dimensional M-Pc monolayer as an excellent material for formaldehyde and phosgene sensing. Applied Surface Science 2021, 543, 148805. [Google Scholar] [CrossRef]
- Esrafili, M. D.; Arjomandi Rad, F. Carbon-doped boron nitride nanosheets as highly sensitive materials for detection of toxic NO and NO2 gases: A DFT study. Vacuum 2019, 166, 127–134. [Google Scholar] [CrossRef]
- Roondhe, B.; Jha, P. K.; Ahuja, R. Haeckelite boron nitride as nano sensor for the detection of hazardous methyl mercury. Applied Surface Science 2020, 506, 144860. [Google Scholar] [CrossRef]
- Peng, S.; Cho, K.; Qi, P.; Dai, H. Ab initio study of CNT NO2 gas sensor. Chemical Physics Letters 2004, 387, 271–276. [Google Scholar] [CrossRef]
- Yu, Y.-X. A dispersion-corrected DFT study on adsorption of battery active materials anthraquinone and its derivatives on monolayer graphene and h-BN. J. Mater. Chem. A 2014, 2, 8910–8917. [Google Scholar] [CrossRef]
- Kistanov, A. A.; Cai, Y.; Zhou, K.; Dmitriev, S. V.; Zhang, Y.-W. The role of H2O and O2 molecules and phosphorus vacancies in the structure instability of phosphorene. 2D Materials 2016, 4, 015010. [Google Scholar] [CrossRef]
- Xia, S.-Y.; Tao, L.-Q.; Jiang, T.; Sun, H.; Li, J. Rh-doped h-BN monolayer as a high sensitivity SF6 decomposed gases sensor: A DFT study. Applied Surface Science 2021, 536, 147965. [Google Scholar] [CrossRef]
- Xu, Z.; Shi, Z.; Wang, M.; Song, R.; Zhang, X.; Liu, G.; Qiao, G. Gas sensing properties of defective tellurene on the nitrogen oxides: A first-principles study. Sensors and Actuators A: Physical 2021, 328, 112766. [Google Scholar] [CrossRef]
- Liu, Y.; Gui, Y.; Chen, X. Adsorption and sensing performances of ZnO-g-C3N4 monolayer toward SF6 decomposition products. Physica E: Low-dimensional Systems and Nanostructures 2021, 134, 114909. [Google Scholar] [CrossRef]
Figure 1.
(a) The configuration of top views and side views of the FePr monolayer and (b) the adsorption configurations of the different gases on FePr monolayer.
Figure 1.
(a) The configuration of top views and side views of the FePr monolayer and (b) the adsorption configurations of the different gases on FePr monolayer.
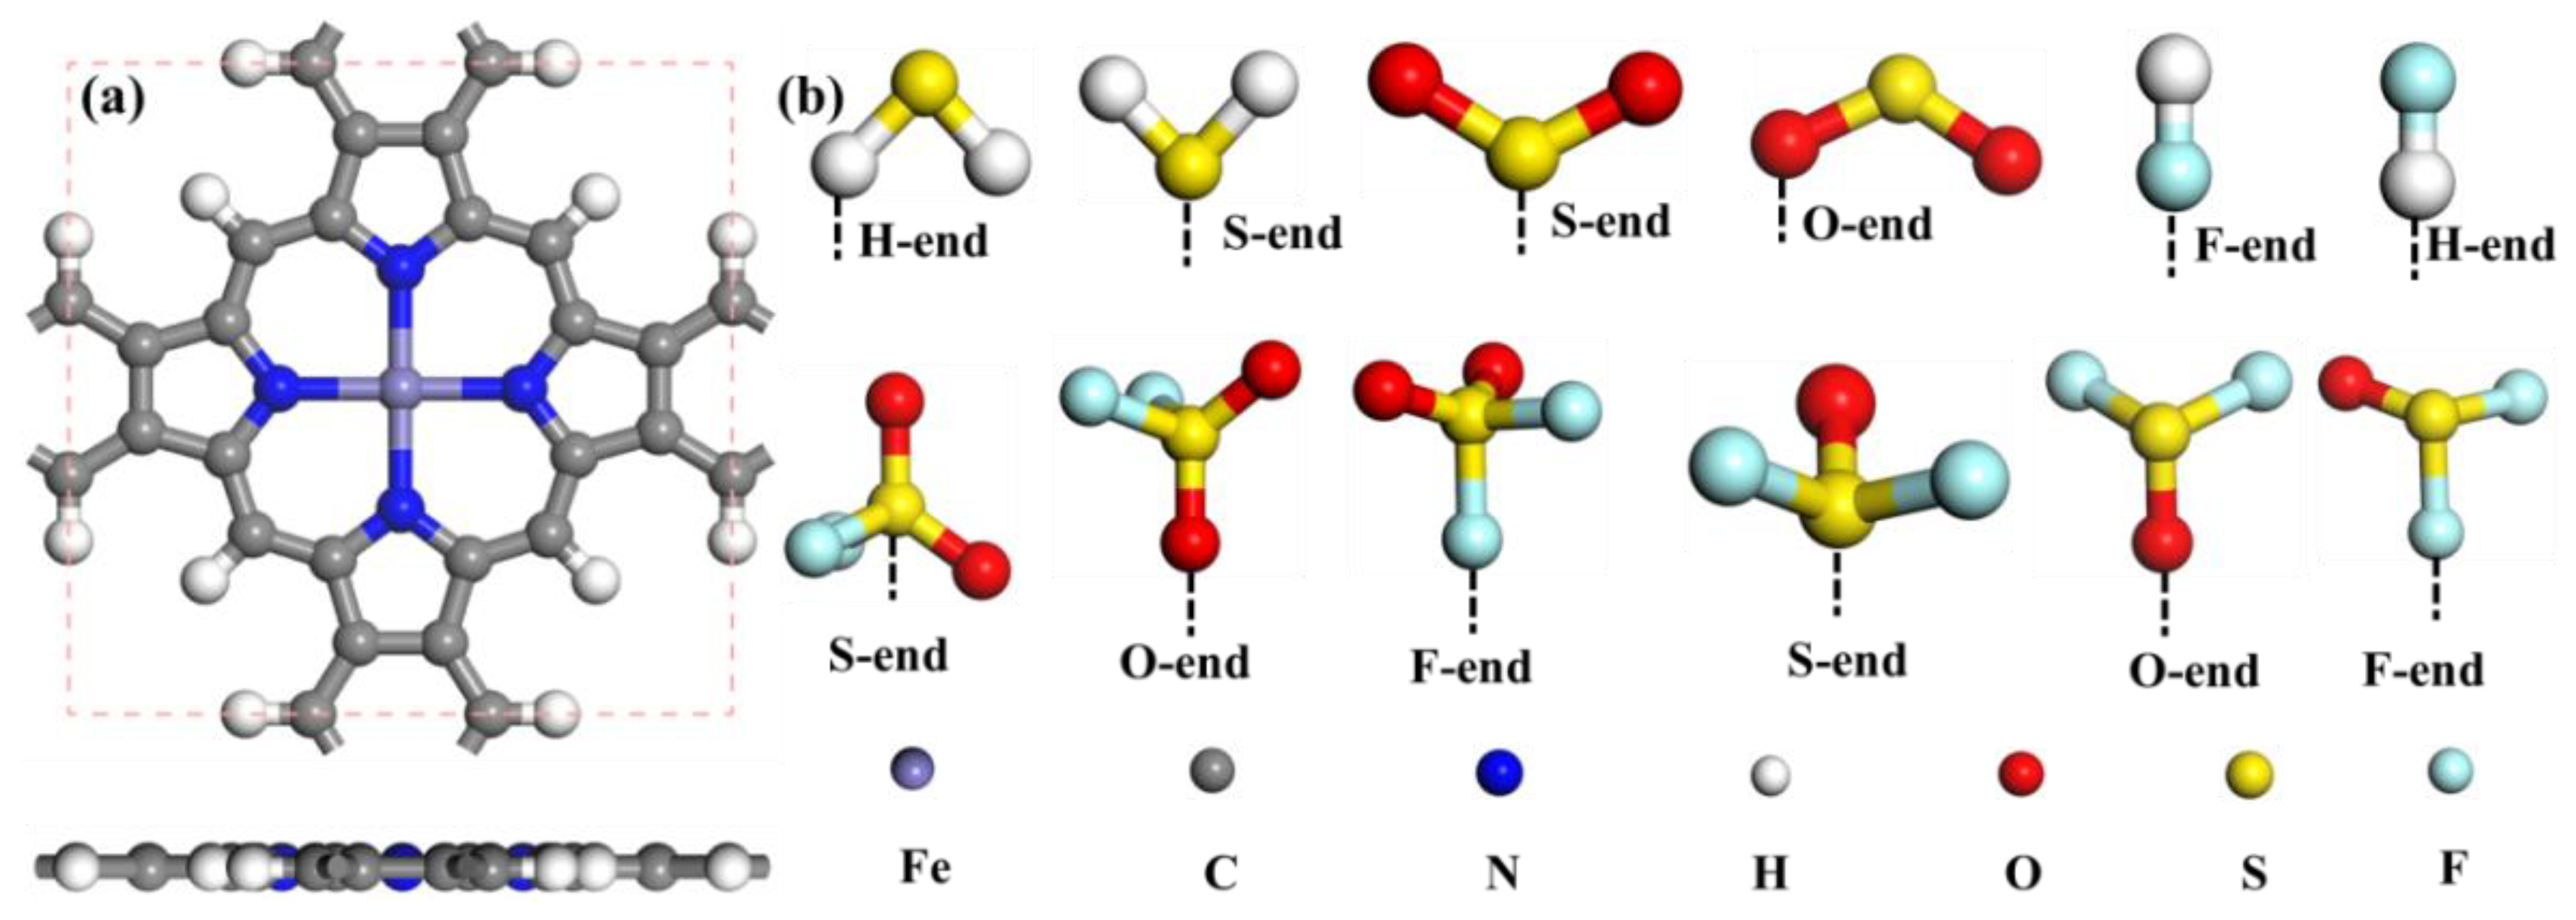
Figure 2.
(a) Cohesive energy of Fe bulk (Ecoh) and binding energy of FePr monolayer (Ebin), and band structure of the (b) Pr monolayer and (c) FePr monolayer.
Figure 2.
(a) Cohesive energy of Fe bulk (Ecoh) and binding energy of FePr monolayer (Ebin), and band structure of the (b) Pr monolayer and (c) FePr monolayer.
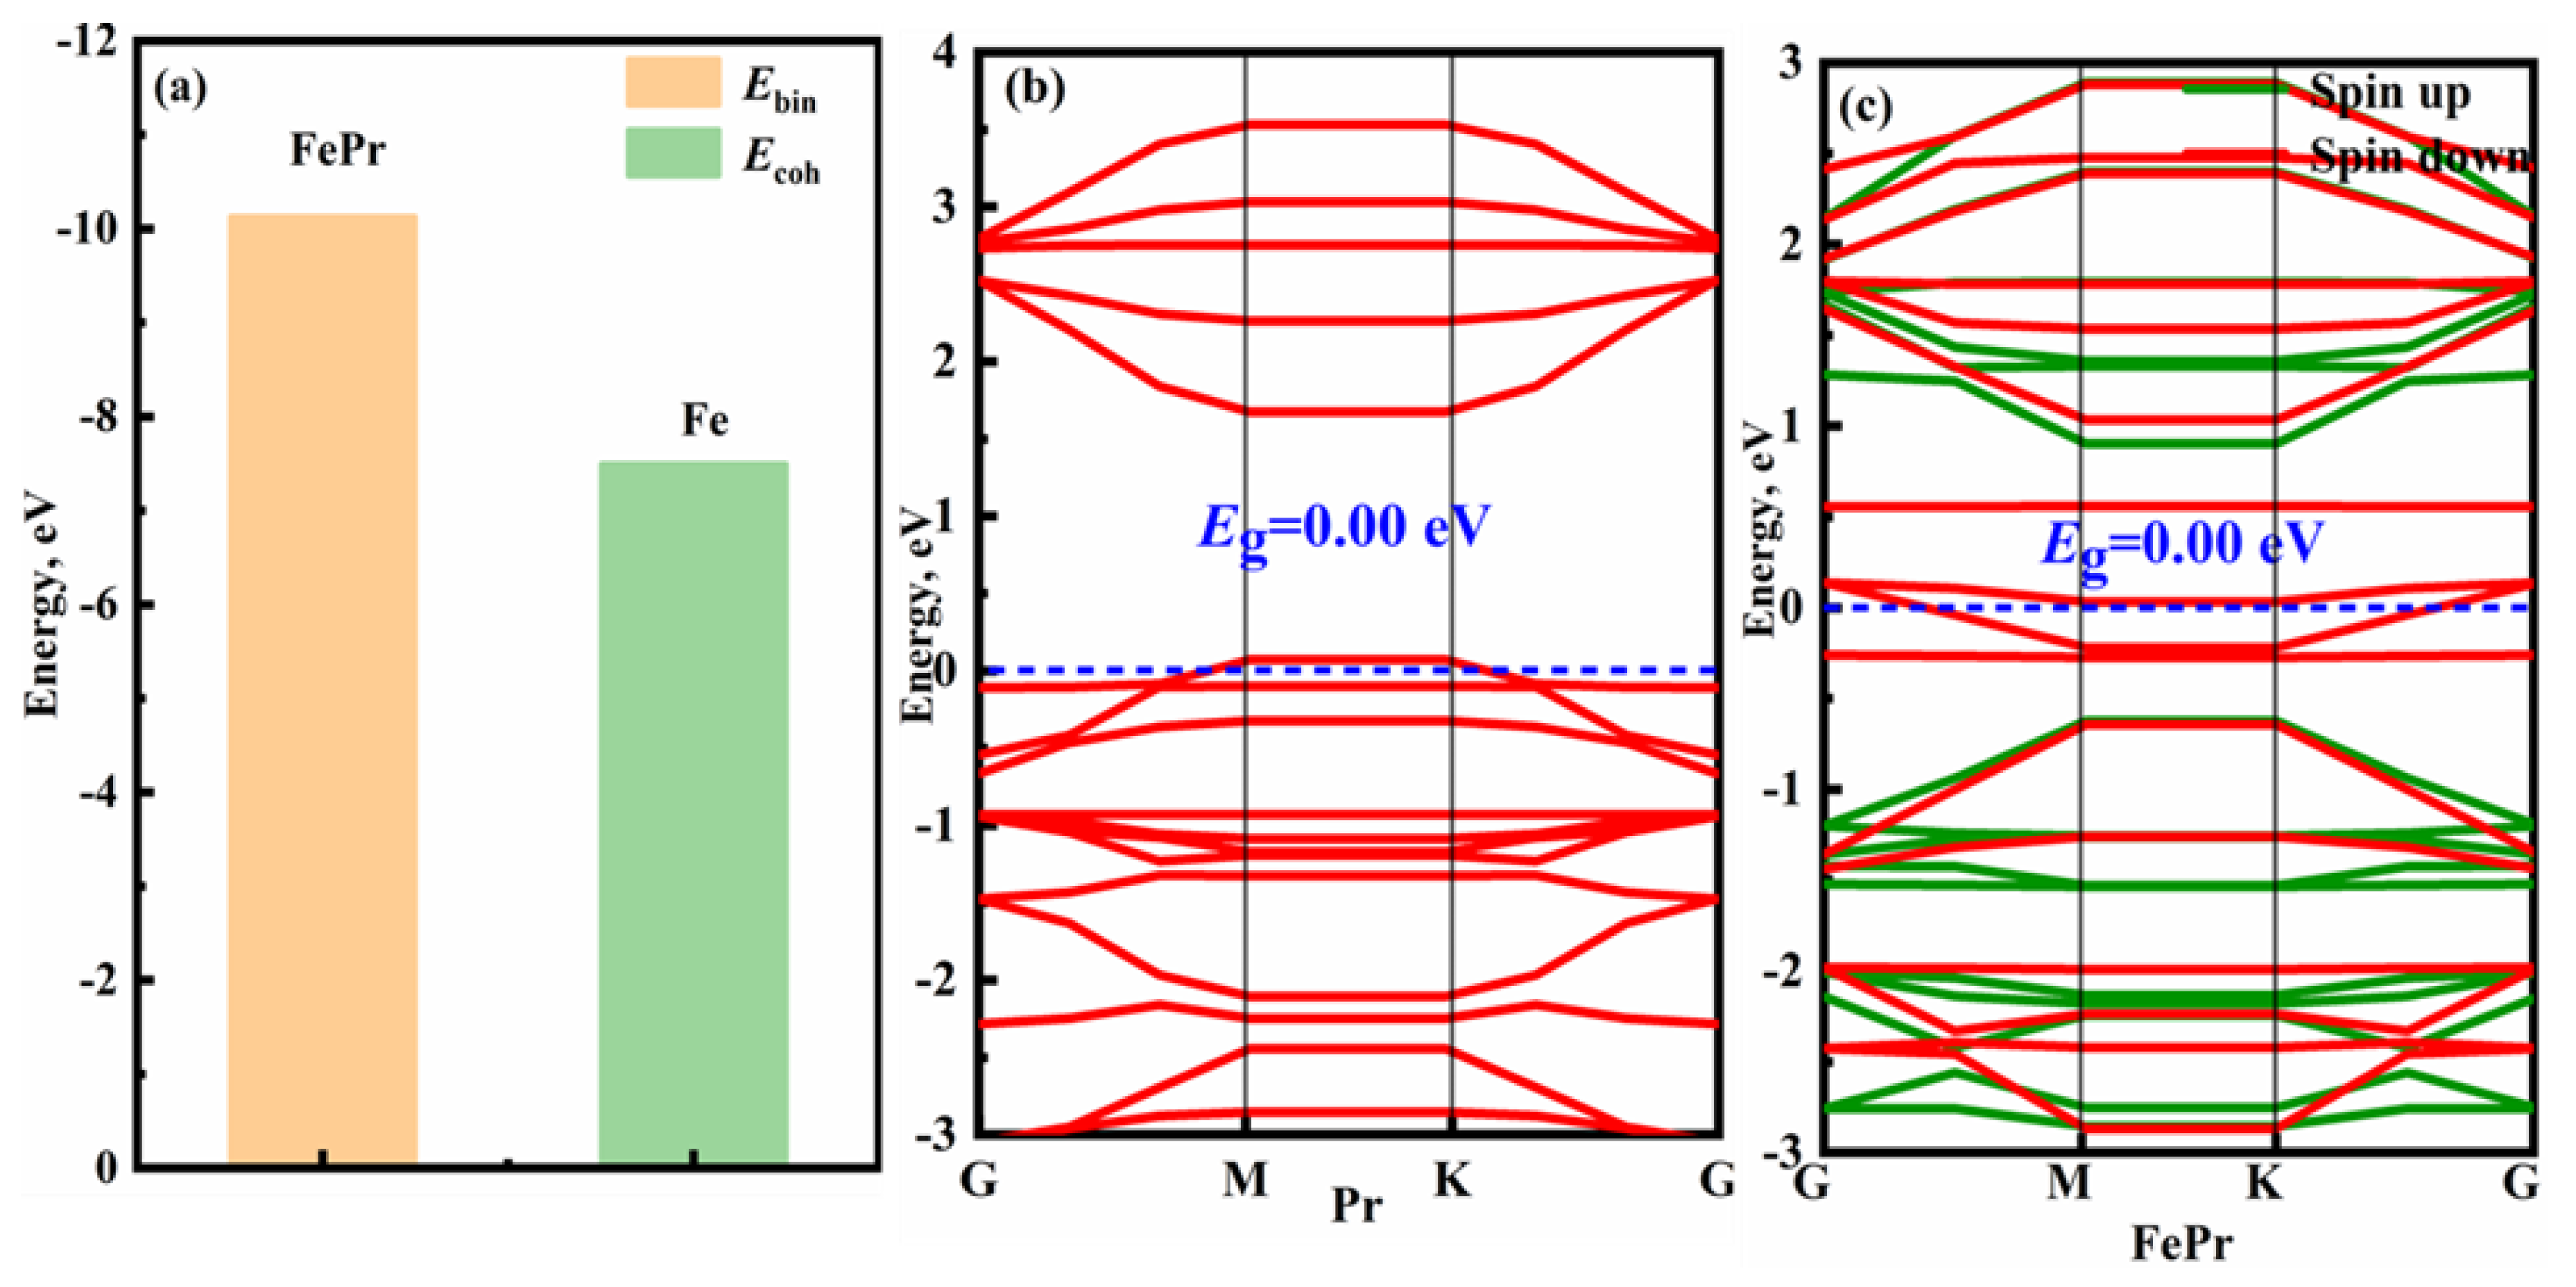
Figure 3.
CDD and DOSs of (a, b) FePr monolayer, where N4 denotes the four closest neighboring N atoms to the Fe atom. The blue region indicates electron accumulation, while the yellow region indicates electron depletion, and the isosurface value of the CDD being ± 0.01 e/Å3.
Figure 3.
CDD and DOSs of (a, b) FePr monolayer, where N4 denotes the four closest neighboring N atoms to the Fe atom. The blue region indicates electron accumulation, while the yellow region indicates electron depletion, and the isosurface value of the CDD being ± 0.01 e/Å3.
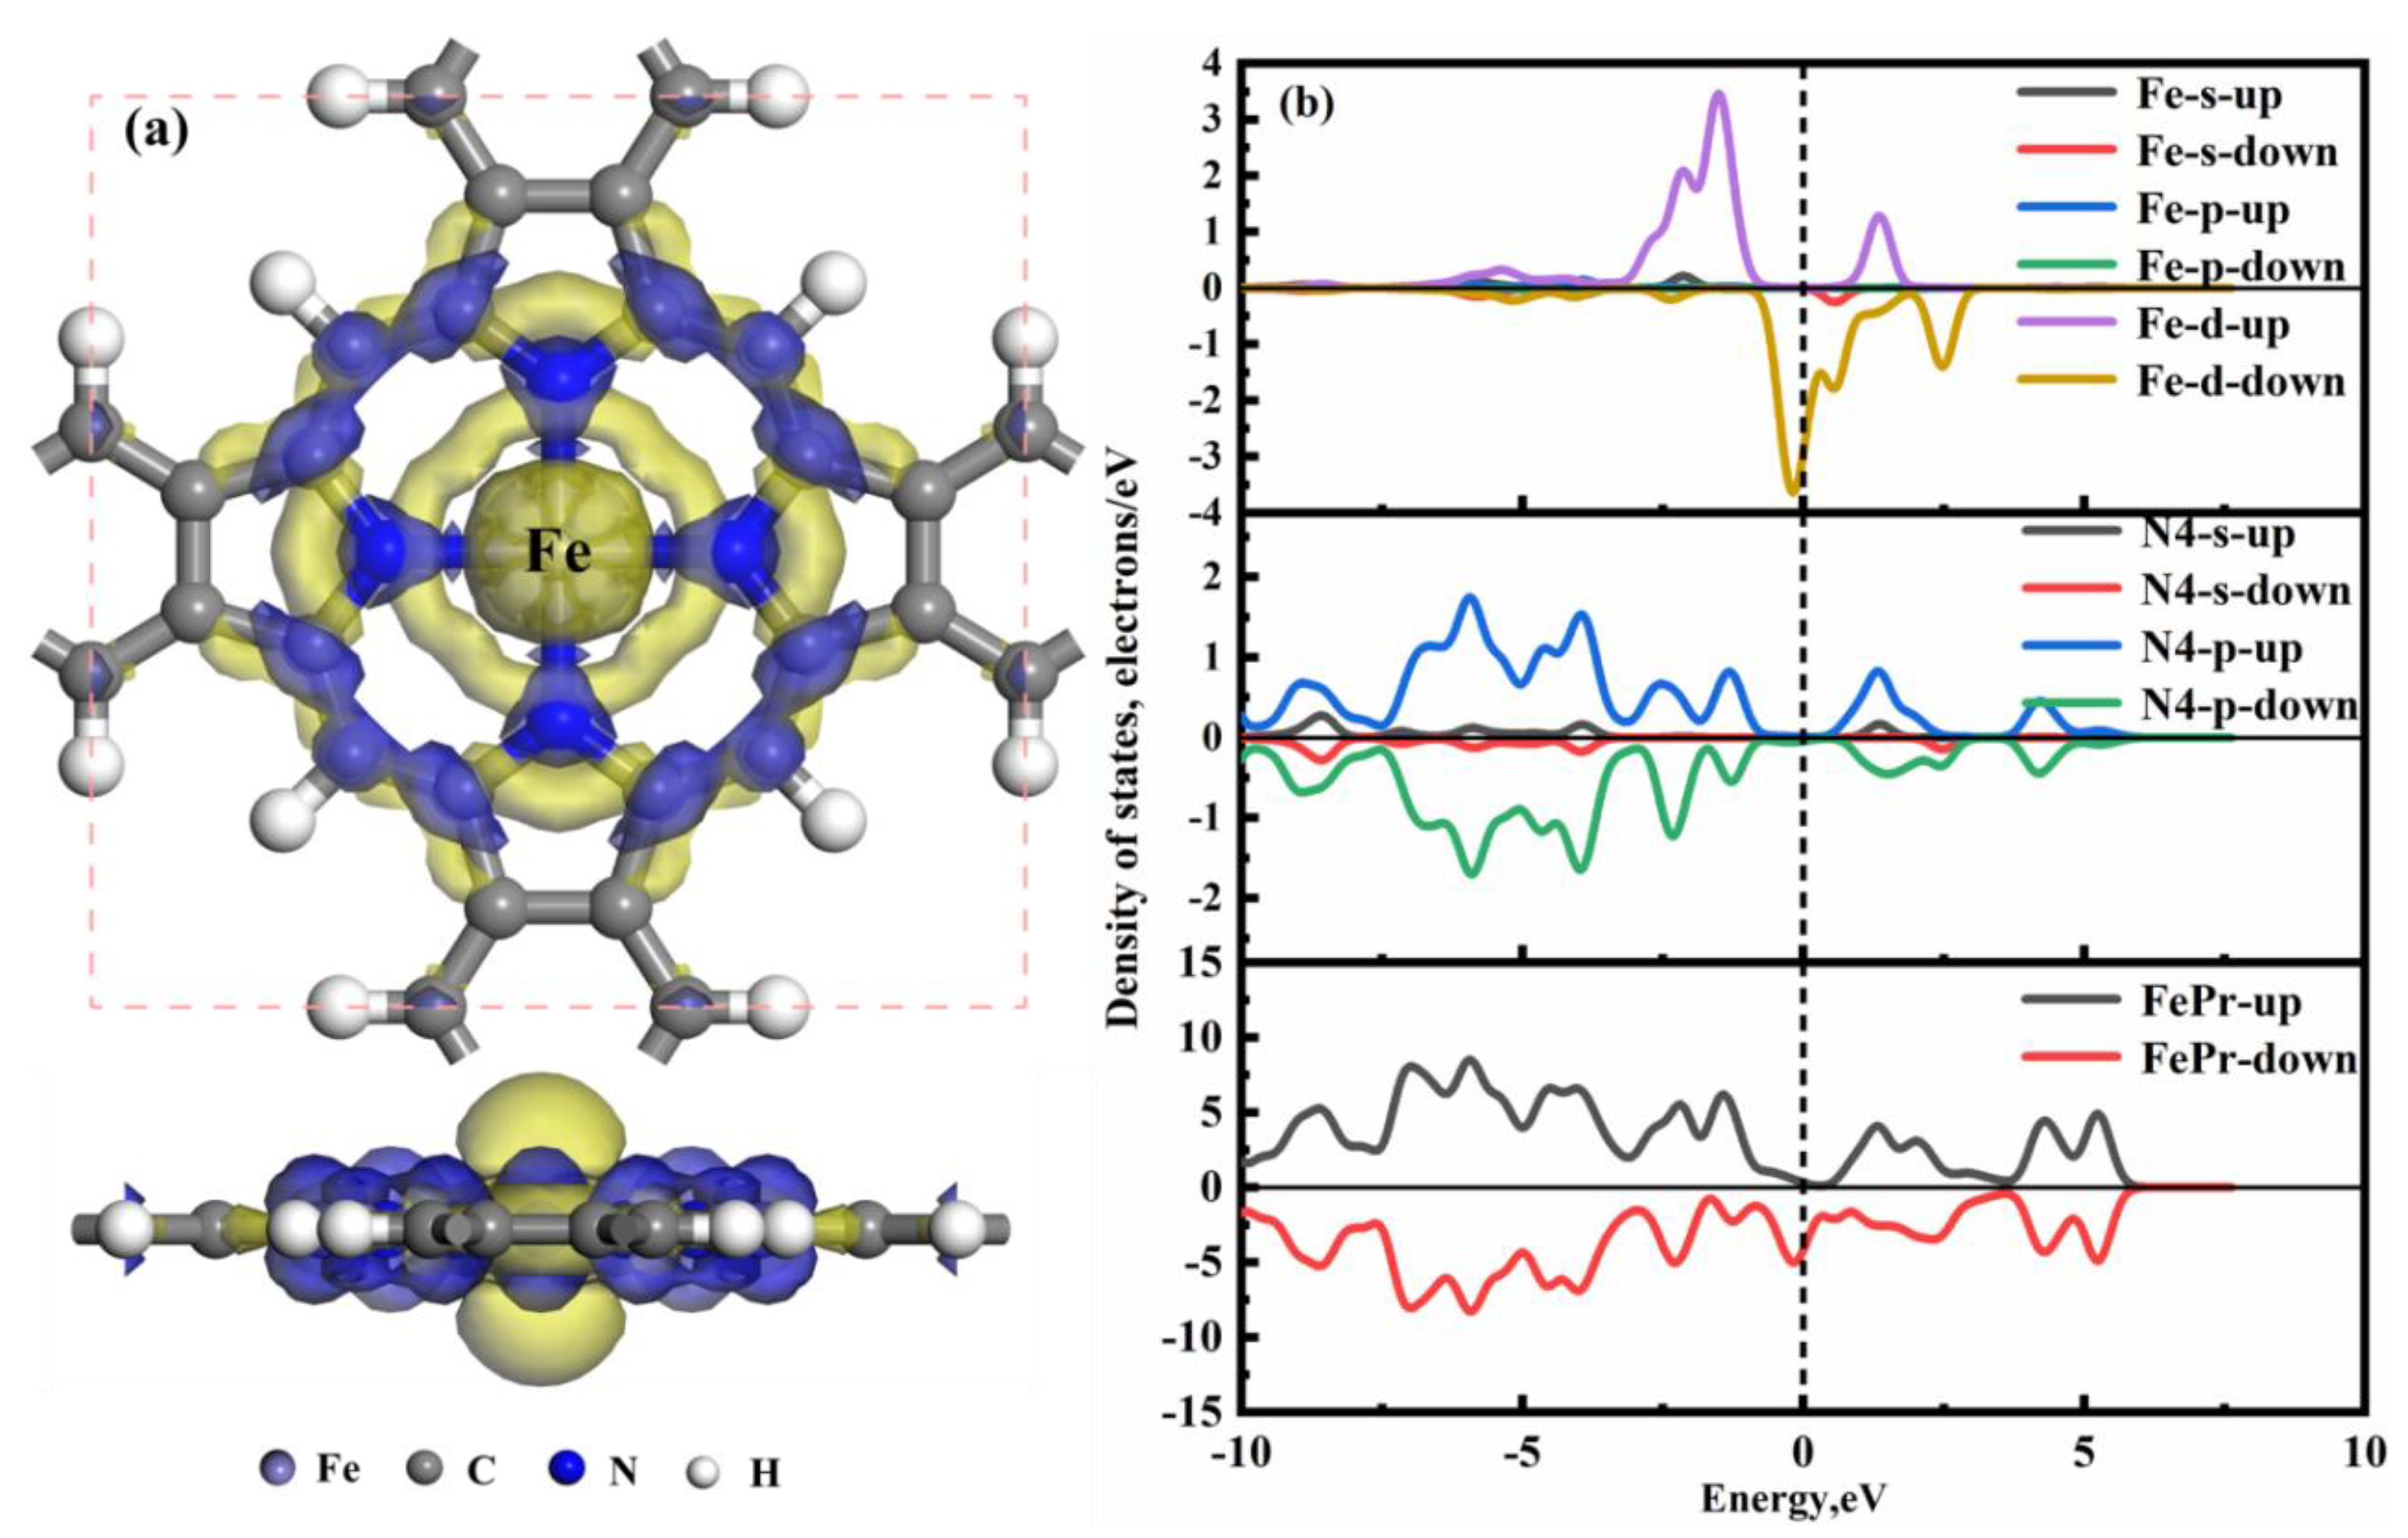
Figure 4.
The stable adsorption configurations, CDD, and EDD of (a1-c1) H2S, (a2-c2) SO2, (a3-c3) SOF2, (a4-d4) SO2F2 and(a5-c5)HF adsorbed on Pr monolayer. The blue region indicates electron accumulation, while the yellow region indicates electron depletion, the isosurface for CDD being ± 0.01 e/Å3 and the isosurface for EDD being 0.2 e/Å3.
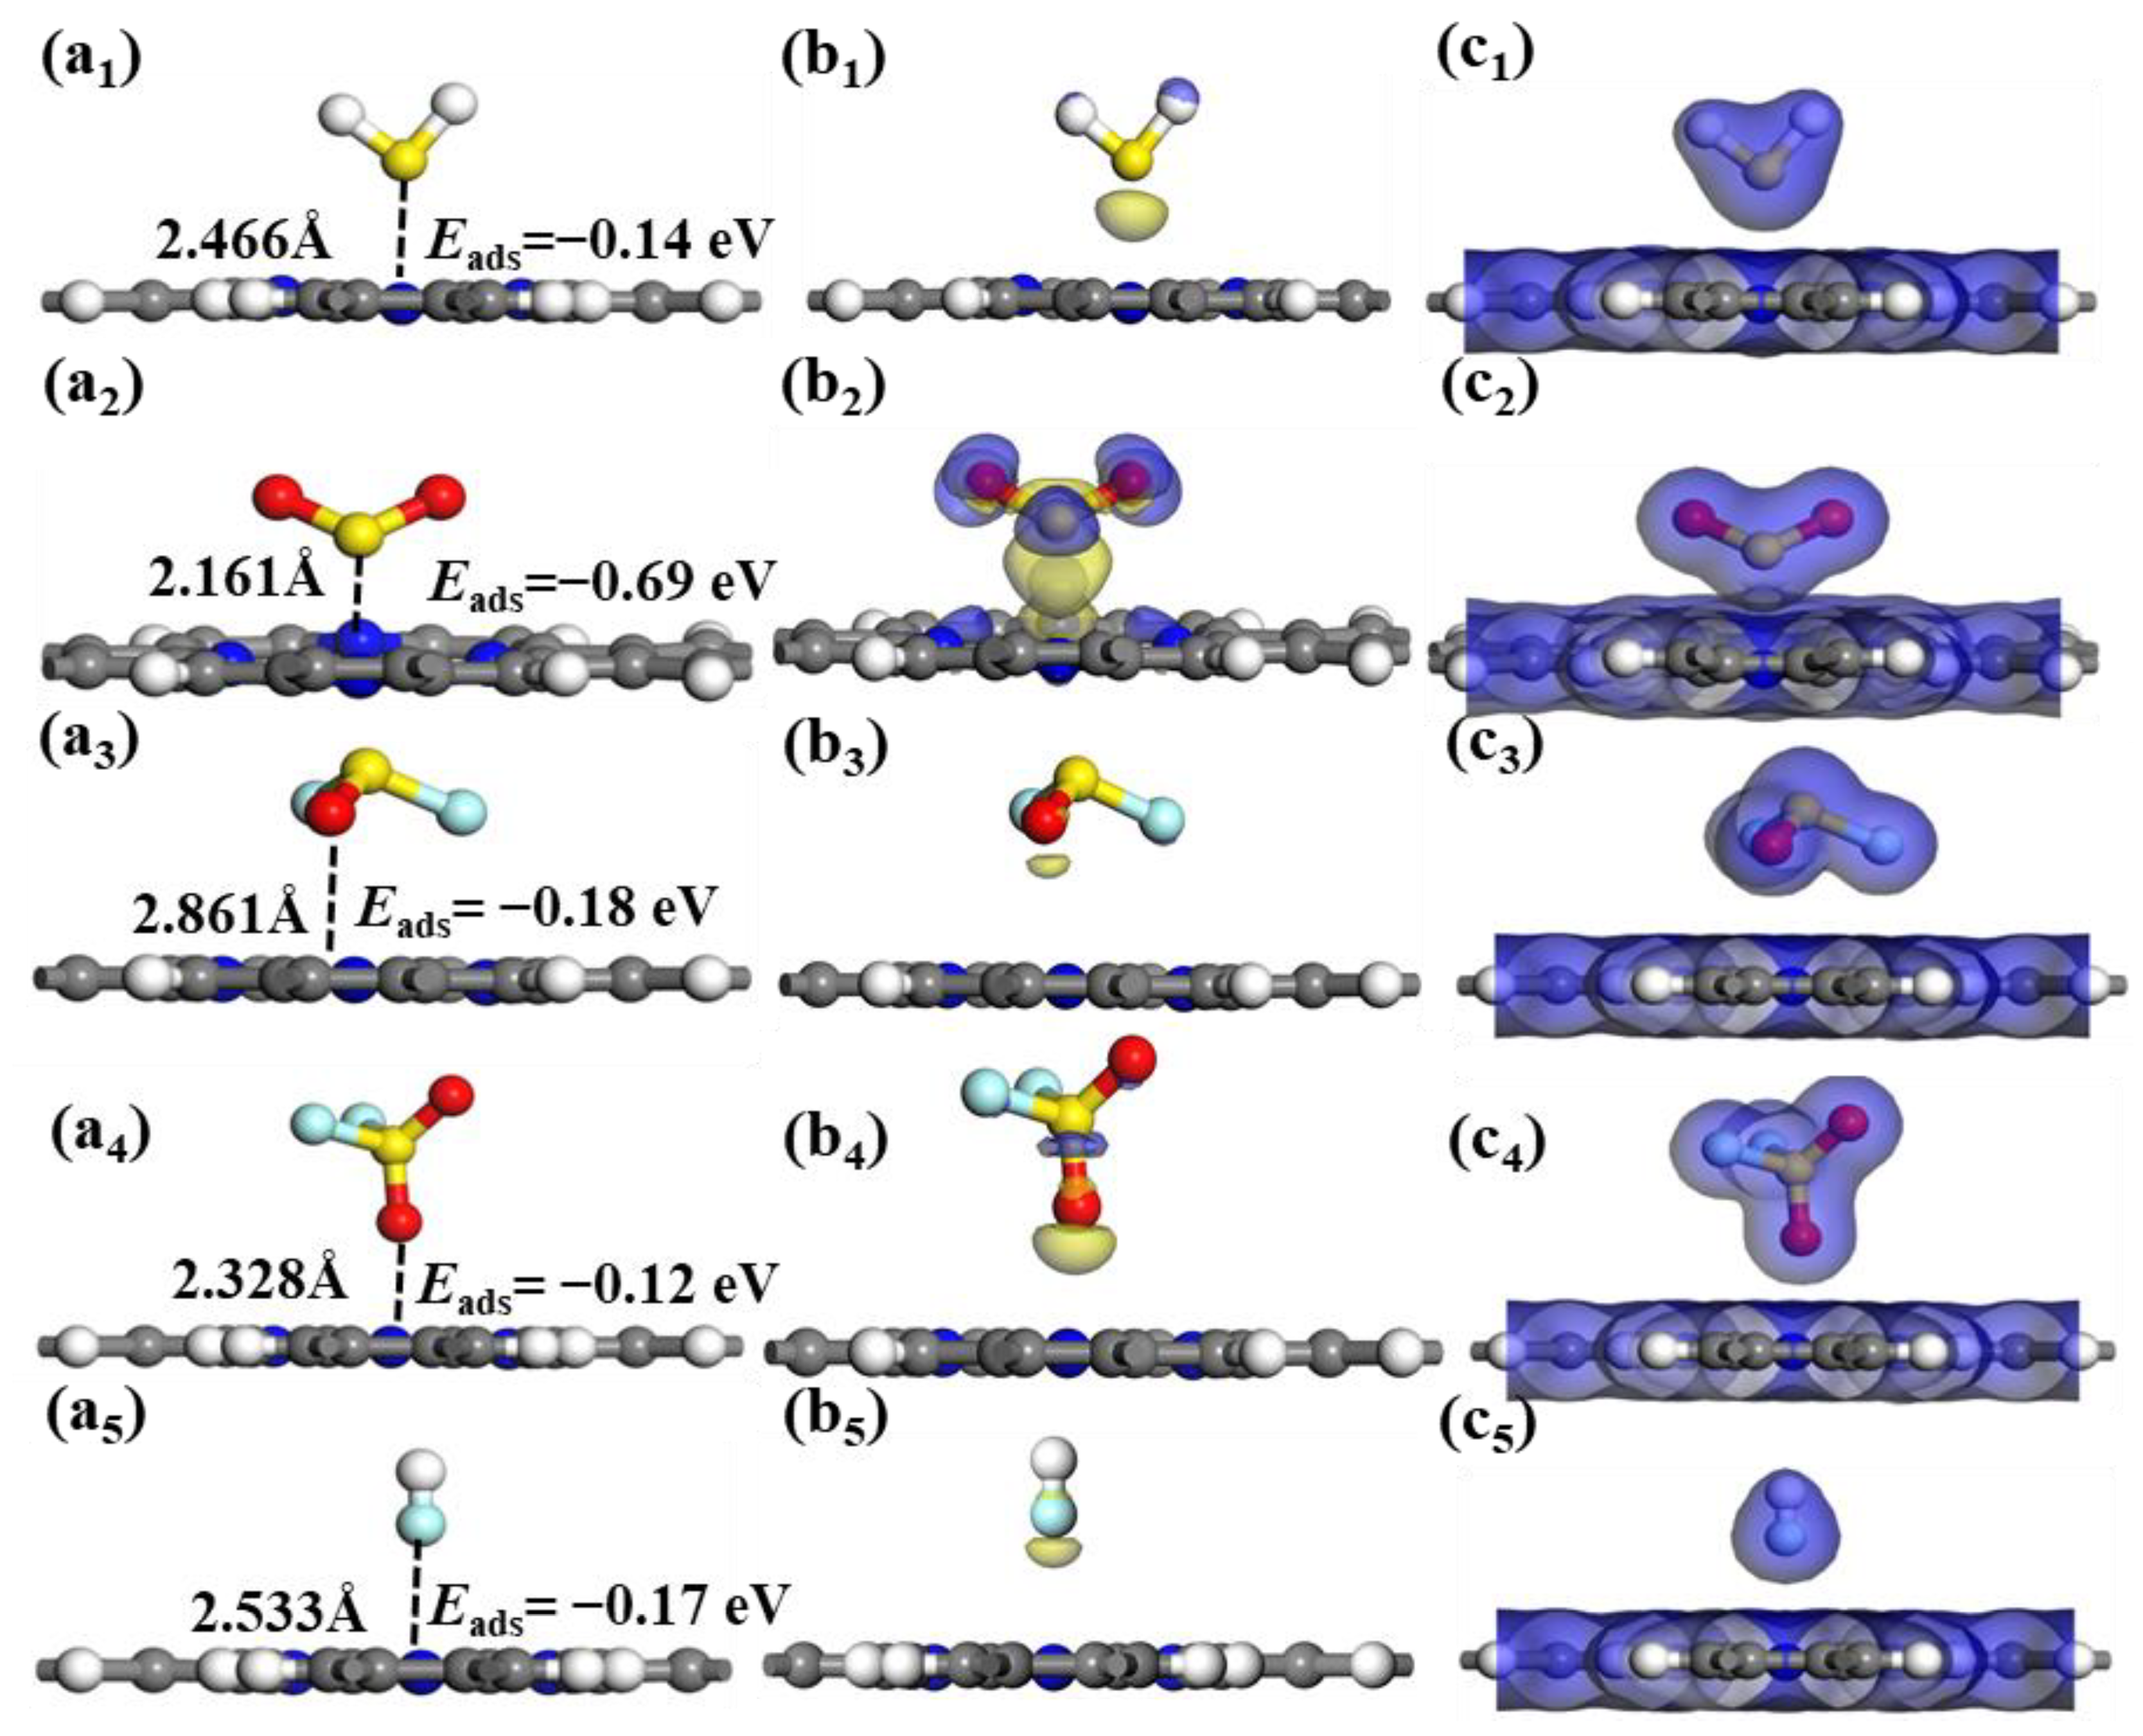
Figure 5.
The DOSs of (a) H2S, (b) SO2, (c) SOF2, (d) SO2F2, and (e) HF adsorbed on Pr.
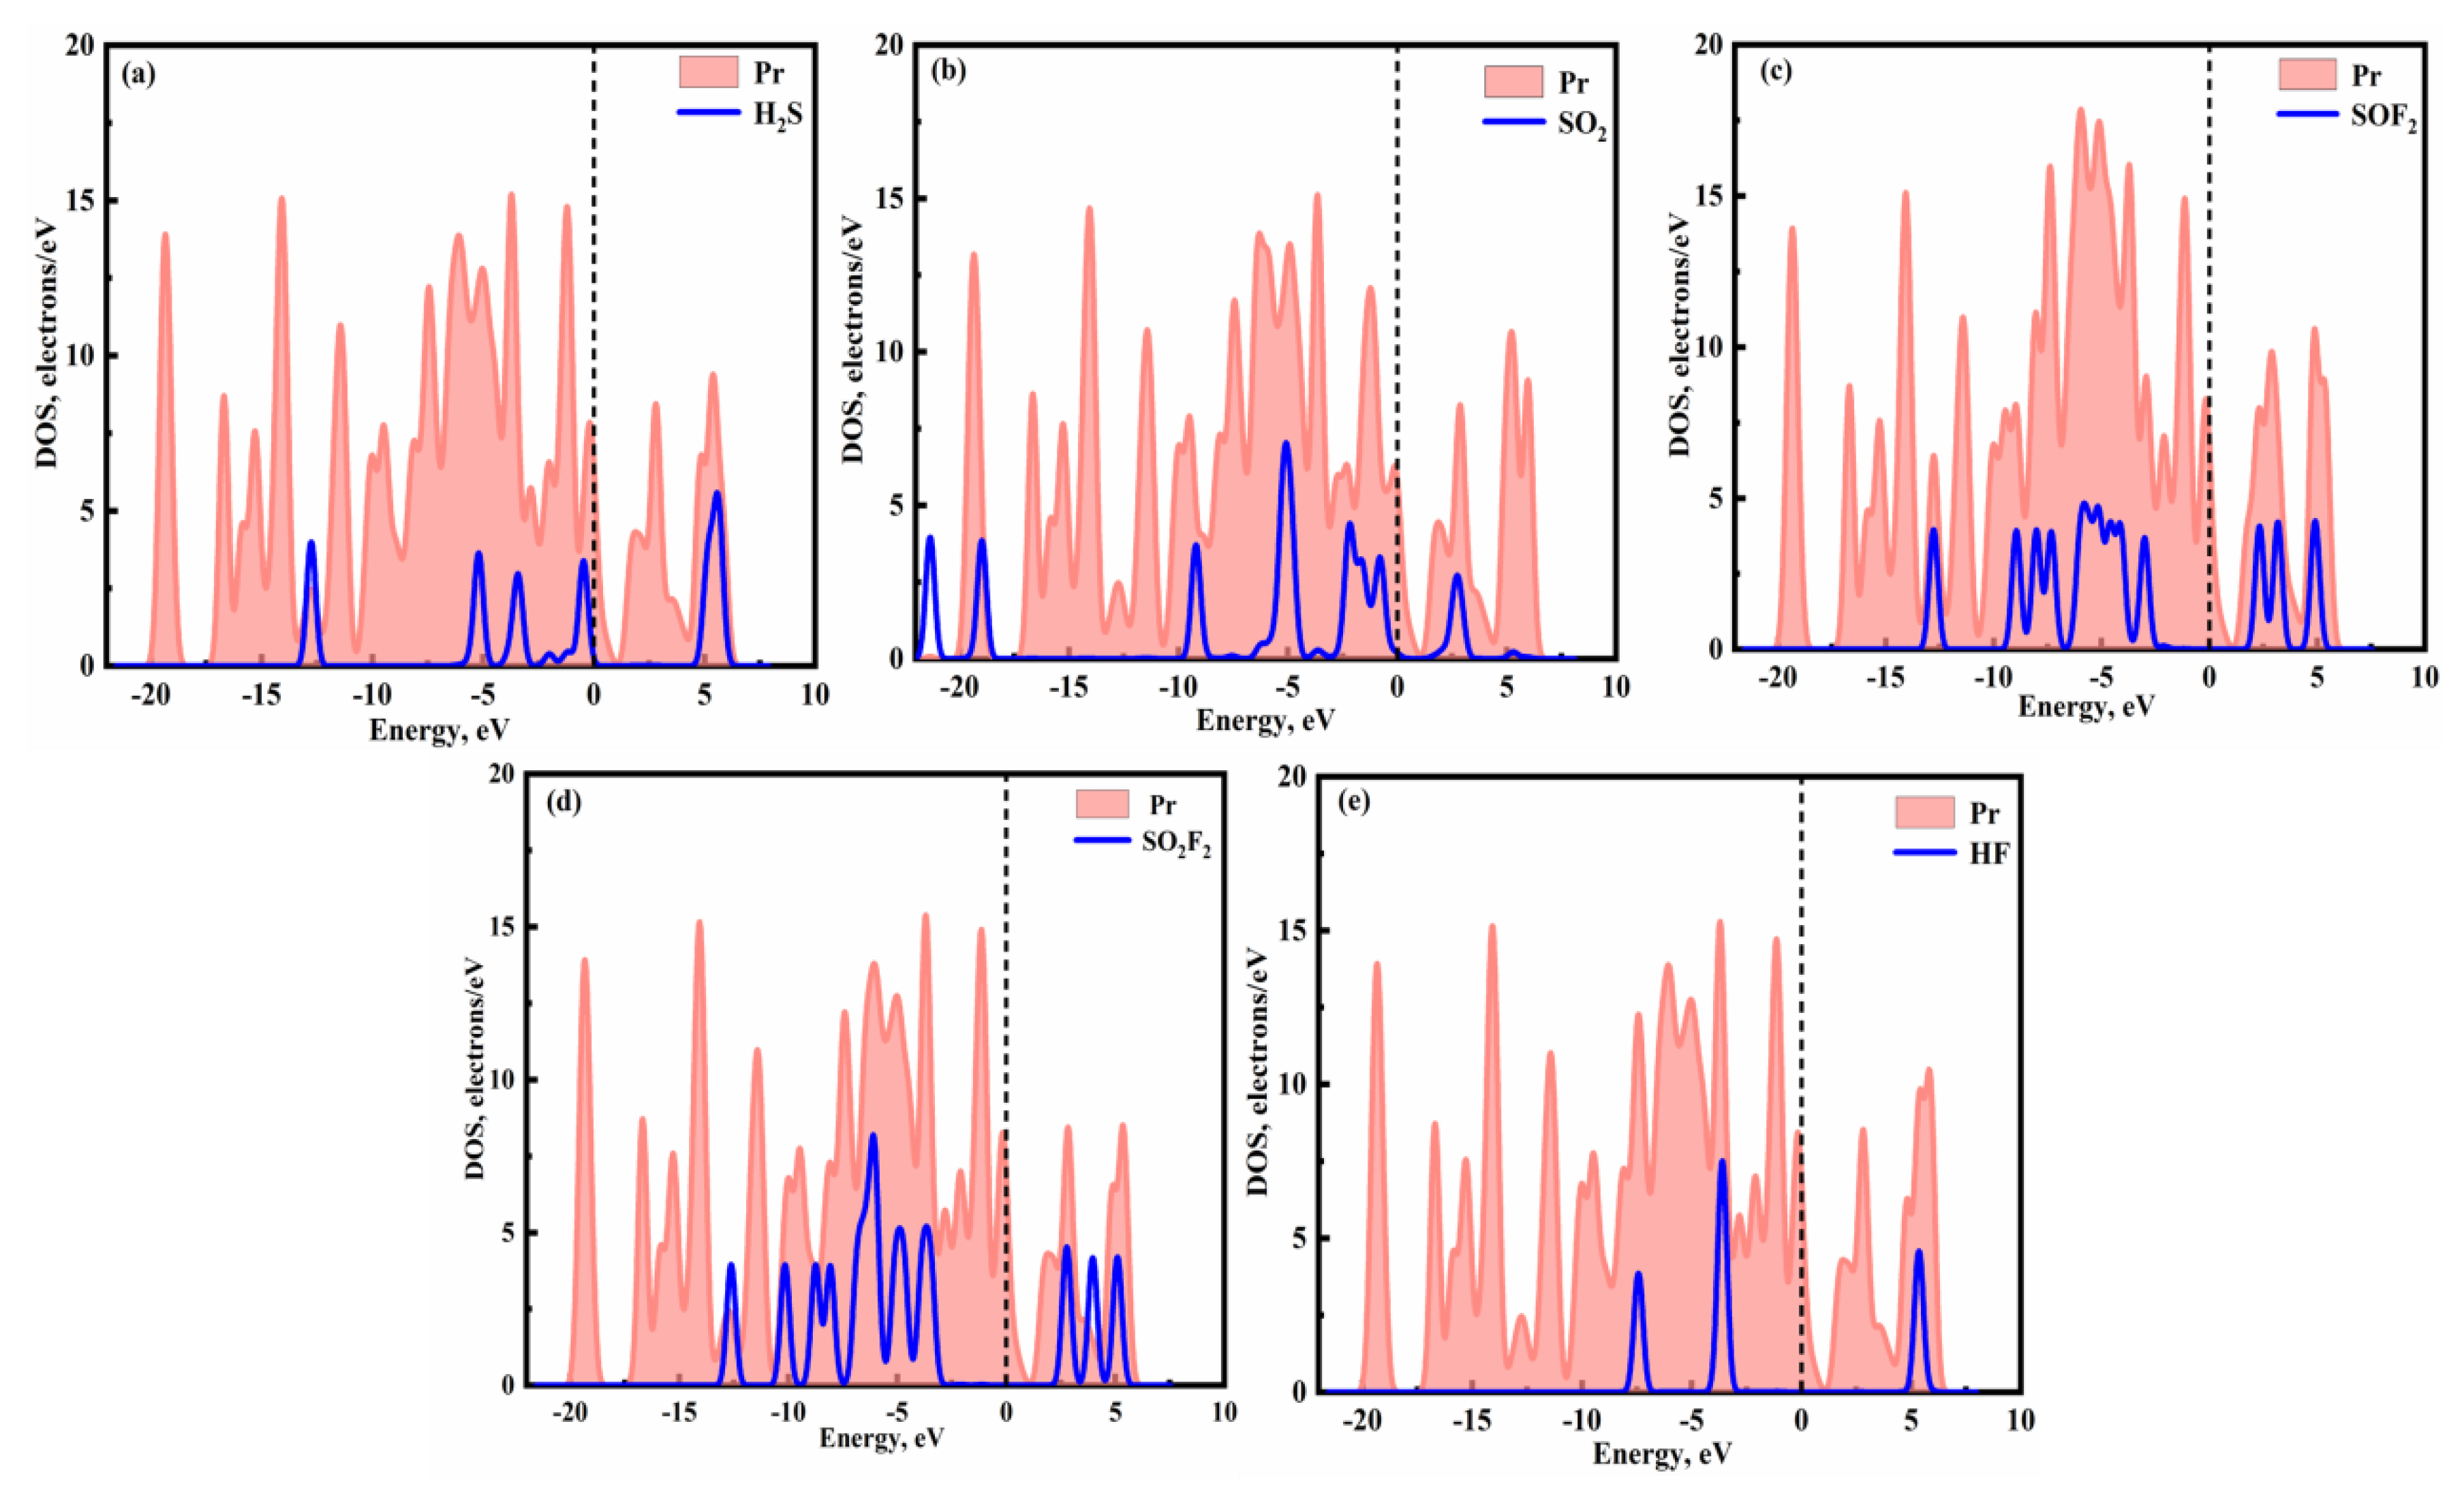
Figure 6.
The CDD and EDD were calculated for the FePr monolayer. (a1-c1) H2S, (a2-c2) SO2, (a3-c3) SOF2, (a4-c4) SO2F2 and (a5-c5) HF. The blue region indicates electron accumulation, while the yellow region indicates electron depletion, the isosurface for CDD being ± 0.01 e/Å3 and the isosurface for EDD being 0.2 e/Å3.
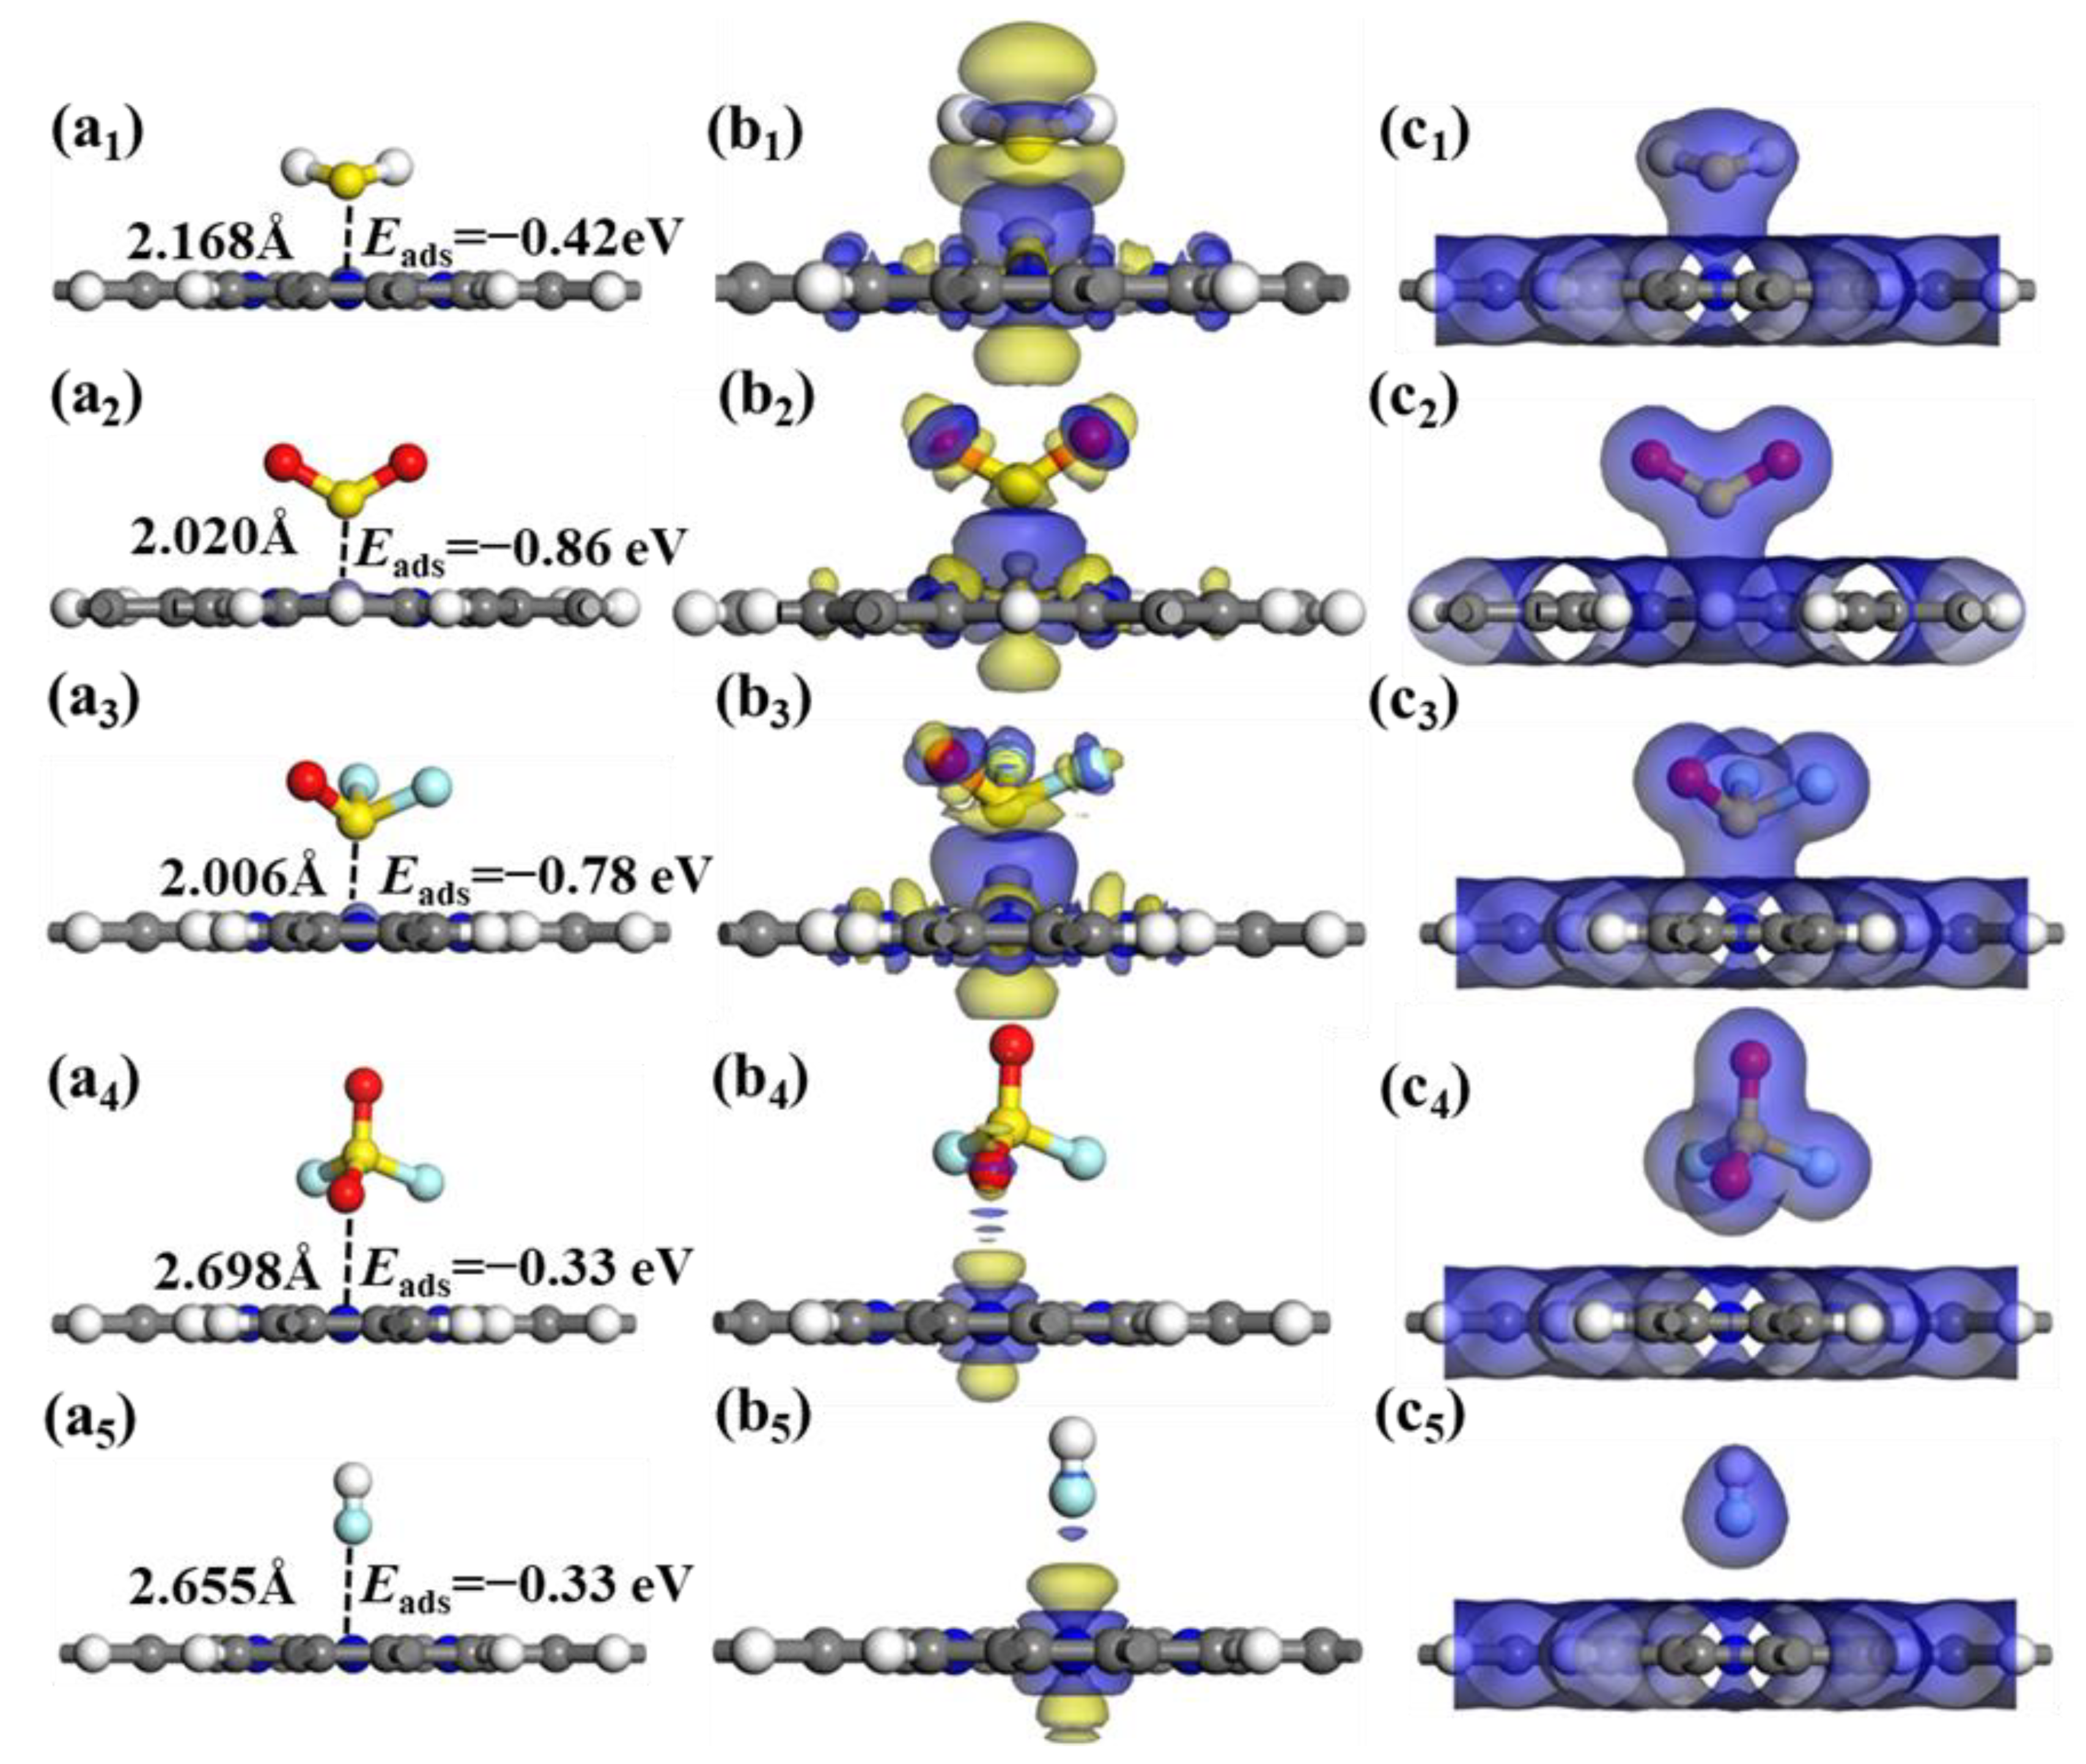
Figure 7.
The DOSs of (a) H2S, (b) SO2, (c) SOF2, (d) SO2F2, and (e) HF adsorbed FePr monolayer.

Figure 8.
The PDOSs of adsorbed FePr monolayer with (a) H2S, (b) SO2, (c) SOF2, (d)SO2F2, and (e)HF.
Figure 8.
The PDOSs of adsorbed FePr monolayer with (a) H2S, (b) SO2, (c) SOF2, (d)SO2F2, and (e)HF.
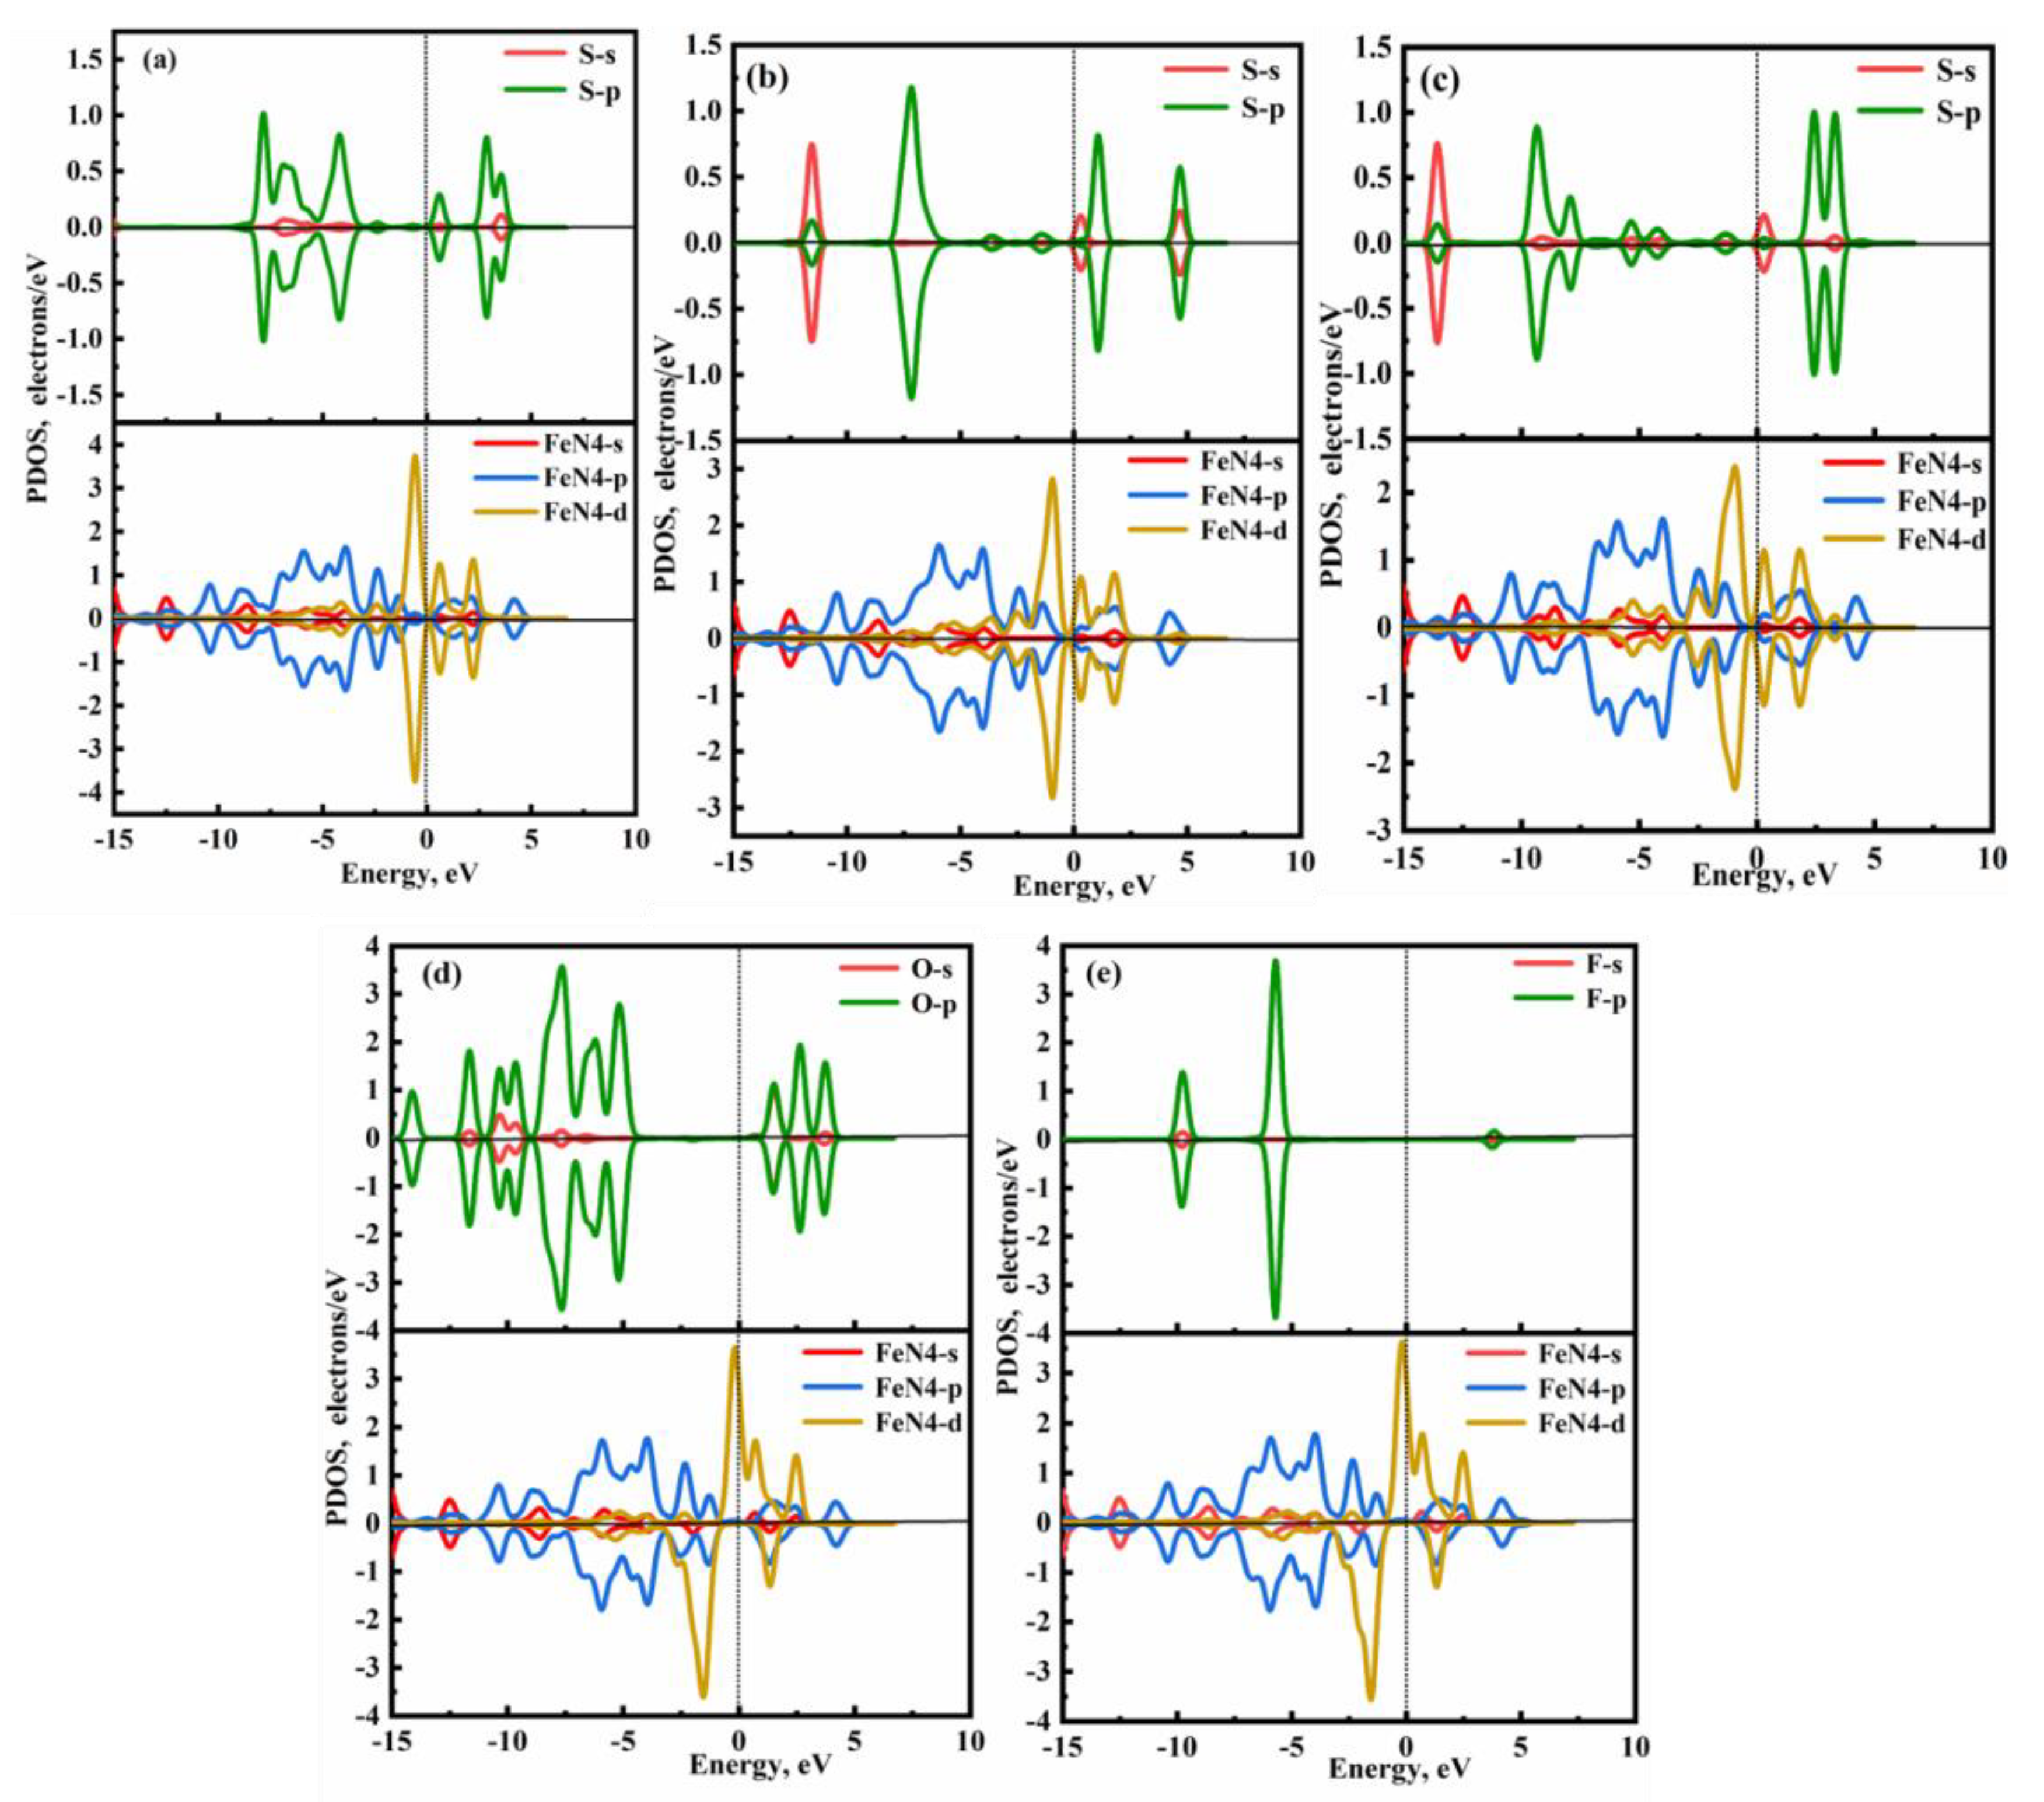
Figure 9.
Band structure of adsorption systems can be defined as A@B, where A represents the gas molecule being adsorbed and B represents the substrate on which it is adsorbed.
Figure 9.
Band structure of adsorption systems can be defined as A@B, where A represents the gas molecule being adsorbed and B represents the substrate on which it is adsorbed.

Figure 10.
The work function of FePr monolayer before and after gas adsorption.
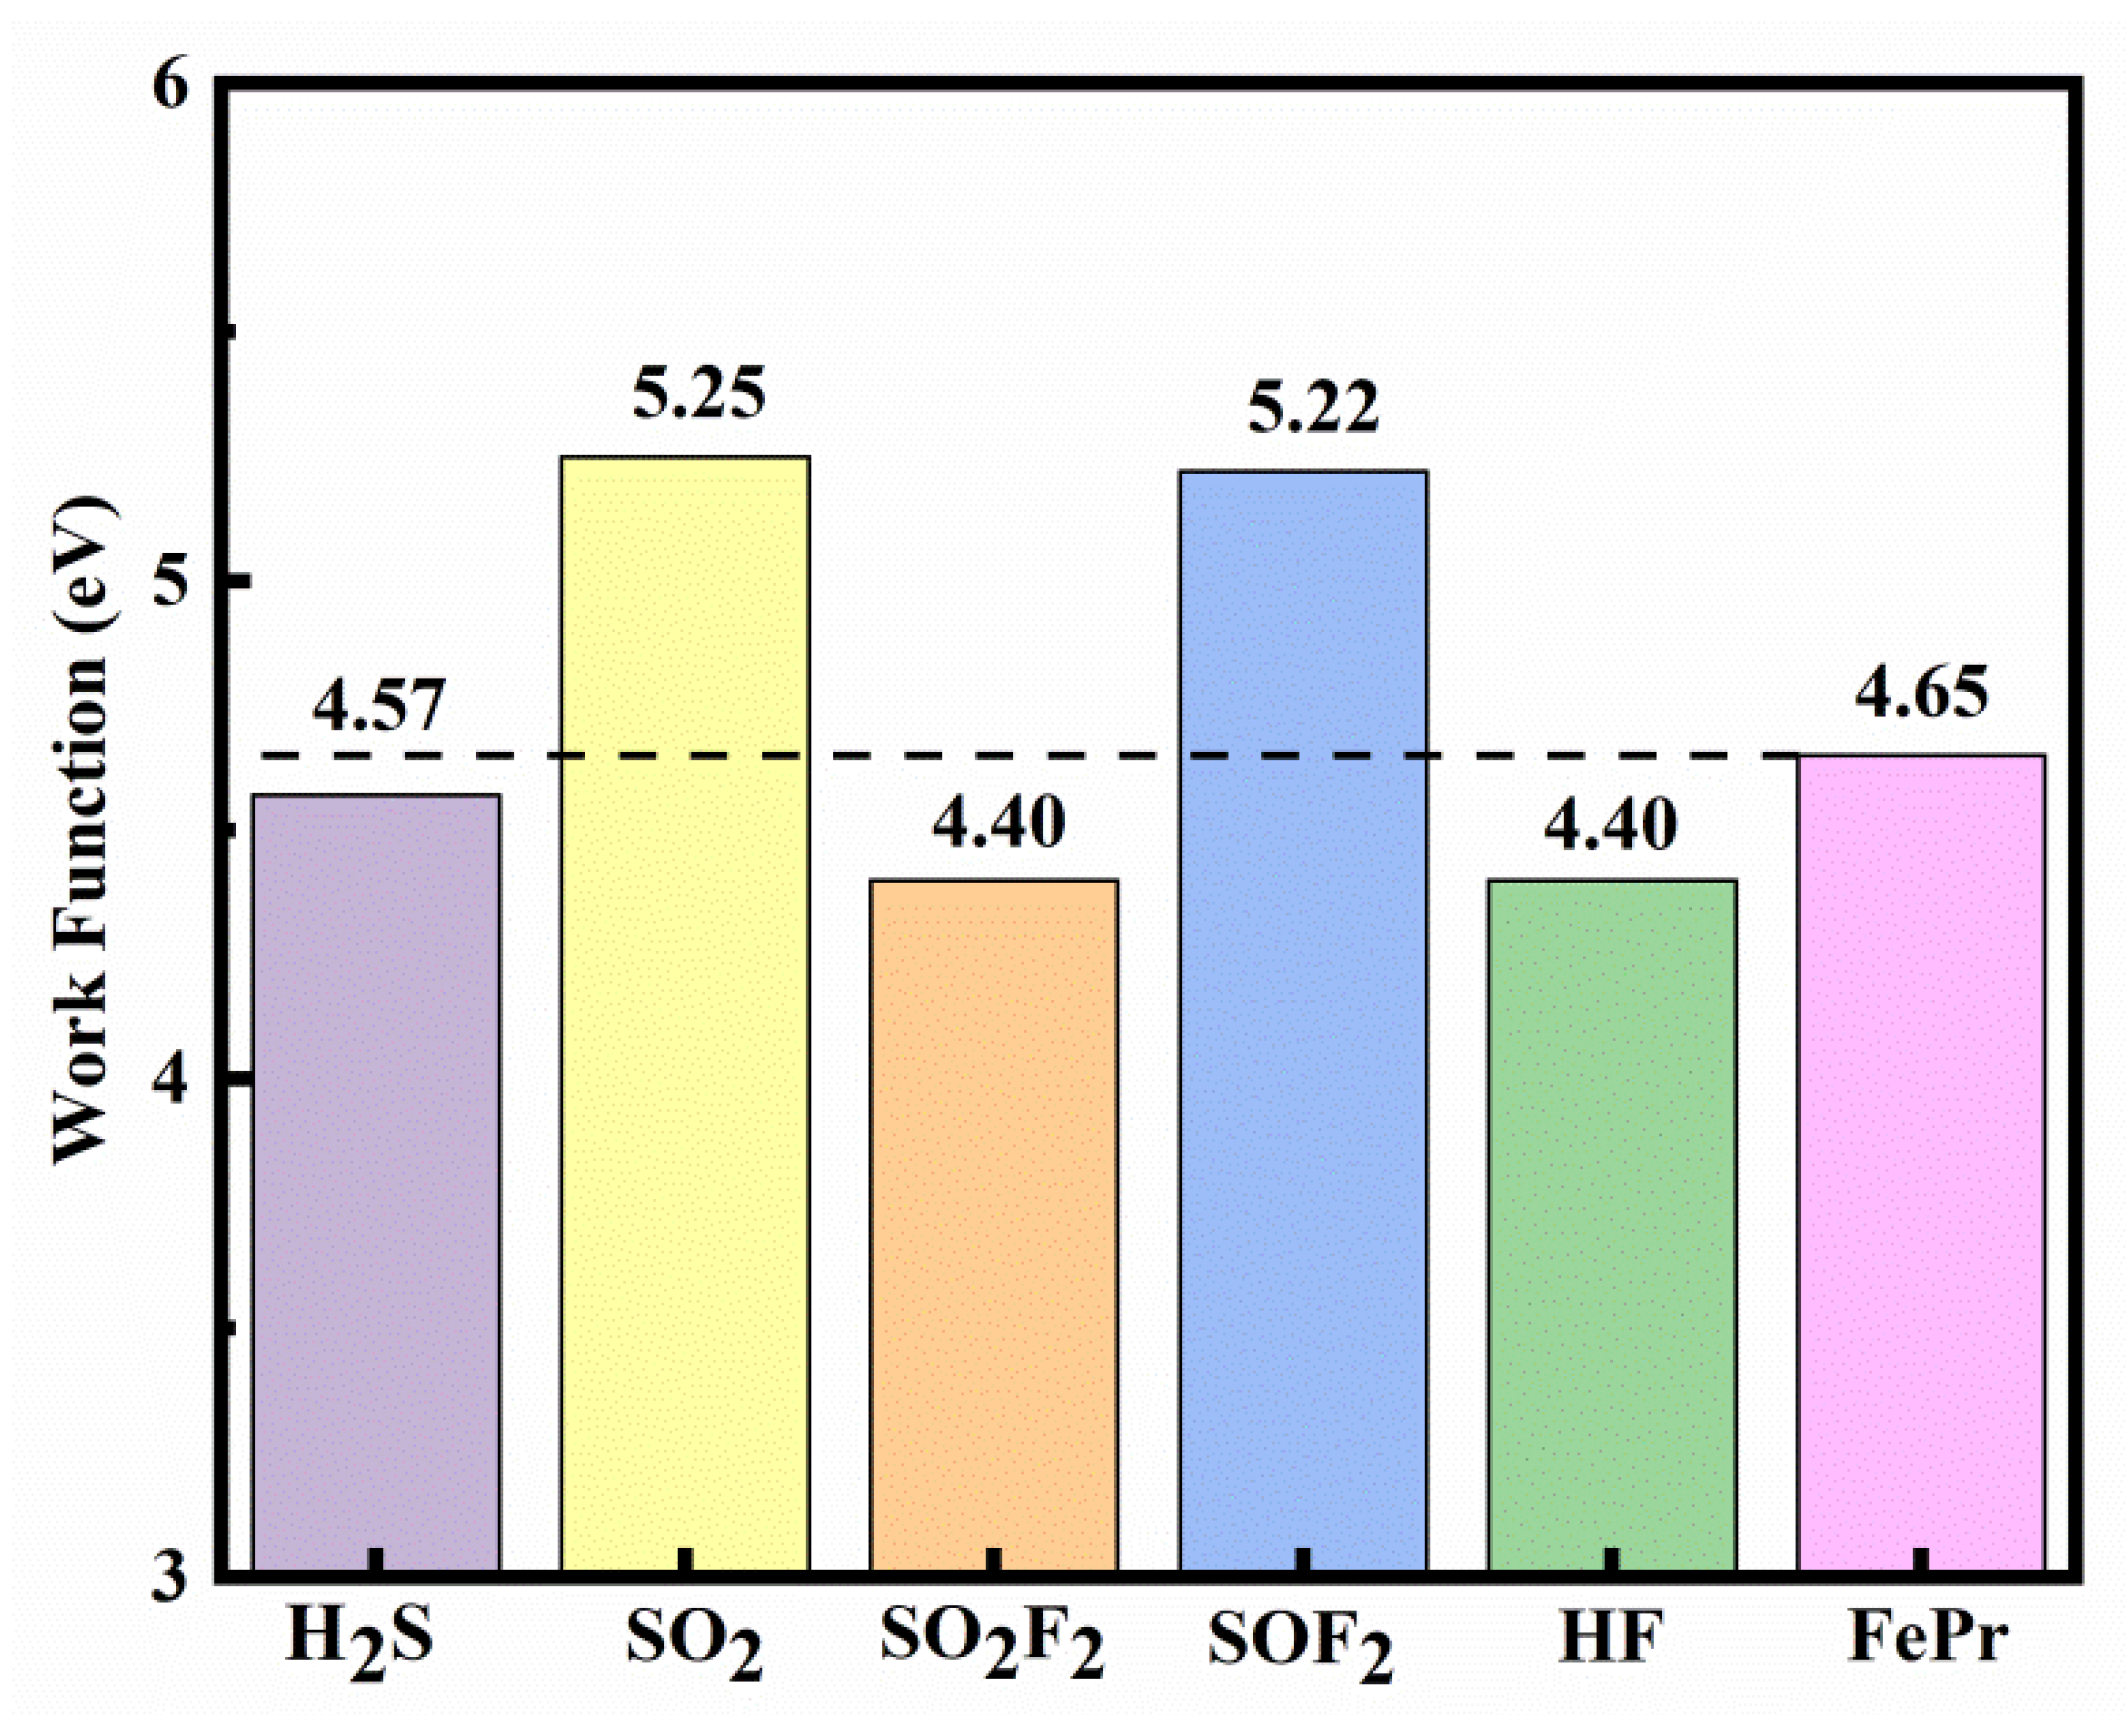
Figure 12.
The recovery time of the different gases on FePr monolayer at the range temperatures of 298 K to 498 K.
Figure 12.
The recovery time of the different gases on FePr monolayer at the range temperatures of 298 K to 498 K.
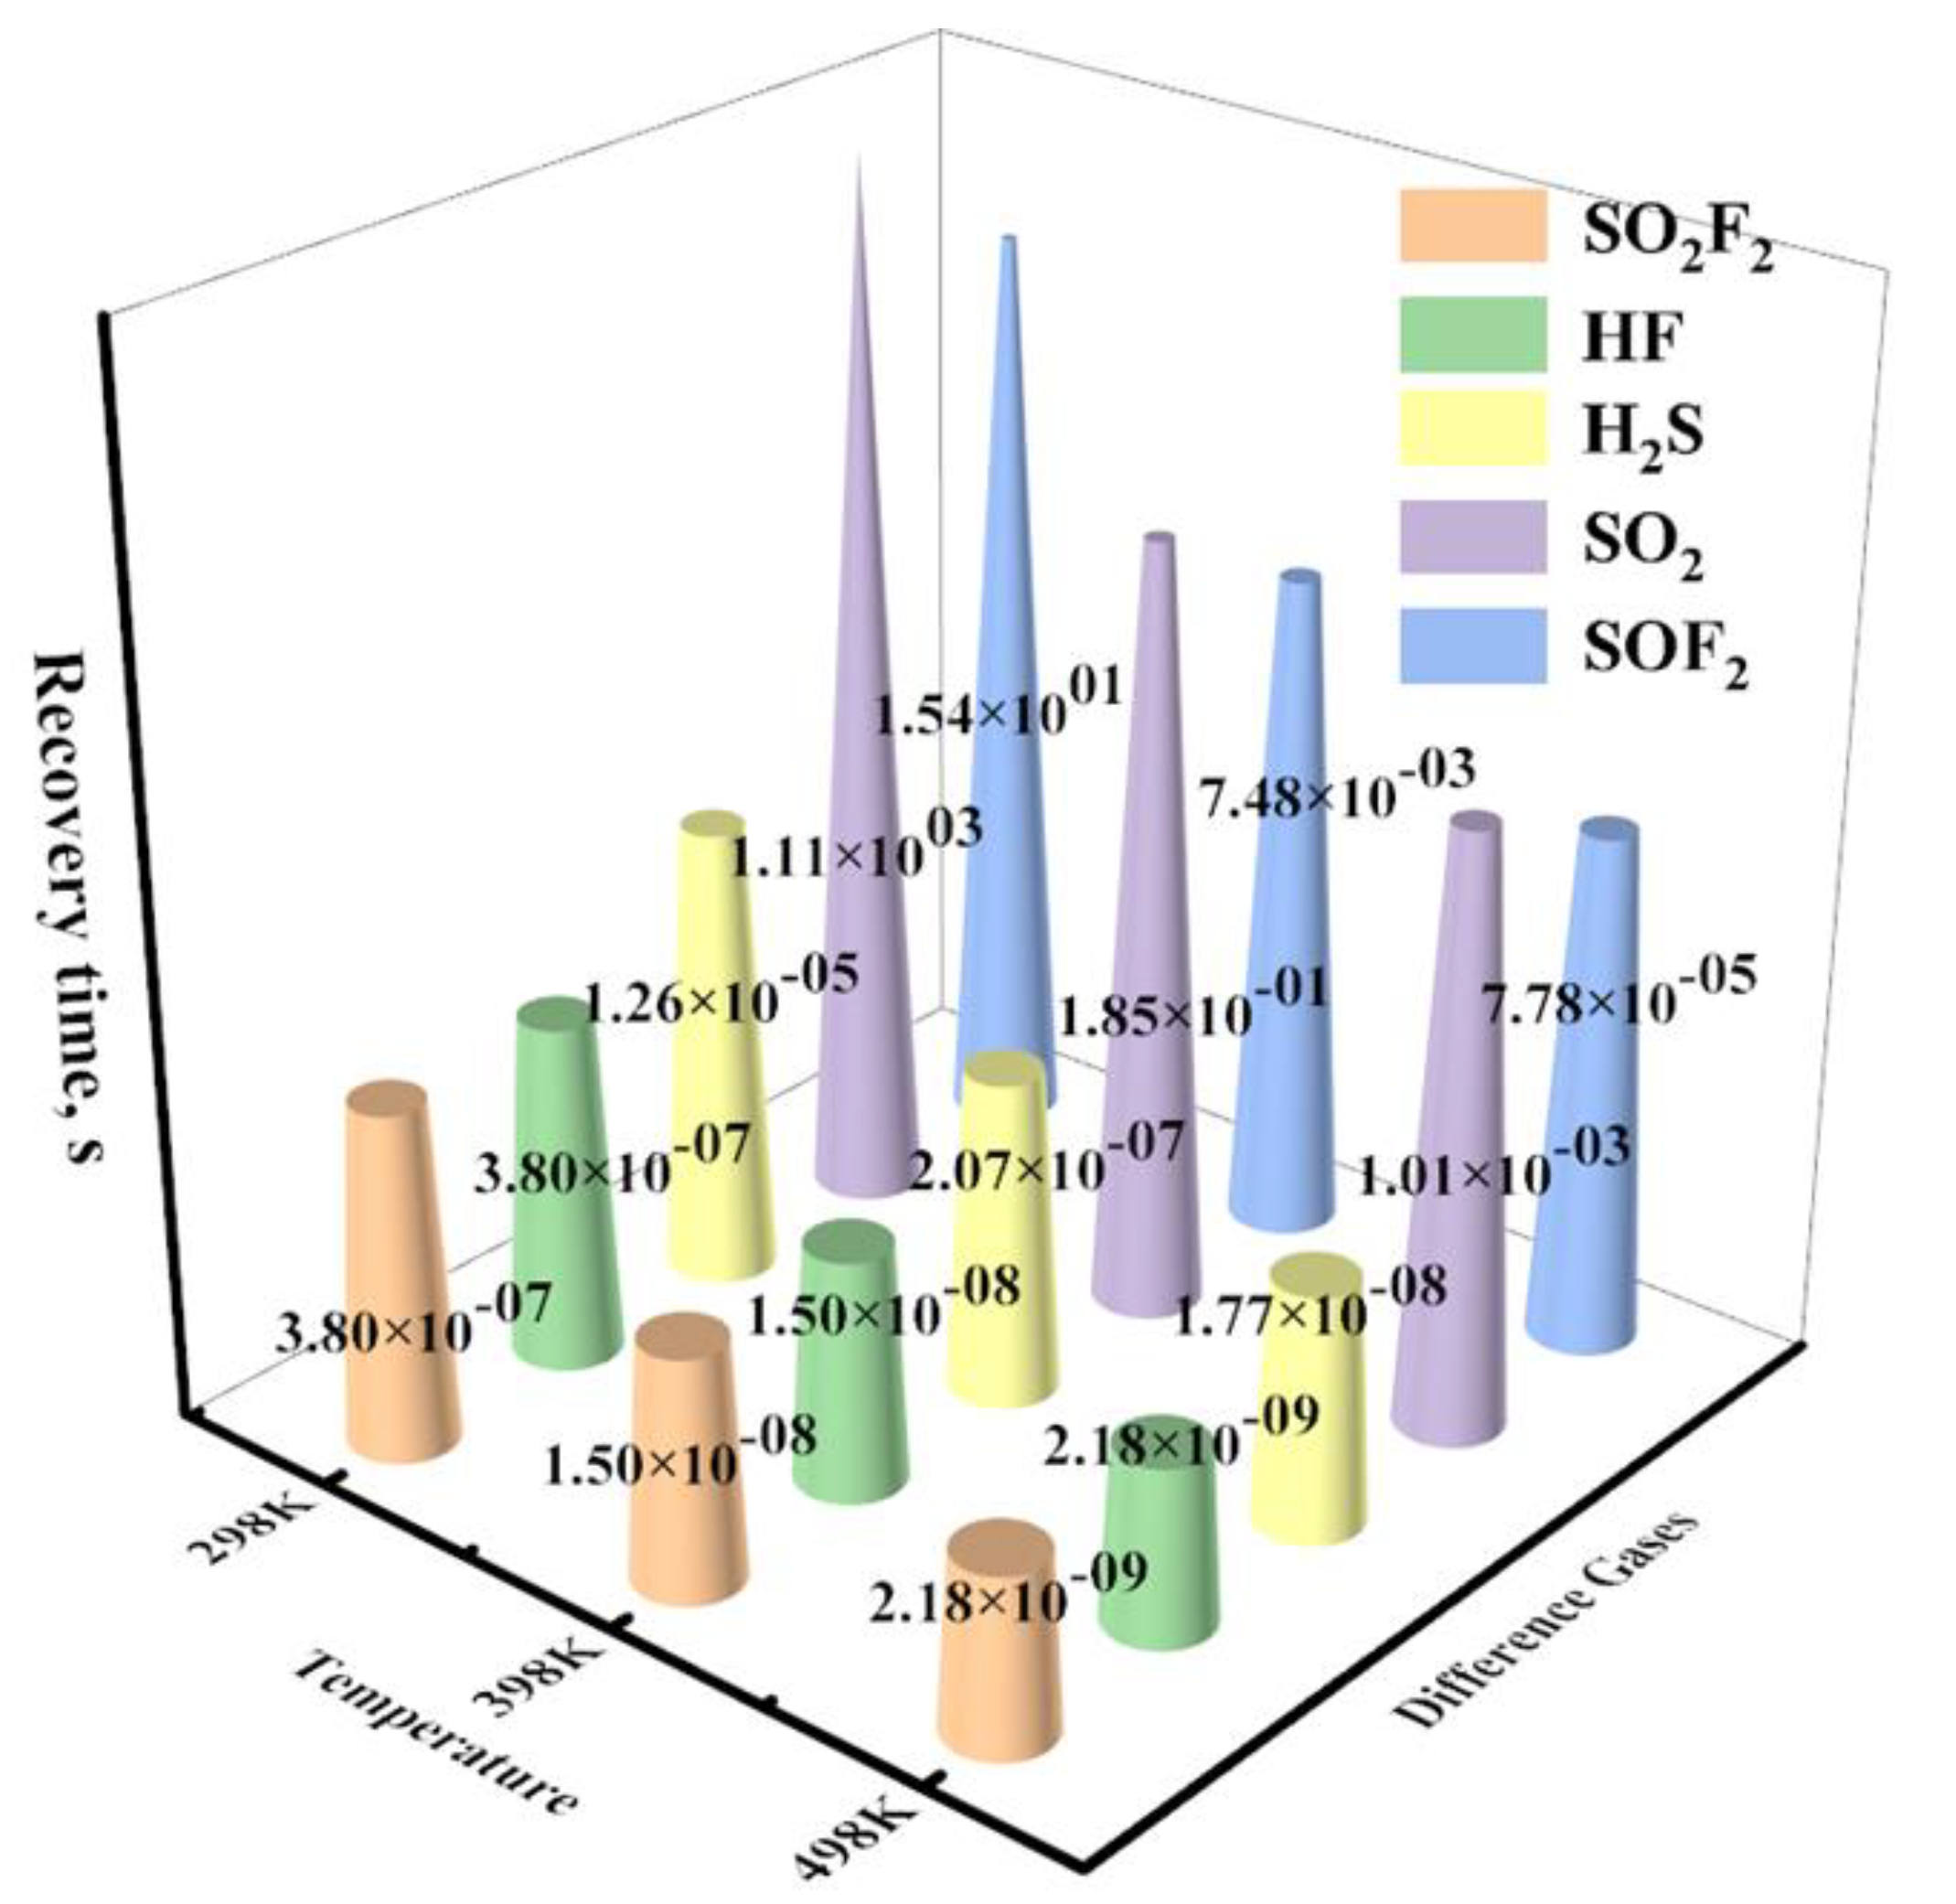

Table 1.
The adsorption energy (Eads), the electron transfer (QT), adsorption height (H), band gap before and after adsorption (Eg’ and Eg), and magnetic moment before and after adsorption (M’ and M) of the optimal adsorption systems.
Table 1.
The adsorption energy (Eads), the electron transfer (QT), adsorption height (H), band gap before and after adsorption (Eg’ and Eg), and magnetic moment before and after adsorption (M’ and M) of the optimal adsorption systems.
| Gases | Adsorption style |
Eads/eV | QT/e | H/Å | Eg’(Eg)/eV | M’(M)/μB | |
|---|---|---|---|---|---|---|---|
| H2S | S-end | −0.14 | 0.063 | 2.466 | 0.000 (0.000) | 0.000 (0.000) | |
| SO2 | S-end | −0.69 | −0.130 | 2.161 | 0.000 (0.000) | 0.000 (0.000) | |
| Pr | SOF2 | O-end | −0.18 | 0.006 | 2.861 | 0.000 (0.000) | 0.000 (0.000) |
| SO2F2 | O-end | −0.12 | −0.001 | 2.328 | 0.000 (0.000) | 0.000 (0.000) | |
| HF | F-end | −0.17 | 0.086 | 2.533 | 0.000 (0.000) | 0.000 (0.000) |
Table 2.
The adsorption energy (Eads), the electron transfer (QT), adsorption height (H), band gap before and after adsorption (Eg’ and Eg), and magnetic moment before and after adsorption (M’ and M) of the optimal adsorption systems.
Table 2.
The adsorption energy (Eads), the electron transfer (QT), adsorption height (H), band gap before and after adsorption (Eg’ and Eg), and magnetic moment before and after adsorption (M’ and M) of the optimal adsorption systems.
| Gases | Adsorption style | Eads/eV | QT/e | H/Å | Eg’(Eg)/eV | M’(M)/μB | |
|---|---|---|---|---|---|---|---|
| H2S | S-end | −0.42 | 0.350 | 2.168 | 1.013(0.000) | 0.000(1.869) | |
| SO2 | S-end | −0.86 | 0.066 | 2.020 | 0.919(0.000) | 0.000(1.869) | |
| FePr | SOF2 | S-end | −0.78 | 0.087 | 2.006 | 0.916(0.000) | 0.000(1.869) |
| SO2F2 | O-end | −0.33 | 0.027 | 2.698 | 0.000(0.000) | 1.879(1.869) | |
| HF | F-end | −0.33 | 0.021 | 2.655 | 0.000(0.000) | 1.888(1.869) |
Disclaimer/Publisher’s Note: The statements, opinions and data contained in all publications are solely those of the individual author(s) and contributor(s) and not of MDPI and/or the editor(s). MDPI and/or the editor(s) disclaim responsibility for any injury to people or property resulting from any ideas, methods, instructions or products referred to in the content. |
© 2023 by the authors. Licensee MDPI, Basel, Switzerland. This article is an open access article distributed under the terms and conditions of the Creative Commons Attribution (CC BY) license (http://creativecommons.org/licenses/by/4.0/).
Copyright: This open access article is published under a Creative Commons CC BY 4.0 license, which permit the free download, distribution, and reuse, provided that the author and preprint are cited in any reuse.


