Submitted:
12 June 2023
Posted:
13 June 2023
You are already at the latest version
Abstract
Metabolic and bariatric surgery (MBS) is the most effective long-term treatment for Class III obesity. Reduced dietary intake is considered a behavioral driver of post-surgical weight loss, but limited data have examined this association. Therefore, this study examined prospective, longitudinal relationships between dietary intake and weight loss over 24 months following Roux-en-Y Gastric Bypass and Sleeve Gastrectomy. Relationships between weight loss and dietary intake were examined using a validated 24-hour dietary recall method. Associations between total energy/macronutrient intake and weight loss outcomes were assessed at 12-, 18-, and 24-months following MBS, defining patients as “responders” and “suboptimal responders” according to the Reinhold criteria of 50% excess weight loss. Consistent with previous literature, 12-month responders and suboptimal responders showed significant associations between weight loss and dietary intake. Unlike previous work, this study revealed that many of these associations are no longer significant 24 months post-MBS, despite consistent weight loss trends. This study suggests a short-term signal between these dietary factors and weight loss outcomes 12 months post-MBS, consistent with previous observations. However, this signal does not persist beyond 12 months. These results are essential for interpreting and designing clinical studies measuring long-term post-surgical weight loss outcomes.
Keywords:
dietary intake
; bariatric surgery
; weight loss
; outcomes
; macronutrient consumption
1. Introduction
Metabolic and bariatric surgery (MBS) is the most effective treatment for severe obesity [1], with sleeve gastrectomy (SG) and Roux-en-Y gastric bypass (RYGB) being the most commonly performed procedures [2,3]. Although definitions of “success” vary, a standard convention to define an optimal outcome of surgery as one in which a patient loses at least 50% of their excess weight, with less-than-optimal outcomes occurring when excess weight loss (EWL) is less than 50% [4,5]. A relatively large literature has examined predictors of lower-than-expected weight loss following surgery. Predictors have included a lack of sustained nutritional management and physical activity coupled with problematic post-surgical eating behaviors [6,7]. The mechanisms underlying MBS weight loss outcomes vary; however, dietary intake after surgery has been shown to play a crucial role in weight loss and weight loss maintenance [8,9]. Some research has shown reduced energy intake to be a main behavioral driver of initial weight loss [10,11]. Patients generally receive nutritional education before and after surgery and are provided with specific guidelines to maintain sufficient nutrient intake [9]. Such post-operative guidelines include a recommended energy intake from carbohydrates at 35-48% with at least 60-80 g of protein per day [12].
Although MBS is the most effective treatment for Class III obesity, several studies, including the multi-site Longitudinal Assessment of Bariatric Surgery (LABS), have found that a substantial portion of patients (~25%) do not achieve their expected weight loss outcomes and that most patients regain some of their lost weight [13,14]. Although longer-term weight loss outcome studies have been conducted, very few investigated dietary intake and weight loss outcomes past two years post-MBS.
A single-site 2020 study in Seoul, Korea, examined energy and nutrient intake changes in patients up to 12 months post-MBS to help establish nutritional guidelines for weight loss goals [15]. The study classified patients into two groups depending on whether they lost 50% of their excess weight 12 months after MBS. The results revealed that patients who lost over half of their excess weight had significantly lower daily total caloric, carbohydrate, and fat intake than the sub-optimal group and significantly higher protein intake [15]. This study sought to reproduce these findings at 12 months and extend them at the 18- and 24-month time-points post-surgery with a cohort of 145 MBS participants from Cleveland, OH, and Fargo, ND, to further aid in interpreting and designing long-term clinical studies on weight loss and dietary intake.
2. Materials and Methods
2.1. Participants and Recruitment
Data were collected as part of a larger study examining multiple behavioral and biological factors and their relationship to post-surgical weight outcomes. Participant recruitment took place through the Sanford Center for Biobehavioral Health (Fargo, ND) and the Cleveland Clinic (Cleveland, OH) and was approved by the Institutional Review Boards at both sites. This NIH-funded study (1RO1 DK112585-01 & 3R01DK112585-01) is registered on ClinicalTrials.gov (Trial ID NCT03065426), and the protocol for the study has been described previously [16]. Participants in the pre-operative evaluation process for RYGB and SG were offered the opportunity to volunteer for this study. Enrollment criteria were carefully selected to balance generalizability with the need to limit confounding variables. A total of 145 participants undergoing bariatric surgery were initially enrolled in this study; however, 124 proceeded to surgery and were in the analyzable sample. Participants were assessed at baseline (pre-surgery) and specified time points (1, 6, 12, 18, and 24 months) post-surgery.
2.2. Study Assessments and Timeline
Participants provided informed consent during a screening visit at the research center. They completed a medical history assessment for study eligibility according to the inclusion and exclusion criteria list [16].
2.3. Biometrics and Dietary Recall
Height (in) and weight (lb) were recorded at each study visit with participants wearing lightweight clothing without shoes, and measurements were then converted to metric units (m and kg, respectively) and body mass index (BMI) was calculated. Participants were classified as “responders” or “suboptimal responders” based on the percentage of their excess weight loss (%EWL) at 12, 18, and 24 months. Per widely utilized clinical standards and for direct comparison with previous findings, those exhibiting >50% excess weight loss at a given time point were considered “responders” and those with an excess loss of <50% as “suboptimal responders” [5].
Nutritional intake data were collected using the Automated Self-administered 24-hour (ASA24) Dietary Assessment Tool, a 24-hour dietary recall developed by the National Cancer Institute [17]. The ASA24 is a validated, widely used method for assessing dietary intake, including foods, fluids, vitamins, and supplements [18]. Participants completed three days of the ASA24 dietary recall at each time point (with the goal of including at least one weekday and one weekend day, though this goal was met ~68% of the time throughout the study) to estimate total mean energy (kilocalories) and macronutrient (grams) consumption.
2.4. Statistical Analysis
Participants were classified as responders and suboptimal responders based on %EWL data at 12 months (12-month outcome group), 18 months (18-month outcome group), and 24 months (24-month outcome group) post-surgery. Because of individual time-based differences, participants could be classified as responders at one time point but as suboptimal responder at another, resulting in different sub-sample sizes. At each time point, responder and suboptimal responder groups were compared for the differences in weight by surgery type and nutritional intake using Wilcoxon’s rank-sum test. Associations between %EWL and diet (i.e., daily total kilocalories and grams of protein, carbohydrates, and fats) at 12-, 18-, and 24-months post-surgery were assessed with non-parametric Spearman rank correlations. Univariate linear regression analyses were implemented for longitudinal factors affecting excess weight loss outcomes using R’s “lm” function [19]. All statistical analyses were performed using the automated BioLockJ pipeline (https://github.com/BioLockJ-Dev-Team/BioLockJ) utilizing a Dockerized version of R (version 4.0.2) to ensure study reproducibility.
3. Results
3.1. Patient characteristics
A total of 145 participants were recruited, though 19 of the initial patients did not proceed to surgery, and two RYGB patients were lost to follow-up, resulting in 124 participants (89 RYGB, 37 SG) for analysis (Figure S1). The number of patients recruited from each study location was roughly equal (48.4% Fargo, 51.6% Cleveland), with no significant variation in baseline BMI among patients at either location (p = 0.132). Of the 124 participants who underwent surgery and attended at least one follow-up visit, 93 (75%) had complete data for this analysis at the 24-month time point. The average age of participants was 42.8 years, and 80.6% were female (Table S1). These demographics are consistent with national bariatric surgery statistics [20]. There was no significant differentiation in baseline BMI between RYGB (44.28 ± 5.66 kg/m2) and SG (47.46 ± 8.82 kg/m2) patients prior to surgery (p = 0.348).
3.2. Excess Weight Loss and Responder Status
The mean pre-operative BMI of the 124 patients who proceeded to surgery was 45.93 ± 6.79 kg/m2 with an average of 60.1 ± 21.17 kg of excess weight based upon a BMI of 25 kg/m2 (Table 1). The average %EWL at one-, six-, 12-, 18-, and 24-months post-operation were 27.3%, 58.3%, 66.5%, 65.5% and 62.6%, respectively (Table 1). The percentage of excess weight carried by RYGB and SG patients did not differ before surgery (p = 0.348) or within the first post-surgical month (p = 0.485). By six months, RYGB patients exhibited significantly more excess weight loss than SG patients, and this difference remained consistent throughout the duration of the study (Figure 1, Table 1).
At 12 months, of the remaining 110 participants, 85 (77.3%) were classified as “responders,” with more RYGB recipients classified as responders (86.5%) than SG recipients (58.3%). By 18 months, 77.2% of the participants were in the responder category, compared with 68.8% by month 24. Again, differences by procedure persisted, with a higher percentage of RYGB participants being in the responder category compared with SG at 18 (88.1% of RYGB and 55.9% of SG) and 24 (82.8% of RYGB and 37.9% of SG) months. Excess weight loss from baseline was highly correlated (p < 0.001) across the 12-, 18-, and 24-month timepoints (Figure S2). Irrespective of surgery type, individual patient weight loss trends after 12 months post-surgery remained highly stable, with most patients maintaining the same responder and suboptimal responder status (Figure S2 red and orange symbols). However, a few patients moved between responder and suboptimal responder status at the 18- and 24-month time points (Figure S2b, c, blue and green symbols).
3.3. Changes in Total Energy and Macronutrient Intake
Energy and macronutrient intake significantly decreased after surgery (Figure 2). Differences in early post-surgical protein (g) and total fat (g) intake were observed between RYGB and SG patients. SG patients showed higher total protein intake (g) at one and six months and higher total fat intake (g) at one month relative to RYGB patients (Table S2). No differences were found in energy (kcal) or total carbohydrate (g) intake between surgical types at any assessment point, and no differences in dietary intake were observed between surgery types after six months (Table S2).
3.4. Direct Associations between Nutrient Intake and %EWL at 12-, 18-, and 24-months
Direct relationships between dietary variables and excess weight loss at different time points revealed that daily energy intake (kcal) significantly negatively correlated with weight loss (%EWL) at 12 months (p = 0.030, r = –0.21), but this association was not significant at the 18- (p = 0.821) and 24-month (p = 0.504) time periods (Figure 3a, e, i). Likewise, total fat intake showed a negative association with %EWL at 12 months post-surgery (p = 0.013, r = –0.29; Figure 3d). However, this association was also no longer significant after 12 months (Figure 3h, l). Protein intake showed a significant negative correlation to %EWL at 12 months (p < 0.001, r = –0.37; Figure 3c) and at 18-months (p = 0.026, r = –0.22; Figure 3g), but at 24-months, this association was no longer significant (p = 0.388; Figure 3k). Patient weight loss showed no correlation with carbohydrate intake at 12, 18, or 24 months (Figure 3b, f, j). These findings are observed with and without outliers, indicating a few extreme data points did not drive these associations.
3.5. Changes in Total Energy and Macronutrient Intake over Time by Weight Loss Response
Given that associations between diet and %EWL seen at 12 months did not extend to later time points (Figure 3), the present study sought to expand upon a previous study on patient weight loss outcomes (determined with a 50% EWL threshold) and diet with a 12-month study termination [15]. The present analysis considered how diet and weight loss associations would be affected by study duration length (12, 18, or 24 months) with patients assigned responder or suboptimal responder status according to the same 50 %EWL threshold at each designated study endpoint.
3.5.1. Dietary Intake and Weight Loss Outcomes at 12 months
Pre-surgery nutritional intake did not differ among patients classified as responders (n = 85) and suboptimal responders (n = 25) at the 12-month study visit (Table 2). The 12-month responders consumed, on average, 669 kcal one month after surgery, while suboptimal responder caloric intake was significantly higher by ~260 kcal (p < 0.001). These suboptimal responders continued to consume significantly more calories than responders at six and 12 months (Table 2). Carbohydrate intake differed between the outcome groups at one- and six-months post-surgery, but this difference did not persist at 12 months (Table 2). At 12 months, the protein intake of suboptimal responders was significantly higher than responder intake (p = 0.002). However, no differences were observed between groups in prior months (Table 2). 12-month suboptimal responders were found to have significantly higher total fat intake than responders after surgery (Table 2). The carbohydrate energy ratio was found to be significantly higher among the responder group at 12 months (p = 0.025), but no other differences in macronutrient energy ratios were found among these outcome groups (Figure S3).
3.5.2. Dietary Intake and Weight Loss Outcomes at 18 months
When classifying patients at an 18-month termination point, 76 were deemed responders and 22 as suboptimal responders (Table S3). 18-month responders and suboptimal responders again showed no differences in dietary intake prior to surgery. However, after surgery protein intake was consistently higher in the suboptimal responder group (one-month p = 0.029; six-months p = 0.014; 12-months p = 0.002; 18-months p = 0.003). Energy intake was significantly increased among suboptimal responders shortly after surgery, at one (p = 0.003) and six months (p = 0.021) but did not significantly vary from responder intake after 12 months. Suboptimal responders consumed significantly more total fat than the responder group six months post-surgery (p = 0.022). No differences were observed in carbohydrate intake at any time between these outcome groups. These results remain consistent with the 12-month observations in this study.
3.5.3. Dietary Intake and Weight Loss Outcomes at 24 months
At the 24-months post-surgery, there was a ~10% decrease in the number of responders (Figure S2), with 62 responders and 28 suboptimal responders yielding a ~69% response rate. Although this difference in response rate was modest, it had significant effects on the analyses in that the associations between %EWL and nutrient intake no longer reflected those found with the 12-month outcome groups. The 24-month outcome groups again showed no significant differences in protein, carbohydrate, or caloric intake pre-operatively; however, most dietary intake variability between the responders and suboptimal responders was no longer significant, and no differences were observed in carbohydrate intake between these outcome groups at any time (Table 3). Total fat intake was found to be significantly higher among pre-surgery suboptimal responders (p = 0.048), although no differences in fat intake were observed between groups post-surgery. 24-month responders consumed significantly fewer calories one-month post-surgery (p = 0.011) but were not significantly different from their suboptimal responder counterparts at later times. Only protein intake was found to differ between outcome groups at later time points (12 and 18 months), but by the 24-month study’s end, this difference was no longer observed. These results are inconsistent the short-term (12- and 18-month) diet and weight loss associations observed in the present study.
3.6. Differences in Sample Size and Power do not explain Differences in outcome between 12 and 24 months
To determine if sample size was the main contributor to the differences in weight loss and diet associations at 12 and 24 months, a subset of the final 93 patients present in the study at 24 months were classified according to their 12-month outcome status, effectively reducing the 12-month analysis sample size. With the limited sample size (n = 90; three patients who provided 24-month data were unable to report for their 12-month follow-up), the associations between weight loss and diet were comparable to those found in the complete data set (Table S4). Responders (n = 69) consumed significantly fewer calories than suboptimal responders (n = 21) at one (p < 0.001) and six months (p = 0.01), though a significant difference was no longer observed at 12 months (p = 0. 064). All comparisons between groups for carbohydrates, protein, and total fat remained consistent with the results found in the full 12-month dataset, indicating that sample size is not driving the association changes.
4. Discussion
To further elucidate the role of dietary intake in post-bariatric surgery weight loss outcomes, the present study sought to examine associations between short- and long-term total energy and macronutrient intake with patient weight loss outcomes. A previous study conducted in South Korea by Lim et al. (2020) found no significant differences in pre-surgical diet between outcome groups but did observe significantly lower fat, carbohydrate, and caloric intake among their responder group (n = 127) at six and 12 months suggesting an association between a patient’s post-surgical dietary intake and their weight loss outcome after one year. The present study expanded upon the previous analysis using the same weight loss outcome threshold, dietary measures, and statistical methods on a cohort of 124 BS patients from the U.S. with data collection extending to 24 months post-surgery. The results were largely consistent among the two study cohorts with weight loss outcomes measured at 12 months. No differences in dietary intake were observed prior to surgery between 12-month outcome groups suggesting there was no underlying variability in patient diets before surgical intervention. The responder group showed significantly different intake volumes of protein, total fat, and total calories than their suboptimal responding counterparts at 12 months post-surgery.
However, significant diet and weight loss associations were no longer observed with an extended study duration to 24 months (Table 3). Similarly, total energy, protein, and fat intake significantly correlate with excess weight loss at the 12-month but not 24-month time point. These results strongly suggest that dietary variables may be associated with patient outcomes in the first 12 months post-surgery, but that these associations are no longer significant at 24 months.
The differences in dietary intake among outcome groups at 12 months were no longer observed at 24 months but may be explained by a relatively small number of patients moved from responder to suboptimal responder status (Figure S2). Because defining responders and suboptimal responders is a somewhat arbitrary metric, direct relationships between %EWL and macronutrients were examined (Figure 3); and, again, the demonstrated associations at the 12-month time point were no longer observed at 24 months, highlighting that the early associations with dietary factors become less robust in the second year following surgery and that other factors may explain different weight outcomes.
The loss of associations between patient outcomes and diet could not be attributed to the reduced sample size at 24 months. Analysis of 12-month outcomes and dietary factors using the same reduced sample size still yielded the same associations observed with the full 12-month dataset indicating that the loss of these associations is not simply due to a lack of statistical power in the smaller 24-month dataset (Table S4). While statistically significant and reproducible with the Lim et al. study, the amount of weight loss variability that dietary factors explained in this study is small (R2 < 0.15; Table 2).
Numerous studies have addressed various factors associated with weight loss after bariatric surgery; however, most have been limited by small sample sizes and short follow-up durations, typically 12 months [21]. Consistent with previous literature, this study found that patients lost significantly more weight with RYGB than with SG (Figure 1). However, this study suggests that dietary variables do not play a major role in weight loss outcomes between the two surgery types. Despite higher protein and fat intake among SG patients in early post-surgical months, RYGB and SG patients showed little difference in dietary intake throughout the study (Table S2).
Additionally, patient weight loss was found to stabilize after the first 12 months of surgery with minimal difference in 12- to 24-month weight change regardless of surgery type or outcome consistency (Figure S2). Dietary intake, however, showed much more variability (Figure S4). Though energy intake may be important following surgery in the short term, several putative mechanisms of action have been offered that explain alternate outcomes beyond energy balance [22]. Identified factors include eating behaviors (e.g., timing, eating beyond fullness), loss of control eating, physical activity, mood, executive function, and biological factors such as the intestinal microbiome [1,21,23,24,25].
After MBS, patients are at risk of protein malnutrition and, as a result, are informed by their healthcare provider that they need approximately 1.1-1.5 g of protein per kg of ideal body weight per day with 10-35% of their total energy intake being derived from a protein source [8]. In terms of net intake (g) and energy ratios (%), patients from this study cohort were largely non-adherent with these guidelines and recommendations regardless of weight loss outcomes (Figure S5). Analysis of macronutrient energy ratios over time reveals few changes in the quality of patient diets, except for significant reductions in carbohydrate- and fat-derived energy in the post-surgery diet of suboptimal responders classified at 24 months (Figure S6). These findings indicate that patients are not eating higher-quality diets but simply consuming fewer calories, suggesting that other factors (e.g., the gut microbiome) are at play in predicting patient weight loss outcomes [26].
Classifying the outcome of bariatric surgery by %EWL and further denoting the success of surgery according to the 50% mark as defined in 1982 may not be the optimal strategy for defining longer-term weight outcomes following surgery [4]. The goal of bariatric surgery is to improve health-related quality of life and reduce health risks, which cannot be captured by a %EWL threshold, particularly in cases of metabolic surgeries like RYGB [5]. Further, the 50% EWL Reinhold threshold was characterized before the development and implementation of the widely performed sleeve gastrectomy and does not account for factors associated with this procedure [27]. Despite these limitations, the present study utilized the Reinhold criteria of 50% excess weight loss to directly compare and advance previous research.
Despite improvements in dietary tracking, patient-reported dietary recall methods can be unreliable, and misreported data could have influenced these results [28,29]. For example, the ASA24 dietary recall method utilized in this study has been found to underestimate protein intake when measured by 3-day intake averages [29]. More accurate intake measurements could be collected with an increase in the number of recall days and a decrease in the amount of time between each recall assessment [30], however, these increase participant burden which is a significant factor in longitudinal studies with repeat assessment. Future studies may be able to utilize improvements in dietary recall accuracy and may therefore show stronger associations with weight loss than the small but significant associations shown here.
This study was able to reproduce the short-term dietary associations observed by Lim et al., despite being performed in the U.S. while the Lim et al. study was conducted in South Korea. This reproducibility is notable as dietary behaviors widely vary based on geography and culture [31,32]. The current study aimed to advance the short-term research on post-MBS dietary intake and weight loss via the use of a rigorous dietary method and follow-up out to 24 months and suggests the intriguing possibility that patients’ weight may not be closely associated with dietary intake after 12 months post-surgery, contrary to conventional thought. This study shows the importance of the design of clinical studies in sampling beyond 12 months to properly assess the impact of dietary factors on long-term patient success. Future long-term studies will be needed to continue to elucidate patient attributes which have the most considerable effect on weight loss and regain over multi-year durations.
Supplementary Materials
The following supporting information can be downloaded at the website of this paper posted on Preprints.org, Figure S1. Infographic for participant attrition.; Table S1. Baseline demographics for all participants; Figure S2. Patient excess weight loss (%) from baseline weight; Table S2. Differences in dietary intake between RYGB and SG patients; Figure S3. Energy ratio comparisons between outcome groups; Table S3. Comparison of nutrition intake between groups for patients characterized as responders vs. suboptimal responders at 18 months post-surgery; Table S4. Comparison of nutrition intake between outcome groups at 12 months post-surgery; Figure S4. Dietary intake between 12 and 24 months; Figure S5. Proportion of responder and suboptimal responder patients consuming the recommended daily protein; Figure S6. Energy ratio comparisons between outcome groups.
Author Contributions
Conceptualization, AS; Formal analysis, AS; Funding acquisition, KS and and LH; Investigation, KS, IC, DB, RC and LH; Methodology, AS, AF and RC; Resources, IC; Supervision, AF; Validation, AF; Visualization, AS; Writing – original draft, AS; Writing – review & editing, AF, KS, IC, DB, RC and LH. All authors were involved in writing the paper and had final approval of the submitted and published versions.
Funding
This research was funded by the National Institutes of Health, grant numbers 1RO1 DK112585-01 and 3R01 DK112585-01.
Institutional Review Board Statement
The study was approved by the Institutional Review Boards of the Sanford Center for Biobehavioral Health (protocol code STUDY00001423; approved 12/19/16) and North Dakota State University (protocol code IRB0003681; approved 12/19/16) in Fargo, ND and the Cleveland Clinic (protocol code 16-1460; approved 2/9/17) in Cleveland, OH.
Informed Consent Statement
Written informed consent was obtained from all subjects involved prior to beginning the initial study visit.
Data Availability Statement
Data will be available to the extent the NIH requires and permitted by appropriate laws and rules. It will be available after the study's conclusion and when the data have been cleaned and patient data is fully de-identified.
Acknowledgments
The authors wish to thank Ivory Blakley for data and code review.
Conflicts of Interest
Dr. Sorgen declares no conflict of interest. Dr. Fodor is funded by the NIH grant R01 DK112585-01. He also receives consulting fees from Gelesis Corporation, ByHeart Corporation, L-Nutra Corporation, and NKarta Corporation. Dr. Steffen is funded by the NIH grant R01 DK112585-01. Dr. Carroll declares no conflict of interest. Dr. Bond declares no conflict of interest. Dr. Crosby receives consulting fees from Health Outcomes Solutions. Dr. Heinberg is funded by the NIH grant R01 DK112585-01. She has also received payment or honoraria from the Obesity Action Committee and support for travel/meeting attendance from the American Society of Bariatric and Metabolic Surgery.
References
- King, W.C.; Hinerman, A.S.; White, G.E.; Courcoulas, A.P.; Saad, M.A.B.; Belle, S.H. Associations Between Physical Activity and Changes in Weight Across 7 Years After Roux-En-Y Gastric Bypass Surgery: A Multicenter Prospective Cohort Study. Annals of Surgery 2022, 275, 718–726. [CrossRef]
- Madsbad, S.; Holst, J.J. Bariatric Surgery—Which Procedure Is the Optimal Choice? The Lancet 2019, 393, 1263–1264. [CrossRef]
- American Society for Metabolic and Bariatric Surgery Estimate of Bariatric Surgery Numbers, 2011-2020 Available online: https://asmbs.org/resources/estimate-of-bariatric-surgery-numbers.
- Reinhold, R.B. Critical Analysis of Long Term Weight Loss Following Gastric Bypass. Surg Gynecol Obstet 1982, 155, 385–394.
- van de Laar, A.; de Caluwé, L.; Dillemans, B. Relative Outcome Measures for Bariatric Surgery. Evidence Against Excess Weight Loss and Excess Body Mass Index Loss from a Series of Laparoscopic Roux-En-Y Gastric Bypass Patients. OBES SURG 2011, 21, 763–767. [CrossRef]
- Hall, K.D.; Kahan, S. Maintenance of Lost Weight and Long-Term Management of Obesity. Med Clin North Am 2018, 102, 183–197. [CrossRef]
- Ruiz-Lozano, T.; Vidal, J.; de Hollanda, A.; Scheer, F.A.J.L.; Garaulet, M.; Izquierdo-Pulido, M. Timing of Food Intake Is Associated with Weight Loss Evolution in Severe Obese Patients after Bariatric Surgery. Clinical Nutrition 2016, 35, 1308–1314. [CrossRef]
- Handzlik-Orlik, G.; Holecki, M.; Orlik, B.; Wyleżoł, M.; Duława, J. Nutrition Management of the Post–Bariatric Surgery Patient. Nutrition in Clinical Practice 2015, 30, 383–392. [CrossRef]
- Sherf Dagan, S.; Goldenshluger, A.; Globus, I.; Schweiger, C.; Kessler, Y.; Kowen Sandbank, G.; Ben-Porat, T.; Sinai, T. Nutritional Recommendations for Adult Bariatric Surgery Patients: Clinical Practice. Advances in Nutrition 2017, 8, 382–394. [CrossRef]
- Miller, G.D.; Norris, A.; Fernandez, A. Changes in Nutrients and Food Groups Intake Following Laparoscopic Roux-En-Y Gastric Bypass (RYGB). OBES SURG 2014, 24, 1926–1932. [CrossRef]
- Raatz, S.K.; Johnson, L.K.; Caliquary, A.; King, W.C.; Kalarchian, M.A.; Devlin, M.J.; Marcus, M.D.; Mitchell, J.E. Reported Nutrient Intake over 7 Years after Roux-En-Y Gastric Bypass in the Longitudinal Assessment of Bariatric Surgery-3 (LABS-3) Psychosocial Study. Surg Obes Relat Dis 2020, 16, 1022–1029. [CrossRef]
- Kanerva, N.; Larsson, I.; Peltonen, M.; Lindroos, A.-K.; Carlsson, L.M. Changes in Total Energy Intake and Macronutrient Composition after Bariatric Surgery Predict Long-Term Weight Outcome: Findings from the Swedish Obese Subjects (SOS) Study. The American Journal of Clinical Nutrition 2017, 106, 136–145. [CrossRef]
- Karmali, S.; Brar, B.; Shi, X.; Sharma, A.M.; de Gara, C.; Birch, D.W. Weight Recidivism Post-Bariatric Surgery: A Systematic Review. OBES SURG 2013, 23, 1922–1933. [CrossRef]
- Courcoulas, A.P.; Christian, N.J.; Belle, S.H.; Berk, P.D.; Flum, D.R.; Garcia, L.; Horlick, M.; Kalarchian, M.A.; King, W.C.; Mitchell, J.E.; et al. Weight Change and Health Outcomes at 3 Years After Bariatric Surgery Among Individuals With Severe Obesity. JAMA 2013, 310, 2416–2425. [CrossRef]
- Lim, H.-S.; Kim, Y.J.; Lee, J.; Yoon, S.-J.; Lee, B. Establishment of Adequate Nutrient Intake Criteria to Achieve Target Weight Loss in Patients Undergoing Bariatric Surgery. Nutrients 2020, 12, 1774. [CrossRef]
- Heinberg, L.J.; Bond, D.S.; Carroll, I.; Crosby, R.; Fodor, A.; Fouladi, F.; Gunstad, J.; Mitchell, J.; Peat, C.; Steffen, K. Identifying Mechanisms That Predict Weight Trajectory after Bariatric Surgery: Rationale and Design of the BioBehavioral Trial. Surg Obes Relat Dis 2020, 16, 1816–1826. [CrossRef]
- National Institutes of Health Automated Self-Administered 24-Hour (ASA24®) Dietary Assessment Tool Available online: https://epi.grants.cancer.gov/asa24/.
- Widaman, A.M.; Keim, N.L.; Burnett, D.J.; Miller, B.; Witbracht, M.G.; Widaman, K.F.; Laugero, K.D. A Potential Tool for Clinicians; Evaluating a Computer-Led Dietary Assessment Method in Overweight and Obese Women during Weight Loss. Nutrients 2017, 9, 218. [CrossRef]
- R Core Team R: A Language and Environment for Statistical Computing 2018.
- Courcoulas, A.; Coley, R.Y.; Clark, J.M.; McBride, C.L.; Cirelli, E.; McTigue, K.; Arterburn, D.; Coleman, K.J.; Wellman, R.; Anau, J.; et al. Interventions and Operations 5 Years After Bariatric Surgery in a Cohort From the US National Patient-Centered Clinical Research Network Bariatric Study. JAMA Surgery 2020, 155, 194–204. [CrossRef]
- Gutiérrez-Repiso, C.; Molina-Vega, M.; Bernal-López, M.R.; Garrido-Sánchez, L.; García-Almeida, J.M.; Sajoux, I.; Moreno-Indias, I.; Tinahones, F.J. Different Weight Loss Intervention Approaches Reveal a Lack of a Common Pattern of Gut Microbiota Changes. Journal of Personalized Medicine 2021, 11, 109. [CrossRef]
- Lanyon, R.I.; Maxwell, B.M.; Kraft, A.J. Prediction of Long-Term Outcome after Gastric Bypass Surgery. OBES SURG 2009, 19, 439–445. [CrossRef]
- Pinto-Bastos, A.; de Lourdes, M.; Brandão, I.; Machado, P.P.P.; Conceição, E.M. Weight Loss Trajectories and Psychobehavioral Predictors of Outcome of Primary and Reoperative Bariatric Surgery: A 2-Year Longitudinal Study. Surgery for Obesity and Related Diseases 2019, 15, 1104–1112. [CrossRef]
- Colles, S.L.; Dixon, J.B.; O’Brien, P.E. Grazing and Loss of Control Related to Eating: Two High-Risk Factors Following Bariatric Surgery. Obesity 2008, 16, 615–622. [CrossRef]
- Fouladi, F.; Carroll, I.M.; Sharpton, T.J.; Bulik-Sullivan, E.; Heinberg, L.; Steffen, K.; Fodor, A.A. A Microbial Signature Following Bariatric Surgery Is Robustly Consistent Across Multiple Cohorts. medRxiv 2020, 2020.11.12.20230581. [CrossRef]
- Fouladi, F.; Brooks, A.E.; Fodor, A.A.; Carroll, I.M.; Bulik-Sullivan, E.C.; Tsilimigras, M.C.B.; Sioda, M.; Steffen, K.J. The Role of the Gut Microbiota in Sustained Weight Loss Following Roux-En-Y Gastric Bypass Surgery. OBES SURG 2019, 29, 1259–1267. [CrossRef]
- Marceau, P.; Hould, F.-S.; Simard, S.; Lebel, S.; Bourque, R.-A.; Potvin, M.; Biron, S. Biliopancreatic Diversion with Duodenal Switch. World J. Surg. 1998, 22, 947–954. [CrossRef]
- Moshfegh, A.J.; Rhodes, D.G.; Baer, D.J.; Murayi, T.; Clemens, J.C.; Rumpler, W.V.; Paul, D.R.; Sebastian, R.S.; Kuczynski, K.J.; Ingwersen, L.A.; et al. The US Department of Agriculture Automated Multiple-Pass Method Reduces Bias in the Collection of Energy Intakes. The American Journal of Clinical Nutrition 2008, 88, 324–332. [CrossRef]
- Yuan, C.; Spiegelman, D.; Rimm, E.B.; Rosner, B.A.; Stampfer, M.J.; Barnett, J.B.; Chavarro, J.E.; Rood, J.C.; Harnack, L.J.; Sampson, L.K.; et al. Relative Validity of Nutrient Intakes Assessed by Questionnaire, 24-Hour Recalls, and Diet Records as Compared With Urinary Recovery and Plasma Concentration Biomarkers: Findings for Women. American Journal of Epidemiology 2018, 187, 1051–1063. [CrossRef]
- Foster, E.; Lee, C.; Imamura, F.; Hollidge, S.E.; Westgate, K.L.; Venables, M.C.; Poliakov, I.; Rowland, M.K.; Osadchiy, T.; Bradley, J.C.; et al. Validity and Reliability of an Online Self-Report 24-h Dietary Recall Method (Intake24): A Doubly Labelled Water Study and Repeated-Measures Analysis. J Nutr Sci 2019, 8, e29. [CrossRef]
- Grivetti, L.E. Culture, Diet, and Nutrition: Selected Themes and Topics. BioScience 1978, 28, 171–177. [CrossRef]
- Inocian, E.P.; Nolfi, D.A.; Felicilda-Reynaldo, R.F.D.; Bodrick, M.M.; Aldohayan, A.; Kalarchian, M.A. Bariatric Surgery in the Middle East and North Africa: Narrative Review with Focus on Culture-Specific Considerations. Surgery for Obesity and Related Diseases 2021, 17, 1933–1941. [CrossRef]
Figure 1.
Excess weight loss in RYGB and SG patients at 1, 6, 12, 18, and 24 months. Data are presented as means ± standard errors. Pairwise statistical differences are analyzed by Wilcoxon’s rank-sum test. * indicates p < 0.05, ** indicates p < 0.01, *** indicates p < 0.001, and **** indicates p < 0.0001 RYGB versus SG.
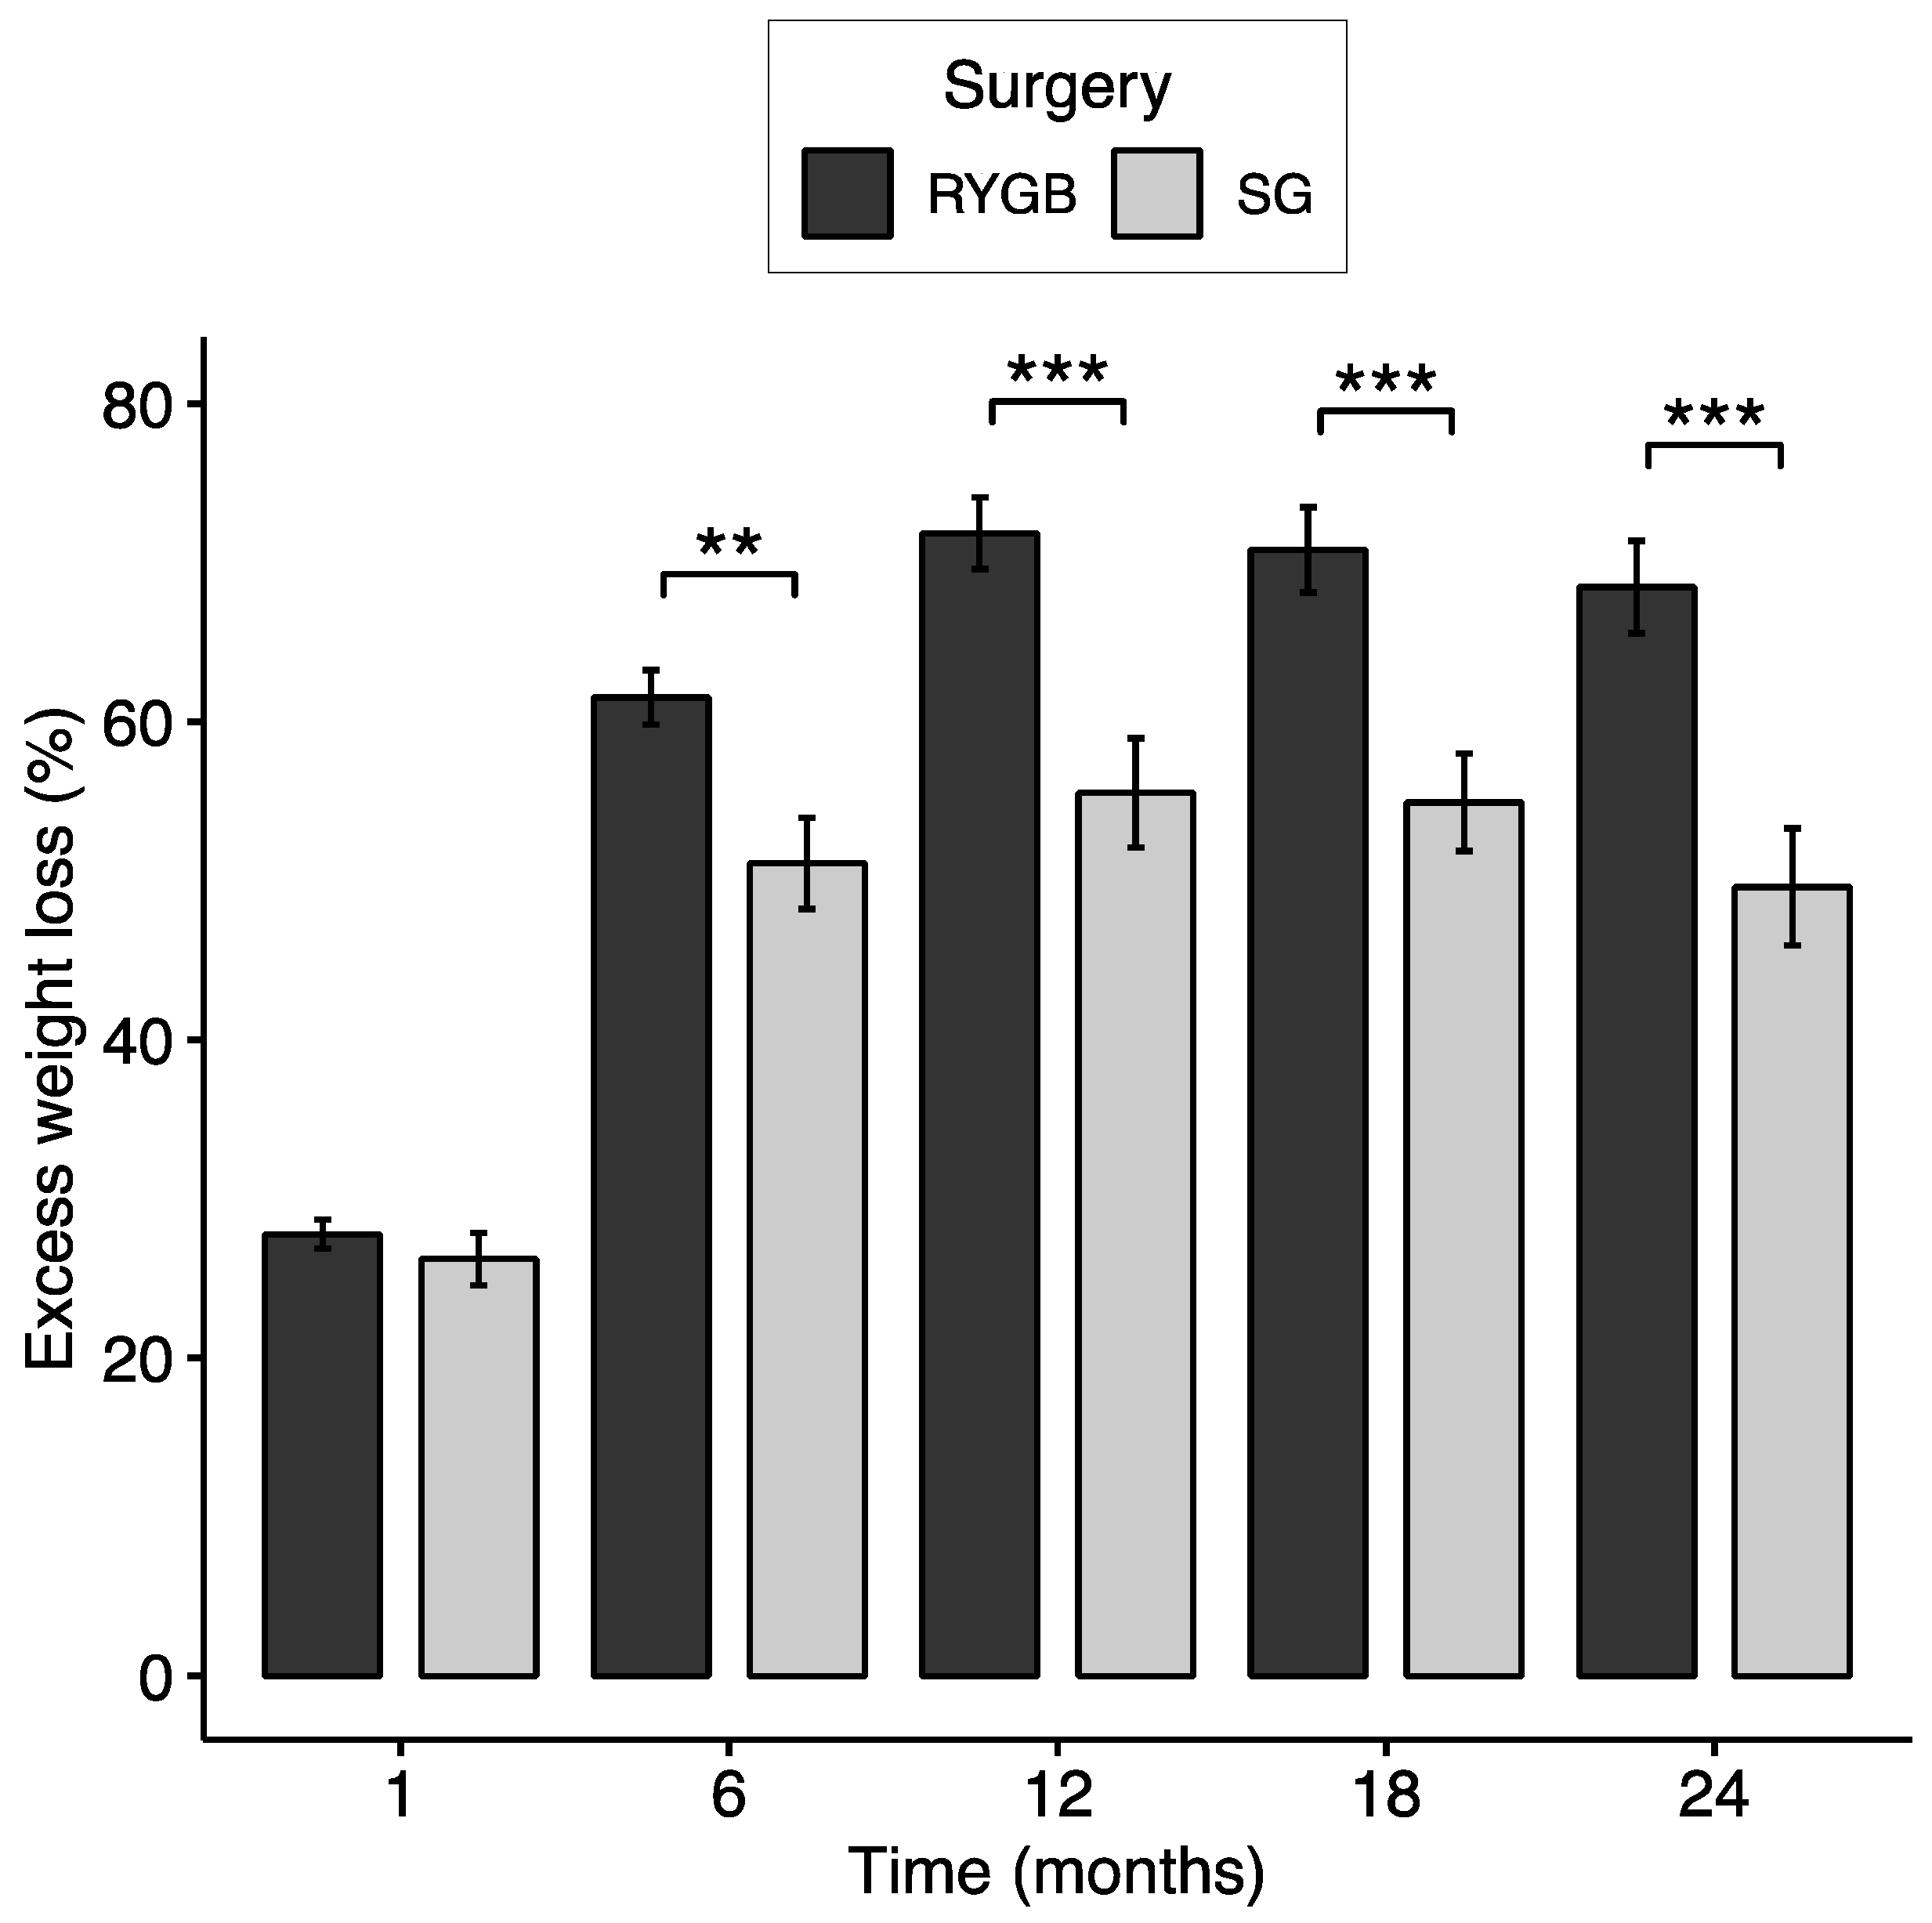
Figure 2.
Differences in dietary intake for all patients over time for total energy (a), carbohydrates (b), protein (c), and fat (d). Pairwise statistical differences are analyzed by univariate linear regression. * indicates p < 0.05, ** indicates p < 0.01, *** indicates p < 0.001, and **** indicates p < 0.0001 baseline versus post-surgery time.
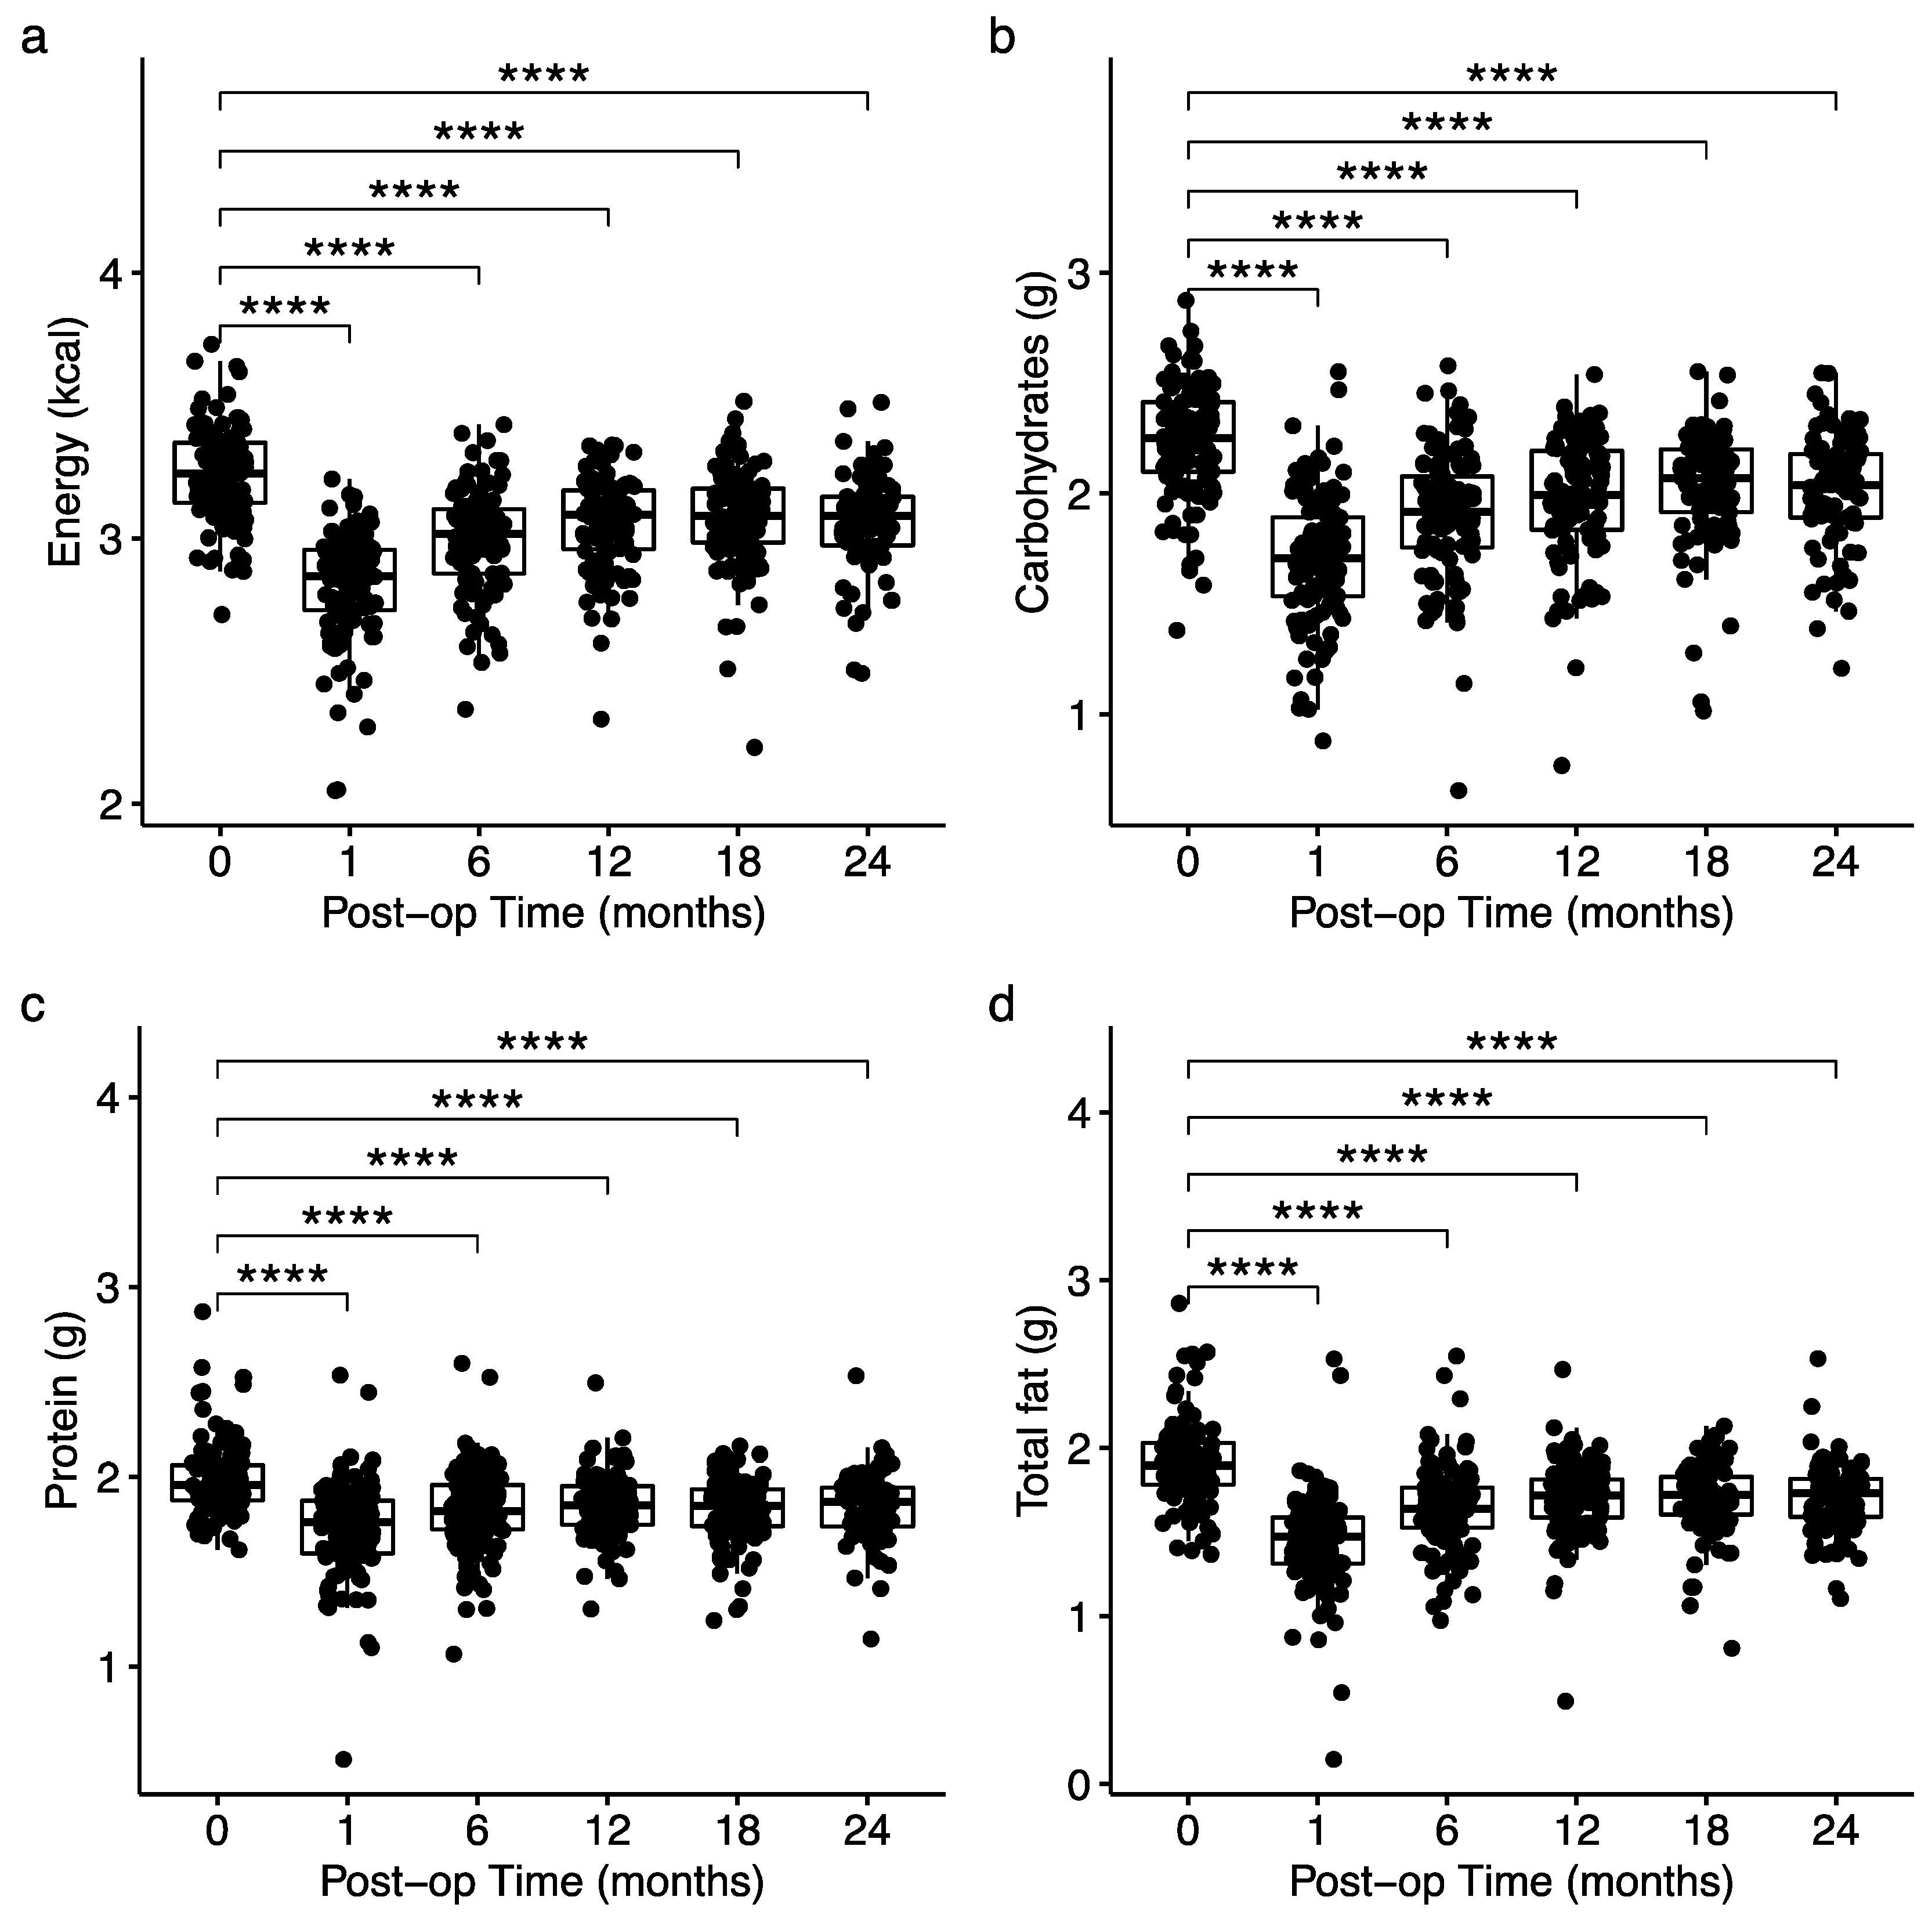
Figure 3.
Correlations between excess weight loss and dietary intake at 12 months (a-d), 18 months (e-h), and 24 months (i-l) post-surgery with outliers removed. The number of outliers removed from the analysis is indicated below each plot. Correlation coefficients (r) and p-values were calculated using Spearman’s rank correlation. Grey shading indicates a confidence interval of 95%.
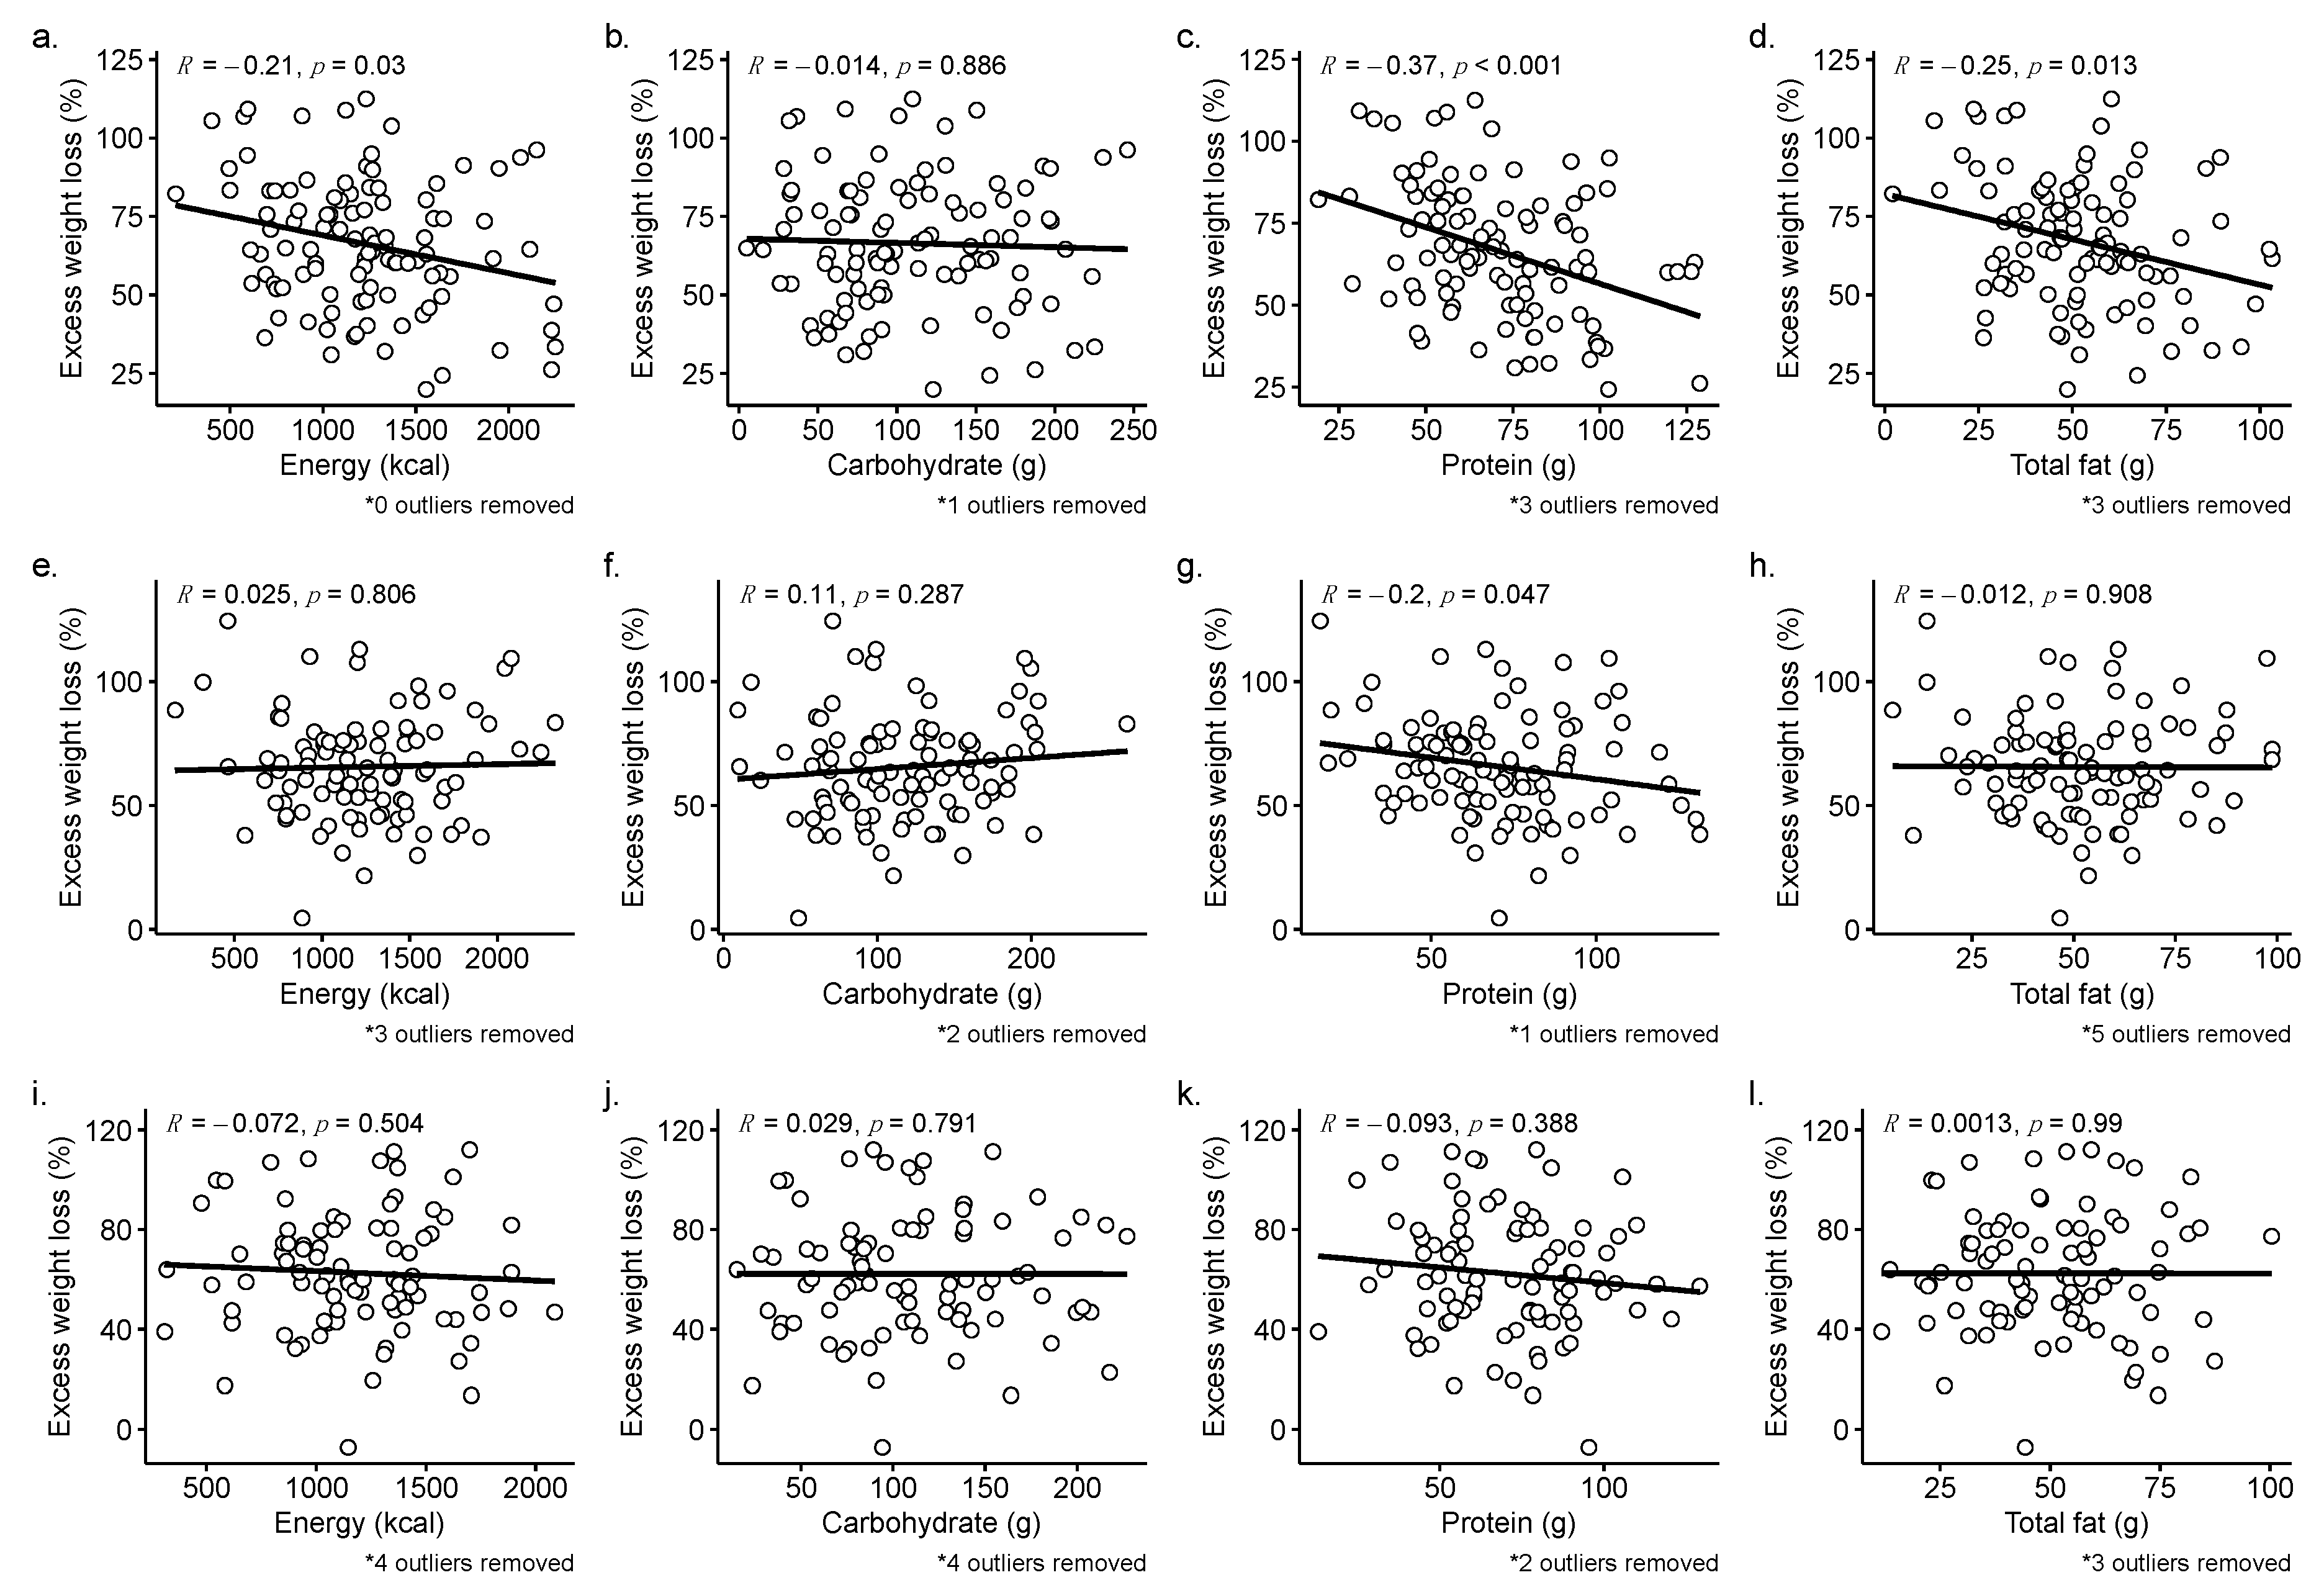

Table 1.
Patient weight metrics.
| Timepoint | n | Weight (kg) | BMI (kg/m2) | Excess weight (kg) | Percent loss (%) | EWL (%) | ||
|---|---|---|---|---|---|---|---|---|
| Baseline | 124 | 131.64 ± 25.21 | 45.93 ± 6.79 | 60.1 ± 21.17 | - | - | ||
| RYGB – 87 | 129.51 ± 21.58 | 45.28 ± 5.66 | 58.05 ± 17.56 | - | - | |||
| SG – 37 | 136.66 ± 31.97 | 47.46 ± 8.82 | 64.93 ± 27.58 | - | - | |||
| p = 0.219 | p = 0.348 | p = 0.263 | ||||||
| Postop 1 month | 122 | 115.89 ± 22.41 | 40.52 ± 6.37 | 44.43 ± 19.01 | 11.81 ± 3.44 | 27.32 ± 8.94 | ||
| RYGB – 86 | 114.07 ± 18.46 | 39.9 ± 5.02 | 42.59 ± 14.86 | 12.02 ± 3.4 | 27.77 ± 8.49 | |||
| SG – 36 | 120.23 ± 29.68 | 41.99 ± 8.72 | 48.82 ± 26.19 | 11.31 ± 3.55 | 26.23 ± 9.96 | |||
| p = 0.295 | p = 0.485 | p = 0.386 | p = 0.117 | p = 0.341 | ||||
| Postop 6 months | 114 | 97.85 ± 20.93 | 34.37 ± 6.09 | 26.77 ± 17.87 | 25.3 ± 5.95 | 58.32 ± 16.36 | ||
| RYGB – 79 | 94.29 ± 15.76 | 33.26 ± 4.58 | 23.39 ± 12.91 | 26.69 ± 5.66 | 61.53 ± 15.16 | |||
| SG – 35 | 105.88 ± 28.12 | 36.88 ± 8.1 | 34.4 ± 24.35 | 22.15 ± 5.43 | 51.09 ± 16.88 | |||
| p = 0.032 | p = 0.024 | p = 0.020 | p < 0.001 | p = 0.002 | ||||
| Postop 12 months | 110 | 93.13 ± 21.66 | 32.69 ± 6.34 | 22.05 ± 18.66 | 28.79 ± 7.99 | 66.51 ± 21.19 | ||
| RYGB – 74 | 88.32 ± 16.32 | 31.12 ± 4.68 | 17.43 ± 13.38 | 31 ± 7.29 | 71.85 ± 19.44 | |||
| SG – 36 | 103.02 ± 27.5 | 35.91 ± 7.99 | 31.55 ± 23.93 | 24.23 ± 7.52 | 55.53 ± 20.64 | |||
| p = 0.004 | p = 0.002 | p = 0.002 | p < 0.001 | p < 0.001 | ||||
| Postop 18 months | 101 | 93.31 ± 21.76 | 32.73 ± 6.16 | 22.28 ± 18.37 | 28.25 ± 8.48 | 65.46 ± 21.93 | ||
| RYGB – 67 | 88.61 ± 17.32 | 31.21 ± 4.86 | 17.78 ± 14.21 | 30.46 ± 8.57 | 70.81 ± 21.98 | |||
| SG – 34 | 102.58 ± 26.5 | 35.73 ± 7.32 | 31.14 ± 22.29 | 23.89 ± 6.45 | 54.93 ± 17.86 | |||
| p = 0.009 | p = 0.003 | p = 0.003 | p < 0.001 | p < 0.001 | ||||
| Postop 24 months | 93 | 94.87 ± 21.64 | 33.36 ± 6.41 | 23.91 ± 18.89 | 27.25 ± 9.26 | 62.59 ± 23.8 | ||
| RYGB – 64 | 89.3 ± 17.45 | 31.62 ± 5.03 | 18.83 ± 14.76 | 29.45 ± 9.01 | 68.47 ± 23.24 | |||
| SG – 29 | 107.18 ± 25 | 37.19 ± 7.5 | 35.12 ± 22.2 | 22.42 ± 7.99 | 49.62 ± 19.82 | |||
| p = 0.001 | p = 0.001 | p < 0.001 | p < 0.001 | p < 0.001 | ||||
Data are reported as mean ± SD. P-values were computed by Wilcoxon’s rank-sum test for RYGB versus SG weight metrics.
Table 2.
Comparison of nutrition intake between groups for patients characterized as responders vs. suboptimal responders at 12 months post-surgery.
Table 2.
Comparison of nutrition intake between groups for patients characterized as responders vs. suboptimal responders at 12 months post-surgery.
| Responder | Suboptimal responder | |||||
|---|---|---|---|---|---|---|
| (n = 85) | (n = 25) | R2 | p-value | |||
| Baseline | Weight (kg) | 126.01 ± 21.13 | 146.67 ± 31.57 | 0.118 | 0.002 | |
| Energy (kcal) | 1865.58 ± 842.97 | 1973.37 ± 756.42 | 0.003 | 0.392 | ||
| Carbohydrates (g) | 198.29 ± 119.14 (43.7%) | 209.78 ± 101.33 (46.5%) | 0.002 | 0.448 | ||
| Protein (g) | 109.6 ± 86.56 (27.7%) | 117.28 ± 70.75 (30.2%) | 0.002 | 0.267 | ||
| Total fat (g) | 98.8 ± 94.24 (52.4%) | 111.46 ± 70.2 (62.8%) | 0.004 | 0.053 | ||
| Postop | Weight (kg) | 110.27 ± 18.12 | 130.76 ± 29.13 | 0.143 | 0.001 | |
| 1 month | Energy (kcal) | 668.69 ± 253.94 | 930.85 ± 295.61 | 0.148 | <0.001 | |
| Carbohydrates (g) | 58.41 ± 50.72 (35.8%) | 79.96 ± 47.85 (33.5%) | 0.031 | 0.013 | ||
| Protein (g) | 59.97 ± 45.52 (36.8%) | 64.17 ± 22.47 (28.9%) | 0.002 | 0.105Δ | ||
| Total fat (g) | 33.71 ± 44.01 (46.7%) | 39.33 ± 17.15 (37.5%) | 0.003 | 0.007 | ||
| Postop | Weight (kg) | 91.35 ± 15.01 | 119.82 ± 25.38 | 0.311 | <0.001 | |
| 6 months | Energy (kcal) | 1021.7 ± 427.11 | 1285.95 ± 458.12 | 0.06 | 0.009Δ | |
| Carbohydrates (g) | 91.51 ± 63.07 (35.1%) | 110.9 ± 54.65 (34.4%) | 0.017 | 0.038Δ | ||
| Protein (g) | 74.4 ± 53.24 (30.9%) | 76.09 ± 28.62 (24.0%) | <0.001 | 0.247 | ||
| Total fat (g) | 50.88 ± 48.29 (45.0%) | 59.21 ± 25.22 (41.2%) | 0.006 | 0.017Δ | ||
| Postop | Weight (kg) | 85.72 ± 14.63 | 118.35 ± 22.9 | 0.402 | <0.001 | |
| 12 months | Energy (kcal) | 1156.08 ± 416.19 | 1436.55 ± 466.82 | 0.072 | 0.018Δ | |
| Carbohydrates (g) | 110.25 ± 61.81 (36.8%) | 116.61 ± 58.31 (31.1%) | 0.002 | 0.685Δ | ||
| Protein (g) | 71.27 ± 36.12 (26.0%) | 85.48 ± 24.49 (25.1%) | 0.031 | 0.002Δ | ||
| Total fat (g) | 52.42 ± 33.14 (40.6%) | 66.43 ± 25.31 (41.5%) | 0.034 | 0.005Δ |
Data are reported as mean ± SD. P-values were computed by Wilcoxon’s rank-sum test. Data in parentheses report the average energy ratio for each macronutrient intake. R2 was calculated by univariate linear models. Bold p-values indicate p < 0.05 responder versus suboptimal responder. Δ corresponds with significant comparisons observed by Lim et al. (2020).
Table 3.
Comparison of nutrition intake between groups for patients characterized as responders vs. suboptimal responders at 24 months post-surgery.
Table 3.
Comparison of nutrition intake between groups for patients characterized as responders vs. suboptimal responders at 24 months post-surgery.
| Responder | Suboptimal responder | ||||
|---|---|---|---|---|---|
| (n = 64) | (n = 29) | R2 | p-value | ||
| Baseline | Weight (kg) | 126.81 ± 19.42 | 138.62 ± 32.7 | 0.049 | 0.121 |
| Energy (kcal) | 1807.96 ± 681.19 | 1820.37 ± 762.13 | <0.001 | 0.879 | |
| Carbohydrates (g) | 179.03 ± 81.77 (38.7%) | 222.75 ± 161.77 (53%) | 0.032 | 0.673 | |
| Protein (g) | 91.19 ± 28.57 (21.8%) | 141.41 ± 141 (38.3%) | 0.077 | 0.167 | |
| Total fat (g) | 76.24 ± 31.16 (37.7%) | 133.3 ± 142.57 (79.2%) | 0.094 | 0.048 | |
| Postop | Weight (kg) | 110.99 ± 16.18 | 124.25 ± 30.1 | 0.077 | 0.042 |
| 1 month | Energy (kcal) | 676.96 ± 263.61 | 833.98 ± 291.5 | 0.068 | 0.011 |
| Carbohydrates (g) | 58.46 ± 49.11 (34.8%) | 69.71 ± 41.96 (32.8%) | 0.012 | 0.094 | |
| Protein (g) | 58.87 ± 42.55 (36.9%) | 62.09 ± 24.22 (30.4%) | 0.002 | 0.229Δ | |
| Total fat (g) | 32.14 ± 41.13 (45%) | 34.11 ± 15.19 (36.6%) | 0.001 | 0.091 | |
| Postop | Weight (kg) | 92 ± 14.54 | 110.37 ± 27.77 | 0.162 | <0.001 |
| 6 months | Energy (kcal) | 1016.07 ± 434.96 | 1206.94 ± 488.45 | 0.037 | 0.053Δ |
| Carbohydrates (g) | 90.74 ± 67.43 (35.1%) | 99.74 ± 53.14 (33%) | 0.004 | 0.205Δ | |
| Protein (g) | 77.92 ± 60.31 (32.5%) | 75.54 ± 31.86 (25.5%) | <0.001 | 0.39 | |
| Total fat (g) | 53.3 ± 55.04 (47.7%) | 54.91 ± 26.24 (40.2%) | <0.001 | 0.086Δ | |
| Postop | Weight (kg) | 85.46 ± 14.82 | 109.01 ± 26.16 | 0.252 | <0.001 |
| 12 months | Energy (kcal) | 1143.68 ± 426.09 | 1338 ± 476.48 | 0.04 | 0.141Δ |
| Carbohydrates (g) | 108.7 ± 66.45 (36.3%) | 109.96 ± 57.76 (31.6%) | <0.001 | 0.905Δ | |
| Protein (g) | 72.11 ± 38.97 (26.9%) | 84.65 ± 25.65 (26.9%) | 0.026 | 0.005Δ | |
| Total fat (g) | 52.15 ± 36.69 (40.8%) | 61.4 ± 27.24 (40.8%) | 0.016 | 0.109Δ | |
| Postop | Weight (kg) | 85.99 ± 14.88 | 110.35 ± 24.31 | 0.28 | <0.001 |
| 18 months | Energy (kcal) | 1261.91 ± 498.21 | 1364.14 ± 530.58 | 0.009 | 0.467 |
| Carbohydrates (g) | 121.91 ± 61.32 (37.4%) | 121.67 ± 60.63 (35.3%) | <0.001 | 0.754 | |
| Protein (g) | 65.56 ± 21.83 (22.7%) | 84.3 ± 28.94 (25.2%) | 0.115 | 0.003 | |
| Total fat (g) | 53.67 ± 23.26 (38.3%) | 59.44 ± 25.43 (39.1%) | 0.012 | 0.402 | |
| Postop | Weight (kg) | 86.36 ± 14.77 | 113.67 ± 22.7 | 0.346 | <0.001 |
| 24 months | Energy (kcal) | 1218.42 ± 472.41 | 1296.49 ± 542.18 | 0.005 | 0.451 |
| Carbohydrates (g) | 116.14 ± 62.55 (39.9%) | 121.33 ± 71.11 (36.3%) | 0.001 | 0.808 | |
| Protein (g) | 75.65 ± 41.86 (28.6%) | 71.23 ± 22.48 (23.9%) | 0.003 | 0.976 | |
| Total fat (g) | 56.64 ± 43.52 (47.6%) | 53.28 ± 21.87 (38%) | 0.002 | 0.724 |
Data are reported as mean ± SD. P-values were computed by Wilcoxon’s rank-sum test. Data in parentheses report the average energy ratio for each macronutrient intake. R2 was calculated by univariate linear models. Bold p-values indicate p < 0.05 responder versus suboptimal responder. Δ corresponds with significant comparisons observed by Lim et al. (2020).
Disclaimer/Publisher’s Note: The statements, opinions and data contained in all publications are solely those of the individual author(s) and contributor(s) and not of MDPI and/or the editor(s). MDPI and/or the editor(s) disclaim responsibility for any injury to people or property resulting from any ideas, methods, instructions or products referred to in the content. |
© 2023 by the authors. Licensee MDPI, Basel, Switzerland. This article is an open access article distributed under the terms and conditions of the Creative Commons Attribution (CC BY) license (http://creativecommons.org/licenses/by/4.0/).
Copyright: This open access article is published under a Creative Commons CC BY 4.0 license, which permit the free download, distribution, and reuse, provided that the author and preprint are cited in any reuse.


