
Submitted:
12 June 2023
Posted:
12 June 2023
You are already at the latest version
Abstract
This study evaluated eight herbal and fruit teas to produce kombucha beverages. Besides, the effect of initial sucrose concentration (10, 40, and 70% w/v) on kombucha fermentation from tea extracts was investigated. Kinetic characterization and modeling of kombucha fermentation were also performed. Results showed that kombucha beverages' characteristics and chemical content changed according to tea type and initial sucrose concentration. It was determined that as initial sucrose concentration increased, the consumed substrate concentration increased. The highest total biomass values were determined when green tea and pomegranate tea were supplemented with 70 g/L sucrose. The highest total phenolic content and antioxidant activity were achieved with green tea samples. The total acidity and phenolic substance concentration increased as fermentation progressed in general. The kinetic parameters including maximum consumption rate, sugar utilization, yield, biomass yield, maximum biomass, total acidity, phenolic production rate, and the phenolic result were computed depending on changing substrate concentration. Concerning kinetic modeling, proposed models (Logistic and Luedeking-Piret models) estimated satisfactorily experimental substrate consumption and total acidity values. Besides, total acidity was associated with the substrate consumption.
Keywords:
Kombucha fermentation
; bioactive component
; proximate composition
; kinetic parameters
; kinetic modeling
1. Introduction
Kombucha has been consumed all over the world but historically in China, Russia, and Eastern European countries. Kombucha is a fermented sugared black tea by yeasts and Acetobacter species [1,2]. The various yeast species of Kombucha tea are Brettanomyces bruxellensis [3], Candida stellata [3], Schizosaccharomyces pombe [3], Torulaspora delbrueckii [3], Zygosaccharomyces bailii [3], Saccharomycodes ludwigii [4], Kloeckera apiculata [5], Saccharomyces cerevisiae [4], Brettanomyces lambicus [6], Brettanomyces custersii [6], Candida krusei [5], and Pichia species [7]. This means that Kombucha culture differs from place to place and could easily be understood from different research about Kombucha cultures [2]. The role of yeasts in the Kombucha fermentation is to hydrolyze sucrose from cultivation medium to glucose and fructose and metabolize these monosaccharides to ethanol, which is further oxidized to acetic acid by AAB. AAB cannot uptake sucrose alone, because of the lack of enzymes for the extracellular hydrolysis of sucrose or its transport into the cell. Besides, AAB use yeast-derived glucose to synthesize gluconic acid and bacterial cellulose in the form of pellicle which is commonly described as the “fungus” [8,9,10]. Microbial community type and composition play an important role in the biochemistry dynamics of Kombucha. These associations help to decrease pH and reduce microbial growth of other microorganisms with antimicrobial metabolites [11]. The time of Kombucha fermentation is between 7 and 60 days. During this time, the biological activities increase. On the other hand, it was reported that the best results were yielded in an average of 15 days [12]. According to the Food and Drug Administration Model Food Code for Kombucha brewing, more than 10 days of fermentation are not suggested if produced for human consumption [13]. Therefore, 8–10 days can be enough to get the best beverage specifications and microorganisms use sugar to produce value-added acids and antimicrobial metabolites [14]. The kombucha tea yielded after fermentation is consisted of sugars (glucose, fructose), gluconic, glucuronic, L-lactic, acetic, malic, tartaric, malonic, citric, and oxalic acids, as well as ethanol, 14 amino acids, water-soluble vitamins, antibiotically active matters, and some hydrolytic enzymes [15].
Kombucha tea has beneficial features on human health [2]. The research about the antimicrobial activity of Kombucha tea showed that the antimicrobial agent was acetic acid content and it inhibited Agrobacterium tumefaciens, Bacillus cereus, Salmonella choleraesuisserotypetyphimurium, Staphylococcus aureus, and Escherichia coli. However, due to the fermented samples including 33 g/L total acid (7 g/L acetic acid), these values indicated the yielded beverage samples were not suitable for drinkable levels but Kombucha had antimicrobial activity against pathogenic bacteria [16]. The other research demonstrated that Kombucha beverage had an antimicrobial effect against a range of pathogenic bacteria, several clinical Candida species, fermented L. citriodora, and F. vulgare [17]. Kombucha could also be used against enteropathogenic bacterial infections due to its polyphenolic content [18]. Various Kombucha cultures also showed different antioxidant activity under the same conditions [19]. The conformable research showed the difference between antioxidant activity values from different starter cultures and tea extracts [15]. The Kombucha fermentation with different ISCs (70, 50, and 35 g/L of sucrose) was studied and the highest sugar concentration value was found to be an optimal concentration of carbon source, providing high pH, low acetic acid, and high L-lactic acid content and highest sucrose consumption [20].
In the literature, there are some similar studies regarding the production of Kombucha tea from different types of herbal and fruit teas. For instance, Zubaidah et al. [21] examined the physical, chemical and microbiological features of Kombucha from different varieties of apples (Anna, Manalagi, Fuji, Granny Smith, Red Delicious, Rome beauty and Royal Gala). Based on the results, it was reported that the best treatment was yielded on Fuji varieties of Kombucha apple (total acid 1.33%, pH 2.95, total phenol 268.57 μg/mL GAE, total sugar 6.74%, antibacterial activity against Staphylococcus aureus 21.30 mm, antibacterial activity Escherichia coli 21.20 mm, antioxidant activity 35.62%, organoleptic aroma 3.55, taste 3.3, and color 3.4 (on a scale of 1–5)) [21]. In another study in which the different carbon sources (glucose, fructose, xylose, lactose, sucrose (70 g/L)), types of teas (black tea, green tea, sage tea, pomegranate (hibiscus) tea, blueberries tea, and rosehip tea), and coffee were used as resources to produce Kombucha [22], the pH, acidity, antioxidant activity, phenolic substance, biomass development, color change, organic acid profile, ethanol, and sensory analysis were examined. The results indicated that the value of pH decreased during fermentation and the Kombucha from fruit teas were greater acidity than herbal teas and coffee extract. Besides, phenolic substance content and antioxidant activity of the kombucha produced have been found to have the potential to be an important product. Regarding biomass growth, it was determined most in glucose and sucrose (tea samples) and lactose (coffee extract) and at the least in fructose (tea samples) and lactose (coffee extract). When color changes were examined, it was detected that the L, a, b values of herbal tea changed in fermentation medium supplemented with glucose, xylose or fructose. During the fermentation, most of organic acids including oxalic acid, tartaric acid, malic acid, lactic acid, citric acid, succinic acid, and fumaric acid were measured. On the other hand, it was reported that no ethanol production was observed at the end of the fermentation. Based on the sensory analysis, the most and least preferred Kombucha teas were produced from the pomegranate and sage teas, respectively [22]. As a different study, Tamer et al. [23] evaluated the bio-accessibility and functional features of Kombucha beverages fortified with different medicinal plant extracts (linden, lemon balm, sage, Echinacea, mint, and cinnamon). Based on the results, the antioxidant capacity (AC), ferric-reducing antioxidant power, and cupric-reducing AC were 13.96, 48.90, and 55.54%, respectively. It was also found that during 9-day storage, the bio-accessibility of total phenolics and AC increased dramatically after gastric and intestinal digestion [23]. Additionally, the changes in content of organic acids and polyphenols during the Kombucha fermentation from green tea, black tea, and tea manufacturing waste [24] and the antibacterial and antifungal activities of black and green Kombucha teas [25] were also examined. Moreover, the kinetics of sucrose fermentation by Kombucha culture was also studied by using the Boltzmann’s functions [26]. The fermentation conditions were performed on 1.5 g/L of black tea, with 67 g/L of sucrose and using 10 or 15% of Kombucha culture (v/v). Besides, the model was described as a sigmoidal function at two different temperatures (22 and 30 °C). Based on the results, it was determined that the rate of the fermentation was maximum on days 4–5 and after reaching the maximal rate, it decreased dramatically. Besides, it was reported that as the temperature and inoculum concentration increased, the rate of the fermentation increased, the optimal fermentation time was 3.5–5 days under the implemented circumstances, and the saturation curves indicated the sigmoidal kinetics at the selected sucrose concentration [26]. When considering this information, this study has novelty in terms of the use of some different types of teas in the production of Kombucha beverages, kinetic characterization of Kombucha fermentations performed at different substrate concentrations, and kinetic modeling of Kombucha fermentations in terms of substrate consumption and total acidity. Therefore, this study is filled the significant gap in the literature.
Kombucha tea is generally produced from black and green tea, but commercial firms’ market started to produce new Kombucha beverages with lemon, apples, peach, blackberries, and rosehip. Therefore, this study aimed to produce kombucha teas with different chemical compositions using different substrates, develop Kombucha tea, which has limited consumption due to its acidic taste, reach wider communities, determine the kinetic characterization of Kombucha fermentation, and model kinetically Kombucha fermentation from different sources of tea.
2. Materials and methods
Kombucha culture and media
Kombucha culture was obtained from the commercial firm “Comboutea” (Tema Pharmaceutical Vitamin Cosmetics Limited Company, Samsun, Turkey). The media components for stock and pre-culture were 10 g/L yeast extract, 20 g/L glucose, and 20 g/L peptone [27]. After the medium composition was prepared, the medium pH was adjusted to 4 using 10 N HCl. The prepared medium was sterilized at 121.1 °C for 15 min. Subsequently, the medium was cooled to room temperature, it was inoculated with 10% (v/v) of Kombucha culture. The stock and pre-cultures were incubated at 24 °C for 10 days and stock cultures were stored at 4 °C. Stock cultures were renewed one month to have viability and productivity.
Experimental design
This study was planned to carry out the characteristics of Kombucha teas which were produced from different herbal and fruit teas with different initial sugar values. The acetic acid produced during kombucha fermentation makes it difficult to consume fermented tea. Consumption of Kombucha tea in Turkey is less than its consumption in the world due to its acidic taste and not suitable for Turkish taste. Therefore, in this study, different fruit (bilberry, rosehip, apple, and pomegranate tea) and herbals (green, sage, linden, and black tea) teas were used for tea extraction. On the other hand, the limit sugar value to produce Kombucha from different types of tea was determined from a previous study [15]. After determining the maximum sugar limit, sucrose as the sole carbon source was added to the fermentation medium by decreasing 30 g/L to instigate the effect of the initial sucrose concentration. Thus, the ISCs were 10, 40, and 70 g/L in the present study. Each of the extracts was prepared with three different ISCs (10, 40, and 70 g/L), and a coded system for the samples was given in Table 1. All production and analyses were replicated two times. Kinetic parameters of Kombucha fermentation were also calculated. Besides, fermentations were kinetically modeled using the logistic model (LM) and the Luedeking-Piret model (LPM) [28]. The LM was used to predict the experimental substrate consumption values and LPM was employed to estimate the experimental total acidity values of fermentation.
Preparation of tea extracts, inoculation, and fermentation
Four different herbal teas [green (GT), sage (ST), linden (LT), and black tea (BT)] and four various fruit teas [bilberry (BBT), rosehip (RT), apple (AT), and pomegranate tea (PT)] were used for Kombucha production. All of the tea samples were provided by Unilever Company in Konya, Turkey.
The extraction process was realized by mixing 1-L of boiled pure water with 10 g tea and waiting for 15 min to obtain tea extracts [29]. The mix was filtered by using roughing filter paper (cellulosic filter paper) to separate the insoluble materials. After filtration, different amounts of sucrose (10, 40, or 70 g/L) were added immediately. After the sugar was dissolved completely, the mixture was transferred into 250 mL flasks (100 mL working volume) and cooled to room temperature. It was stored in appropriate conditions until inoculation.
After pre-culture and fermentation media were prepared, the flasks were inoculated with 10 mL of pre-culture. Inoculated sugared tea mixtures were incubated at 24 °C for 10 days with no agitation and samples were taken daily under aseptic conditions and stored at 4 °C [30].
Analysis
The total acidity was determined by adding 0.1 N NaOH to samples until pH is 8.2 [31]. The pH values of fermented beverages were measured with an electronic pH meter (Thermo Scientific Orion 4 Star, Singapore). The total biomass of fermented samples was determined gravimetrically. The collected samples during fermentation were filtered by using pre-weighed filter paper (Whatman No: 1) and the fermented broth was removed. The filter cake (biomass) was then dried at 60 °C in the oven until constant weight [32]. The residual sugar concentration was spectrophotometrically determined using the 3,5-dinitrosalicylic acid method [33]. The Folin-Ciocalteu method was used for determining the total phenolic substance concentration in samples. The results were given as milligrams of gallic acid equivalents per liter (mg GAE/L) of Kombucha [34]. The antioxidant analysis was determined with the α, α-diphenyl-β-picrylhydrazyl (DPPH) free radical scavenging method, and the antioxidant capacity was determined as % inhibition [19].
Kinetic parameters
Kinetic parameters like substrate consumption (∆S, g/L), maximum substrate consumption rate (QS, g/L/d), substrate utilization yield (η, %), biomass production (∆X, g/L), maximum biomass production rate (QX, g/L/d), biomass yield (YX/S, g biomass/g substrate), total acidity (TA, %), maximum total acidity production rate (QTA, %/d), phenolics production (∆PH, mg/L), maximum phenolics production rate (QPH, mg/L/d), and phenolics yield (YPH/S, mg phenolics/g substrate) were calculated. The details regarding how kinetic parameters are calculated can be found in previous similar studies [28].
Kinetic modeling
The LM (Eq 1) and LPM (Eq 2) were utilized to estimate the experimental substrate consumption and total acidity data of Kombucha fermentation. Microsoft Office Excel 2013 was used. Traditionally, LM is used to describe cell growth. However, in this work, the model was modified to define sugar consumption and employed independently from cell growth data since there is no sigmoidal growth of biomass because of high acidity or low pH values.
where −dS/dt is the substrate consumption rate (g/L/d), µm,S is the specific sugar consumption rate (1/d), S is the residual substrate concentration at the time “t” (g/L), and Sm is the maximum substrate concentration (g/L).
The LPM is utilized to define the metabolite production rate (dP/dt) related to cell growth. However, dP/dt is also thought to be contingent on both momentary S and dS/dt in a linear manner [35].
where, dP/dt is the total acidity rate (%/d) and α and β are the empirical constants that vary based on fermentation conditions and are determined with the best appropriate real data. Moreover, the determination of coefficient (R2) was utilized to comprehend whether modeling is accomplished or not [28].
Statistical analysis
The SAS Version 7 program (Statistical Analysis System, TS P1, USA) was used for the statistical evaluation of the data obtained from the study, and variance analysis was performed. Significant differences were evaluated by the Duncan Multiple Comparison Test at a confidence level of 95%.
3. Results and discussion
Sugar consumption and biomass production
Three ISCs were used to determine the fermentation performance of the commercial Kombucha culture. It was determined that all of the sugar in the fermentation medium was consumed by the Kombucha culture in fermentations performed with AT-10, RT-10, PT-10, and BT-10. However, when the fermentation medium contained high sugar concentration, all of the substrate in the medium was not consumed by the Kombucha culture at the end of the fermentation (Figure 1A–G). The highest sugar consumption value was 55.40 g/L for LT-70 herbal Kombucha tea, whereas its highest value was 48.39 g/L for AT-70 fruit Kombucha tea (Table 2). These sugar consumption values also affected biomass formation. In Figure 1A–G, biomass production curves from different medium compositions were given. The difference in the medium used, amount of sugar, the composition of culture, fermentation conditions, and applied period are effective in the chemical composition of Kombucha [36]. Moreover, ISC affected total sugar consumption. High sugar consumption was observed in fermentations with high ISCs (Table 2). It was determined that residual sugar concentration decreased during fermentation. Furthermore, the highest biomass productions for herbal and fruit kombucha teas were determined as 6.46 g/L for GT-70 and 8.77 g/L for PT-70. These results showed that biomass formation increased with an increase in sugar consumption (Table 2). In the work done by Muhialdin et al. [37], the amount and yield of biomass were associated with the sugar source.
pH and total acidity
Kombucha fermentation was performed with herbal and fruit tea extracts for 10 days and pH changes were shown in Figure 1H–N. Herbal and fruit tea extracts’ initial pH values ranged from 4.86 to 5.90 and from 3.12 to 3.53, respectively. Differences between initial and final values of pH were higher for herbal tea samples than fruit tea samples (Figure 1). The lowest final pH values of herbal and fruit teas were measured to be 2.53 for ST-40, 2.46 for BBT-40, and their highest values were 3.73 for ST-10 and 3.57 for AT-10. It was seen a slight pH increase at the end of Kombucha fermentation in AT supplemented with 10 g/L sucrose (Figure 1K). This may be due to the breakdown of dead cells in the fermentation medium [38]. All pH values, except for that of AT-10, were decreased during fermentation because microorganisms metabolize sugar into different metabolites such as organic acids and by-products. For all samples, a significant decrease in pH was noticed between days 0 and 5 and changes in pH were statistically insignificant after day 5 (p < 0.05). Total acidity values in all herbal and fruit tea samples were below 0.30% acetic acid at the beginning of fermentation. Initial total acidity values differ from 0.04 to 0.22% for herbal tea extracts and 0.15 to 0.27% for fruit tea extracts. The highest and lowest total acidity values for herbal and fruit teas were determined to be 4.21% (ST-40), 0.15% (GT-10), and 2.55% (RT-70), 0.23% (AT-10) respectively (Figure 1H–N). In general, when examining Figure 1H–N, an increase in total acidity values was observed as a result of organic acid production and dead cell fragmentation during fermentation [39]. These results showed that organic acid production and microbial by-products, which occur in parallel with sugar consumption during fermentation, decrease pH and increase total acidity (Figure 1H–N).
Total phenolic compounds and antioxidant activity
The changes in total phenolic compounds for herbal and fruit Kombucha teas are given in Figure 1O–U. The phenolic concentration increased in almost all herbal (except for those of BT-40 and BT-70 (data not shown)) and fruit Kombucha tea experiments at the end of fermentation. The highest total phenolic compound values were determined to be 1522.90 mg GAE/L in ST-40, 1061.55 mg GAE/L in LT-10, and 3266.05 mg GAE/L in GT-40, and 1025.67 mg GAE/L in BT-10 for herbal Kombucha teas after 10 days fermentation. For fruit kombucha teas, the highest total phenolic compound values were calculated to be 1041.21 mg GAE/L in AT-40, 1016.99 mg GAE/L in RT-40, 1420.44 mg GAE/L in PT-40, and 1907.53 mg GAE/L in BBT-40 after 10 days fermentation. When considering all fermentations, the highest increase in total phenolic substance concentration was yielded as 215.44% with BBT-40. An increase in phenolic content with fermentation may be related to the enzymes of mixed kombucha culture, the acidic environment of kombucha tea, the synergistic effect of different components in tea, and the breakdown of complex phenolic compounds [40]. Moreover, the fact that phenolic components are more stable at acidic pH may cause differences in the total amount of phenolic substances during fermentation [41]. The decline in total phenolic concentration in black kombucha tea samples (BT-40 and BT-70) might be due to the characteristics of black tea of that season (data not shown). The total amount of phenolic substances in green tea is higher than in black tea [41]. Moreover, the percentage increase in total phenolic concentration in fruit kombucha teas (average 112.49%) is higher than in herbal kombucha teas (average 49.14%) (Figure 3). In summary, the total amount of phenolic compounds increased.
The antioxidant activity results are given in Figure 1O–U. The final DPPH scavenging ability decreased except for GT-70 (+4.46%), AT-10 (+5.99%), and AT-40 (+38.08%) assays. Decline values changed from 0.86 to 31.97% for herbal kombucha teas, and 2.92 to 17.50% for fruit kombucha teas. The maximal decrease was calculated to be 31.97% for LT-40. This decline could be about substrate and starter culture types. Because research about the influence of starter culture on kombucha fermentation, results showed that DPPH scavenging ability is slightly increased in the first 3 days and decreased after day 3 of fermentation [15]. Besides, the final antioxidant values were lower than the initial values of this research. The highest final DPPH scavenging ability value was 66.59% for GT-40. In a study [19], half of eight different Kombucha samples showed a regular increase in antioxidant activity, while the rest of them had irregular and variable results. It was predicted that Kombucha is affected by different environments, sugar quantity, fermentation conditions, and ionization change that occurs during fermentation may cause this variability. The highest initial and final DPPH scavenging ability results were calculated in green tea samples. All other herbal and fruit tea kombucha samples were lower than green tea samples. It is also reported that the highest DPPH scavenging ability is generally obtained from green tea samples [42]. Moreover, the change in antioxidant activity is affected by tea type and fermentation temperature. DPPH scavenging ability, despite decreases and increases during fermentation, generally increases at the end of fermentation [42].
Kinetic characterization
Based on the kinetic results given in Table 2, the minimum and maximum ∆S were determined as 8.52 g/L in ST-10 and 55.40 g/L in LT-70, respectively. Besides, as the sugar concentration in the fermentation medium increases, ∆S increases. However, this is not alone as an indicator that indicates the success of fermentation. Therefore, other kinetics regarding substrate depletion, QS, and η, were estimated. The results indicated that the lowest and highest values of QS were 1.29 g/L/d in ST-10 and 11.28 g/L in LT-70, which were the same as ∆S. Moreover, as the substrate concentration increases, QS increases. The η was also determined. The values of η ranged from 26.02 in BBT-70 to 100% in AT-10, RT-10, and PT-10. When the sugar amount added into the fermentation medium was minimum, almost all of the sugar was consumed by the Kombucha culture. However, when the substrate concentrations in the fermentation medium were 40 and 70 g/L, the η varied from 29.39% in ST-40 to 56.65% in GT-40 and 26.02% in BBT-70 to 72.78% in LT-70, respectively. Therefore, we can say that as the substrate concentration in the fermentation environment increases, η decreases in general.
Similar to the kinetics regarding substrate consumption, when the fermentation medium was enriched with 10 g/L sucrose, the minimum ∆X was 0.72 g/L for ST-10 whereas its maximum value was 2.20 g/L for PT-10. When 40 g/L sucrose was added into the fermentation medium, the lowest and highest values of ∆X were 1.74 and 4.71 g/L in ST-10 and RT-40, respectively. Similarly, when the substrate concentration in the medium was 70 g/L, the ∆X varied from 3.55 to 8.77g/L in BBT-70 and PT-70, respectively. Therefore, as the substrate concentration increases, ∆X increases. As for the QX, when the fermentation medium was supplemented with 10, 40, and 70 g/L of sucrose, the lowest and highest values of QX were calculated as 0.12 and 0.91 g/L/d (ST-10 and PT-10), 0.51 and 2.17 g/L/d (ST-40 and RT-40), and 0.14 and 1.66 g/L/d (LT-70 and PT-70), respectively. Between both the minimum and maximum QX values, the highest QX values were yielded when 40 g/L substrate was added into the medium. Moreover, when the fermentation medium was supplemented with 10, 40, and 70 g/L, the lowest values of YX/S were 0.06, 0.08, and 0.07 g/g whereas their highest values were 0.21, 0.20, and 0.20 g/g, respectively. The minimum and maximum values of YX/S at different substrate concentrations were highly close to each other. Besides, although ∆X increases depending on the substrate concentration, this situation was not valid for the YX/S.
Regarding the kinetic results related to the total acidity, the minimum and maximum ∆TA values were determined as 0.17 and 1.07%, 0.87 and 4.10%, and 1.42 and 2.77% of ST-10 and RT-10, GT-40 and ST-40, and GT-70 and RT-70 when 10, 40, and 70 g/L sucrose were inserted into the medium, respectively. Except for the ∆TA values of the Kombucha fermentation of ST, as the substrate concentration increased, ∆TA values increased (Table 2). Besides, the lowest and highest QTA values were found as 0.08 and 0.36%/d (ST-10 and RT-10), 0.27 and 0.60%/d (LT-40 and ST-40), and 0.28 and 0.82%/d (ST-70 and RT-70) with 10, 40, and 70 g/L of sucrose concentration added into the medium, respectively. As it is in the values of ∆TA, except for QTA values of ST, QTA values increased with an increase in substrate concentration (Table 2).
The lowest values of ∆PH were 130.66, 295.36, and 227.06 mg/L with 10, 40, and 70 g/L sucrose concentrations inserted into the RT-10, RT-40, and LT-70 media, respectively. Contrarily, its maximum values were yielded as 1217.60 mg/L from GT-10, 1311.92 mg/L from BBT-40, and 1268.40 mg/L from GT-70. Except for the ∆PH values of ST, GT, and BT, the highest ∆PH values were obtained when 40 g/L sucrose was used in the medium (Table 2). Additionally, the minimum and maximum values of QPH were 21.39 and 410.68 mg/L/d, 49.54 and 245.69 mg/L/d, and 48.14 and 264.16 mg/L/d for RT-10 and GT-10, LT-40 and GT-40, and LT-70 and GT-70, respectively. It was realized that the Kombucha teas from GT supplemented with 10, 40, and 70 g/L sucrose gave the highest phenolic substance amounts. Besides, as the substrate concentration in the GT-based medium increased, the values of QPH decreased. Conversely, the QPH increased with an increase in substrate concentration added into the ST- and PT-based media. For the rest of QPH, the maximum peak values of QPH were yielded when 40 g/L substrate concentration was added into the fermentation medium. Concerning the YPH/S, its lowest values were obtained to be 8.47, 10.28, and 4.10 mg PH/g substrate when the fermentation media were RT-10, RT-40, and LT-70, respectively. Maximum YPH/S values were also calculated as 100.38, 81.74, and 36.57 mg PH/g substrate for GT-10, BBT-40, and BBT-70, respectively. As the sugar concentration in the medium increases, the maximum YPH/S value decreases. Moreover, it was determined that YPH/S values decreased with an increase in the substrate levels of GT- and PT-based media. For the remaining media, except for that of the LT, the highest YPH/S peak values were yielded when the media were enriched with 40 g/L sucrose (Table 2).
Kinetic modeling
The observed values of total acidity were estimated by the LPM, while the actual values related to sugar depletion were predicted by the LM (Figure 2). Concerning the prediction of sugar depletion values, the observed and estimated sugar depletion curves were plotted vs. time in Figure 2. As indicated in Figure 2, ST, LT, GT, AT, RT, PT, and BBT, the experimental and estimated sugar depletion values were generally in good agreement, except for that of the Kombucha fermentation performed with ST supplemented with 40 g/L sucrose since its R2 value (0.6038) was lower than 0.75 (Table 3). Indeed, the experimental data on days 4–7 of fermentation were overestimated by the LM (Figure 2S,T). Also, if the R2 value is higher than 0.75, meaning that the model can be used to estimate the fermentation experimental data [43]. Therefore, the yielded R2 values were found between 0.7731 and 0.9750, except for R2 = 0.6038, demonstrating that the proposed model for substrate depletion fitted adequately the actual data of substrate depletion. Additionally, the values µm,S, and Sf were between 0.17 and 1.14 d−1 and 0.34 and 9.64 g/L, respectively. The minimum and maximum values of µm,S were obtained when the BBT supplemented with 40 and 10 g/L sucrose was used in the production of Kombucha tea, respectively. Besides, the highest µm,S values were achieved when 10 g/L sucrose was added to the fermentation media (Table 3). The lowest and highest Sf values were also yielded with ST supplemented with 10 g/L sucrose and RT supplemented with 70 g/L sucrose, respectively. Nevertheless, the values of Sf increased with an increase in sucrose concentration added into the fermentation media in general (Table 3). Mahdinia et al. [35] predicted the observed substrate depletion data of Menaquinoe-7 fermentation in the biofilm reactor with glucose- or glycerol-based medium using the LM. Based on the modeling results, it was declared that the R2 values of the process were determined between 0.953 and 0.991, indicating that the suggested models fitted well with the experimental substrate consumption data. The values of µm,S for glucose- and glycerol-based media were 0.059 and 0.054 h−1, respectively [35], which were all higher than those of this study (Table 3). Ilgın et al. [44] estimated the substrate consumption data of Aspergillus niger inulinase fermentation from carob extract under shake flask fermentation circumstances using the LM. From the calculations, it was reported that the values of µm,S, and Sf were found to be 0.062 h−1 and 0.93 g/L, respectively, showing that the µm, S value was greater than the results yielded from the current study while the Sf value was compatible with those of this study (Table 3). In another study in which A. niger inulinase fermentation of sugar beet molasses in the large-scale stirred tank bioreactor was taken place [45], the experimental data of substrate consumption were forecasted by using the LM, thus µm,S, and Sf values were computed as 0.042 h−1 and 1.18 g/L, respectively. It was determined that the computed µm,S, and Sf values were highly consistent with the present study (Table 3). Besides, it was reported that the proposed model successfully fitted the experimental data of substrate depletion with a high R2 value (R2 = 0.9778) [45].
The actual and estimated total acidity values were also plotted vs. time and shown in Figure 2. It was detected that the values of R2 ranged from 0.4809 to 0.9526. It can be said that those with R2 values higher than 0.75 (in this case they are ST-40, ST-70, LT-10, GT-10, GT-70, AT-10, AT-40, AT-70, RT-10, PT-10, PT-40, PT-70, BBT-10, and BBT-40) were adequately fitted by the LPM (Table 3). Therefore, most of the Kombucha fermentation from different tea extracts supplemented with different concentrations of sucrose was satisfactorily fitted by the LPM with the R2 value greater than 0.75. Moreover, α and β values, which can change based on the fermentation circumstances, were estimated (Table 3). If α ≠ 0 and β = 0, then the total acidity is associated with substrate consumption. If α = 0 and β ≠ 0, then the total acidity is non-associated with substrate consumption. The values of β varied from −0.0075 to 0.0076%/gS·d, which were so close to zero, while the values of α ranged from 0.0142 and 0.2584%/gS. The values of α are 5.87 to 360.19 times greater than those of β (Table 3). Therefore, we can say that the total acidity is associated with substrate consumption. Mahdinia et al. [35] studied the kinetic modeling of Menaquinoe-7 fabrication from glucose and glycerol in the biofilm reactor using the LPM. The model parameters of the LPM, which are α and β, were calculated to be −0.138 mg/g and 0.00010 mg/g/h for the production in the glucose-based medium and −0.089 mg/g and 0.00301 mg/g/h for the production in glycerol-based medium, respectively. Therefore, the values of α were 1380- and 29.57-fold higher than those of β, respectively, showing that Menaquinoe-7 fabrication was associated with substrate consumption [35], as it is in the current study. To the best of our knowledge, there is no study regarding the kinetic modeling of Kombucha fermentation using different tea extracts enriched with different concentrations of sucrose as a carbon source. Therefore, this study is important in terms of contributing to science because of the information it contains.
4. Conclusions
In the present study, Kombucha teas with different chemical compositions using different substrates were produced, and Kombucha fermentations performed were characterized and modeled kinetically. Based on the results, any type of herbal or fruit tea could be used as a substrate for Kombucha fermentation. Different Kombucha substrates resulted in different pH, total acids, biomass, sugar consumption, total phenolic content, and antioxidant activity. Besides, this diversity can contribute to the increase in the consumption of Kombucha by directing people to different Kombucha teas. Regarding modeling, the total acidity was related to substrate depletion. Moreover, both the experimental substrate consumption and total acidity data were adequately predicted by the suggested models. Thus, this study showed that Kombucha fermentation is suitable for all tea samples evaluated in the scope of the study and all tea samples have their characteristics, component, and sensory composition.
Author Contributions
Kubra Tarhan Kuzu Conceptualization, Investigation, Methodology, Project Administration, Writing—Original Draft Preparation; Gamze Aykut Conceptualization, Investigation, Methodology, Project Administration, Writing—Original Draft Preparation; Serap Tek Conceptualization, Investigation, Methodology, Project Administration, Writing—Original Draft Preparation; Ercan Yatmaz Writing—Review & Editing, Project Administration, Supervision, Formal Analysis; Mustafa Germec Writing—Review & Editing, Formal Analysis, Software, Modeling; Ibrahim Yavuz Writing—Review & Editing, Formal Analysis, Software, Modeling Irfan Turhan Writing—Review & Editing, Resources, Supervision, Conceptualization, Methodology.
Acknowledgments
The some part of this study was supported by the TUBITAK 2209-University Student Research Project Support Program.
Conflicts of Interest
On behalf of all authors, the corresponding author states that there is no conflict of interest.
Abbreviations
| Abbreviations | Full name |
| ISC | Initial sucrose concentration |
| R2 | Determination of coefficient |
| α and β | Empirical constants |
| N | Normal |
| HCl | Hydrochloric acid |
| LPM | Luedeking-Piret model |
| LM | Logistic model |
| GT | Green tea |
| ST | Sage tea |
| LT | Linden tea |
| BT | Black tea |
| BBT | Bilberry tea |
| RT | Rosehip tea |
| AT | Apple tea |
| PT | Pomegranate tea |
| NaOH | Sodium hydroxide |
| GAE | Gallic acid equivalents |
| DPPH | α, α-diphenyl-β-picrylhydrazyl |
| ∆S | Substrate consumption, g/L |
| QS | Maximum substrate consumption rate, g/L/d |
| η | Substrate utilization yield, % |
| ∆X | Biomass production, g/L |
| QX | Maximum biomass production rate, g/L/d |
| YX/S | Biomass yield, g biomass/g substrate |
| TA | Total acidity, % |
| QTA | Maximum total acidity production rate, %/d |
| ∆PH | Phenolics production, mg/L |
| QPH | Maximum phenolics production rate, mg/L/d |
| YPH/S | Phenolics yield, mg phenolics/g substrate |
| −dS/dt | Substrate consumption rate, g/L/d |
| µm,S | specific sugar consumption rate, 1/d |
| S | residual substrate concentration at the time “t”, g/L |
| Sm | maximum substrate concentration, g/L |
| dP/dt | total acidity rate, %/d |
| SAS | Statistical Analysis System |
References
- Dutta, H.; Paul, S.K. Kombucha drink: Production, quality, and safety aspects. In Production and Management of Beverages; Elsevier, 2019; pp. 259–288. [Google Scholar]
- Jayabalan, R.; Malbasa, R.V.; Loncar, E.S.; Vitas, J.S.; Sathishkumar, M. A review on kombucha tea: Microbiology, composition, fermentation, beneficial effects, toxicity, and tea fungus. Comprehensive Reviews in Food Science and Food Safety 2014, 13, 538–550. [Google Scholar] [CrossRef]
- Teoh, A.L.; Heard, G.; Cox, J. Yeast ecology of Kombucha fermentation. International Journal of Food Microbiology 2004, 95, 119–126. [Google Scholar] [CrossRef]
- Malbaša, R.; Lončar, E.; Djurić, M. Comparison of the products of Kombucha fermentation on sucrose and molasses. Food Chemistry 2008, 106, 1039–1045. [Google Scholar] [CrossRef]
- Şafak, S.; Mercan, N.; Aslim, B.; Beyatli, Y. A study on the production of poly-β-hydroxybutyrate by some eukaryotic microorganisms. Turkish Electronic Journal of Biotechnology 2002, 1, 11–17. [Google Scholar]
- Mayser, P.; Fromme, S.; Leitzmann, G.; Gründer, K. The yeast spectrum of the ‘tea fungus Kombucha’. Mycoses 1995, 38, 289–295. [Google Scholar] [CrossRef]
- Tsilo, P.H.; Basson, A.K.; Ntombela, Z.G.; Maliehe, T.S.; Pullabhotla, R.V. Isolation and optimization of culture conditions of a bioflocculant-producing fungi from Kombucha tea SCOBY. Microbiology Research 2021, 12, 950–966. [Google Scholar] [CrossRef]
- Greenwalt, C.; Steinkraus, K.; Ledford, R. Kombucha, the fermented tea: microbiology, composition, and claimed health effects. Journal of Food Protection 2000, 63, 976–981. [Google Scholar] [CrossRef]
- Kurtzman, C.P.; Robnett, C.J.; Basehoar-Powers, E. Zygosaccharomyces kombuchaensis, a new ascosporogenous yeast from ‘Kombucha tea’. FEMS Yeast Research 2001, 1, 133–138. [Google Scholar] [CrossRef] [PubMed]
- Liu, C.-H.; Hsu, W.-H.; Lee, F.-L.; Liao, C.-C. The isolation and identification of microbes from a fermented tea beverage, Haipao, and their interactions during Haipao fermentation. Food Microbiology 1996, 13, 407–415. [Google Scholar] [CrossRef]
- Chakravorty, S.; Bhattacharya, S.; Chatzinotas, A.; Chakraborty, W.; Bhattacharya, D.; Gachhui, R. Kombucha tea fermentation: Microbial and biochemical dynamics. International Journal of Food Microbiology 2016, 220, 63–72. [Google Scholar] [CrossRef] [PubMed]
- Chu, S.-C.; Chen, C. Effects of origins and fermentation time on the antioxidant activities of kombucha. Food Chemistry 2006, 98, 502–507. [Google Scholar] [CrossRef]
- Nummer, B.A. Kombucha brewing under the Food and Drug Administration Model Food Code: Risk analysis and processing guidance. Journal of Environmental Health 2013, 76, 8–11. [Google Scholar] [PubMed]
- Villarreal-Soto, S.A.; Beaufort, S.; Bouajila, J.; Souchard, J.P.; Taillandier, P. Understanding kombucha tea fermentation: a review. Journal of Food Science 2018, 83, 580–588. [Google Scholar] [CrossRef] [PubMed]
- Malbasa, R.V.; Loncar, E.S.; Vitas, J.S.; Canadanovic-Brunet, J.M. Influence of starter cultures on the antioxidant activity of kombucha beverage. Food Chemistry 2011, 127, 1727–1731. [Google Scholar] [CrossRef]
- Greenwalt, C.J.; Ledford, R.A.; Steinkraus, K.H. Determination and characterization of the antimicrobial activity of the fermented tea kombucha. LWT-Food Science and Technology 1998, 31, 291–296. [Google Scholar] [CrossRef]
- Battikh, H.; Bakhrouf, A.; Ammar, E. Antimicrobial effect of kombucha analogues. Lwt-Food Science and Technology 2012, 47, 71–77. [Google Scholar] [CrossRef]
- Bhattacharya, D.; Bhattacharya, S.; Patra, M.M.; Chakravorty, S.; Sarkar, S.; Chakraborty, W.; Koley, H.; Gachhui, R. Antibacterial activity of polyphenolic fraction of kombucha against enteric bacterial pathogens. Current Microbiology 2016, 73, 885–896. [Google Scholar] [CrossRef]
- Chu, S.C.; Chen, C.S. Effects of origins and fermentation time on the antioxidant activities of kombucha. Food Chemistry 2006, 98, 502–507. [Google Scholar] [CrossRef]
- Malbasa, R.; Loncar, E.; Djuric, M.; Dosenovic, I. Effect of sucrose concentration on the products of kombucha fermentation on molasses. Food Chemistry 2008, 108, 926–932. [Google Scholar] [CrossRef]
- Zubaidah, E.; Yurista, S.; Rahmadani, N. Characteristic of physical, chemical, and microbiological kombucha from various varieties of apples. In IOP Conference Series: Earth and Environmental Science; IOP Publishing, 2018; Volume 1, p. 012040. [Google Scholar]
- Tarhan, K. Use of different substrate resources in the production of kombucha tea. 2017. Available online: https://agris.fao.org/agris-search/search.do?recordID=TR2019000120 (accessed on 18 February 2023).
- Tamer, C.E.; Temel, Ş.G.; Suna, S.; Karabacak, A.Ö.; Özcan, T.; Ersan, L.Y.; Kaya, B.T.; Çopur, Ö.U. Evaluation of bioaccessibility and functional properties of kombucha beverages fortified with different medicinal plant extracts. Turkish Journal of Agriculture and Forestry 2021, 45, 13–32. [Google Scholar]
- Jayabalan, R.; Marimuthu, S.; Swaminathan, K. Changes in content of organic acids and tea polyphenols during kombucha tea fermentation. Food Chemistry 2007, 102, 392–398. [Google Scholar] [CrossRef]
- Battikh, H.; Chaieb, K.; Bakhrouf, A.; Ammar, E. Antibacterial and antifungal activities of black and green kombucha teas. Journal of Food Biochemistry 2013, 37, 231–236. [Google Scholar] [CrossRef]
- Lončar, E.S.; Kanurić, K.G.; Malbaša, R.V.; Đurić, M.S.; Milanović, S.D. Kinetics of saccharose fermentation by Kombucha. Chemical Industry and Chemical Engineering Quarterly 2014, 20, 345–352. [Google Scholar] [CrossRef]
- Ismaiel, A.A.; Bassyouni, R.H.; Kamel, Z.; Gabr, S.M. Detoxification of patulin by kombucha tea culture. CyTA-Journal of Food 2016, 14, 271–279. [Google Scholar] [CrossRef]
- Germec, M.; Karhan, M.; Demirci, A.; Turhan, I. Kinetic modeling, sensitivity analysis, and techno-economic feasibility of ethanol fermentation from non-sterile carob extract-based media in Saccharomyces cerevisiae biofilm reactor under a repeated-batch fermentation process. Fuel 2022, 324, 124729. [Google Scholar] [CrossRef]
- Alboreadi, M.A.; Al-Najdawi, M.M.; Jarrar, Q.B.; Moshawih, S. Evaluation of hair growth properties of topical kombucha tea extracts. Advances in Traditional Medicine 2021, 1–7. [Google Scholar] [CrossRef]
- Kruk, M.; Trząskowska, M.; Ścibisz, I.; Pokorski, P. Application of the “SCOBY” and Kombucha tea for the production of fermented milk drinks. Microorganisms 2021, 9, 123. [Google Scholar] [CrossRef] [PubMed]
- Cemeroğlu, B. Gıda analizleri. Gıda Teknolojisi Derneği Yayınları. Bizim Grup Basımevi: Ankara, Turkey, 2010. [Google Scholar]
- Germec, M.; Karahalil, E.; Yatmaz, E.; Tari, C.; Turhan, I. Effect of process parameters and microparticle addition on polygalacturonase activity and fungal morphology of Aspergillus sojae. Biomass Conversion and Biorefinery 2021. [Google Scholar] [CrossRef]
- Miller, G.L. Use of dinitrosalicylic acid reagent for determination of reducing sugar. Analytical Chemistry 1959, 31, 426–428. [Google Scholar] [CrossRef]
- Škerget, M.; Kotnik, P.; Hadolin, M.; Hraš, A.R.; Simonič, M.; Knez, Ž. Phenols, proanthocyanidins, flavones and flavonols in some plant materials and their antioxidant activities. Food Chemistry 2005, 89, 191–198. [Google Scholar] [CrossRef]
- Mahdinia, E.; Mamouri, S.J.; Puri, V.M.; Demirci, A.; Berenjian, A. Modeling of vitamin K (Menaquinoe-7) fermentation by Bacillus subtilis natto in biofilm reactors. Biocatalysis and Agricultural Biotechnology 2019, 17, 196–202. [Google Scholar] [CrossRef]
- Watawana, M.I.; Jayawardena, N.; Gunawardhana, C.B.; Waisundara, V.Y. Health, wellness, and safety aspects of the consumption of kombucha. Journal of Chemistry 2015. [Google Scholar] [CrossRef]
- Muhialdin, B.; Osman, F.; Muhamad, R.; Che Wan Sapawi, C.; Anzian, A.; Voon, W.; Hussin, A. Effects of sugar sources and fermentation time on the properties of tea fungus (kombucha) beverage. International Food Research Journal 2019, 26. [Google Scholar]
- Kallel, L.; Desseaux, V.; Hamdi, M.; Stocker, P.; Ajandouz, E. Insights into the fermentation biochemistry of kombucha teas and potential impacts of kombucha drinking on starch digestion. Food Research International 2012, 49, 226–232. [Google Scholar] [CrossRef]
- Loncar, E.S.; Kanuric, K.G.; Malbasa, R.V.; Duric, M.S.; Milanovic, S.D. Kinetics of saccharose fermentation by kombucha. Chemical Industry & Chemical Engineering Quarterly 2014, 20, 345–352. [Google Scholar] [CrossRef]
- Bhattacharya, S.; Gachhui, R.; Sil, P.C. Effect of kombucha, a fermented black tea in attenuating oxidative stress mediated tissue damage in alloxan induced diabetic rats. Food and Chemical Toxicology 2013, 60, 328–340. [Google Scholar] [CrossRef]
- Emiljanowicz, K.E.; Malinowska-Pańczyk, E. Kombucha from alternative raw materials-the review. Critical reviews in food science and nutrition 2020, 60, 3185–3194. [Google Scholar] [CrossRef] [PubMed]
- Fu, C.L.; Yan, F.; Cao, Z.L.; Xie, F.Y.; Lin, J. Antioxidant activities of kombucha prepared from three different substrates and changes in content of probiotics during storage. Food Science and Technology 2014, 34, 123–126. [Google Scholar] [CrossRef]
- Carlson, H.A. Check your confidence: size really does matter. Journal of Chemical Information and Modeling 2013, 53, 1837–1841. [Google Scholar] [CrossRef] [PubMed]
- Ilgın, M.; Germec, M.; Turhan, I. Statistical and kinetic modeling of Aspergillus niger inulinase fermentation from carob extract and its partial concentration. Industrial Crops and Products 2020, 156, 112866. [Google Scholar] [CrossRef]
- Germec, M.; Turhan, I. Kinetic modeling and sensitivity analysis of inulinase production in large-scale stirred tank bioreactor with sugar beet molasses-based medium. Biochemical Engineering Journal 2021, 176, 108201. [Google Scholar] [CrossRef]
Figure 1.
Change of substrate concentration, biomass production, pH, total acidity, phenolics, and antioxidant activity during Kombucha fermentation performed on media containing different initial sugar concentrations. A, H, and O: Sage tea (ST); B, I, and Q: Linden tea (LT); C, J, and P: Green tea (GT); D, K, and R: Apple tea (AT); E, L, and S: Rosehip tea (RT); F, M, and T: Pomegranate tea (PT); and G, N, and U: Bilberry tea (BBT).
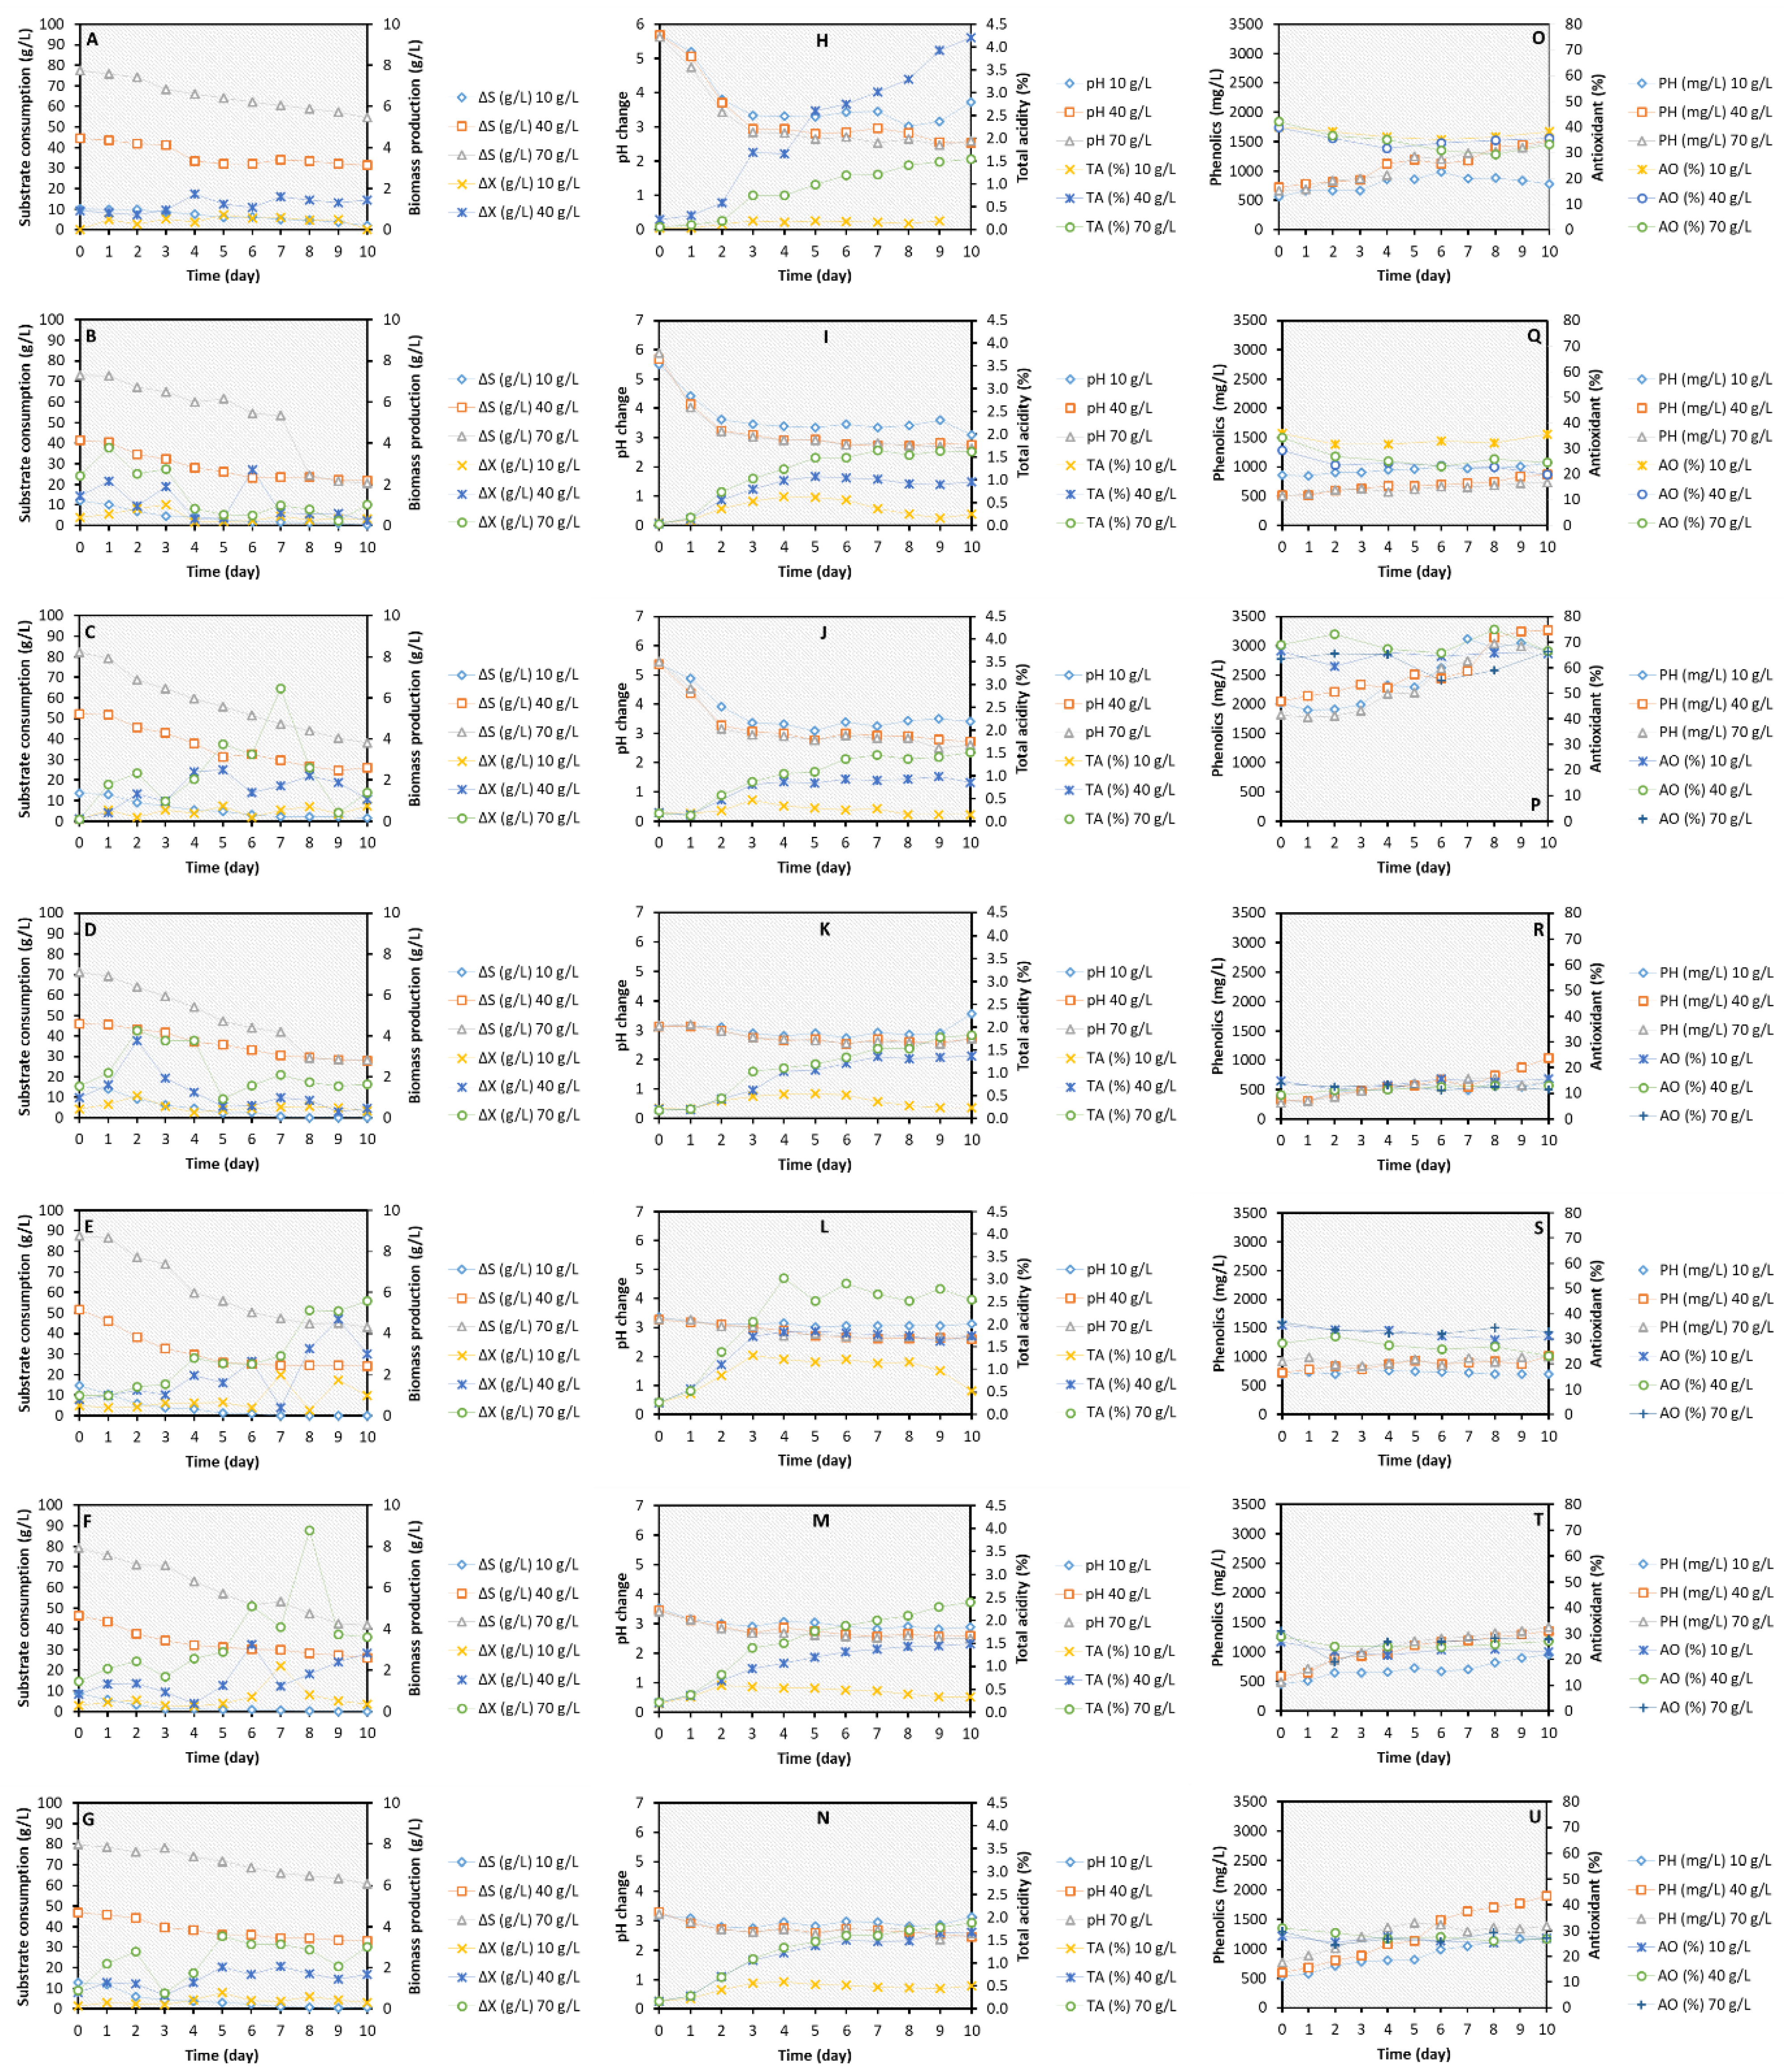
Figure 2.
Substrate consumption and total acidity curves fitted by the LM and LPM.
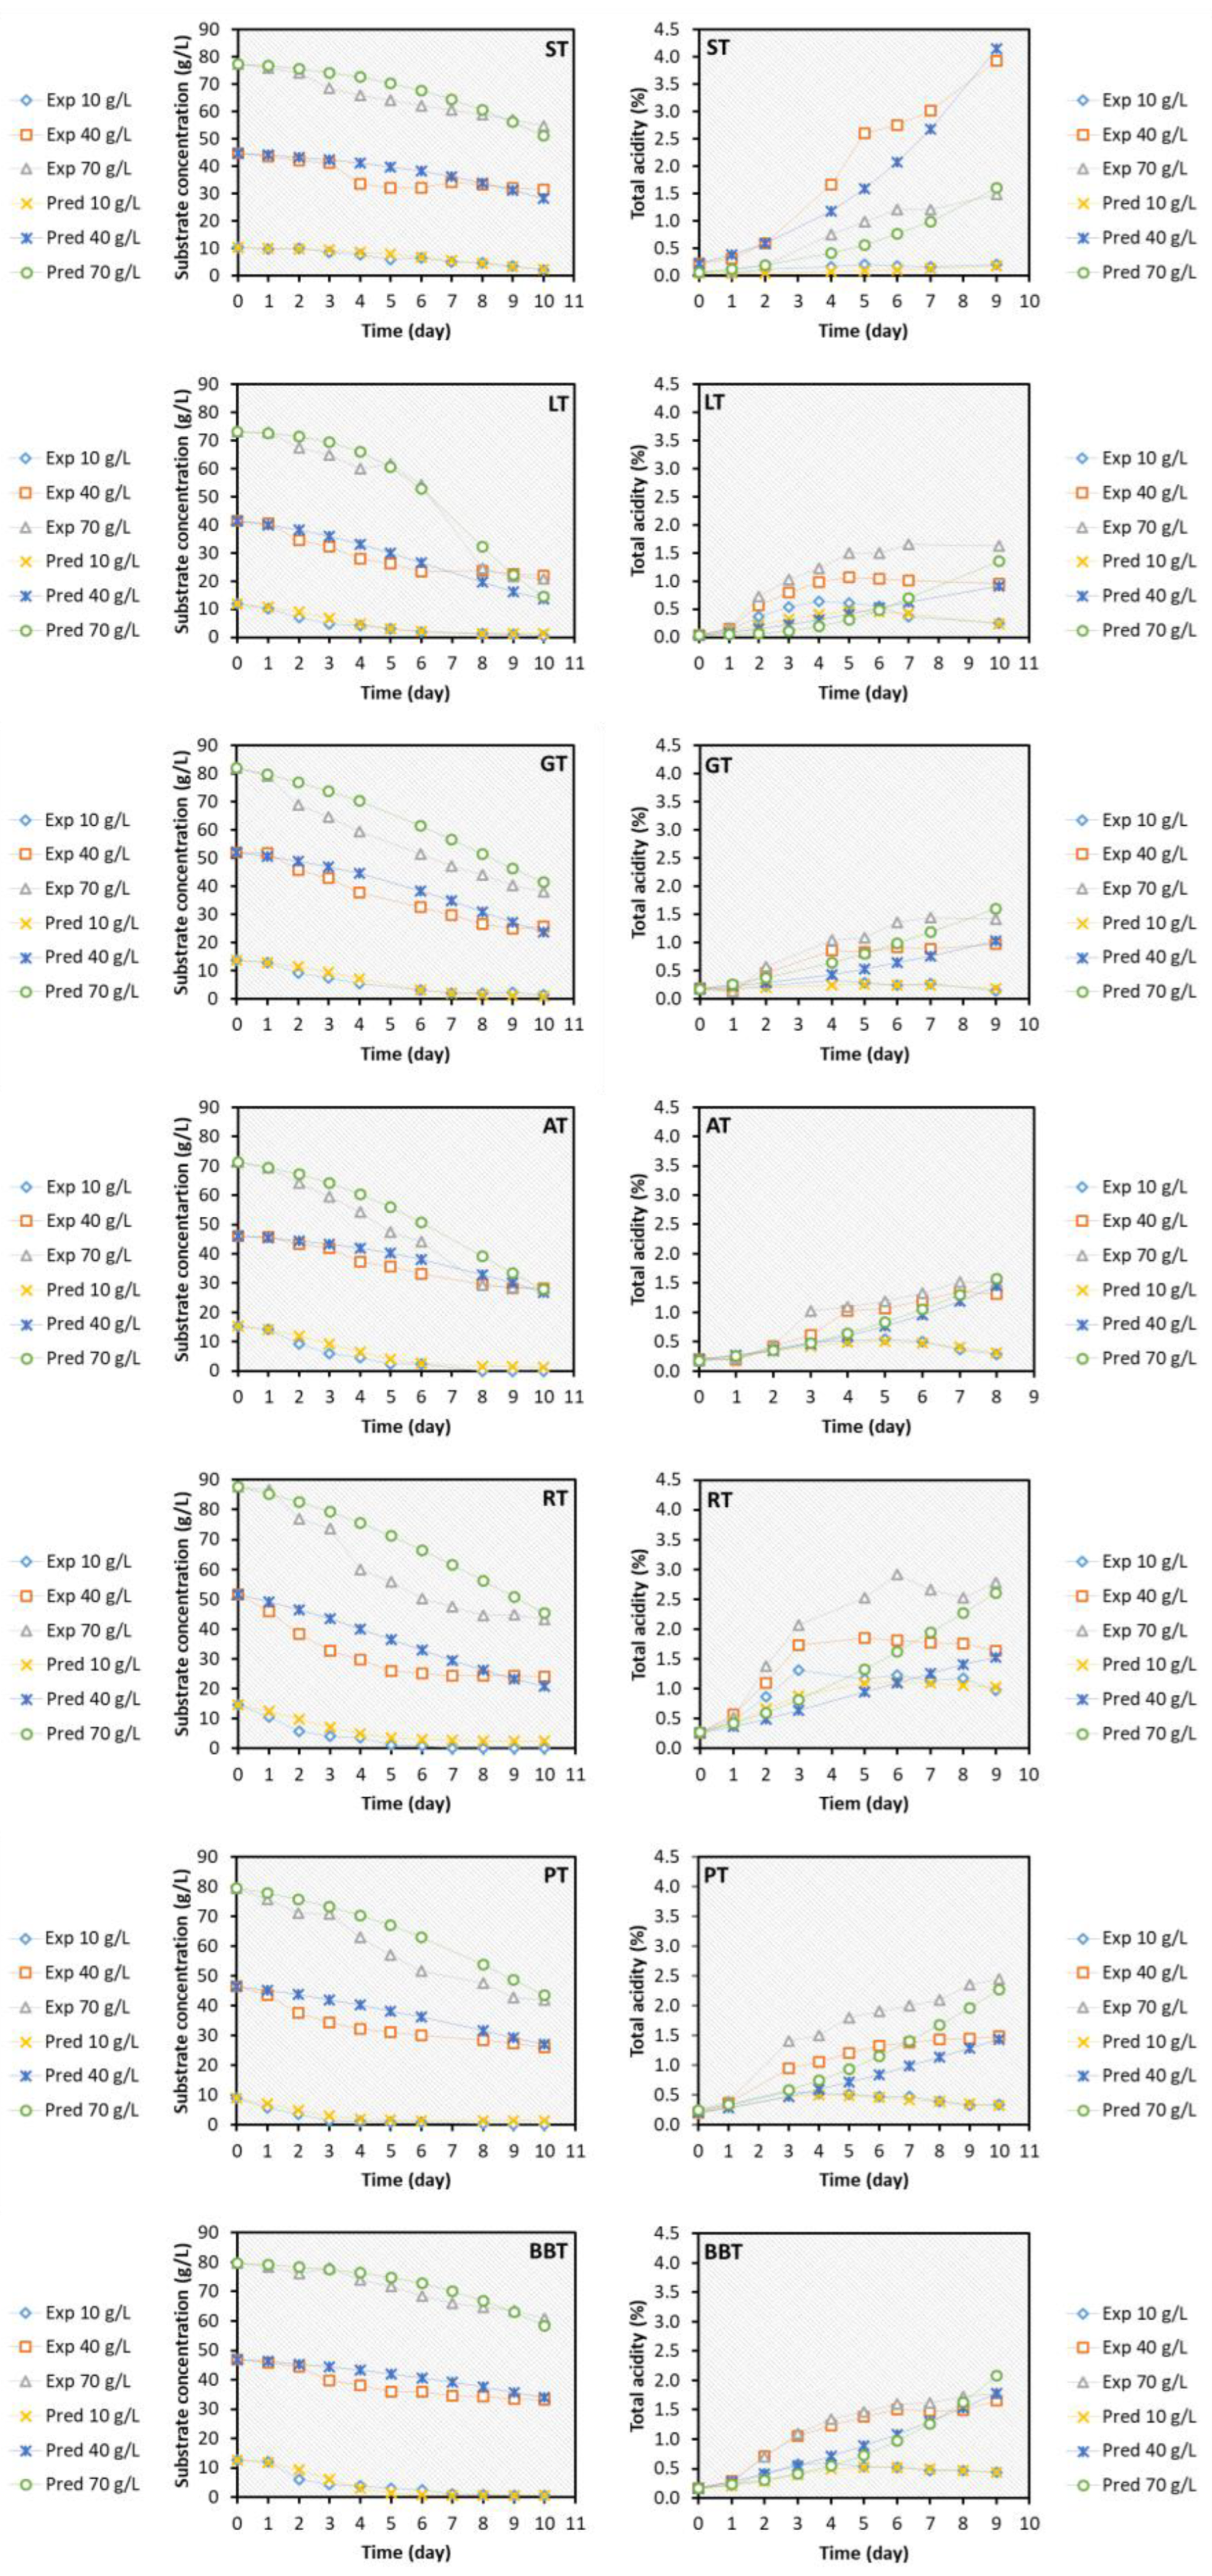

Table 1.
Sample code system.
| Tea origin | Tea | Initial sugar concentration (g/L) | ||
|---|---|---|---|---|
| 10 | 40 | 70 | ||
| Herbal tea | Sage tea (ST) | ST-10 | ST-40 | ST-70 |
| Linden tea (LT) | LT-10 | LT-40 | LT-70 | |
| Green tea (GT) | GT-10 | GT-40 | GT-70 | |
| Black tea (BT) | BT-10 | BT-40 | BT-70 | |
| Fruit tea | Apple tea (AT) | AT-10 | AT-40 | AT-70 |
| Rosehip tea (RT) | RT-10 | RT-40 | RT-70 | |
| Pomegranate tea (PT) | PT-10 | PT-40 | PT-70 | |
| Bilberry tea (BBT) | BBT-10 | BBT-40 | BBT-70 | |
Table 2.
Kinetic parameters of Kombucha fermentation performed with extracts from different types of tea with various initial sugar concentrations.
Table 2.
Kinetic parameters of Kombucha fermentation performed with extracts from different types of tea with various initial sugar concentrations.
| Tea | [Substrate] | Kinetic parameters | ||||||||||
|---|---|---|---|---|---|---|---|---|---|---|---|---|
| ∆S (g/L) | QS (g/L/d) | η (%) | ∆X (g/L) | QX (g/L/d) | YX/S (g/g) | ∆TA (%) | QTA (%/d) | ∆PH (mg/L) | QPH (mg/L/d) | YPH/S (mg/g) | ||
| ST | 10 g/L | 8.52 | 1.29 | 79.48 | 0.72 | 0.12 | 0.08 | 0.17 | 0.08 | 445.96 | 97.18 | 52.34 |
| 40 g/L | 13.10 | 3.71 | 29.39 | 1.74 | 0.51 | 0.13 | 4.10 | 0.60 | 883.17 | 169.75 | 67.42 | |
| 70 g/L | 26.62 | 4.05 | 32.71 | 3.96 | 0.94 | 0.15 | 1.51 | 0.28 | 900.31 | 189.07 | 33.82 | |
| LT | 10 g/L | 11.66 | 2.72 | 97.25 | 1.02 | 0.22 | 0.09 | 0.59 | 0.17 | 242.12 | 26.80 | 20.77 |
| 40 g/L | 19.85 | 4.00 | 47.40 | 2.72 | 1.20 | 0.14 | 1.04 | 0.27 | 399.65 | 49.54 | 20.13 | |
| 70 g/L | 55.40 | 11.28 | 72.78 | 3.80 | 0.14 | 0.07 | 1.63 | 0.31 | 227.06 | 48.14 | 4.10 | |
| GT | 10 g/L | 12.13 | 2.40 | 88.80 | 0.74 | 0.26 | 0.06 | 0.35 | 0.15 | 1217.60 | 410.68 | 100.38 |
| 40 g/L | 32.43 | 4.90 | 56.65 | 2.52 | 0.78 | 0.08 | 0.87 | 0.33 | 1215.90 | 345.69 | 37.49 | |
| 70 g/L | 44.07 | 6.34 | 53.72 | 6.46 | 1.22 | 0.15 | 1.42 | 0.37 | 1268.40 | 264.16 | 28.78 | |
| AT | 10 g/L | 15.75 | 2.82 | 100.00 | 1.09 | 0.34 | 0.07 | 0.34 | 0.15 | 321.98 | 64.14 | 20.44 |
| 40 g/L | 18.61 | 3.07 | 39.89 | 3.76 | 1.39 | 0.20 | 1.18 | 0.27 | 785.45 | 159.90 | 42.21 | |
| 70 g/L | 48.39 | 5.28 | 63.15 | 4.28 | 1.37 | 0.09 | 1.64 | 0.41 | 466.38 | 74.71 | 9.64 | |
| RT | 10 g/L | 15.43 | 3.65 | 100.00 | 2.01 | 0.23 | 0.13 | 1.07 | 0.36 | 130.66 | 21.39 | 8.47 |
| 40 g/L | 28.74 | 6.37 | 54.33 | 4.71 | 2.17 | 0.16 | 1.61 | 0.49 | 295.36 | 76.28 | 10.28 | |
| 70 g/L | 45.66 | 8.32 | 51.38 | 5.60 | 1.31 | 0.12 | 2.77 | 0.82 | 255.86 | 56.83 | 5.60 | |
| PT | 10 g/L | 10.33 | 2.47 | 100.00 | 2.20 | 0.91 | 0.21 | 0.39 | 0.20 | 549.89 | 95.36 | 53.23 |
| 40 g/L | 21.04 | 3.67 | 44.69 | 3.25 | 1.43 | 0.15 | 1.30 | 0.30 | 800.04 | 101.66 | 38.02 | |
| 70 g/L | 42.92 | 6.36 | 50.61 | 8.77 | 1.66 | 0.20 | 2.18 | 0.34 | 930.94 | 166.20 | 21.69 | |
| BBT | 10 g/L | 12.67 | 2.54 | 95.62 | 0.81 | 0.31 | 0.06 | 0.44 | 0.18 | 655.20 | 95.51 | 51.71 |
| 40 g/L | 16.05 | 3.07 | 32.56 | 2.07 | 0.70 | 0.13 | 1.52 | 0.39 | 1311.92 | 187.92 | 81.74 | |
| 70 g/L | 21.41 | 3.24 | 26.02 | 3.55 | 1.40 | 0.17 | 1.73 | 0.41 | 782.90 | 178.13 | 36.57 | |
Table 3.
The model parameters calculated for kinetically modeling the Kombucha fermentation.
| Tea | [Substrate] | Kinetics for substrate consumption | Kinetics for acidity | ||||||
|---|---|---|---|---|---|---|---|---|---|
| µm,S (1/d) | Sm (g/L) | Sf (g/L) | R2 | β (%/gS·d) | α (%/gS) | α > β Fold | R2 | ||
| ST | 10 (g/L) | 0.4738 | 10.24 | 0.34 | 0.9438 | 0.0001 | 0.0201 | 360.19 | 0.5675 |
| 40 (g/L) | 0.2752 | 44.58 | 1.87 | 0.6038 | 0.0076 | 0.2584 | 34.00 | 0.9064 | |
| 70 (g/L) | 0.2864 | 77.45 | 2.54 | 0.8572 | 0.0013 | 0.0662 | 49.85 | 0.8481 | |
| LT | 10 (g/L) | 0.7821 | 11.99 | 1.19 | 0.9672 | -0.0058 | 0.0631 | 10.91 | 0.8060 |
| 40 (g/L) | 0.3462 | 41.42 | 3.89 | 0.8055 | -0.0006 | 0.0343 | 60.27 | 0.5337 | |
| 70 (g/L) | 0.5947 | 73.16 | 0.83 | 0.9655 | 0.0004 | 0.0211 | 55.41 | 0.4809 | |
| GT | 10 (g/L) | 0.7168 | 13.62 | 0.84 | 0.9487 | -0.0024 | 0.0142 | 5.87 | 0.7586 |
| 40 (g/L) | 0.2909 | 52.03 | 4.44 | 0.9185 | 0.0005 | 0.0315 | 63.17 | 0.7220 | |
| 70 (g/L) | 0.2503 | 82.03 | 9.18 | 0.9413 | 0.0001 | 0.0394 | 282.80 | 0.8259 | |
| AT | 10 (g/L) | 0.7798 | 15.34 | 1.24 | 0.9636 | -0.0075 | 0.0468 | 6.24 | 0.9228 |
| 40 (g/L) | 0.2757 | 46.12 | 2.46 | 0.9012 | 0.0019 | 0.0863 | 45.75 | 0.8479 | |
| 70 (g/L) | 0.3324 | 71.27 | 5.07 | 0.9563 | 0.0015 | 0.0365 | 23.65 | 0.8251 | |
| RT | 10 (g/L) | 0.7978 | 14.64 | 2.49 | 0.9671 | -0.0030 | 0.0876 | 29.15 | 0.8465 |
| 40 (g/L) | 0.2765 | 51.46 | 9.47 | 0.7731 | -0.0003 | 0.0475 | 145.00 | 0.6153 | |
| 70 (g/L) | 0.2459 | 87.58 | 9.64 | 0.8645 | -0.0006 | 0.0671 | 110.88 | 0.7225 | |
| PT | 10 (g/L) | 1.0969 | 8.94 | 1.39 | 0.9750 | -0.0039 | 0.0554 | 14.30 | 0.9526 |
| 40 (g/L) | 0.2011 | 46.40 | 6.97 | 0.8137 | 0.0008 | 0.0568 | 75.30 | 0.8141 | |
| 70 (g/L) | 0.2589 | 79.37 | 6.13 | 0.9332 | 0.0013 | 0.0493 | 39.13 | 0.8193 | |
| BBT | 10 (g/L) | 1.1422 | 12.71 | 0.52 | 0.9166 | -0.0023 | 0.0371 | 16.34 | 0.7676 |
| 40 (g/L) | 0.1671 | 46.97 | 4.90 | 0.8257 | 0.0010 | 0.1349 | 129.31 | 0.7937 | |
| 70 (g/L) | 0.3043 | 79.67 | 1.49 | 0.9088 | 0.0008 | 0.1122 | 135.44 | 0.6790 | |
Disclaimer/Publisher’s Note: The statements, opinions and data contained in all publications are solely those of the individual author(s) and contributor(s) and not of MDPI and/or the editor(s). MDPI and/or the editor(s) disclaim responsibility for any injury to people or property resulting from any ideas, methods, instructions or products referred to in the content. |
© 2023 by the authors. Licensee MDPI, Basel, Switzerland. This article is an open access article distributed under the terms and conditions of the Creative Commons Attribution (CC BY) license (http://creativecommons.org/licenses/by/4.0/).
Copyright: This open access article is published under a Creative Commons CC BY 4.0 license, which permit the free download, distribution, and reuse, provided that the author and preprint are cited in any reuse.


