

Submitted:
12 June 2023
Posted:
12 June 2023
You are already at the latest version
Abstract
Health related quality of life’s (HRQoL) different domains of functioning can serve as a good prognosticator of later life’s outcomes for children and adolescents. Understanding associated factors is crucial for promoting better health and life satisfaction. This study aimed to investigate the impact of socio-economic status (SES), physical activity (PA) and cardio-fitness on the Health-Related Quality of Life (HRQoL) in 224 Italian early adolescents attending secondary school in the Emilia-Romagna region located in northern Italy. The present cross-sectional study included measures of SES, demographic factors, cardio-fitness measures and self-reported PA levels. In a multivariate model, younger students and females reported higher HRQoL (β=-0.139, P<.05, 95% CI: -0.254 – -0.023 and β=0.142, P<.05, 95% CI: 0.011 – 0.273 respectively). Having both parents employed and having higher familiar educational status resulted in higher HRQoL. Greater engagement in routine PA was positively associated with HRQoL (β=0.429, P<.001, 95% CI: 0.304 – 0.554). Endurance (speed) was positively associated with HRQoL (β=0.221, P<.01, 95% CI: 0.087 – 0.355) and students with longer times on the shuttle run reported less HRQoL (β=-0.207, P<.01, 95% CI: -0.337 – -0.077). Findings reinforced the importance of promoting regular PA among students and addressing SES disparities to improve HRQoL. The study suggests a focus on expanding research measures and evaluating targeted PA interventions for a more comprehensive understanding of children’s well-being. These findings highlight the crucial roles of demographic, PA and cardio-fitness measures in child’s HRQoL, thus providing relevant information for stakeholders who work in the education, public health, and health policy sectors.
Keywords:
Public Health
; Quality of Life
; Adolescents
; Physical Activity
1. Introduction
The construct of health-related quality of life (HRQoL) represents a subjective interpretation of an individual’s well-being. As it is generally used, HRQoL encompasses a person’s health status as well as non-medical aspects of functioning including emotional, social, and cognitive functioning [1]. In general, most medical and health professionals consider HRQoL as a valid and useful barometer of how happy a person is and how satisfied with life they may be [2]. Since its wider adoption in the medical and clinical literature in the 1960s, the concept of HRQoL has proven useful to assess satisfaction with treatment and disease remediation in a wide range of medical conditions. The idea behind HRQoL is that a person’s health is not merely the absence of disease, but is more holistic and includes their physical, mental, and social well-being [2]. It is this fitness of mind and body that gives HRQoL a unique place in the various literatures attending to well-being, happiness, and life satisfaction [2]. The World Health Organization (WHO) Quality of Life Group set the tone for how HRQoL is conceptualized defining quality of life as “the individual’s perception of their position in life in the context of the culture and value systems in which they live and in relation to their goals, expectations, standards and concerns” [1]. Accordingly, HRQoL is both an “ideal” and also a means to assess a person’s state of satisfaction whether prior to illness, during treatment or after recovery [3]. From a measurement standpoint, HRQoL assesses important aspects of health that are subjective and not detected by traditional physiological and clinical assessments. In this respect, HRQoL is regarded as multidimensional [4], extending beyond a person’s reflection on their physical condition to include an appraisal of their emotional and psychosocial functioning in addition to their health and well-being [5,6].
Although much of the early work using the WHO perspective emphasized health in relationship to functional status and disability, both conceptual models of HRQoL and assessment strategies now incorporate both individual and environmental factors that influence well-being [7]. These latter refinements incorporate a more “ecological” perspective consistent with biopsychosocial meta-theories of human development [8]. The inclusive nature of HRQoL has led many to consider it an organizing construct that incorporates the qualities and conditions of an individual’s life, their subjective satisfaction, expectations and values that guide their life [9].
From childhood onward, HRQoL takes on special meaning. During the early adolescent years, in particular, the growing child experiences rapid physical, cognitive, emotional, and social development. These maturational changes along with powerful socialization factors can influence a person’s growth and development and contribute to their well-being including setting the tone for later life adjustment. Thus, assessing HRQoL can provide rich and meaningful insight into the mind and world of young children, particularly with respect to different aspects of their psychosocial functioning. Studies of HRQoL in children and adolescents have produced a myriad of findings. Most of the studies have been disease-specific, for example, emphasizing chronic conditions such as diabetes, asthma [10], cancer [11], and obesity [12]. This line of inquiry has been expanded to include learning disabilities [13] and mental health [14]. Other studies have formulated HRQoL measures for epidemiological and public health purposes where the objective is gathering population-based data to inform policy and decision-making [15].
One consistent finding from previous research has been the positive association between physical activity (PA) and HRQoL in children and adolescents [16]. This finding most likely results from the function of PA because it can improve a person’s outlook on life, leading to subjective reports of more favorable well-being. Several studies have shown that regular engagement in PA is associated with better physical, mental, and social health outcomes [17–19]. Additionally, higher levels of PA have been linked to improved self-esteem and decreased symptoms of anxiety and depression in both children and adolescents [20]. A positive relationship between PA and HRQoL is particularly relevant given consistent findings that young children today are becoming increasingly more sedentary than ever before [21]. Thus, promoting regular PA may be an effective strategy to improve HRQoL in children and adolescents.
Socioeconomic (SES) factors may also bear on both a child’s engagement in PA as well as their HRQoL [22,23]. This relationship arises because HRQoL reflects the status of a person against some standard of living. As a result, SES-related measures such as family income, parental education, family structure, and social support (as an indicator of social capital) may bear on whether a child is happy, content, balanced, and feeling they have sufficient resources to obtain a high quality of life [24–26].
Studies show that children and adolescents from lower SES backgrounds who experience some form of material deprivation have poorer HRQoL than their peers from higher SES backgrounds [27]. This follows the assumption that a social class gradient contributes to different HRQoL in children as it does with adult health [28]. In support of this contention, parental education has been found to be positively associated with HRQoL, with higher levels of education being linked to better HRQoL in children and adolescents [29]. In addition to education, family affluence may contribute to HRQoL [30]. This arises because families with more social capital and resources can afford to engage their child in sport clubs that reinforce physical activities. This may arise because of accessibility to parks, the relative safety of neighborhoods, and available resources to support club activities for children. Conversely, families that face chronic adversity and who live in under-resourced neighborhoods cannot access the social and material resources that support organized sports and expose their children to health-engendering activities. As an extension of this premise, social support, including family and peer support, has been identified as an important factor in promoting HRQoL in younger populations [31]. The latter connection may reflect the advantages of social skills garnered in the presence of family and friends, higher self-concept, and social networks that buffer children from adversity and stressful life events. When surrounded by supportive family and friends, children tend to be optimistic and have a better outlook on life.
The “ACtive Breaks in Secondary School Children: The BRAVE Study" is a quasi-experimental study to implement and evaluate the efficacy of a PA intervention conducted in a secondary school setting. The study commenced in 2022 and wasmanaged by teachers and peer educators. The PA sessions were conducted as mini “active breaks” during classroom time and coordinated to reinforce much of the learning materials (i.e., counting jumping jacks was tied to solving math problems). The present study aims to investigate several determinants of HRQoL, focusing specifically on SES and healthy lifestyle (PA and cardio-fitness performance) factors among Italian middle school students participating in the ACtive Breaks intervention. To accomplish this, participants were administered the Physical Activity Questionnaire for Older Children (PAQ-A) [32] and the KIDSCREEN-27 questionnaire [33]. Both instruments are very cost-effective and epidemiological assessments have been validated with similar age populations. To the best of our knowledge this is the first study to explore the combined effects of SES and PA on HRQoL in Italian middle school students. As such, the study is poised to fill an important gap in the literature and provide novel insights into the relations of PA, cardio-fitness and SES with HRQoL in this population. Ultimately, the results of this investigation may inform the development of targeted interventions aimed at promoting healthy development and well-being in this important age group.
2. Materials and Methods
2.1. Study Design and Participant
The BRAVE study involved students attending a secondary school located in Valsamoggia (Bologna), part of the Emilia Romagna region of northeastern Italy. The Bioethics Committee of the University of Bologna approved the "BRAVE" project on 18 March 2022 (Protocol n. 63053). The study was conducted in accordance with the Declaration of Helsinki. The research team obtained written informed consent from the parents of participating children.
Participants were recruited from the 1 to 3 grades (corresponding to ages 12 to 14) . Inclusion criteria stipulated that students were free of any health issues or physical disabilities that might interfere with or impact their PA performance. The study adhered to the STROBE guidelines [34].
2.2. Instruments
Data from the students was collected in January 2023 using a self-report questionnaire assessing SES along with basic demographic information and general PA. Separately, using a standardized protocol including an extensive training session, physical education teachers collected physical fitness performance data.
2.3. Main Outcome Measure: Health-Related Quality of Life
An Italian version of the KIDSCREEN-27 questionnaire [35] was used to assess the students’ HRQoL. The KIDSCREEN-27 is a psychometrically validated and widely-used epidemiological instrument appropriate for children and adolescents between 8 and 18 years of age [33]. It consists of 27 self-report items that assess perceived health status and quality of life broken down into five domains: physical well-being (5 items: MacDonald’s ω = 0.80 for reliability) (McDonald, 1999), psychological well-being (7 items: ω = 0.89), parent relations and autonomy (7 items: ω = 0.88), social support and peers (4 items: ω = 0.81), and school environment (4 items: ω = 0.72). The instrument has been tested in relatively large samples, demonstrated good scale reliability, both construct and criterion validity in various cultures and when translated into several languages, rendering it a valuable tool for both clinical and research purposes in the field of pediatric health [33].
The physical well-being domain assesses energy and vitality (e.g., "Did you feel full of energy?"), physical activity (e.g., "Were you able to run as fast as you wanted?"), and general health (e.g., “How do you rate yours health?”). The psychological well-being domain evaluates psychological functioning including self-esteem (e.g., “Were you happy being the way you are?"), emotional well-being (e.g., "Did you feel lonely?"), and body image (e.g., "Did you feel happy with the way you look?"). The parent relations and autonomy domain assesses aspects related to the child's relationship with their parents, including communication (e.g., “Your parents have you devoted enough time?”), support ("Did you feel understood by your parents?"), and parental control ("Did your parents let you make your own decisions?").
The social support and peer domain assesses the child's relationships with their peers ("Did you feel supported by your friends?") and social environment (e.g., "Did you have fun with your friends?"). The school environment domain assesses school climate (e.g., ”Did you feel happy at school?”), teacher support (e.g., "Did you have good relationships with your teachers?"), and academic performance (e.g., "Were you satisfied with your grades?"). Each item on the KIDSCREEN-27 questionnaire is scored on a five-point Likert scale ranging from 1 ("never") to 5 ("always”), with scores for each domain calculated separately to provide an overall assessment of the child's HRQoL (min 27 [low quality of life]; max 135 [high quality of life]).
2.4. Physical Activity Questionnaire for Older Children
The Italian version of the Physical Activity Questionnaire for Older Children (PAQ-A)[36,37] was used to assess the childrens’ PA levels. The PAQ-A consists of nine items probing PA levels over the past 7-day timeframe. Children are instructed there are no right or wrong answers and to answer the questions honestly. The nine questions assess participation in physical activities that cause sweating or heavy breathing, daily activity duration, sedentary behavior, active commuting, fitness improvement efforts, sports proficiency, physical education class participation, non-school related screen time, and extracurricular activities. Responses are rated on a 5-point Likert scale ranging from 1 (“never”) to 5 (“always”). The total score of PAQ-A ranged from 0 to 5 point.
2.5. Physical Fitness Measurements
Physical fitness measures were collected using the 6-minute Cooper test (in meters) [38,39], the shuttle run test [40], and standing long jump (in centimeters) [41,42]. Cardiovascular fitness and PA are closely related and both provide key indicators of health outcomes [43–45]. The 6-minute Cooper test was conducted on a 28 × 15 meter track, where participants were instructed to run as far as possible within 6 minutes (i.e., endurance). The shuttle run 4x10 test (4 10 SRT) [40] measures speed, agility, and coordination while the subject runs between two lines drawn on the floor 10 m apart to pick up small blocks. Each student ran as fast as possible from the starting line to the other line and returned to the starting line, crossing each line with both feet every time. This test was performed twice. A stopwatch was used to determine time based on when the student crossed the end line with one foot. Standing long jump (SLJ) saw each student stand behind the take-off line and jump forward as far as possible (i.e., core power). The distance is measured from the take-off line to the point where the back of the heel nearest to the take-off line lands on the mat or non-slippery floor. The test was repeated twice, and the best score retained (in cm).
2.6. Socioeconomic Variables
Socioeconomic variables included in the models were child nationality, parents' citizenship, parents' educational level, and parents' employment level. Child nationality was coded as either native or foreign-born, with the latter category encompassing children born outside of Italy. Parents' citizenship was operationalized in the same manner as their child's. Parents' educational level was measured using the highest degree obtained by either parent, ranging from no high school diploma (reference category) to university degree or higher degrees. This was recoded to high school or less vs. university or graduate training. Parents' employment level was assessed by categorizing parents as either unemployed or employed (i.e., 1 = both parents were employed; 0 = at least one parent wasn’t employed).
2.7. Covariates
In addition to the measures of SES, several other covariates were used in the analysis to control for potential confounds that may also contribute to HRQoL. These included child gender and age, International Obesity Task Force (IOTF) category, and family living status. Child gender was coded as either male or female, and child age at the time of the survey was measured in years. The IOTF category was used as a measure of childhood weight status, with categories including age-grade estimates of underweight/normal weight and overweight/obese. Living with both parents was coded as a dichotomous variable, indicating whether the child lived with both parents or not.
2.8. Data Analysis
Participants’ characteristics and responses were summarized using mean and standard deviation, and absolute and relative frequencies, as appropriate. Distributional properties of dependent variables was assessed graphically using density graphs and tested for normality with the Shapiro-Wilk test. The strength of association between cardio-fitness, PA and KIDSCREEN 27 subscales was examined using the Pearson correlation coefficient.
A structural path model was used to examine the relationships between cardio-fitness, PA, SES measures and HRQoL. We tested these relations using four integrated model building steps:
(1) Confirmatory Factor Analysis (CFA): A confirmatory measurement model was used to examine the dimensionality of HRQoL using the five KIDSCREEN-27 subscale domains. A single latent factor (HRQoL) was hypothesized to cause the association among the five subscale domains. Model fit was based on the Comparative Fit Index (CFI > .95), Tucker-Lewis Index (TLI), Root Mean Square Error of Approximation (RMSEA ≤.08), Standardized Root Mean Squared Residual (SRMR ≤.05), χ2/df (<5.0), and magnitude of the standardized factor loadings [46].
(2) Covariate Only Model: Next, a model was tested positing the relations of covariates alone (child's gender and age, nationality, family living status, and socioeconomic variables) with the latent factor of HRQoL. Examining covariates in the absence of cardio-fitness and PA measures helps to identify any potential suppressor relations and also determine which SES measures are uniquely associated with HRQoL. Model fit was based on the same indices as with the CFA model and non-significant measures were removed.
(3) Cardio-fitness and PA Model: A third model posited relations between the observed cardio-fitness measures (6-minute Cooper test, shuttle run test, and standing long jump), PA levels (PAQ-A) and HRQoL. The same model fit indices were applied and we examined the increment in model R2 (variance accounted for in HRQoL) with the addition of the second set of measures, controlling for the presence of covariates.
(4) Combined Model: We then combined the results of steps 1-3 and tested a path model positing relations between SES, covariates, cardio-fitness, PA and HRQoL. This model included only measures that were significant from the prior steps. Additionally, we evaluated the R2 statistic to determine whether the additional measures improved the overall variance accounted for compared to the prior models. The statistical significance level was set as P<0.05. The combined model included associations among the fitness measures but not the covariates. All data management and descriptive analyses were conducted using R version 4.2.2 (R Project for Statistical Computing) [47] and the correlation and path modeling used the Mplus statistical software [48].
3. Results
3.1. Study Population
Table 1 summarizes the main characteristics of the 370 early adolescents that comprised the study sample. There were slightly more males (n = 188; 51%) than females (n = 182; 49%). The mean age of the sample was 12.76±0.94 years (range 10.89 to 15.34). A total of 54 (24%) participants were categorized as overweight/obese and a majority lived with both parents (n =194; 87%). The majority of the sample (n = 186; 83%) had Italian citizenship. As for parental educational level, 69 (31%) mothers had a university degree. The same level of education was reported by 51 (23%) fathers. Overall, 146 (39.5%) of the participants did not engage in the cardio-fitness tests or respond to the PA measures or HRQoL. As a result, they had over 80% of their data missing. We eliminated cases with >80% missing data, as any type of model-based imputation would not recover accurate standard errors or produce efficient parameter estimates with large amounts of missing data.
3.2. Correlation Analysis
Bivariate relations between the main variables of interest are presented in Table 2.
The five subscales of HRQoL were moderately related and all were significant (ravg. = .451). The largest of these relations was between Psychological Well-being and Parent Relations & Autonomy (r = .536) while the smallest in magnitude was between Social Support & Peers and School Environment (r = .256). As expected, routine engagement in PA (PAQ-A) was moderately related to Physical Well-being (r = .579) with a much smaller relationship with School Environment (r = .075). The cardio-fitness measures were all substantially related to each other, with longer agility times (shuttle run) inversely related to the long jump (r = -.727) and endurance (r = .496) and endurance was inversely related to agility (r = -.569). Also as expected, being able to jump, demonstrate agility and endurance were all moderately related to routine engagement in PA. Among the five subscales of HRQoL, Physical Well-being had the largest associations with the cardio-fitness tests (ravg. = .374) and the PAQ-A score (r = .579). The remaining associations with HRQoL scales and cardio-fitness were much smaller (ravg. = .100 for long jump, ravg. = .104 for shuttle run, and ravg. = .127 for the Cooper endurance test).
Notably, females reported less physical (r = -.13, P<.10) and psychological well-being (r = -.20, P<.01), less autonomy and favorable family relations (r = -.14, P<.10), less positive peer relations (r = -.04, P=n.s.), and a better school environment and learning context (r = .18, P<.05). They also reported longer distances in the standing long jump (r = .10, P=n.s.), shorter 6-minute run times in the Cooper test (r = -.33, P<.001), and faster shuttle run results (r = .24, P<.01), and less participation in routine PA (r = -.17, P<.05)
Figure 1 shows the results of the CFA model testing the dimensional structure of HRQoL using the KIDSCREEN-27. The fit of the model was adequate according to several benchmark criteria, χ2(5, N=224) = 5.84, P<.001, χ2/df = 1.17, CFI = .996, TLI = .992, SRMR = .02, RMSEA = .03 (95% CI: .000 - .100). The CFI indicates the amount of covariation in the data accounted for by the hypothesized model (compared to a baseline independence model which posits the manifest variables are uncorrelated) with larger values > .95 indicating a good model. Both the SRMR and RMSEA [49] indicate “badness of fit” (smaller values are better), in the former case comparing the hypothesized model to an unrestricted mean and variance covariance structure (i.e., mean square error of the estimated correlations) and the latter case based on a discrepancy statistic that considers the sample and model-implied covariance matrices. Monte Carlo simulations have shown these model fit indices perform well with small samples and small degrees of freedom [50,51]. As depicted, all of the factor loadings for the measured variables were sizable in magnitude (λavg. = .603) and significant (P<.001). The largest loading was for Parent Relations & Autonomy (λ = .726, SE = .050), and the smallest loading was for Social Support & Peer Relations (λ = .530, SE = .060).
3.3. Path Model
With a well hypothesized and reliable latent factor of HRQoL we next tested a path model using the Mplus program. Table 3 contains the structural path coefficients for the univariate, multivariate, and fully adjusted models.
The model with only SES measures and demographic covariates fit well, χ2(33) = 60.733, P<.001, χ2/df = 1.84, CFI = .892, TLI = .853, SRMR = .054, RMSEA = .061 (95% CI: .036 - .085) and accounted for 17.2% of the variance in HRQoL. Benchmark model fit indices indicated several model refinements could be made that might improve the overall fit. However, Monte Carlo simulations with relatively small samples (<500) have shown that additional refinements obtained with specification searches are likely to be sample specific and not accurately reproduce the population model [52]. Male students reported higher HRQoL (β=-0.204, P<.01, 95% CI: -0.346 – 0.062) as did those living with both parents (β=0.164, P<.05, 95% CI: 0.023 – 0.305) and having both parents employed (β=0.235, P<.01, 95% CI: 0.087 – 0.384). The lower portion of the table in the first column shows the univariate results for the cardio-fitness and PA measures, χ2(21) = 98.527, P<.001, CFI = .765, TLI = .664, SRMR = .085, RMSEA = .128 (95% CI: .103 - .154). This model accounted for 39.3% of variance in HRQoL essentially doubling the information we know about HRQoL. Being routinely engaged in PA was associated with better HRQoL (β=0.418, P < .001, 95%, P<.001, CI: 0.257 – 0.579) as was endurance (speed: β=0.184, P<.05, 95% CI: 0.033 – 0.336). Agility was negatively related to HRQoL (more time to cross the endline means slower agility: β=-0.186, P<.05, 95% CI: -0.371 – 0.001).
We then combined the two models joining the covariates with cardio-fitness and PA measures. The multivariate model showed an adequate fit, χ2(33) = 133.646, P<.001, χ2/df = 4.05, CFI = .733, TLI = .635, SRMR = .078, RMSEA = .115 (95% CI: .095 - .136), although by all accounts, this model also could be improved (R2 = 49.6%). In the multivariate model, younger students reported higher HRQoL (β=-0.139, P<.05, 95% CI: -0.254 – -0.023). In contrast to the univariate model, females reported higher HRQoL (β=0.142, P<.05, 95% CI: 0.011 – 0.273). Students having both parents employed reported higher HRQoL (β=0.145, P<.05, 95% CI: 0.031 – 0.259) as did students from homes with a higher educational status (β=0.135, P<.05, 95% CI: 0.023 – 0.248). The associations of the cardio-fitness and PA measures with HRQoL remained consistent in the multivariate model. That is, greater engagement in routine PA was positively associated with HRQoL (β=0.429, P<.001, 95% CI: 0.304 – 0.554). Endurance (speed around the track) was positively associated with HRQoL (β=0.221, P<.01, 95% CI: 0.087 – 0.355) and students who took longer on the shuttle run (slower agility) reported less HRQoL (β=-0.207, P<.01, 95% CI: -0.337 – -0.077).
The final model added associations among the cardio-fitness and PA measures to control for their moderate association, χ2(45) = 214.342, P<.001, χ2/df = 4.76, CFI = .545, TLI = .545, SRMR = .120, RMSEA = .130 (95% CI: .112 - .147). The far right hand side of Table 3 shows that the unique associations between the SES, cardio-fitness and PA measures with HRQoL did not appreciably change with the addition of these associations. The overall R2 for the model was 51.2%. Students who took longer on the shuttle run had less speed and endurance (Cooper test: r = -.468, P<.001) and likewise engaged in less routine PA (r = -.366, P<.001). Students who engaged in more routine PA were faster on the Cooper test (r = .345, P<.001).
We also ran a model that replaced age with the IOTF score (under/normal weight vs. overweigth/obese). The replacement is necesitated by the observation that the IOTF score is age-graded and including both measures would muddy if not confound the interpretation. The initial model was adequate and several measures were removed for nonsignificance. A final trimmed model fit well, χ2(33) = 110.15, P<.001, χ2/df = 3.34, CFI = .779, TLI = .699, SRMR = .078, RMSEA = .102 (95% CI: .081 - .124). Significant parameters included parents’ employment status (β=0.126, P<.05, 95% CI: 0.007 – 0.245), parents’ educational status (β=0.118, P<.05, 95% CI: 0.007 – 0.229), the shuttle test (β=-0.132, P<.05, 95% CI: -0.260 – -0.004), Cooper endurance test (β=0.151, P<.05, 95% CI: 0.024 – 0.278), general PA involvement (β=0.446, P<.001, 95% CI: 0.329 – 0.563), and the IOTF score (β=-0.134, P<.05, 95% CI: -0.246 – -.022). Citizenship of the parents was marginally significant (β=-0.108, P<.08, 95% CI: -0.226 – 0.009). The model accounted for 49.8% of variance in the HRQoL measure.
4. Discussion
Health-related quality of life captures a myriad of functions in a person’s life. This is true for adults as well as children. Understanding factors that are associated with HRQoL in children is important as their satisfaction with different domains of functioning can be a reliable prognosticator of later life’s outcomes. The ability to identify factors associated with HRQoL also creates opportunities to develop a wide range of interventions to promote better health and life satisfaction, with implications for both morbidity and mortality. To address this concern, and in an exploratory manner, we assessed several factors believed to be associated with HRQoL in a sample of Italian children attending secondary school, a period in life which corresponds to early adolescence. This is a crucial period of development when children begin to form lifelong impressions of their health and well-being. It is also a time when they remain malleable with regard to their health orientations, open to suggestions about exercise, nutrition, and the benefits of healthy living. We assessed two relevant areas of PA including their cardio-fitness using performance measures of agility with a shuttle run, core strength using the standing long jump, and fitness endurance using the Cooper 6 minute run test. A second self-report measure assessed their general inclination to engage in PA. We also included objective measures of social status assessing the parents’ education, citizenship, employment, and the child’s gender, age, nationality and living situation. A measure of body mass (IOTF) was modeled separately given some confounding with age. Inclusion of traditional measures of SES is intended to capture the “social gradient” of health, which suggests that inadequate material wealth and personal resources, and lack of social capital can hinder a person’s ability to satisfy certain needs and diminish their well-being.
The findings are discussed in terms of the sequence of models tested. To begin with, we confirmed that HRQoL is multidimensional, consistent with previous findings [53]. The loadings on the five subscale domains were balanced and moderate in size suggesting that each contributed relatively equally to defining HRQoL. This suggests that for this age group HRQoL best represents a mixture of multiple contexts of a child’s life including their vitality, energy, and general health, emotional state of mind, home atmosphere, family relations and sense of parental control, peer social relations, and how they feel about school, whether it is a supportive place, and their academic performance. These five facets provide a glimpse of a child’s functioning and how they perceive their world. Two additional pieces of information come from the CFA model. First, that HRQoL can be conceptualized as a reliable single dimension. In a CFA model, the parameter estimates are ”error-free” and thus provide a more reliable expression of the underlying statistical relationships. Second, the measurement model also reinforces that the KIDSCREEN-27 can be administered in an abbreviated form to accommodate assessing HRQoL with young children while still capturing the full essence of what makes them satisfied with different facets of their life.
The sequence of path models showed that when examined in isolation certain SES and demographic factors provide important pieces of information regarding HRQoL. These are not arbitrary covariates, rather they provide insight into the lifestyles of these children and account for meaningful variation in HRQoL. When the full set of SES and demographic were modeled, gender, living situation and parent’s employment status were significantly associated with HRQoL. Females reported higher HRQoL as did children living with both parents and in homes where both parents were employed. In general, males reported significantly higher levels of physical and psychological well-being and satisfaction with family relations and parental control. One explanation for these differences may involve a ‘socialization’ effect (i.e., reporting differences between boys and girls) that captures differences in how girls and boys perceive their state of mind, emotional well-being, and family relations. Girls in this age group have the added experience of hormonal and pubertal changes that can tip the balance and create the aura of emotional friction in the home or less satisfaction with life.
Education and employment, both objective measures of social status, were consistently related to HRQoL and may represent a social gradient of health, with higher income families reporting less disease and sickness overall [54]. Education has been shown to be an important component of a child’s overall health and well-being [26]. In homes with more educated parents there is likely greater health literacy, leading to more informed decisions about a family’s healthcare [55]. Furthermore, higher educational status often correlates with increased SES resources such as material wealth, social capital and better access to healthcare. Education and nutrition are also closely intertwined leading to healthier food choices, less dependence on fatty foods or foods high in sugar content [56]. The consistent relations between several objective SES measures and HRQoL reinforces that even among children [54] and youth here is a social gradient for health with more resources associated with better quality of life [22].
The next model built on the prior model and added the cardio-fitness and PA measures. In this combined model the standing long jump measure was not significant. The loss of predictive efficiency may happen with multiple measures of fitness because there is empirical overlap in what they assess. In other words, the 6-minute Cooper and shuttle tests capture strength, endurance and agility, leaving no room for an independent contribution from a measure of power (jumping far indicates lower core strength). Notably, a self-report measure of PA was by far the most efficient predictor of HRQoL. The PAQ-A score consists of 9 items that provide a comprehensive view of the child’s routine physical activities based on their 7-day recall. The scale has been shown to be both reliable and valid with numerous ages from very young children to late adolescents. The instrument queries students’ activities during different parts of their day (i.e., PE class, during recess, lunch, after school, in the evening, over the weekend, and during the child’s free time) thus providing a realistic impression of their total PA participation. As a result, it may provide the most veridical measure of their PA, lessening the importance of single performance measures that can fluctuate with context and other temporal factors like time of day or day of week. Overall, this finding reinforces the importance of regular PA for secondary school students and the influence this has on the quality of their life [57]. Regular PA has known benefits on physical health, cognitive functioning, and social skills [58], contributing to enhanced HRQoL.
Replacing age with the IOTF score (indicating normal vs. obese weight), provided some interesting findings. Both variables cannot be modeled simultaneously given the IOTF score is age-graded. The model with IOTF actually fit better than a model with age, and also provided new information. Parents’ work and educational status were both significant as in the previous models. Children with higher IOTF scores categorized as being overweight or obese reported less HRQoL. Importantly, when we decomposed the five subscales and examined the bivariate associations only physical well-being was significantly different with heavier children reporting less well-being (r = -.206, P < .05).
The results of this study align with many findings in the literature, which posit that routine engagement in PA can lead to a number of favorable outcomes in children. It is associated with less sedentary behavior, optimizes physiological functioning, and bolsters cognitive performance [59,60]. The significance of these findings is amplified when considering the long-term implications of PA habits established during childhood and adolescence. By instilling the importance of regular PA at an early age, parents and schools can promote a trajectory of healthful choices, subsequently reducing the risk of chronic diseases and bolstering HRQoL throughout the life course [61]. Thus, it is imperative for stakeholders across the educational, public health, and policy sectors to prioritize and allocate resources towards programs that facilitate access to, and engagement in, PA for this age group.
The current study is part of an overall research agenda to promote PA in young children through the introduction of ‘active breaks’ during classroom time. The basic emphasis of active breaks is to find ways to weave in small doses of PA throughout the school day, without interrupting normal curricular instruction. This concept has emerged as a promising approach to bolstering PA levels and enhancing health outcomes among children and adolescents [62–64]. An accumulation of evidence now shows that active breaks present a valuable intervention strategy to reduce sedentary behavior, improve cognitive function, and is associated with better academic performance [65–68]. Furthermore, active breaks have demonstrated favorable effects on both mood and social behavior and may serve as a catalyst for promoting positive attitudes toward PA among younger populations [69]. It is worth noting that active breaks can be readily integrated into existing school infrastructure, thereby rendering this type of program both feasible and cost-effective as a means to encourage PA and improve health outcomes among children and adolescents [70].
Limitations
There are several limitations to this study worth noting. First, the study was seriously underpowered, which can undermine detecting significant effects in the path model. This is especially important with path models where Type II error rates will increase for model fit indices with decreases in sample size (albeit the 224 students in the current study exceeds the lower limit testing in simulation studies [71]. Clearly, a larger sample is required to fully test the path model and ensure precision in the parameter estimates including obtaining accurate standard errors. Despite the exploratory nature of this study, we can still learn a great deal about a wide range of SES, demographic, cardio-fitness and PA measures that contribute to HRQoL in young children. Second, the cross-sectional design and the lack of temporal relations precludes making causal statements about factors that contribute to HRQoL in young children. Longitudinal studies with appropriate statistical controls (which we are conducting currently) are needed to infer causality from observational data [72]. There may also have been selection bias given the inclusion of a convenience sample, which can affect the generalizability of these findings. The sample, sourced entirely from a single province within Emilia-Romagna, may not be representative of the entire region or population of Italy. This geographical limitation may restrict the external validity of the findings. There was limited triangulation of data other than the performance tests and self-report. All of the SES information was subjective based on the child’s reports. All of these factors suggest that future studies should replicate the current findings, using more diverse and larger samples encompassing multiple provinces or regions, with additional corroboration of key markers from external sources.
There are many factors we did not model that may contribute to HRQoL. For one thing, the cardio-fitness measures represent only a subset of possible strength and agility performance measures. There are many different types of field tests that can gauge physical fitness. The assessment of additional activities, particularly those more representative of daily life or sport-specific activities, could provide a more comprehensive understanding of the relationship between PA and HRQoL. Furthermore, the reliance on a single trained individual for data collection may introduce potential observer measurement bias, suggesting that future studies should consider using multiple trained PE teachers or standardized protocols to minimize such bias. Moreover, additional measures of culture, family functioning, diet and nutrition may also account for variation in HRQoL. Larger families have to share resources, and this can strain family relations. What a person eats, their activity habits, parental support, involvement in sport clubs, and amount of time they spend engaging in leisure or pleasurable activities all can contribute to HRQoL. Likewise, other SES-related factors (i.e., income) can make a material contribution to HRQoL. The omission of relevant variables was perhaps best indicated by the less than optimal fit of the different path models. Although a relatively large amount of variance was accounted for in HRQoL, the overall fit of the models indicated that variance remained unaccounted for by the precise model specification. Future studies may want to revisit this model and include additional conceptually important measures.
5. Conclusions
The current findings provide valuable insights into the crucial roles that demographic, PA and cardio-fitness measures play in shaping a child’s HRQoL. The study emphasizes the importance of promoting regular PA among children to improve their overall well-being. The study also suggests that certain demographic factors may contribute to a health gradient, with higher HRQoL associated with better educated parents who are employed. Future studies may want to broaden the array of measures, particularly considering adding measures that capture cultural influences, nutrition, and family characteristics, all of which may influence a child’s life satisfaction. Moreover, longitudinal studies that investigate causal relationships between PA, socioeconomic factors and HRQoL, as well as those that incorporate household income data, will provide a more comprehensive understanding of the factors influencing children's well-being. Additionally, future research should focus on evaluating the impact of targeted PA interventions and exploring potential mediators and moderators of these relationships.
The current study findings have implications for stakeholders who work in the education, public health, and health policy sectors. By prioritizing and allocating resources towards programs that facilitate access to, and engagement in, PA for middle school children, we can foster a trajectory of healthful choices, ultimately reducing the risk of chronic diseases and improving HRQoL throughout their lives. Furthermore, addressing SES disparities may contribute to more equitable health outcomes for children across various demographic backgrounds. Together, these efforts can pave the way for a healthier, more resilient generation of youth, better equipped to navigate the challenges of adolescence and adulthood.
Author Contributions
Conceptualization, F.S. and A.M.; methodology, F.S.; A.M. and L.M.S.; software, F.S.; validation, M.R. and G.L.; formal analysis, F.S.; A.M and L.M.S.; investigation, A.M.; G.L. and M.R.; resources, L.D.; data curation, A.M.; G.L. and M.R.; writing—original draft preparation, F.S. and A.M.; writing—review and editing, L.M.S.; visualization, A.C.; supervision, L.M.S.; project administration, A.M.; L.D. and A.C.; funding acquisition, L.D and A.C. All authors have read and agreed to the published version of the manuscript.
Funding
This research received no external funding.
Institutional Review Board Statement
The study was conducted in accordance with the Declaration of Helsinki and approved by the Bioethics Committee of the University of Bologna (Protocol n. 63053).
Informed Consent Statement
Informed consent was obtained from all subjects involved in the study.
Data Availability Statement
Data are available upon request to the contact author.
Acknowledgments
The authors would like to thank the children and their family for their cooperation in this study. We would like to thank the teachers, the school personnel and the school director for their cooperation in the study.
Conflicts of Interest
The authors declare no conflict of interest.
References
- Whoqol Group. Development of the WHOQOL: Rationale and Current Status. Int. J. Ment. Health. 1994, 23, 24–56. [Google Scholar] [CrossRef]
- Wang, H.; Shen, B.; Bo, J. Profiles of health-related quality of life and their relationships with happiness, physical activity, and fitness. Res Q Exerc Sport. 2022, 93, 260–269. [Google Scholar] [CrossRef] [PubMed]
- Harding, L. Children’s quality of life assessments: A review of generic and health related measures completed by children and adolescents. Clinical Psychology and Psychotherapy 2001, 8, 79–96. [Google Scholar] [CrossRef]
- Spieth, L.E.; Harris, C.V. Assessment of health-related quality of life in children and adolescents: an integrative review. J Pediatr Psychol. 1996, 21, 175–193. [Google Scholar] [CrossRef] [PubMed]
- Petracci, E.; Cavrini, G. The effect of weight status, lifestyle, and body image perception on health-related quality of life in children: a quantile approach. Qual Life Res 2013, 22, 2607–2615. [Google Scholar] [CrossRef] [PubMed]
- Zhang, L.; Fos, P.J.; Johnson, W.D.; et al. Body mass index and health related quality of life in elementary school children: a pilot study. Health Qual Life Outcomes 2008, 6, 77. [Google Scholar] [CrossRef]
- Ferrans, C.E.; Zerwic, J.J.; Wilbur, J.E.; Larson, J.L. Conceptual model of health-related quality of life. J Nurs Scholarsh 2005, 37, 336–342. [Google Scholar] [CrossRef] [PubMed]
- Bronfenbrenner, U. The ecology of human development: Experiments by nature and design. Harvard University Press: Cambridge, MA, USA, 1979. [Google Scholar]
- Wallander, J.L.; Schmitt, M.; Koot, H.M. Quality of life measurement in children and adolescents: issues, instruments, and applications. J Clin Psychol. 2001, 57, 571–585. [Google Scholar] [CrossRef] [PubMed]
- Sawyer, M.G.; Spurrier, N.; Whaites, L.; Kennedy, D.; Martin, A.J.; Baghurst, P. The relationship between asthma severity, family functioning and the health-related quality of life of children with asthma. Qual Life Res 2000, 9, 1105–1115. [Google Scholar] [CrossRef]
- Russell, K.M.; Hudson, M.; Long, A.; Phipps, S. Assessment of health-related quality of life in children with cancer: consistency and agreement between parent and child reports. Cancer 2006, 106, 2267–2274. [Google Scholar] [CrossRef]
- Pinhas-Hamiel, O.; Singer, S.; Pilpel, N.; Fradkin, A.; Modan, D.; Reichman, B. Health-related quality of life among children and adolescents: associations with obesity. Int J Obes (Lond) 2006, 30, 267–272. [Google Scholar] [CrossRef]
- Karande, S.; Bhosrekar, K.; Kulkarni, M.; Thakker, A. Health-related quality of life of children with newly diagnosed specific learning disability. J Trop Pediatr 2009, 55, 160–169. [Google Scholar] [CrossRef] [PubMed]
- Weitkamp, K.; Daniels, J.K.; Romer, G.; Wiegand-Grefe, S. Health-related quality of life of children and adolescents with mental disorders. Health Qual Life Outcomes 2013, 11, 129. [Google Scholar] [CrossRef] [PubMed]
- Ravens-Sieberer, U.; Erhart, M.; Wille, N.; Bullinger, M. BELLA study group. Health-related quality of life in children and adolescents in Germany: results of the BELLA study. Eur Child Adolesc Psychiatry 2008, 17 (Suppl. 1), 148–156. [Google Scholar] [CrossRef] [PubMed]
- Calzada-Rodríguez, J.I.; Denche-Zamorano, Á.M.; Pérez-Gómez, J.; et al. Health-related uality of life and frequency of physical activity in Spanish students aged 8-14. Int J Environ Res Public Health 2021, 18, 9418. [Google Scholar] [CrossRef]
- Pascoe, M.; Bailey, A.P.; Craike, M.; et al. Physical activity and exercise in youth mental health promotion: a scoping review. BMJ Open Sport Exerc Med 2020, 6, e000677. [Google Scholar] [CrossRef] [PubMed]
- Poitras, V.J.; Gray, C.E.; Borghese, M.M.; et al. Systematic review of the relationships between objectively measured physical activity and health indicators in school-aged children and youth. Appl Physiol Nutr Metab 2016, 41(6 Suppl 3), S197–S239. [Google Scholar] [CrossRef]
- Rodriguez-Ayllon, M.; Cadenas-Sánchez, C.; Estévez-López, F.; et al. Role of physical activity and sedentary behavior in the mental health of preschoolers, children and adolescents: a systematic review and meta-analysis. Sports Med 2019, 49, 1383–1410. [Google Scholar] [CrossRef]
- Biddle, S.J.H.; Ciaccioni, S.; Thomas, G.; Vergeer, I. Physical activity and mental health in children and adolescents: an updated review of reviews and an analysis of causality. Psycho Sport Exerc 2019, 42, 146–1555. [Google Scholar] [CrossRef]
- Guthold, R.; Stevens, G.A.; Riley, L.M.; Bull, F.C. Global trends in insufficient physical activity among adolescents: a pooled analysis of 298 population-based surveys with 1·6 million participants. Lancet Child Adolesc Health 2020, 4, 23–35. [Google Scholar] [CrossRef]
- Kim, K.W.; Wallander, J.L.; Peskin, M.; Cuccaro, P.; Elliott, M.N.; Schuster, M.A. Associations between parental SES and children's health-related quality of life: the role of objective and subjective social status. J Pediatr Psychol 2018, 43, 534–542. [Google Scholar] [CrossRef]
- von Rueden, U.; Gosch, A.; Rajmil, L.; Bisegger, C.; Ravens-Sieberer, U. Socioeconomic determinants of health related quality of life in childhood and adolescence: results from a European study. J Epidemiol Community Health 2006, 60, 130–135. [Google Scholar] [CrossRef]
- Williams, J.; Wake, M.; Hesketh, K.; Maher, E.; Waters, E. Health-related quality of life of overweight and obese children. JAMA 2005, 293, 70–76. [Google Scholar] [CrossRef]
- Keating, C.L.; Moodie, M.L.; Swinburn, B.A. The health-related quality of life of overweight and obese adolescents--a study measuring body mass index and adolescent-reported perceptions. Int J Pediatr Obes 2011, 6, 434–441. [Google Scholar] [CrossRef]
- Costa, D.; Cunha, M.; Ferreira, C.; et al. Socioeconomic inequalities in children's health-related quality of life according to weight status. Am J Hum Biol 2021, 33, e23453. [Google Scholar] [CrossRef]
- Drukker, M.; Kaplan, C.; Feron, F.; van Os, J. Children's health-related quality of life, neighbourhood socio-economic deprivation and social capital: a contextual analysis. Soc Sci Med 2003, 57, 825–841. [Google Scholar] [CrossRef]
- Marmot, M. (2004) The status syndrome: How social standing affects our health and longevity. New York, NY: Henry Holt and Company.
- Masini, A.; Gori, D.; Marini, S. , et al. The determinants of health-related quality of life in a sample of primary school children: a cross-sectional analysis. Int J Environ Res Public Health 2021, 18, 3251. [Google Scholar] [CrossRef] [PubMed]
- Guevara, R.M.; Moral-García, J.E.; Urchaga, J.D.; López-García, S. Relevant factors in adolescent well-being: family and parental relationships. Int J Environ Res Public Health 2021, 18, 7666. [Google Scholar] [CrossRef] [PubMed]
- Wang, J.; Jin, W.; Shi, L.; Geng, Y.; Zhu, X.; Hu, W. Health-related quality of life in children: the roles of age, gender and interpersonal trust. Int J Environ Res Public Health 2022, 19, 15408. [Google Scholar] [CrossRef] [PubMed]
- Kowalski, K.C.; Crocker, P.R.E.; Faulkner, R.A. Validation of the Physical Activity Questionnaire for Older Children. Pediatric Exercise Science 1997, 9, 174–186. [Google Scholar] [CrossRef]
- Ravens-Sieberer, U.; Auquier, P.; Erhart, M.; et al. The KIDSCREEN-27 quality of life measure for children and adolescents: psychometric results from a cross-cultural survey in 13 European countries. Qual Life Res 2007, 16, 1347–1356. [Google Scholar] [CrossRef]
- von Elm, E.; Altman, D.G.; Egger, M.; et al. The strengthening the reporting of observational studies in epidemiology (STROBE) statement: guidelines for reporting observational studies. J Clin Epidemiol 2008, 61, 344–349. [Google Scholar] [CrossRef] [PubMed]
- The KIDSCREEN Group Europe. (2006) The KIDSCREEN Questionnaires–Quality of Life Questionnaires for Children and Adolescents. Handbook. Lengerich: Pabst Science Publishers.
- Crocker, P.R.; Bailey, D.A.; Faulkner, R.A.; Kowalski, K.C.; McGrath, R. Measuring general levels of physical activity: preliminary evidence for the Physical Activity Questionnaire for Older Children. Med Sci Sports Exerc 1997, 29, 1344–1349. [Google Scholar] [CrossRef] [PubMed]
- Mannocci, A.; Masala, D.; Mei, D.; Tribuzio, A.M.; Villari, P.; La Torre, G. International Physical Activity Questionnaire for Adolescents (IPAQ A): reliability of an Italian version. Minerva Pediatr 2021, 73, 383–390. [Google Scholar] [CrossRef]
- Ayán, C.; Cancela, J.M.; Romero, S.; Alonso, S. Reliability of two field-based tests for measuring cardiorespiratory fitness in preschool children. J Strength Cond Res 2015, 29, 2874–2880. [Google Scholar] [CrossRef]
- Bolonchuk, W.W. The accuracy of the six minute run test to measure cardiorespiratory fitness. North Dakota University: Grand Forks, ND, USA: 1975.
- Cˇillík, I.; Kollár, R.; Kremnický, J.; Pivovarnicˇek, P.; Mandzáková, M. The level of general physical performance and physical development of 7 and 10-year-old boys and girls. J. Hum. Sport Exerc 2015, 10. [Google Scholar]
- Secchi, J.D.; García, G.C.; España-Romero, V.; Castro-Piñero, J. Physical fitness and future cardiovascular risk in argentine children and adolescents: an introduction to the ALPHA test battery. Arch Argent Pediatr 2014, 112, 132–140. [Google Scholar] [CrossRef] [PubMed]
- Castro-Piñero, J.; Ortega, F.B.; Artero, E.G.; et al. Assessing muscular strength in youth: usefulness of standing long jump as a general index of muscular fitness. J Strength Cond Res 2010, 24, 1810–1817. [Google Scholar] [CrossRef]
- Ortega, F.B.; Ruiz, J.R.; Castillo, M.J.; Sjöström, M. Physical fitness in childhood and adolescence: a powerful marker of health. Int J Obes (Lond) 2008, 32, 1–11. [Google Scholar] [CrossRef]
- Blair, S.N.; Cheng, Y.; Holder, J.S. Is physical activity or physical fitness more important in defining health benefits? Med Sci Sports Exerc 2001, 33 (6 Suppl), S379–S420. [Google Scholar] [CrossRef]
- Katzmarzyk, P.T.; Malina, R.M.; Bouchard, C. Physical activity, physical fitness, and coronary heart disease risk factors in youth: the Québec Family Study. Prev Med 1999, 29 (6 Pt 1), 555–562. [Google Scholar] [CrossRef]
- Hu, L.; Bentler, P.M. Cutoff criteria for fit indexes in covariance structure analysis: conventional criteria versus new alternatives. Structural Equation Modeling: A Multidisciplinary Journal 1999, 6, 1–55. [Google Scholar] [CrossRef]
- R Core Team (2022) R: A language and environment for statistical computing. R Foundation for Statistical Computing, Vienna, Austria. Available online: https://www.R-project.org/.
- Muthén, L.K.; Muthén, B.O. (1998-2017) Mplus users’ guide (8th ed.). Los Angeles, CA: Muthén & Muthén.
- Steiger, J.H.; Lind, J.C. (1980) Statistically-based tests for the number of common factors. Handout for a presentation delivered at the meeting of the Psychometric Society, Iowa City, IA.
- Taasoobshirazi, G.; Wang, S. The performance of the SRMR, RMSEA, CFI, and TLI: An examination of sample size, path size, and degrees of freedom. Journal of Applied Quantitative Methods, 2016, 11, 31–39. [Google Scholar]
- Kenny, D.A.; Kaniskan, B.; McCoach, D.B. The performance of RMSEA in models with small degrees of freedom. Sociological Methods & Research 2015, 44, 486–507. [Google Scholar] [CrossRef]
- MacCallum, R.C.; Browne, M.W.; Sugawara, H.M. Power analysis and determination of sample size for covariance structure modeling. Psychological Methods 1996, 1, 130–149. [Google Scholar] [CrossRef]
- Gaspar, T.; Ribeiro, J.P.; de Matos, M.G.; Leal, I.; Ferreira, A. Health-related quality of life in children and adolescents: subjective well being. Span J Psychol 2012, 15, 177–186. [Google Scholar] [CrossRef]
- Wallander, J.L.; Fradkin, C.; Chien, A.T.; Mrug, S.; Banspach, S.W.; Davies, S.; Elliott, M.N.; Franzini, L.; Schuster, M.A. Racial/ethnic disparities in health-related quality of life and health in children are largely mediated by family contextual differences. Acad Pediatr. 2012, 12, 532–538. [Google Scholar] [CrossRef]
- Berchick, E.R. The relationship between maternal education and reported childhood conditions. Soc Sci Med 2016, 170, 170–179. [Google Scholar] [CrossRef]
- Bicego, G.T.; Boerma, J.T. Maternal education and child survival: a comparative study of survey data from 17 countries. Soc Sci Med 1993, 36, 1207–1227. [Google Scholar] [CrossRef]
- Hallal, P.C.; Victora, C.G.; Azevedo, M.R.; Wells, J.C. Adolescent physical activity and health: a systematic review. Sports Med 2006, 36, 1019–1030. [Google Scholar] [CrossRef]
- Esteban-Cornejo, I.; Hallal, P.C.; Mielke, G.I.; et al. Physical activity throughout adolescence and cognitive performance at 18 years of age. Med Sci Sports Exerc 2015, 47, 2552–2557. [Google Scholar] [CrossRef]
- Eime, R.M.; Young, J.A.; Harvey, J.T.; Charity, M.J.; Payne, W.R. A systematic review of the psychological and social benefits of participation in sport for children and adolescents: informing development of a conceptual model of health through sport. Int J Behav Nutr Phys Act 2013, 10, 98. [Google Scholar] [CrossRef] [PubMed]
- Longmuir, P.E.; Colley, R.C.; Wherley, V.A.; Tremblay, M.S. Canadian society for exercise physiology position stand: benefit and risk for promoting childhood physical activity. Appl Physiol Nutr Metab 2014, 39, 1271–1279. [Google Scholar] [CrossRef] [PubMed]
- Anderson, E.; Durstine, J.L. Physical activity, exercise, and chronic diseases: a brief review. Sports Med Health Sci 2019, 1, 3–10. [Google Scholar] [CrossRef]
- Masini, A.; Marini, S.; Gori, D.; Leoni, E.; Rochira, A.; Dallolio, L. Evaluation of school-based interventions of active breaks in primary schools: a systematic review and meta-analysis. J Sci Med Sport 2020, 23, 377–384. [Google Scholar] [CrossRef]
- Watson, A.; Timperio, A.; Brown, H.; Best, K.; Hesketh, K.D. Effect of classroom-based physical activity interventions on academic and physical activity outcomes: a systematic review and meta-analysis. Int J Behav Nutr Phys Act 2017, 14, 114. [Google Scholar] [CrossRef] [PubMed]
- Neil-Sztramko, S.E.; Caldwell, H.; Dobbins, M. School-based physical activity programs for promoting physical activity and fitness in children and adolescents aged 6 to 18. Cochrane Database Syst Rev 2021, 9, CD007651. [Google Scholar] [CrossRef]
- Álvarez-Bueno CPesce, C.; Cavero-Redondo, I.; Sánchez-López, M.; Martínez-Hortelano, J.A.; Martínez-Vizcaíno, V. The effect of physical activity interventions on children's cognition and metacognition: a systematic review and meta-analysis. J Am Acad Child Adolesc Psychiatry 2017, 56, 729–738. [Google Scholar] [CrossRef]
- Ardoy, D.N.; Fernández-Rodríguez, J.M.; Jiménez-Pavón, D.; Castillo, R.; Ruiz, J.R.; Ortega, F.B. A physical education trial improves adolescents' cognitive performance and academic achievement: the EDUFIT study. Scand J Med Sci Sports 2014, 24, e52–e61. [Google Scholar] [CrossRef]
- Kvalø, S.E.; Bru, E.; Brønnick, K.; Dyrstad, S.M. Does increased physical activity in school affect children's executive function and aerobic fitness? Scand J Med Sci Sports 2017, 27, 1833–1841. [Google Scholar] [CrossRef]
- Alloway, T.P.; Alloway, R.G. Investigating the predictive roles of working memory and IQ in academic attainment. J Exp Child Psychol 2010, 106, 20–29. [Google Scholar] [CrossRef] [PubMed]
- Infantes-Paniagua, Á.; Silva, A.F.; Ramirez-Campillo, R.; et al. Active school breaks and students' attention: a systematic review with meta-analysis. Brain Sci 2021, 11, 675. [Google Scholar] [CrossRef] [PubMed]
- Dallolio, L.; Gallè, F.; Masini, A.; et al. Active breaks: a strategy to counteract sedentary behaviors for health promoting schools: a discussion on their implementation in Italy. Ann Ig 2023, 35, 202–212. [Google Scholar] [CrossRef] [PubMed]
- MaCallum, R. Specification searches in covariance structure modeling. Psychological Bulletin 1986, 100, 107–120. [Google Scholar] [CrossRef]
- Kim, K.W.; Wallander, J.L.; Depaoli, S.; Elliott, M.N.; Schuster, M.A. Longitudinal associations between parental SES and adolescent health-related quality of life using growth curve modeling. Journal of Child and Family Studies 2021, 30, 1463–1475. [Google Scholar] [CrossRef]
Figure 1.
Results of the CFA analysis. Notes: physwb = Physical Well-Being; psychwb = Psychological Well-Being; autonomy = Parents & Autonomy; peer_sup = Social Support & Peers; school = School Environment.
Figure 1.
Results of the CFA analysis. Notes: physwb = Physical Well-Being; psychwb = Psychological Well-Being; autonomy = Parents & Autonomy; peer_sup = Social Support & Peers; school = School Environment.
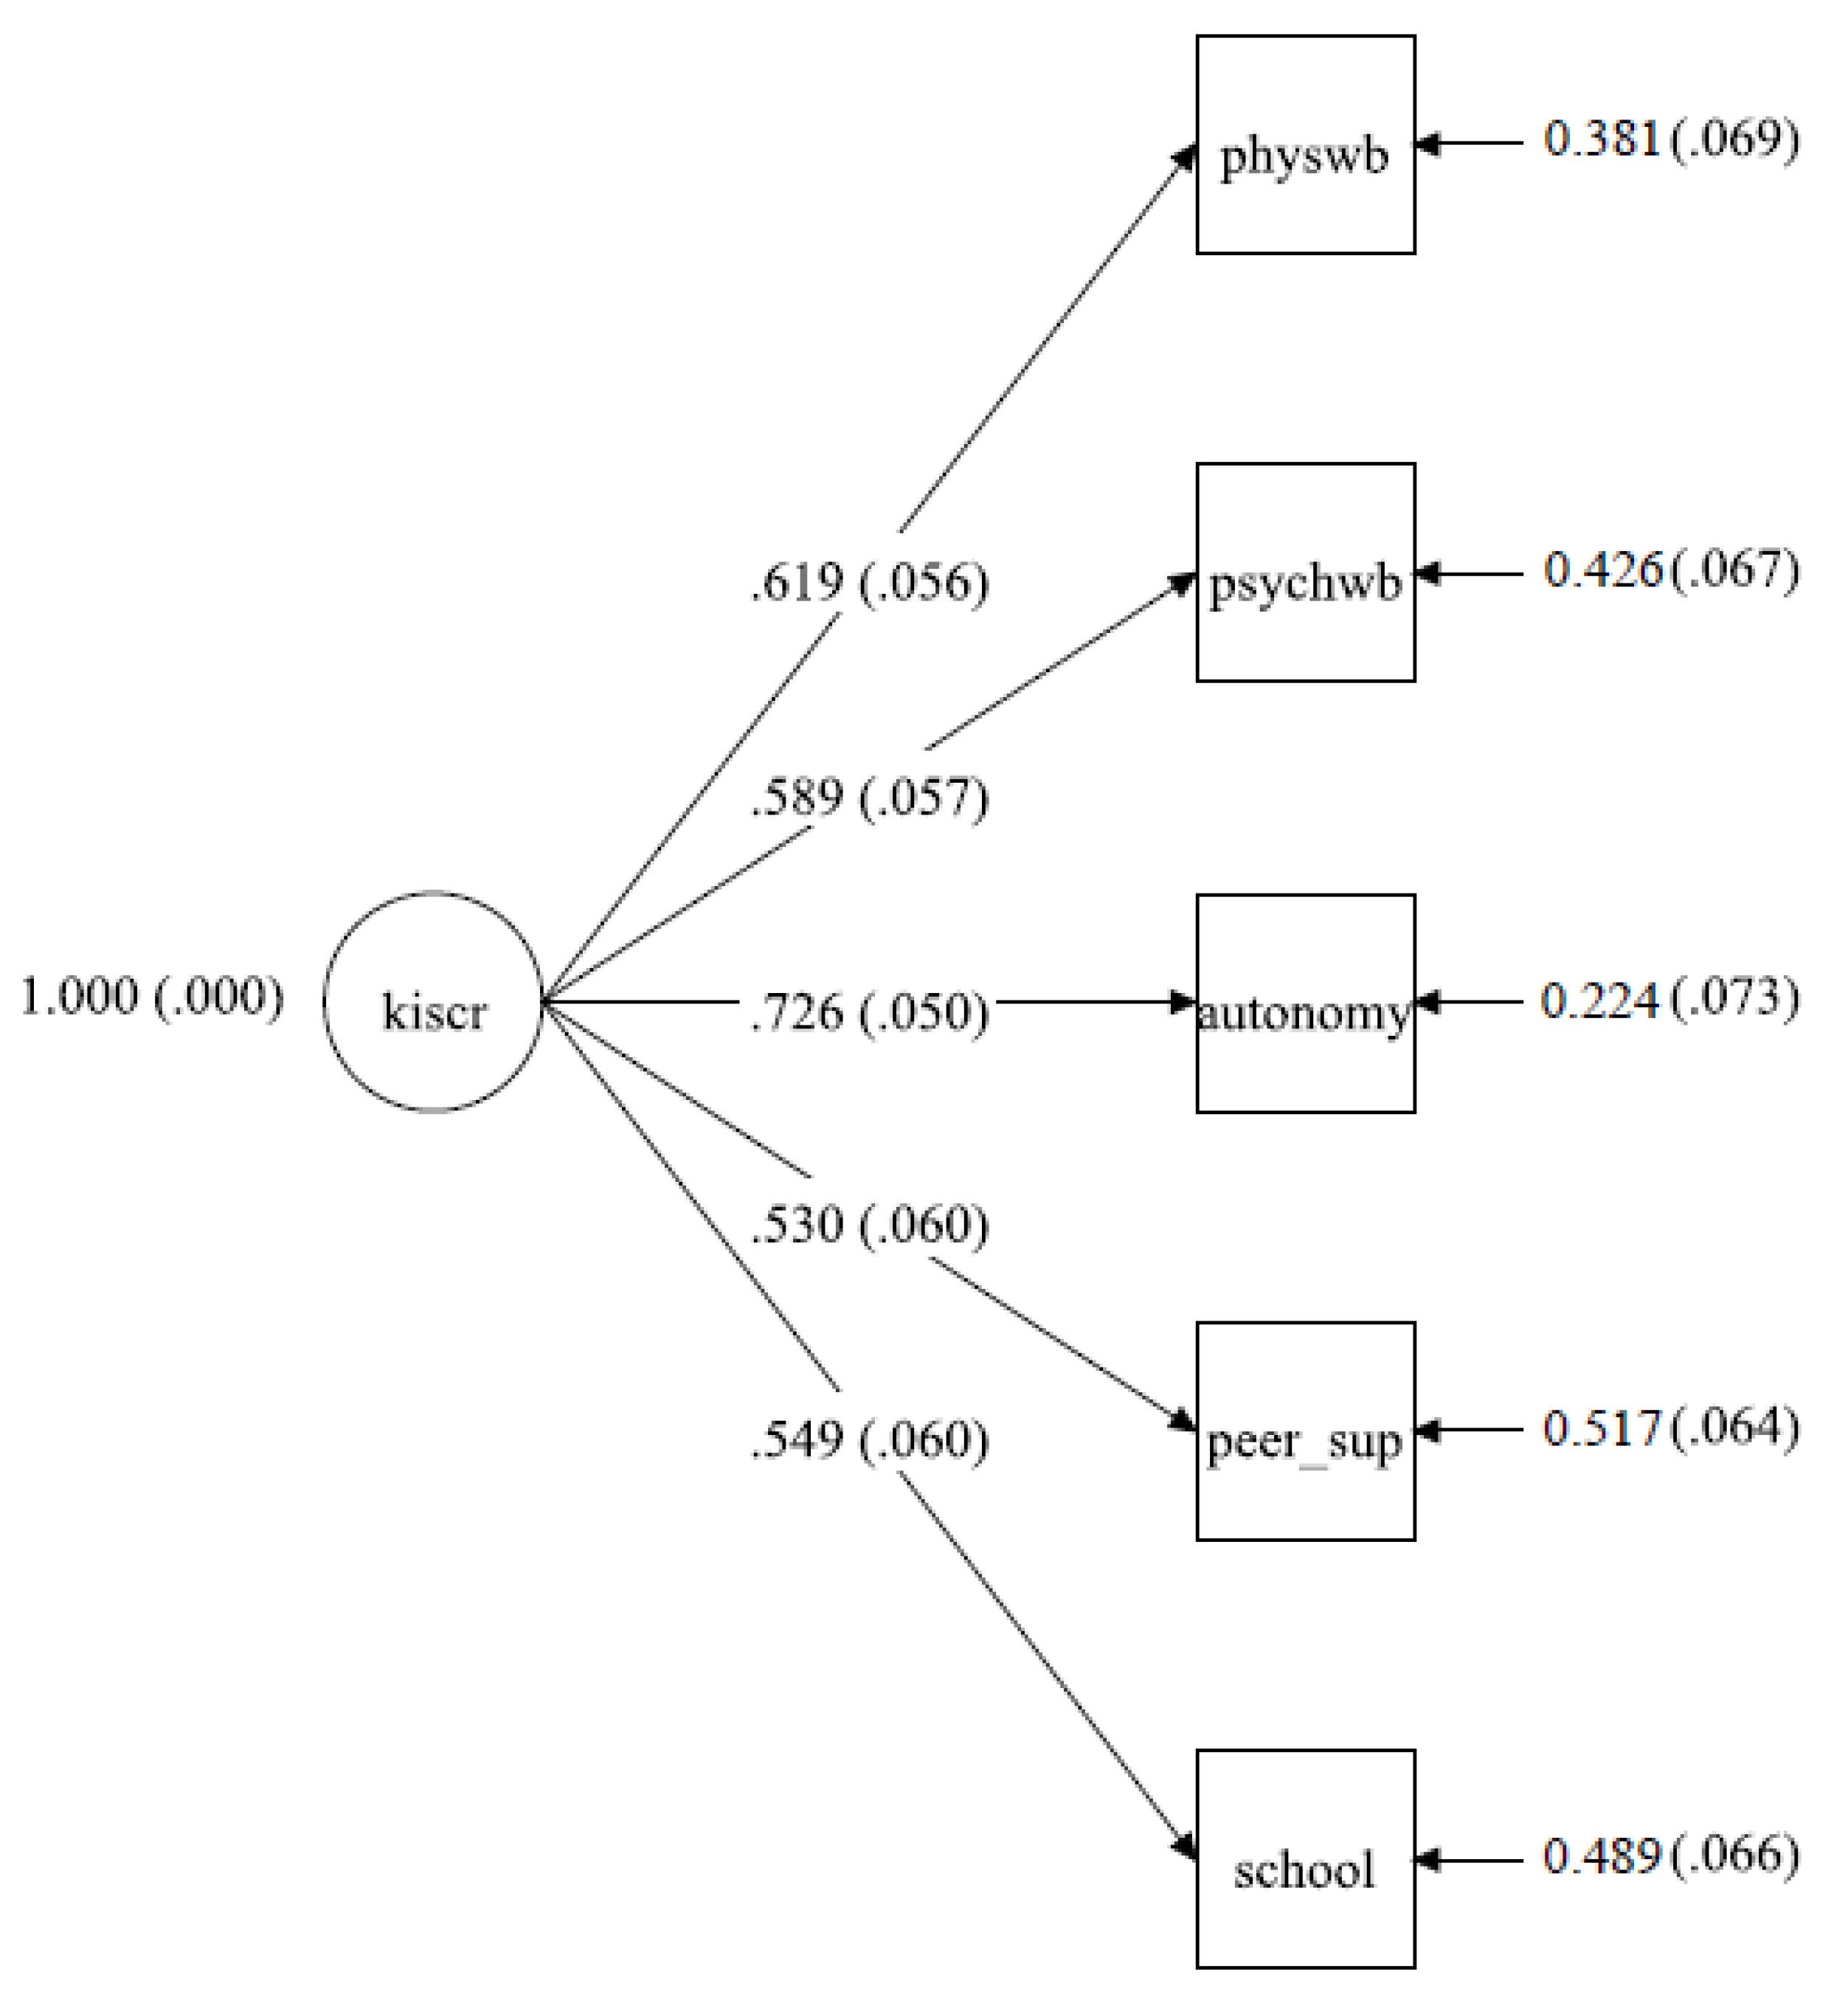

Table 1.
Population characteristics.
| Population Characteristics | Overall, N = 370 | Females, N = 182 | Males, N = 188 | p-Value |
|---|---|---|---|---|
| Age (years, mean±SD) | 12.76±0.94 | 12.89±0.91 | 12.63±0.95 | 0.009 |
| IOTF category | 0.725 | |||
| Underweight/Normal weight | 170 (76%) | 98 (77%) | 72 (74%) | |
| Overweight/Obese | 54 (24%) | 29 (23%) | 25 (26%) | |
| Missing | 146 | 55 | 91 | |
| Live with both parents | 0.512 | |||
| No | 28 (13%) | 18 (14%) | 10 (10%) | |
| Yes | 194 (87%) | 108 (86%) | 86 (90%) | |
| Missing | 146 | 56 | 92 | |
| Nationality | 0.07 | |||
| Italian | 186 (83%) | 111 (87%) | 75 (77%) | |
| Other | 38 (17%) | 16 (13%) | 22 (23%) | |
| Missing | 146 | 55 | 91 | |
| Mother citizenship | 0.181 | |||
| Italian | 179 (81%) | 106 (84%) | 73 (76%) | |
| Other | 43 (19%) | 20 (16%) | 23 (24%) | |
| Missing | 146 | 56 | 92 | |
| Father citizenship | 0.7 | |||
| Italian | 193 (87%) | 111 (88%) | 82 (85%) | |
| Other | 29 (13%) | 15 (12%) | 14 (15%) | |
| Missing | 146 | 56 | 92 | |
| Parents citizenship | 0.228 | |||
| Both Italians | 173 (78%) | 103 (82%) | 70 (73%) | |
| One Italian-One other | 26 (12%) | 11 (8.7%) | 15 (16%) | |
| Both other | 23 (10%) | 12 (9.5%) | 11 (11%) | |
| Missing | 146 | 56 | 92 | |
| Parents citizenship dichotomic | 0.159 | |||
| Both Italians | 173 (78%) | 103 (82%) | 70 (73%) | |
| Other | 49 (22%) | 23 (18%) | 26 (27%) | |
| Missing | 146 | 56 | 92 | |
| Mother educational level | 0.651 | |||
| Middle school or lower | 44 (20%) | 26 (21%) | 18 (19%) | |
| High school | 109 (49%) | 64 (51%) | 45 (47%) | |
| University degree or higher | 69 (31%) | 36 (29%) | 33 (34%) | |
| Missing | 146 | 56 | 92 | |
| Father educational level | 0.442 | |||
| Middle school or lower | 60 (27%) | 35 (28%) | 25 (26%) | |
| High school | 111 (50%) | 66 (52%) | 45 (47%) | |
| University degree or higher | 51 (23%) | 25 (20%) | 26 (27%) | |
| Missing | 146 | 56 | 92 | |
| Parents highest educational level | 0.651 | |||
| Middle school or lower | 39 (18%) | 23 (18%) | 16 (17%) | |
| High school | 114 (51%) | 67 (53%) | 47 (49%) | |
| University degree or higher | 69 (31%) | 36 (29%) | 33 (34%) | |
| Missing | 148 | 56 | 92 | |
| Mother employed | >0.999 | |||
| Yes | 34 (15%) | 19 (15%) | 15 (16%) | |
| No | 188 (85%) | 107 (85%) | 81 (84%) | |
| Missing | 146 | 56 | 92 | |
| Mother employment status | 0.105 | |||
| Unemployed | 34 (15%) | 19 (15%) | 15 (16%) | |
| Part time | 70 (32%) | 47 (37%) | 23 (24%) | |
| Full time | 117 (53%) | 60 (48%) | 57 (60%) | |
| Missing | 146 | 56 | 93 | |
| Father employed | >0.999 | |||
| Yes | 5 (2.3%) | 3 (2.4%) | 2 (2.1%) | |
| No | 217 (98%) | 123 (98%) | 94 (98%) | |
| Missing | 148 | 56 | 92 | |
| Family working status | 0.981 | |||
| One employed or less | 38 (17%) | 21 (17%) | 17 (18%) | |
| Both employed | 184 (83%) | 105 (83%) | 79 (82%) | |
| Missing | 148 | 56 | 92 | |
| Physical Well-Being (5)1 | 18.51±3.38 | 18.02±3.46 | 19.16±3.19 | 0.013 |
| Missing | 146 | 56 | 92 | |
| Psychological Well-Being (7) | 27.66±4.25 | 26.65±4.47 | 28.94±3.58 | <0.001 |
| Missing | 146 | 61 | 93 | |
| Parents & Autonomy (7) | 28.09±4.59 | 27.33±4.92 | 29.07±3.93 | 0.005 |
| Missing | 146 | 56 | 92 | |
| Social Support & Peers (4) | 16.73±2.59 | 16.64±2.58 | 16.85±2.60 | 0.548 |
| Missing | 146 | 56 | 92 | |
| School Environment (4) | 14.27±2.30 | 14.34±2.20 | 14.19±2.42 | 0.622 |
| Missing | 146 | 56 | 92 | |
| KIDSCREEN 27 total score | 105.79±12.20 | 103.77±12.38 | 108.37±11.53 | 0.006 |
| Missing | 146 | 61 | 93 | |
| Long jump (centimeters)2 | 154.22±33.08 | 144.13±30.69 | 164.18±32.43 | <0.001 |
| Missing | 67 | 42 | 46 | |
| Shuttle run (seconds)2 | 12.13±1.54 | 12.51±1.38 | 11.77±1.59 | <0.001 |
| Missing | 96 | 49 | 47 | |
| 6 minutes Cooper test (meters)2 | 1,807.28±378.68 | 1,645.75±313.79 | 1,977.64±367.35 | <0.001 |
| Missing | 105 | 47 | 60 | |
| PAQ-A score | 2.25±0.62 | 2.08±0.58 | 2.48±0.58 | <0.001 |
| Missing | 146 | 56 | 92 |
Notes: 1Numbers in parentheses adjacent to scale name indicate the number of items in scale. 2These variables are transformed in the path model by dividing them by a constant.
Table 2.
Correlations between IVs and DV (all 5 subscales).
| Variable | Physical WB | Psychological WB | Parents & Autonomy | Social Support & Peers | School Environment | KIDSCREEN 27 | PAQ-A score | Long jump | Shuttle run | Cooper test | Age |
|---|---|---|---|---|---|---|---|---|---|---|---|
| Physical WB | 0.481 | 0.435 | 0.362 | 0.358 | 0.714 | 0.579 | 0.352 | -0.408 | 0.361 | -0.116 | |
| Psychological WB | - | 0.536 | 0.349 | 0.453 | 0.824 | 0.141 | 0.181 | -0.095 | 0.169 | -0.210 | |
| Parents & Autonomy | 0.422 | 0.375 | 0.805 | 0.206 | 0.073 | -0.162 | 0.112 | -0.070 | |||
| Social Support & Peers | 0.256 | 0.595 | 0.189 | 0.119 | -0.073 | 0.146 | -0.074 | ||||
| School Environment | 0.606 | 0.075 | -0.029 | -0.092 | 0.082 | -0.163 | |||||
| KIDSCREEN 27 | 0.313 | 0.192 | -0.200 | 0.230 | -0.158 | ||||||
| PAQ-A score | 0.263 | -0.349 | 0.339 | -0.092 | |||||||
| Long jump | -0.727 | 0.496 | 0.144 | ||||||||
| Shuttle run | -0.569 | -0.062 | |||||||||
| Cooper test | -0.022 | ||||||||||
| Age |
Table 3.
Standardized Coefficients from Path Model.
| Structural Path Coefficients | |||||||
| Univariate Model1 | Multivariate Model | Fully Adjusted Model3 | |||||
| Measure | β | 95% CI | β | 95% CI | β | 95% CI | |
| Covariates | |||||||
| Age | -.136m | -0.280 – 0.008 | -.139* | -0.254 – -0.023 | -.136* | -0.250 – -0.023 | |
| Nationality | -.058 | -0.220 – 0.103 | –2 | ||||
| Gender | -.204** | -0.346 – -0.062 | .142* | 0.011 – 0.273 | .140* | 0.017 – 0.263 | |
| Living situation | .164* | 0.023 – 0.305 | –2 | ||||
| Parent’s employment status | .235** | 0.087 – 0.384 | .145* | 0.031 – 0.259 | .142* | 0.027 – 0.257 | |
| Parent’s educational status | .032 | -0.111 – 0.176 | .135* | 0.023 – 0.248 | .133* | 0.022 – 0.244 | |
| Parent’s citizenry (immigration status) | -.043 | -0.212 – 0.126 | –2 | ||||
| Cardio Fitness and Physical Activity Measures | |||||||
| PAQ-A (PA) | .418*** | 0.257 –0.579 | .429*** | 0.304 – 0.554 | .421*** | 0.300 – 0.542 | |
| Cooper Test (speed) | .184* | 0.033 – 0.336 | .221** | 0.087 – 0.355 | .218** | 0.089 – 0.346 | |
| Long jump | .011 | -0.199 – 0.221 | –2 | –2 | |||
| Shuttle run (agility) | -.186* | -0.371 – -0.001 | -.207** | -0.337 – -0.077 | -.203** | -0.329 – -0.077 | |
Notes: 1Model parameters are for the fully saturated model not trimmed for nonsignificant effects. 2Variables with no statistical information in the multivariate or fully adjusted models were trimmed for non-significance. 3This model includes correlations among continuous independent measures. β= standardized coefficients; CI = 95% confidence interval. A model that replaced age with the IOTF produced several differences in parameter estimates. * P < .05; ** P < .01; *** P < .001; m = marginal, P < .08.
Disclaimer/Publisher’s Note: The statements, opinions and data contained in all publications are solely those of the individual author(s) and contributor(s) and not of MDPI and/or the editor(s). MDPI and/or the editor(s) disclaim responsibility for any injury to people or property resulting from any ideas, methods, instructions or products referred to in the content. |
© 2023 by the authors. Licensee MDPI, Basel, Switzerland. This article is an open access article distributed under the terms and conditions of the Creative Commons Attribution (CC BY) license (http://creativecommons.org/licenses/by/4.0/).
Copyright: This open access article is published under a Creative Commons CC BY 4.0 license, which permit the free download, distribution, and reuse, provided that the author and preprint are cited in any reuse.