
Submitted:
09 June 2023
Posted:
09 June 2023
You are already at the latest version
Abstract
The economic downturn caused by the financial crisis of 2008-2009 and the intensifying glob-al climate policy trends forced changes in the energy management of the European Union. The study examined how the most relevant energy economic variables affected the economic growth of the EU between 2010-2019. The study examined the relationship between GDP (dependent variable) and energy consumption, greenhouse gas emissions, the average energy price, and renewable energy use (independent variables) using the PSL-PM methodology. The results show an asymmetric picture because the independent variables influenced the eco-nomic growth of the EU in the examined period with different correlations and with different strengths. One of the significances of the study is that the presented and analyzed variables, as well as the results of the relationships between them, can contribute to the optimization of the EU's currently critical energy management and economic growth.
Keywords:
economic growth
; energy economics
; independent energy variables
; PLS-PM analysis
; asymmetric effect
1. Introduction
Abbreviations used in the study: gross domestic product (GDP), energy price (EnP), renewable energy (ReE), energy consumption (EnC), greenhouse gas emissions (CO2), European Union (EU).
The study examines the relationship between energy management variables in the EU 2010-2019 period and the Union's economic growth. The analysis of past data enables the recognition of time-related trends, the identification of correlations between energy variables and critical points that may affect the future energy management processes of the EU. The analysis of data from 2010-2019 helps to understand the causes and consequences of past events and can therefore improve the quality of future decisions regarding EU energy management.
All researchers should be aware that analyzing past data generally does not guarantee future results, but can help reduce risk and increase opportunities to make better decisions for the future. Europe's current energy situation cannot be considered ideal from several points of view, since it does not have a large amount of energy carrier assets that would be able to adequately satisfy a significant part of its needs. The decrease in production resulting from the depletion of traditional energy resources is currently not offset by non-conventional (oil shale, oil sand, shale gas) resources, the exploitation of which is hampered by several factors.
After the 2008 global economic crisis, the European Union is trying to create mechanisms through which it can prevent negative global energy management effects. The creation of the new mechanism was necessary because the EU's economic growth was threatened by growing import dependence, limited diversification, high and variable energy prices, and growing global energy demand. Additional sources of danger were the security problems affecting the producing and transit countries, the growing threat from climate change, and decarbonization. Following the subprime crisis, there was a need to speed up the slow progress achieved in the field of energy efficiency in the EU, to increase the share of renewable energy sources, and for greater transparency, further integration, and interconnection of energy markets.
2. Literature Review
The relationship between the energy economic variables examined in this study and economic growth was analyzed separately by several articles [1,2,3,4,5,6,7,8].
The EU's energy management underwent significant changes following the 2008-2009 financial crisis. Increasing energy efficiency has become one of the most important objectives of the EU. The EU's setting of energy efficiency targets and related legislation and programs have helped to ensure that the reduction of energy consumption contributes to the economic growth of the EU, environmental protection, and increased competitiveness [9,10,11].
The second significant change in the EU's energy management objectives was the increase in the use of renewable energy sources. The EU strengthened its policies aimed at switching to renewable energy sources (such as solar energy, wind energy, etc.) and reducing carbon dioxide emissions. The member states of the EU undertook to provide 20 percent of their total energy consumption with the use of energy from renewable sources by 2020 [12,13,14]. Improving energy security became the third priority objective in the EU. The EU also strengthened efforts to improve energy security after the crisis. The goal was to ensure that the energy supply was reliable, safe and that the energy balance could be maintained in the EU member states. In this context, the EU paid more attention to the diversification of gas supply, the expansion of energy infrastructure, and the creation of more efficient energy networks [15,16,17].
Reducing energy prices has also become an important objective in EU energy management. As a result of the financial crisis, the price of energy carriers temporarily decreased, but energy prices started to rise again after 2010. Fluctuations in energy prices represented a strong economic risk. Rising prices motivated the EU to further reduce its energy needs and further diversify energy sources. Ensuring competitiveness has become a vital issue for the EU, but this has been made difficult by significant primary energy imports and high energy prices [18,19].
Among researchers, there is still a lot of uncertainty regarding the connection between economic growth and energy management. The relevance of the topic of this research is that it connects the economic growth of the EU with the selected four independent variables for the period 2010-2019. The investigation will reveal which of the independent energy economic variables (EnC, CO2, EnP, ReF) had a positive relationship with economic growth as a target variable (GdP). The energy economy variables showing a positive correlation can provide the EU with guidance on which energy management areas need to be strongly developed for the EU economy to grow sustainably and competitively.
The values of the target variable and independent variables presented in the study also indicate what results in the EU achieved in the above-mentioned objectives during the period under review. In recent years, more and more literature has appeared on the interaction between economic growth and other macroeconomic variables. However, a study that correlates the economic growth of the EU in this selected period (2010-2019) with the independent variables presented here has not yet been published.
The results of the study will provide a basis for drawing public policy conclusions regarding the EU's energy management.
3. Materials and Methods
The basic data of the PLS-SEM analysis are contained in the table below:

Table 1.
Values of the target variable (GDP) and independent energy variables (2010-2019).
| Year | EnC* | CO2** | EnP*** | ReE**** | GDP***** |
|---|---|---|---|---|---|
| 2010 | 1559 | 3952 | 60.30 | 225 | 10982 |
| 2011 | 1514 | 3851 | 63.70 | 217 | 11055 |
| 2012 | 1494 | 3767 | 63.30 | 239 | 11264 |
| 2013 | 1479 | 3681 | 63.80 | 246 | 11698 |
| 2014 | 1428 | 3563 | 58.20 | 249 | 12024 |
| 2015 | 1448 | 3619 | 56.70 | 258 | 12215 |
| 2016 | 1460 | 3637 | 52.70 | 269 | 12636 |
| 2017 | 1491 | 3723 | 50.60 | 274 | 13047 |
| 2018 | 1481 | 3642 | 53.10 | 283 | 13484 |
| 2019 | 1458 | 3497 | 52.40 | 290 | 14015 |
*EnC: (million tonnes of oil equivalent), [20], ** CO2: (in thousand kilo tons CO2 equivalent), [21], *** EnP: Non-residential, non-weighted average price of energy (euro/thousand KW-hour), [22], ****ReE: (million tonnes of oil equivalent), [23], ******Gross Domestic Product (million euros, at PPP prices), [24].
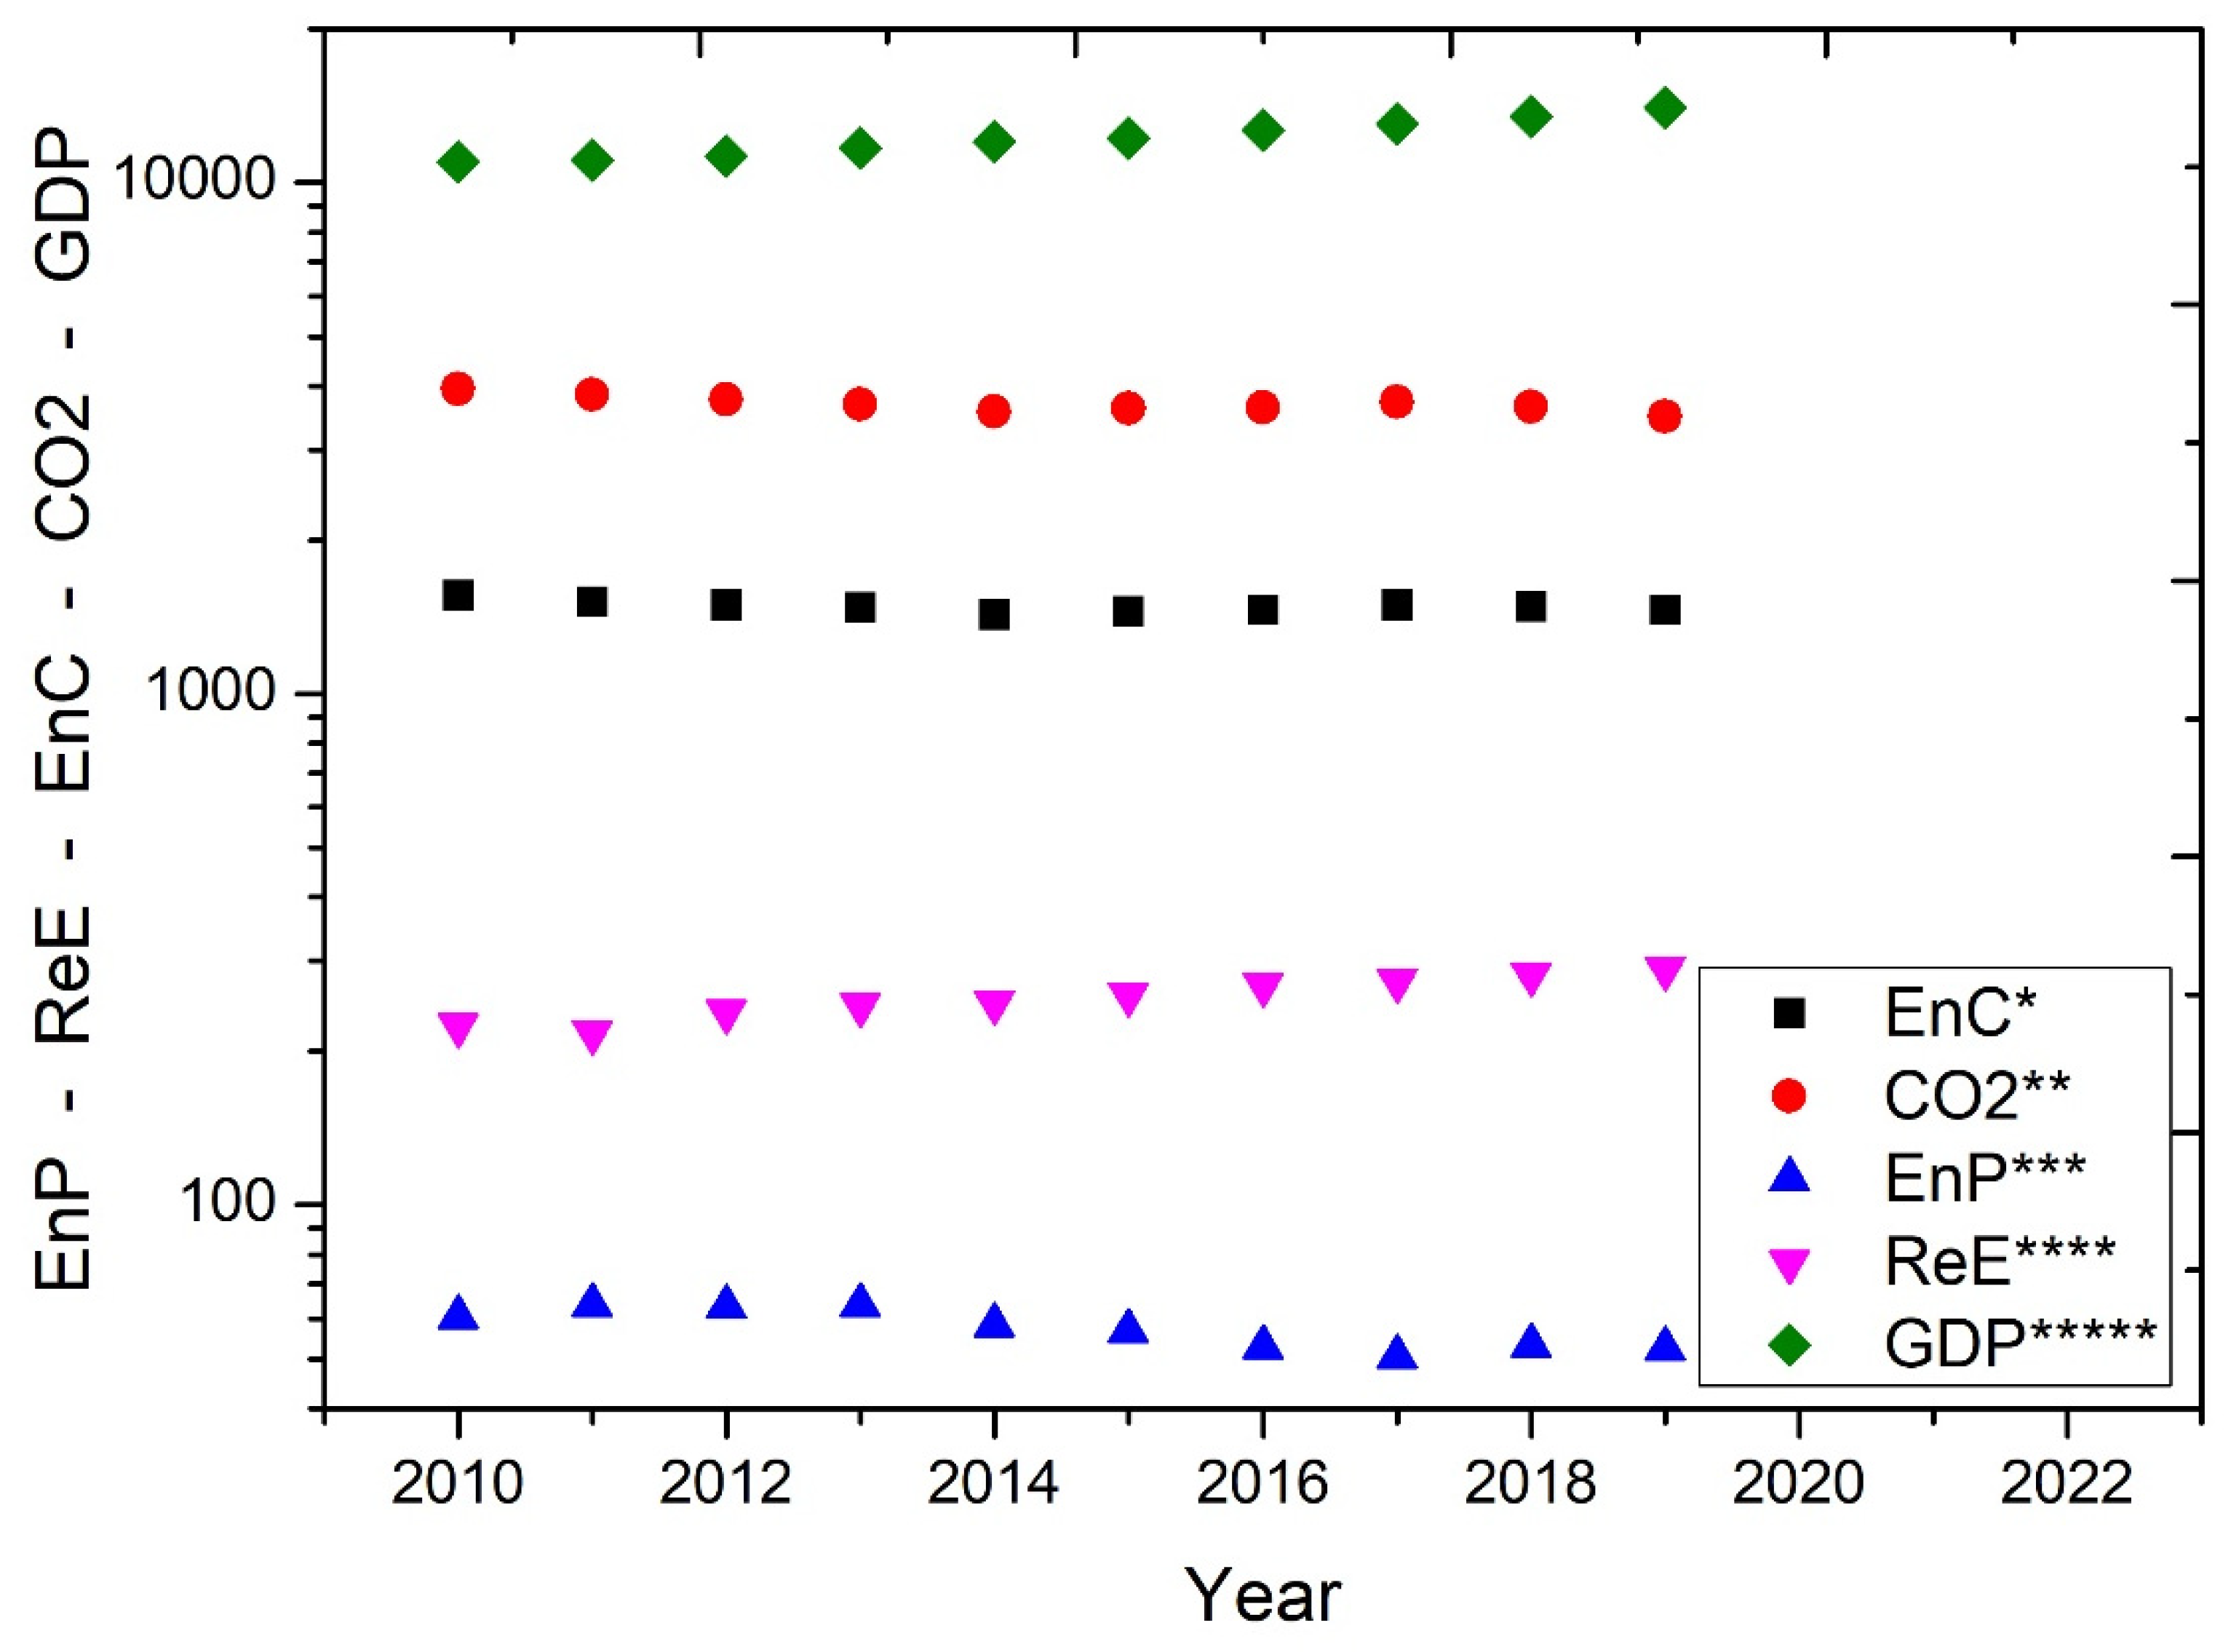
Based on the time series data, the values of GDP and ReE show a continuous increase, while the values of EnC and CO2 show a permanent decrease. However, fluctuations in the EnP values can be observed.
Figure 1.
Representation of the values of GDP and energy economy variables between 2010-2019.
The study chose the PLS-SEM method to conduct the investigation. In the field of social sciences, it is often necessary to examine theoretical constructs that cannot be directly measured. In addition to measuring these constructions, it is necessary to create an opportunity to learn about the system of relationships between them and to measure their impact on each other. The method of structural equations, i.e. SEM (structural equation modeling), is suitable for this [25]. There are two approaches to exploring the relationships: CB-SEM (covariance-based) approaches the connections of the model on a covariance basis, while PLS-SEM approaches the model connections on a variance basis [26]. In the case of a small number of sample elements, the choice of the PLS method is the most appropriate [27].
In the case of models consisting of purely created variables (emergent variables) and constellations with a small number of elements, PLS-PM performs outstandingly in comparison with other variance-based methods [28], since accuracy plays a prominent role when estimating path coefficients [29]. Due to the nature of PLS-SEM, it always uses a composite model for estimation, regardless of whether it is a latent or composite model. Due to the previous statement, the rules for the identification of composite models must be strictly followed [30,31].
During the definition of the model, it must be ensured that each concept is related to at least one other concept (with a path coefficient different from 0), thus ensuring that the weights can be individually retrieved from the variance/covariance matrix of the indicators. The sign of the weights in the different indicator blocks can be ambiguous, therefore it is recommended to use the dominant indicator approach, according to which the direction of the value of the concepts must be recorded [32].
In this study, PLS-PM was chosen because of its minimal sample size requirement and its precise computational and modern approach to model development. In addition, PLS-PM has low data dependence and does not need to constrain parameters, and the model setup is simple and easy to handle [33,34].
Table 2.
Descriptive analysis of variables.
| Name | No. | Mean | Median | Scale min | Scale max | Obs. min | Obs. max | Stand. dev. | Exc. kurt. | Skewn. | Cramér- von Mises p-value |
|---|---|---|---|---|---|---|---|---|---|---|---|
| Year | 0 | 2014 | 2015 | 2010 | 2019 | 2010 | 2019 | 2.87 | -1.200 | 0.000 | 0.911 |
| EnC | 1 | 1481 | 1481 | 1428 | 1559 | 1428 | 1559 | 35.09 | 1.204 | 0.823 | 0.768 |
| CO2 | 2 | 3693 | 3681 | 3497 | 3952 | 3497 | 3952 | 128.49 | 0.170 | 0.627 | 0.731 |
| EnP | 3 | 57.00 | 58.00 | 51.00 | 64.00 | 51.00 | 64.00 | 0.005 | -1.785 | 0.064 | 0.237 |
| ReE | 4 | 255.0 | 258.0 | 217.0 | 290.0 | 217.0 | 290.0 | 23.0 | -1.024 | -0.121 | 0.907 |
| GdP | 5 | 12242 | 12215 | 10982 | 14015 | 10982 | 14015 | 989.27 | -0.977 | 0.403 | 0.784 |
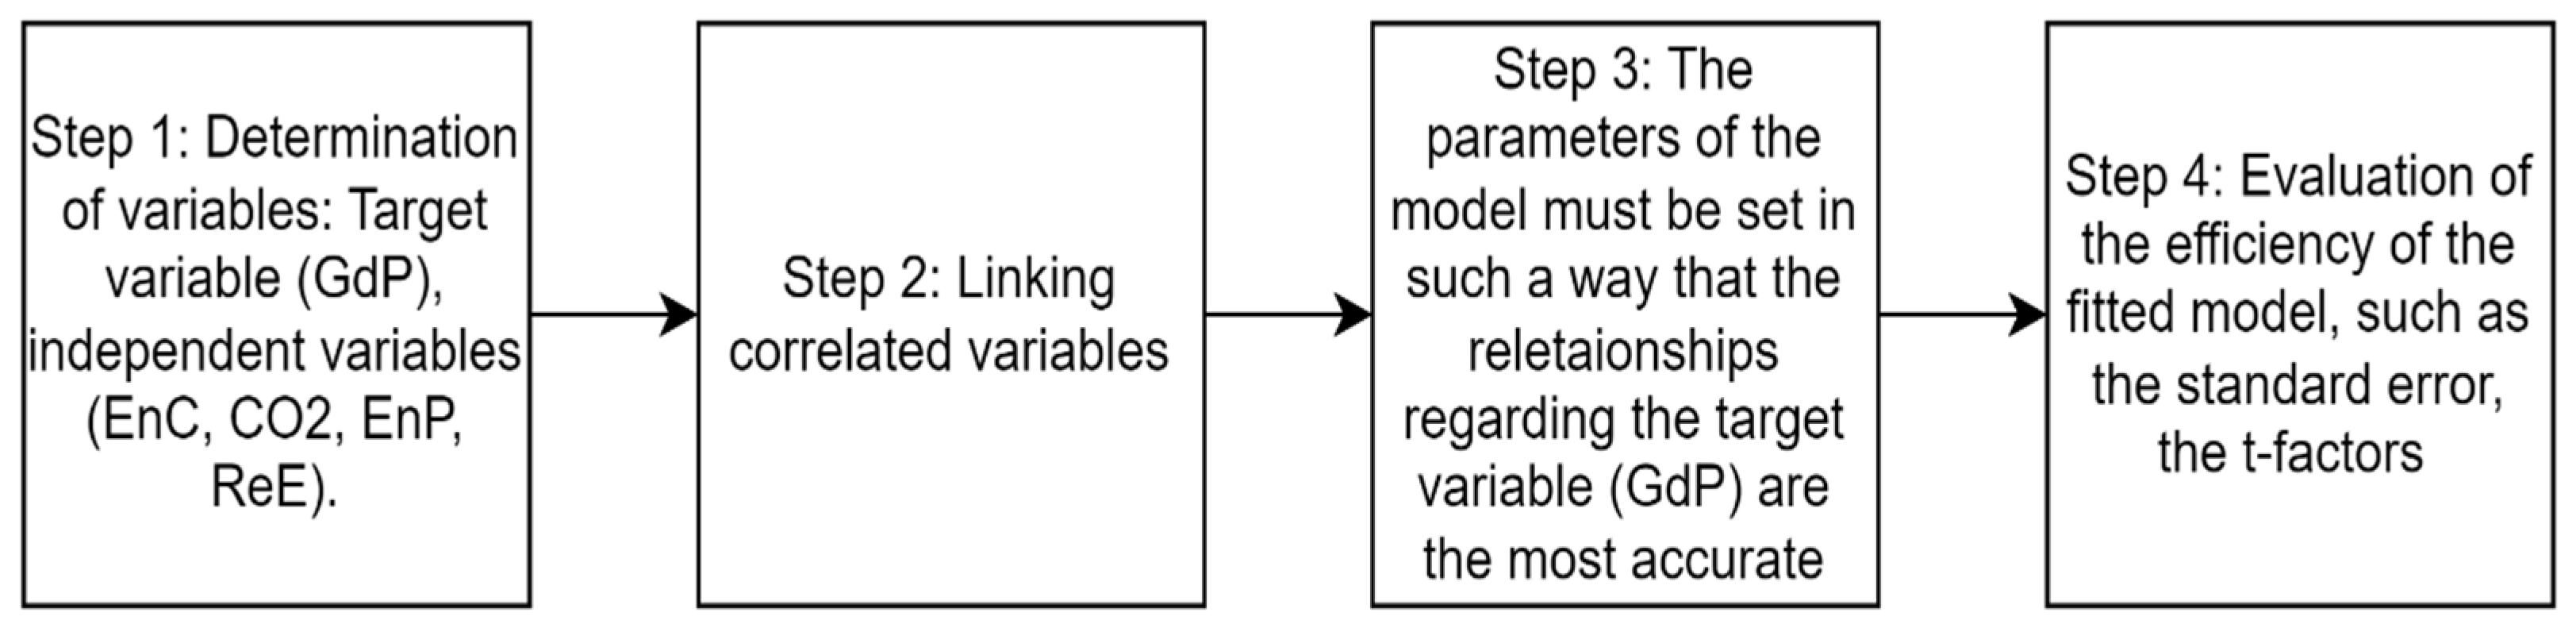
The steps of the PLS-PM analysis were as follows:
Model structure: For the PLS-PM analysis, the variables of the model had to be defined first, i.e. the dependent (GDP) and independent variables (EnC, CO2, EnP, ReE).
Correlation of the model: The correlations between the four independent variables and the dependent variable had to be examined, and the variables with a strong correlation had to be connected to form a smaller number of but higher-level factors.
Model fitting: The model created in the previous step had to be fitted to the data using the PLS-PM algorithm. During the fitting, the parameters of the model had to be adjusted so that the relationships regarding the dependent variable (GDP) were as accurate as possible.
Model evaluation: The effectiveness of the fitted model had to be evaluated with several statistical indicators, such as the R^2 or Q^2 value of the model fit, the standard error, t-factors, effects, etc. The evaluation helped to understand the relationships between the dependent and independent variables and their effect on the dependent variable.
The following figure shows the individual technical steps:
Figure 2.
The main stages of the research and the procedures carried out in them.
After the standardization step applied during the preprocessing, the following mathematical equations and formulas were used by the algorithm when performing the PLS-PM analysis.
Structural equation:
where GDP is the GDP of the European Union, E is energy consumption, CO2 is CO2 emissions, Á is the average energy price, M is renewable energy consumption, and β1-β4 are the weighting factors.
GDP = β1 * E + β2 * CO2 + β3 * Á + β4 * M
Regression equation:
where y is the dependent variable, x1-xk are the independent variables, b0-bk are the regression coefficients and e is the error.
y = b0 + b1x1 + ... + bkxk + e
Multivariate regression:
where y is the dependent variable vector, X is the matrix of independent variables, b is the vector of regression coefficients and e is the error vector.
y = Xb + e
Weighted component analysis (WCPA) formula:
where F is the factor space, X is the original data matrix, W is the weighting matrix, and V is the covariance matrix.
F = XW(V'W)-1
The formula of component weights:
where w is the component weights, X is the matrix of the original data, P is the weighting matrix of the predictive variables for the multivariate regression, F is the factor space.
w = (X'PF)/(F'PF)
Two-matrix structural equation (2M-SEM) model:
where X are the independent variables, Y are the dependent variables, Λ and Γ are the weights of the independent and dependent factors. Ψ and Δ are the effects of the independent and dependent factors, F and U are the factors and error, and e and d are the error vectors.
X = ΛF + ΨU + e,
Y = ΓF + ΔU + d
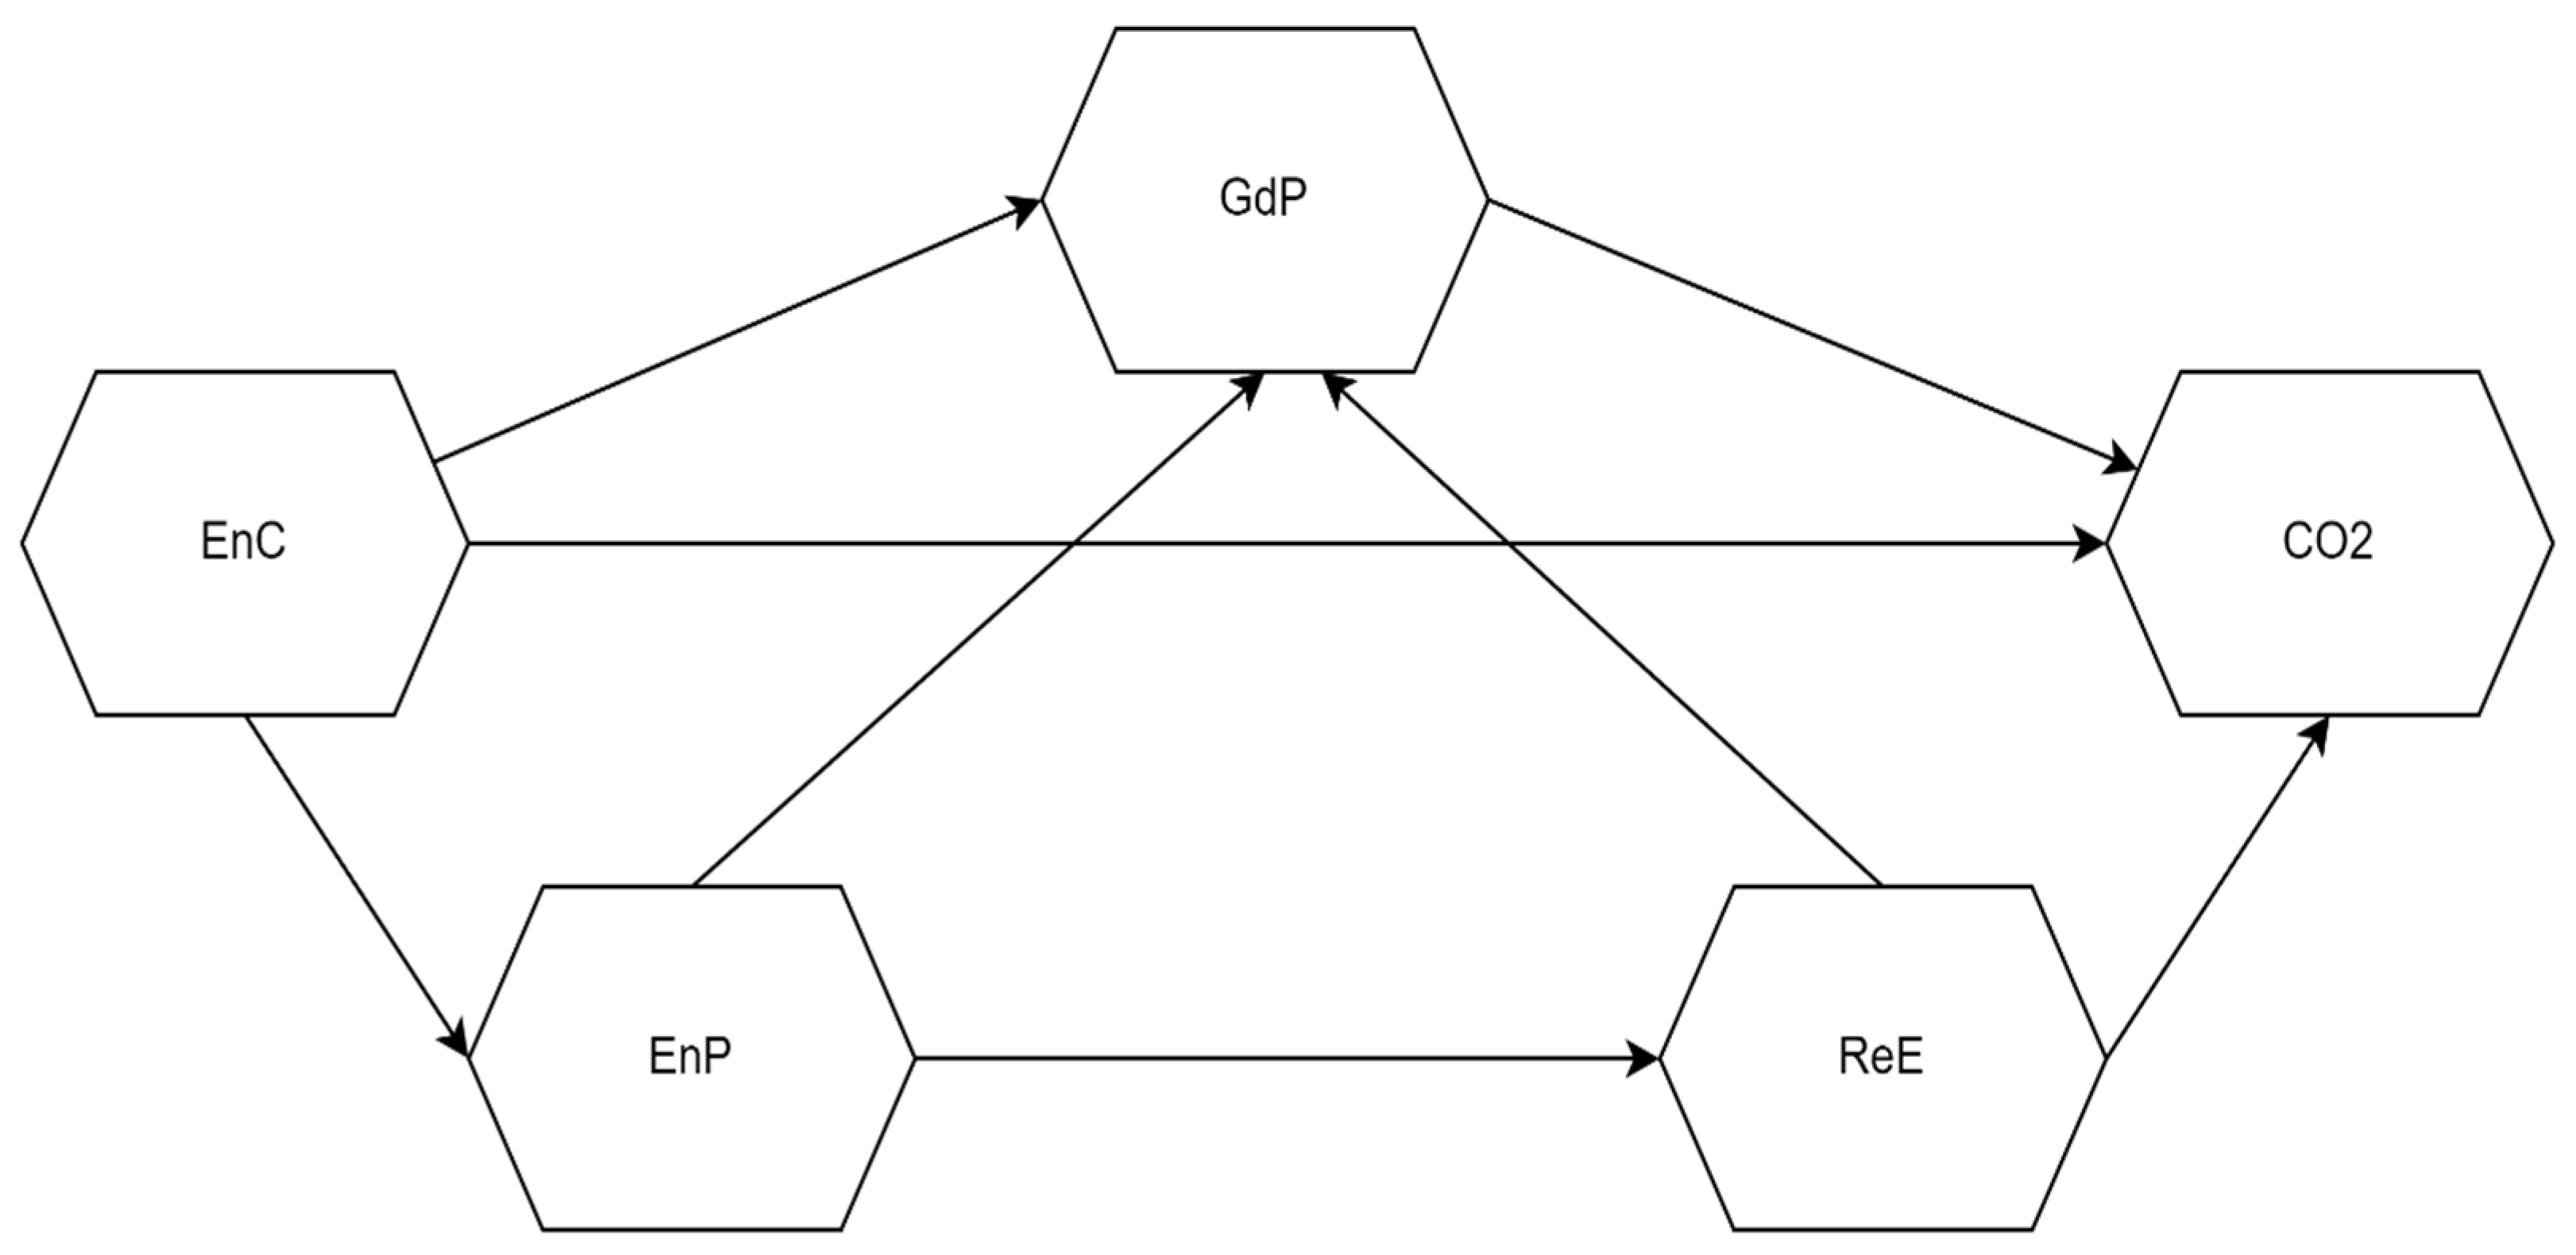
With the method described in the study, the relationships between the dependent (target) variable, the European Union's GDP (GdP), and the four independent variables were revealed, so the energy economic factors behind the development of the GDP became better understood. An important step in PLS-PM analysis is the specification of the model and its relationship with the dependent variable. The model looked like this:
Dependent (target) variable: European Union GDP value (GDP), Independent variables: Energy consumption (EnC), CO2 greenhouse gas emissions (CO2), Average energy price (EnP), Renewable energy consumption (ReE). The next step was to build the model, which includes the structural relationships between the dependent and independent variables.
The relationships were defined as follows:
Energy consumption and CO2 greenhouse gas emissions have a positive effect on GDP. Average energy price has a negative effect on GDP. Renewable energy use has no direct impact on GDP.
The model consists of a total of 4 factors, i.e. 4 independent variables.
The results are as follows:
The purpose of the PLS-PM analysis is to understand the effect of the independent variables (energy consumption, CO2 emissions, average energy price, renewable energy consumption) on the dependent variable (European Union GDP) in the period 2010-2019. By analyzing the correlation matrix, we determined which independent variables have a strong positive or negative relationship. Through principal component analysis, we identified the factors that explain the largest variance.
Figure 3.
Connections of target variable and independent variables.
4. Results
Below, the study presents the results of the PLS-PM analysis it carried out to examine the energy management and economic growth of the European Union. During the analysis, the GDP of the EU was the dependent variable, while energy consumption, greenhouse gas emissions, average energy price, and renewable energy use were the independent variables.
Table 3 shows that GDP is negatively correlated with energy consumption, CO2 emissions, and the average energy price.
Table 3.
Correlations between GDP and the four independent variables based on the basic data.
| Variables | GdP | EnC | CO2 | EnP | ReE |
| GdP | 1.00 | -0.51 | -0.75 | -0.87 | 0.97 |
| EnC | -0.51 | 1.00 | 0.93 | 0.37 | -0.55 |
| CO2 | -0.75 | 0.92 | 1.00 | 0.53 | -0.77 |
| EnP | -0.87 | 0.37 | 0.53 | 1.00 | -0.87 |
| ReE | 0.97 | -0.55 | -0.77 | -0.87 | 1.00 |
At the same time, it has a close positive relationship with renewable energy. Energy consumption, CO2 emissions, and the average energy price are in strong positive contact with each other, but there is a negative correlation between energy consumption and renewable energy. The average energy price has a close negative relationship with renewable energy, but it is positively correlated with energy consumption and CO2 emissions. Renewable energy is in negative contact with energy consumption, CO2 emissions, and the average energy price. According to the results, three of the four independent variables (energy consumption, CO2 emissions, average energy price) effectively explain GDP growth, and four factors can be created from these variables. The fourth variable (renewable energy consumption) has a smaller effect on GDP growth, the 5th factor created from these variables explains the variance more significantly.
The study summarizes the results as follows:
Factor 1: The relationship between economic growth and energy consumption. The decreasing values of energy consumption, CO2 emissions, the average energy price, and energy balance in the examined period effectively explain the GDP growth in the EU.
GDP growth is negatively correlated with CO2 emissions, showing that the EU economy is still highly dependent on fossil fuels. The continuous reduction of CO2 emissions had a positive effect on GDP. The average energy price is also negatively correlated with GDP growth, which shows that the reduction in prices effectively supports economic growth.
Factor 2: This shows the relevance of the utilization of renewable energy sources. The increase in the proportion of renewable energy use contributed to the growth of GDP. The positive correlation means that the GDP also increased in parallel with the increase in the use of renewable energy. The utilization of renewable energy sources can be an important factor in increasing the sustainability of economic growth.
Factor 3: Connects CO2 emissions, energy use, and average energy price, which are all important factors in energy use and environmental impact. This factor is more important in countries with a lower GDP.
Factor 4: Combines renewable energy use and energy balance, both of which refer to sustainable energy production and use. This factor is important in countries where more emphasis is placed on the use of renewable energy sources and reducing energy dependence.
Factor 5: There is a strong positive correlation between GDP and renewable energy use, indicating that this type of energy use effectively supports economic growth. It follows from this finding that EU member states with higher GDP are likely to make larger investments in the production and use of renewable energy.
One of the significances of the study's results is that the presented and analyzed EU economic variables (economic growth, energy consumption, greenhouse gas emissions, average energy price, and renewable energy consumption), as well as the existing relationships between them, can contribute to the optimization of the EU's currently critical energy management and economic growth. Past data between 2010-2019 and correlation relationships between variables can be used to forecast the future energy management and economic growth of the European Union.
Another significance of the study is that the introduction of previously unused independent energy management variables into the research allowed us to better understand the relationships between energy economic processes and economic growth. Since other researchers did not use these variables, the new approach made it possible to reveal new relationships that were not previously considered by decision-makers.
In this way, the use of new variables can contribute to the development of energy management and economic research and help decision-makers find new solutions to increase the energy efficiency of the European Union and ensure the sustainable development of the economy.
5. Discussion
The importance of the results of the research was presented at the end of the previous part of the study. Comparing the results with other researches can contribute to the expansion of the theoretical framework. Summarizing and connecting the results of individual researches enables a more comprehensive and deeper understanding, as well as the recognition of new theoretical connections between economic growth and energy economy variables. Comparing the results with other research can help identify new research directions and questions. Understanding possible contradictions or conflicting results can provide inspiration for further investigation of sustainable energy management in the EU and exploration of new research areas. In this section, the study presents research that describes the relationship between economic growth in the EU about some energy economic variables. [35] examined the relationship between energy consumption and economic growth. The study aims to examine the cause-and-effect relationship between energy consumption and economic growth in the European Union based on data from the period 1960-2015. Using the Granger causality test, the empirical results clearly showed that energy consumption contributed to the economic growth of the European Union.
Another central question of the study was how energy consumption and economic growth were related to each other and how they interacted over time and space in the European Union. The results showed that there was no robust, strong correlation between GDP and the energy consumption of the member countries. Another result of the research showed that in those member states where energy consumption dropped significantly, the decrease did not hurt economic growth [36]. The aim of the study by [37] was to examine the relationship between energy consumption and economic growth in a comparative analysis of Spain, Romania, and the European Union based on data from the period 1990-2010. Their finding is that in the short run, there were only two correlations that would sustain the growth hypothesis. In their study, examined the combined effect of various economic development factors on energy consumption and CO2 emissions in different economic environments. The study demonstrated evidence of dynamic interactions among variables. The results confirmed that there is at least a long-term equilibrium relationship between economic growth and energy consumption, CO2 emissions, FDI, and net exports [38].
A study by [39] research examined the impact of various macroeconomic variables on the economic growth of the EU-27 member states. The main results of the study show that GDP calculated at constant prices had a significant impact on GHG emissions in the EU-27 countries.
Meanwhile, the lag between inflation and employment did not have a significant impact on economic growth. Regarding the contribution of energy prices to inflation in the EU [40] study that almost half of it is caused by energy price increases. This robust contribution reflects the past development of crude oil prices, a factor that has had a common effect in all euro area countries. However, the contribution of energy to inflation depends on the share of energy in consumption expenditure and on the extent to which the development of energy prices is transferred to the consumer prices of individual countries.
The effect of different energy prices on economic growth was investigated by [41]. According to the researchers, there was a two-way causal relationship between electricity consumption and electricity prices. There was no causal relationship between kerosene consumption, kerosene prices, and economic growth. The study did not support the hypothesis of a neutral relationship between energy and economic growth. A large number of published studies describe the relationship between renewable energy and economic growth for different countries and periods.
A study found that there is a long-term equilibrium relationship between economic growth and renewable energy consumption and that renewable energy consumption has a positive effect on economic growth. The results indicate that the use of renewable energy as a global commodity is extremely important in the process of economic growth [42,43] aimed to examine the relationship between renewable energy consumption and the economic growth of countries. To investigate this connection, they analyzed data on the GDP, use of renewable energy sources, and non-renewable energy consumption of 25 European countries. The method used revealed the existence of clusters of two groups of countries. One group was a cluster of countries with high GDP and high renewable energy consumption, the other group was a cluster of countries with low GDP and low renewable energy consumption.
The study by [44] examined the development of the energy balance of EU countries. They found that only the energy demand and imports of the EU countries were closely related to the economic situation. Exports and industrial production, on the other hand, were moderately and weakly correlated with the state of the economy. A study revealed the specifics of sectoral transformations in European countries during the 2008-2009 crisis and the 2010-2019 period of stable economic growth. The results showed that, despite the efficient production structure, fluctuations in energy prices significantly influenced the economic growth of the examined countries [45].
6. Conclusions
Based on the analysis, the diagram below summarizes the sustainable energy management of the EU.
Figure 4.
The sustainable energy ecosystem of the European Union.
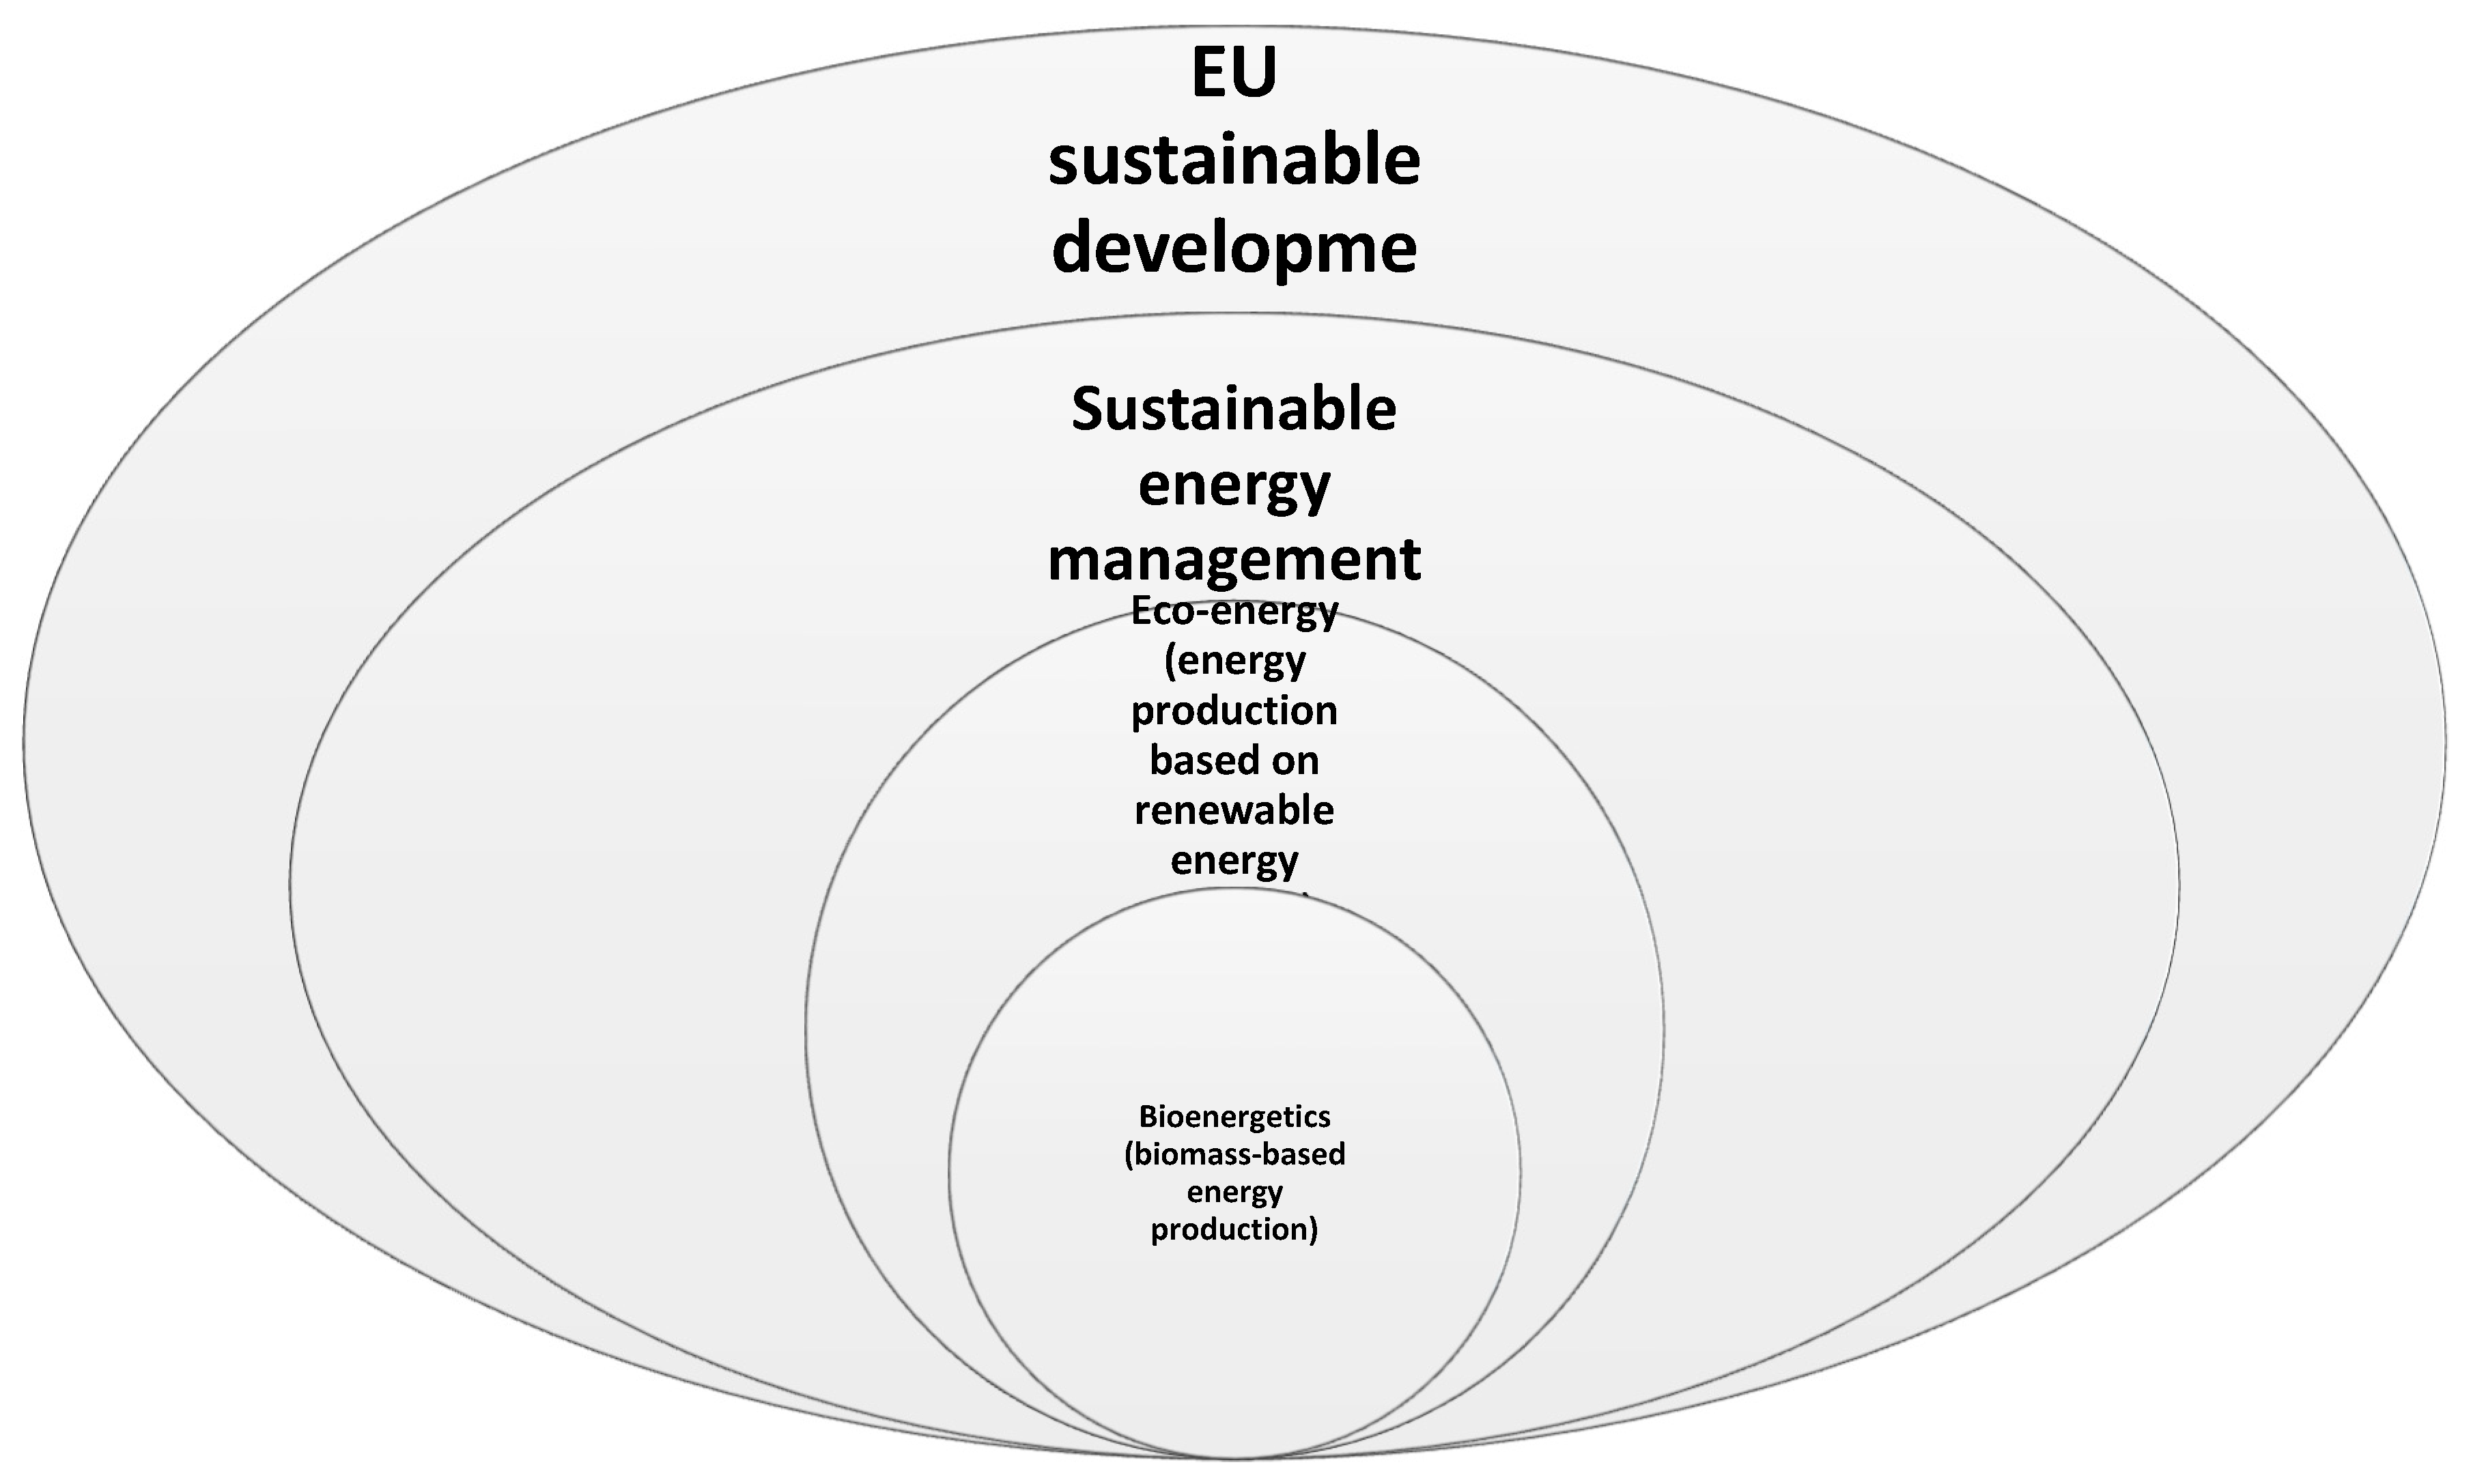
However, in addition to the summary findings described in the figure above, the study formulates public policy conclusions related to the EU's energy economics and economic growth based on the results of the study.
One of the most robust conclusions formulated at the end of the results chapter was that the decreasing values of energy consumption, CO2 emissions, and the average energy price in the examined period effectively explain the GDP growth in the EU. The close correlation of the decrease in energy consumption with the increase in GDP highlights that it is advisable for the EU to further improve energy efficiency. To achieve this, it would be necessary for EU decision-makers to adopt an agreement on the reform and strengthening of the EU Energy Efficiency Directive. To enforce the primacy of energy efficiency, it would be necessary for the member states to be legally obliged to take into account energy efficiency in the energy sector.
An agreement is needed according to which the annual energy-saving obligation of the member countries doubles or triples compared to the previous value.
The average energy price is also negatively correlated with GDP growth, which shows that the reduction in prices effectively supports economic growth. It is in the interest of the EU to avoid excessively high energy (mainly gas and electricity) prices. It seems necessary to introduce a price-limiting mechanism. The member states should agree on a market correction mechanism that would limit the periodic development of extremely high energy prices in the EU.
A price ceiling should be introduced for energy transactions, which would be activated when energy prices reach a predetermined level. With this method, the EU would limit excessively high energy prices that do not reflect world market prices and would also support the security of the energy supply.
The decrease in CO2 emissions also showed a strong positive correlation with GDP growth in the EU. This suggests that the reduction of greenhouse gas emissions in the EU should be further intensified. It is necessary to tighten the regulations of the EU CO2 emission trading system to reduce the emission of greenhouse gases.
Even within the reduction, a drop in CO2 emissions from energy-intensive industries and power plants is desirable. In the EU joint commitment regulation, it is necessary to define national emission target values for the sectors with the highest CO2 emissions (e.g. energy industry, construction industry, transport, agriculture, and waste management).
The continuous increase in the proportion of renewable energy in EU energy consumption shows the most robust positive correlation with GDP growth. This connection confirms that, to be relevant, by 2030 all 27 EU member states would undertake to obtain half of their energy from renewable sources, such as wind and solar energy. (The current target is 42.5 percent, while in 2021 less than a quarter of the EU's energy came from renewable sources). The goals related to renewable energy have become increasingly important, the EU has set itself the goal of ending its dependence on Russian fossil fuels by 2027. And the EU wants to achieve this independence mainly by producing locally produced energy with low carbon dioxide emissions. Achieving this goal will require huge investments in wind and solar power plants, increasing the production of renewable gases, and strengthening European electricity grids.
It will also be necessary to diversify the EU's energy sources and guarantee energy security through solidarity and cooperation between EU countries. It is also justified to ensure the operation of a fully integrated internal energy market, which enables the free energy flow of energy within the EU through the appropriate infrastructure, without technical or regulatory constraints. Research into low-carbon and clean energy technologies and the support of energy innovations must be given priority.
Finally, the study makes statements regarding the shortcomings of the research and future directions.
Like all studies, this one also has shortcomings, three main shortcomings are worth highlighting: (1) Only four variable effects of energy management, which plays a decisive role in the production of GDP, were examined in this study.
However, additional energy management variables can also play a role in how economic growth develops in an examined economic region. Such an energy management variable could be, for example, the EU's dependence on energy imports, the industrial structure of energy production, etc. (2) Many other factors influence CO2 emissions, in this study, only the effect of economic development, energy consumption and greenhouse gas emissions from renewable energy was examined. However, CO2 emissions also have other influencing factors, for example, the structure of the EU's industrial production, the technical level of the operation of energy systems, etc. (3) About the EU, the study examined only 10 years of data, from 2010 to 2019. The selection of this period was deliberate, because during this period there was relatively steady GDP growth in the EU, in addition to a continuous decrease in energy consumption. These aspects provided an excellent framework for conducting an exciting investigation. However, the time interval can be significantly extended, thus even more substantiated result data can be obtained.
In the future, research on the subject of this study can go in several directions, three of which should be highlighted:
(1) In addition to the four independent variables selected in the study, additional variables can be included in the research. Such a very important indicator can be, for example, the EU's dependence on energy imports, etc. (2). The period examined by the study ended in 2019, followed by two years of epidemics and the outbreak of the Russian-Ukrainian conflict. The aforementioned circumstances forced significant changes in the EU's energy policy. In the future, it will be possible to write an interesting and instructive study for public policy about the structural changes the aforementioned global traumas forced in the EU's energy policy. (3) The 27 countries of the EU represent a relatively small proportion of the number of countries on Earth. In the future, an instructive and interesting study could be written in such a way that the authors examine a different range of countries on this topic, for example, BRICS, G20, Europe, or OECD countries.
Funding
This research received no external funding.
Data Availability Statement
Data is contained within the article.
Conflicts of Interest
The author declare no conflict of interest.
References
- Dynan, K.; Sheiner, L. GDP as a Measure of Economic Well–being. In Hutchins Center Working Paper, 2018, 43; The Brookings Institution: Washington, DC, USA, 2018;
- Rafindadi, A. Impacts of renewable energy consumption on the German economic growth: Evidence from combined cointegration test. Renew. Sustain. Energy Rev. 2017, 75. [CrossRef]
- Acaravci, A.; Ozturk, I. On the relationship between energy consumption, CO2 emissions and economic growth in Europe. Energy 2010, 35. [CrossRef]
- Salazar-Núñez, H.F.; Venegas-Martínez, F.; Tinoco-Zermeño, M.Á. Impact of energy consumption and carbon dioxide emissions on economic growth: Cointegrated panel data in 79 countries grouped by income level. Int. J. Energy Econ. Policy 2020, 10. [CrossRef]
- Salari, M.; Javid, R.J.; Noghanibehambari, H. The nexus between CO2 emissions, energy consumption, and economic growth in the US. Econ. Anal. Policy 2021, 69. [CrossRef]
- Oliveira, H.; Moutinho, V. Renewable Energy, Economic Growth and Economic Development Nexus: A Bibliometric Analysis. Energies 2021, 14, 4578. [CrossRef]
- Topolewski, Ł. Relationship between Energy Consumption and Economic Growth in European Countries: Evidence from Dynamic Panel Data Analysis. Energies 2021, 14, 3565. [CrossRef]
- Pehli, D.; Spanos, K.; Trachanas, E. Financial development, economic growth and the role of fiscal policy during normal and stress times: Evidence for 26 EU countries’. International Journal of Finance & Economics, Early View, 2023. [CrossRef]
- Pehlivanoglu, F.; Kocbulut, O.; Akdag, S.; Alola, A.A. Toward a sustainable economic development in the EU member states: The role of energy efficiency-intensity and renewable energy. International Journal of Energy Research, 2023, Volume 45, Issue15 https://doi.org/10.1002/er.7174.
- Karasek, A.; Fura, B.; Zajączkowska, M. Assessment of Energy Efficiency in the European Union Countries in 2013 and 2020. Sustainability 2023, 15(4), 3414. [CrossRef]
- Elbassoussy, A. European energy security dilemma: Major challenges and confrontation strategies. Review of Economics and Political Science, 2019, Vol. 4 No. 4. [CrossRef]
- Roberts, J. Power to the people? Implications of the Clean Energy Package for the role of community ownership in Europe's energy transition, Review of European. Comparative & International Environmental Law 2020, Volume 29, Issue 2: Assessing the EU 2030 Climate and Energy Policy Framework. [CrossRef]
- Miłek, D.; Nowak, P.; Latosinska, J. The Development of Renewable Energy Sources in the European Union in the Light of the European Green Deal. Energies 2022, 15, 5576. [CrossRef]
- Stec, M.,; Grzebyk, M. Statistical Analysis of the Level of Development of Renewable Energy Sources in the Countries of the European Union. Energies 2022; 15(21):8278. [CrossRef]
- Gökgöz, F.; Yalçın, E. Investigating the energy security performance, productivity, and economic growth for the EU. Environmental Progress & Sustainable Energy, 2023, Early View. [CrossRef]
- Luty, L.; Zioło, M.; Knapik, W.; Bąk, I.; Kukuła, K. Energy Security in Light of Sustainable Development Goals’. Energies. 2023; 16(3):1390. [CrossRef]
- Kozłowska, J.; Benvenga, M. A.; Nääs, Ida. Investment Risk and Energy Security Assessment of European Union Countries Using Multicriteria Analysis’. Energies. 2023; 16(1):330. [CrossRef]
- Athanasios S. D; Michael L. P.; Symeoni-Eleni S. Revisiting the impact of energy prices on economic growth: Lessons learned from the European Union, Economic Analysis and Policy, 2020, Volume 66,. [CrossRef]
- Baláž, P.; Bayer, J. Energy Prices and their Impact on the Competitiveness of the EU Steel Industry’. Prague Economic Papers, 2019, 28(5):1-20. [CrossRef]
- European Commission. State of the energy union 2022 - snapshots per EU country, Available at: https://energy.ec.europa.eu/publications/state-energy-union-2022-snapshots-eu-country_en, (accessed on 16 Marc 2023).
- European Environment Agency. EEA greenhouse gases - data viewer, Data viewer on greenhouse gas emissions and removals, sent by countries to UNFCCC and the EU Greenhouse Gas Monitoring Mechanism (EU Member States). Available at: https://www.eea.europa.eu/data-and-maps/data/data-viewers/greenhouse-gases-viewer, (accessed on 17 Marc 2023).
- Eurostat. Energy statistics - prices of natural gas and electricity, Available at: https://ec.europa.eu/eurostat/databrowser/view/NRG_PC_203/default/table?lang=en&category=nrg.nrg_price.nrg_pc, (accessed 18. Marc 2023).
- Eurostat. National accounts and GDP, Available at: https://ec.europa.eu/eurostat/statisticsexplained/index.php?title=National_accounts_and_GDP, 2021, (accessed 11. Marc 2023).
- Eurostat. Renewable energy statistics, Available at: https://ec.europa.eu/eurostat/statistics-explained/index.php?title=Renewable_energy_statistics#Share_of_renewable_energy_more_than_doubled_between_2004_and_2021, (accessed 19. Marc 2023.
- Bollen, K. A. A New Incremental Fit Index for General Structural Equation Models’. Sociological Methods & Research, 1989, 17(3), 30. [CrossRef]
- Benitez, J.; Henseler, J.; Castillo, A.; Schuberth, F. How to perform and report an impactful analysis using partial least squares: Guidelines for confirmatory and explanatory IS research’. Information & Management, 2020, 57(2), 103168. [CrossRef]
- Rigdon, E. E. Rethinking Partial Least Squares Path Modeling: In Praise of Simple Methods’. Long Range Planning, 2012, 45(5–6). [CrossRef]
- Hwang, H.; Takane, Y. Generalized structured component analysis. Psychometrika, 2004, 69(1). https://link.springer.com/content/pdf/10.1007/, BF02295841.pdf.
- Hair, J. F.; Hult, G. T. M.; Ringle, C. M.; Sarstedt, M.; Thiele, K. O. Mirror, mirror on the wall: A comparative evaluation of composite-based structural equation modeling methods’. Journal of the Academy of Marketing Science, 2017, 45(5). [CrossRef]
- Dijkstra, T. K. A. Perfect Match Between a Model and a Mode. In H. Latan & R. Noonan (Eds.), Partial Least Squares Path Modeling. 2017, Cham: Springer International Publishing. [CrossRef]
- Schuberth, F.; Henseler, J.; Dijkstra, T. K. Confirmatory Composite Analysis. Frontiers in Psychology, 2017, 9, 2541. [CrossRef]
- Henseler, J.; Hubona, G.; Ray, P. A. Using PLS path modeling in new technology research: Updated guidelines’. Industrial Management & Data Systems, 2016, 116(1). [CrossRef]
- Hair, J.F.J.; Hult, G.T.M.; Ringle, C.; Sarstedt, M. A. Primer on Partial Least Squares Structural Equation Modeling (PLS-SEM). Elsevier: Amsterdam, The Netherlands, 2014, Volume 46. [CrossRef]
- Hair, J.F.; Risher, J.J.; Sarstedt, M.; Ringle, C.M. When to use and how to report the results of PLS-SEM’. Eur. Bus. Rev. 2019, 31. [CrossRef]
- Grodzicki, T.; Jankiewicz, M. Energy Consumption and Economic Growth in the European Union: A Causality Analysis. Ekonomista 2020, (4):616-627. [CrossRef]
- Török, L. Ambivalent changes in the correlation of energy consumption and economic growth in the member states of the European Union (2010–2019). Helyion, 2023, 9(5): e14550. [CrossRef]
- Marinescu, C.; Cicea, C. Econometric perspective of the energy consumption and economic growth in the European Union. Renewable and Sustainable Energy Reviews, 2012, 16(8):5718–5726. [CrossRef]
- Gardiner, R.; Hajek, P. Interactions among energy consumption, CO2, and economic development in European Union countries. Sustainable Development, 2019, Volume28, Issue4, 2019 https://doi.org/10.1002/sd.2023.
- Gricar, S.; Bojnec, S.; Baldigara, T. GHG Emissions and Economic Growth in the European Union, Norway, and Iceland: A Validated Time-Series Approach Based on a Small Number of Observations’. Journal of Risk and Financial Management. 2022, 15(11):518. [CrossRef]
- Dagoumas, A.; Polemis, M.; Soursou, S-E. Revisiting the impact of energy prices on economic growth: Lessons learned from the European Union. Economic Analysis and Policy 2020, 66(6). [CrossRef]
- Osigwe, A.; Arawomo, D.F. Energy Consumption, Energy Prices and Economic Growth: Causal Relationships Based on Error Correction Model. International Journal of Energy Economics and Policy, 2015, 5(2),.
- Kasperowicz, R.; Bilan, Y.; Štreimikienė, D. The renewable energy and economic growth nexus in European countries. Sustainable Development, 2020, Volume28, Issue5. [CrossRef]
- Ntanos S.; Skordoulis, M.; Kyriakopoulos, G.; Arabatzis, G.; Chalikias, M.; Galatsidas, S.; Batzios, A.; Katsarou, A. Renewable Energy and Economic Growth: Evidence from European Countries. Sustainability. 2018; 10(8):2626. [CrossRef]
- Rokicki, T.; Perkowska, A. Diversity and Changes in the Energy Balance in EU Countries. Energies, 2021, 14(4):1098. [CrossRef]
- Vasin, S. M. Sectoral Transformation of the Economic System during Crisis and Stable Growth Periods (A Case Study of the European Countries). Economies, 2022, 10(6), 148. [CrossRef]
Disclaimer/Publisher’s Note: The statements, opinions and data contained in all publications are solely those of the individual author(s) and contributor(s) and not of MDPI and/or the editor(s). MDPI and/or the editor(s) disclaim responsibility for any injury to people or property resulting from any ideas, methods, instructions or products referred to in the content. |
© 2023 by the authors. Licensee MDPI, Basel, Switzerland. This article is an open access article distributed under the terms and conditions of the Creative Commons Attribution (CC BY) license (http://creativecommons.org/licenses/by/4.0/).
Copyright: This open access article is published under a Creative Commons CC BY 4.0 license, which permit the free download, distribution, and reuse, provided that the author and preprint are cited in any reuse.


