1. Introduction
As shipbuilding and construction has grown in scale, thick plate steels are increasingly in demand for high strength and toughness [
1,
2,
3,
4,
5,
6,
7,
8,
9,
10,
11,
12]. One of the representative methods for high strength and toughness of thick plates is quenching and tempering (QT) heat treatment, which is aimed at obtaining a tempered martensite microstructure that provides an excellent combination of strength and toughness. At the surface area a martensite microstructure can be easily obtained after water quenching due to the fast cooling rate, whereas the slow cooling rate in the center of the thick plate results in a transformation to bainite or ferrite. As the thickness increases, it is difficult to obtain a uniform microstructure in the thickness direction, leading to a complex microstructure composed of various phases such as martensite, bainite, and ferrite inside thick plates after water quenching. Although many researchers have tried to predict cooling rates in the thickness direction of thick plate steels during water quenching, a systematic analysis of cooling rate in thick plates has yet to be reported [
13,
14,
15,
16]. H. Wang et al. [
13] studied effect of cooling rate on microstructure and mechanical properties in low-carbon low-alloyed steel plate using a dilatometric experiment. However, the authors focused on how microstructure/mechanical property relationships of a low-carbon low-alloyed steel are affected by phase transformations during continuous cooling, not on estimation of cooling rate in a thick steel plate. Lv yanchun et al. [
14] reported that temperatures in core and surface of steel plate with a thickness of 60 mm were measured by thermocouples embedded in core and surface of the steel plate during normalizing, and the cooling rate was simulated through a finite element model using the measured temperature data. They did not consider cooling rate of steel plate metallurgically by investigating microstructure, mechanical properties etc. Therefore, in this study, our aim was to precisely identify the microstructure and hardness of high-strength thick plate steel in the thickness direction as well as specimens from a high-strength thick plate controlled at various cooling rates by a dilatometric experiment. Finally, we predicted the cooling rates in the thickness direction of the thick plate during water quenching based on a comparison of the microstructure and hardness in both specimens from the thick plate and from the dilatometric experiments.
2. Experimental procedure
2.1. Material preparation and characterization
The microstructure and hardness were investigated for high-strength thick plate steel with a thickness of 40 mm after water-quenching (As-Quenched, AQ). The chemical composition is shown in
Table 1. Note that details of the compositions of micro-alloying elements cannot be disclosed due to information security. The microstructure of the surface, 1/4t, and 1/2t in the thickness direction of the thick plate was observed using scanning electron microscopy (SEM, JSM-7001F, JEOL) and transmission electron microscopy (TEM, JEM-2100F, JEOL). The samples for SEM were prepared using a 1% picral solution (1 g picric acid + 5 ml HCL + 100 ml ethyl alcohol) after mechanical polishing and disc samples with 3 mm diameter for TEM were prepared by mechanical polishing to 70 ~ 100 μm thickness, followed by electro-chemical polishing using a twin-jet polisher with a solution of 10% perchloric acid and 90% methanol at -30 °C. Vickers hardness (FM-700, Future tech) was measured under a load of 1 kg for 10 seconds.
2.2. Dilatometric experiment
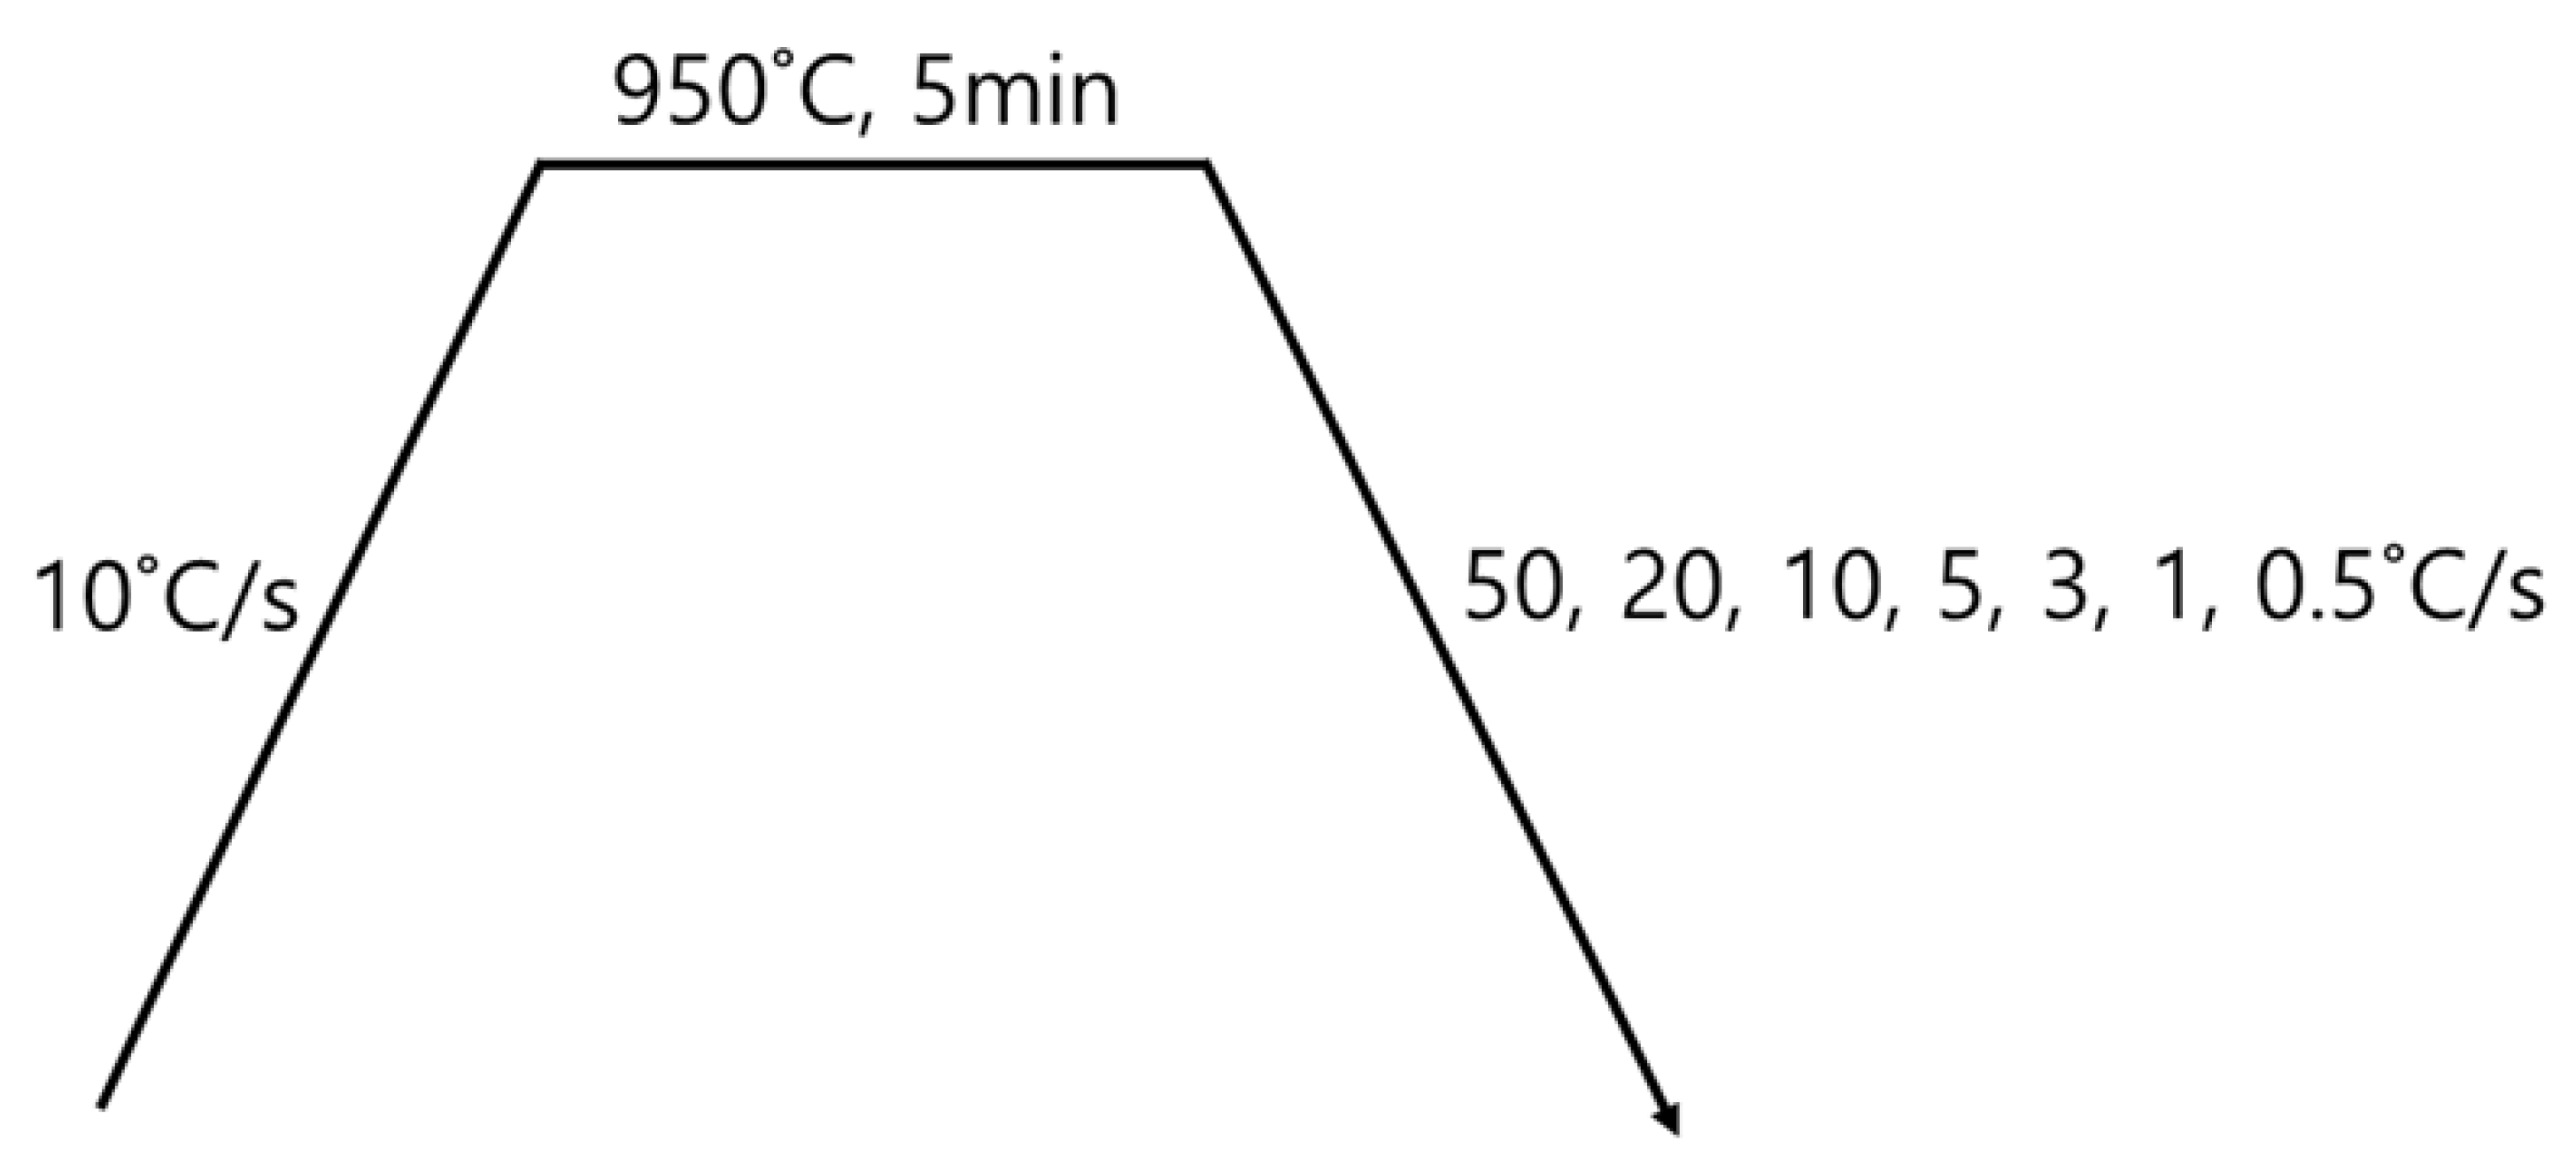
Dilatometric specimens with dimensions of 3 mm diameter × 10 mm length were machined from the thick plate using a dilatometer (Dilatronic-III, Theta). The heat treatment conditions for the dilatometric experiment are shown in
Figure 1. After austenitizing at 950 °C for 5 minutes, cooling was performed at various cooling rates between 0.5 to 50 °C/s. A CCT diagram was prepared based on the dilatation results, the microstructure observation, and the Vickers hardness for the specimens controlled with various cooling rates. The specimens were observed by SEM (JSM-7001F, JEOL) and TEM (JEM-2100F, JEOL) and their Vickers hardness was measured under the same conditions as described above. It was confirmed that prior austenite grain sizes of the thick plate and the dilatometric specimen are very similar: 14.9 μm in the thick plate and 15.6 μm in the dilatometric specimen.
3. Results and Discussion
3.1. Investigation of AQ specimens
Figure 2 shows SEM micrographs of the surface, 1/4t, and 1/2t in the AQ thick plate. The surface area shows a martensite microstructure. Martensite and a small fraction of bainite at austenite grain boundaries and a banded structure with martensite and bainite were observed at 1/4t and 1/2t, respectively. Bainite transformation occurs toward center in thickness due to slow cooling rate. It is well known that this banded structure at 1/2t is formed due to segregation of alloying elements, especially Mn during slab solidification, resulting in Mn-enriched and Mn-depleted regions [
17,
18,
19,
20,
21]. The Mn-enriched zone at 1/2t of the AQ specimen was transformed to martensite due to high hardenability even at a slow cooling rate, whereas a bainite transformation occurred in the Mn-depleted zone with relatively low hardenability.
Table 2 presents the Vickers hardness according to the thickness. The hardness of the surface with martensite was approximately 500 Hv, and that of 1/4t, which contains martensite and a small amount of bainite, was 390 Hv. The hardness of the martensite and bainite in the banded structure of the 1/2t were measured as 507 Hv and 351 Hv, respectively. As a result, the Vickers hardness results are consistent with the microstructural change according to thickness.
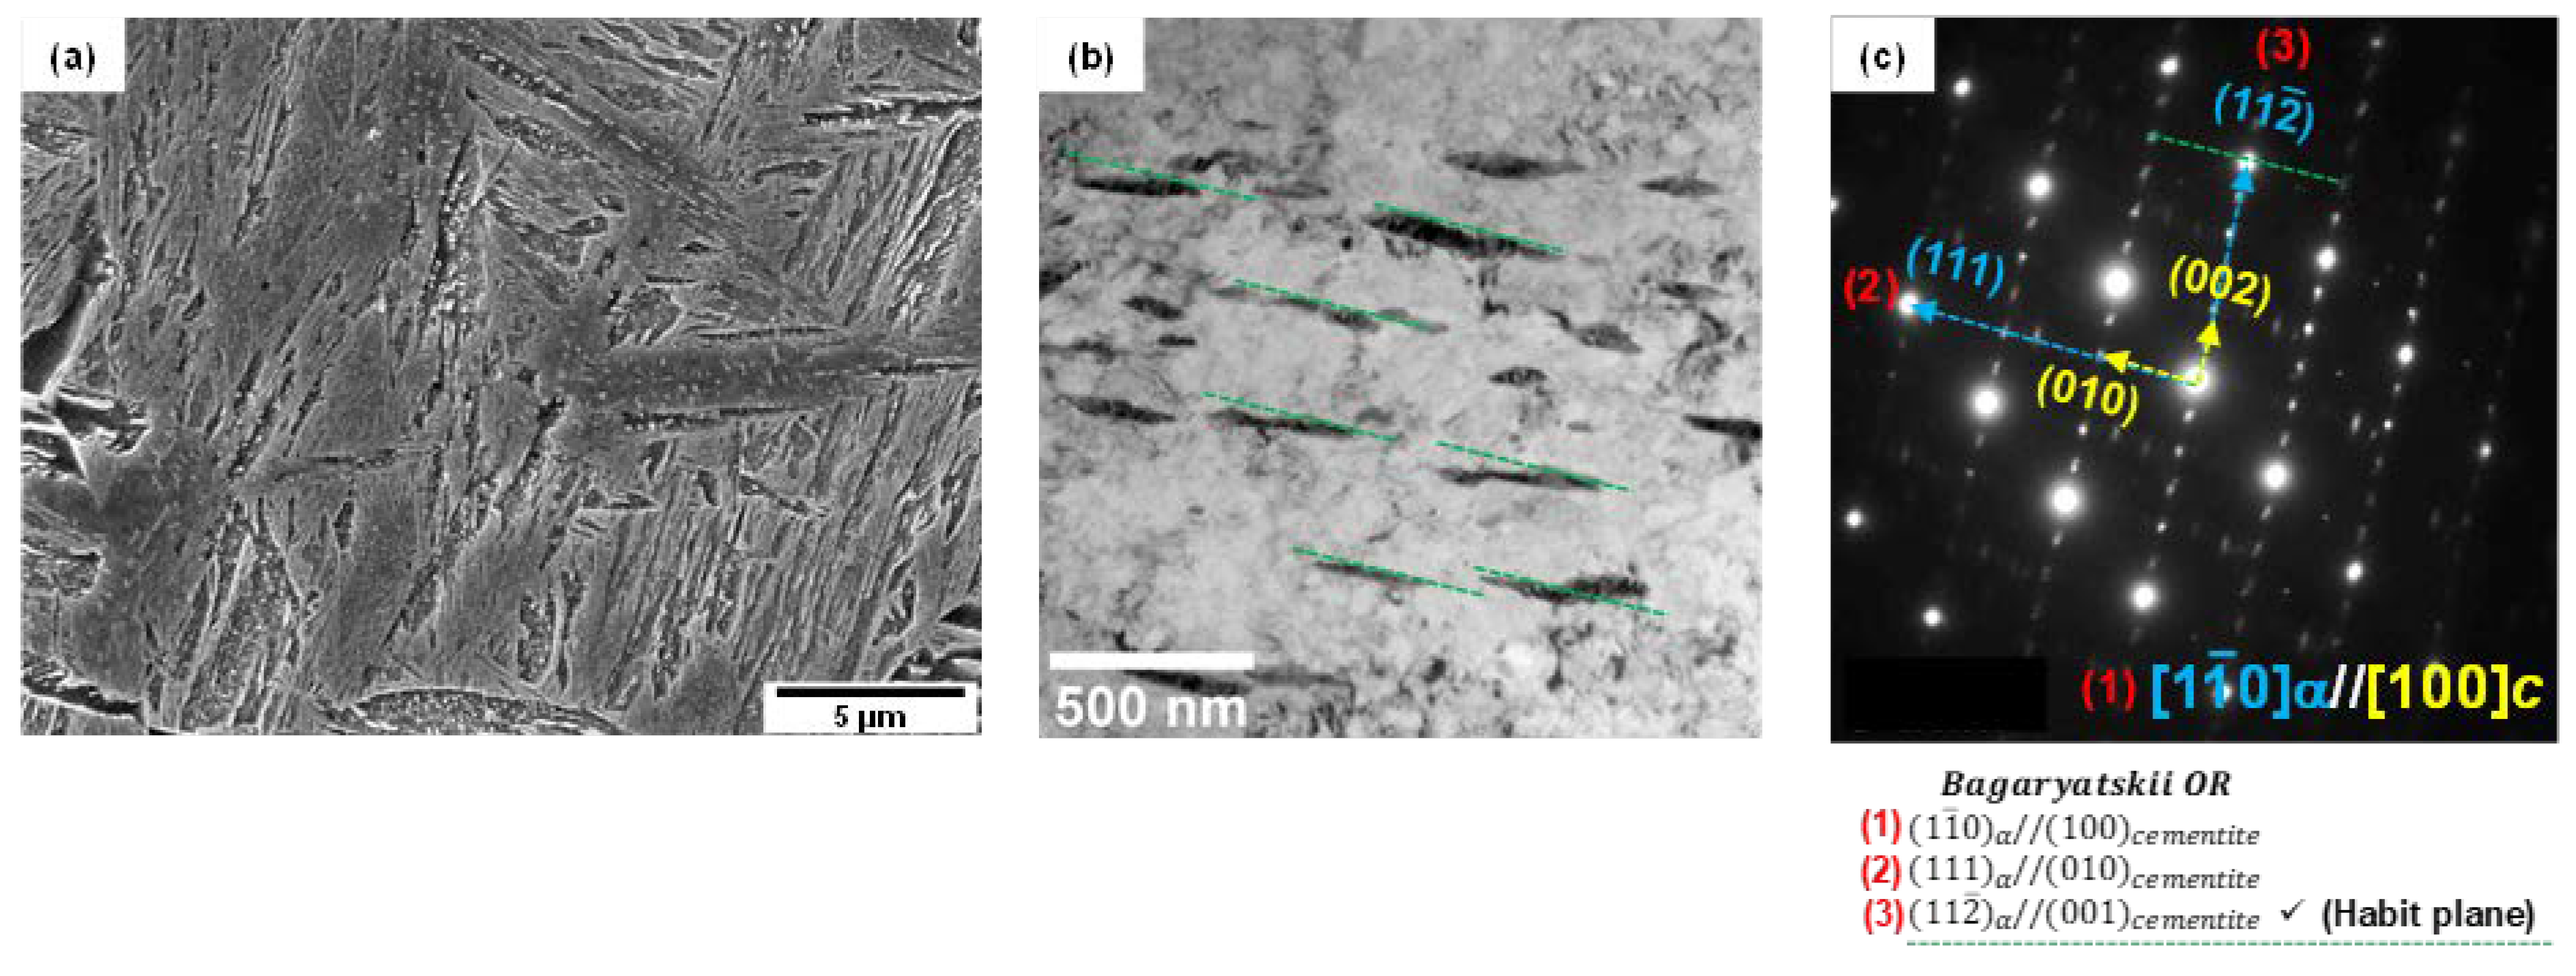
Figure 3 presents a high-magnification SEM image, a TEM bright field image, and the selected area diffraction pattern at 1/4t. In
Figure 3(a), martensitic lath and fine particles inside lath were observed. Through a TEM analysis, this microstructure was identified as auto-tempered martensite with fine cementite, where a Bagayatskii orientation relationship between the ferrite matrix and fine cementite was found in
Figure 3b,c. Auto-tempering of martensite is a phenomenon that can occur immediately after martensite transformation for steels with a relatively high martensite transformation start (Ms) temperature [
22,
23,
24]. The Ms temperature of the AQ specimen is around 400 °C (in
Figure 8), which is relatively high, resulting in auto-tempering.
3.2. Dilatation results of AQ specimens
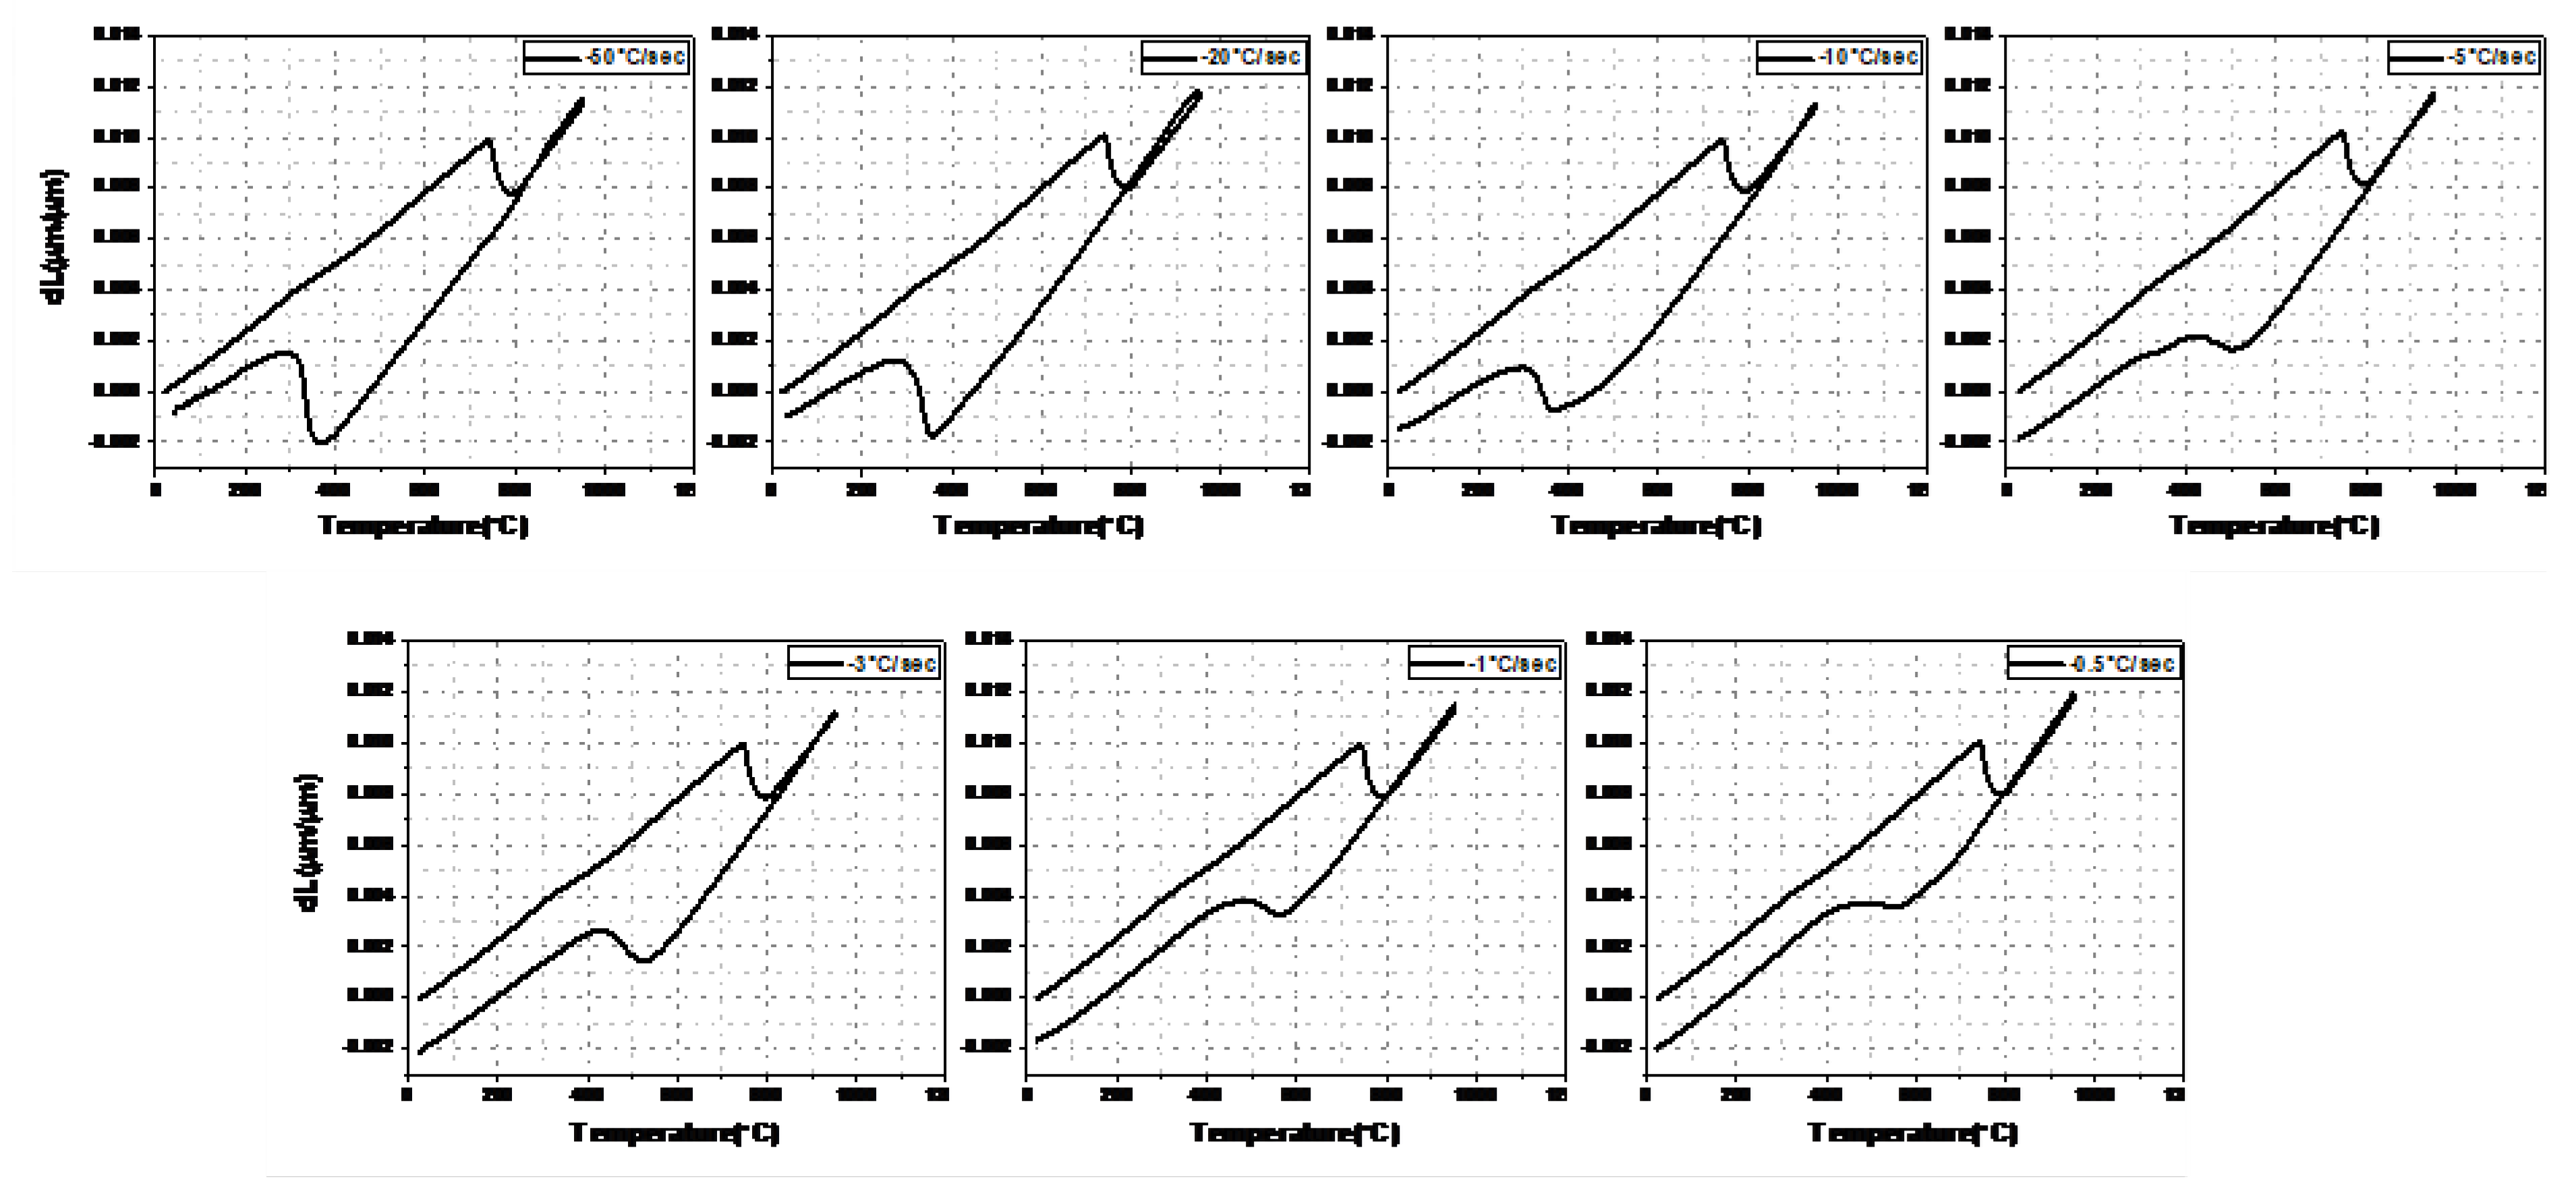
Figure 4 shows the dilatation behavior of an AQ specimen during heating and cooling. With a decreasing cooling rate, volume expansion occurs at a higher temperature during cooling, which is consistent with the previous studies [
11,
12,
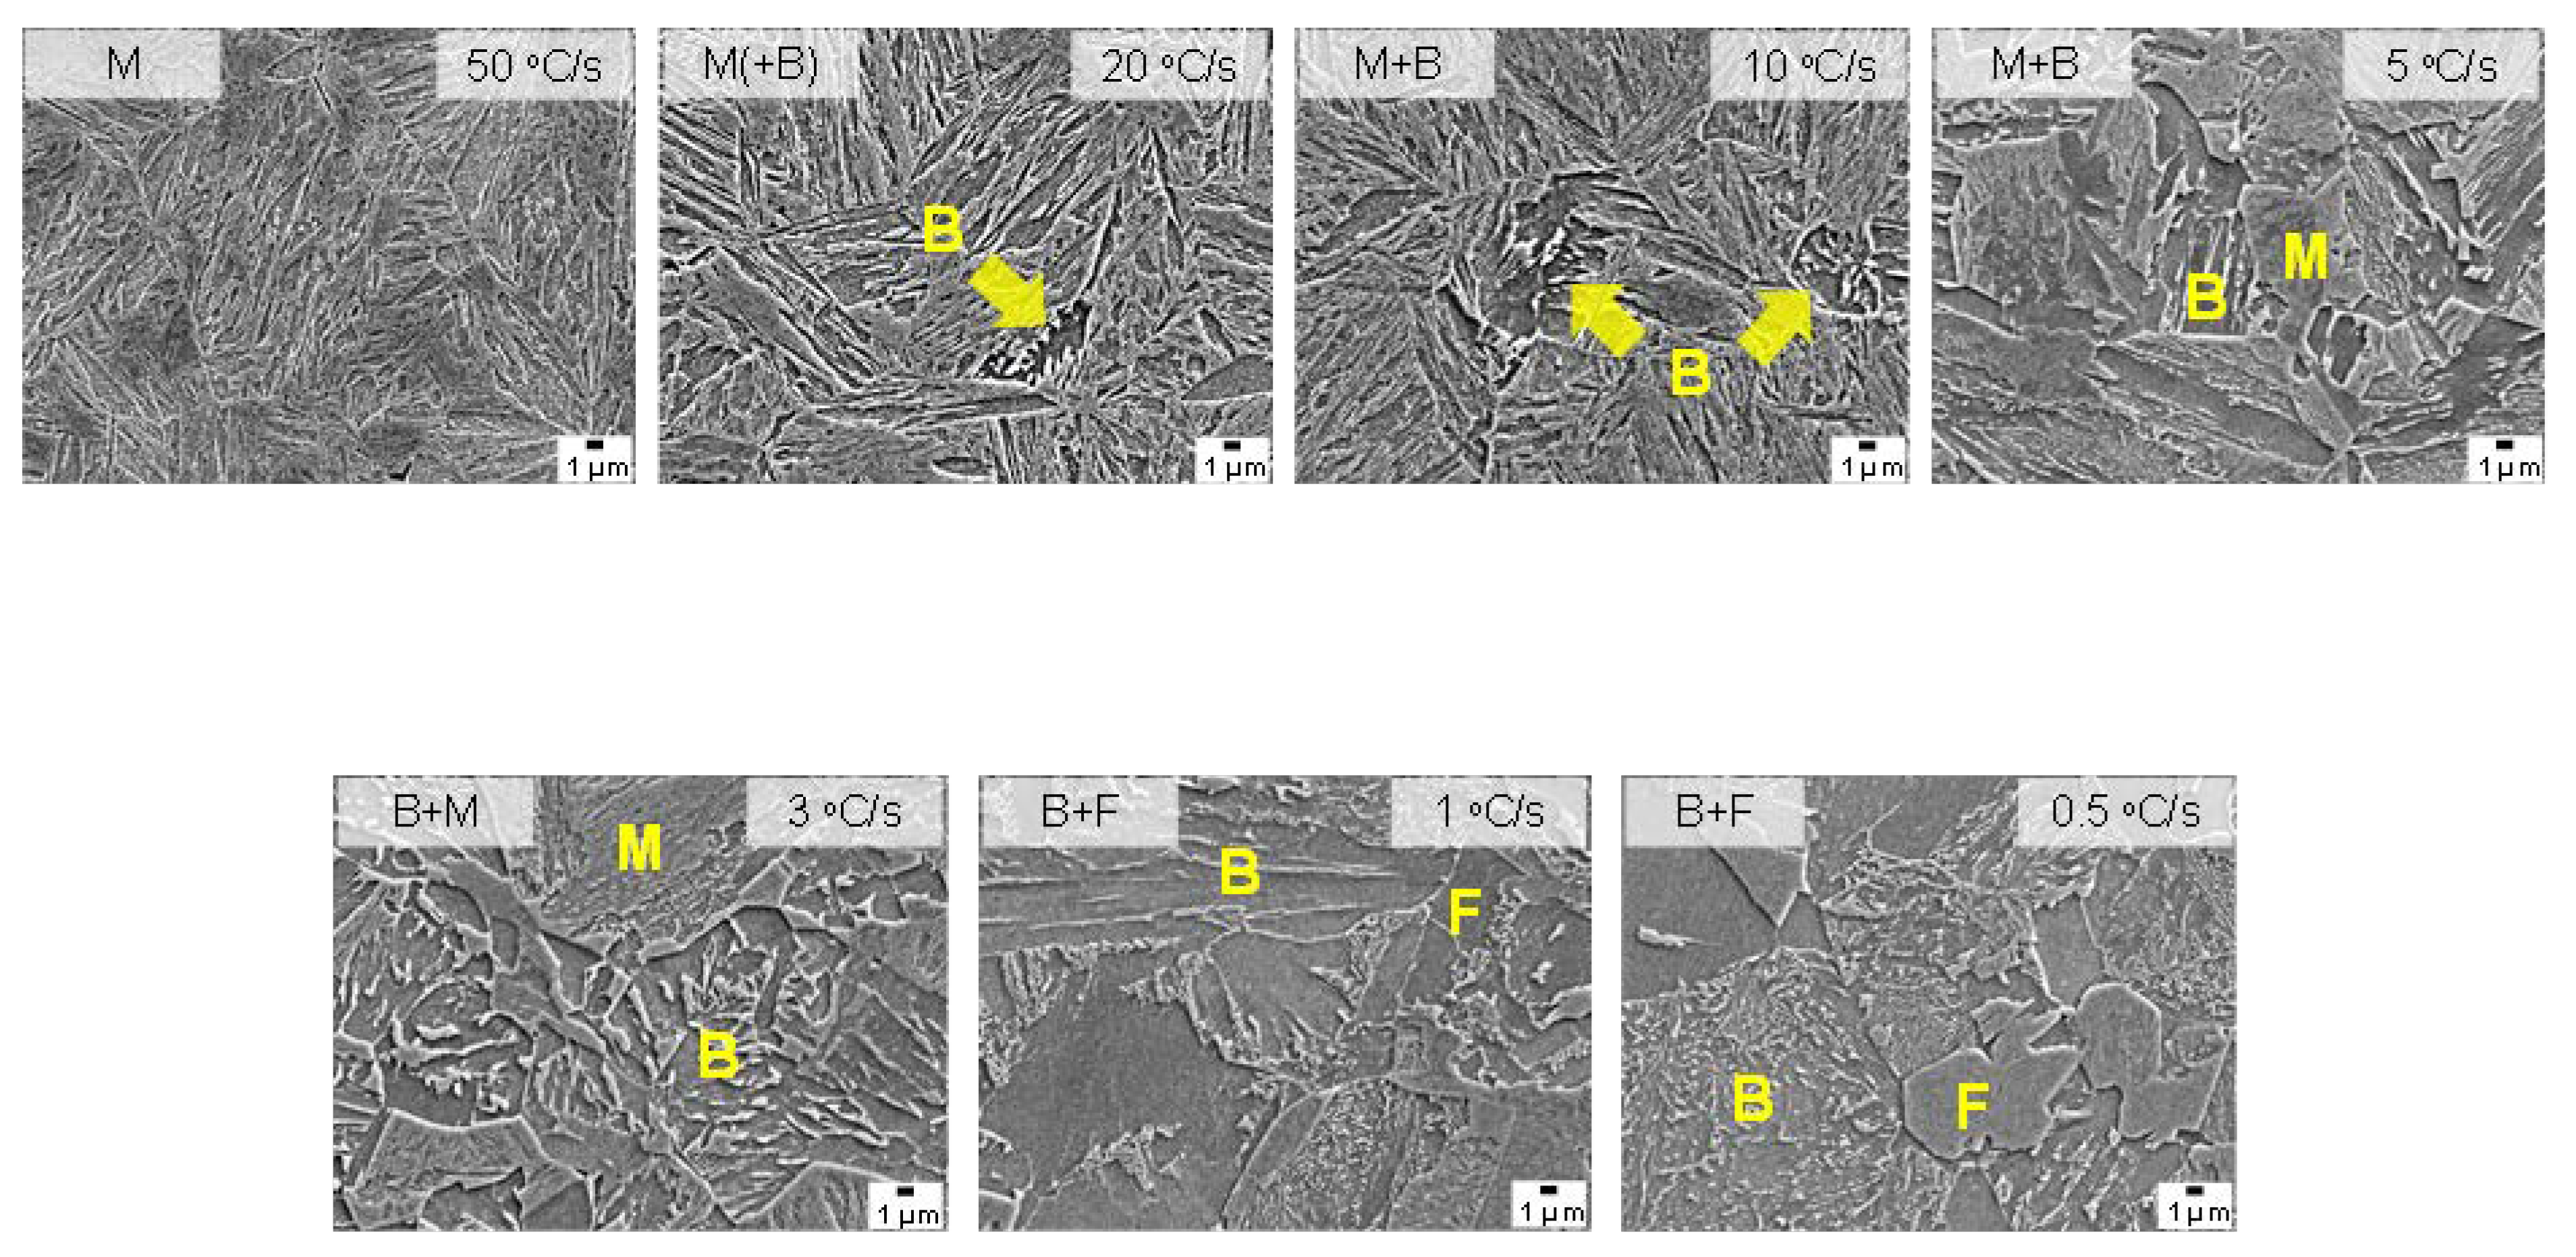
13]. Therefore, martensite can be transformed at a higher cooling rate and bainite or ferrite can be transformed as the cooling rate becomes slower in the AQ specimen. The microstructure according to the cooling rate is presented in
Figure 5. Full martensite was clearly shown at a cooling rate of 50 °C/s. At 20 °C/s, it was found that a very small amount of bainite was transformed. With a decreasing cooling rate to 3 °C/s, the amount of the transformed bainite increased and the fraction of martensite decreased. At cooling rates of 1 °C/s and 0.5 °C/s, ferrite phase was found as well as bainite, but martensite was hardly observed. It is determined that auto-tempering of the dilatometric specimen cooled at 50 °C/s occurred, as also observed in the AQ thick plate, as shown in the SEM and TEM micrographs in
Figure 6. It was confirmed again that AQ steel was auto-tempered due to its high Ms temperature.
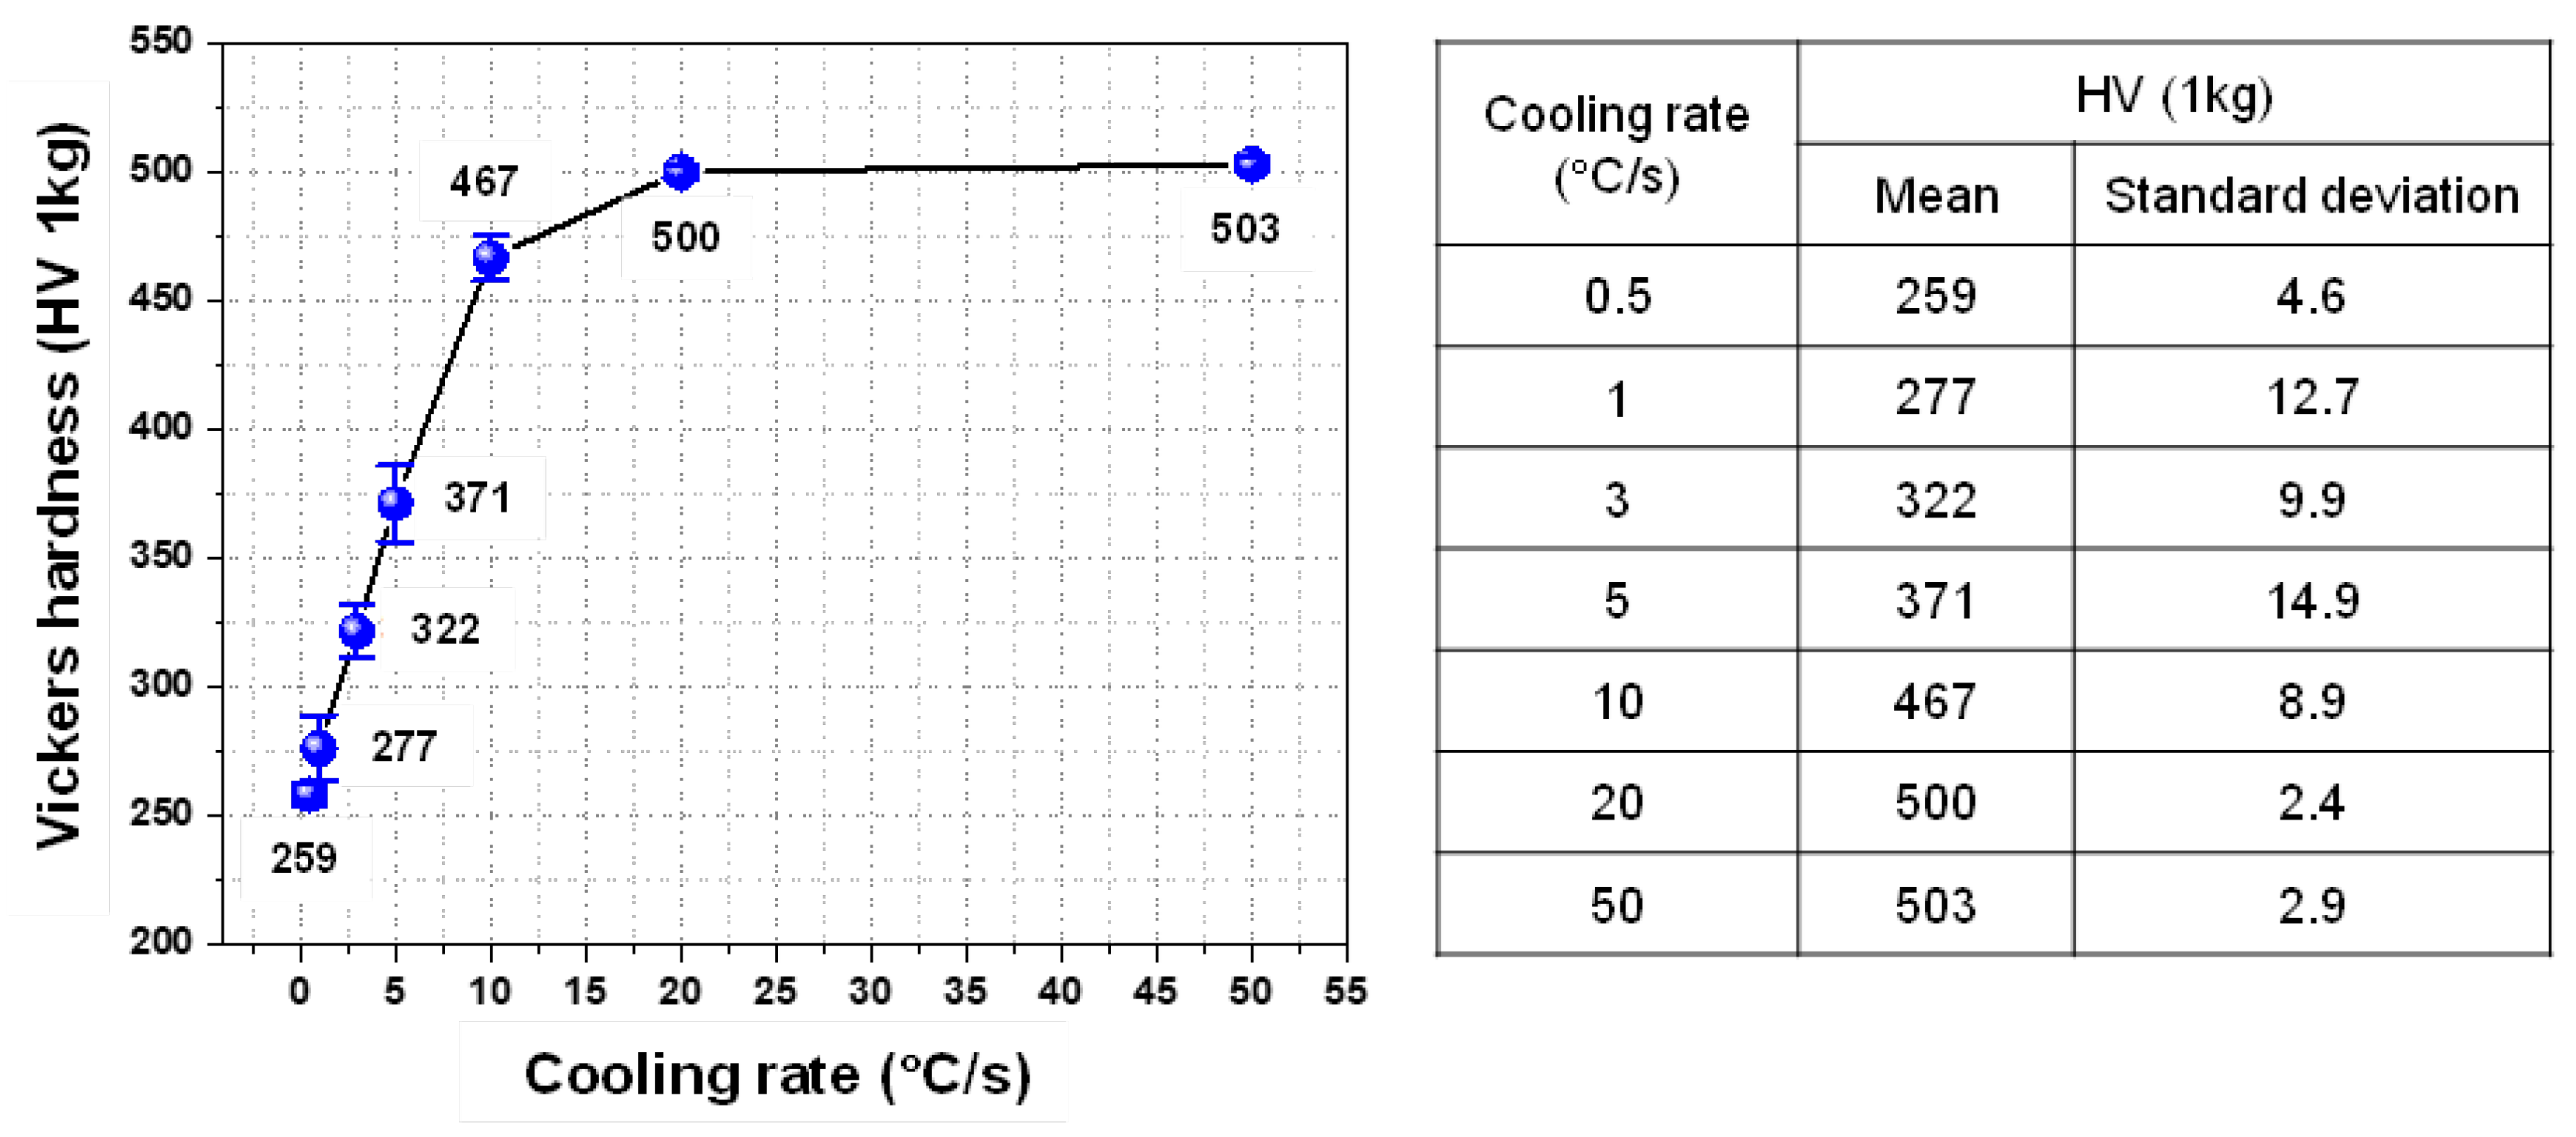
Figure 7 shows the Vickers hardness of dilatometric specimens according to the cooling rate. As the cooling rate became slower, the Vickers hardness accordingly became lower, which is consistent with the microstructural change in
Figure 5. Full martensite has hardness of approximately 500 Hv. With an increasing fraction of bainite, the hardness decreases to 322 Hv for the specimen cooled at 3 °C/s. At much slower cooling rates of 1 °C/s and 0.5 °C/s, the hardness is below 300 Hv because of the transformation to ferrite, which is a soft phase.
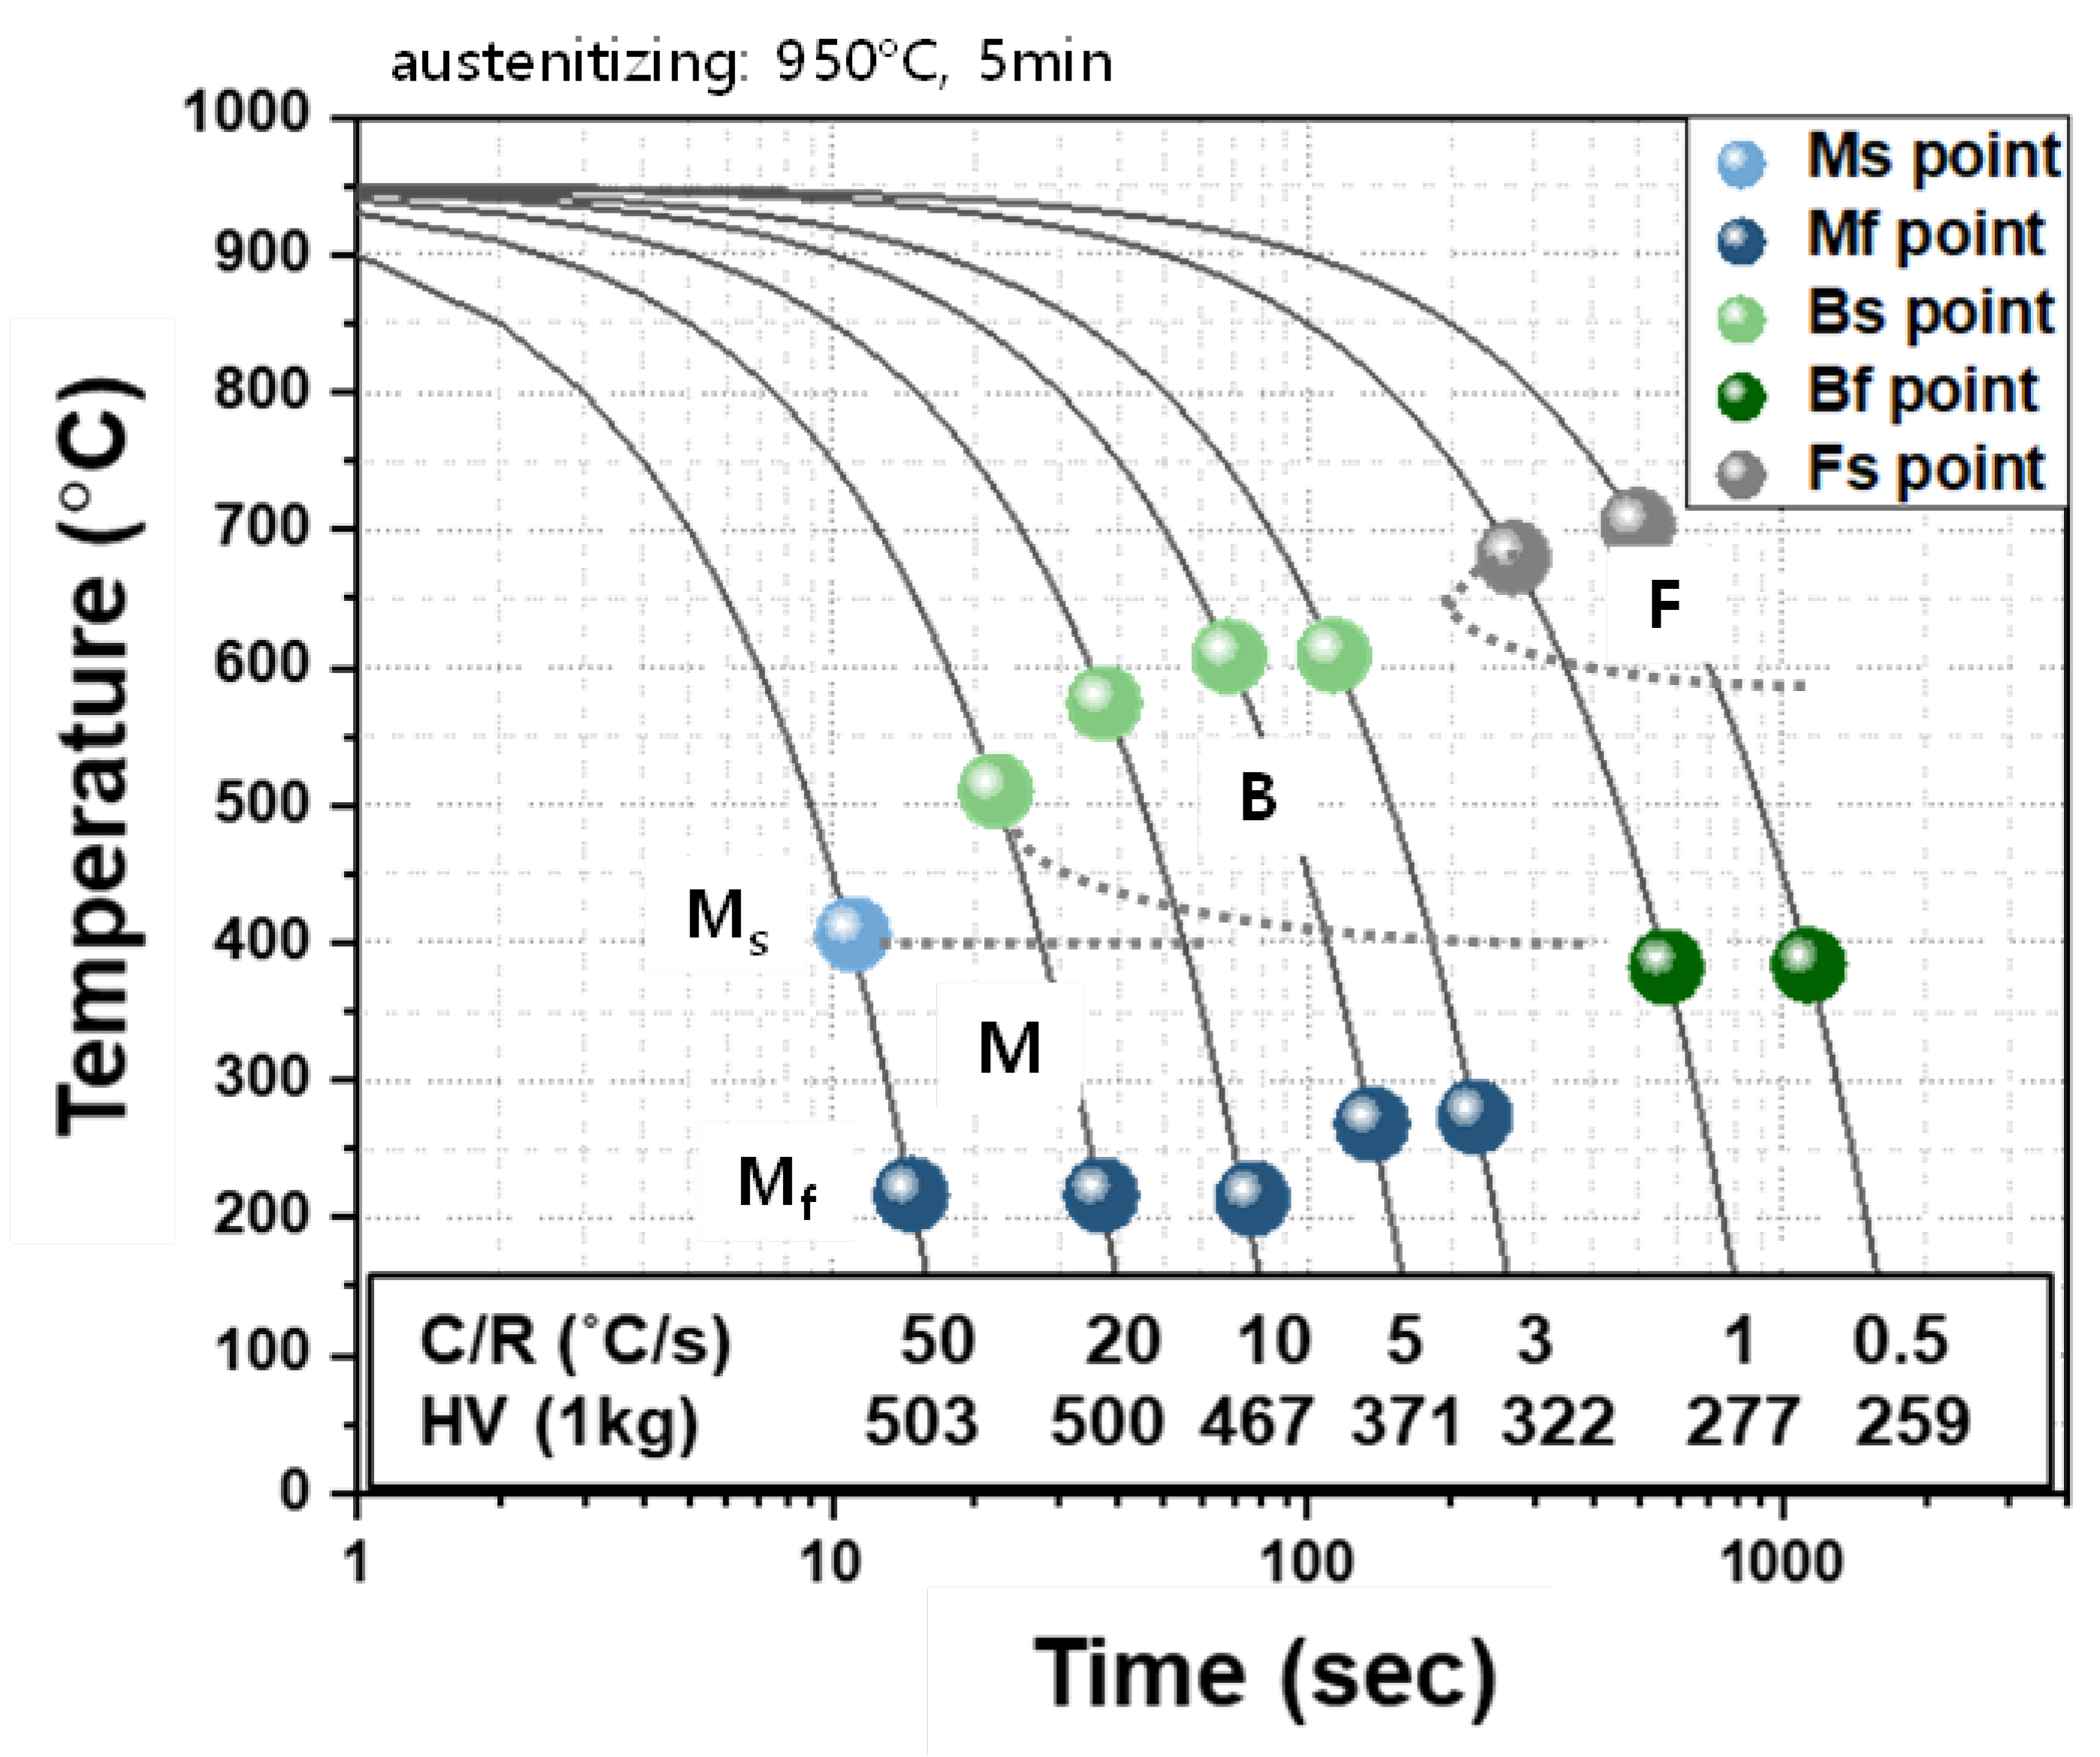
A CCT diagram of the AQ specimen is presented in
Figure 8, based on Figs. 4, 5, and 7. It was found that full martensite was transformed at cooling rate of 50 °C/s, bainite and martensite were transformed at a cooling rate in the range between 3 ~ 20 °C/s, and ferrite and bainite and no more martensite were transformed at a cooling rate lower than 1 °C/s. Bainite transformation start (Bs) and martensite transformation start (Ms) temperatures can be calculated by the equations (1) and (2), respectively [
25,
26,
27,
28]. The calculated Bs and Ms temperatures were 606 °C and 378 °C, respectively, which are similar to those in this CCT diagram.
Figure 8.
CCT diagram of AQ specimen based on a dilatometric experiment.
Figure 8.
CCT diagram of AQ specimen based on a dilatometric experiment.
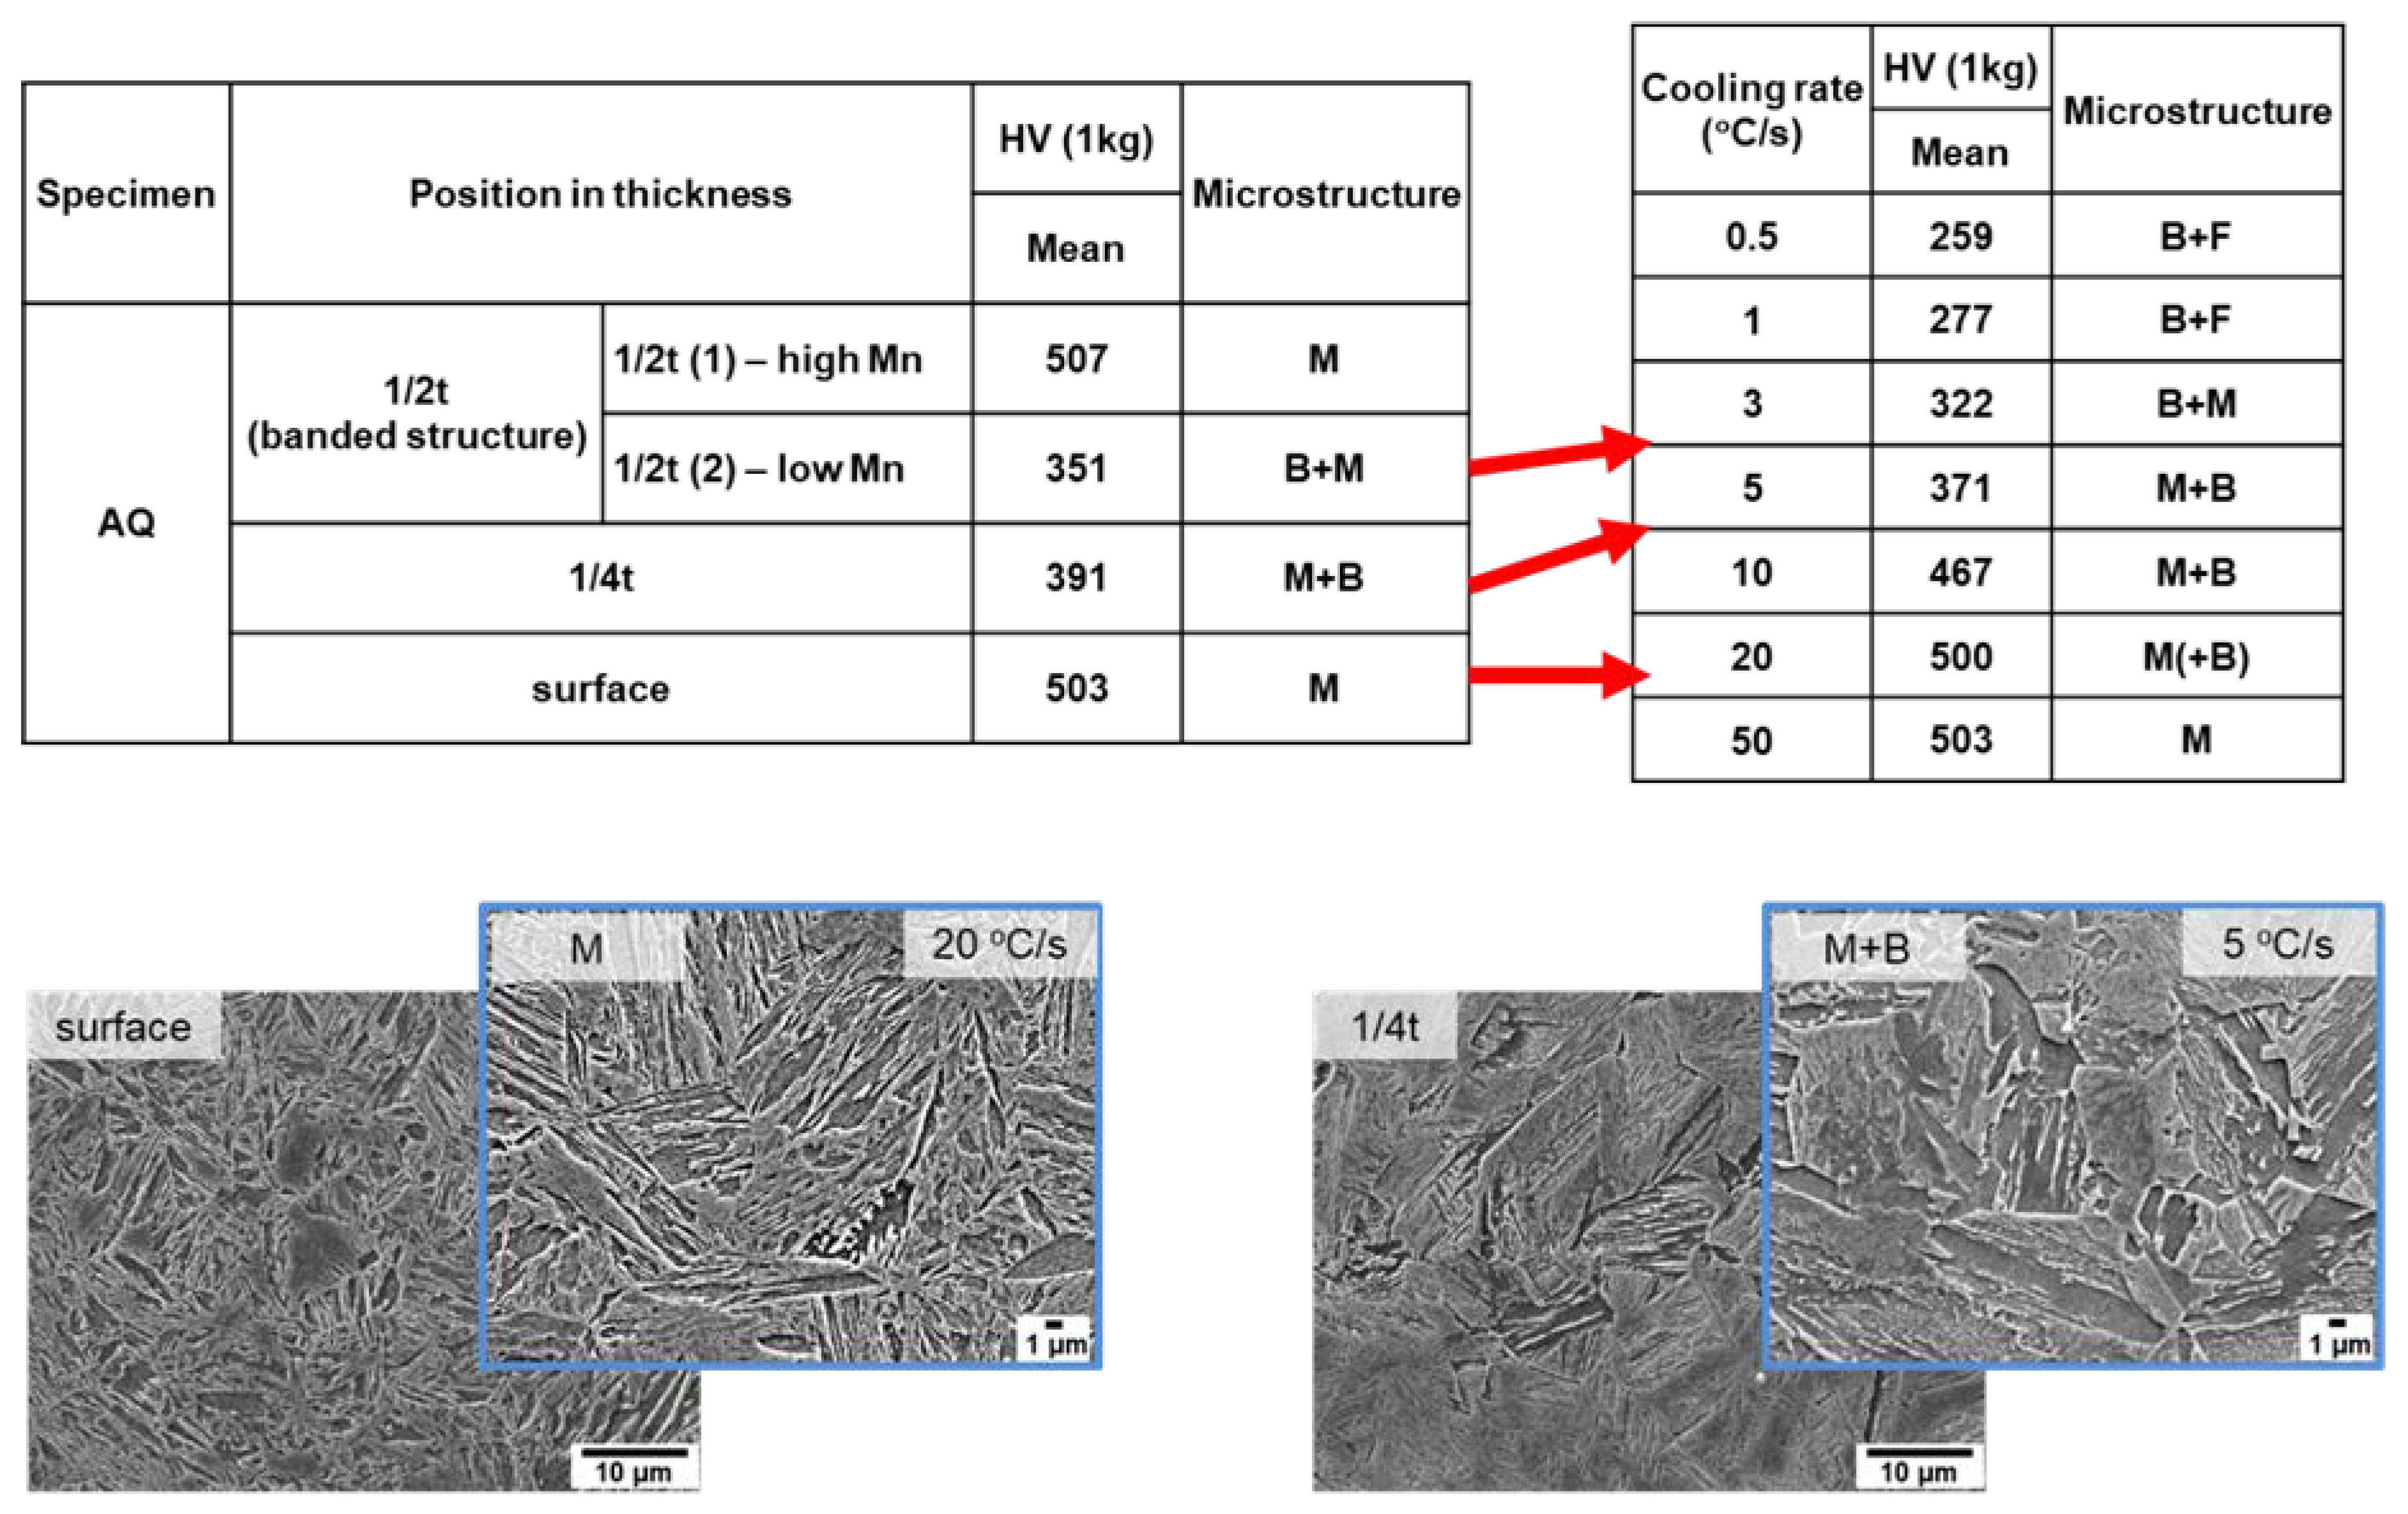
Finally, the actual cooling rate for each thickness of the AQ thick plate during water quenching was estimated by comparing the microstructure and hardness between the AQ thick plate in the thickness direction and dilatometric specimens cooled at various cooling rates. Hardness of 500 Hv and martensite at the surface of the AQ thick plate show that the surface should be cooled at a cooling rate of 20 °C/s or more. Hardness of 390 Hv and microstructure of martensite and bainite at 1/4t were similar to those of the dilatometric specimens cooled at a cooling rate between 5 and 10 °C/s. In the case of 1/2t, it was difficult to estimate the cooling rate due to the banded structure, but if the results of a Mn-depleted zone are considered, the cooling rate of 1/2t was estimated between 3 and 5 °C/s.
Figure 9.
Estimation of cooling rate of AQ thick plate during water quenching by comparison of hardness and microstructure between AQ thick plate and dilatometric specimens.
Figure 9.
Estimation of cooling rate of AQ thick plate during water quenching by comparison of hardness and microstructure between AQ thick plate and dilatometric specimens.
4. Conclusions
In this study, the microstructure and hardness of an AQ thick plate with 40 mm thickness were investigated in the thickness direction. Dilatometric experiments with specimens from the AQ thick plate were conducted to verify the effect of the cooling rate on the microstructure and hardness and to make a CCT diagram of the AQ steel. Finally, we estimated the cooling rate of the AQ thick plate in the thickness direction during water quenching based on an investigation of the thick plate and dilatometric specimens. The surface of the thick plate showed a full martensite microstructure due to the fast cooling rate, and the bainite structure was partially transformed at 1/4t due to the slower cooling rate. At 1/2t, a banded structure with martensite and bainite was formed due to a hardenability difference resulting from central segregation of Mn in the slab. By comparing the microstructure and hardness of dilatometric specimens cooled at various cooling rates, the cooling rates at the surface and at 1/4t of the thick plate during water quenching were more than 20 °C/s and between 5 and 10 °C/s, respectively. The cooling rate at 1/2t was estimated between 3 and 5 °C/s based on the results of a Mn-depleted zone. A portion of martensite in both the AQ thick plate and dilatometric specimen was identified as auto-tempered martensite in which there is a Bagayatskii orientation relationship between the ferrite matrix and cementite.
Acknowledgments
This work was financially supported by CBMM and the Fundamental Research Program of the Korea Institute of Materials Science (PNK8920). The authors thank Prof. S.-D. Kim in Pukyong National University for help with the TEM analysis.
References
- Ouchi, C. Development of steel plates by intensive use of TMCP and direct quenching processes. ISIJ Int. 2001, 41, 542–553. [Google Scholar] [CrossRef]
- Liu, D.; Li, Q.; Emi, T. Microstructure and mechanical properties in hot-rolled extra high-yield-strength steel plates for offshore structure and shipbuilding. Metall. Mater. Trans. A 2011, 42, 1349–1361. [Google Scholar] [CrossRef]
- Nishilka, K.; Ichikawa, K. Progress in thermomechanical control of steel plates and their commercialization. Sci. Technol. Adv. Mater. 2012, 13, 023001. [Google Scholar] [CrossRef] [PubMed]
- Uemori, R.; Inoue, T.; Ichikawa, K.; Nose, T.; Fujioka, M.; Minagawa, M.; Shirahata, H. Steels for marine transportation and construction. Nippon steel technical report. No. 101 Nov. 2012.
- Sun, X.; Yuan, S.; Xie, Z.; Dong, L.; Shang, C.; Misra, R. Microstructure-property relationship in a high strength-high toughness combination ultra-heavy gauge offshore plate steel: The significance of multiphase microstructure. Mater. Sci. Eng. A 2017, 689, 212–219. [Google Scholar] [CrossRef]
- Yoshie, A.; Sasaki, J. Recent development of niobium bearing structural steels for ships and infrastructures in Nippon steel. Niobium Bearing Structural Steel TMS(The Minerals, Metals & Materials Society) 2010.
- Liu, D.; Cheng, B.; Chen, Y. Strengthening and Toughening of a Heavy Plate Steel for Shipbuilding with Yield Strength of Approximately 690 MPa. Metall. Mater. Trans. A 2013, 44, 440–455. [Google Scholar] [CrossRef]
- Tang, S.; Liu, Z.; Wang, G. Development of High Strength Plates with Low Yield Ratio by the Combination of TMCP and Inter-Critical Quenching and Tempering. Steel Res. Int. 2011, 82, 772–778. [Google Scholar] [CrossRef]
- Guo, K.; Pan, T.; Zhang, N.; Meng, L.; Luo, X.; Chai, F. Effect of Microstructural Evolution on the Mechanical Properties of Ni-Cr-Mo Ultra-Heavy Steel Plate. Materials 2023, 16, 1607. [Google Scholar] [CrossRef]
- Schino, A.; Guagnelli, M. Metallurgical design of high strength/high toughness steels. Mater. Sci. Forum 2012, 706-709, 2084–2089. [Google Scholar] [CrossRef]
- Saxena, A.; Kumar, V.; Datta, R. Influence of Cooling Rate on Transformation Behavior of 0.15% V Microalloyed Steel. J. Mater. Eng. Perform. 2011, 20, 1481–1483. [Google Scholar] [CrossRef]
- Zhao, Y.; Shang, C.; Yang, S.; Wang, X.; He, X. The metastable austenite transformation in Mo-Nb-Cu-B low carbon steel. Mater. Sci. Eng. A 2006, 433, 169–174. [Google Scholar] [CrossRef]
- Wang, H.; Cao, L.; Li, Y.; Schneider, M.; Detemple, E.; Eggeler, G. Effect of cooling rate on the microstructure and mechanical properties of a low-carbon low-alloyed steel. J. Mater. Sci. 2021, 56, 11098–11113. [Google Scholar] [CrossRef]
- Lv, Y.; Zhang, Y.; Wang, H.; Wang, W.; Liu, Y. Temperature Variation of Steel Plate with Different Thickness on Normalizing Process. J. Phys.: Conf. Ser. 2021, 1820, 012127. [Google Scholar]
- Stewart, R.; Speer, J.; Thomas, B.; Moor, E.; Clarke, A. Quenching and Partitioning of Plate Steels: Partitioning Design Methodology. Metall. Mater. Trans. A 2019, 50, 4701–4713. [Google Scholar] [CrossRef]
- Fu, T.; Deng, X.; Tian, X.; Liu, G.; Wang, Z. Experimental study on temperature drop during roller quenching process of large-section ultra-heavy steel plate. Sci. Prog. 2021, 104(2), 1–26. [Google Scholar] [CrossRef]
- Thompson, S.; Howell, R. Factors influencing ferrite/pearlite banding and origin of large pearlite nodules in a hypoeutectoid plate steel. Mater. Sci. Technol. 1992, 8, 777–784. [Google Scholar] [CrossRef]
- Ha, W.; Lee, C.; Park, C. Microstructural control of hot rolled strips and their tensile strengths after hot stamping process. J. Mech. Sci. Technol. 2015, 29, 209–213. [Google Scholar] [CrossRef]
- Slater, C.; Bandi, B.; Dastur, P.; Davis, C. Segregation Neutralised Steels: Microstructural Banding Elimination from Dual-Phase Steel Through Alloy Design Accounting for Inherent Segregation. Metall. Mater. Trans. A 2022 53, 2286–2299.
- Shi, L.; Yan, Z.; Liu, Y.; Yang, X.; Zhang, C.; Li, H. Effect of acicular ferrite on banded structures in low-carbon microalloyed steel. Int. J. Miner. Metall. Mater. 2014, 21, 1167–1174. [Google Scholar] [CrossRef]
- Ye, Q.; Liu, Z.; Yang, Y.; Wang, G. Effect of Rolling Temperature and Ultrafast Cooling Rate on Microstructure and Mechanical Properties of Steel Plate. Metall. Mater. Trans. A 2022, 47, 3622–3632. [Google Scholar] [CrossRef]
- Honeycombe, R.; Bhadeshia, H. Steels: Microstructure and properties 4th edition. Elsevier Ltd 2017, 238–246. [Google Scholar]
- Matsuda, H.; Mizuno, R.; Funakawa, Y.; Seto, K.; Matsuoka, S.; Tanaka, T. Effects of auto-tempering behaviour of martensite on mechanical properties of ultra high strength steel sheets. J. Alloys. Compd. 2013, 577, S661–S667. [Google Scholar] [CrossRef]
- Jiang, H.; He, Y.; Lin, L.; Liu, R.; Zhang, Y.; Zheng, W.; Li, L. Microstructures and Properties of Auto-Tempering Ultra-High Strength Automotive Steel under Different Thermal-Processing Conditions. Metals 2021, 11, 1121. [Google Scholar] [CrossRef]
- Bhadeshia, H. Bainite in steel 3rd edition. Mancy Publishing 2015, 142. [Google Scholar]
- Lee, Y. Empirical formula of isothermal bainite start temperature of steels. J. Mater. Sci. Lett. 2002, 21, 1253–1255. [Google Scholar] [CrossRef]
- Akyel, F.; Olschok, S.; Reisgen, U. Reduction of distortion by using the low transformation temperature effect for high alloy steels in electron beam welding. Welding in the World 2021, 65, 23–34. [Google Scholar] [CrossRef]
- Steven, W.; Haynes, A. The Temperature of Formation of Martensite and Bainite in Low-Alloy Steels. J. the Iron and Steel Inst. 1956, 183, 349–359. [Google Scholar]
|
Disclaimer/Publisher’s Note: The statements, opinions and data contained in all publications are solely those of the individual author(s) and contributor(s) and not of MDPI and/or the editor(s). MDPI and/or the editor(s) disclaim responsibility for any injury to people or property resulting from any ideas, methods, instructions or products referred to in the content. |
© 2023 by the authors. Licensee MDPI, Basel, Switzerland. This article is an open access article distributed under the terms and conditions of the Creative Commons Attribution (CC BY) license (http://creativecommons.org/licenses/by/4.0/).
