Submitted:
06 June 2023
Posted:
07 June 2023
You are already at the latest version
Abstract
The increased demand and use of autonomous vehicles and advanced driver-assistance systems has been constrained by an incidence of accidents involving errors with the perception layer’s functionality. In tandem, recent papers have noted the lack of standardized, independent testing formats and insufficient methods with which to analyze, verify and qualify LiDAR-based data and categorization. While camera-based approaches benefit from an ample amount of research, camera images can be unreliable in situations with impaired visibility such as dim lighting and fog. This paper aims to introduce a novel method based entirely on LiDAR data with the capability to detect anomalous patterns as well as complementing other performance evaluators using a Copula-based approach. With a promising set of preliminary results, this methodology may be used to evaluate an algorithm’s confidence score, the impact conditions may have on LiDAR data and detect cases in which LiDAR data may be insufficient or otherwise unusable.
Keywords:
autonomous driving
; perception algorithms
; LiDAR
; anomaly detection
; COPOD
1. Introduction
The last five years have seen an exponential increase in embedded systems within the automotive industry, a modernization which has allowed for a deeper and more complex integration of electronics, in part fueled by the higher interest in both electric and hybrid vehicles. This phenomenon, in turn, has given way to a wave of demand for advanced driver-assistance systems and “self-driving vehicles”, shifting automated driving into a particularly pertinent field of research. This increased interest has been accompanied by a requirement for better and more accurate machine learning models, in turn necessitating new performance indicators and metrics, higher quality and diversity of evaluation methods, as well as higher quality and realism of the datasets used to train these models, among others.
Nevertheless, accidents involving autonomous vehicles have been reported as resulting from errors of the perception computing layers [1,2,3]. One such example involves an accident between one of Uber’s vehicles and a pedestrian holding a bike while crossing a street. Reports suggest that both LiDAR and RADAR systems detected the pedestrian about six seconds before the registered impact, but a misclassification of the pedestrian as an "unknown object" led to the unfortunate crash [3]. Despite development efforts held in the past years, research is still required to prevent these failures. Special notice has to be given to ways in which researchers may improve and characterize the performance of perception algorithms under diversified driving situations. Notably, there is an acute lack of research involving holistic LiDAR data.
In order to obtain robust and accurate perception algorithms, there exists a fundamental requirement to expand the availability and size of datasets and to improve the effectiveness of both testing methods and key performance metrics in other to mitigate risks and better assess the performance and evolution of these algorithms. There are a few ways to achieve this, one such involving the comparison of the layer’s output against a "ground truth" (labeled data) that is part of the dataset. Other such approaches involve the collection of detailed statistics via thorough testing, correlations between different metrics, the detection of anomalies, outliers, and fringe cases, etc.
With this in mind, this paper aims to introduce a novel, multi-faceted approach based entirely on LiDAR data, capable of both outlining points of concern within a given dataset, as well as complementing other performance evaluators. This approach, using a Copula-based Outlier Detection algorithm (COPOD), leverages its unique characteristics to aid in the training and evaluation of perception algorithms.
Its ability to identify possible outliers within a given category allows for the detection and removal of data which may prove unsuitable for a given purpose, facilitating the building and use of a dataset. Furthermore, through a similar process, this method is able to calculate the probability of a given LiDAR Point Cloud belonging to a certain category. This allows it, when combined with other performance evaluators, to serve as a benchmark with which to evaluate a Perception Algorithm’s performance.
1.1. Mathematical Copulas
In probability theory and statistics, a cumulative distribution function (CDF) gives the probability of a given variable X taking a value less than or equal to x. A Copula is a distribution function whose marginal laws are uniform in . It is a special, multivariate cumulative distribution function case for which the marginal probability distribution for each of the variables that define it is uniform on this interval, separating them from the dependency structure associated with a multivariate distribution [4] and verifying the following three conditions:
If C is a Copula related to a random vector , then C couples the distribution functions, in the sense that
While, at first glance, Copulas may appear a niche, they can be applied in a wide variety of ways via some clever mathematical maneuvering. Firstly, it is known that, by leveraging the Central Limit Theorem via the sampling of a given distribution, one can transform it into an uniform distribution. Furthermore, any uniform distribution can be transformed into any given function via inverse sampling [4]. With this in mind, Sklar’s Theorem can be introduced, stating that any given multivariate, joint distribution can be written in terms of a univariate marginal distribution and, in turn, can be described by a Copula [4].
Due to these properties, Copulas have long since been used to describe the correlation between seemingly random variables, finding applications in many fields. Most notably, they are widely used in finance to manage and optimize investment risk. Recently, Copulas have found new applications within a variety of fields such as, outlier detection [4], software quality assessment [5], automotive component failure [6], test of analog and mixed-signal circuits [7], and fault detection in mechanical engineering [8].
The task of a LiDAR data perception algorithm is to interpret and process the point cloud (PC) information, captured by its sensor, to detect and track objects. Accurately segmenting the captured point cloud into the various objects that compose a scene and locating them in the 3D space is not a trivial task, especially when the relative distance, shape and size of objects are required. The captured PC is usually noisy, sparse and frequently inconsistent due to, e. g., complex objects’ geometries, different surface reflectiveness, difficult weather conditions, or even LiDAR’s intrinsic errors. All these are likely to generate scattered point cloud data where many data points can be classified as outliers.
The objective of the work presented herein is to resort to a Copula-based Outlier Detection algorithm (COPOD) to identify outliers in a given category, facilitating the building and use of a dataset containing LiDAR data. Furthermore, the proposed method allows, when combined with other performance evaluators, to serve as a benchmark when evaluating the performance of perception algorithms.
Prior to presenting the preliminary results obtained, the following Section 2 provides as a summary revision of some of the methods used to test and evaluate different aspects of the systems responsible for an autonomous vehicle’s functionality, including the perception algorithms and associated data. Section 3 presents an in-depth explanation of the proposed methodology. Within this section one may find an overview of outlier detection and the detector developed in this work, as well as a presentation of the data analyzed and the method we wish to outline. Finally, Section 4 discusses the preliminary results obtained after the application of the proposed methodology making use of the KITTI dataset.
2. Overview on Perception Testing Methods
In 2021, a review of the methods used to test Environmental Perception in autonomous driving was conducted by Hoss et al. . During it, the authors found that much of the testing and evaluation present at the time, while conforming under ISO 26262 and ISO/PAS 21448, became insufficient once vehicles were given a larger degree of automation. Highlighted are several points regarding the interdependence of criteria and the failure of given metrics to account for points of failure which, while not formally regarded as catastrophic failures, may result in accidents regardless.
One such highlighted example involves a metric dubbed "statistical safety impact" [9], which depends on a system’s safety impact in individual scenes that, unfortunately, depends on whether the system itself correctly recognized and reported its uncertainty in a scene. If a failure-induced mischaracterization occurs, an uncertainty may never be detected and the abnormality remain undetected. Similarly, there are times in which the perception layer may encounter uncertainty with a false positive, such as cases involving ’ghost pedestrians’ which may cause the subsequent layers to behave erratically, leading to performing an emergency and dangerous breaking maneuver, and putting other vehicles and drivers at risk.
Most of all, the review highlights that despite the existence of safety criteria and metrics which fulfill them, including those independent from the system itself, there exists a pressing need to produce new and more apt indicators that do not rely on the system itself, consider the impact a missclassification may have on the entirety of the system’s pipeline, and are scalable to higher degrees of autonomy.
In 2022, a thorough survey was published by Bogdoll et al. delved into the many forms in which anomaly detection has been leveraged to tackle this specific context, outlining an extensive list of previous methodologies developed throughout the years. They identified five distinct categories: Confidence Score, Reconstruction, Generation, Feature Extraction, and Prediction. For each category, the authors searched extensively for any methods which could be applied to a given context, identifying three main modalities for data capture: Camera, LiDAR, and RADAR. Additionally, an analysis is also conducted regarding the detection of anomalies across multimodal facets and object level data. The former encompasses data captured with two or more of the previous three modalities, while the latter involves abstract abnormalities such as behavioral patterns and other data not bound to any given modality.
Within the survey, the authors highlight the differentiation between the quantity and the quality of effective methods, especially when it comes to LiDAR captured data. Out of all the modalities, LiDAR presents the least technological development when it comes to the identification of anomalous data, comprising four total methods, three within the Confidence Score category and one reconstructive approach. While per-point detection is a well-explored field of Anomaly Detection, object-level and pattern-based approaches are still few and far between.
3. Materials and Methods
To better contextualize this description, a basic overview of the tools and materials utilized will come before presenting the actual procedures, starting with a brief explanation of the COPOD algorithm.
3.1. Outlier Detection
Outliers, also regarded as anomalies, are commonly understood as instances, actions or objects which fall outside the norm. In the field of statistics, these refer to unexpected data points or patterns which do not conform to an expected behavior [11]. This definition can be further explored by taking an abstract set of data, describable via a given number of functions. In this case, outlier designates any point unable to be fit into, at least, one such function, originating instead from an unknown distribution, foreign to the remaining data. Conversely, any points which can be fit into these describing functions are regarded as inliers.
Outlier detection refers to any process which may be used to accurately identify any such anomalies, separating the inliers and outliers [4]. Depending on the quantity, type, labeling and other such characteristics of a given dataset, the manner in which one may go about identifying said anomalies will vary. With that in mind, it is possible to distinguish between three main types of algorithms, fundamentally characterized by the availability of labels in the dataset [11].
- Supervised detection relies on fully labeled data and often benefits from the use of classifiers to deal with unbalanced class distribution;
- Semi-Supervised detection is characterized by training data which consists only of normal instances, without anomalies.
- Unsupervised detection is performed on unlabeled data, taking only the intrinsic properties of a dataset.
3.1.1. Copula-Based Outlier Detection
An outlier detection algorithm based upon Copulas was first introduced in Li et al. [4]. Excelling in both speed and effectiveness, it outperformed most of its competitors where applicable, distinguishing itself from them due to its deterministic approach and complete lack of hyperparameters [4]. These characteristics allow for ease of use, removing any need for manual tweaking or tinkering which in turn leave little margin for user error. Furthermore, as it is able to function both with and without learning splits, it may operate as a supervised, semi-supervised or unsupervised algorithm. It has also been integrated into the Python Outlier Detection (pyOD) suite, which allows for further accessibility.
The algorithm itself is based upon the exploitation of properties intrinsic to empirical Copulas which can be derived from empirical cumulative distribution functions (eCDFs). A cumulative distribution function (CDF) is a descriptor of the probability of a given variable X taking a value less than or equal to x. The continuous nature of this probability distribution, however, imposes some rather expensive computational requirements which do not scale well in multivariate cases. An eCDF is instead used, defined as a step function which approximates the true CDF via a sampling system with a frequency of 1/n, with n being the total amount of samples. A Copula is a special case of a multivariate CDF, defined by the uniformity of each variable’s marginal probability in the interval of .
Figure 1.
Original CDF and derived eCDF with n-samples [12].
Figure 1.
Original CDF and derived eCDF with n-samples [12].
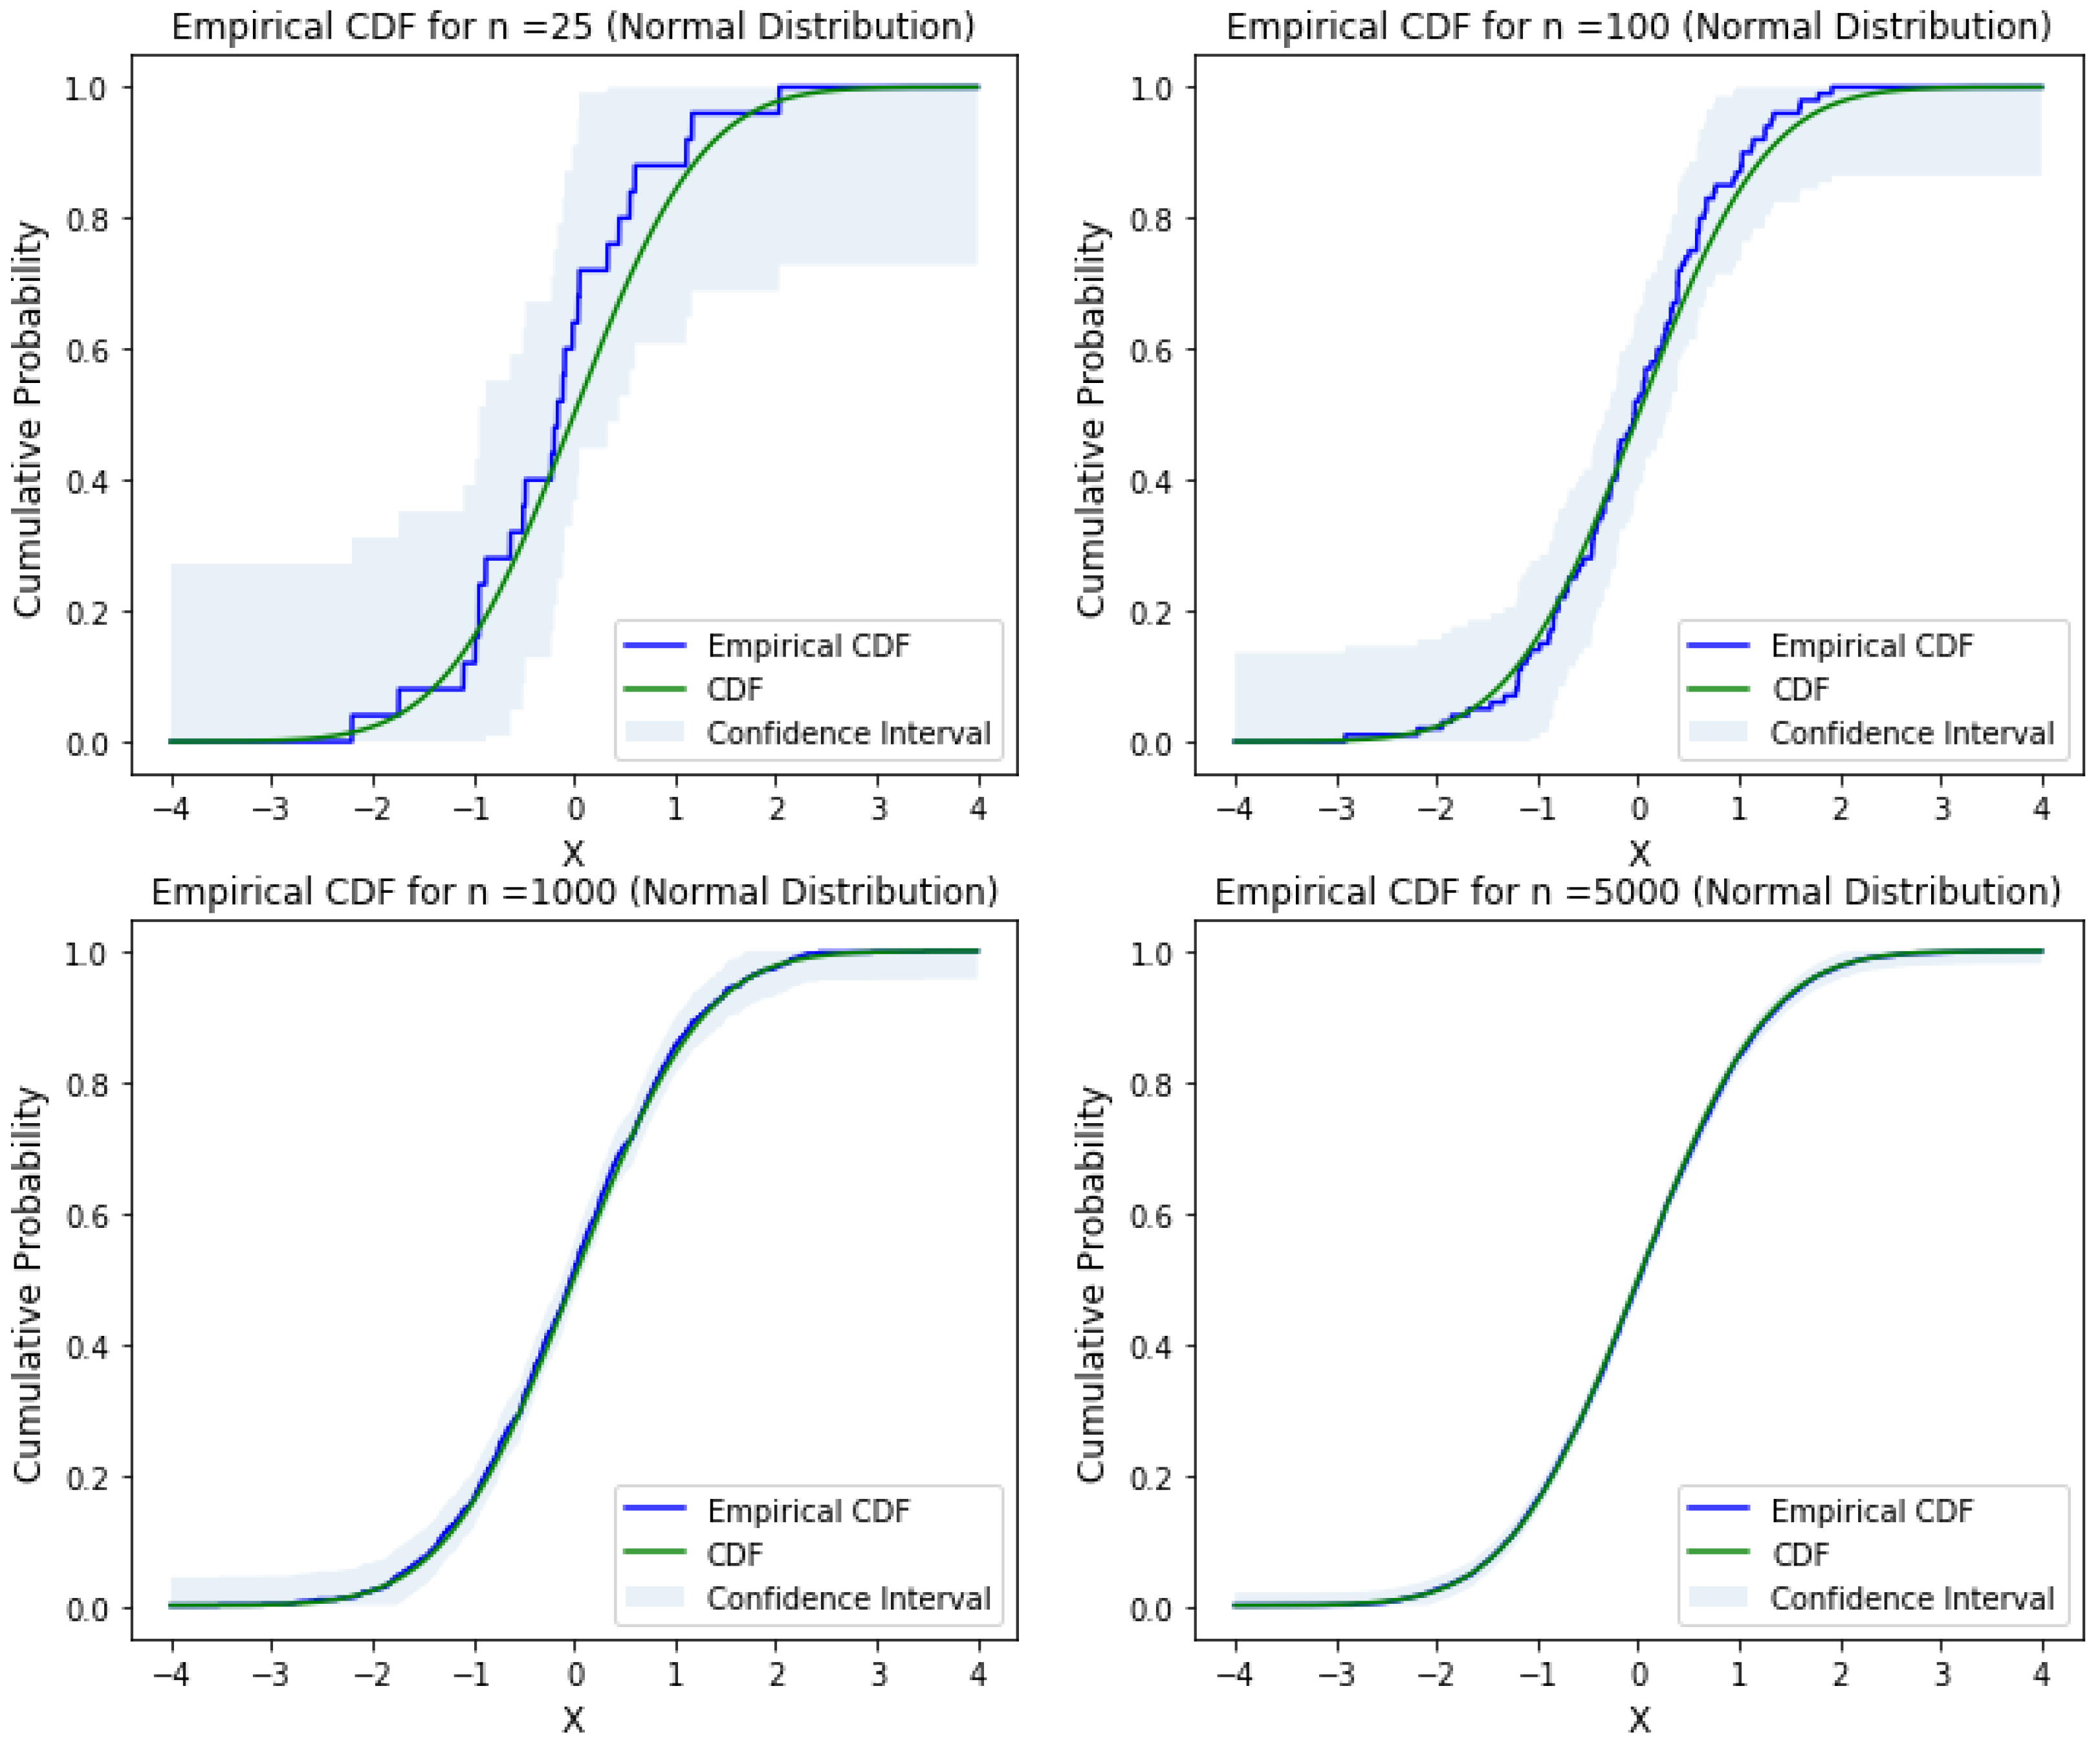
The algorithm itself works by attempting to fit a given dataset to a Copula. To do this, it must first create one, or multiple eCDFs which accurately encapsulate the majority of the dataset’s values. These can then be used to derive the empirical Copula. Since outliers can be seen as a Copula’s tail events, calculating an approximation of its tail probabilities allows for the evaluation of a given point X. By calculating the likelihood of a point Y being, at least, as extreme as X, the algorithm is able to assign an anomaly score to that value, with lower probabilities resulting in higher scores.
While this approach may provide an opening towards bias and inherent skews in the dataset, the algorithm mitigates this via a correction system leveraging the monotonicity of logarithmic functions [4].
3.2. Data
For the purposes of this first introduction to the methodology, we elected to use the KITTI dataset [13]. KITTI has been a staple of autonomous driving datasets ever since it was made available in 2012, providing a stereo camera and LiDAR data via a 360 degrees Velodyne Laserscanner [13]. Using the 2017 version of the 3D Object Detection Evaluation dataset, it provides 7481 training images and 7518 testing images, which corresponds to a total of 80,256 labeled objects across multiple categories such as: car, van, truck, pedestrian, person sitting, cyclist and tram.
The data itself is stored in a proprietary format and separated across different .zip files which contain: left color images, right color images (stereo dataset), Velodyne point clouds and the labeling data for the training portion of the dataset [13].
There are a few ways in which one may go about extracting and organizing the LiDAR data available. One of those options is to extract the data pertaining to each point within a given bounding box, shaping its coordinates into a position relative to the bounding box’s center. This is a necessary step in eliminating inconsistencies in an object’s point cloud that may come from the distance to the scanner itself, allowing each resulting collection to better describe the object’s captured shape. These data can then be stored in individual NumPy arrays to be processed by the method.
3.3. Methodology
The peculiarities of COPOD as a multivariate, statistical method render it unable to parse the data we previously acquired. Its input is constrained, accepting only a collection of one or more features, or variables, that it can relate and process. The associated matrix must strictly be both uniform and either one or two dimensional.
To tackle this problem, a new approach had to be found and deliberation upon problem incurred the following hypothesis: if one were to simply turn X, Y and Z into the individual features with which to fit the algorithm, the eCDF and subsequent Copula derived from the conjunction of all these points might accurately describe the shape of a given category. Looking at the granularity present in the KITTI dataset, cars and vans are regarded as different entities, as should be trucks and other vehicles. This means that a ‘car’ is a somewhat defined entity with a shape that, while different individually, can be characterized by telltale characteristics easily picked up by a LiDAR point cloud.
With that in mind, it is important to note that this approach dispenses with crucial information and granularity derived from individual contexts, from the intrinsic properties of distinct cars which may have aided in better identifying outliers or preventing misclassification.
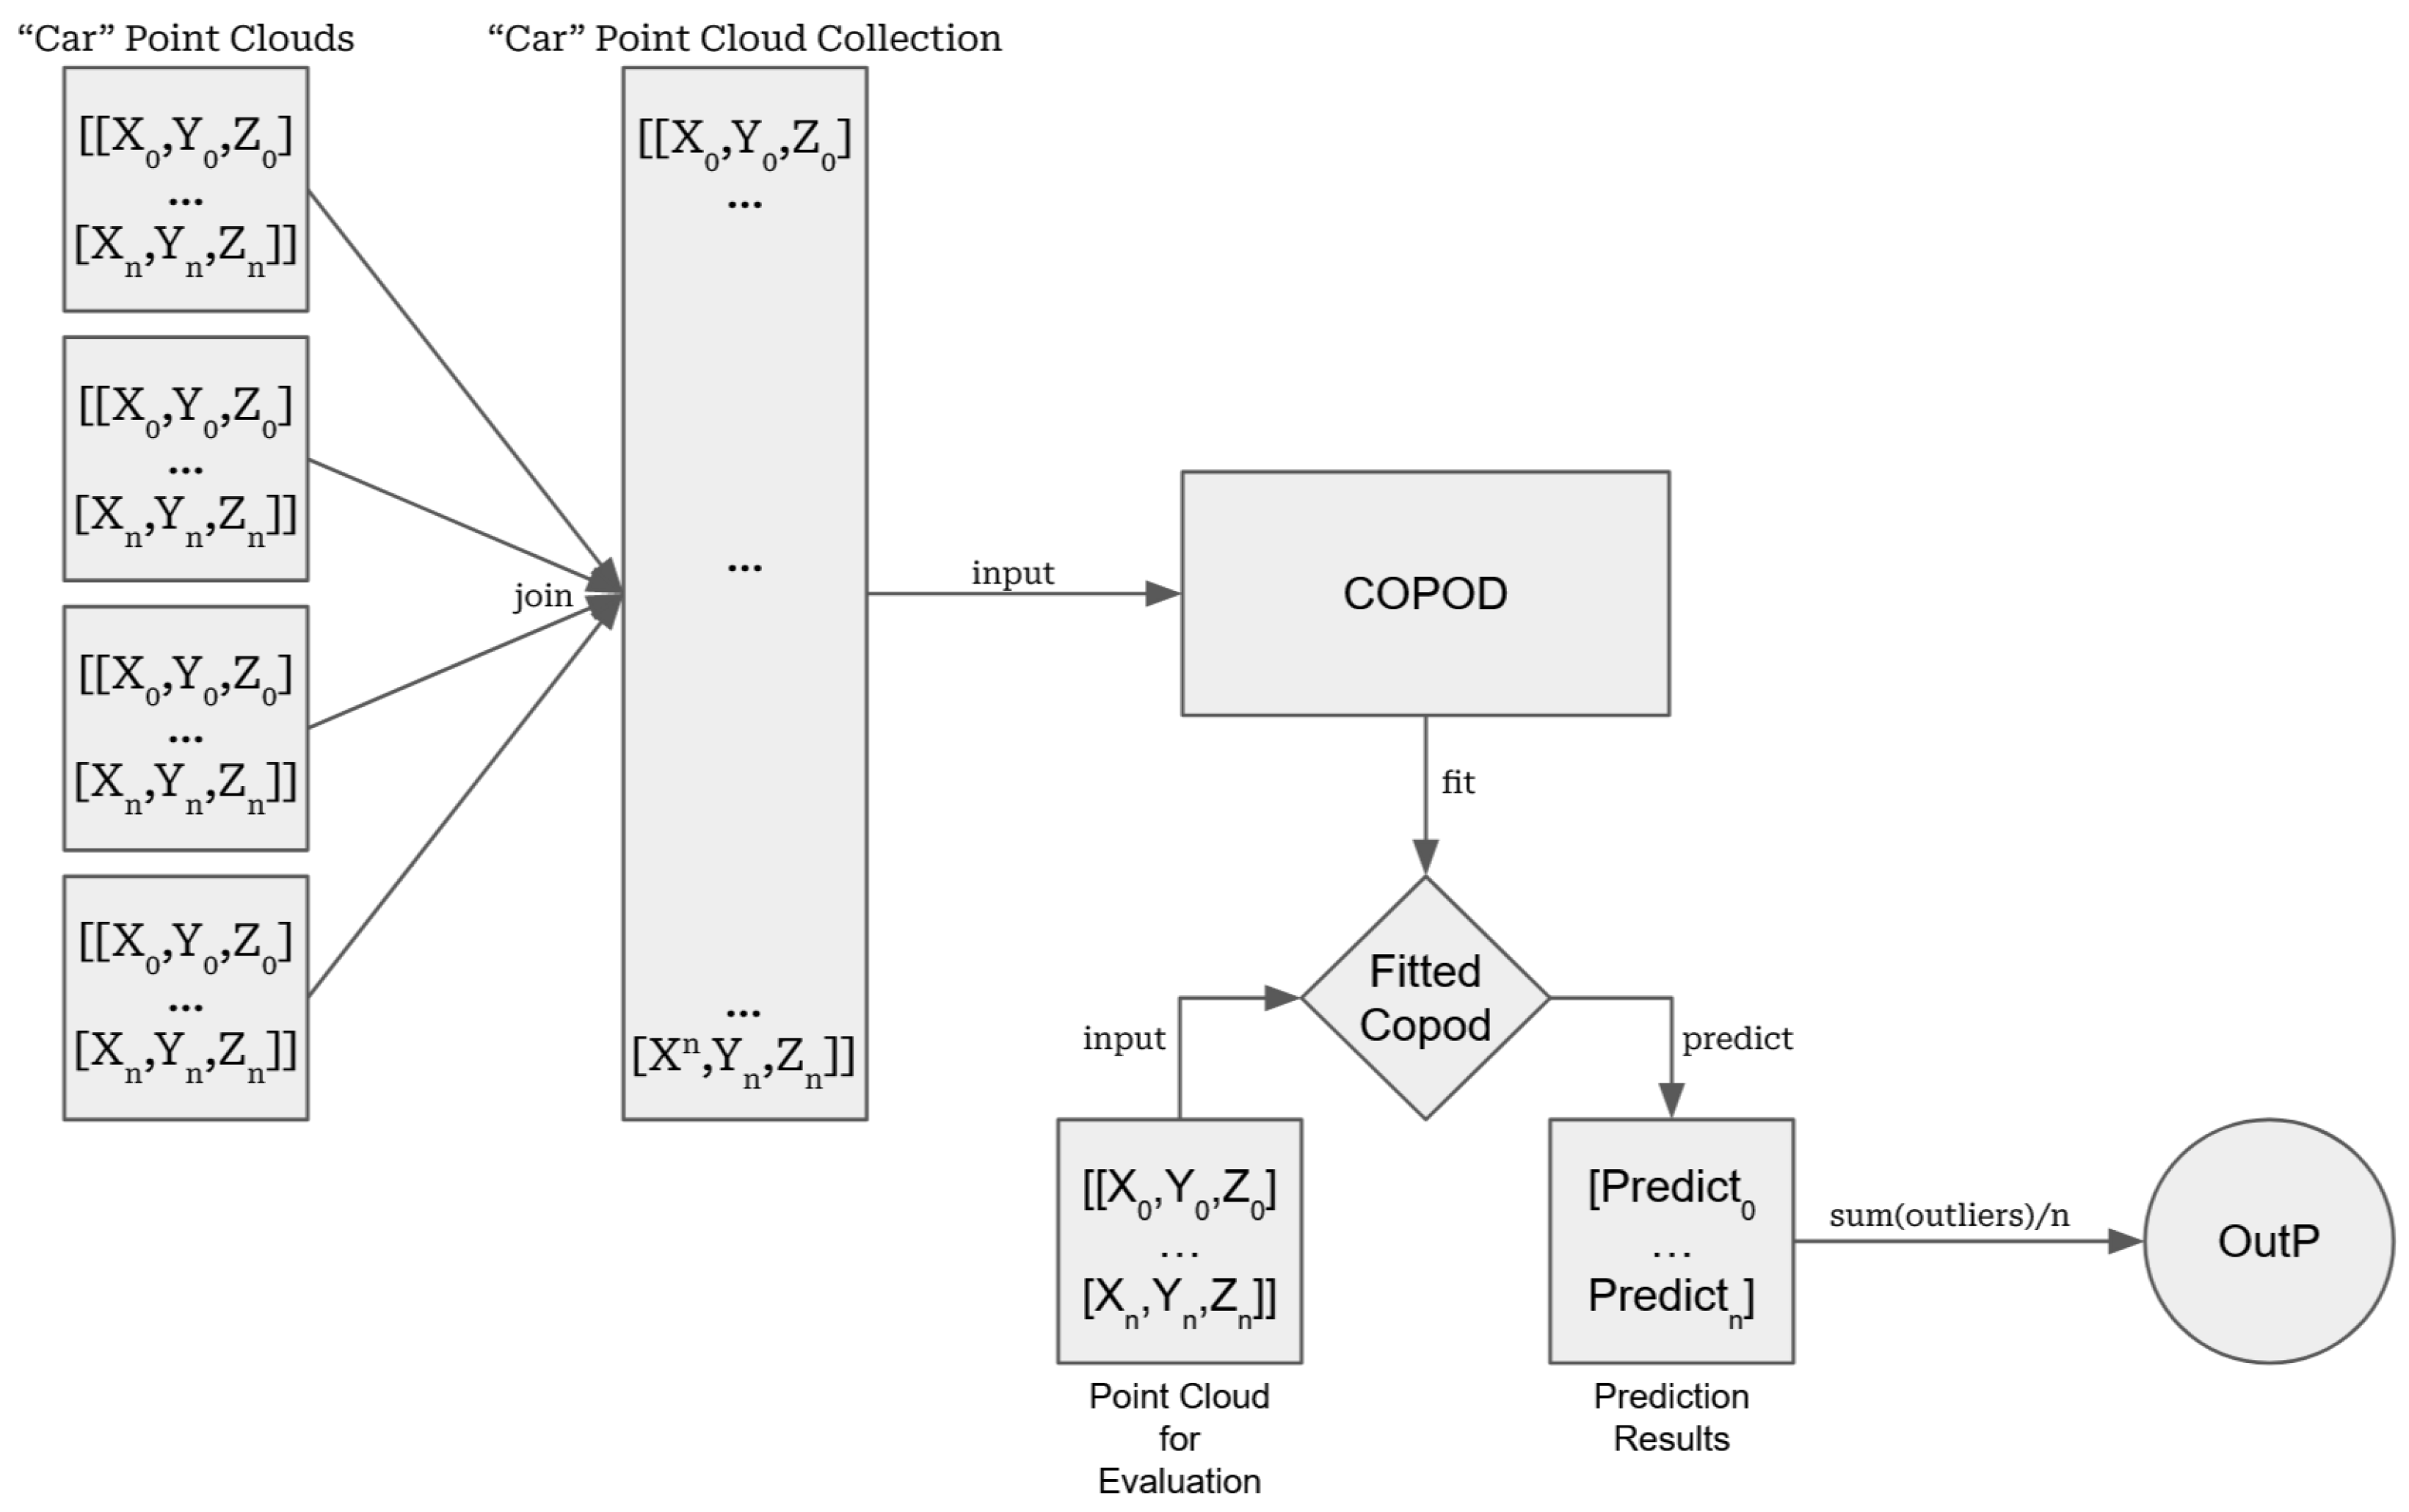
The data treatment process can be seen in Figure 2 and is as follows: after extracting the data for a single category as outlined above, each individual NumPy array is then gathered into a singular matrix, collecting every associated point. Using the fit function, a Copula specific to this category can be produced and used to evaluate single points in one of three ways:
- Prediction Method: Predict whether a given point is anomalous or not. The output of this method is a m size list containing 1s and 0s with the former denoting outliers while the latter denotes inliers.
- Probability Method: Predict the probability of a given point being anomalous. The output of this method is a m size list containing the computed probabilities and, if requested, a confidence value of the prediction.
- Scoring Method: Compute the raw anomaly score of a given point. The output of this method is a m size list containing numbers with higher values denoting more anomalous points.
This method however, only provides an analysis on a per-point basis regardless of avenue. As such, a way must be devised to extend these evaluations such that meaningful data on a point-cloud level can be extracted from the individual values obtained. For each method, the following is proposed:
- Prediction: An assessment of the number of outliers present in the cloud is necessary. For this, a simple Outlier Percentage(OutP) is computed by taking the number of outliers present and dividing them by the total number of points in the cloud.
- Probability: An average Anomalous Probability (AAP) can be obtained by adding all individual probabilities and used to evaluate the whole point cloud.
- Scoring: Similar to the probability method, an average Anomaly Score (AAS) can be produced to evaluate the point cloud.
The resulting output, regardless of chosen analysis, can be equated to a perception algorithm’s confidence score, serving as a measure of the likelihood of any given point cloud belonging, or not, to the category used to fit the Copula. Working only with LiDAR data, this method may be implemented alone or supplemented with others and, by comparing its results with an algorithm’s confidence score, an evaluation of the latter’s performance is provided.
Figure 2.
A visual outline of the proposed methodology.
4. Results
The results presented herein are preliminary yet show the promising nature of this methodology and were obtained using the car and pedestrian categories. First, the point clouds for all car and pedestrian bounding boxes present in the 7481 training images were extracted. The car point clouds are appended to one another, producing a single array that is then used to train the algorithm and produce a fitted Copula. Then, point cloud by point cloud, the prediction algorithm is run to determine whether a given point is anomalous or not. Before moving onto the next cloud, the percentage of anomalous points (OutP) is calculated and stored to produce the graphs shown below.
The first case is a proof of concept, obtained by selecting 100 random pedestrian samples and comparing them to 42 car samples that were not included in the training split by calculating their respective OutP.
Figure 3 is a unfiltered showcase of the data presented. The topmost scatterplot highlights the 42 car point clouds that were analyzed through the proposed methodology while the bottom one is in reference to the first 100 point clouds belonging to pedestrians that were randomly selected. Within both graphs, we can see the point cloud distribution across Outlier Percentages with the X-axis highlighting individual point clouds and the Y-axis serving as the respective outlier percentages. The same applies to Figure 5, albeit with 3623 pedestrian point clouds. Furthermore, Figure 4 and Figure 6 present the boxplots associated with each respective scatterplot, outlining the minimum and maximum value as well as the first, second and third quartiles.
As seen within Figure 3 and Figure 4, there is not only a sizable occurrence of outliers within the pedestrian samples, but the difference in outlier percentages between the pedestrian and car point clouds is high enough to enable drawing inferences. This was, however, a test done with very few car and pedestrian samples and may not be representative of the whole data. With that in mind, this preliminary test was scaled to include all the pedestrian point clouds available, a total of 3623. The goal was to see whether this trend continued and, if it did, whether the first obtained percentages were indicative of the greater population. Would that be the case, then it would be a fair assumption that the same would likely be seen in the car samples.
This was necessary for time constraints and computing time reasons: the method is computationally intensive and, as such, validating the results obtained with a lower sample-size opens allows for more varied testing.
Figure 5.
Scatter plot depicting the 42 car point clouds and 3623 pedestrian point clouds. Higher
scores represent a higher percentage of anomalous points.
Figure 5.
Scatter plot depicting the 42 car point clouds and 3623 pedestrian point clouds. Higher
scores represent a higher percentage of anomalous points.
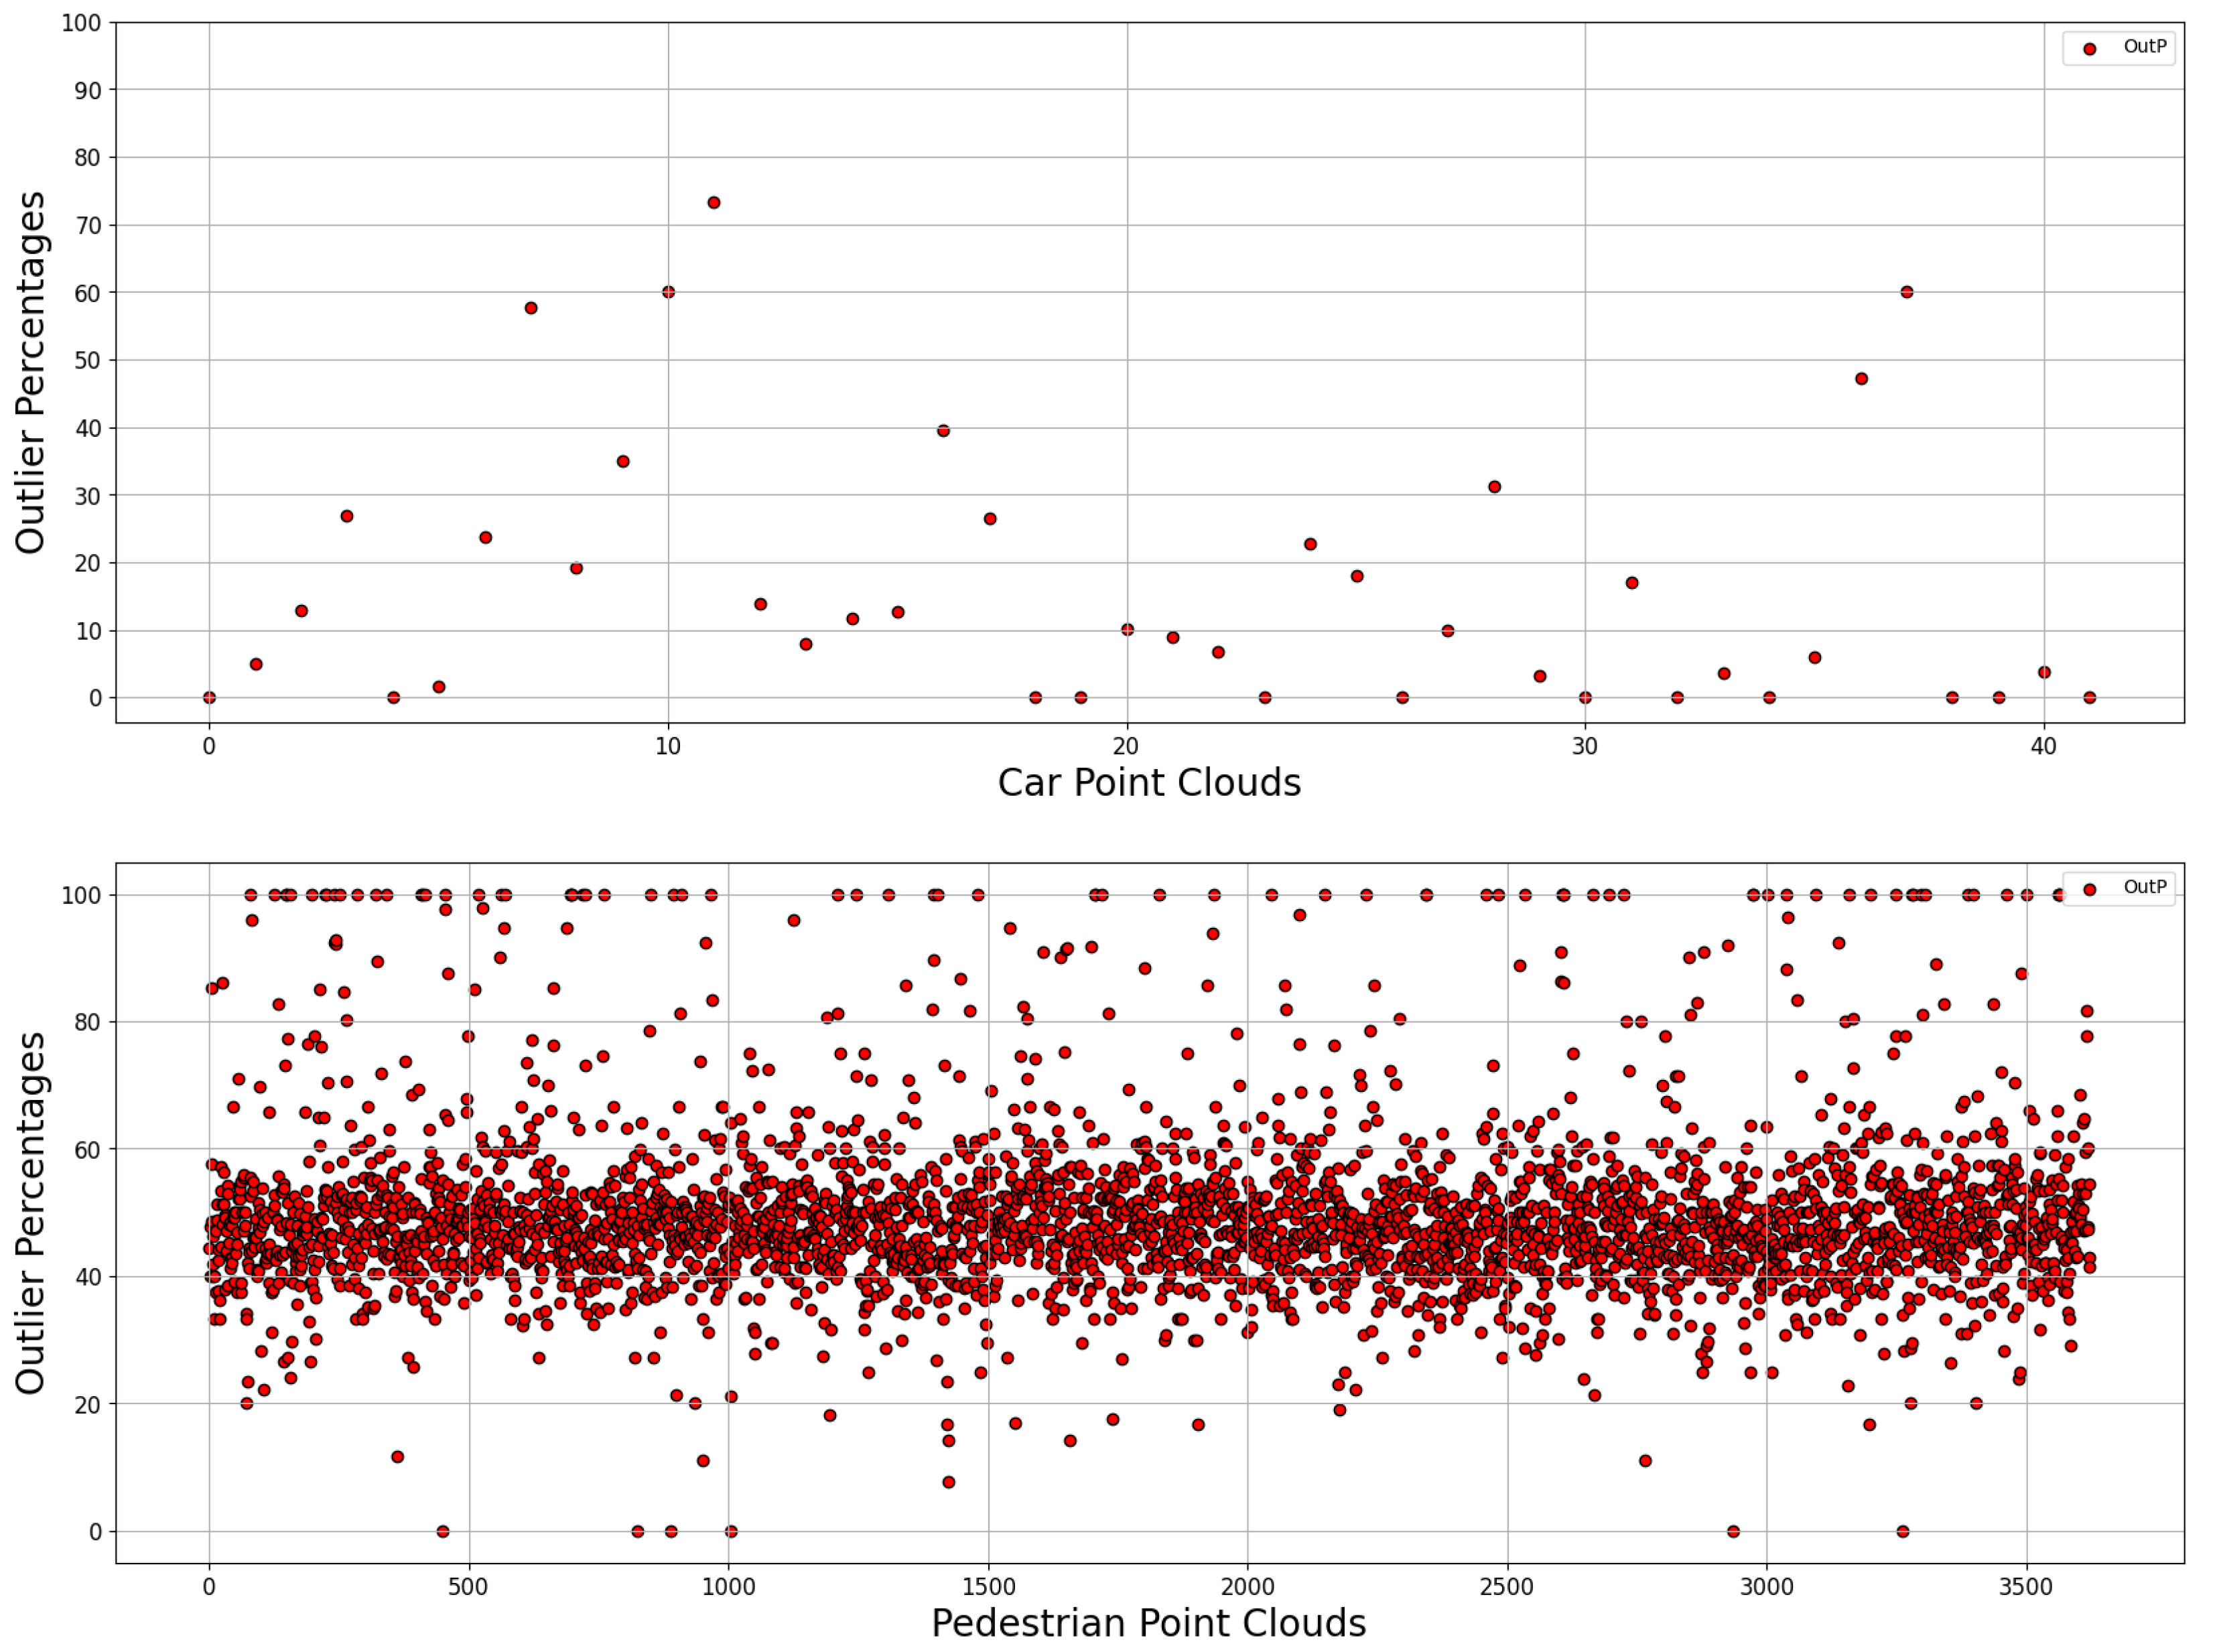
Figure 6.
The associated boxplot for Figure 5.
Figure 6.
The associated boxplot for Figure 5.
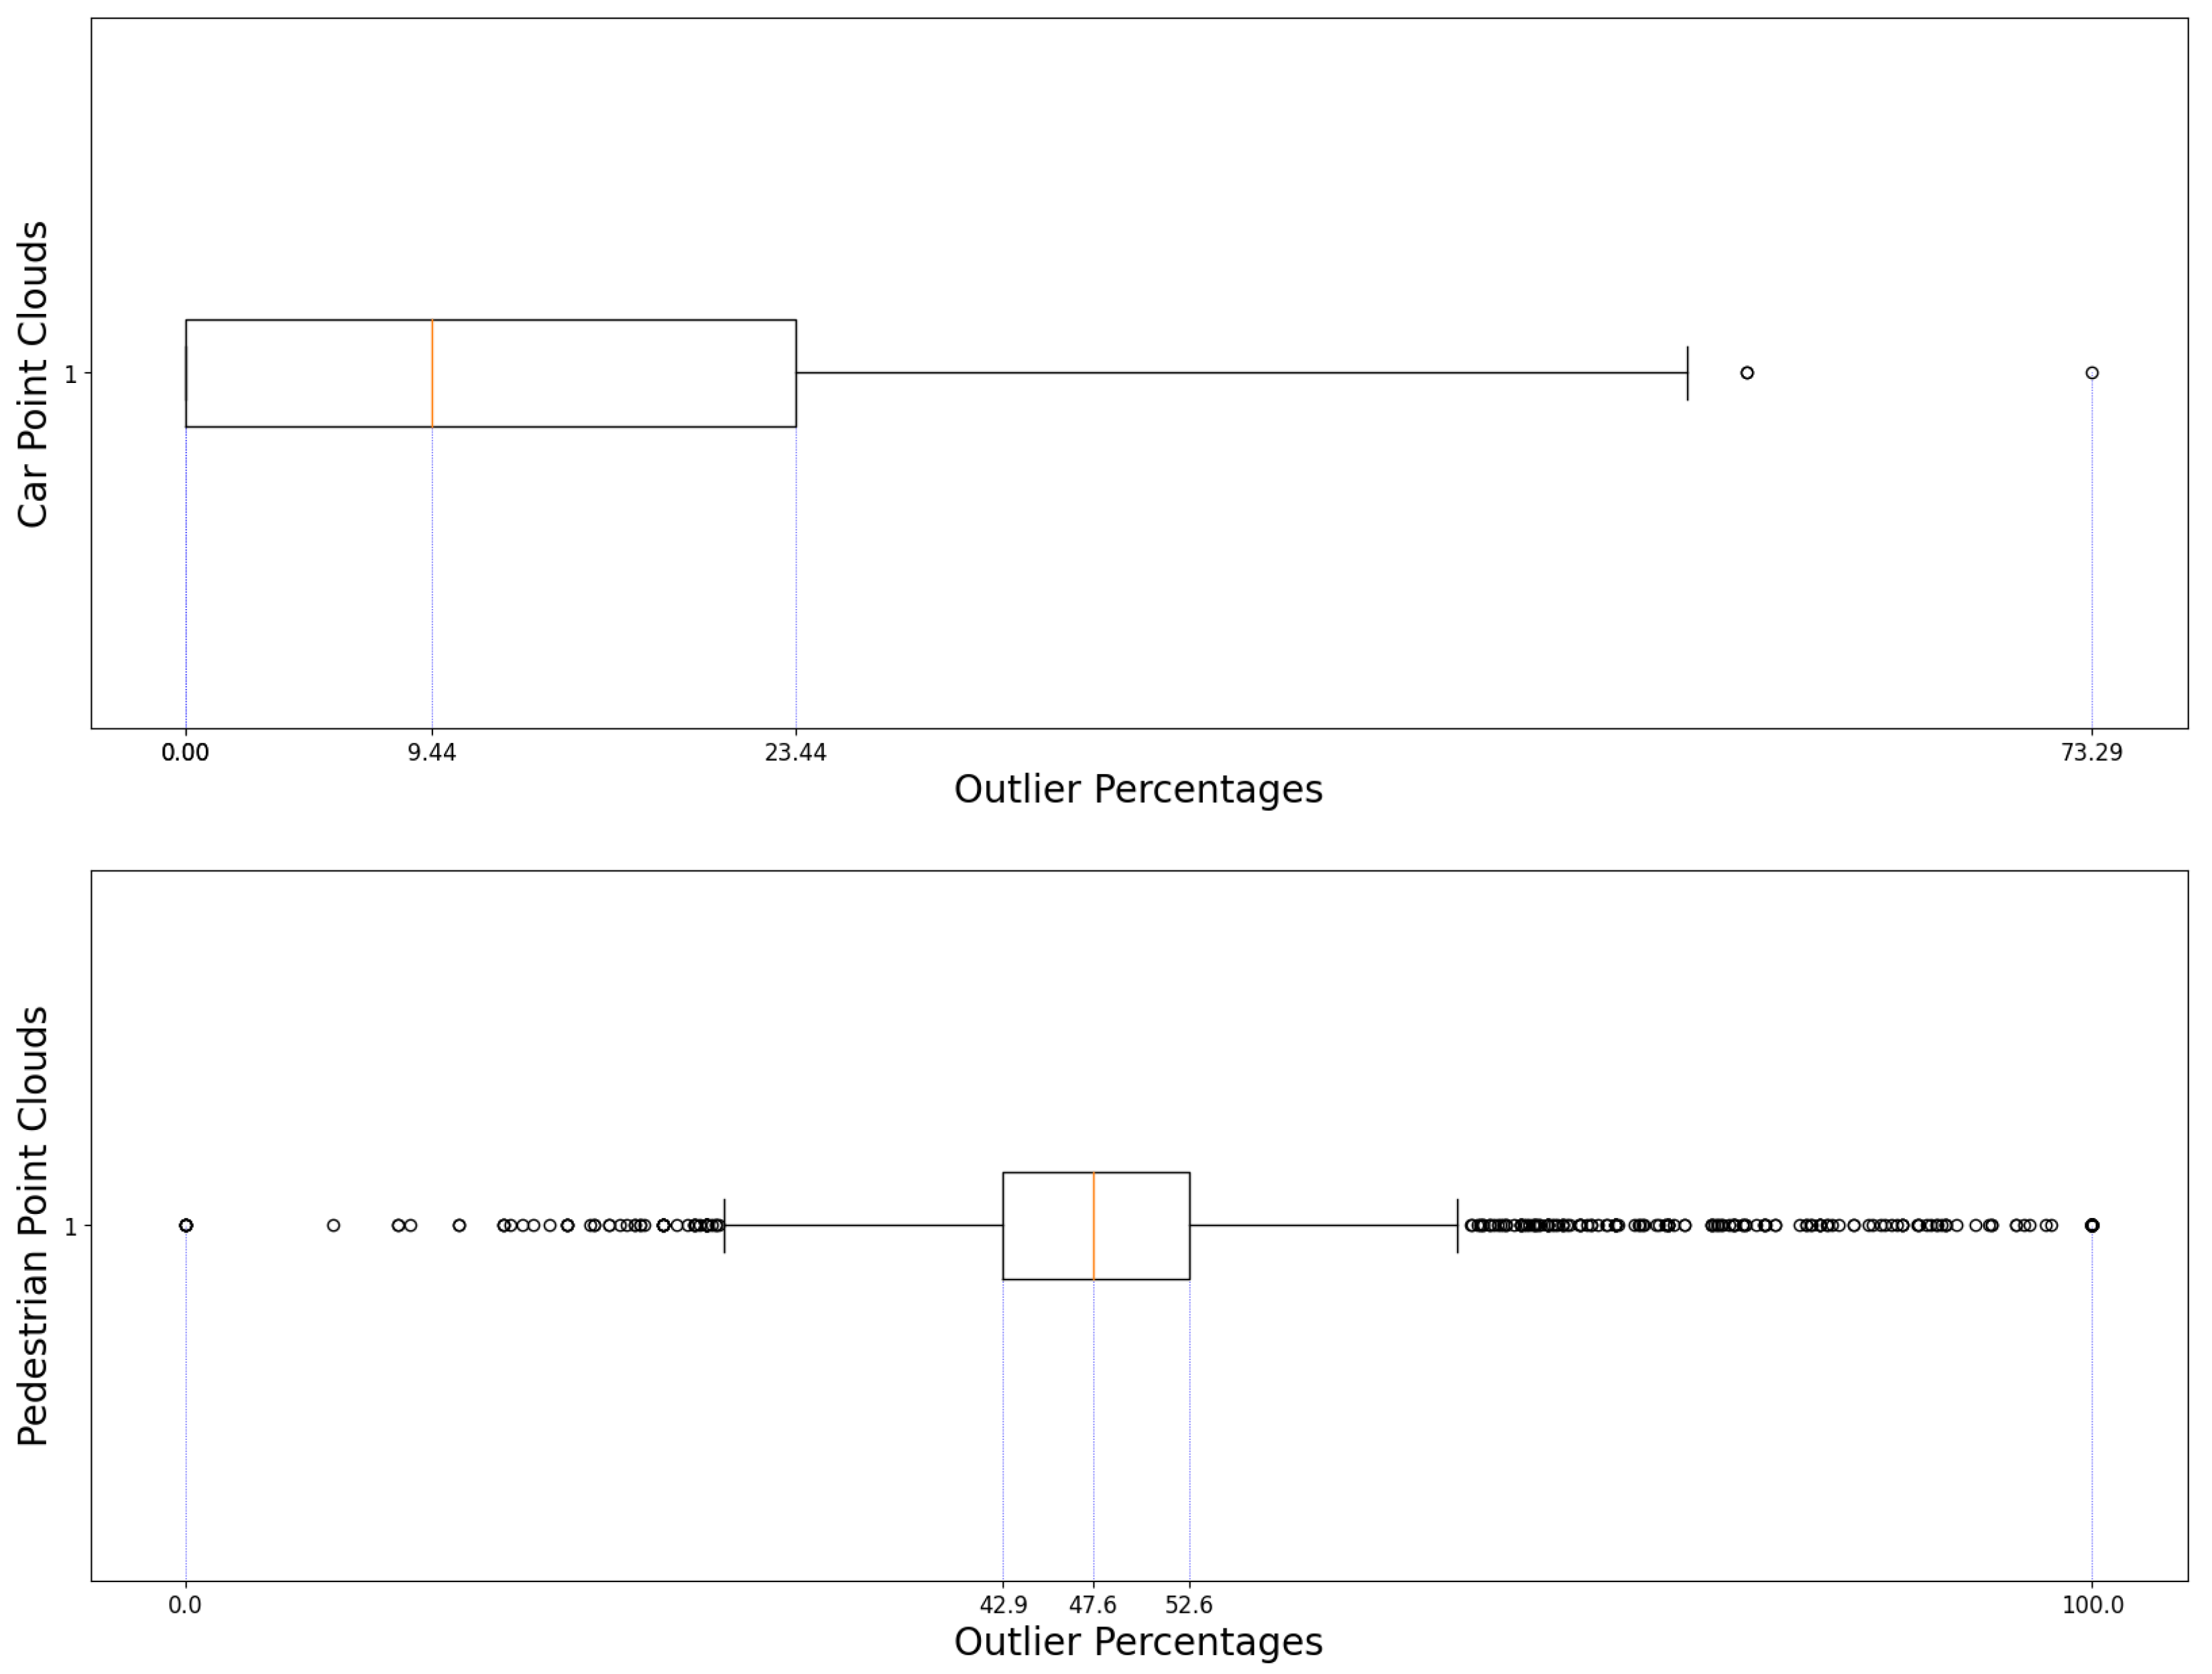
Figure 5 a provides comparison between the results obtained considering the car samples and the entire pedestrian data. The overall distribution of points mirrors the smaller sample of 100 point cloud. Not only that, it is easily observed that there are many more points which fall outside the expected distribution due to their overwhelming presence of outliers than those that seem to lack in outliers altogether.
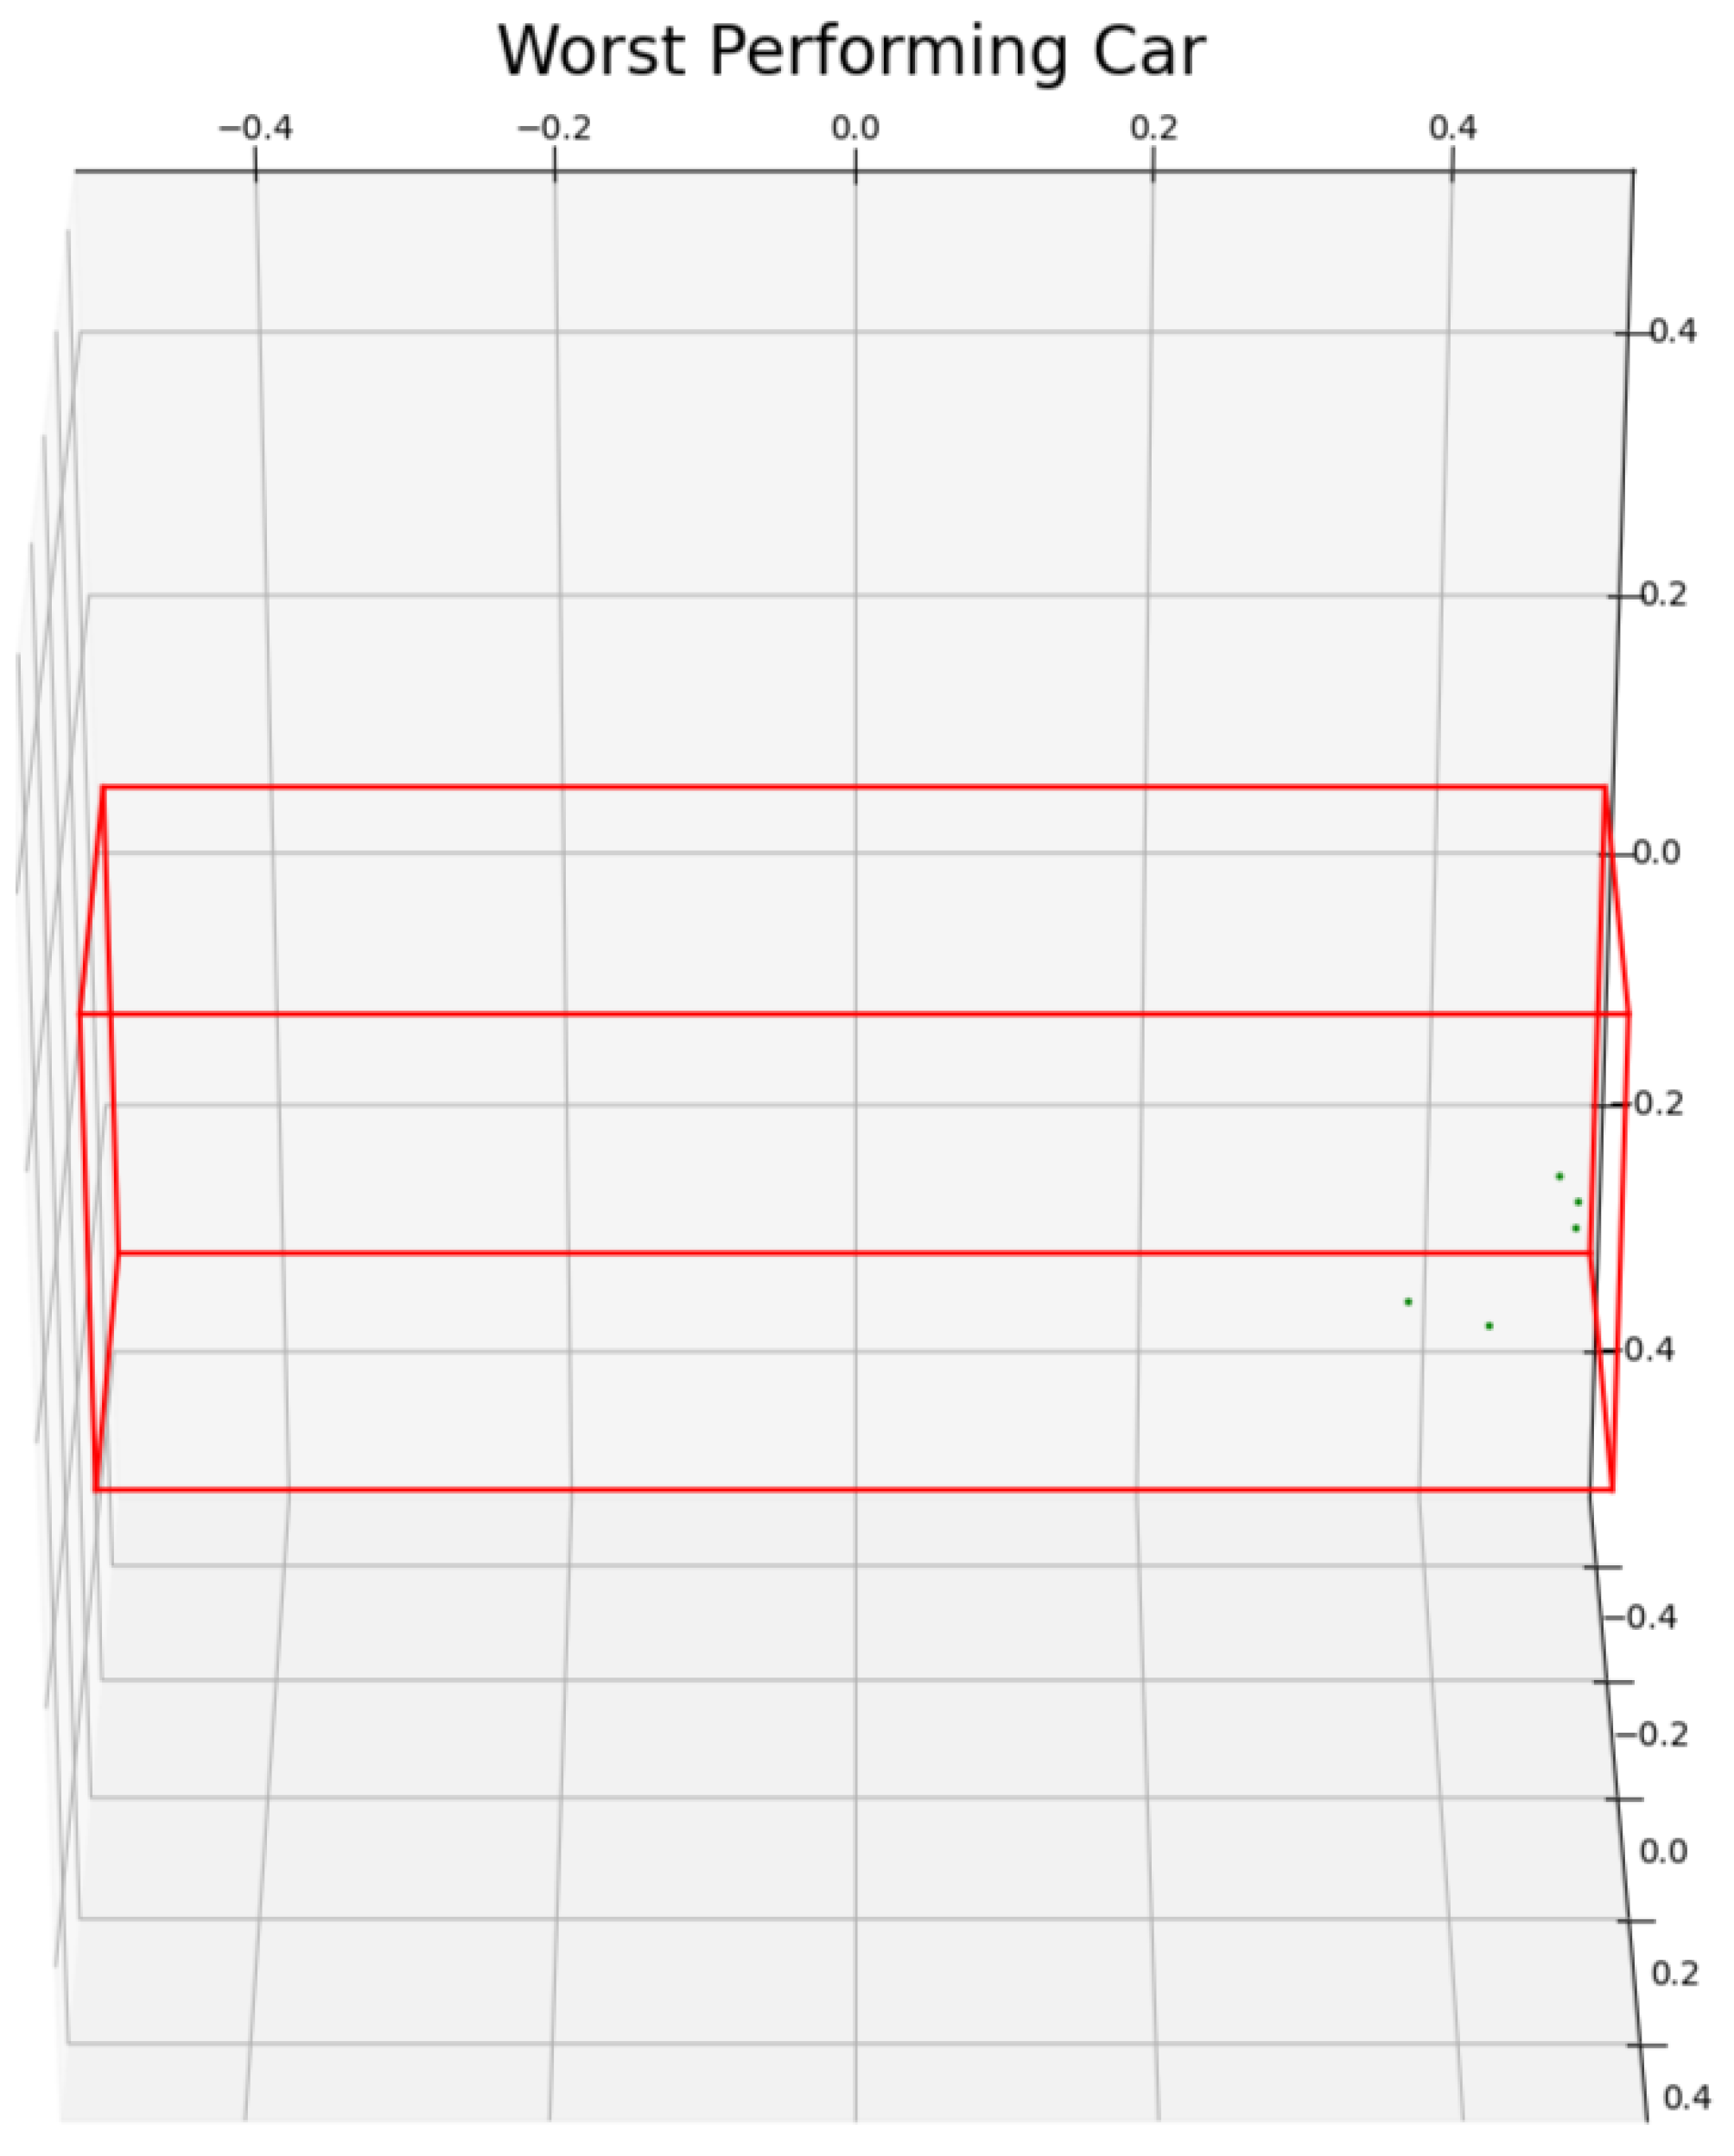
Observing the differences present between the pedestrian and car sample size, it is safe to say that the algorithm is able to provide a degree of confidence as to whether a given point cloud may or may not be part of the category with which it was fitted and, for those within the category with high scores, it serves as a marker of the quality of the data obtained. An example of this is given in Figure 7, where the reason behind the high OutP score is made apparent as no real context can be extracted from the point cloud itself.
5. Discussion
Solutions for assisted and automated driving are being developed to improve road safety and driving comfort. These systems resort to LiDAR technology to capture three-dimensional images to interpret and understand vehicles’ surroundings. Nevertheless, accidents involving vehicles operating in autonomous modes have been reported as resulting from Perception layer failures. The driving environments are often uncontrolled and complex, and various factors contribute to corrupt LiDAR data due, namely, to adverse weather conditions, dust, and interferences.
In order to achieve safe assisted and autonomous driving systems, robust and accurate LiDAR data and Perception algorithms their performance must be thoroughly evaluated. The present work presents a novel method based entirely on LiDAR data capable of detecting anomalous patterns, as well as complementing other performance evaluators. This methodology resorts to the Copula-based Outlier Detection algorithm (COPOD) to identify outliers in a given object category, and may be used to evaluate an algorithm’s confidence score, the impact the surroundings conditions may have on LiDAR data, and detect cases in which LiDAR data may be insufficient or otherwise unusable.
The results obtained in this study lay the foundation for a promising technique. Through analysis of the data obtained, be it the car category or comparison between both car and pedestrian data, we can conclude the method is suitable for the identification of possibly faulty or otherwise unusable point clouds, as well as to evaluate perception algorithms.
Further work is being carried out to include other datasets in an effort to better study the algorithm’s performance with varied LiDAR resolution and point cloud density, and to evaluate prediction algorithms.
Author Contributions
Conceptualization, N.R. and J.M.S.; methodology, N.R. and J.M.S.; software, N.R.; validation, N.R. and J.M.S. and M.C.; writing—review and editing, N.R. and J.M.S. and M.C.. All authors have read and agreed to the published version of the manuscript.
Funding
This work has been supported by European Structural and Investment Funds in the FEDER component, through the Operational Competitiveness and Internationalization Programme (COMPETE 2020) [Project no. 047264 - THEIA: Automated Perception Driving; Funding Reference: POCI-01-0247-FEDER-047264].
Data Availability Statement
All data is publicly available. The KITTI dataset may be found at https://www.cvlibs.net/datasets/kitti/ while the pyOD [14] implementation of the COPOD algorithm can be found at https://pypi.org/project/pyod/. For additional or further information, please contact jms@fe.up.pt
Conflicts of Interest
The authors declare no conflict of interest of any kind. The funders had no role in the design of the study; in the collection, analyses, or interpretation of data; in the writing of the manuscript; or in the decision to publish this work.
Abbreviations
The following abbreviations are used in this manuscript:
| LiDAR | Laser Imaging, Detection and Ranging |
| RADAR | Radio Detection and Ranging |
| COPOD | Copula-based Outlier Detector |
| pyOD | Python Outlier Detection Suite |
| eCDF | Empirical Cumulative Distribution Function |
| CDF | Cumulative Distribution Function |
| OutP | Outlier Percentage |
| AAP | Average Anomalous Probability |
| AAS | Average Anomaly Score |
References
- Đorđe Petrović.; Mijailović, R.; Pešić, D. Traffic Accidents with Autonomous Vehicles: Type of Collisions, Manoeuvres and Errors of Conventional Vehicles’ Drivers. Transportation Research Procedia 2020, 45, 161–168. Transport Infrastructure and systems in a changing world. Towards a more sustainable, reliable and smarter mobility.TIS Roma 2019 Conference Proceedings. [CrossRef]
- Ma, Y.; Yang, S.; Lu, J.; Feng, X.; Yin, Y.; Cao, Y. Analysis of Autonomous Vehicles Accidents Based on DMV Reports. In Proceedings of the 2022 China Automation Congress (CAC), 2022, pp. 623–628. [CrossRef]
- Miethig, B.; Liu, A.; Habibi, S.; Mohrenschildt, M.v. Leveraging Thermal Imaging for Autonomous Driving. In Proceedings of the 2019 IEEE Transportation Electrification Conference and Expo (ITEC), 2019, pp. 1–5. [CrossRef]
- Li, Z.; Zhao, Y.; Botta, N.; Ionescu, C.; Hu, X. COPOD: Copula-Based Outlier Detection. In Proceedings of the 2020 IEEE International Conference on Data Mining (ICDM). IEEE, 2020. [CrossRef]
- Ulan, M.; Löwe, W.; Ericsson, M.; Wingkvist, A. Copula-Based Software Metrics Aggregation. Software Quality Journal 2021, 29, 863–899. [CrossRef]
- Wifvat, K.; Kumerow, J.; Shemyakin, A. Copula Model Selection for Vehicle Component Failures Based on Warranty Claims. Risks 2020, 8. [CrossRef]
- Bounceur, A.; Mir, S.; Stratigopoulos, H.G. Estimation of Analog Parametric Test Metrics Using Copulas. IEEE Transactions on Computer-Aided Design of Integrated Circuits and Systems 2011, 30, 1400–1410. [CrossRef]
- Copula-Based Time-Frequency Distribution Analysis for Planetary Gearbox Fault Detection, Vol. Volume 10: 2017 ASME International Power Transmission and Gearing Conference, International Design Engineering Technical Conferences and Computers and Information in Engineering Conference, 2017, [https://asmedigitalcollection.asme.org/IDETC-CIE/proceedings-pdf/IDETC-CIE2017/58240/V010T11A035/ 2475308/v010t11a035-detc2017-68060.pdf]. V010T11A035. [CrossRef]
- Hoss, M.; Scholtes, M.; Eckstein, L. A Review of Testing Object-Based Environment Perception for Safe Automated Driving. Automotive Innovation 2022, 5, 223–250. [CrossRef]
- Bogdoll, D.; Nitsche, M.; Zollner, J.M. Anomaly Detection in Autonomous Driving: A Survey. In Proceedings of the 2022 IEEE/CVF Conference on Computer Vision and Pattern Recognition Workshops (CVPRW). IEEE, 2022. [CrossRef]
- Horváth, G.; Kovács, E.; Molontay, R.; Nováczki, S. Copula-based anomaly scoring and localization for large-scale, high-dimensional continuous data. CoRR 2019, abs/1912.02166, [1912.02166].
- Sivaji12331. File:empirical CDF, CDF and confidence interval plots for various ..., 2019.
- Geiger, A.; Lenz, P.; Urtasun, R. Are we ready for Autonomous Driving? The KITTI Vision Benchmark Suite. In Proceedings of the Conference on Computer Vision and Pattern Recognition (CVPR), 2012.
- Zhao, Y.; Nasrullah, Z.; Li, Z. PyOD: A Python Toolbox for Scalable Outlier Detection. Journal of Machine Learning Research 2019, 20, 1–7.
Figure 3.
Scatter plot containing the 42 car point clouds and 100 pedestrian point clouds. Higher scores represent a higher percentage of anomalous points.
Figure 3.
Scatter plot containing the 42 car point clouds and 100 pedestrian point clouds. Higher scores represent a higher percentage of anomalous points.
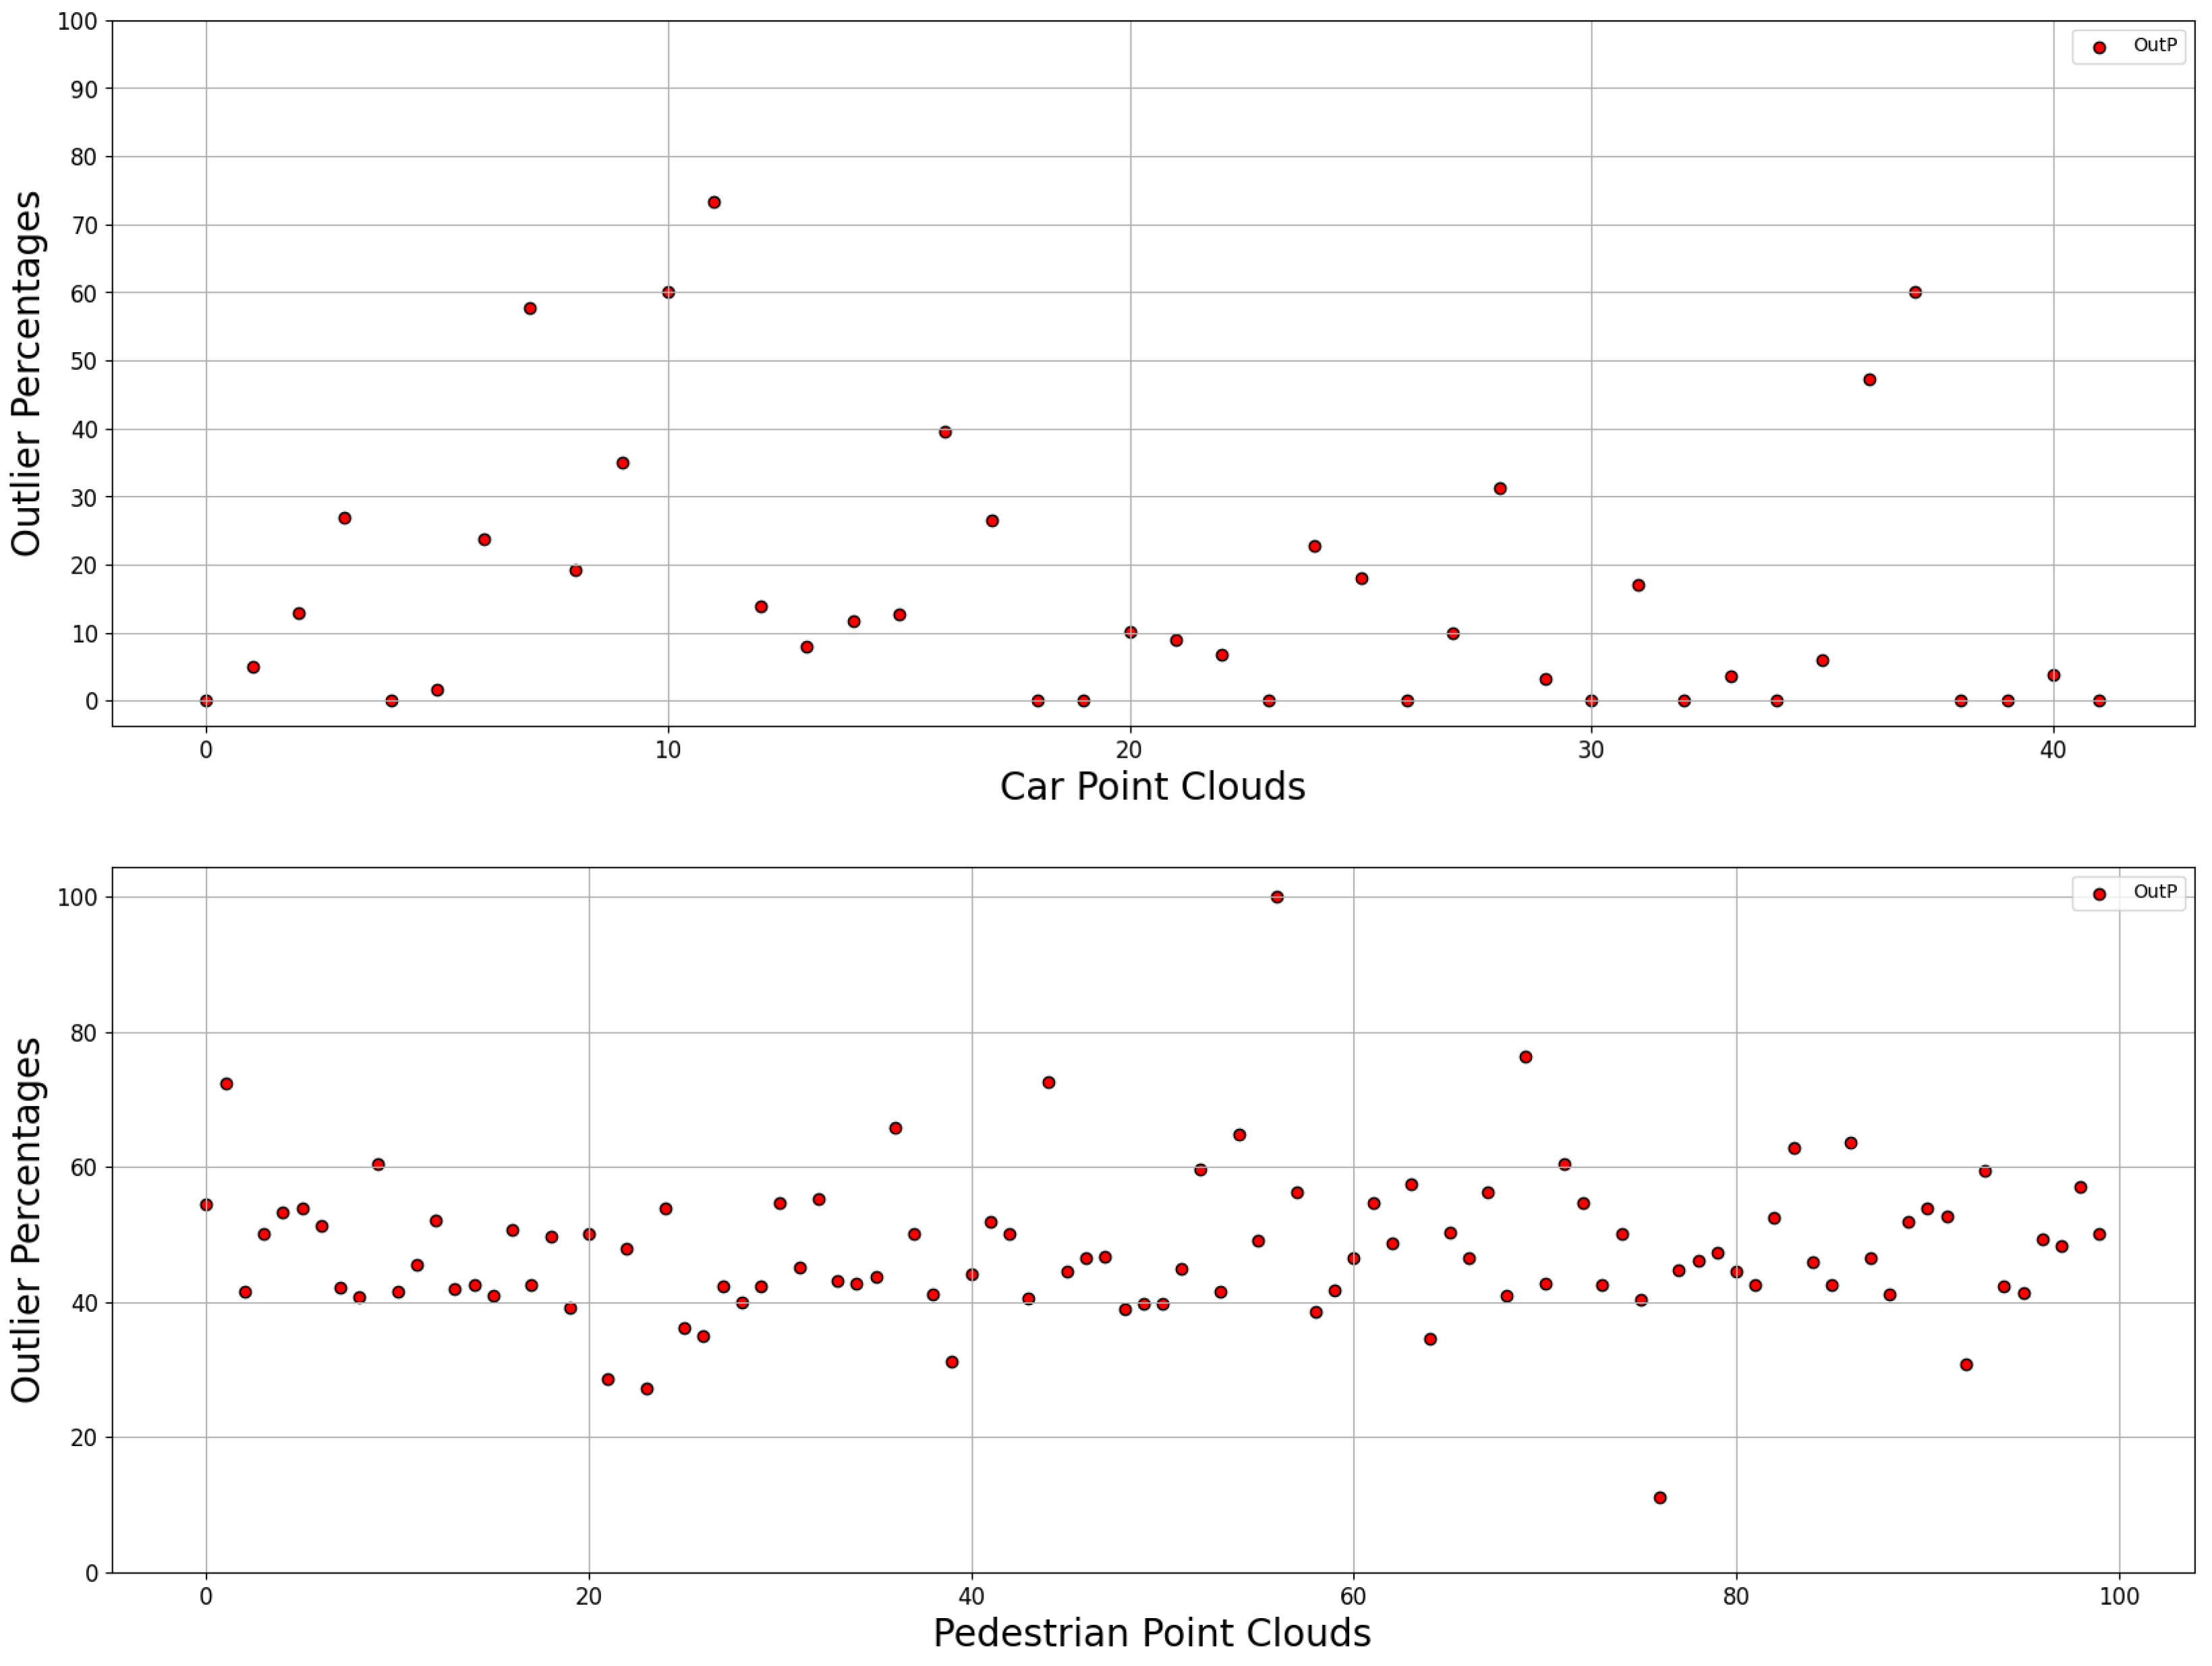
Figure 4.
The associated boxplot for Figure 3.
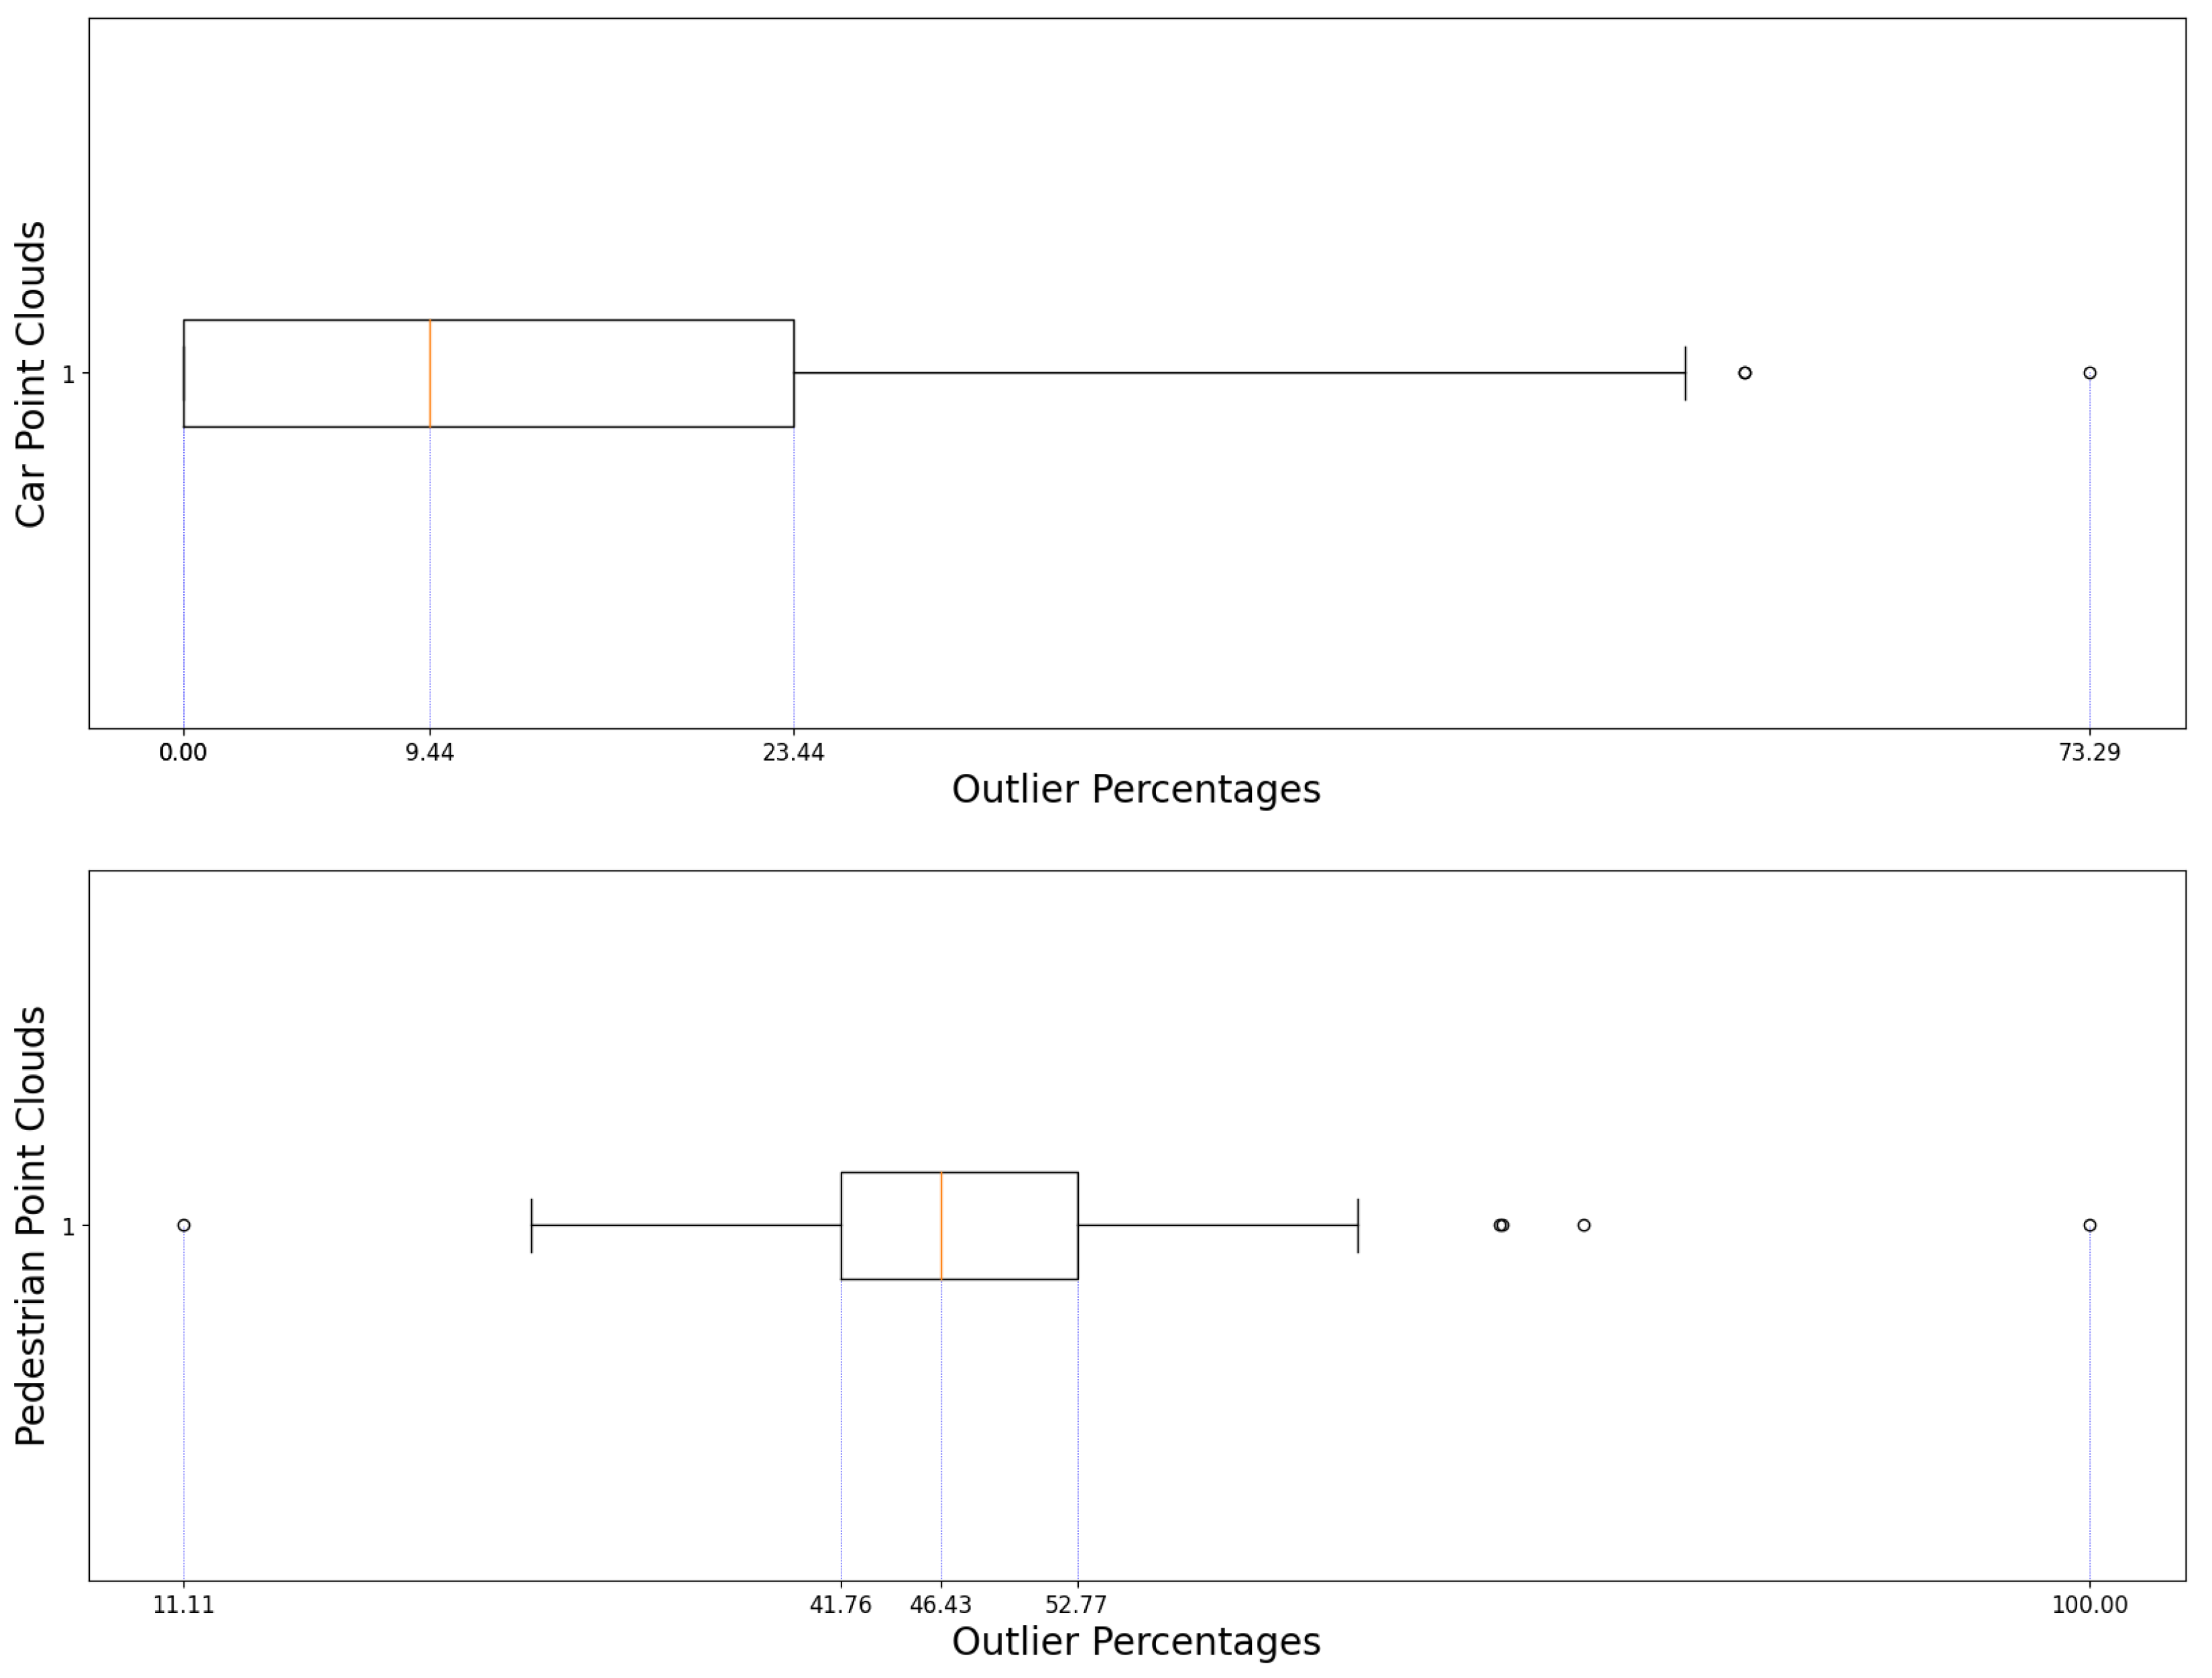
Figure 7.
The worst performing car sample’s point cloud.
Disclaimer/Publisher’s Note: The statements, opinions and data contained in all publications are solely those of the individual author(s) and contributor(s) and not of MDPI and/or the editor(s). MDPI and/or the editor(s) disclaim responsibility for any injury to people or property resulting from any ideas, methods, instructions or products referred to in the content. |
© 2023 by the authors. Licensee MDPI, Basel, Switzerland. This article is an open access article distributed under the terms and conditions of the Creative Commons Attribution (CC BY) license (http://creativecommons.org/licenses/by/4.0/).
Copyright: This open access article is published under a Creative Commons CC BY 4.0 license, which permit the free download, distribution, and reuse, provided that the author and preprint are cited in any reuse.


