Submitted:
06 June 2023
Posted:
07 June 2023
You are already at the latest version
Abstract
Data-Flow and Higher-Order Mutation are white-box testing techniques. To our knowledge, no work has been proposed to compare data flow and higher-order mutation. This paper compares all def-uses data-flow and second-order mutation criteria. This compassion investigates the subsumption relation between these two criteria and evaluates the effectiveness of test data developed for each. To compare the two criteria, a set of test data satisfying each criterion is generated, which is used to explore whether one criterion subsumes the other criterion and assess the effectiveness of the test set that was developed for one methodology in terms of the other. The results showed that the mean mutation coverage ratio of the all du-pairs adequate test cover is 80.9%, and the mean data flow coverage ratio of the 2nd-order mutant adequate test cover is 98.7%. Consequently, 2nd-order mutation “ProbSubsumes” the all du-pairs data flow. The failure detection efficiency of the mutation (98%) is significantly better than the failure detection efficiency of data flow (86%). Consequently, 2nd-order mutation testing is “ProbBetter” than all du-pairs data flow testing. In contrast, the size of the test suite of 2nd-order mutation is more significant than the size of the test suite of all du-pairs.
Keywords:
Data flow testing
; higher-order mutation testing
; “ProbSubsumes”
; “ProbBetter”
1. Introduction
Data flow and mutation testing are two standard white-box testing methodologies [1]. The two methodologies are more effective and widespread than the other white testing criteria, such as statement and branch coverage [2]. Besides, data flow and mutation coverage criteria subsume statement and branch coverage requirements [2].
There are only a few studies have been presented to compare and evaluate the differences between data flow and mutation testing concerning 1) effectiveness: number of faults detected by each approach; and 2) efficiency: number of test cases needed by each approach for creating an adequate test suite [2,3,4,5]. Some of the previous studies have analytically compared mutation and data flow [5,6] and other studies have empirically compared them [2,3,4,7].
To the best of our knowledge, the key study for comparing data flow and mutation testing techniques was proposed by Mathur and Wong in 1994 [3]. Mathur and Wong [3] and [8] manually designed test data to meet all-uses and mutation criteria and compare the scores to check the “ProbSubsumes” relationship between the two criteria. The experiment consisted of four programs and thirty groups of test data for each program. The results showed that mutation-cover was closer to satisfying data flow than data flow-cover was to mutation. In their study, Mathur and Wong compared two test adequacy criteria, called data flow-based all-uses criterion and mutation-based criterion. This research compared the hardness of fulfilling the two criteria and the cost of each of them. They showed that satisfying the mutation criterion was more challenging than all du-pairs.
Offutt and Voas [4] presented a comparison of mutation with all-defs data flow testing. They concluded that mutation cover subsumes all-defs cover (i.e., “any set of test cases that satisfies mutation will also satisfy all-defs”). The experiment consisted of ten programs and five groups of test data for each program generated using different methods. They also studied the fault detection ability of the generated tests.
Tewary and Harrold [9] developed techniques for seeding faults into the code under test utilizing the “program dependence graph.” Then, they compared the fault-revealing capability of mutation and data flow. The results showed that the sufficient test sets for mutation and data flow were nearly equally successful in revealing the faults.
Offutt and Voas [4] concluded that no experiment could prove that one test approach is superior to another. Still, additional and dissimilar programs and studies can improve confidence in the validity of the relationship between the testing criteria.
Therefore, this paper introduces a new comparison between mutation and data flow testing. The significant contribution of this comparison is utilizing search-based algorithms to generate the test sets. In addition to the new test-data generation approach, this study uses a new set of C# programs different from the related work.
This paper is organized as follows. Section 2 presents some essential concepts about data flow and higher order mutation testing for understanding this article. Section 3 introduces in detail the proposed empirical comparison. Section 4 gives the experiments and results. finally, the conclusion and future work are given in Section 5.
2. Data flow and Mutation Testing
Below are the basic concepts of data flow testing and higher order mutation testing. Also, the expected relationships between the testing criteria are introduced.
2.1. Data Flow Testing
In any program, a limited number of actions can happen to a variable with the following events:
Definition: A statement loading a value in the memory space of the “variable” makes a definition (def) of that “variable”.
Use: A statement reading a value from the memory slot of the “variable” is a use of the currently active definition of the “variable”.
Data flow analysis [10] uses the control flow graph of the program to find the def-use pairs.
A program may be represented by a graph, with “a set of nodes” and “a set of edges”, called the control flow graph (CFG). Each “node” represents a statement and each edge is a possible control flow between the nodes.
Defs and c-uses are associated with nodes, but p-uses are associated with edges. Def-use associations are represented by triples, (v, s, u), where the value of variable v defined in statement s is used in statement or edge u.
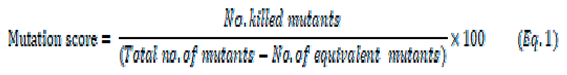
In Figure 1, the triples (X, 4, 7) and (A, 2, (5,6)) represents def-use associations.
In order to determine the set of paths that satisfy the all-uses criterion, it is necessary to determine the defs of every variable in the program and the uses that might be affected by these defs [11].
2.2. Higher-Order Mutation
The mutation testing technique targets finding the test data, evaluating their efficiency, and simulating the other test coverage criteria [12,13]. The mechanism of mutation testing depends on injecting the targeted program with an error or more to get faulty versions called mutants [12]. A mutant is killed if the output of executing the program against a test datum differs from the output of the mutant. A mutant is alive if the output of executing the program and the mutant against all test data are the same in the current test suite. An alive mutant is “equivalent” if the output of executing the program and the mutant against all possible test data are the same.
The first-order mutation was suggested by DeMillo and Hamlet [14,15] via seeding a single error inside the program. Jia and Harman [12] proposed the higher-order mutation via seeding double errors or more in the program. Table 1 introduces examples of first-, second-, and third-order mutants.
The quality of data to detect errors is calculated using the mutation score (Equation (1)).
2.3. Relationship between testing criteria
Weyuker, Weiss, and Hamlet [16] proposed a relationship between any two testing criteria called “ProbBetter”. According to this relationship, “a testing criterion c1 is “ProbBetter” than c2 for a program P if a randomly selected test set T that satisfies c1 is more “likely” to detect a failure than a randomly selected test set that satisfies c2”.
Mathur and Wong [3] proposed another relationship between any two testing criteria called “ProbSubsumes”. According to this relationship, “a testing criterion c1 “ProbSubsumes” c2 for a program P if a test set T that is adequate with respect to c1 is “likely” to be adequate with respect to c2”.
3. The Proposed Approach
In this section, we describe the phases that comprise the proposed approach. The system is written in C# and consists of the following modules:
1. Program analyzer.
2. Mutant generator.
3. Test data generator.
Figure 2 shows the architecture of the proposed approach. In the following, we will discuss these modules in details.
3.1. Program analyzer module
This module accepts the original program P in C# programming language as input. Then it analyses the original program to collect vital information to find the def-use associations. In addition, it instruments the original program with probes to identify the executed parts of the original program.
The output of this phase includes:
- An Instrumented version (P’) of the given original program. The system instruments the assigned programs with software probes. During program execution, these probes cause the number of each traversed line to be recorded to keep track of the path traveled during the execution.
- The static analysis reports contain information about the components of each program: classes, objects, statements, variables, and functions.
- The control flow graph for the tested program.
- The list of variables def-use pairs for the tested program.
3.2. Mutant generator module
This module accepts the original program P in C# programming language as input. Then it passes the tested program into CREAM, which applies a set mutation operator to create a set of mutants. CREAM (Creator of Mutants) is a tool that introduces minor faults called mutations into C# programs. It is helpful to investigate the quality of a mutated program and the effectiveness of a prepared test suite. The CREAM system generates several object-oriented types of faults, puts them into the code of the original program according to its parsed trees, and compiles the modified sources. Obtained assemblies can be tested by measuring the number of revealed modifications. The output of this phase is a set of mutants.
3.3. Test data generator module
Test-data generation in software testing identifies a set of program input data that satisfy a given test-coverage criterion. This phase uses the GA algorithm [17] to generate test cases to cover all def-use pairs of the given program or its mutant. Then, the tested program is executed with the test cases generated by the GA.
To apply the concepts of GAs to the problem of test-data creation, the GAs-based test-data generation techniques perform the following tasks:
- Consider the population to be sets of test data (test suite). Each set of test data is represented by a binary string called chromosome.
- Find the sets of test data that represent the initial population. These sets can be randomly generated according to the format and type of data used by the program under test or it may be input to the GAs.
- Determine the fitness of each individual of the population, which is based on a fitness function that is problem dependent.
- Select two individuals that will be combined by some way to contribute to the next generation.
- Apply the crossover and mutation processes.
- The input to this phase includes:
- Instrumented version of the program to be tested.
- List of def-use paths to be covered.
- Number of program input variables.
- Domain and precision of input data.
- Population size.
- Maximum no. of generations.
- Probabilities of crossover and mutation.
The output of this phase includes:
- A dynamic analysis report that shows the traversed path(s) and list of covered and uncovered def-use pairs after executing the given program with the test cases generated by the GA.
- Set of test cases (du pairs cover) that cover the def-use paths of the given program, if possible. The GA may fail to find test cases to cover some of the specified def-use paths when they are infeasible (i.e., no test data can be found by the GA to cover them).
- Set of test cases (mutants cover) that cover the mutant.
4. The experiments and results
This section presents the experiment to assess the efficiency of the two testing criteria and their relationship. The investigation studies the “ProbBetter” and “ProbSubsumes” relationships of the two criteria: mutation and def-use. We run the proposed method (given in Figure 2) for the original codes of a selected set of C# programs.
4.1. Subject programs
4.2. Mutant generator
4.3. GA parameters setup
The genetic algorithm parameters were set up after a set of trial runs. GA settings are adapted to create a test suite of 20 tests (i.e., population size is 20), and GA iterates itself 100 times (i.e., the maximum number of generations is 100). It has been applied 30 times on the same machine for each subject program. The proposed GA used the single point crossover with probability = 0.8 and the flip bit mutation with probability = 0.15. After setting up the parameters of the genetic algorithms and the configurations of the CREAM tool, the following procedure was applied to each one of the subject programs given in Table 2.
Each subject program is passed to the analyzer to find the du-pairs and the mutant generator (the CREAM tool) to find the 1st-order and the 2nd-order mutants. Table 3 gives the programs’ titles (in column 1), the number of 1st-order mutants (in column 2), the number of killable 1st-order mutants (in column 3), the number of 2nd-order mutants (in column 4), the number of killable 2nd-order mutants (in column 5), the number of killable 2nd-order mutants that affect du-pairs (in column 6), and the number of du-pairs for each subject program (in column 7). This process is performed for each subject program as follows.
- Apply the CREAM tool to generate 1st order mutants.
- Generate the 2nd-order mutants for each program by applying the CREAM tool on all 1st-order mutants.
- Eliminate the 2nd-order mutants that are stillborn, equivalent, or don't contain a def or use for any du-pairs.
- Generate the def-uses pairs for each program.
- Eliminate the stillborn and the equivalent mutants from the 1st and 2nd-order mutants.
- Find the killable 2nd-order mutants that affect the du-pairs.
4.4. Comparison hypotheses
The mutation and data flow testing criteria will be compared according to the two relationship “ProbBetter” [16] and “ProbSubsumes” [3]. In this comparison the following hypotheses are formulated:
H1:
2nd-order mutation testing “ProbSubsumes” all du-pairs data flow testing.
H2:
All du-pairs data flow testing “ProbSubsumes” 2nd-order mutation testing.
H3:
2nd-order mutation testing “ProbBetter” all du-pairs data flow testing.
H4:
All du-pairs data flow testing “ProbBetter” 2nd-order mutation testing.
4.5. Experimental Results
- i. Coverage cost
For each subject program, the genetic algorithm finds a test cover to execute all du-pairs and another test cover to execute the du-based killable 2nd-order mutants. The genetic algorithm has been applied many times to get more accurate results. The genetic algorithm has been applied three times on each subject program to find an adequate cover for the du-based mutants. In the same way, the genetic algorithm has been run on each subject program three times to find a sufficient covering for all du-pairs. The average number of the obtained test cases was computed for each subject program (given in Table 4). Table 5 gives the statistical results of the t-Test for the test-covers of the two criteria.
The data given in Table 4 shows that all du-pairs testing criterion needs 20.3 test cases (on average) to cover all the set of du-pairs for each tested program. Furthermore, the 2nd-order mutation testing criterion requires 59.1 test cases (on average) to kill all 2nd-order mutants for each tested program. The statistical results of the t-Test (given in Table 5) show that the size of the test cover of all du-pairs criterion is significantly smaller than the size of the test cover of the 2nd-order mutation criterion.
- 2.
- ii. Coverage adequacy
To investigate the “ProbSubsumes” relationship between the two testing criteria, each tested program is executed using the adequate test set concerning the 2nd-order mutation testing criterion; and the adequacy concerning the all du-pairs testing criterion is measured. In addition, each tested program is executed using the adequate test set concerning the all du-pairs testing criterion; and the adequacy concerning the 2nd-order mutation testing criterion is measured.
The mutants coverage of the all du-pairs adequate test cover is given in Table 6, and the du-pairs coverage of the 2nd-order mutants adequate test cover is given in Table 7. The coverage ratio for each of the three test suites are presented, as well as the average mutation and data flow coverages. Table 8 shows the statistical comparison between the obtained coverages and their significant difference. Figure 3 shows the mutual coverage of all du-pairs and 2nd-order mutation criteria.
The mean mutation coverage ratio of the all du-pairs adequate test cover is 80.9%, and the mean data flow coverage ratio of the 2nd-order mutant adequate test cover is 98.7%. Therefore, one can accept H1 and reject H2. Consequently, 2nd-order mutation testing “ProbSubsumes” the all du-pairs data flow testing.
- 3.
- iii. Failure detection efficiency
A set of faults is seeded into each tested program to investigate the “ProbBetter” [16] relationship between the two testing criteria. Each program is executed using the adequate test suites of the 2nd-order mutation and all du-pairs criteria. Then, the failure detection efficiency of each test suite is estimated. The number of faults seeded into each program is given in the second column of Table 9, while the third and fourth columns give the failure detection ratio for the test suite of the two criteria. The total number of faults seeded into the tested programs is 10565 faults (1056 faults on average, 2459 faults on maximum, and 109 on minimum).
Failure detection efficiency of the 2nd-order mutation is 98% (on average), while failure detection efficiency of the all du-pairs is 86% (on average). In addition, the 2nd-order mutation criterion detects all the seeded faults in 7 out of 10 tested programs, while the all du-pairs criterion failed to detect 100% of faults in any tested program. Figure 4 shows the failure detection efficiency of the two criteria.
Table 10 shows the statistical comparison between the obtained failure detection efficiency and their significant difference. According to the results of the t-Test, the P-value (9.195E-05) is less than 0.05; therefore, the failure detection efficiency of the mutation (98%) is significantly better than the failure detection efficiency of data flow (86%). Therefore, one can accept H3 and reject H4. Consequently, 2nd-order mutation testing is “ProbBetter” than the all du-pairs data flow testing.
5. Conclusion and Future work
Data flow and higher-order mutation are white-box testing methodologies, and these two methodologies are the most popular and successful white-box testing techniques. This paper presented an empirical comparison of all def-uses data flow and second-order mutation criteria. This compassion investigated the subsumption relation between these two criteria and evaluated the effectiveness of test data developed for each. The results showed that the mean mutation coverage ratio of the all du-pairs adequate test cover is 80.9%, and the mean data flow coverage ratio of the 2nd-order mutant adequate test cover is 98.7%. Consequently, 2nd-order mutation testing “ProbSubsumes” the all du-pairs data flow testing. The failure detection efficiency of the mutation (98%) is significantly better than the failure detection efficiency of data flow (86%). Consequently, 2nd-order mutation testing is “ProbBetter” than the all du-pairs data flow testing. In contrast, the size of the test suite of 2nd-order mutation is bigger than the size of the test suite of all du-pairs. In future work, more testing criteria will be compared with higher-order mutation testing.
Acknowledgments
The authors gratefully acknowledge the approval and the support of this research study by the grant no. CSCR-2022-11-1709 from the Deanship of Scientific Research at Northern Border University, Arar, K.S.A.
References
- L. J. White, “Software testing and verification,” In Marshall C. Yovits, editor, Advances in Computers, vol. 26, pp. 335-390, 1987. [CrossRef]
- J. Offutt, J. Pan, K. Tewary and T. Zhang, “An Experimental Evaluation of Data Flow and Mutation Testing,” Journal of Software: Practice and Experience, vol. 26, p. 165–176, 1996.
- P. Mathur and W. E. Wong, “An empirical comparison of data flow and mutation-based adequacy criteria,” Software Testing, Verification, and Reliability, vol. 4, no. 1, pp. 9-31, 1994. [CrossRef]
- J. Offutt and J. M. Voas, “Subsumption of condition coverage techniques by mutation testing,” Technical Report ISSE-TR-96-01 Information and Software Systems Engineering George Mason University Tech. Rep., 1996.
- P. G. Frankl, S. N. Weiss and C. Hu, “All-uses vs. mutation testing: An experimental comparison of effectiveness,” Journal of Systems and Software, vol. 38, no. 3, pp. 235-253, 1997. [CrossRef]
- S. Kakarla, S. Momotaz and A. S. Namin, “An Evaluation of Mutation and Data-Flow Testing: A Meta-analysis,” in 2011 IEEE Fourth International Conference on Software Testing, Verification and Validation Workshops, Berlin, Germany, 2011. [CrossRef]
- I. Bluemke and K. Kulesza, “A Comparison of Dataflow and Mutation Testing of Java Methods,” in Zamojski, W., Kacprzyk, J., Mazurkiewicz, J., Sugier, J., Walkowiak, T. (eds) Dependable Computer Systems. Advances in Intelligent and Soft Computing, Berlin, Heidelberg., Springer, 2011.
- P. Mathur and W. E. Wong, “Comparing the fault detection effectiveness of mutation and data flow testing: An empirical study,” Software Quality Journal, vol. 4, pp. 69-83, 1994.
- K. Tewary and M. J. Harrold, “Fault modeling using the program dependence graph,” in the Fifth International Symposium on Software Reliability Engineering, Monterey CA, 1994. [CrossRef]
- V. Aho, R. Sethi and J. D. Ullman, Compilers, Principles, Techniques, and Tools, Massachusetts: Addison-Wesley Publishing Company, 1986.
- P. G. Frankl and E. J. Weyuker, “An applicable family of data flow testing criteria,” IEEE Transactions on Software Engineering, vol. 14, no. 10, pp. 1483-1498, 1988. [CrossRef]
- Y. Jia and M. Harman, “Higher order mutation testing,” Information and Software Technology, vol. 51, no. 10, p. 1379–1393, 2009. [CrossRef]
- S. Ghiduk, M. R. Girgis and M. H. Shehata, “Higher-order mutation testing: a systematic literature review,” Computer Science Review Journal, vol. 25, p. 9–48, 2017. [CrossRef]
- R. A. DeMillo, R. J. Lipton and F. G. Sayward, “Hints on test data selection: Help for the practicing programmer,” Computer, vol. 11, no. 4, p. 4–41, 1978. [CrossRef]
- R. G. Hamlet, “Testing programs with the aid of a compiler,” IEEE Transactions on Software Engineering, vol. 3, no. 4, p. 279–290, 1977. [CrossRef]
- E. J. Weyuker, S. N. Weiss and R. G. Hamlet, “Comparison of program testing strategies,” in the Fourth Symposium on Software Testing, Analysis, and Verifcation, Victoria, British Columbia, Canada, 1991.
- Z. Michalewicz, Genetic algorithms + Data Structures = Evolution Programs, vol. 3rd, Springer, 1998.
- M. Harman, Y. Jia and B. Langdon, “Strong higher order mutation-based test data generation,” in the 8th European Software Engineering Conference and the ACM SIGSOFT Symposium on the Foundations of Software Engineering (ESEC/FSE ’11), 2011. [CrossRef]
- X. Dang, D. Gong, X. Yao, T. Tian and H. Liu, “Enhancement of Mutation Testing via Fuzzy Clustering and Multi-population Genetic Algorithm,” IEEE Transactions on Software Engineering, 2021. [CrossRef]
- A. Derezi´nska and A. Szustek, “CREAM- A system for object-oriented mutation of C# programs,” Warsaw University of Technology, Warszawa, Poland, 2007.
- Derezi´nska, “Advanced mutation operators applicable in C# programs,” Warsaw University of Technology, Warszawa, Poland, 2005.
- Derezi´nska, “Quality assessment of mutation operators dedicated for C# programs,” in the 6th International Conference on Quality Software (QSIC’06), Beijing, China, 2006. [CrossRef]
Figure 1.
Def-c-uses for the variable X and def-p-uses for the variable A.
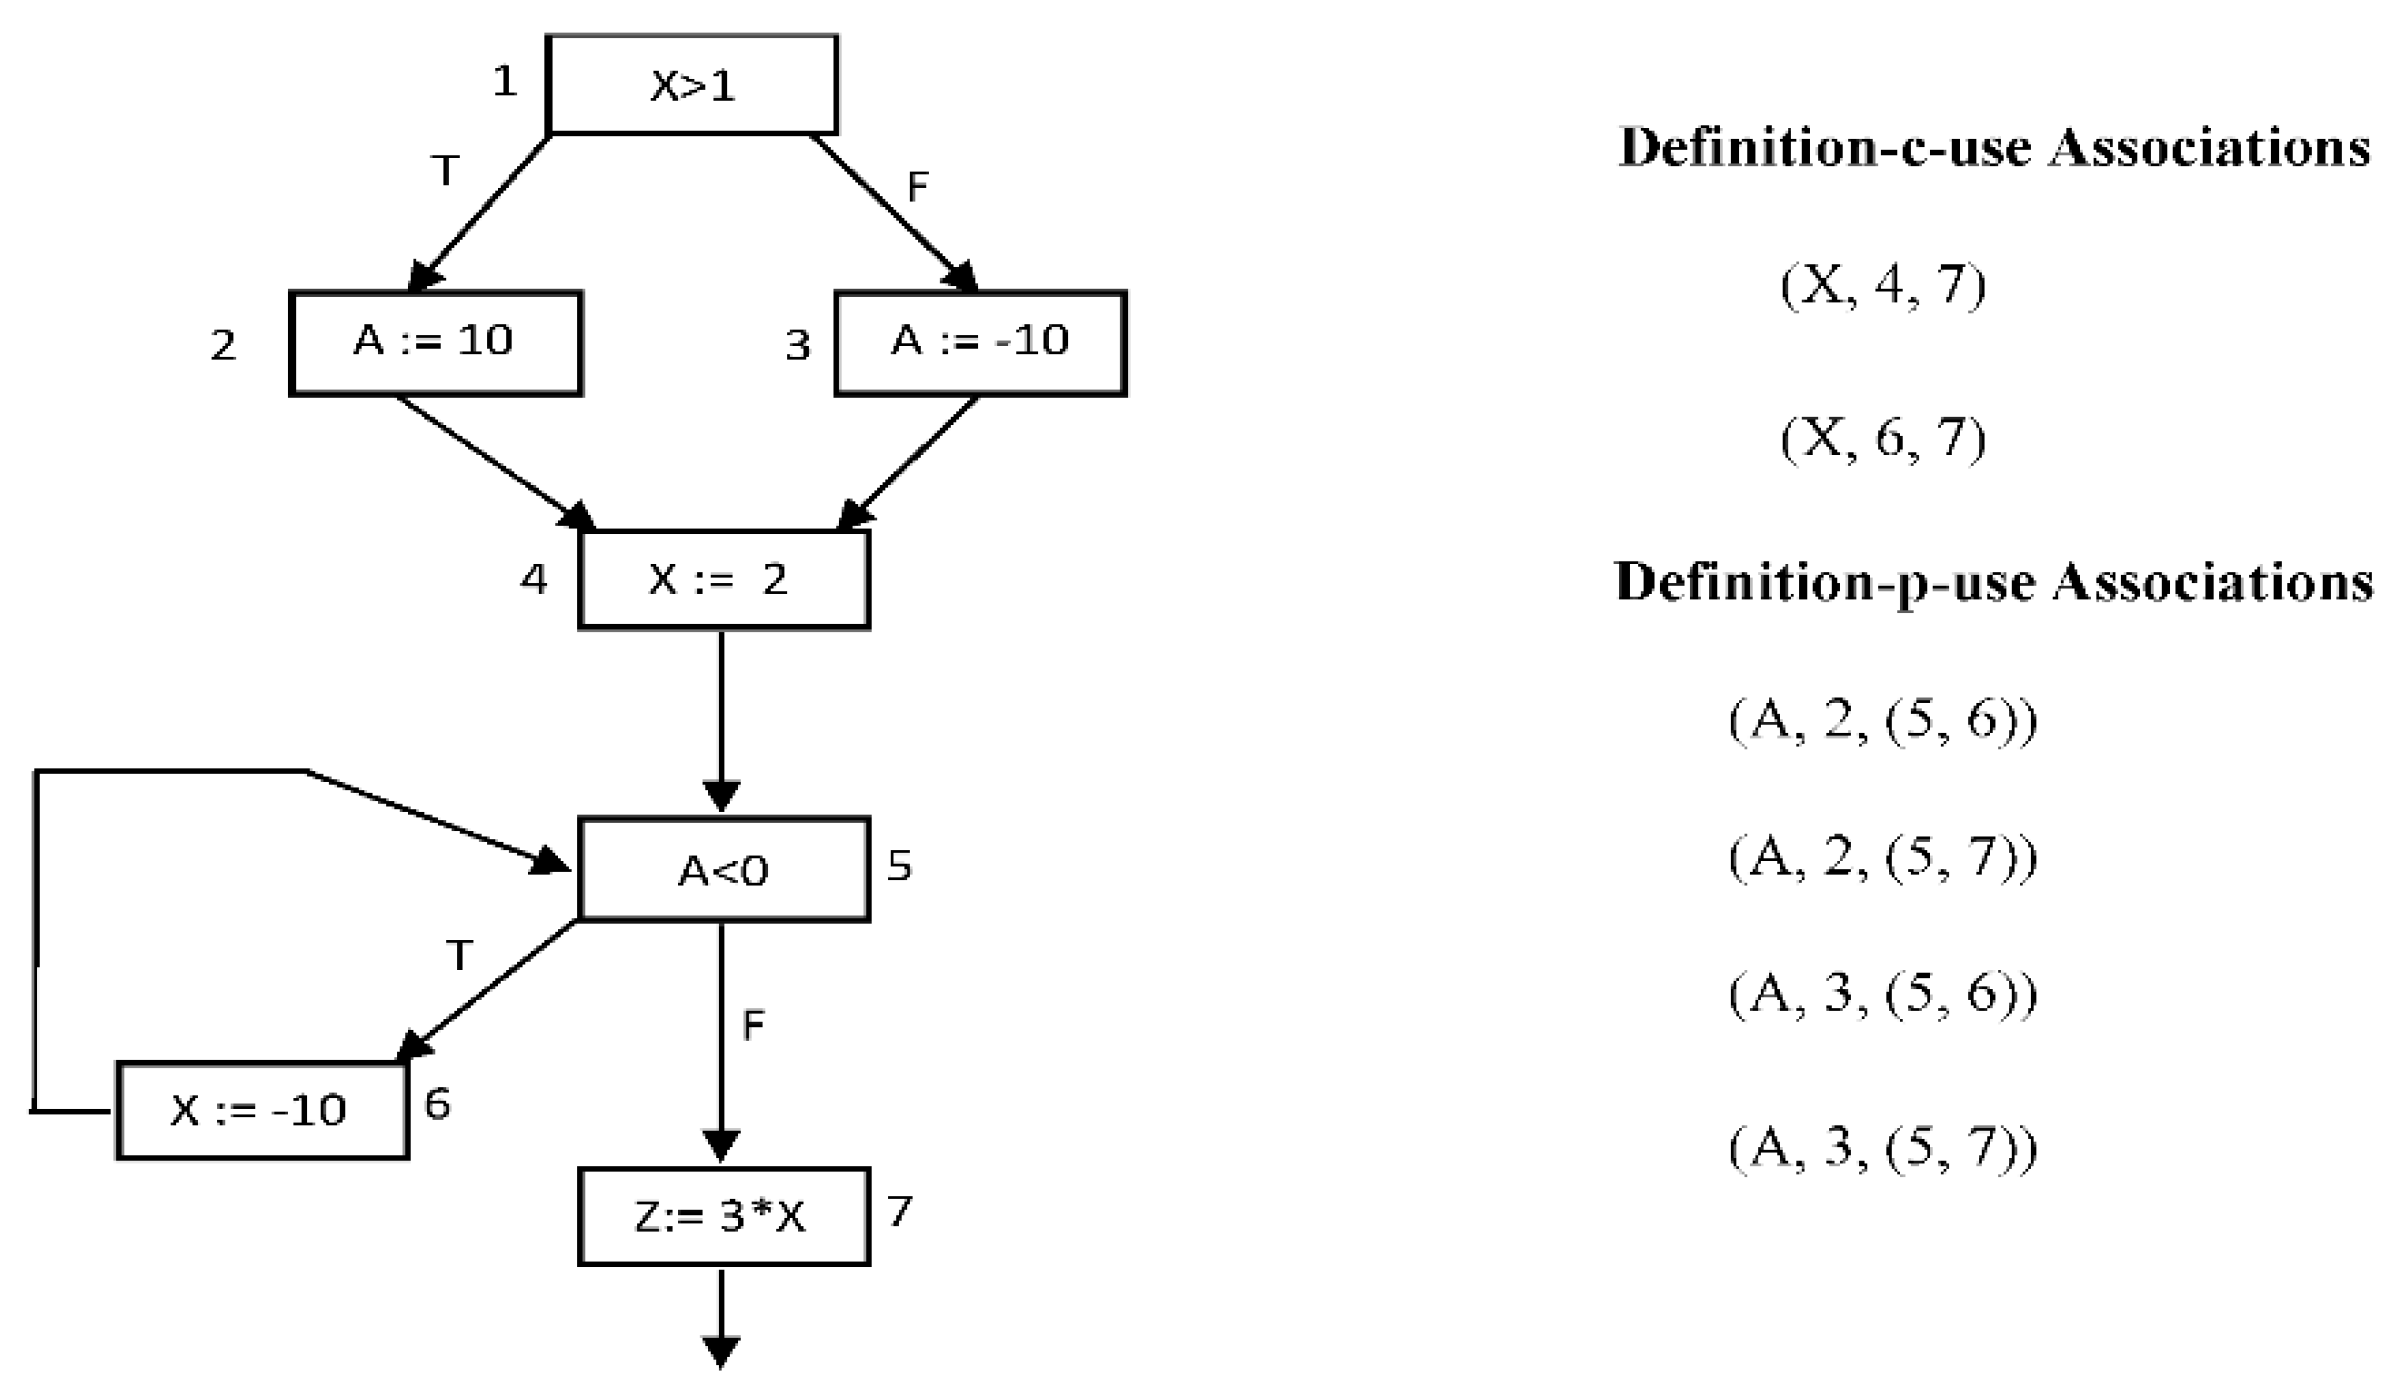
Figure 2.
Overall chart of the proposed approach.
Figure 3.
Mutual coverage of all du-pairs and 2nd-order mutation.
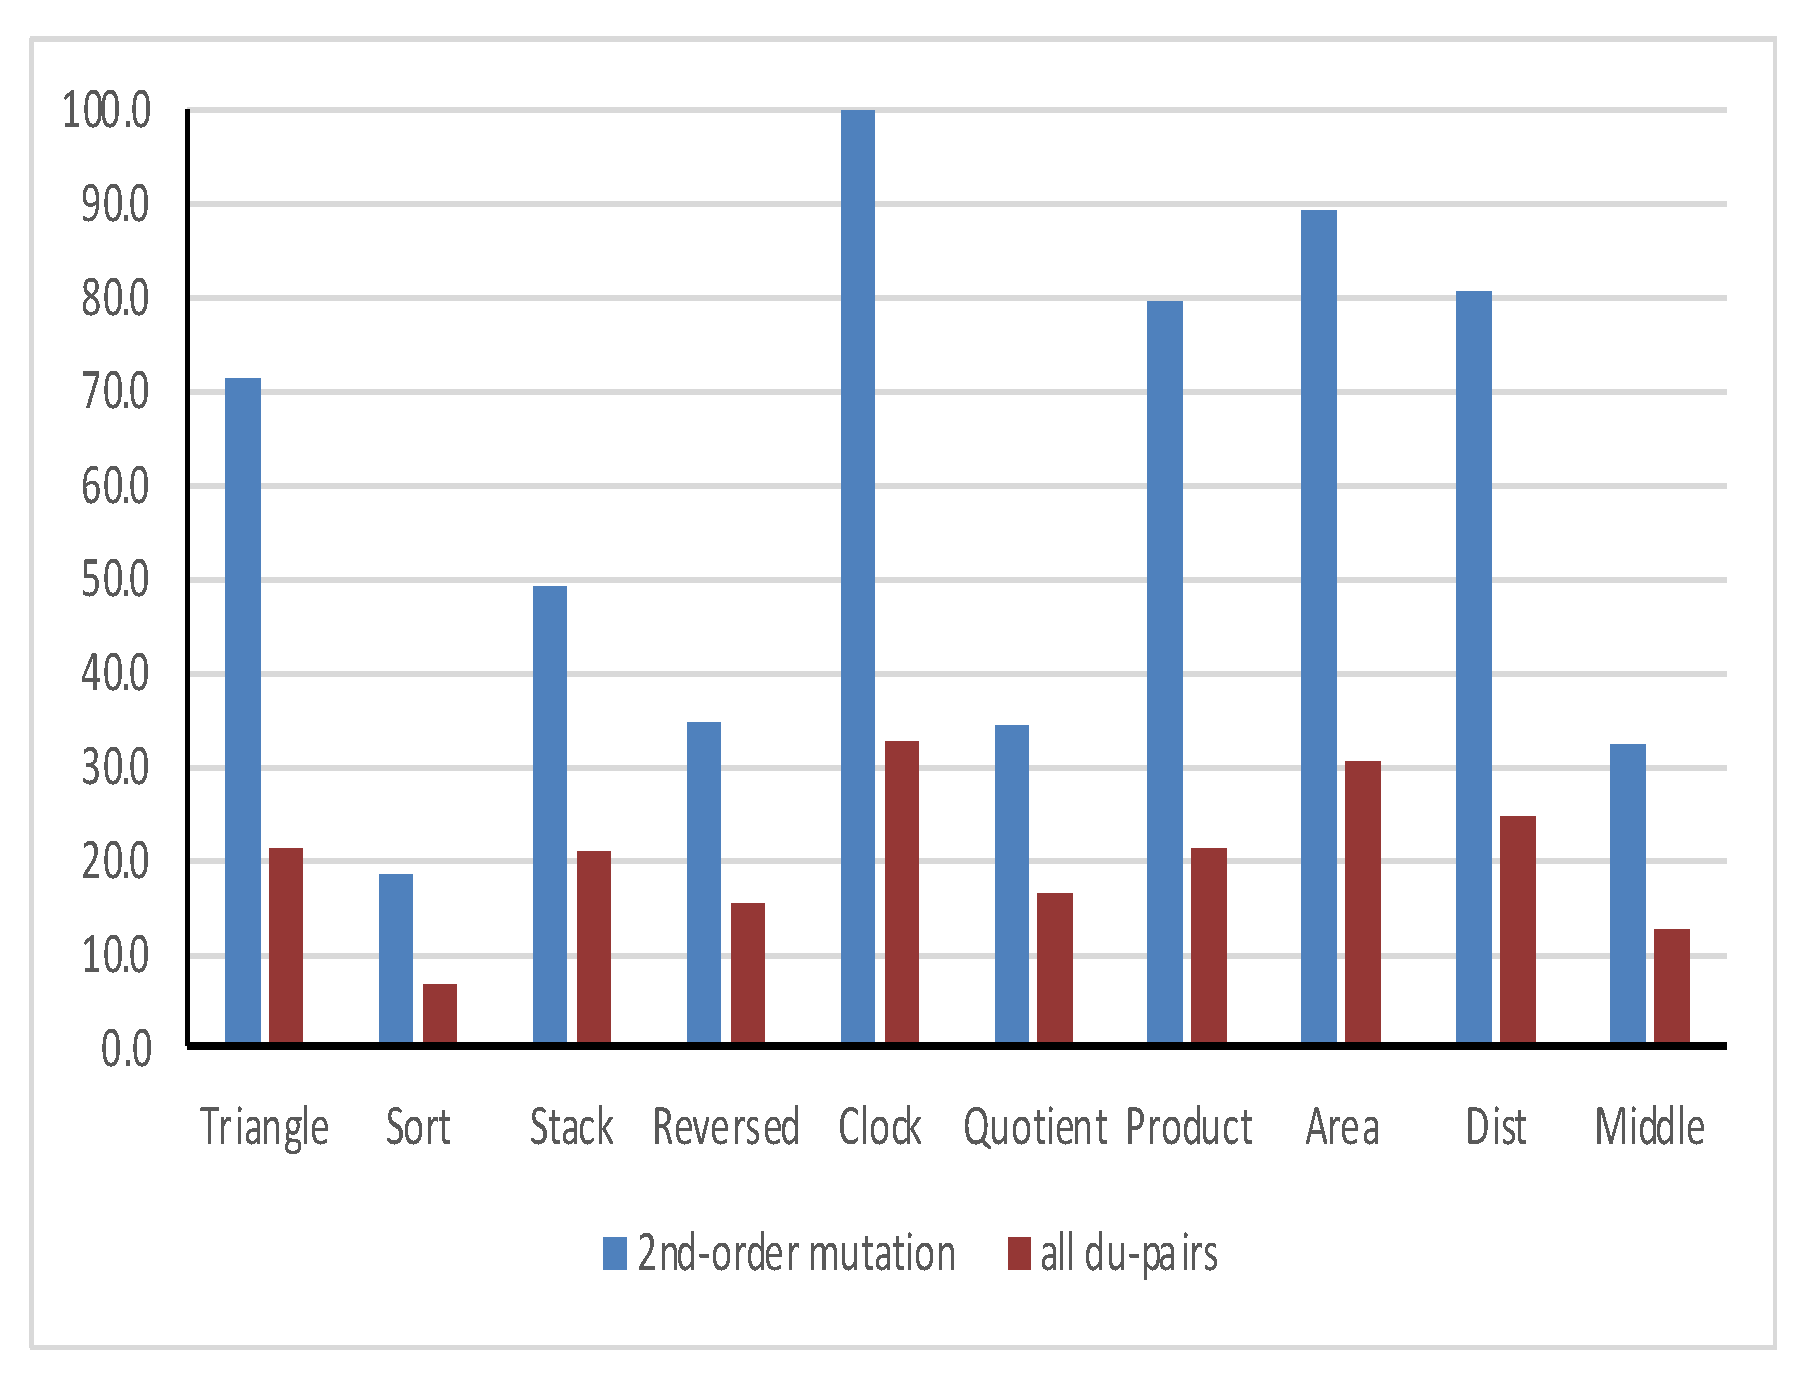
Figure 4.
Failure detection efficiency.
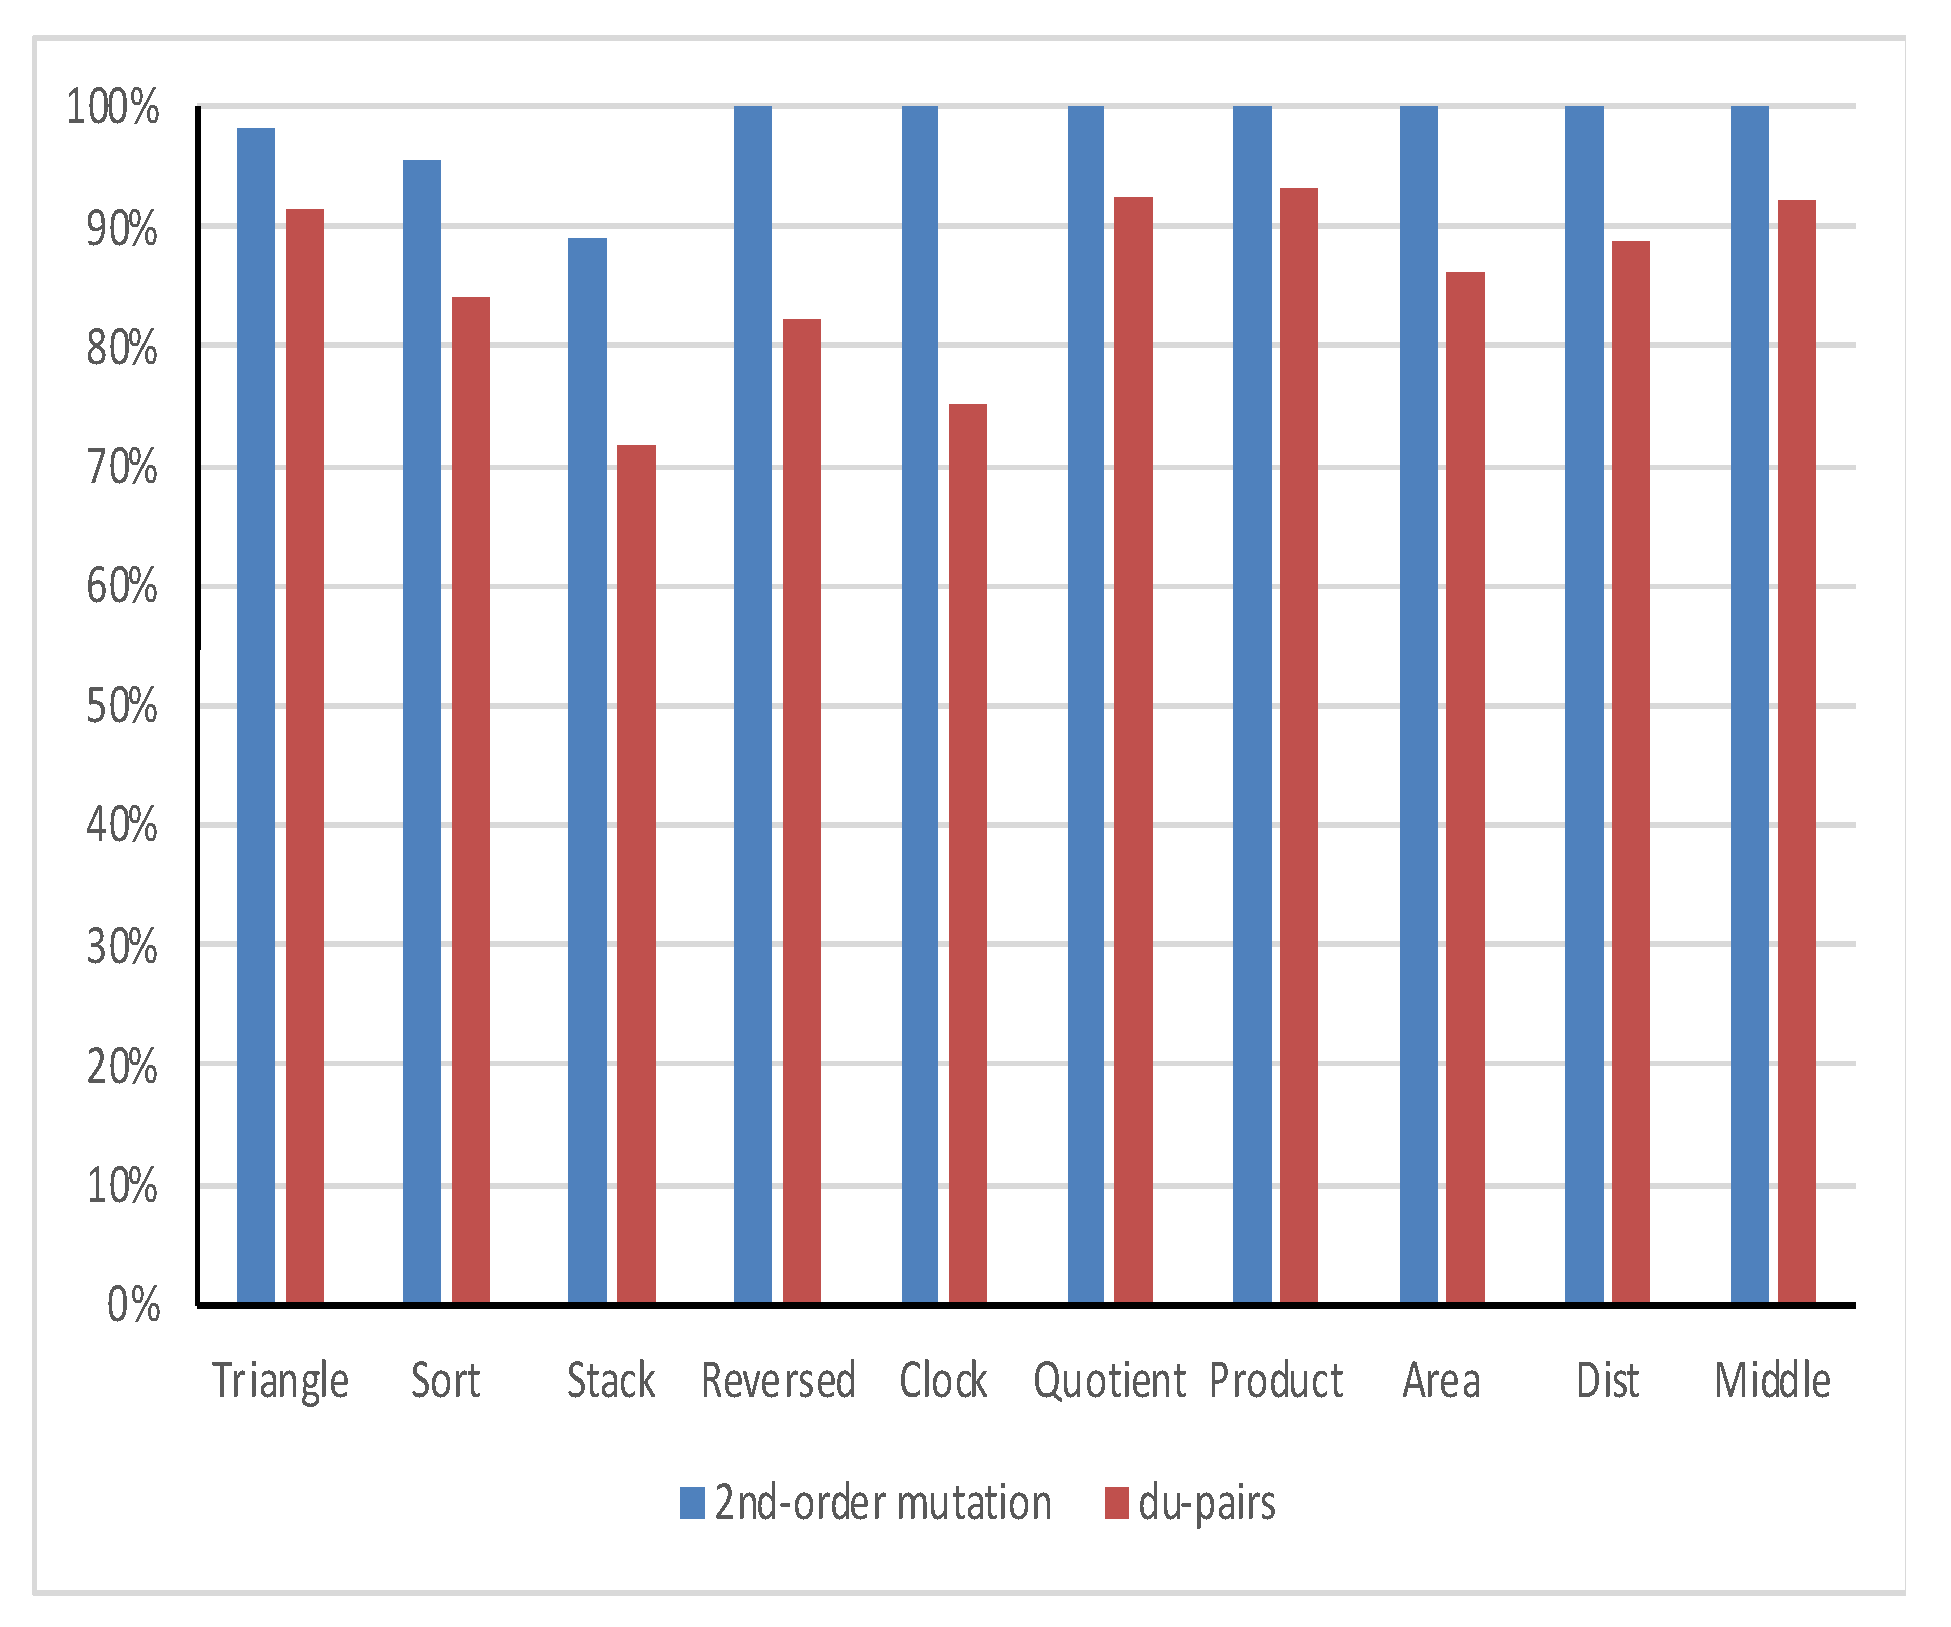

Table 1.
FOM and HOM examples.
| Original version |
Mutated version | ||
|---|---|---|---|
| 1st Order | Higher Order Mutant | ||
| 2nd Order | 3rd Order | ||
|
double n, m double d=n*m double d= n/m |
double n, m double d=n+m double d= n/m |
double n, m double d=n+m double d= n-m |
double n, m double d=n+m double d= n-m++ |
Table 2.
The subject programs.
| Title | Description | Scale |
|---|---|---|
| Triangle | find the type of triangle according to its sides’ lengths. | 52 LOC |
| Sort | arrange a group of items | 40 LOC |
| Stack | using push method to enter a group of elements and using pop method to delete element from stack. | 51 LOC |
| Reversed | returns the array after inverting the elements | 44 LOC |
| Clock | return the time in hours, minutes and seconds | 63 LOC |
| Quotient | return the quotient and the remainder of the division between two numbers | 43 LOC |
| Product | find the summation, multiplication and subtraction of three numbers. | 54 LOC |
| Area | find the areas of any circle, triangle or rectangle. | 59 LOC |
| Dist | calling variables with more than one object and printing their dependent values with each call | 52 LOC |
| Middle | find the middle value of three numbers. | 42 LOC |
Table 3.
No. of 1st-order, no. of 2nd-order, and no. of du-pairs.
| Tested Program | all 1st order | killable 1st order | all 2nd order | killable 2nd order | du-based killable 2nd order |
du-pairs |
|---|---|---|---|---|---|---|
| Triangle | 163 | 146 | 30799 | 23799 | 2459 | 102 |
| Sort | 120 | 104 | 15960 | 11547 | 2333 | 95 |
| Stack | 70 | 57 | 5146 | 3507 | 354 | 68 |
| Reversed | 98 | 78 | 10444 | 6620 | 956 | 77 |
| Clock | 78 | 74 | 7638 | 7036 | 109 | 64 |
| Quotient | 156 | 140 | 27184 | 21338 | 2597 | 89 |
| Product | 117 | 101 | 17018 | 12321 | 759 | 71 |
| Area | 112 | 88 | 15555 | 8656 | 405 | 64 |
| Dist | 83 | 73 | 9207 | 6774 | 274 | 64 |
| Middle | 74 | 70 | 6876 | 5458 | 319 | 70 |
| Total | 1071 | 931 | 145827 | 107056 | 10565 | 764 |
Table 4.
du-pairs and 2nd order mutants cover size.
| Tested Program | Cover size of 2nd order mutants |
Cover size of all du-pairs |
|---|---|---|
| Triangle | 71.3 | 21.3 |
| Sort | 18.3 | 6.7 |
| Stack | 49.3 | 21.0 |
| Reversed | 34.7 | 15.3 |
| Clock | 101.3 | 32.7 |
| Quotient | 34.3 | 16.3 |
| Product | 79.7 | 21.3 |
| Area | 89.3 | 30.7 |
| Dist | 80.7 | 24.7 |
| Middle | 32.3 | 12.7 |
| Average | 59.1 | 20.3 |
Table 5.
Test: paired two sample for means of cover size.
| 2nd-order mutant | du-pairs | ||
|---|---|---|---|
| Mean | 59.13 | 20.27 | |
| Variance | 824.4 | 62.96 | |
| P(T<=t) two-tail | 2.77E-04 | ||
Table 6.
2nd-order mutant coverage ratio using all du-pairs cover.
| Tested Program | Suite1 | Suite2 | Suite3 | Average |
|---|---|---|---|---|
| Triangle | 98% | 100% | 98% | 98.7% |
| Sort | 96% | 96% | 96% | 95.6% |
| Stack | 89% | 100% | 89% | 92.6% |
| Reversed | 100% | 100% | 100% | 100% |
| Clock | 100% | 100% | 100% | 100% |
| Quotient | 100% | 100% | 100% | 100% |
| Product | 100% | 100% | 100% | 100% |
| Area | 100% | 100% | 100% | 100% |
| Dist | 100% | 100% | 100% | 100% |
| Middle | 100% | 100% | 100% | 100% |
| Average | 98.3% | 99.6% | 98.3% | 98.7% |
Table 7.
All du-pairs coverage ratio using 2nd-order mutant cover.
| Tested Program | Suite1 | Suite2 | Suite3 | Average |
|---|---|---|---|---|
| Triangle | 80% | 82% | 80% | 81% |
| Sort | 85% | 85% | 85% | 85% |
| Stack | 89% | 85% | 85% | 86% |
| Reversed | 75% | 80% | 75% | 77% |
| Clock | 80% | 80% | 80% | 80% |
| Quotient | 70% | 73% | 70% | 71% |
| Product | 78% | 80% | 75% | 78% |
| Area | 80% | 83% | 88% | 84% |
| Dist | 79% | 90% | 79% | 83% |
| Middle | 85% | 85% | 85% | 85% |
| Average | 80.1% | 82.3% | 80.2% | 80.9% |
Table 8.
t-Test: paired two sample for means of coverage ratio.
| 2nd-order mutant | du-pairs | ||
|---|---|---|---|
| Mean | 98.7% | 80.9% | |
| Variance | 0.1% | 0.2% | |
| P(T<=t) two-tail | 1.11E-05 | ||
Table 9.
Failure detection ratio of 2nd-order mutation and all du-pairs test suites.
| Tested Program | No. of faults | failure detection efficiency | |
|---|---|---|---|
| 2nd-order mutation | du-pairs | ||
| Triangle | 2459 | 98% | 91% |
| Sort | 2333 | 96% | 84% |
| Stack | 354 | 89% | 72% |
| Reversed | 956 | 100% | 82% |
| Clock | 109 | 100% | 75% |
| Quotient | 2597 | 100% | 92% |
| Product | 759 | 100% | 93% |
| Area | 405 | 100% | 86% |
| Dist | 274 | 100% | 89% |
| Middle | 319 | 100% | 92% |
| Total = 10565 | Average = 98% | Average = 86% | |
Table 10.
t-Test: paired two sample for means of failure detection ratio.
| 2nd-order mutant | du-pairs | ||
|---|---|---|---|
| Mean | 98.3% | 85.7% | |
| Variance | 0.1% | 0.6% | |
| P(T<=t) two-tail | 9.195E-05 | ||
Disclaimer/Publisher’s Note: The statements, opinions and data contained in all publications are solely those of the individual author(s) and contributor(s) and not of MDPI and/or the editor(s). MDPI and/or the editor(s) disclaim responsibility for any injury to people or property resulting from any ideas, methods, instructions or products referred to in the content. |
© 2023 by the authors. Licensee MDPI, Basel, Switzerland. This article is an open access article distributed under the terms and conditions of the Creative Commons Attribution (CC BY) license (http://creativecommons.org/licenses/by/4.0/).
Copyright: This open access article is published under a Creative Commons CC BY 4.0 license, which permit the free download, distribution, and reuse, provided that the author and preprint are cited in any reuse.


