
Submitted:
02 June 2023
Posted:
05 June 2023
You are already at the latest version
Abstract
A high prevalence of childhood obesity has been observed in the last years. Ultrasound of adi-pose tissue is technique validated in adults in order to detect risk of comorbidity as NAFLD and NASH, but no studies at pediatric population. The main objective is to assess measurement of preperitoneal fat by nutritional ultrasound as a screening method for non-alcoholic fatty liver disease (NAFLD) in obese children. Patients and methods: Prospective longitudinal study. A study of somatometry, bioelectrical impedancemetry and nutritional ultrasound has been car-ried out. Results : 102 patients were included, with a mean BMI (SDS) of 2.58. A linear and direct correlation was observed between the fat mass measured by bioelectrical impedancemetry and the total subcutaneous abdominal fat measured by nutritional ultrasound. We also observed a correlation between preperitoneal fat measured by nutritional ultrasound and NASH, with a cut-off point of 0.93 cm of preperitoneal fat (sensitivity 96% and specificity 94%).Conclusions: Measurement of preperitoneal fat by nutritional ultrasound is a good screening method for NASH in obese children.
Keywords:
obesity NASH
Introduction and Objectives:
The current lifestyle, with a diet increasingly removed from the Mediterranean diet, together with the habitual sedentary lifestyle, is associated with many of the so-called non-communicable diseases, such as metabolic syndrome. Every day these pathologies are more frequent in pediatrics.
Malnutrition should be considered an imbalance between energy and nutrient intake and their requirements, causing metabolic and functional changes that are normally difficult to appreciate in the initial stages, but as the process progresses they can be assessed as changes in nutritional status markers. and body composition (BC) [1].
There are difficulties in establishing a diagnosis with universally accepted criteria for all patients, as is evident in the multitude of screening methods and different diagnostic criteria in different scientific societies such as the European Society for Clinical Nutrition and Metabolism (ESPEN) and the American Society for Parenteral and Enteral Nutrition (ASPEN) [1,2].
A nutritional marker must be sensitive in order to add value to nutritional diagnosis and identify alterations in the early stages. On the other hand, it must be quite specific to show modifications only with the nutritional intervention, and also adequate nutritional support must correct the altered values of the marker.
In clinical practice, since there is no single diagnostic or prognostic marker, in the assessment of nutritional status, we use screening and assessment tests that include clinical, anthropometric, and analytical parameters, nutritional indices, and functionality and BC tests.
The assessment of the BC has demonstrated its usefulness, both at the individual level at a specific moment, and to estimate changes over time of a longitudinal nature, both to know the nutritional status, and to identify the risk of malnutrition and to plan nutritional support more adequate [3,4].
Within the BC, what we are really evaluating is the functioning of the different organs such as muscle, adipose tissue, metabolic organs such as the liver, etc. Obtaining morphological data on size may be insufficient and we must always evaluate its functionality (muscle-strength) to know the scope of the malnutrition problem [4].
Basic anthropometric parameters such as weight, height, and body mass index (BMI) should always be mandatory, both for screening and for assessing nutritional status, whether in ambulatory or hospitalized patients. Complementary parameters such as determination of perimeters (waist, mid-arm, calf) and skinfolds (triceps, biceps, subscapularis, and suprailiacus) are recommended in some cases and necessary in others to complete screening tests [5].
Weight, height, and BMI are not sufficiently sensitive parameters to assess early changes in WC [6]. Different methods in clinical practice estimate fat mass (FM) and fat free mass (FFM) in the simplest (compartmental) model. The more complex models analyze different components of the FFM: total body water (TBW, intracellular water (ICW), extracellular water (ECW), and active cell mass (BCM). Body compartments can be measured quantitatively. In addition to anthropometry, bioelectrical impedance (BIA), dual photon X-ray densitometry (DXA) and radiological techniques are currently the most widely used techniques in centers that may have them.
Is worry think about the association of food/nutrition with obesity and metabolic syndrome and its further association to NAFLD and possibly to NASH [4,6,7]. The relation sheep at Pediatric is study now, but at adults is simple: NASH increase risk of metabolic syndrome, and this one is in relation sheep with central obesity. The question is how to study this quickly and efficient.
BIA estimates CC indirectly based on several assumptions, many of which can be altered in pathological states such as hydration and/or changes in body geometry. In addition, the use of predictive equations developed for a specific population or pathology limits its clinical use. The recent development of new multifrequency, spectroscopic or segmental BIA equipment opens up a range of possibilities to perform other measurements such as monitoring body fluids and assessing longitudinal changes in body compartments, even avoiding the use of specific equations. In addition to the data obtained in the indirect assessment of body compartments, the BIA provides raw electrical values: Z (impedance), R (resistance), XC (reactance), and the phase angle (PA) that expresses the relationship between R and XC. Its direct application or its vectorial representation in specific software has shown its usefulness to assess changes in CC in the short term, to serve as a specific marker of nutritional status and, above all, the raw values of PA are directly related to the state of the cellular health, and report both short- and long-term changes as an indicator of nutritional prognosis, and risk of morbidity and mortality. FA is, therefore, a nutritional marker that reflects not only the BCM content, but is also one of the best indicators of cell membrane function [8,9,10].
In this sense, AF provides a measure of energy changes (electrical) that is related to cell functionality and the composition of the internal environment, but not from a molecular point of view, but bioelectrical. Changes in the bioenergy of cells and tissues are very sensitive to nutritional and metabolic changes, and provide us with comprehensive information on tissue composition and functionality.
The BCM is affected in situations of malnutrition due to decreased intake, increased losses, and the proinflammatory state that accompanies it. Functional assessment is always necessary, not only for nutritional diagnosis, but also to assess functional changes [11]. The muscular strength estimated by “ handgrip “ dynamometry, must complement today the study of assessment of nutritional status, eliminating borders between the different methods and building a new approach to nutrition.
The field of functional nutritional assessment is beginning. Techniques such as hand dynamometry are already established, but more detailed and global evaluations of the organism’s functionality are yet to be systematized. Functional tests: “ Timed Up and Go “ test (TUG), gait test, Barthel index (BI), etc., should be included in the nutritional assessment as they complement the CC data [12].
Classic analytical data must be adapted to new, more specific markers of the situation of biomolecules that assess nutrition, inflammation (prealbumin/CRP), metabolic changes, etc.
All this should make us consider the need to incorporate new nutritional assessment parameters that are practical, sensitive and specific, and reproducible throughout the follow-up of patients.
Classic Parameters vs. Advanced Parameters in Clinical Nutrition
Advanced Parameters in Clinical Nutrition
Impedancemetry: Body Composition and Phase Angle
The BIA is an indirect method for measuring DC, based on the ability of the human body to transmit electrical current. It is well transmitted through fluids and electrolytes, whereas fat and bone are relatively non-conductive. In this way, the impedance measures the TBW.
Using predictive equations based on reference techniques, from the estimated value of the TBW, the FFM and FM are obtained [13,14,15,16,17,18,19,20,21,22,23,24,25,26,27,28].
Through crude impedance parameters, such as resistance and reactance, the phase angle can be calculated (AF = arc tangent (Xc /R) × 180°/n). By definition, PA is positively associated with tissue reactance (associated with cell mass, integrity, function, and composition of cell membranes), and negatively with resistance, which mainly depends on the degree of tissue hydration [21,26].
Clinical Utility
BIA is probably the most widely used method at present to study CC in various contexts, mainly due to its low cost, ease of use and transport, and because it presents less inter-observer variability than other techniques. However, this technique is subject to possible biases, depending on the formulas used, equipment and measurement conditions [10,27]. To alleviate these limitations, information can be obtained from crude impedance measurements, such as the AF. Its advantage is that it is independent of the regression equations, and it can be calculated in situations in which the BIA assumptions are not valid to estimate CC [28].
In the healthy population, PA varies physiologically depending on sex (greater in men than in women), age (direct relationship), BMI (direct relationship up to extreme values, in which there is an inverse correlation) and the race.
It is important to follow the measurement protocol, patient position, electrode placement, and general conditions so that electrical determinations are not affected.
BIA has now ceased to be an indirect CC technique based solely on predictive equations to be a technique for clinical use in nutrition based on crude electrical parameters that provide early information on cell functionality and the degree of hydration of the FFM.
Muscle Ultrasound
Definition
The application of ultrasound for the morphological and structural study of muscle mass is an emerging technique. At present, there are different validation studies on the measurement technique.
Sonography is an ultrasound technique that determines the area of the muscle surface in transverse and longitudinal position. In particular, with ultrasound analysis, it is possible to measure key parameters of muscle architecture, such as muscle volume, fascicle length, and angle of muscle penetration.
Although there are different muscular structures that can be evaluated, most of the studies focus on the rectus femoris of the quadriceps or on combinations of various muscle groups that involve large muscle packages with functional importance for the patient in terms of gait or BADL. The measurement of the rectus femoris of the quadriceps is one of the most referenced measurements due to its correlation with strength and performance tests or functional performance [29,30,31,32].
Ultrasound of Adipose Tissue
Definition
The application of ultrasound for the morphological and structural study of fat mass is an emerging technique. At present, there are different validation studies on the measurement technique.
Ultrasonography is an ultrasound technique that determines the area of the fat surface in a transverse position in the visceral adipose zone (Hamagawa technique) in the middle zone of the parietal peritoneum. In particular, with ultrasound analysis, it is possible to measure the key parameters of superficial subcutaneous fat (energy reserve), deep (neuroendocrine regulation) and visceral ectopia [33,34,35,36].
Patients and Methods
Design: It is a study of diagnostic tests, where the result of the nutritional echo is going to be compared with the hepatic echo (nutritional ultrasound) longitudinal prospective.
Study approved by the Ethical Local Comitee of the OSI ARABA Hospital: reference file 020-2021 number
Study population: patients diagnosed as overweight/ obese (defined as BMI≥2SDS) (WHO grow charts) (CASE SUBJECT) who are referred from primary care (PC) to our Hospital and meet the following inclusion and none exclusion criteria:
Inclusion criteria:
- 1)
- Both genders
- 2)
- Age ≥ 6 years and under 18 years.
- 3)
- Only exogenous obesity
- 4)
- Regular clinical follow-up (Includes performing standardized impedance)
- 5)
- Sign the informed consent
Exclusion criteria:
Obesity with underlying organicity, syndromic with obesity in its usual clinical evolution (Prader Willi , hypothalamic pathology, use of corticosteroids......)
Intervention
The patient is referred from PC and others consults to the pediatric endocrinology outcomes. If the patient meets the inclusion criteria, they will be invited to participate in the study. Regardless of your participation in the study, as usual practice, you will take a medical history, regular clinical follow-up, and a systematic physical examination consisting of:
- Standardized nutrition education
- Follow-up by specialized nursing and our own regular practice
- Analytical study if applicable bioelectric impedance, obtaining variables such us basal metabolism, fat mass, lean mass, excess fat mass. As usual practice, all the data of the children who come to the consultation and have a TANITA impedance test are collected in a database that is registered in computer science
- In the case of obesity > 3 SDS BMI we study blood exam too with hyperinsulinism prediabetes or altered lipid profile. And we referral to the Radiology Service, determining the presence or absence of NASH and its degree.
After explanation we use ecograph in our consult by technical systematics validated by the Spanish Society of Endocrinology and Nutrition (Hamagawa technique). Ecograph probe 2-10 Mhz. Standardized method on right LES 1/3 lower iliacrotulian midline and supraumbilical abdominal midline (variables in mm. Precision +/- 0.1 mm) [39,40].
Main variables to be collected: Age (years-months), weight (Kgrs), height (cm), impedancemetry data (basal metabolism in Kcal, fat mass tissue, muscle mass tissue in Kgrs. Nutritional ultrasound variables
-
Muscle ULTRASOUND (in mm)
- 1)
- vastus anterior triceps area
- 2)
- X axis Y axis
- 3)
- muscle circumference
- 4)
- Supramuscular superficial adipose tissue right EESS
-
ULTRASOUND abdominal fat (in mm)
- 1)
- Superficial subepidermal fat
- 2)
- deep subepidermal fat
- 3)
- intraperitoneal fat
Test completion time 5-10’
Variables
-
Main variable:
- 1)
- Thickness in mm of intraperitoneal fat.
- 2)
- Diagnosis of hepatic steatosis (yes/no) and metabolic risk (yes/no) by ultrasound according to usual practice
- 3)
- Diagnosis of hepatic steatosis (yes/no) and metabolic risk (yes/no) by nutritional ultrasound.
-
Secondary variables:
- 1)
- vastus anterior triceps area
- 2)
- X axis Y axis
- 3)
- muscle circumference
- 4)
- Supramuscular superficial adipose tissue right EESS
- 5)
- subepidermal fat (mm fat)
- 6)
- subepidermal fat (mm fat)
- 7)
- Steatosis YES/NO
- 8)
- degree of steatosis
- 9)
- Abdominal fat (mm fat) at baseline, 3 months, 6 months and 12 months.
- Others: age (years), sex (male/female), BMI, degree of overweight/obesity
Statistic Analysis
In order to respond to the main objective on the diagnostic capacity of hepatic steatosis mediated by nutritional ultrasound, diagnostic tests will be carried out in comparison with the ultrasound used in routine practice. Diagnostic tests will report the following information: Sensitivity, specificity, Positive Predictive Value (PPV), Negative Predictive Value (NPV) and Youden ‘s J index.
Descriptive analyzes of the sample are carried out, where the qualitative variables will be expressed by frequency and percentage and for the quantitative variables the mean and standard deviation will be used in the case of following a normal distribution and median and interquartile range if not.
Comparisons between both groups were made using the following statistics: Chi-square when dealing with qualitative variables, the student ‘s t-test for independent samples in the case of quantitative variables that follow a normal distribution and if they do not follow a normal distribution, the non-parametric test. Mann-Whitney U.
To establish if there is any type of correlation between the measurements of abdominal fat between those obtained by nutritional ultrasound and the usual practice, the Pearson correlation will be used and, in the case of not following the normal distribution, Spearman.
Student’s t test will be performed for related samples or the Wilcoxon test in the case of not following a normal distribution.
Results
103 patients were included, 60 men (58%) and 43 women (42%), with a mean age of 11 and a half years. The mean BMI is 2.58 +/- 0.5 [2-3.5] (show as SDS) and the mean ITP (kg/m3) is 18.1 +/- 2.81 [13,14,15,16,17,18,19,20,21,22,23,24,25,26,27,28].
Regarding the CC results obtained by bioelectrical impedancemetry, we see that the mean basal metabolism of the patients is 1578.68 kcal/day. In addition, the average fat mass is 29.39 kg and the average excess fat is 8.52 kg.
On the other hand, in the abdominal ultrasounds carried out by the Radiodiagnosis Service, it was observed that 52 patients had NASH (57.8%) and 38 patients did not (42.2%), with no differences by sex. 47.8% of them are mild NASH, 8.9% moderate and 1.1% severe.
The data obtained by nutritional ultrasound show:
Muscle ultrasound: mean vastus anterior area of 4.97 cm2, mean muscle circumference of 9.13 cm, mean X axis of 2.26 cm, and mean Y axis of 3.25 cm. The mean superficial adipose tissue is 1.64 cm.
Abdominal fat ultrasound: mean total subcutaneous fat of 2.55 cm +/- 0.92, mean superficial subcutaneous fat of 1.27 cm +/- 0.67, and mean preperitoneal fat of 1.03 cm +/- 0.4.
These results are shown in Table 1.
To analyze the correlation between the measurement of total subcutaneous abdominal fat obtained by nutritional ultrasound and the fat mass obtained by bioelectrical impedancemetry, a Spearman’s Rho study was performed, finding p=0.01, which shows a linear and direct correlation (Figure 1).
Preperitoneal fat obtained by nutritional ultrasound and NASH, the Mann-Whitney U test was performed, finding that patients with NASH had significantly more preperitoneal fat (p<0.01). The Youden index was also performed, indicating 0.93 cm of preperitoneal fat as the optimum cut-off point for correlation with NASH (Figure 2). This cut-off point presents a sensitivity of 96% and a specificity of 94%.
Discussion
We want to emphasize that, given the increase in childhood obesity in recent decades in our environment [1,2], we consider it very important to have early diagnosis methods for associated comorbidities.
Although association of food/nutrition with obesity and metabolic syndrome and its further association to NAFLD and possibly to NASH would be study at children, a quickly methods at consult will be development. In addition, NASH is detected more and more frequently in the obese child population, at less in our study.
An expert of ultrasound could be difficult to find in all Hospital, Centers although Primary care. Development of easy technical as this one could be a good idea.
NASH risk has been classically postulated with the use of folds, IMC and ITP perimeters to guide and classify cases [5,6,7]. Although in adults [5] the definitions are clearer, in pediatrics [1,2,3,4] there are no such well-defined objective criteria, parameters/graphs are needed by age and sex and it is necessary to use the SDS as a comparative value for the BMI and ITP variables. between populations. In routine clinical practice, the use of impedance measurement [8,9,10,11] has provided another tool for monitoring and detecting high-risk obesity, also in pediatrics. But in the end, it is necessary to resort to performing deep abdominal ultrasounds [31,32,33,34,35] in the hands of experienced and qualified radiologists to detect an emerging pathology: NASH. In adults, the use of nutritional ultrasound, a tool with a faster learning curve, which can be done in the clinic itself at “bedside” identifying patients with little or excessive fat mass and assessing its distribution with lean tissue [29,30,31,32].
To date, these authors had not found similar validation studies in a pediatric population.
The results of this study agree with what has been validated in studies of adult patients [15,16], postulating nutritional ultrasound and specifically the measurement of preperitoneal fat as a marker of NASH, with a cut-off point of 0.93 cm.
The limitations of this study are that it is a single-center study, which requires expansion of n and revalidation of the cut-off point considering subgroups by age, sex, and race.
Lastly, it should be noted that this is the first study of these characteristics in a child population. Preperitoneal fat by nutritional ultrasound is a good screening method for NASH in overweight or obese children, establishing a cut-off point of 0.93 cm of preperitoneal fat.
Acknowledgments
This work has been possible thanks to a grant from the SEEN Endocrinology Society in its NUTRITION category, call for year 2021
References
- White JV, Guenter P, Jensen G, Malone A, Schofield M; Academy Malnutrition Work Group; ASPEN Malnutrition Task Force; ASPEN Board of Directors. Consensus statement: Academy of Nutrition and Dietetics and American Society for Parenteral and Enteral Nutrition: characteristics recommended for the identification and documentation of adult malnutrition (undernutrition). JPEN J Parenter Enteral Nutrition 2012;36(3):275-83.
- Cederholm T, Barazzoni R, Austin P, Ballmer P, Biolo G, Bischoff SC, et al. ESPEN guidelines on definitions and terminology of clinical nutrition. Clin Nutr 2017;36(1):49-64.
- Lee SY, Gallager D. Assessment methods in human body composition. Curry Opin Clin Nutr MetabCare 2008;11:566-72.
- Baracos V, Caserotti P, Earthman CP, Fields D, Gallagher D, Hall KD, et al. Advances in the science and application of body composition measurement. JPEN J Parenter Enteral Nutrition 2012;36:96-107.
- Madden AM, Smith S. Body composition and morphological assessment of nutritional status in adults: a review of anthropometric variables. J Hum Nutr Diet 2016;29:7-25.
- Gonzalez MC, Correira MITD, Heymsfield SB. A requiem for BMI in the clinical setting. Curry Opin Clin Nutr MetabCare 2017;20:1-8.
- Bellido D, Carreira J. Dual-energy X-ray absorptiometry analysis and body composition. Nutr Clin Med 2008;2:85-108.
- Carreira J, Bellido D, Bellido V, Soto A, Garcia Almeida JM. Analysis of body composition by bioelectrical impedance: physical principles and analytical models. Nutr Clin Med 2011;5:9-26.
- Bellido D, Carreira J, Bellido V, Soto A, Garcia Almeida JM. Analysis of body composition by bioelectrical impedance: modalities and clinical applications. Nutr Clin Med 2011;5:63-79.
- Mulasi U, Kuchnia AJ, Cole AJC, Earthman CP. Bioimpedance at the Bedside: Current Applications, limitations and opportunities. Nut Clin Practice 2015;30:180-93.
- Barbosa-Silva MC. Subjective and objective nutritional assessment methods: what do they rely on? Curry Opn Clin Nutr MetabCare 2008;11:248-54.
- Earthman PC. Body composition tools for assessment of adult malnutrition at the betside : a tutorial on research considerations and clinical applications. JPEN J Parenter Enteral Nutrition 2015;39:787-822.
- Bellido D, Carreira J, Bellido V. Assessment of nutritional status: anthropometry and body composition. In: Angel Gil. Nutrition Treatise: Human Nutrition in the state of health. Volume V. Madrid: Panamericana ; 2017.pp. 99-132.
- Elia M. Screening for malnutrition: A multidisciplinary responsibility. Development and Use of the Malnutrition Universal Screening Tool ('MUST') for Adults. Redditch : BAPEN; 2003.
- Alastrué A, Rull M, Camps I, Ginesta C, Melus MR, Salvá JA. New rules and advice on the assessment of parameters in our population: muscle-fat index, weight indices and percentile tables of anthropometric data useful in a nutritional assessment. MedClin 1998;91:223-6.
- Bellido V, Lopez JJ, Bellido D. Complementary explorations in nutrition: body composition, caloric expenditure measurement. In: Resident's Manual of Endocrinology and Nutrition. 2016.
- Seltzer MH, Bastidas JA, Cooper DM, Engler P, Slocum B, Fletcher HS. Instant nutritional assessment. JPEN J Parenter Enteral Nutrition 1979;3(3):157-9.
- Villalobos Gámez JL, García-Almeida JM, Guzmán de Damas JM, Rioja Vázquez R, Osorio Fernández D, Rodríguez-García LM, et al. INFORNUT® process: validation of the filter phase -FILNUT- and comparison with other methods of early detection of hospital malnutrition. Nutr Hosp 2006;21(4):491-504.
- Ignacio de Ulíbarri J, González-Madroño A, de Villar NG, González P, González B, Mancha A, Rodríguez F, Fernández G. CONUT: a tool for controlling nutritional status. First validation in a hospital population . Nutr Hosp 2005;20(1):38-45.
- Álvarez J, Del Río J, Planas M, García Peris P, García de Lorenzo A, Calvo V, et al.; SENPE Documentation Group. SENPE-SEDOM document on coding of hospital hyponutrition . Nutr Hosp 2008;23(6):536-40.
- Fleck A. Clinical and nutritional aspects of changes in acute-phase proteins during inflammation. Proc Nutr Soc 1989;48(3):347-54.
- Lee JL, Oh ES, Lee RW, Finucane TE. Serum albumin and prealbumin in calorically restricted, nondiseased individuals: A systematic review. Am J Med 2015;128(9):1023.e1-22.
- Burgos-Peláez R. Malnutrition and disease. Nutr Hosp 2013;6(1):10-23.
- Álvarez Hernández J, Muñoz Carmona D, Planas Vila M. Introduction to the problem: nutrition and oncology. Nutr Hosp ( Suppl ) 2008;1(1):13-48.
- Schindler K, Pernicka E, Laviano A, Howard P, Schütz T, Bauer P, et al.; Nutrition Day Audit Team. How nutritional risk is assessed and managed in European hospitals: A survey of 21,007 patients findings from the 2007-2008 cross-sectional NutritionDay survey. Clin Nutr 2010;29:552-9.
- Hiesmayr M, Schindler K, Pernicka E, Schuh C, Schoeniger-Hekele A, Bauer P, et al. Decreased food intake is a risk factor for mortality in hospitalized patients: The NutritionDay survey 2006. Clin Nutr 2009;28:484-91.
- García de Lorenzo A, Álvarez J, Planas M, Burgos R, Araujo K. Multidisciplinary consensus on the approach to hospital malnutrition in Spain. Nutr Hosp 2011;26:701-10.
- Kyle UG, Bosaeus I, De Lorenzo AD, Durenberg P, Elia M, Gomez JM, et al. Bioelectrical impedance analysis - part I: review of principles and methods. Clin Nutr 2004;23(5):1226-43.
- Kyle UG, Bosaeus I, De Lorenzo AD, Durenberg P, Elia M, Gomez JM, et al. Bioelectrical impedance analysis - part II: utilization in clinical practice. Clin Nutr 2004;23(5):1430-53.
- Norman K, Stobäus N, Pirlich M, Bosy -Westphal A. Bioelectrical phase angle and impedance vector analysis-clinical relevance and applicability of impedance parameters. Clin Nutr 2012;31(6):854-61.
- Buckinx F, Landi F, Cesari M, Fielding RA, Visser M, Engelke K, et al. Pitfalls in the measurement of muscle mass: a need for a reference standard. Journal of Cachexia, Sarcopenia and Muscle 2018;9:269-78.
- Berger J, Bunout D, Barrera G, de la Maza MP, Henriquez S, Leiva L, et al. Rectus femoris (RF) ultrasound for the assessment of muscle mass in older people. Archives of Gerontology and Geriatrics 2015;61:33-8.
- Strasser EM, Draskovits T, Praschak M, Quittan M, Graf A. Association between ultrasound measurements of muscle thickness, pennation angle, echogenicity and skeletal muscle strength in the elderly. Age 2013;35(6):2377-88.
- Thomaes T, Thomis M, Onkelinx S, Coudyzer W, Cornelissen V, Vanhees L. Reliability and validity of the ultrasound technique to measure the rectus femoris muscle diameter in older CAD-patients. BMC Med Imaging 2012;12:7.
- Schlecht I, Wiggermann P, Behrens G, Fischer B, Koch M, Freese J, Rubin D, Nöthlings U, Stroszczynski C, Leitzmann MF. Reproducibility and validity of ultrasound for the measurement of visceral and subcutaneous adipose tissues. Metabolism . 2014 Dec;63(12):1512-9. Epub 2014 Aug 5. PMID: 25242434. [CrossRef]
- García Almeida JM, García García C, Bellido Castañeda V, Bellido Guerrero D. New approach to nutrition. Assessment of the patient's nutritional status: composition and function. [ Nutr Hosp 2018;35(Extra No. 3):1-14].
- Díez López I, Fernández B, Sarasua Miranda A, Lorente Blázquez I. Influence of the basal metabolic profile on the evolution of pediatric patients with obesity Garcia et al. Bol S Vasco- Nav Pediatric _ 2021; 53:65-72.
- Influence of metabolic syndrome and its components in overweight and obese patients in Pediatrics : Bol S Vasco- Nav Pediatric _ 2021; 53:45-51.
- Galindo Martín CA, Monares Zepeda E, Lescas Méndez OA. Bedside Ultrasound Measurement of Rectus Femoris: A Tutorial for the Nutrition Support Clinician. J Nutr Metab . 2017;2017:2767232. Epub 2017 Mar 13. PMID: 28386479; PMCID: PMC5366786. [CrossRef]
- García Almeida JM , García García C , Bellido Castañeda V , Bellido Guerrero D New approach to nutrition. Assessment of the patient's nutritional status: function and body composition Nutr . Hosp. vol.35 spe 3 Madrid 2018 Epub 21-Sep-2020. [CrossRef]
Figure 1.
Linear and direct correlation between fat mass measured by bioelectrical impedancemetry and total subcutaneous abdominal fat measured by nutritional ultrasound. SPSS 23.0. ECOABD adipo total means total abdominal fat.
Figure 1.
Linear and direct correlation between fat mass measured by bioelectrical impedancemetry and total subcutaneous abdominal fat measured by nutritional ultrasound. SPSS 23.0. ECOABD adipo total means total abdominal fat.
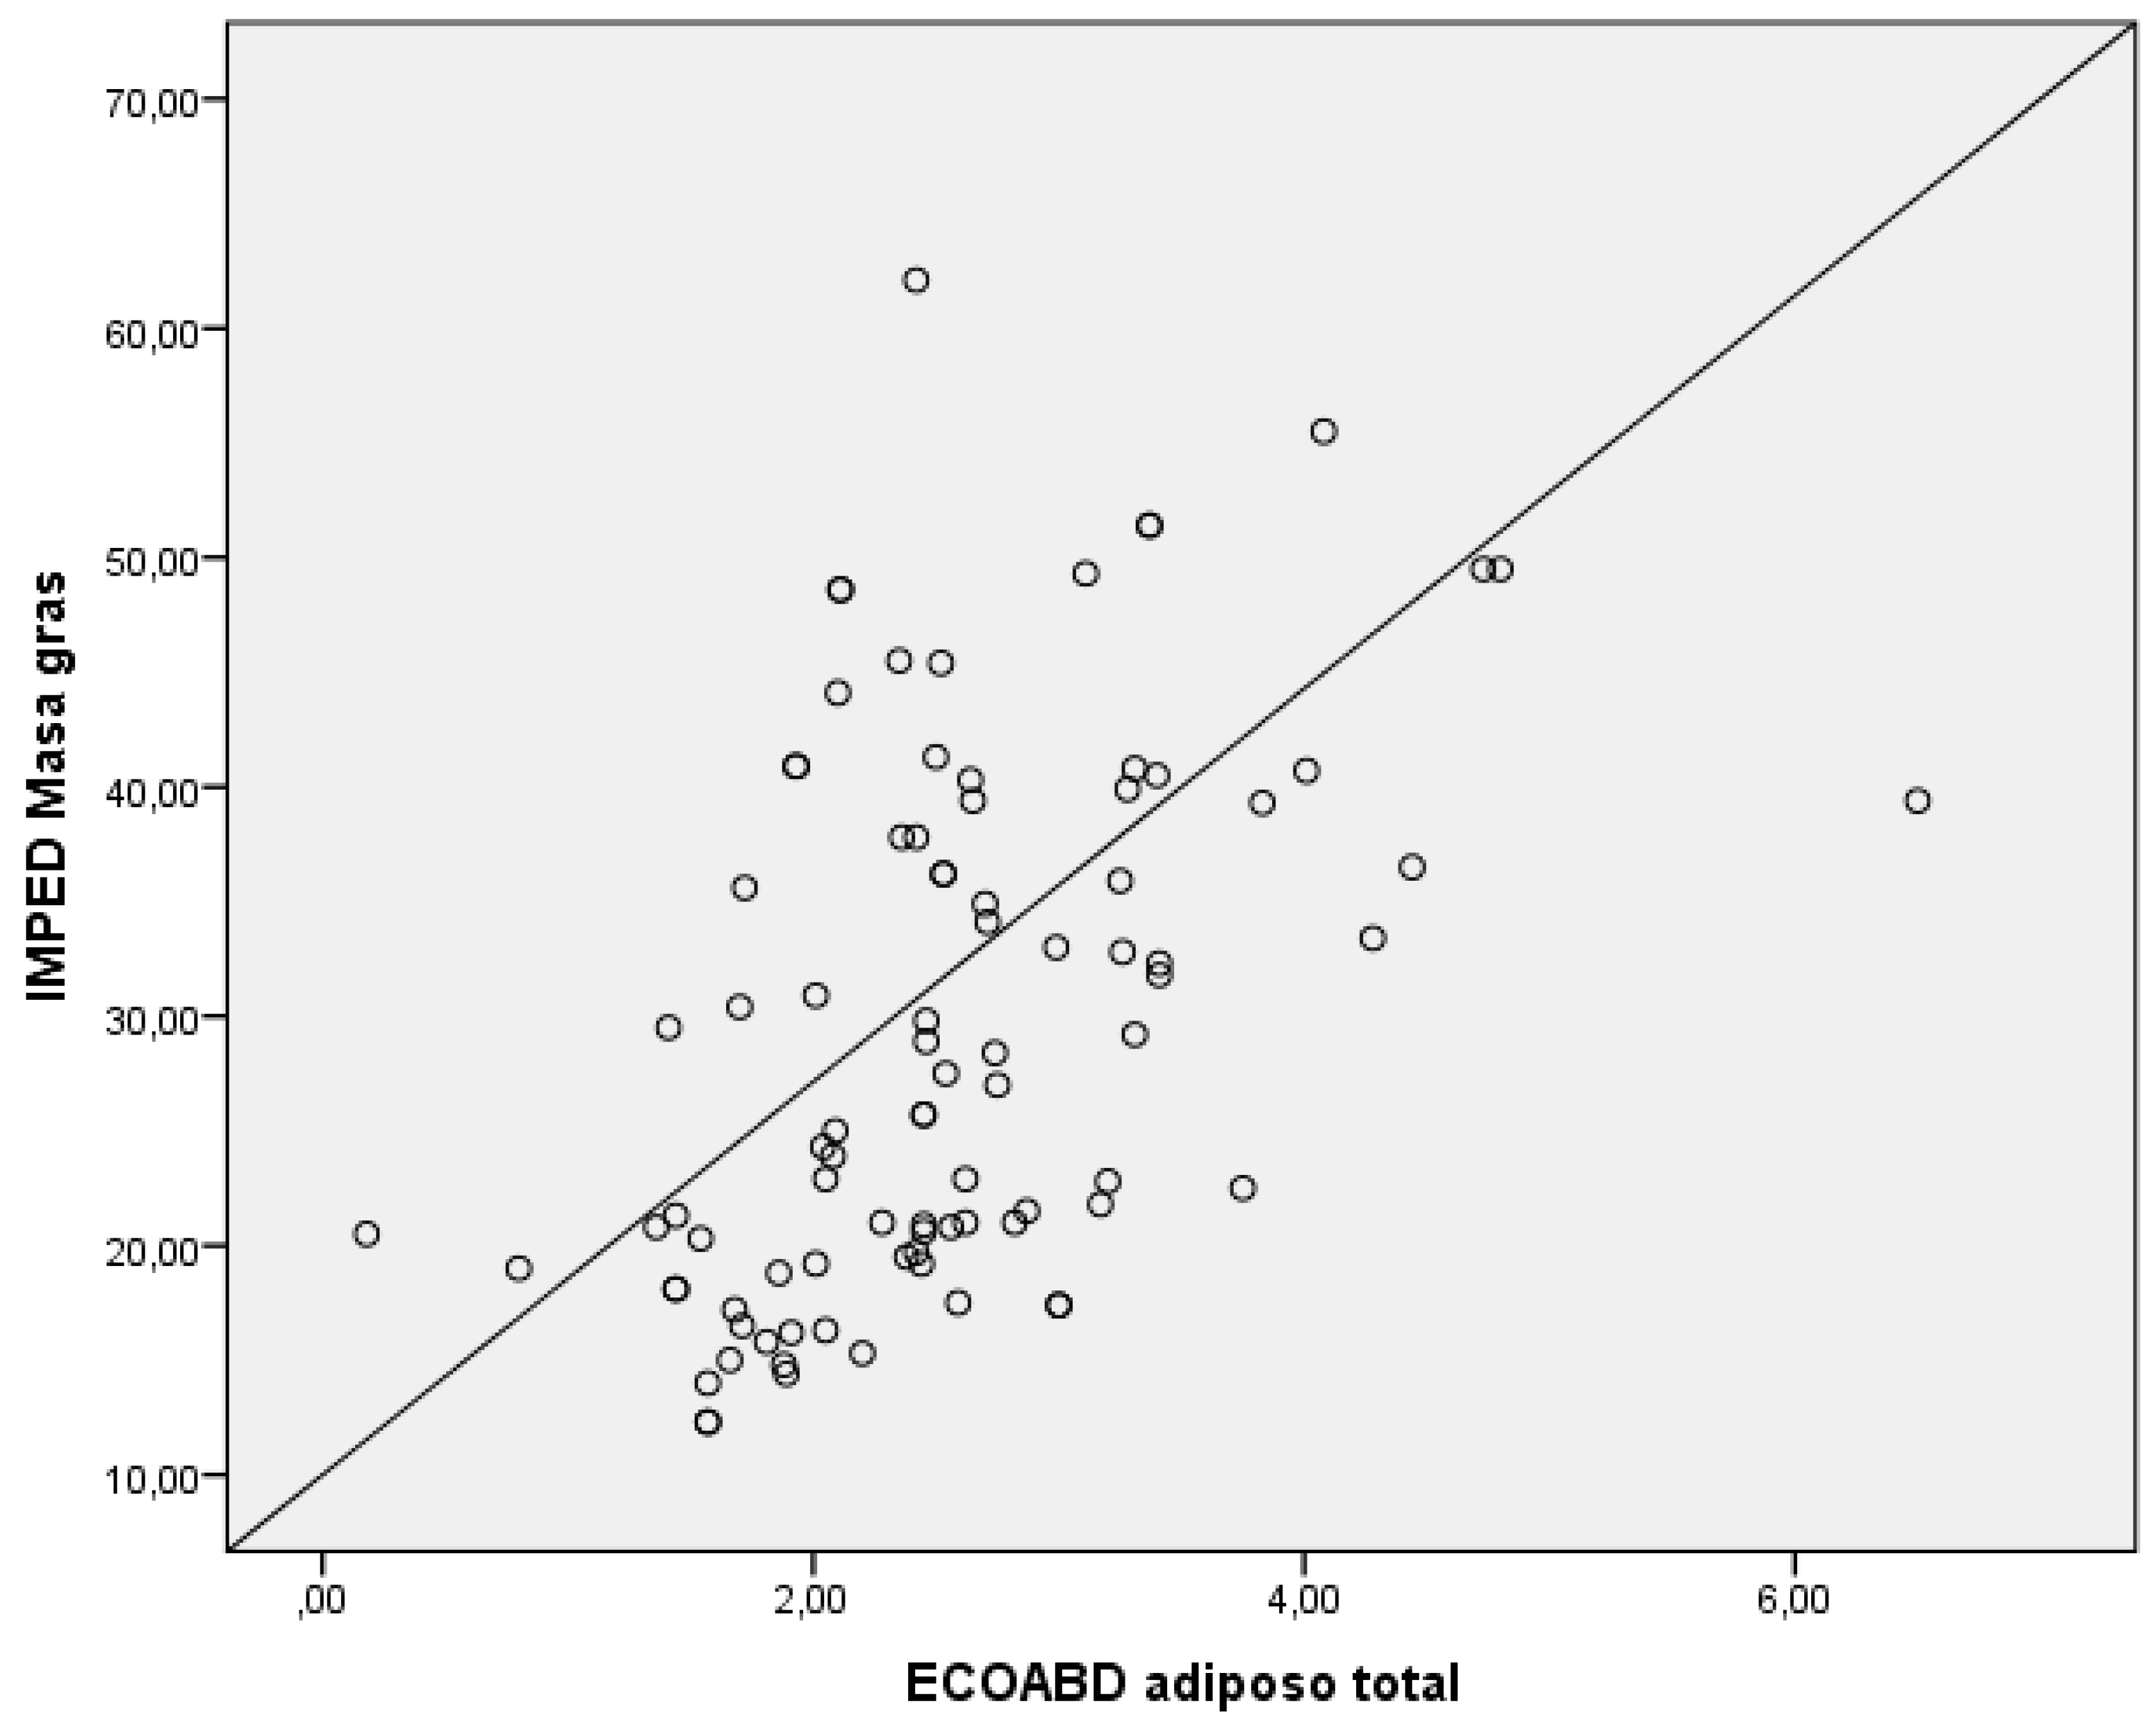
Figure 2.
Cut-off point of 0.93 cm of preperitoneal fat for correlation with NASH. SPSS 23.0. Regression study cut off. It is determinate best point up to 0.93 cm preperitoneal fat (all cases) as predictor risk of NASH.
Figure 2.
Cut-off point of 0.93 cm of preperitoneal fat for correlation with NASH. SPSS 23.0. Regression study cut off. It is determinate best point up to 0.93 cm preperitoneal fat (all cases) as predictor risk of NASH.
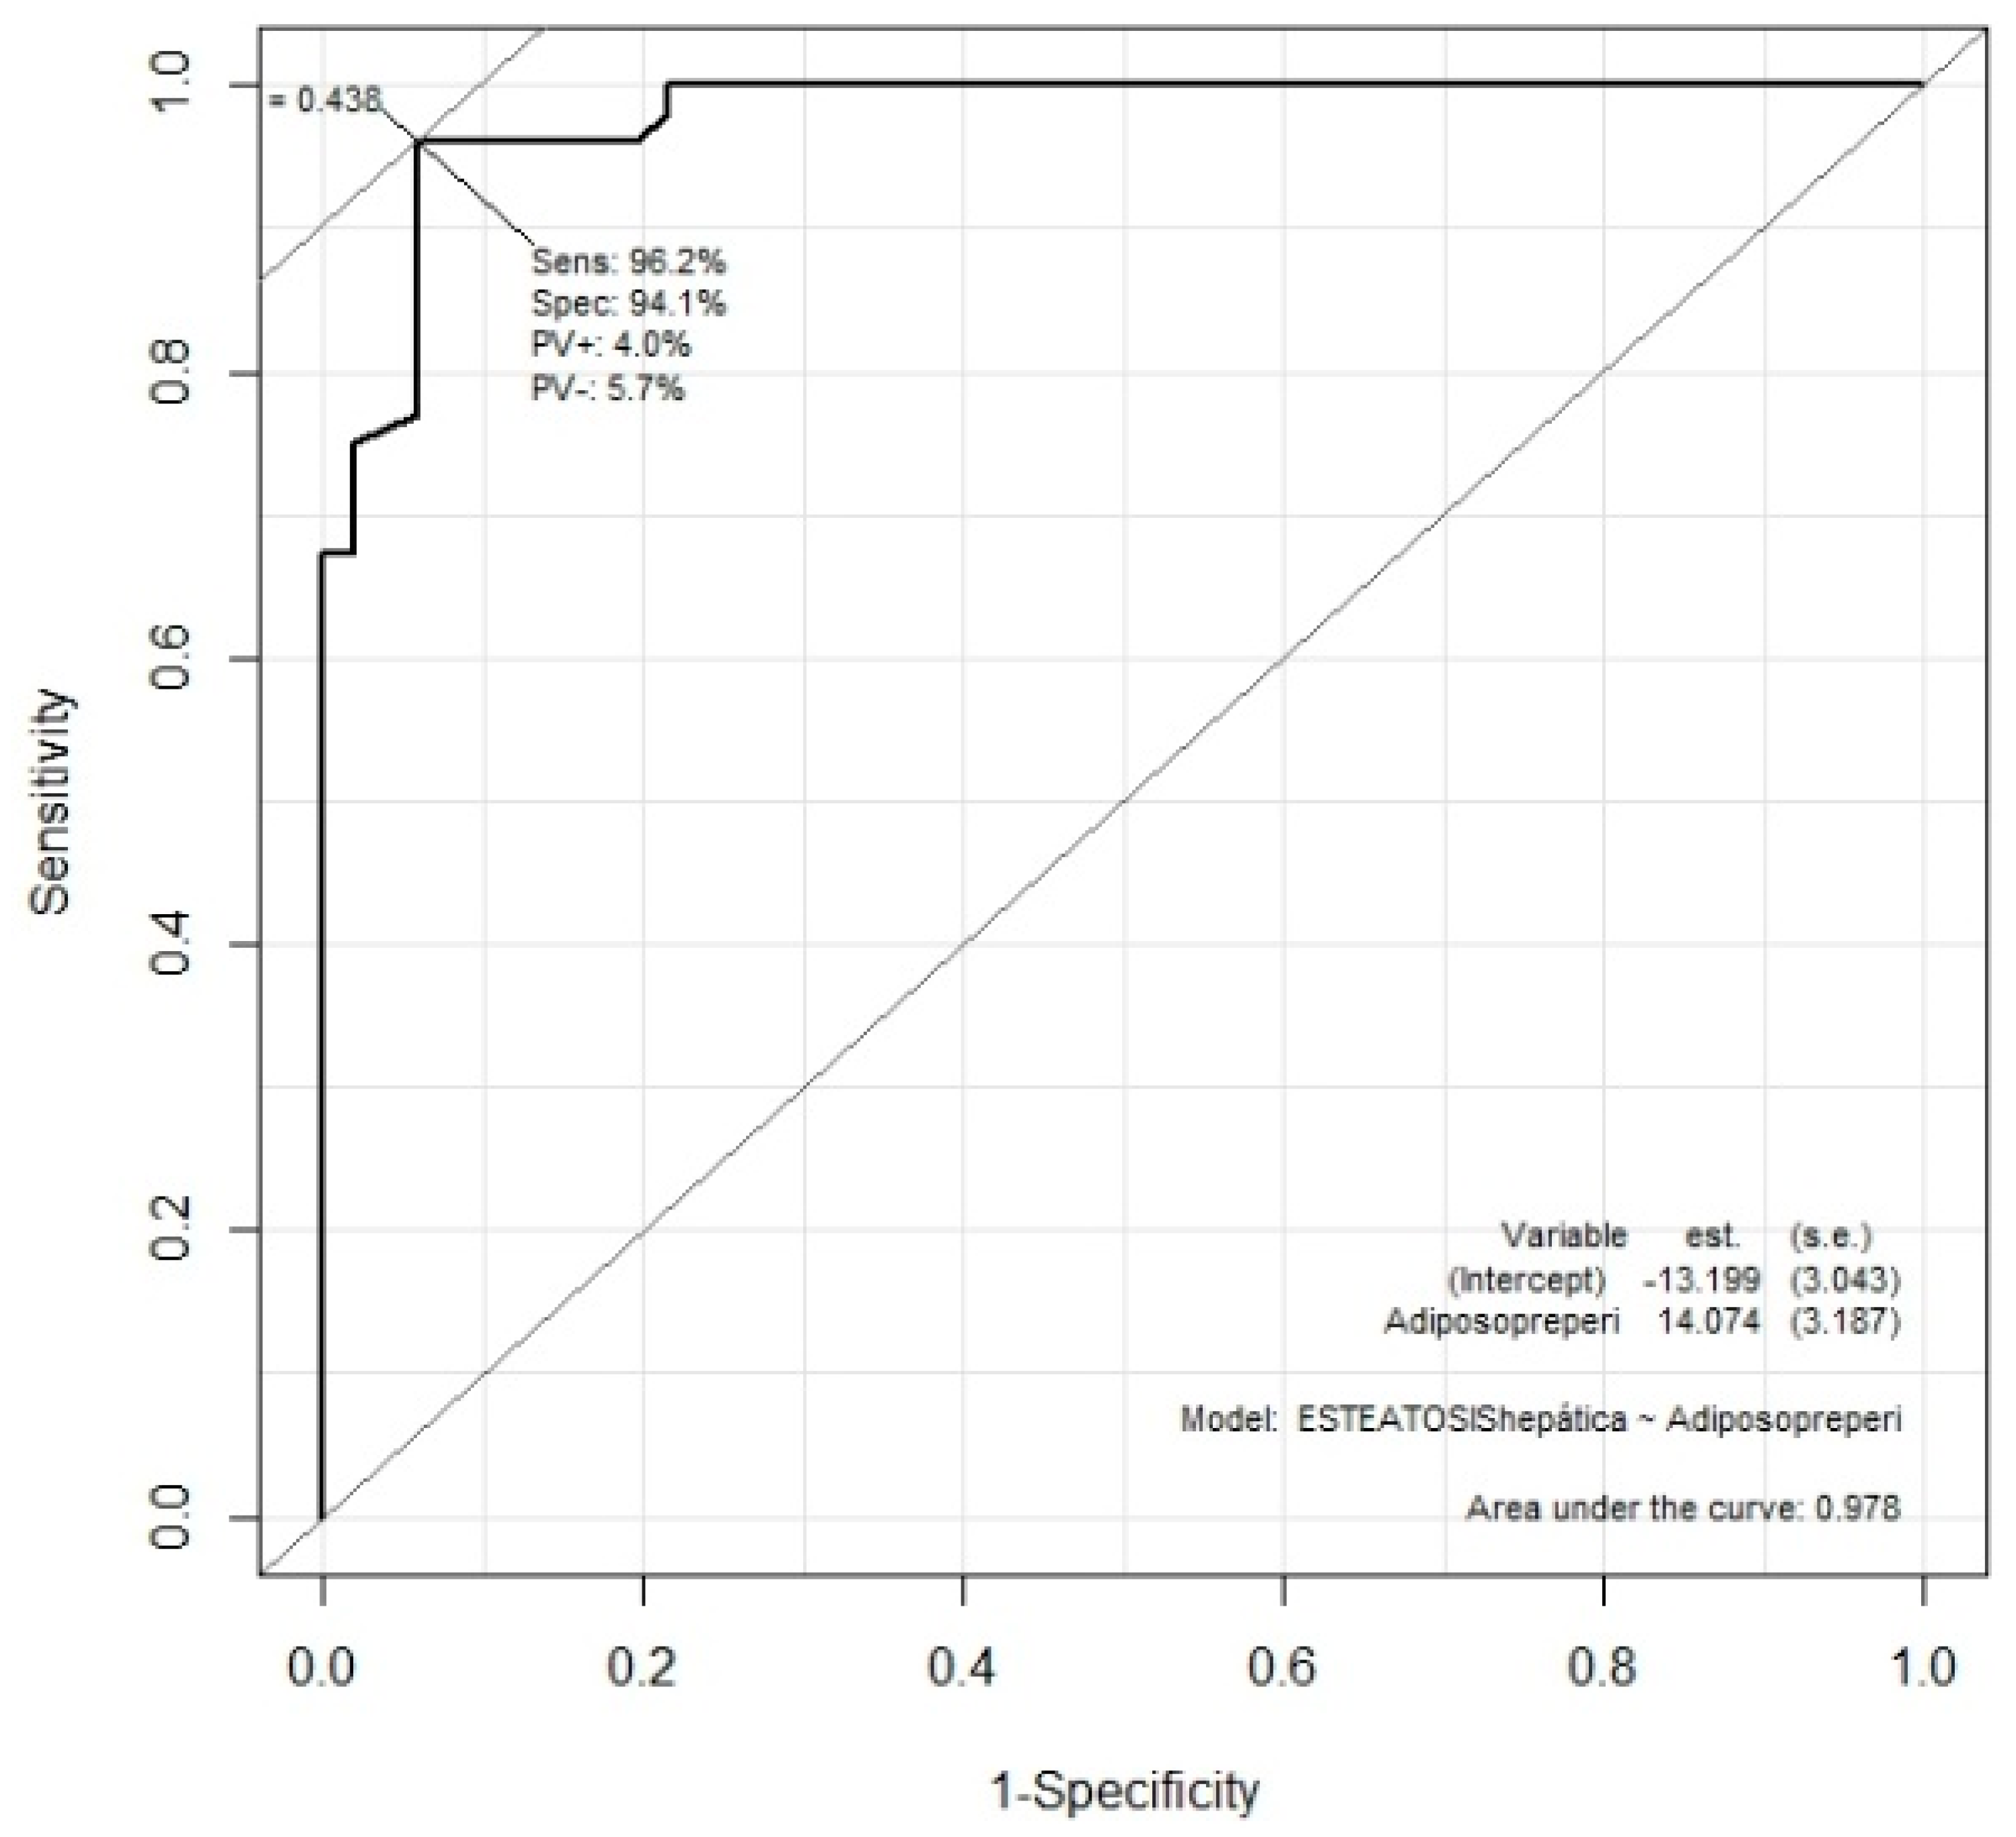

Table 1.
Distribution of the sample.
| no | 103 | ||
|---|---|---|---|
| Men | 60 (58%) | ||
| Women | 43 (42%) | ||
| Age (years) | 11.46 +/- 2.02 | ||
| Weight (kg) | 67.44 +/- 18.1 | ||
| Size (cm) | 154.23 +/- 12.03 | ||
| BMI (kg/m2) | 27.89 +/- 4.73 | ||
| BMI (SDS) | 2.58 +/- 0.5 | ||
| ITP (kg/m3) | 18.1 +/- 2.81 | ||
| Hepatic steatosis | Yeah | 60 (58%) | Mild: 49 (47%) |
| Moderate: 10 (9%) | |||
| Severe: 1 (1%) | |||
| No | 43 (42%) | ||
| bioelectrical impedancemetry | Basal metabolism (kcal/day) | 1578.68 +/- 297.7 | |
| Fat mass (kg) | 29.39 +/- 11.68 | ||
| Excess fat (kg) | 8.52 +/- 6.08 | ||
| muscle ultrasound | Vastus anterior area (cm2) | 4.97 +/- 2.02 | |
| Muscle circumference (cm) | 9.13 +/- 1.96 | ||
| X axis (cm) | 2.26 +/- 1.5 | ||
| Y axis (cm) | 3.25 +/- 1.46 | ||
| Superficial adipose (cm) | 1.64 +/- 1.14 | ||
| Abdominal fat ultrasound | Total subcutaneous fat (cm) | 2.55 +/- 0.92 | |
| Superficial subcutaneous fat (cm) | 1.27 +/- 0.67 | ||
| Preperitoneal fat (cm) | 1.03 +/- 0.4 | ||
Disclaimer/Publisher’s Note: The statements, opinions and data contained in all publications are solely those of the individual author(s) and contributor(s) and not of MDPI and/or the editor(s). MDPI and/or the editor(s) disclaim responsibility for any injury to people or property resulting from any ideas, methods, instructions or products referred to in the content. |
© 2024 by the authors. Licensee MDPI, Basel, Switzerland. This article is an open access article distributed under the terms and conditions of the Creative Commons Attribution (CC BY) license (https://creativecommons.org/licenses/by/4.0/).
Copyright: This open access article is published under a Creative Commons CC BY 4.0 license, which permit the free download, distribution, and reuse, provided that the author and preprint are cited in any reuse.


