Submitted:
03 June 2023
Posted:
05 June 2023
You are already at the latest version
Abstract
Detecting low concentrations of thyroxine hormone (T4) is of utmost importance to prevent diseases and medical issues caused by hypothyroidism. In this work, we propose the use of a simple technique for T4 sensing, the well-known surface-enhanced Raman spectroscopy (SERS). Spherical Au and Ag nanoparticles (NPs) and functionalized with ascorbic acid and tannic acid, respectively. They synthesized by a seed-mediated growth method, were used as SERS substrates to quantify T4 at different concentrations. The NPs were characterized by UV-VIS spectroscopy and scanning electron microscopy. Both, Au and Ag NPs, have an average diameter of 50 nm, the first ones have a surface plasmon resonance at 537 nm, while the latter have it at 421 nm. It was noticed the SERS substrates are composed of isolated and agglomerated NPs. From theoreti-cal-numerical calculations, we identified the hot spots |E| of the agglomerate NPs is at least 7 times more intense than that of the isolated NPs. We show the substrates can detect up to 0.01 mM and, for the range of concentration studied, the Ag substrate is more sensitive than Au. Thus, the proposed substrates and the SERS technique constitute a potential prospect for sensing hormones and organic molecules at low concentrations.
Keywords:
Ag
; Au
; Nanoparticles
; SERS
; thyroxine
; DDA
; Sensor
1. Introduction
Thyroxine (T4) is a hormone secreted by the thyroid gland, made up of amino groups, phenyls, and four iodines. T4 is crucial for the development of reproductive organs; neurons, among others [1,2], and the proper functioning of the human body. Due to its deficiency (T4 < 0.064 mM), it generates development problems for the human being, and in excess (T4 > 0.141 mM), promotes various diseases such as thyroiditis, and cancer nodules, among others [2,3]. Therefore, it is important to detect concentration levels of T4 in the bloodstream. There are several clinical methods for its detection, one of them is the immunoradiometric analysis, and another is the radioimmunoassay analysis. Both methods detect T4 indirectly because they determine the concentration of its precursor thyrotropin hormone [4,5]. The problem with these analyses is that they need a radioactive label so that detection will depend on its sensitivy. To date, successful attempts have been made to detect T4 in serum. Concentrations up to 100 mM have been sensed with techniques such as liquid chromatography coupled with mass spectroscopy (UPLC-MS-MS) [6,7,8], magnetic nanoparticle quantification (MPQ) method [9], lateral flow immunoassay with colorimetric detection (LFAs) [10], electrochemical methods [11], among others. Some have the advantage of being capable of detecting nano-molar concentrations and their reproducibility. However, some technics as UPLC-MS-MS and MPQ require pretreatment, purification or labeling of the sample to detect T4. In contrast, others use high-pressure conditions to increase sensitivity, increasing the cost of the analysis [6,7,8,9]. Electrochemical, LFAs, and MPQ methods use metallic or magnetic NPs as sensors for the molecules. In our case, we use Au NPs and Ag NPs to detect and quantify T4 using surface-enhanced Raman scattering (SERS); the last utilizes localized electric fields of the metal NPs to enhance the Raman signal of the molecule adsorbed on its surface [12]. This technique is simple and easy to reproduce to detect low concentrations of the molecules; it is feasible because the Raman signal is unique to each molecule and does not require the placement of labelers.
The SERS technique amplifies the Raman signal of a molecule adsorbed on a metal surface. When an incident electromagnetic wave interacts with the metal surface, a local electric field is generated, contributing to the excitation of the adsorbed molecule. Subsequently, the last relaxes by scattering photons with a wavelength different from the incident wave. By using the local electric field of the metal surface and considering the shape, size, and material, it is possible to obtain a diversity of SERS substrates.
There are several methods for the synthesis of metallic NPs as the Turkevich method [13], seed-mediated growth [14], and lithography [15], among others. NPs of different shape and sizes can be obtained depending on the method. Seed-mediated growth is a simple technique to synthesize spherical Au and Ag NPs, which allows us to control the shape and size according to the number of growth stages [14,16].
The SERS enhancement factor (SERS-EF) used to quantify the performance of the SERS substrates, depends on several key factors such as the power, exposure time, and wavelength of the excitation laser, the chemical structure and composition of the molecule, the surface roughness of the metal [12]. For example, with Ag NPs of different morphologies, a SERS-EF of 106-107 has been achieved to detect the methylene blue molecule [17]. Ag NP flakes presented a higher SERS-EF when excited at 632 nm. With Au NPs, SERS-EFs of the order of 10 to 105 have been reported to detect of 4-aminothiophenol, these values were achieved with spherical NPs of different sizes from 17 to 80 nm in diameter and an excitation wavelength of 647 nm [18].
The SERS substrates proposed here are an alternative for T4 detection. We expect our results to encourage the use of SERS substrates in measurement strips for personal use.
2. Materials and Methods
Chloroauric acid (Sigma Aldrich, 99.9%), L-ascorbic acid (Sigma Aldrich, 98%), and polyvinylpyrrolidone (PVP, Sigma Aldrich, average molar weight 10,000 wt) used to synthesize Au NPs. Ag NPs obtained using silver nitrate (Riedel-de-Haën, 98%), tannic acid (Sigma Aldrich, 99%), and sodium citrate dihydrate (J. T. Baker, 99.98%). The substrate used was 1 cm2 of the p-type silicon wafer with a resistivity of 0.01-0.02 Ω-cm, previously washed with Xylene (Sigma Aldrich, 98%), acetone (Sigma Aldrich, 98%), and ethanol (Sigma Aldrich). For test molecule for SERS substrates was the thyroxine (T4, Sigma Aldrich, 99%) in methanol (Sigma Aldrich, 98%)-deionized water (18.2 MΩ cm) solution.
2.1. Au NPs Synthesis
Au NPs were fabricated by mixing 35 mg of PVP, and 60 mg of L-ascorbic acid in 6 ml of deionized water. Then 3 ml of chloroauric acid (1 mM) were added to the solution and allowed to react for three h to obtain Au seeds of diameter approximately 30 nm (adjustment with Mie plot). The seeds were grown by adding 3 ml of chloroauric acid (1 mM) and left to react for the other three h. In the following growth, the same amount of chloroauric acid was added for the same reaction time was left. The whole process occurred at a constant temperature of 90°C. Finally, the Ag NPs were centrifuged (Hermle LaborTechnik Z 36 HK) at 18,000 rpm for 15 minutes and redispersed in 20 ml of deionized water.
2.2. Ag NPs Synthesis
The synthesis of Ag NPs was previously reported [19]. Briefly, the procedure is described as follows: the Ag NPs seed solution was obtained by mixing 50 ml of tannic acid (0.1 mM), 50 ml of sodium citrate (45 mM), and 1 ml of silver nitrate (25 mM) for 15 min at 90°C. The seed solution was centrifuged and then redispersed in deionized water. For each growth, 20 ml of the seed solution (0.21 M), 16 ml of deionized water, 500 μl of sodium citrate (25 mM), 1.5 ml of tannic acid (2.5 mM), and 1 ml of silver nitrate (25 mM) were used. The whole process was carried out at a constant temperature of 90°C. Four growths were made, and the Ag NPs sample was centrifuged, and redispersed in 20 ml of deionized water.
2.3. Preparation of SERS Substrates of Au and Ag NPs
Silicon wafers (1 cm2) used as support for SERS substrates were previously washed with xylene, acetone, and ethanol for 10 min and rinsed with deionized water, and dried in a muffle at 100°C. Subsequently, 50 μl (3 mM) of Au NPs (or Ag NPs) deposit. The solvent of the metallic NPs solution was evaporated using a tubular oven (Thermo Scientific Lindberg Blue M) at 60°C, with a nitrogen flow (0.2 ml/s) for 30 min.
2.4. Deposition of T4 in SERS Substrates
T4 solutions were prepared with 0.01, 0.05, 0.10, 0.30, and 1.00 mM concentrations in methanol-deionized water (1:1 v:v). Afterward, on the silicon wafer and the SERS substrates, 50 μL of T4 was deposited. The solvent was evaporated at 50°C in the tubular oven with a nitrogen flow (0.5 ml/s) for 3 h.
2.5. Equipment
UV-Vis-NIR Agilent-Varian-Cary 5000 spectrophotometer was used to obtain the absorbance spectra of the metal NPs solutions.
The equipment used to obtain the SEM images of the metal NPs was a JEOL microscope, model JSM 7800F.
HORIBA Jobin Yvon Micro-Raman LabRam HR was used for all experiments with a monochromatic He-Ne laser (632.8 nm). A power of 6 mW was selected, with a capture time of 10 s and 5 cycles, without using filters. The Raman equipment has an OLYMPUS BX41 microscope with a magnification of 100x to focus the study area used.
2.6. Theoretical-Numerical Calculations
In the theoretical-numerical modeling, discrete dipole approximation (DDA) was used. There is a great variety of articles where the fundamentals of DDA have been discussed in great detail. In brief, DDA is a tool for solving Maxwell’s equations by using a set of point dipoles to mimic the solid target. The dipole-dipole interaction generates an induced electric field, and added to the incident electromagnetic field is possible to obtain a complex 3N equation system [19,20,21]. This approximation allows the calculation of optical efficiencies (scattering, absorption, and extinction) and also calculations of the near and far electric fields of particles of arbitrary geometry.
Extinction efficiencies and near electric field were obtained for 1 to 3 NPs of 50 nm in diameter, with a separation distance of 1 nm between them. For the dielectric function of gold and silver, the finite size correction was considered because at this size, the confinement is very important [22].
For the near-electric field calculations, 200,000 point dipoles were used for 1 NP and the agglomerate of 3 NPs.
3. Results and Discussion
Figure 1 shows the absorbance spectra of Au NP (green line) and Ag NP (orange line) solutions. At 537 nm is observed one band associated with surface plasmons of Au NPs [23,24]. While in Ag NPs, the plasmon band is located at 421 nm. Besides, both spectra have two optical bands between 200 and 300 nm. In the case of Ag NPs, they correspond to tannic acid as a functionalizing agent [19] and to interband transitions [25]. In the case of Au NPs spectrum, the two bands observed correspond to L-ascorbic acid as a functionalizing agent (see Figure S1 in the Electronic Supplementary Material (ESM)) and interband transitions [25].
SEM images of Au NPs and Ag NPs are shown in Figure 2a,c. Metal NPs have a quasi-spherical morphology, and Au NPs are more agglomerated than Ag NPs. From a sampling of 150 NPs, the size distribution was determined, where the average size for Au NPs is 53±15 nm, whereas for Ag NPs is of 46±14 nm, Figure 2b,d, respectively.
Figure 3 shows the Raman spectrum of the T4 crystals. Several bands are observed; the two most intense bands are located at 216 cm-1 and 1044 cm-1. The first is associated with the planar bending vibrational mode of the C-C-I bonds, and the second is due to a combination of the stretching vibrations of the C-O bond and the C-N bonds [26,27,28].
Figure 4 shows the Raman spectra of a silicon wafer (black line), T4 deposited on a silicon wafer (red line), T4 deposited on Au NPs and Si wafer (blue line), and T4 deposited on Ag NPs (orange line) also on Si wafer. The concentration of T4 was 1 mM. Three bands located at 300, 521, and 944 cm-1 are observed in the spectrum of the silicon wafer; the first one corresponds to the acoustic transverse vibrational mode, and the others to optical transverse vibrational modes [29]. In the red spectrum, the bands corresponding to T4 are not observed due to the small concentration of T4; only the band located at 521 cm-1 related to Si wafer is observed. For the Raman signal of T4 on Au and Ag NPs (blue and orange lines), three bands at 822, 1042, and 1050 cm-1 were observed. The first one has been designed at ring deformation vibration mode and the other at, both designated by vibrational modes of stretching the C-O and C-N bonds of the T4 molecule [26,27,28]. These bands are very intense compared to the spectrum of T4 supported on the Si wafer. The Si bands are present in all the spectra, the most intense being located at 521 cm-1.
For the determination of the SERS enhancement factor (SERS-EF) the band at 216 cm-1 (from T4) was discarded because of a slight overlap with the Si band around 300 cm-1, see Figure 4 lines (a), (c), and (d). The band at 822 cm-1 was discarded because it was not present in all spectra of T4 at different concentrations on the metalic NPs.
Therefore, the band located at 1042 cm-1 was chosen to determine the SERS-EF signal. The concentration of T4 was varied from 0.01 mM to 1 mM. The band increases in intensity when the concentration rises. The last is observed using Au and Ag SERS substrates (see Figure 5).
For the determination of SERS-EF of T4 using SERS substrates of metal NPs, the following equation was used:
ISERS and IRaman are the Raman band intensities of the T4 supported on the SERS substrate and on silicon wafer (without the metal NPs), respectively. NRaman and NSERS are the total excited molecules of T4 on the silicon wafer without and with metal NPs, respectively. NRaman and NSERS were determined considering: the area occupied by each molecule (see Figure S2 in ESM), the number of molecules within the laser spot area (12.5 x10⁷ nm2), and in the case of SERS substrates, the number of molecules on the metal NPs (see Table S1 in ESM). It is relevant to mention that a 3 nm thick layer of T4 was considered on the NPs because the highest contribution of the local electric field of the NPs is at a distance of 3 nm above the surface, and after this distance, it starts to decrease exponentially in intensity (see Figure S3 in ESM).
Table 1 shows the ISERS, IRaman, NRaman, NSERS, and SERS-EF obtained values. The SERS-EF increments as the T4 concentration increases for both Au and Ag SERS substrates. However, the Ag NP SERS substrate is more sensitive to the detection of T4 at low concentrations than the Au NP’s SERS substrate. The minimum concentration detected with the substrates is below the minimum value established for the healthy human body (0.064 mM).
An analysis of SERS-EF versus concentration was performed to determine the trend of the effectiveness of the NPs SERS substrates, see Figure 6. Figure 6(a) shows a decreasing trend as the concentration decreases, observing that it presents a linear behavior with a correlation coefficient of 0.96 when using the Au NPs and 0.99 for the Ag NPs. Also, it is appreciated that the SERS substrates of Ag NPs have a higher SERS-EF than that of the Au NP substrate. A logarithmic scale is shown in Figure 6 (b) to appreciate the behavior at low concentrations better. A decrease of three orders of magnitude of SERS-EF is observed as T4 concentration decreases.
In conclusion, SERS substrates of spherical Au and Ag NPs detect T4 concentrations down to 0.01 mM. Therefore, these SERS substrates are feasible for sensing to detect T4 concentrations above and below the standard concentration range in the human body.
For the determination of the SERS-EF, we use the approximation of |E|4 given by the following equation:
where Eloc and Einc are the local and incident electric field, respectively, evaluated at the position where the molecule stands. ωexc is the excitation frequency and ωRaman the Stokes shift Raman frequency of the molecule [12].
We calculated near-electric field to estimate the SERS-EF reached with Au NPs and Ag NPs. Figure 7 (a) shows near-electric field images of one NP, a triangular and linear agglomerate of 3 Au NPs. For an isolated Au NP, the hot spots near its surface contributed to an enhancement factor of 5.2X10². In contrast, for the triangular agglomerate, the hot spot is located between the two NPs whose equator is parallel to the Y-axis; its SERS-EF is around of 8.1X10⁵. However, when the 3 Au NPs are aligned the hot spots are founded in the gaps, obtaining a SERS-EF of 2.4X10⁷. The extinction efficiencies were calculated for the three cases (Figure 7 (b)), observing that the position of the optical band of a single Au NP is founded at 512 nm; for the triangular and linear agglomerates the optical band is located at 574 and 590 nm, respectively. D.D.Li et al. [30] studied the optical efficiency of linear and nonlinear agglomerates of 20 nm Au NPs. They found that the linear agglomerates present two main resonances, one longitudinal and one transverse, while the quasi-spherical agglomerates present a principal resonance that is very broad. Although their NPs are of different sizes, they used the same arrangements, triangular and linear agglomerates of three Au NPs. In the case of the linear agglomerate, they reported two bands of surface plasmons, one longitudinal and one transverse. In our case, a different size of NP was studied and an incident wave was considered with a polarization state in the Y-axis (parallel to the equator of the NPs), giving preference to the longitudinal plasmon band, so that the transverse plasmon band is not appreciated.
Similar behavior is observed in the case of Ag NPs, see Figure 8 (a). Nevertheless, the SERS-EF is about 2.5X10⁶ in the linear array, one order of magnitude lower than that the Au NPs. For the other cases the SERS-EF is lower, of 1.5X10² for the single NP and 3.9X10⁵ for the triangular cluster. Besides, the hot spots are in the gaps. The extinction efficiencies were obtained to understand the last fact (Figure 8 (b)). We observe that the optical extinction band of the linear cluster is at 497 nm, which is farther away from the excitation wavelength of 632 nm. Something similar occurs in the other cases.
4. Conclusions
In summary, spherical Au and Ag NPs of about 50 nm in diameter were obtained and functionalized with ascorbic acid and tannic acid, respectively. Subsequently, they were deposited on silicon wafers and used as SERS substrates for T4 detection. We show that our proposal to use SERS for T4 hormone detection is feasible and easy to employ. Only the SERS substrate and molecule are needed for detection, without adding labelers as required by techniques such as UPLC-MS-MS and MPQ.
We show that using spherical Au and Ag NPs, it is possible to detect the T4 molecule up to concentrations of 0.01 mM. We find that SERS substrates of Ag NPs are more sensitive to the detection of the test molecule than those of Au NPs. With both substrates, the SERS-EF of the order of 106 is achieved for 1 mM concentrations and of 102-103 for 0.01 mM concentrations. Lower concentrations could not be detected with these substrates; however, the substrates are amenable to improvement. For example, it is desirable to avoid oxidation of the NPs, avoid large agglomerates and single particles, favor small clusters with hot spots and, to excite the NPs at their plasmon resonance.
Based on the theoretical-numerical analysis, we deduce that the main contribution to the SERS-EF is the hot spots of the metal NPs. The hot spots in the linear and triangular agglomerates are in the gaps between the metal NPs. Moreover, the hot spots of the single NPs also contribute to the SERS-EF but with a lower intensity than the previous one. Therefore, the presence of agglomerates is advantageous for better performance of the SERS substrates of spherical NPs.
Supplementary Materials
The following supporting information can be downloaded at the website of this paper posted on Preprints.org, Figure S1: Absorbance spectra of the colloidal solution of Au NPs; Figure S2: Image of the Thyroxine molecule inside a rectangular prism; Figure S3: Near electric field intensity image of an Au NP of 50 nm of diameter and plot of the mean |E|4 with increasing distance from the Au NP surface; Figure S3: SEM micrograph at a magnification of 15,000x of the SERS substrate of (a) Au NPs and (b) Ag NPs; Table S1: Molecule concentration of T4, total number of molecules in each T4 solution concentration, number of molecule-layers on the Si wafer, and total thickness of the multi-layer array, and NRaman value; Table S2: Values used to estimate the total metal area occupied by the NP that are under the laser spot.
Author Contributions
Conceptualization, E.S. and A.L.G.; methodology, E.S. and A.L.G.; numerical simulation, P.D.L. and A.L.G.; validation, P.D.L., E.S. and A.L.G.; formal analysis, P.D.L., E.S. and A.L.G.; investigation, P.D.L., E.S. and A.L.G.; resources, E.S. and A.L.G.; writing—original draft preparation, P.D.L. and A.L.G.; writing—review and editing, P.D.L., E.S. and A.L.G.; funding acquisition, E.S. and A.L.G. All authors have read and agreed to the published version of the manuscript.
Funding
This research was funded by Vicerrectoría de Investigación y Estudios de Posgrado, Benemérita Universidad Autónoma de Puebla, grant number 100504244-VIEP2023 and 100409188-VIEP2023.
Institutional Review Board Statement
Not applicable.
Informed Consent Statement
Not applicable.
Data Availability Statement
The original data presented in this study are available by further request to any of the authors.
Acknowledgments
P. de León thanks CONACYT for the doctorate student grant No. 330633 and the postdoctoral fellowship. A. L. González and E. Sanchez-Mora thank to the VIEP-BUAP for the financial support.
Conflicts of Interest
The authors declare no conflict of interest.
References
- Hiller-Sturmhöfel, S.; Bartke, A. The endocrine system: an overview. Alcohol Health Res World. 1998, 22, 153–164. [Google Scholar]
- Silva, J.F.; Ocarino, N.M.; Serakides, R. Thyroid hormones and female reproduction, Biol. Reprod. 2018, 99, 907–921. [Google Scholar]
- Shokripour, M.; Imanieh, M.H.; Garayemi, S.; Omidifar, N.; Shirazi Yeganeh, B.; Althabhawee, F. Thyroid stimulating hormone, T3 and T4 population-based reference range and children prevalence of thyroid dysfunction: first report from South of Iran. Iran J. Pathol. 2022, 17, 427–434. [Google Scholar] [CrossRef]
- Martino, E.; Bambini, G.; Bartalena, L.; Mammoli, C.; Aghni-Lombardi, F.; Baschierli, L.; Pinchera, A. Human serum thyrotrophin measurement by ultrasensitive immunoradiometric assay as a first-line test in the evaluation of thyroid function. Clin. Endocrinol. 1986, 24, 141–148. [Google Scholar] [CrossRef]
- Thumvijit, T.; Supawat, B.; Wattanapongpitak, S.; Kothan, S.; Tungjai, M. Effect of iodinated radiographic contrast media on radioimmunoassay for measuring thyroid hormones. Appl. Radiat. Isot. 2022, 185, 110261. [Google Scholar] [CrossRef]
- Neu, V.; Bielow, C.; Gostomski, I.; Wintringer, R.; Braun, R.; Reinert, K.; Schneider, P.; Stuppner, H.; Huber, C.G. Rapid and comprehensive impurity profiling of synthetic thyroxine by ultrahigh-performance liquid chromatography−high-resolution mass spectrometry. Anal. Chem. 2013, 85, 3309–3317. [Google Scholar] [CrossRef]
- Ackermans, M.T.; Kettelarij-Haas, Y.; Boelen, A.; Endert, E. Determination of thyroid hormones and their metabolites in tissue using SPE UPLC-tandem MS. Biomed. Chromatogr. 2012, 26, 485–490. [Google Scholar] [CrossRef]
- Luna, L.G.; Coady, K.; McFadden, J.R.; Markham, D.A.; Bartels, M.J. Quantification of total thyroxine in plasma from xenopus laevis. J. Anal. Toxicol. 2013, 37, 326–336. [Google Scholar] [CrossRef] [PubMed]
- Orlov, A.V.; Znoyko, S.L.; Pushkarev, A.V.; Mochalova, E.N.; Guteneva, N.V.; Lunin, A.V.; Nikitin, M.P.; Nikitin, P.I. Data on characterization and validation of assays for ultrasensitive quantitative detection of small molecules: determination of free thyroxine with magnetic and interferometric methods. Data Br. 2018, 21, 1603–1611. [Google Scholar] [CrossRef] [PubMed]
- Bikkarolla, S.K.; McNamee, S.E.; Vance, P.; McLaughlin, J. High-sensitive detection and quantitative analysis of thyroid-stimulating hormone using gold-nanoshell-based lateral flow immunoassay device. Biosensors. 2022, 12, 182. [Google Scholar] [CrossRef] [PubMed]
- David, M.; Serban, A.; Enache, T.E.; Florescu, M. Electrochemical quantification of levothyroxine at disposable screen-printed electrodes. J. Electroanal. Chem. 2022, 911, 116240. [Google Scholar] [CrossRef]
- Ru, E.L.; Etchegoin, P. Principles of Surface-Enhanced Raman Spectroscopy; Elsevier: Oxford, 2009. [Google Scholar]
- Dong, J.; Carpinone, P.L.; Pyrgiotakis, G.; Demokritou, P.; Moudgil, B.M. Synthesis of precision gold nanoparticles using turkevich method. Kona. 2020, 37, 224–232. [Google Scholar] [CrossRef]
- Bastús, N.G.; Merkoçi, F.; Piella, J.; Puntes, V. Synthesis of highly monodisperse citrate-stabilized silver nanoparticles of up to 200 nm: kinetic control and catalytic properties. Chem. Mater. 2014, 26, 2836–2846. [Google Scholar] [CrossRef]
- Duval Malinsky, M.; Kelly, K.L.; Schatz, G.C.; Van Duyne, R.P. Nanosphere lithography: effect of substrate on the localized surface plasmon resonance spectrum of silver nanoparticles. J. Phys. Chem. B. 2001, 105, 2343–2350. [Google Scholar] [CrossRef]
- Bastús, N.G.; Comenge, J.; Puntes, V. Kinetically controlled seeded growth synthesis of citrate-stabilized gold nanoparticles of up to 200 nm: size focusing versus Otswald Ripening. Langmuir. 2011, 27, 11098–11105. [Google Scholar] [CrossRef]
- Majumdar, D.; Singha, A.; Mondal, P.; Kundu, S. DNA-mediated wirelike clusters of silver nanoparticles: an ultrasensitive SERS substrate. ACS Appl. Mater. Interfaces. 2013, 5, 7798–7807. [Google Scholar] [CrossRef]
- Hong, S.; Li, X. Optimal sixe of gold nanoparticle for surface-enchanted Raman spectroscopy under different condition. J. Nanomater. 2013, 2013, 1–9. [Google Scholar]
- De Leon Portilla, P.; González, A.L.; Sanchez Mora, E. Theoretical and experimental study on the functionalization effect on the SERS enhancement factor of SiO2-Ag composite films. IntechOpen, in press. [CrossRef]
- Purcell, E.M.; Pennypacker, C.R. Scattering and absorption of light by nonspherical dielectric grains. Astrophys. J. 1973, 186, 705–714. [Google Scholar] [CrossRef]
- Goodman, J.J.; Draine, B.T.; Flatau, P.J. Application of fast-fourier-transform techniques to the discrete-dipole approximation. Opt. Lett. 1991, 16, 1198–1200. [Google Scholar] [CrossRef] [PubMed]
- Kreibig, U. Electronic properties of small silver particles: the optical constants and their temperature dependence. J. Phys. F: Met. Phys. 1974, 4, 999–1014. [Google Scholar] [CrossRef]
- Ziegler, C.; Eychmüller, A. Seeded growth synthesis of uniform gold nanoparticles with diameters of 15−300 nm. J. Phys. Chem. C. 2011, 115, 4502–4506. [Google Scholar] [CrossRef]
- Njoki, P.N.; Lim, I.-I.S.; Mott, D.; Park, H.Y.; Khan, B.; Mishra, S.; Sujakumar, R.; Luo, J.; Zhong, C.J. Size correlation of optical and spectroscopic properties for gold nanoparticles. J. Phys. Chem. C. 2007, 111, 14664–14669. [Google Scholar] [CrossRef]
- Noguez, C.; Villagómez, C.J.; González, A.L. Plasmonics of multifaceted metallic nanoparticles, field enhancement, and TERS. Phys. Status Solidi B. 2015, 252, 56–71. [Google Scholar] [CrossRef]
- Borah, M.M.; Devi, T.G. Vibrational studies of thyroxine hormone: comparative study with quantum chemical calculations. J. Mol. Struct. 2017, 1148, 293–313. [Google Scholar] [CrossRef]
- Rizzon, R.V.K.; Ludwing, Z.M.C.; Modesto-Costa, L.; Ludwing, V. Thyroxine: a theoretical study of the vibrational and electronic properties. QUARKS: Braz. Electron. J. of Phys. Chem. And Mat. Sci. 2020, 3, 31–40. [Google Scholar] [CrossRef]
- Álvarez, R.M.; Della Védova, C.O.; Mack, H.G.; Farías, R.N.; Hilderbrandt, P. Raman spectroscopic study of the conformational changes of thyroxine induced by interactions with phospholipid. Eur. Biophys. J. 2002, 31, 448–453. [Google Scholar] [CrossRef]
- Mandak, V.; Gupta, S.K.; Jha, P.K.; Ovsyuk, N.N.; Kachurin, G.A. Low-frequency Raman scattering from Si/Ge nanocrystals in different matrixes caused by acoustic phonon quantization. J. Appl. Phys. 2012, 112, 054318. [Google Scholar]
- Li, D.D.; Timchenko, V.; Chan, Q.N.; Yuen, A.C.Y.; Yeoh, G.H. Study of morphology and optical properties of gold nanoparticle aggregates under different pH conditions. Langmui. 2018, 34, 10340–10352. [Google Scholar] [CrossRef]
Figure 1.
Absorbance spectra of Au (green line) and Ag NPs (orange line) solutions.
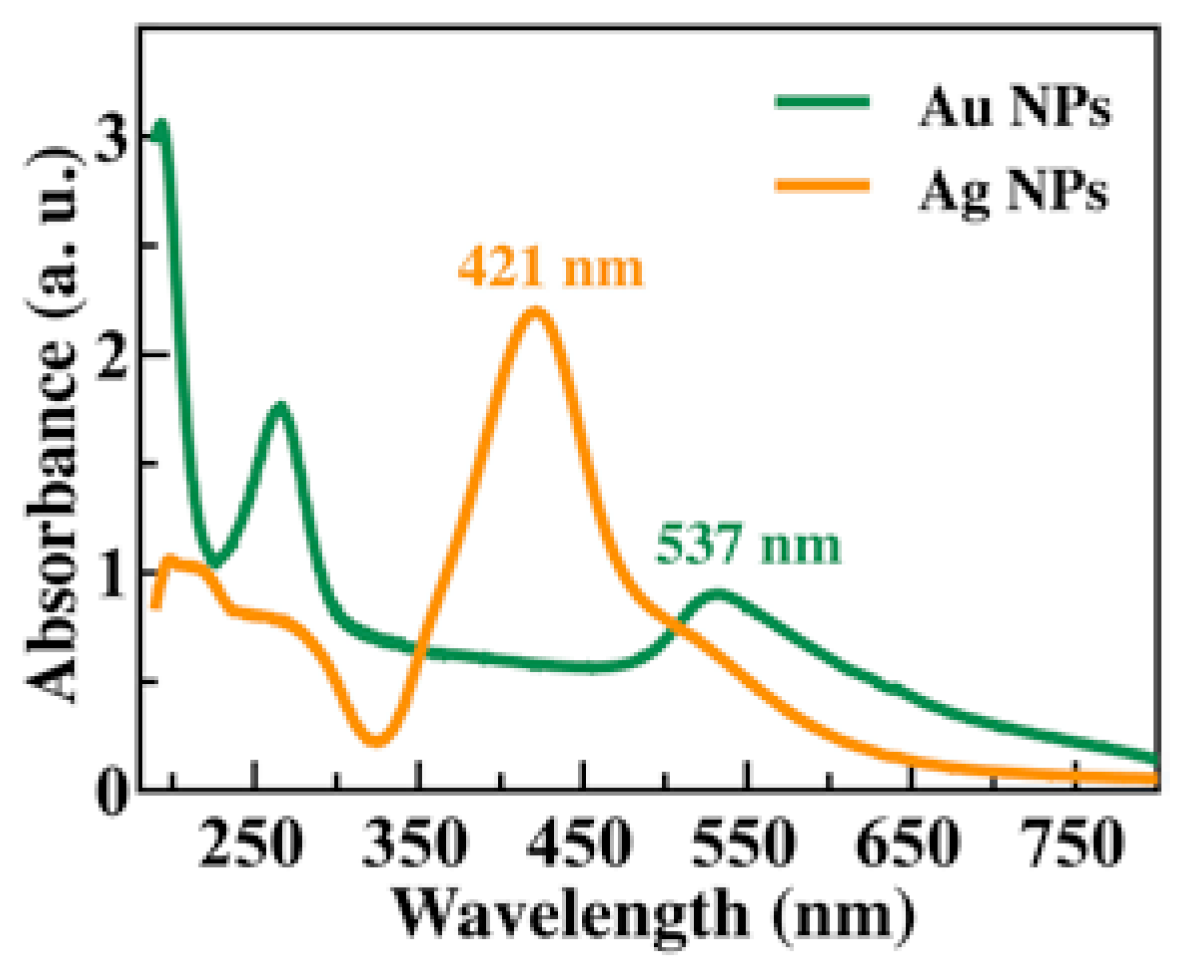
Figure 2.
(a) SEM micrograph and (b) size distribution of Au NPs supported on silicon wafers. Whereas (c) and (d) corresponds to Ag NPs.
Figure 2.
(a) SEM micrograph and (b) size distribution of Au NPs supported on silicon wafers. Whereas (c) and (d) corresponds to Ag NPs.
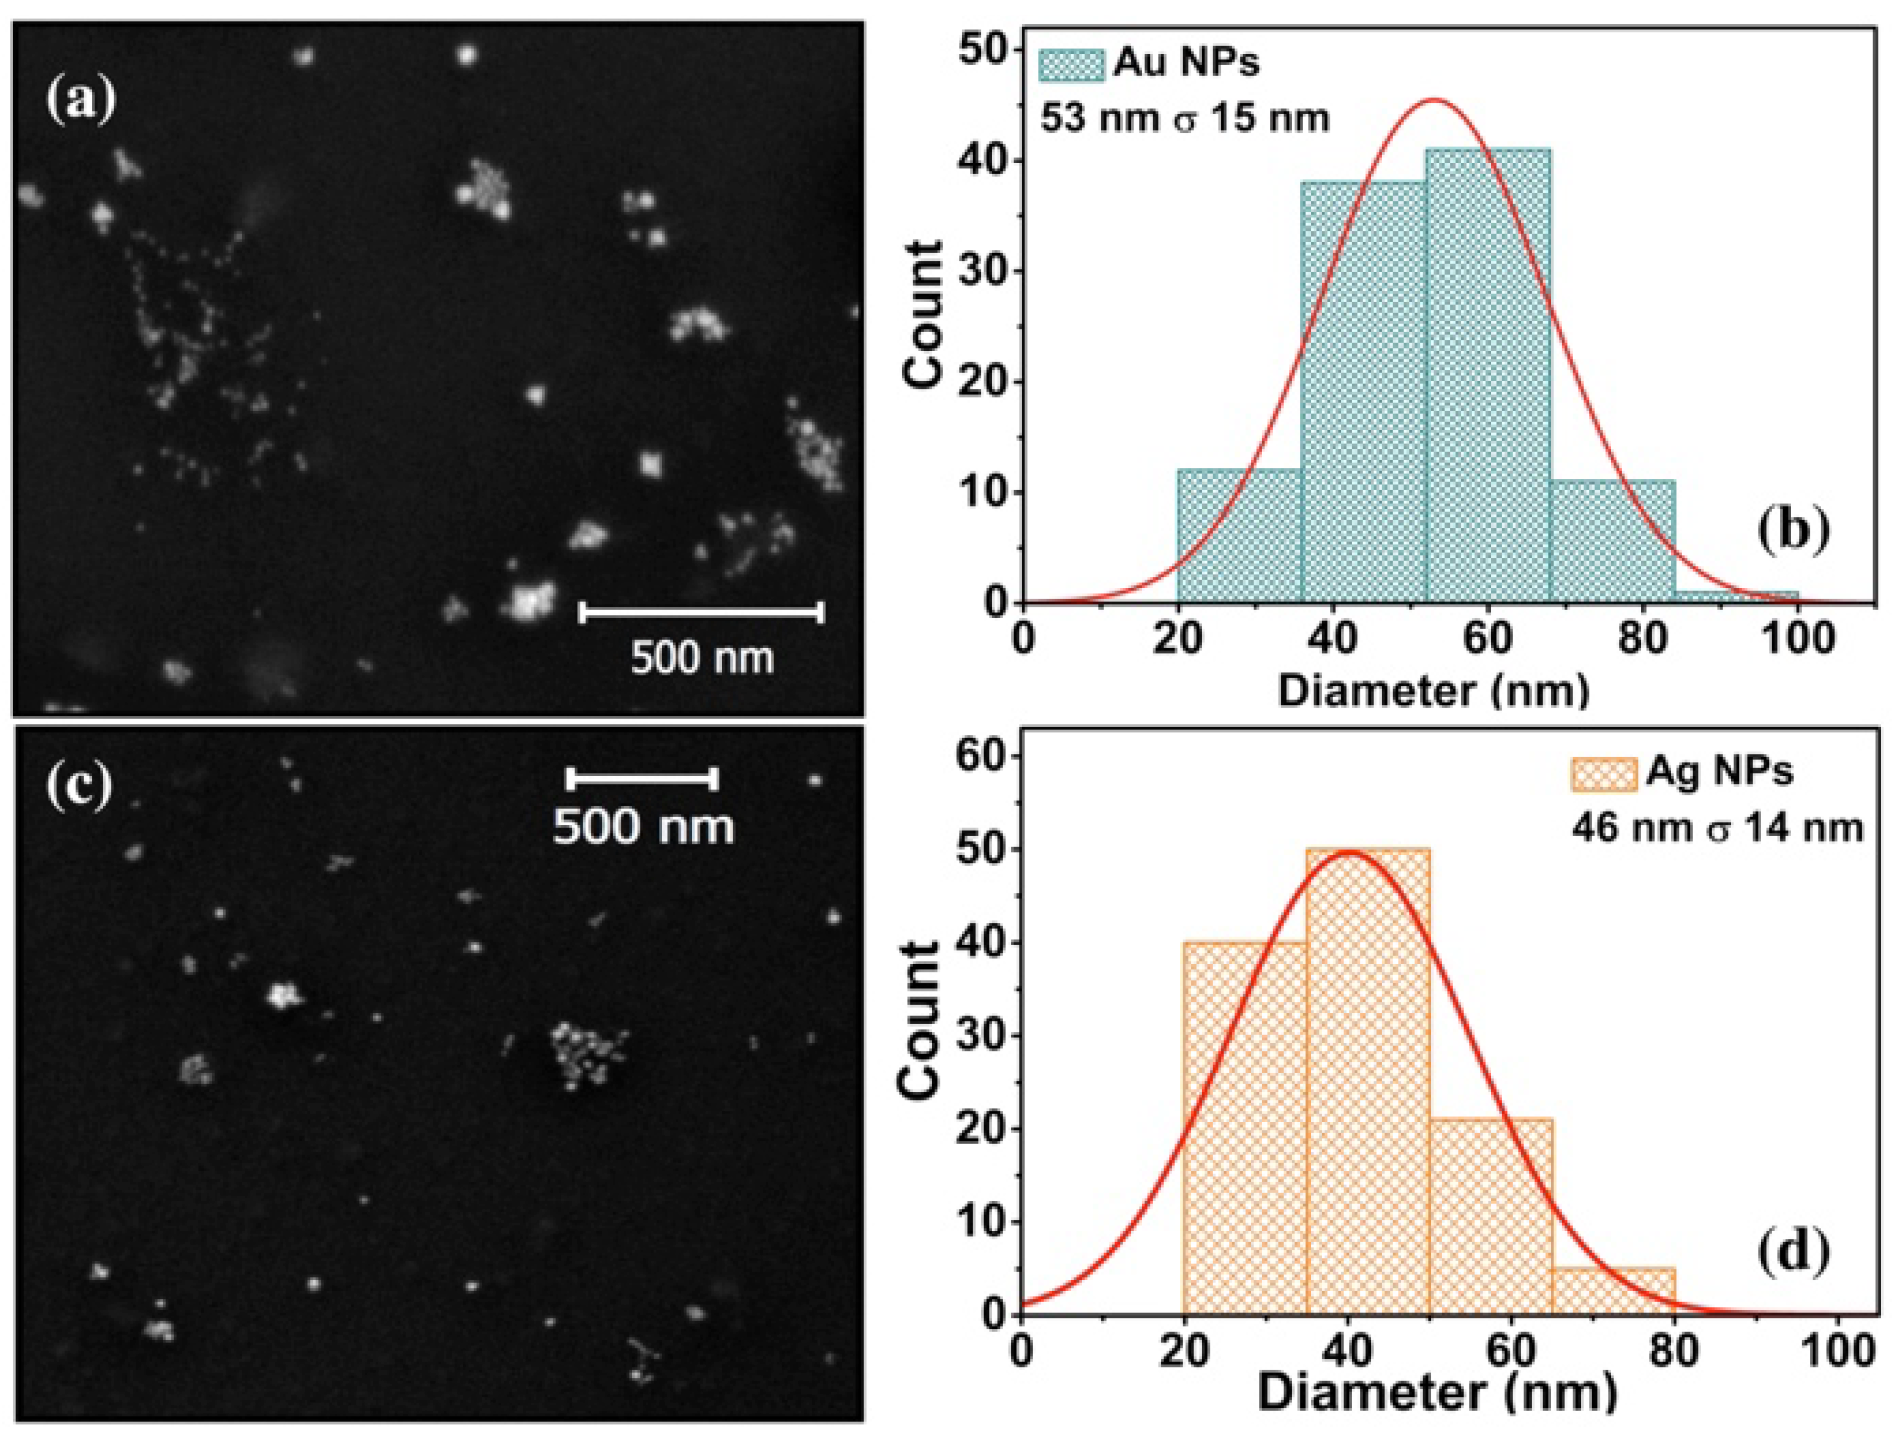
Figure 3.
Raman spectrum of T4 crystals.
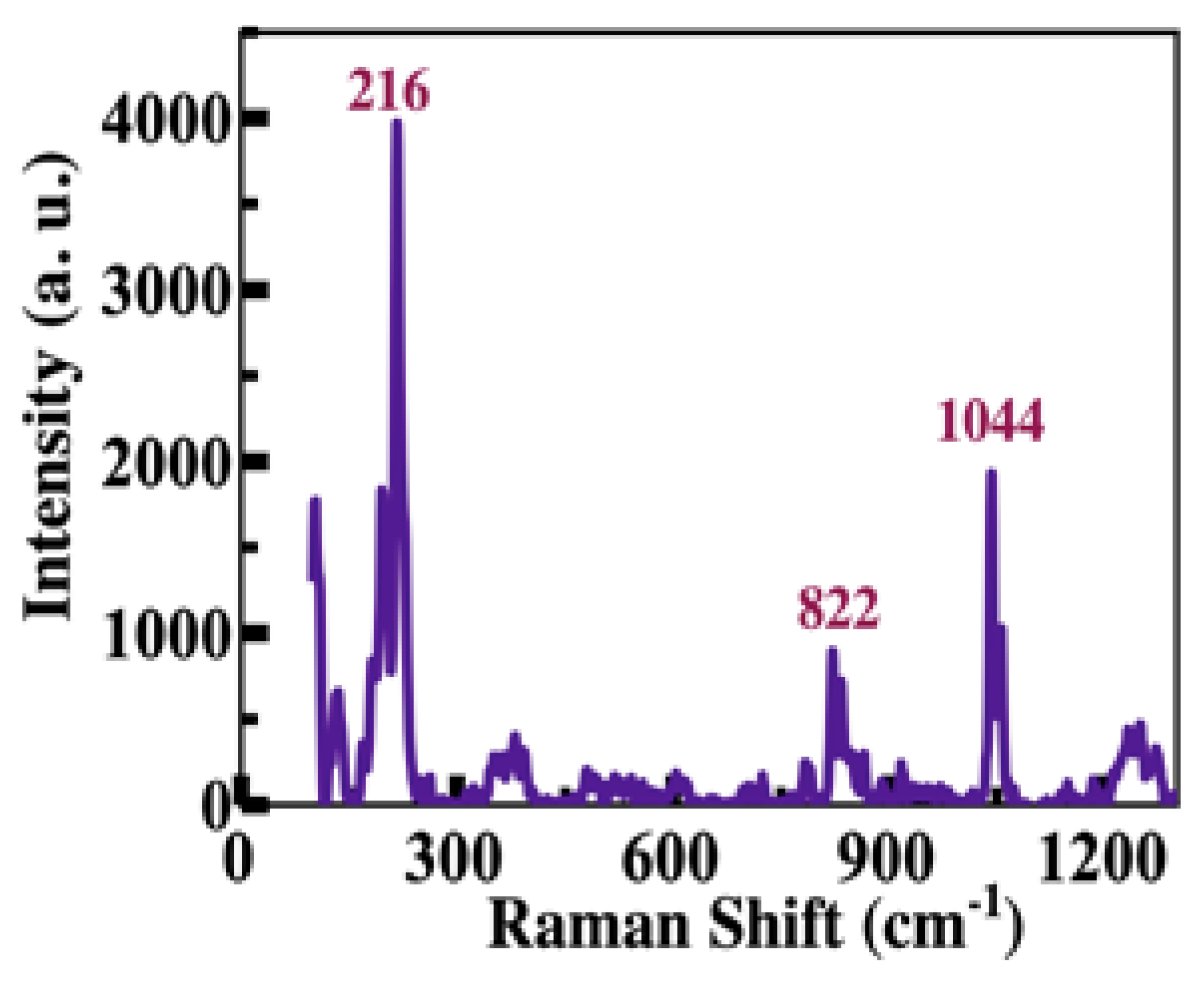
Figure 4.
Raman spectra (a) of the silicon wafer (black line), (b) of T4 at a concentration of 1 mM deposited on the silicon wafer (red line), (c) of T4 on Au NPs (blue line), and (d) of T4 on Ag NPs (orange line). The orange and blue spectra were measured on Si wafers.
Figure 4.
Raman spectra (a) of the silicon wafer (black line), (b) of T4 at a concentration of 1 mM deposited on the silicon wafer (red line), (c) of T4 on Au NPs (blue line), and (d) of T4 on Ag NPs (orange line). The orange and blue spectra were measured on Si wafers.
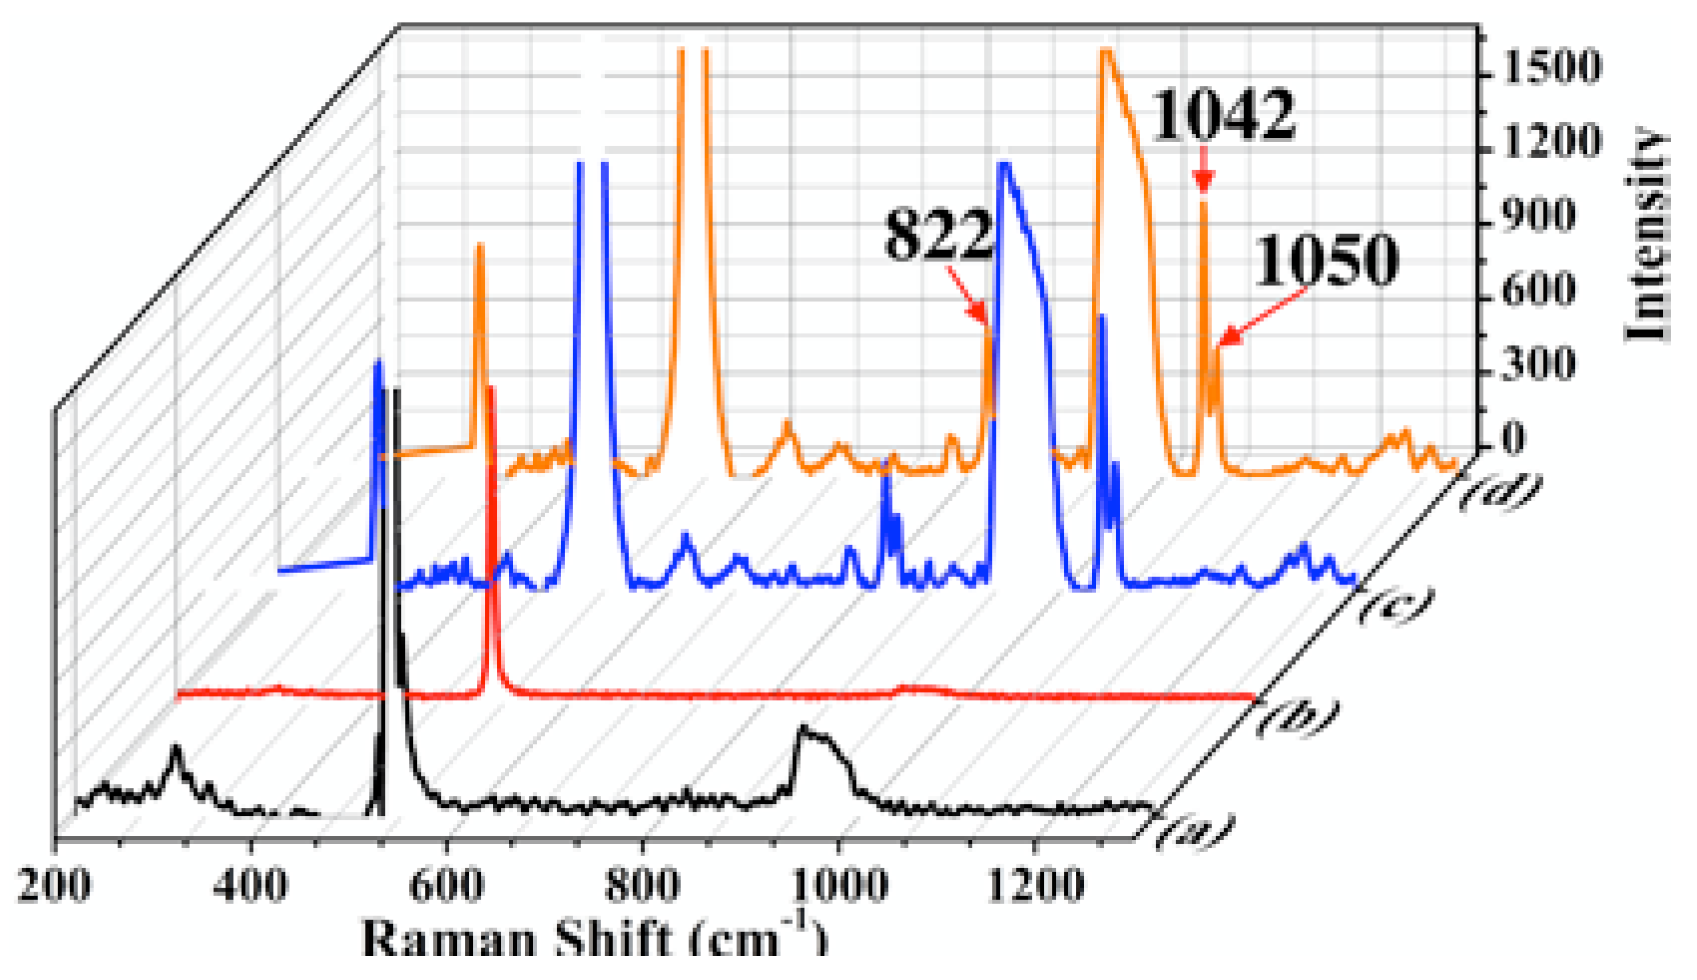
Figure 5.
Raman band of T4 at 1042 and 1050 cm-1 using SERS substrates of (a) Au NPs and (b) Ag NPs; in both cases, different concentrations of T4 were monitored.
Figure 5.
Raman band of T4 at 1042 and 1050 cm-1 using SERS substrates of (a) Au NPs and (b) Ag NPs; in both cases, different concentrations of T4 were monitored.
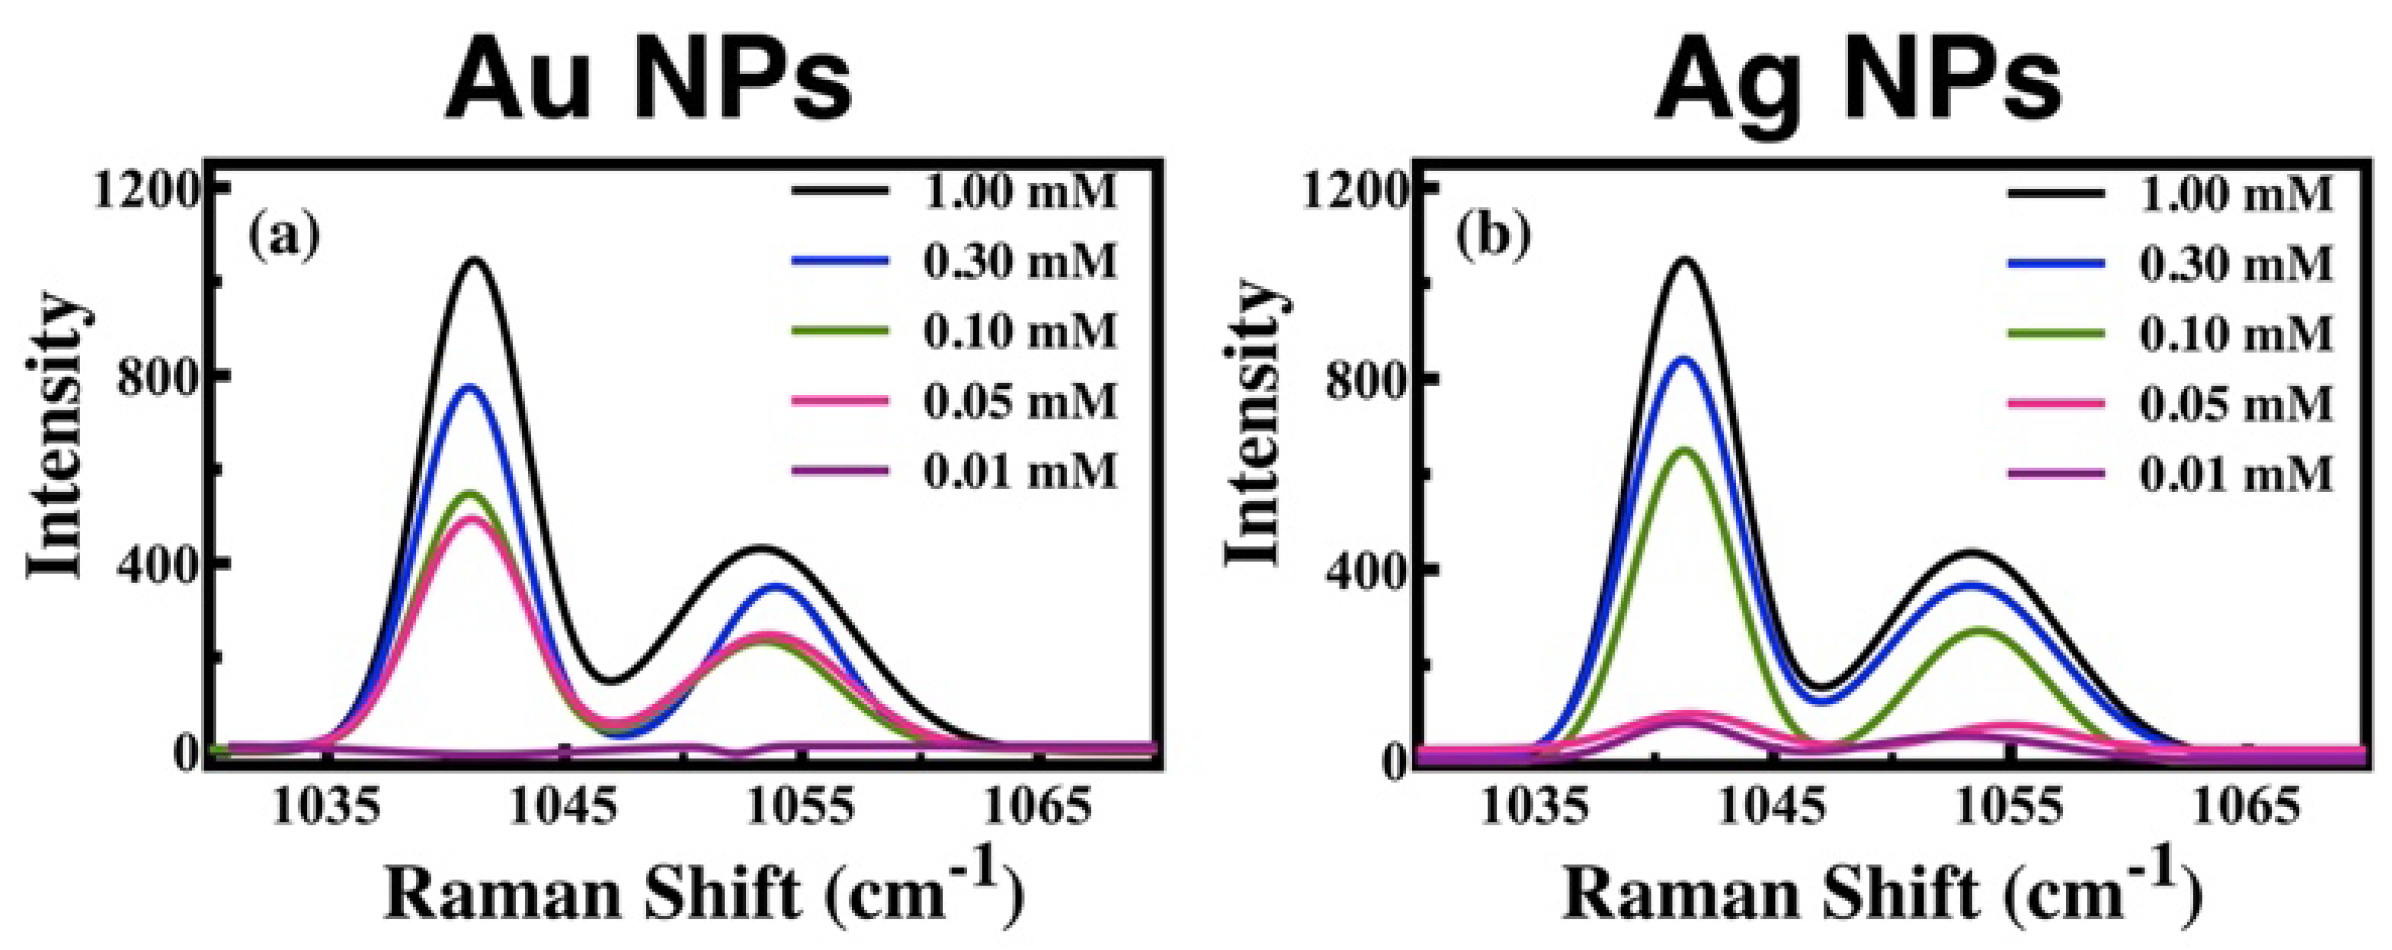
Figure 6.
Plots of (a) SERS-EF vs T4 concentration, and (b) Log10 (SERS-EF) vs T4 concentration. The Raman band at 1042 cm-1 and equation (1) were considered. Table of the .
Figure 6.
Plots of (a) SERS-EF vs T4 concentration, and (b) Log10 (SERS-EF) vs T4 concentration. The Raman band at 1042 cm-1 and equation (1) were considered. Table of the .
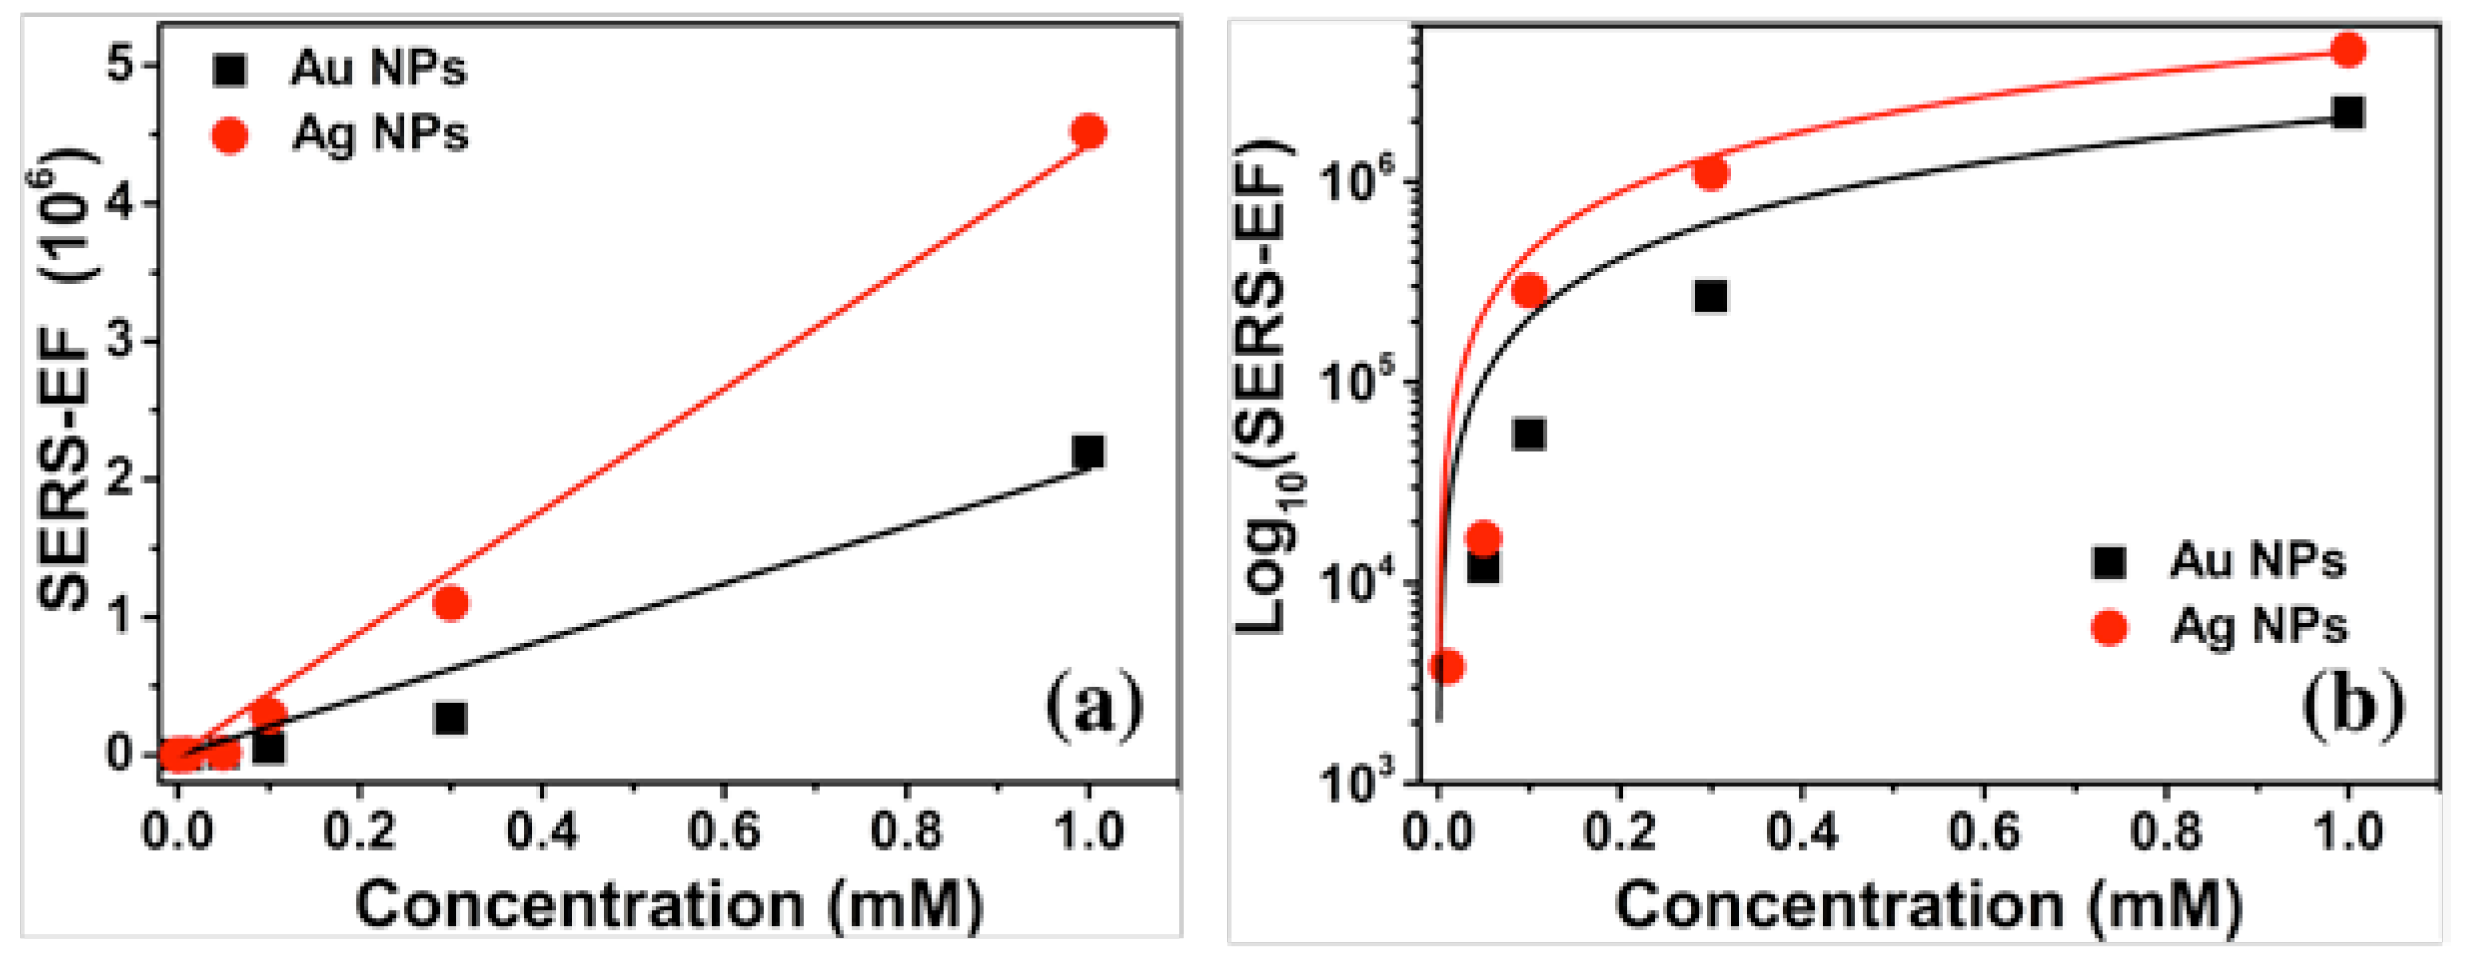
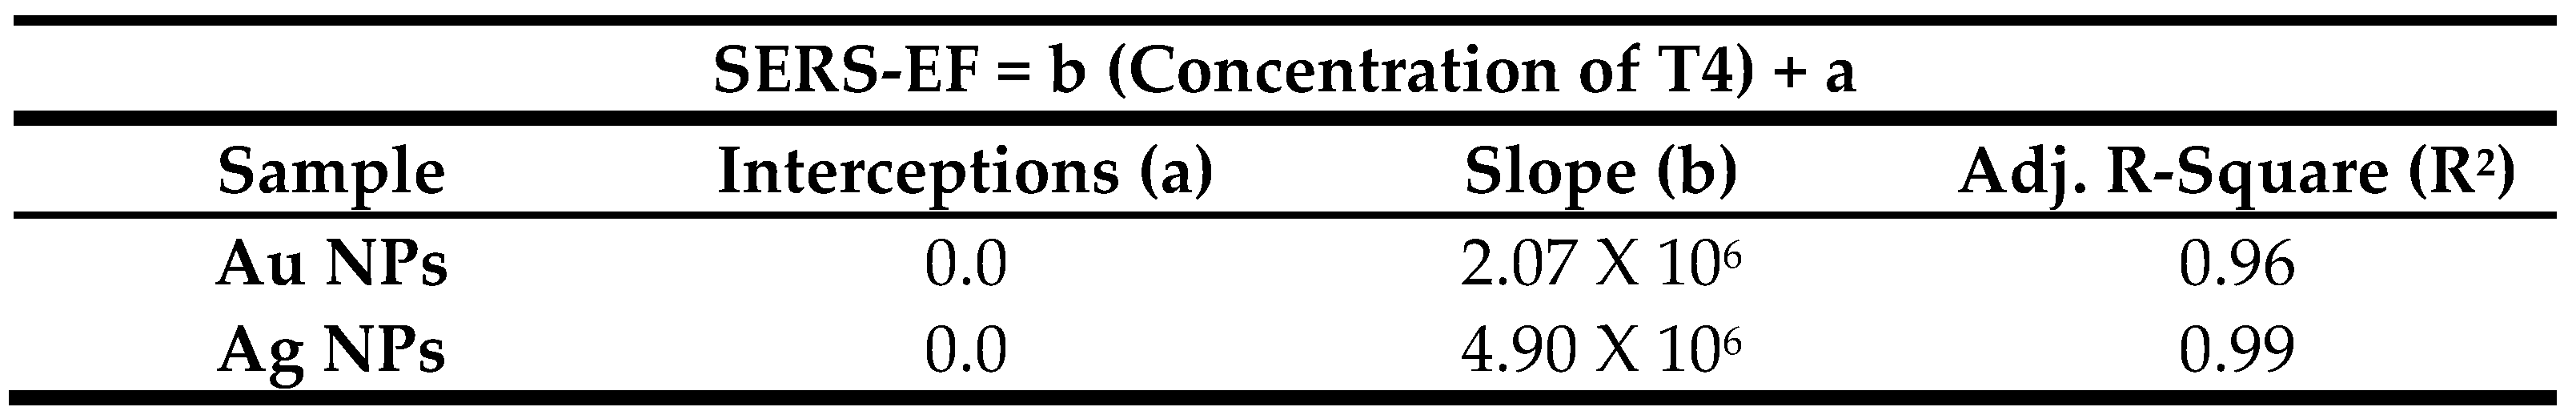
Figure 7.
(a) Electric field magnitude and (b) extinction efficiencies of a single NP, linear and triangular arrays. All the Au NPs are of 50 nm in diameter, and the surface-to-surface separation distance is 1 nm. The polarization state of the incident wave is parallel to the equator of the NPs (Y-axis) with a travel direction along X-axis. The incident wavelength is 632 nm for all cases (dashed line). The air is the surrounding medium.
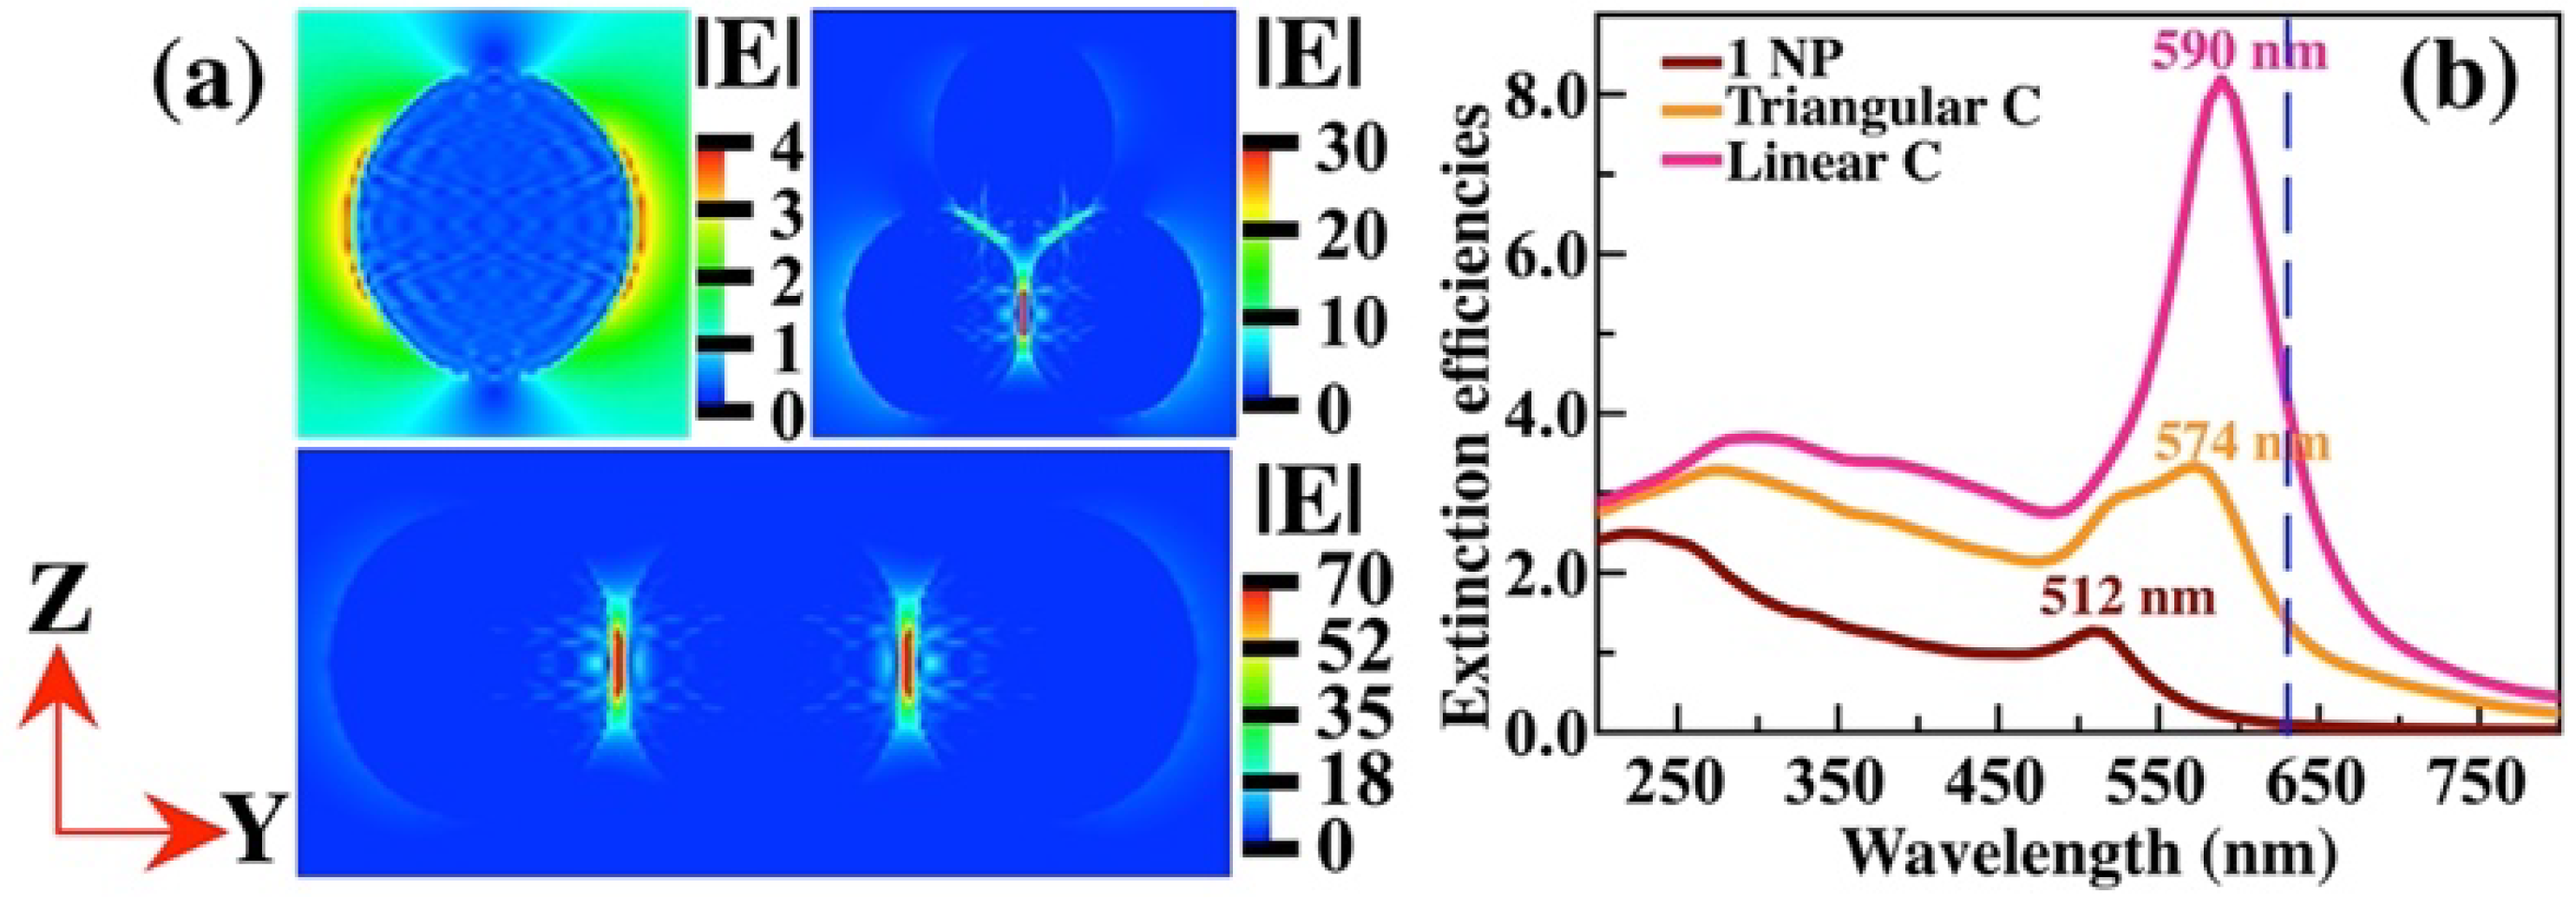
Figure 8.
(a) Electric field magnitude and (b) extinction efficiencies of a single NP, linear and triangular arrays. All the Ag NPs are of 50 nm in diameter, and the surface-to-surface separation distance is 1 nm. The polarization state of the incident wave is parallel to the equator of the NPs (Y axis) with a travel direction along X axis. The incident wavelength is 632 nm for all cases (dashed line). The air is the surrounding medium.
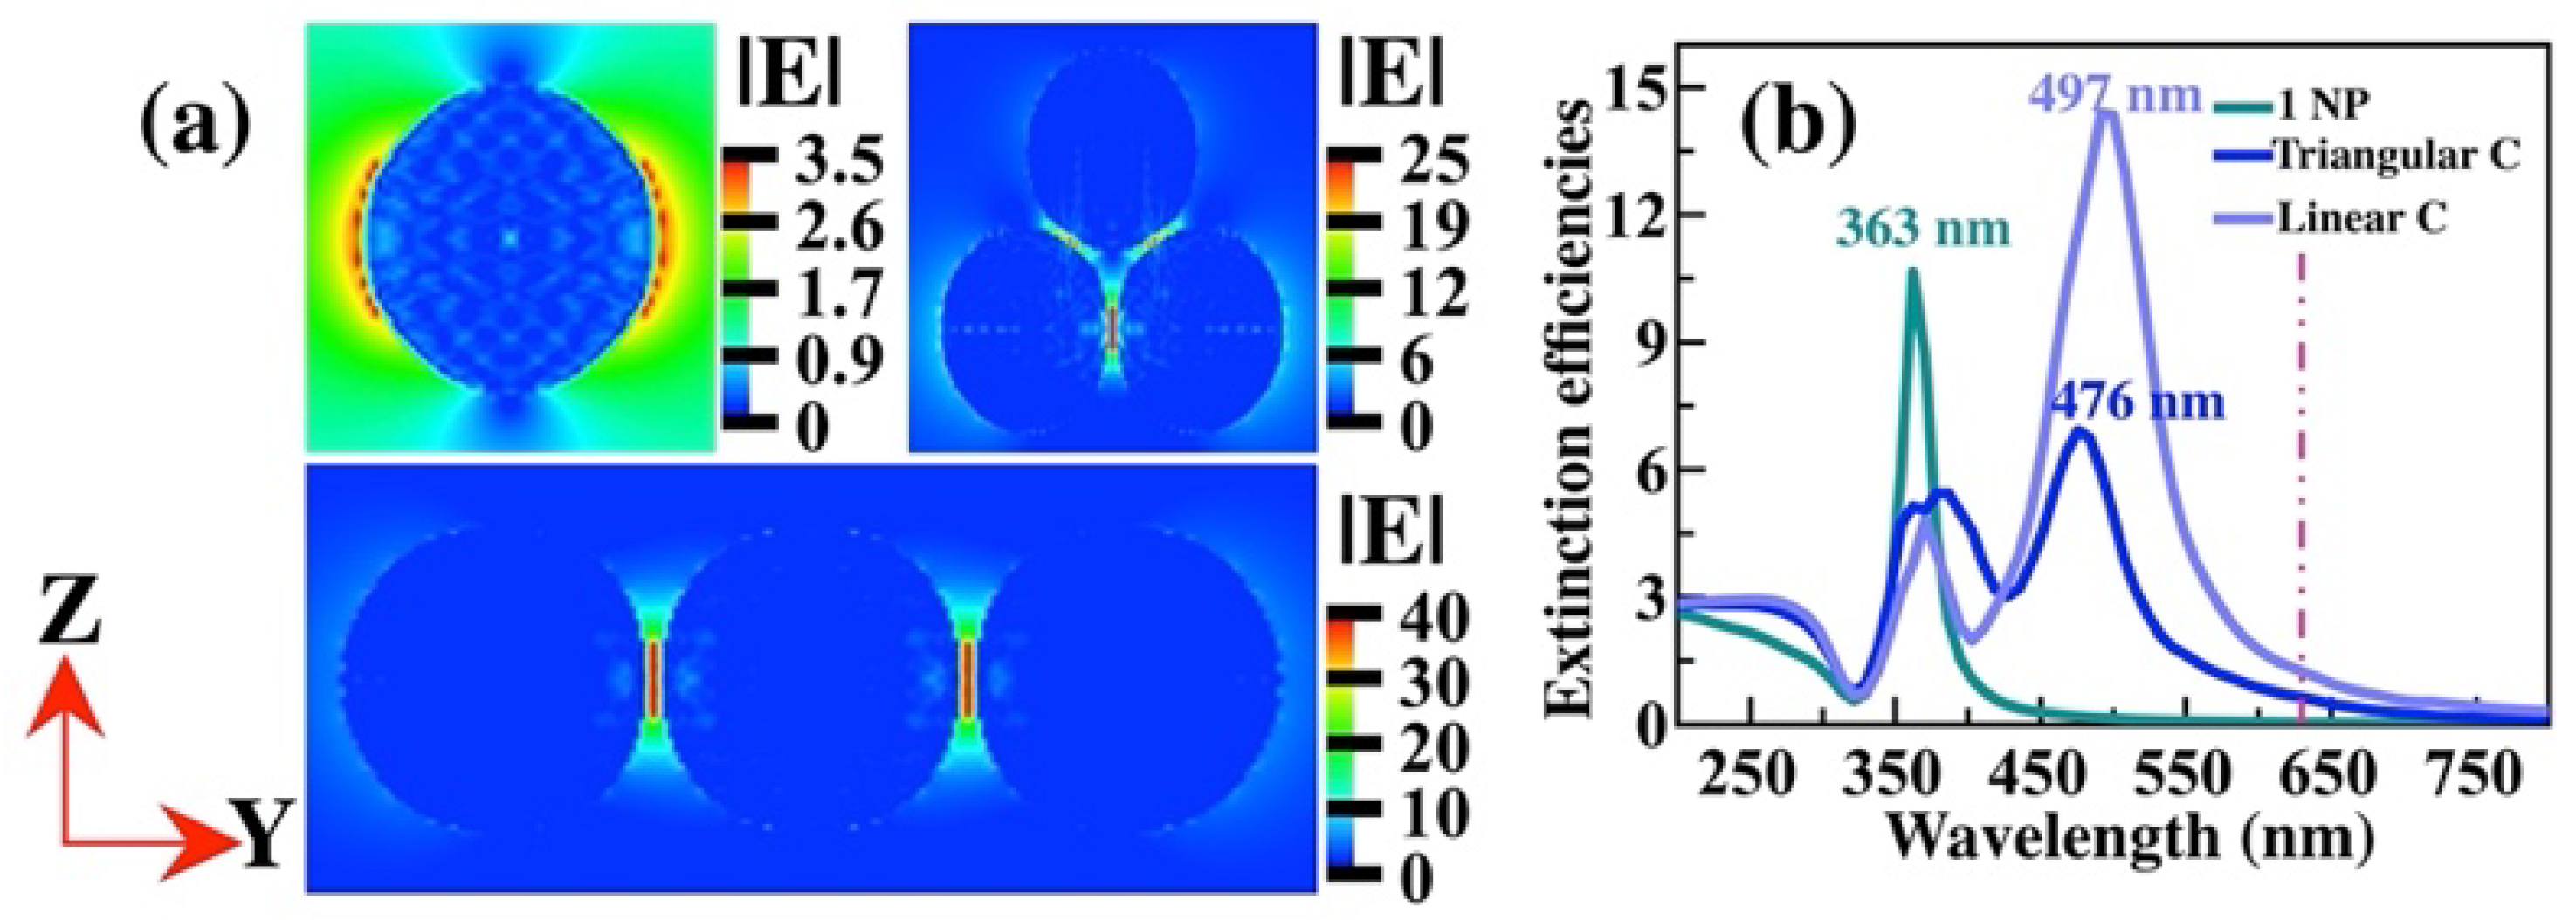

Table 1.
SERS-EF, intensity and the numbers of excited molecules of T4 of different concentrations.
| Au NPs | |||||
| T4 concentration | IRaman | ISERS | NRaman | NSERS | SERS-EF |
| 0.01 mM | 1 | 1 | 3.77 x10⁶ | 2.56 x10⁶ | 1.18 x10² |
| 0.05 mM | 1 | 478 | 1.88 x10⁸ | 2.56 x10⁶ | 1.20 x10⁴ |
| 0.10 mM | 1 | 516 | 3.78 x10⁸ | 2.56 x10⁶ | 5.49 x10⁴ |
| 0.30 mM | 1 | 739 | 1.13 x10⁹ | 2.56 x10⁶ | 2.68 x10⁵ |
| 1.00 mM | 1 | 1022 | 3.78 x10⁹ | 2.56 x10⁶ | 2.20 x10⁶ |
| Ag NPs | |||||
| T4 concentration | IRaman | ISERS | NRaman | NSERS | SERS-EF |
| 0.01 mM | 1 | 91 | 3.77 x10⁶ | 8.99 x10⁵ | 3.82 x10³ |
| 0.05 mM | 1 | 79 | 1.88 x10⁸ | 8.99 x10⁵ | 1.66 x10⁴ |
| 0.10 mM | 1 | 681 | 3.78 x10⁸ | 8.99 x10⁵ | 2.86 x10⁵ |
| 0.30 mM | 1 | 870 | 1.13 x10⁹ | 8.99 x10⁵ | 1.10 x10⁶ |
| 1.00 mM | 1 | 1073 | 3.78 x10⁹ | 8.99 x10⁵ | 4.52 x10⁶ |
Disclaimer/Publisher’s Note: The statements, opinions and data contained in all publications are solely those of the individual author(s) and contributor(s) and not of MDPI and/or the editor(s). MDPI and/or the editor(s) disclaim responsibility for any injury to people or property resulting from any ideas, methods, instructions or products referred to in the content. |
© 2023 by the authors. Licensee MDPI, Basel, Switzerland. This article is an open access article distributed under the terms and conditions of the Creative Commons Attribution (CC BY) license (http://creativecommons.org/licenses/by/4.0/).
Copyright: This open access article is published under a Creative Commons CC BY 4.0 license, which permit the free download, distribution, and reuse, provided that the author and preprint are cited in any reuse.


