
Submitted:
26 May 2023
Posted:
02 June 2023
You are already at the latest version
Abstract
With the growing popularity of smartphones, user identification has become an essential component of maintaining security and privacy. This study investigates how smartphone accelerometer data can be used to identify users, and it makes recommendations for the ideal application parts. Accelerometer data from the HMOG public dataset was used to train deep learning, conventional classifiers, and voting classifiers, which were then utilized to identify users. To enhance performance, feature selection and pre-processing techniques were researched. The results show that RFE feature selection outperforms other approaches and that LSTM followed by XGBoost has the best identification performance as indicated by a relatively large number of machine learning performance measures. The proposed identification system nevertheless performed well and outperformed existing methods, which were principally created and tested on the same HMOG public smartphone dataset, even with a larger number of users. Further work would be necessary for such an application to reach its full potential, though.
Keywords:
biometrics
; deep learning
; time series
; feature selection
; classification
; accelerometer
; Sustainability
1. Introduction
Smartphones have become an indispensable component of people’s lives, with a wide range of applications other than communication such as:
- GPS navigation systems [7].
- Document scanner, and imaging system: Smartphones can be used to scan QR Codes and image copy documents [8].
- Health and fitness: Most smartphones include built-in sensors that can be used with a wide range of applications for monitoring physical activity, and health [9].
- Electronic payments: Smartphones can be used to make mobile payments and conduct financial transactions [10].
With the growing popularity of smartphones, user identification has become an essential component of maintaining security and privacy. This research focuses on the use of the accelerometer data obtained by a smartphone for user identification. The accelerometer sensor in smartphones records the device’s movements and orientation, which can be used to develop personalized profiles for various users.
Less research has been done on the topic of identifying users using accelerometer mobile-phone data. Opposite to users authentication, which has a lot of research using accelerometer data as can be seen in the next section, presuming that each mobile phone has its own unique owner. This isn’t always the case, though; occasionally, several persons will use the same mobile device. Such scenarios include but are not limited to the use in education, sharing with friends and family, public use, business use, etc. For each of these scenarios, it’s crucial to implement the necessary security precautions to safeguard each user’s privacy and personal information.
The aim of this paper is to investigate the utility of accelerometer data in identifying users and offers insights into its potential applications. For this purpose, we used a number of machine learning methods to learn the accelerometer data of each user in order to identify them. These include a few chosen techniques from deep learning, traditional classifiers, and voting classifiers, all of which were trained using the HMOG public accelerometer dataset [18]. In addition, we investigate the use of some pre-processing methods to clean the data, and some feature selection methods to improve the performance of machine learning.
2. Related Work
Modern smartphones frequently contain inertial sensors like accelerometers, gyroscopes, and magnetometers, which motivates researchers interested in authentication and identity techniques to take into account secure, dynamic behavioral biometrics based on these sensors. This section presents a number of works that deal with behavioral biometric keys based on the data obtained from the aforementioned sensors.
An identification framework called ActID was presented by Sudhakar and his coworkers to identify a user based on hand movements made when the user is walking for 60 seconds on a flat surface. Activity sensors consisting of an accelerometer and gyroscope are placed on the wrist of the hand to collect data from 30 subjects over the course of two sessions. The sensors’ readings are subsequently sent through Bluetooth to a mobile phone [19]. The transmitted signals are then filtered and resampled using a linear interpolation method to replace missing data with the nearest value. Next, they extracted physical features like peak value as well as statistical features like mean, median, and variance. Then, they used Optimal Feature Evaluation and Selection (OFES) Ram et al. [20] to choose features of high quality, and Correlation-based Feature Subset Selection (CFSS) Hall [21] to choose features that are most closely related to the labeled class. The results of various standard classifiers, including KNN, Naive Bayes, and Random Forest, are then applied to a subset of features, and their performance is compared with that of the Sliding Window Voting classifier, which is based on the Support Vector Machine and performs 100% accuracy, outperforming the 97.98% accuracy of the standard Support Vector Machine classifier. The study, however, was hampered by the actuality of the data because it didn’t cover all user behaviors, and the training and testing data were gathered from the same users under the same circumstances and over the same length of time.
Cherifi and her coworkers proposed an effective continuous authentication technique based on users’ prehensile movements and modelled these movements through Hidden Markov Model-Universal Background Model (HMM-UBM) with continuous observations based on Gaussian Mixture Model (GMM) [22]. Two datasets are used: the first is the HMOG public dataset, and the second is a proprietary database. The dataset is then filtered using the obfuscation method, which multiplies the original signal of each of the three employed sensors by an offset value and adds new noise to the original signals. The sensor readings for each axis are then normalized by dividing their values by their magnitude and added as a fourth dimension. Multiple tests are conducted to determine the best window size, and a fixed sliding window is ultimately selected. The mean and standard deviation for each sensor axis and magnitude are the extracted features, resulting in a vector of twenty-four features. The proposed method achieved 19.2% Equal error rate (EER) on the HMOG dataset, and 14.8% EER on their second dataset. This study neglects to account for the class-imbalanced HMOG dataset and lacks other performance metrics like Area under the curve (AUC), Specificity, etc.
Sitova and coworkers introduced a Biometric Key Generation (BKG) function on HMOG paired with tap and keystroke that was extracted by an accelerometer, gyroscope, and magnetometer from 100 users while they were seated and moving about [23]. They extracted two types of features, the first type is known as grasp resistance, and it measures how quickly the phone moves and changes orientation in reaction to a tap gesture. The second type, known as grasp stability, measures how fast tap forces cause changes in movement and orientation. The extracted features for both types include sensor reading on x, y, and z, magnitude, start and end times of taps, stability after tap ends, and the average sensor reading in 100ms. Using a combined accelerometer and gyroscope data, they were able to get 13.62% EER on HMOG features. However, the EER dropped to 7.16% when they integrated HMOG, Tap, and Keystroke. Since HMOG is a class-imbalanced dataset, other metrics, such as the precision and recall of the minority class, must be used instead since their model is only evaluated using one metric (EER).
A study by Yoneda and coworkers provided a thorough investigation of mobile biometrics by evaluating nine sensors and 18 physical activities. The data was collected at a 20HZ by the accelerometer and gyroscope incorporated into inertial smartwatches and smartphones. About three minutes were spent performing each of the 18 activities by the 51 users who made up the study’s sample [24]. Every activity is split into eighteen instances with a defined window size of ten seconds that doesn’t overlap. For each instance for both sensors, the statistical features Average, standard deviation, Average Absolute Difference, Time between Peaks, Average Resultant Acceleration, Binned Distribution, Activity label, and subject ID are retrieved. KNN, Decision Tree, and Random Forest were investigated. The Accelerometer sensor combinations for both the watch and the phone, together with all other sensor combinations utilizing random forest with voting yielded the lowest EER for authentication of 9.3%. However, the authentication accuracy increased to 99.7% by combining random forest with voting based only on the Accelerometer of both the smartphone and smartwatch used.
An authentication approach based on a fingertip sensor device that collects motion data like angular velocity and acceleration as well as physiological data like a photoplethysmography (PPG) signal was presented by Wu and coworkers [25]. The compact and portable fingertip device has two sensor chips: the Flora chip detects movement and the Pulse Sensor Amped chip checks blood oxygen levels. As soon as it is worn, it starts capturing acceleration, angular velocity, and PPG signals. These data are then transmitted through Bluetooth to a computer. The data was collected from 40 subjects, who agreed to wear the fingertip device while performing three actions—slow walking, sitting, and performing rather hard movements—for 20 repeats (each repetition lasting 12 seconds) over the course of 30 days. They used a fourth-order Chebyshev low-pass filter with a cutoff frequency of 5 Hz to decrease the noise in the data. Then, a peak detection method is used to extract the periodicity of PPG signals, and a Fixed-size Sliding Window (FSW) ranging from 2s to 12s with 20% overlap is applied to extract the statistical features, which were divided into three categories: time-domain, frequency-domain, and wavelet-domain features. Then, they used the ReliefF algorithm [26] to determine the importance of features, choosing 90% of them that were more crucial for authentication. For activity recognition, the Decision Tree performed the lowest with an overall accuracy of 94.3%, while the KNN earned the best performance with 100% accuracy. With a false acceptance rate (FAR) of 4.69%, a false rejection rate (FRR) of 4.95%, and 98.74% accuracy, the walking state learned by the support vector machine (SVM) provided the best authentication performance.
The works of [27,28,29,30,31,32,33,34,35,36,37,38,39,40] are other examples of research that investigated the use of smartphone Accelerometer data for biometrics.
The bulk of previous research, as can be seen, only used one evaluation metric, leaving out crucial metrics like area under the curve (AUC), Index of Balanced Accuracy (IBA) [41], sensitivity, specificity, Gmean, and F-score. Furthermore, the majority of these studies relied on person authentication rather than identification, and when they addressed the issue of class imbalance, they employed the oversampling approach, which creates new examples based on their resemblance to the minority examples in question and assumes that they belong to the same class even though this is not always the case according to [42].
In this paper, we focused on these drawbacks and worked on person identification using a variety of widely used evaluation metrics, including AUC, IBA, Gmean, and F-score. Additionally, we look into the use of Extreme Gradient Boosting (XGBoost) [43], which has been recommended for the class imbalance problem [44], as well as other approaches like [45].
3. Materials and Methods
Data preparation, feature extraction, feature selection, and training/testing using a machine learning classifier are the four main components of the proposed identification system, as illustrated in Figure 1.
The proposed system leverages data obtained from the mobile accelerometer sensor, which is made up of a set of slender structures and is used for motion detection. These structures produce readings, which are then transmitted to the main circuit. Tri-axial accelerometers are sensors that approximate acceleration in the x, y, and z axes numerically. This information can be used to calculate velocity and displacement [46].
3.1. Dataset description
Hand Movement, Orientation, and Grasp HMOG [18,23], is a dataset of features captured from human interaction with smartphones like holds, taps, and grasps. Accelerometer, Gyroscope, and Magnetometer sensors were used to capture the subtle hand movements and orientation while users interact with their smartphones. The HMOG dataset was captured from 100 subjects (53 male and 47 female) over the course of eight sessions, with four sessions involving the participants writing a text of at least 250 characters while they were walking and the remaining four with the volunteers writing a text while sitting.
Data was collected using Android Samsung Galaxy S4 for all volunteers to record two types readings:
- Accelerometer, gyroscope, and magnetometer readings with a sampling rate of 100 HZ.
- Touch screen data like touch gestures, key press.
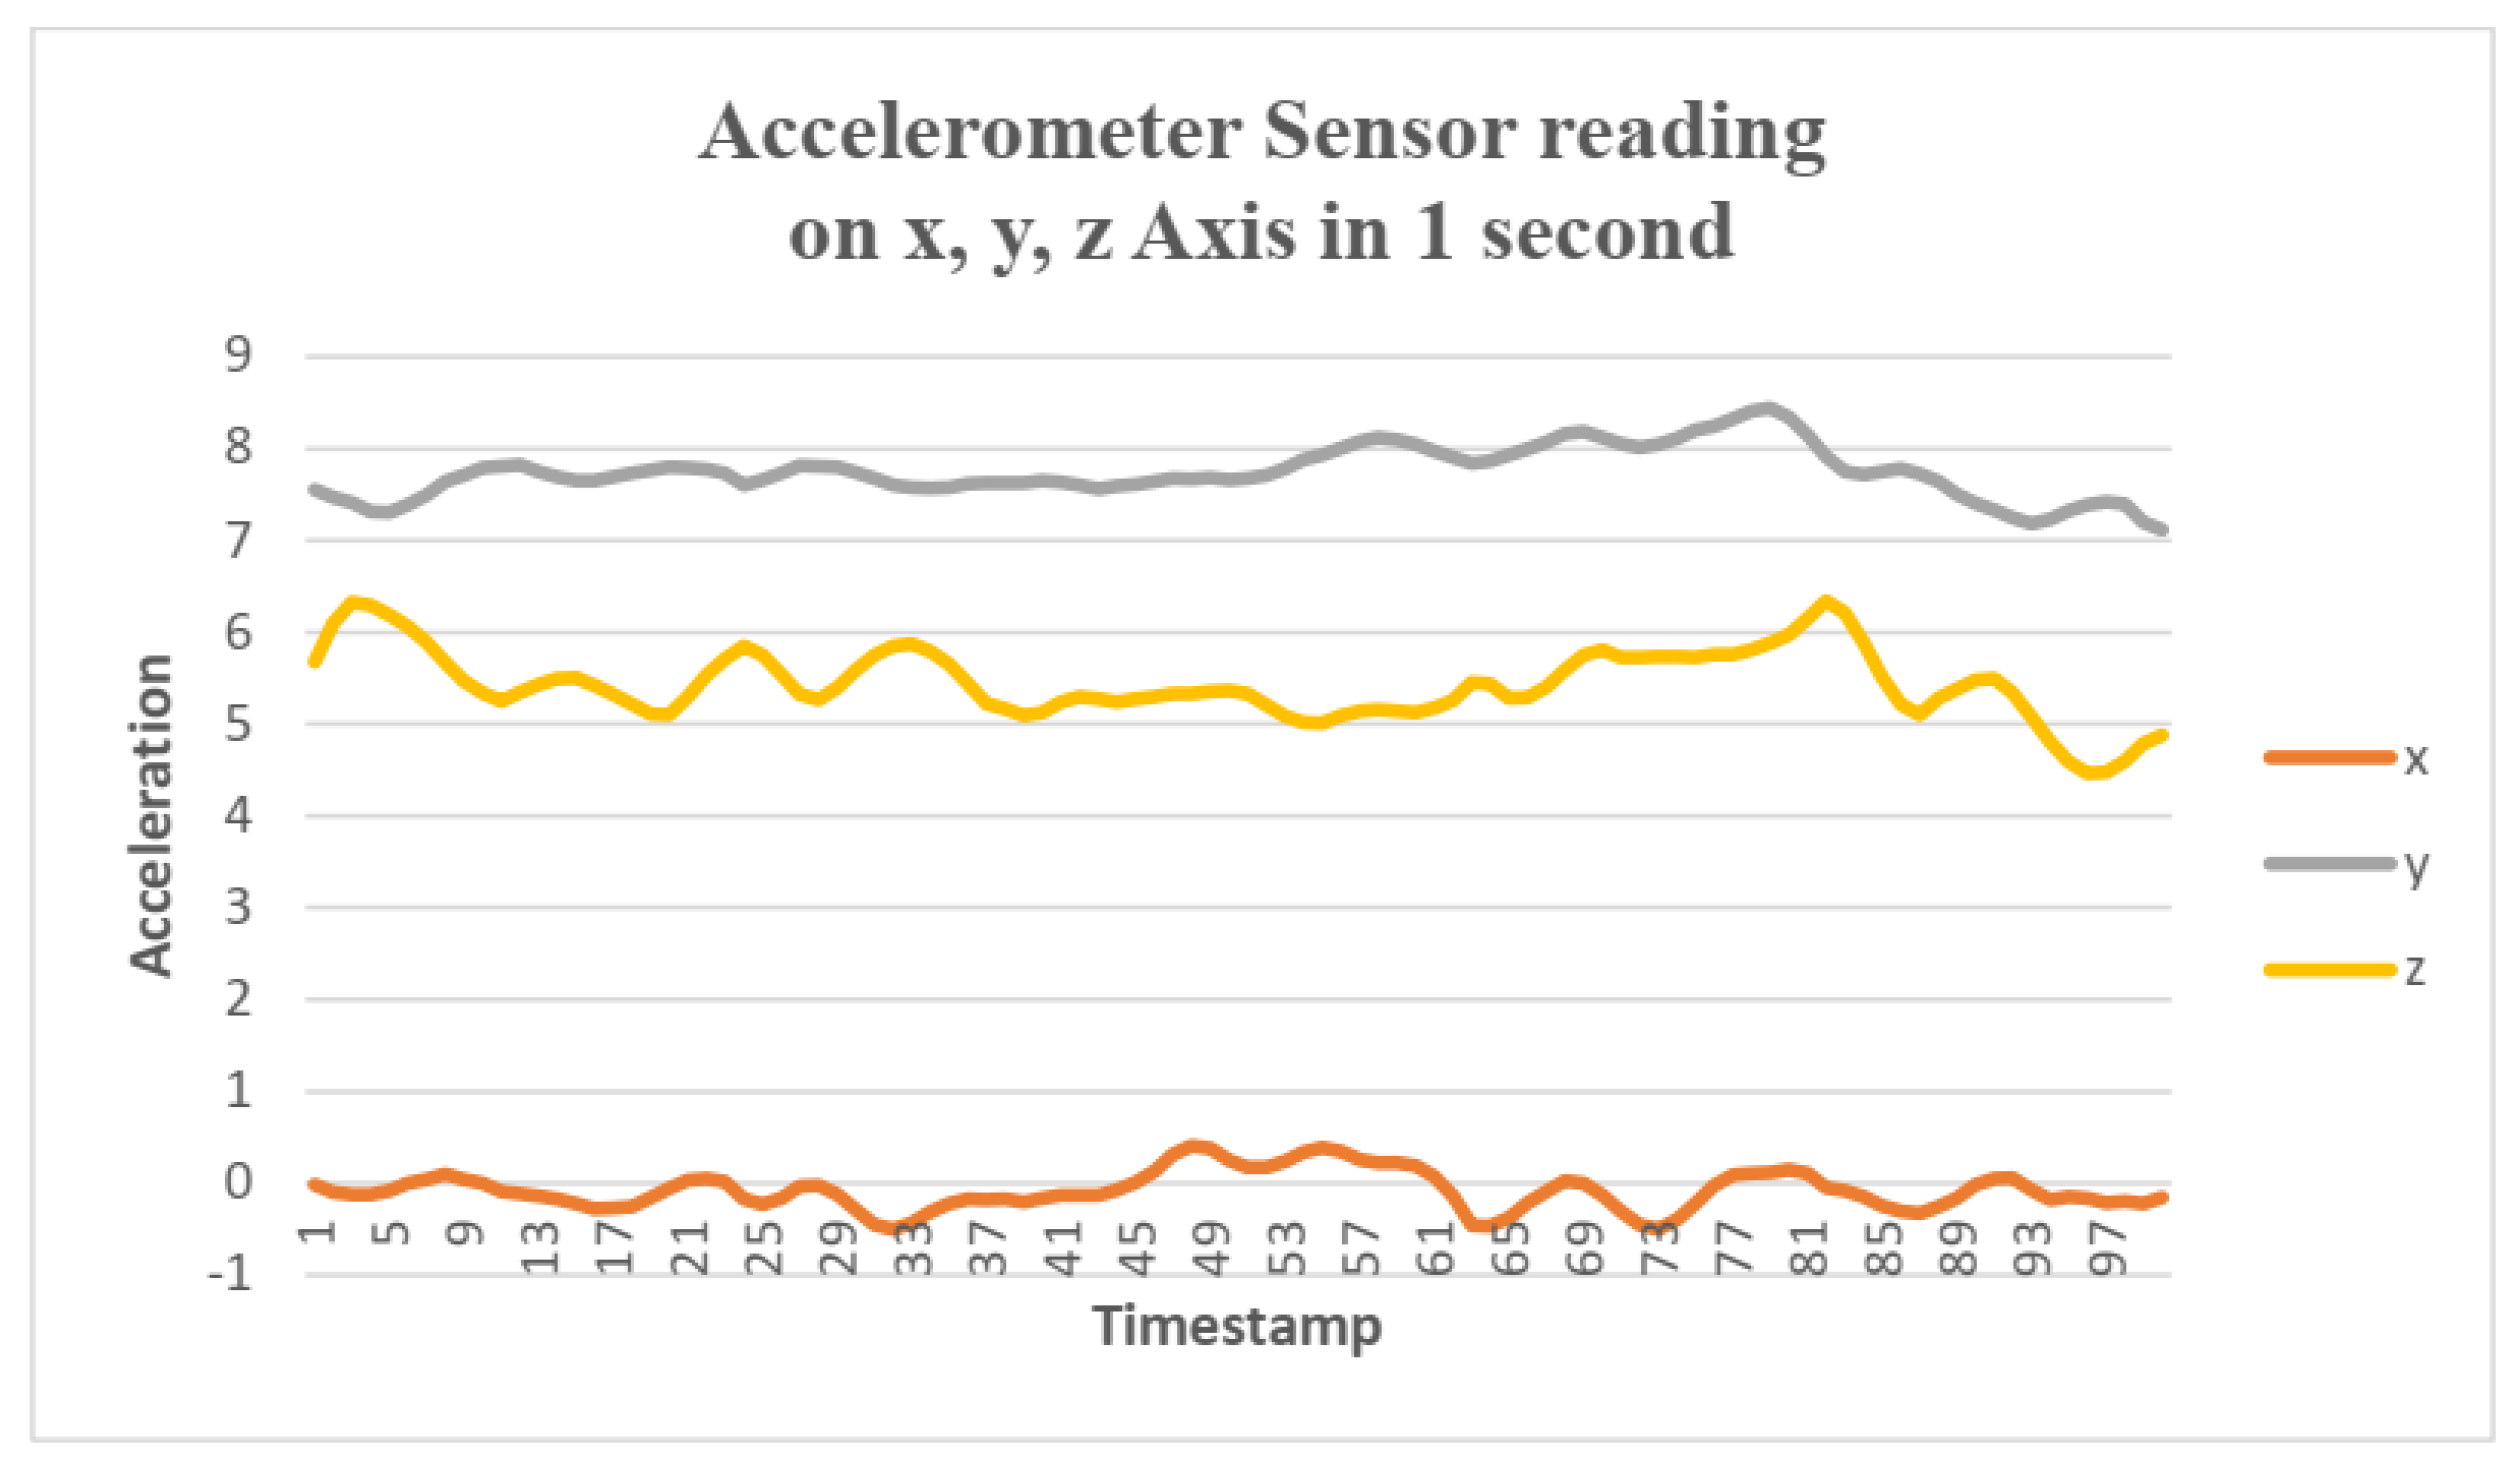
This study utilizes the data obtained from the Accelerometer sensor only to identify users. Figure 1 shows a sample of the Accelerometer sensor reading in one second, and Table 1 summarizes the dataset characteristics.
Figure 2.
Accelerometer sensor reading on three axes (x, y, and z) in one second.
3.2. Preprocessing
The goal of this step is to clean and prepare the sensor raw data so that the feature extraction process can make efficient use of it. Our preprocessing steps include calculating the magnitude of the three axes (x, y, and z) for each signal, bandpass filtering the data and utilizing an overlapping sliding window to extract the signal’s internal features. Equation 1 can be used to more easily and effectively calculate the magnitude of the x, y, and z vectors of the Accelerometer sensor than it is to calculate each axis separately.
where M is the magnitude, x,y, and z are the acceleration at a specific timestamp on the three-axis of the Accelerometer signal.
It is usually recommended to use a band-pass filter to reduce noise in a signal [47], although this largely depends on the amount of noise that may be present in the HMOG dataset. In this study, we tested two different scenarios, the first of which made use of a band-pass filter that was applied at low and high frequencies between 3 and 8 Hz, which corresponds to the acceptable range for human hand tremors [48]. The second Scenario is to omit this step in the event that the data is noise-free.
When employed for low-dimensional time-series data preprocessing, Overlapping Sliding Window delivers an increase in accuracy, latency, and processing cost, especially if the window size is small [49]. In order to improve accuracy, reduce feature extraction time, and give more comprehensive user data so the model can learn from them, we split each user signal into small segments in this study using the overlap sliding window technique. The window size was fixed at ten seconds (10 seconds * 100 samples per second = 1000 samples), as illustrated in Figure 3.
3.3. Feature Extraction
One of the most important processes in building a learned model is feature extraction since choosing the best features enables the model to train more smoothly and accurately differentiate between numerous classes. The Fast Fourier Transform (FFT) is used to transform the row magnitude signal from the time domain to the frequency domain for each sliding window. The statistical features we extracted from the resultant FFT signal and the pure Magnitude signal are listed in Table 2 and Table 3.
3.4. Feature Selection
A subset of features that are relevant from a vast number of features is chosen via a feature selection technique. The primary goal of this step is to improve the machine learning model’s assessment metrics by deleting unnecessary or redundant data. We experimented with a number of feature selection methods to assess and determine the most prevailing features. These methods include the Correlation coefficient, Fisher Score, Information Gain, and Recursive Feature Elimination (RFE). The chosen subsets of features from different techniques are tested using different classifiers. The outcomes of these experiments will be discussed in the next section.
The features that have a correlation coefficient greater than 0, as shown in Figure 4, were chosen for testing with various classifiers for identifying users. The outcomes of these tests were then compared to the results obtained from other feature selection methods and with the results obtained from all features under identical testing and classifier settings.
The Fisher score can also be utilized to determine the importance of features. A different subset of features of top importance (10, 20, and 30 features) are chosen and subjected to the same classifiers for identifying users. The results are compared to those produced by classifiers that utilize all features to determine which approach yields better results. Figure 5 shows the features with fisher score ranks.
The information gain is also investigated as a feature selection method in this study. Specifically, features with an information gain value greater than 0.1 and 0.15 are selected. The Information Gain of each feature is shown in Figure 6.
The ranking of features based on their importance is shown in Figure 7, as determined by the RFE, which eliminates the least important features Logistic Regression (LR) and Random Forest (RF) are the two models that are used to determine the importance of features. The effectiveness of this method is assessed by multiple classifiers, both with 10 and 20 features removed.
3.5. Class imbalance
As can be seen from Table 1, the HMOG is a class-imbalanced dataset. Usually, researchers opt for oversampling techniques that synthesize new examples for the minority classes/subjects (those having fewer Accelerometer signals) based on their similarity to the other examples belonging to the same class/subject. However, this assumption might be violated according to a recent study [42], and it is recommended to avoid such an approach, stressing the use of other re-sampling approaches such as the ensemble approach [45,50].
3.6. Machine learning classifiers
In order to determine the best option for the proposed identification system, a variety of traditional classifiers, voting classifiers, and deep learning are investigated. The traditional classifiers include Artificial Neural Networks (ANN), Decision Trees (DT), Random Forests (RF), Support Vector Machines (SVM), K-Nearest Neighbors (KNN), Logistic Regressions (LR), Stochastic Gradient Descents (SGD), and Gaussian Naive Bases (GNB).
The Voting classifier (VC) is an ensemble learning method that selects the class with the most votes among various classifiers as the prediction of the ensemble model. In this study, the voting classifier selects the most voted class among the top three traditional classifiers which are ANN, SVM, and RF.
The second voting classifier is the well-known XGBoost, a machine learning method that builds machine learning models using the gradient boosting framework, which is a common framework. The gradient boosting framework combines a number of decision trees, which are weak learners, to produce a strong learner that can predict outcomes accurately. The XGBoost entails successive iterations of adding new models to the ensemble and adjusting the weights of the data points based on the mistakes made by the prior models, this is vital for the missclassifications of the minority examples.
The Long Short Term Memory (LSTM) is used as a deep learning classifier which is a type of Recurrent Neural Network (RNN) that can process single and entire sequences of data.
4. Results
We conducted a set of experiments to look into various concerns in order to evaluate the proposed user identification system, including the following experiments:
- Comparisons of identification results on filtered and unfiltered signals to recommend the best alternative for the proposed system.
- Feature selection comparisons to identify what most effective attributes that can boost the identification metrics.
- Comparing classifier performance to determine the most suitable classifier and alternatives for the proposed system.
4.1. Filtered vs. Unfiltered Signals
In this set of experiments, 10 randomly chosen users were identified using their accelerometer signals using 8 conventional classifiers and 2 voting classifiers, with and without band-pass filtering. Figure 8 shows the classifiers’ highest levels of accuracy. This figure illustrates how significantly filtering the HMOG data reduces the performance of the identification process, giving the impression that the data is not noisy and does not require filtering because doing so would result in the loss of some crucial information from the original accelerometer signal, as the desired information is sacrificed in order to reduce noise. This is also supported by many studies such as [52] and Figure 9, which depicts the AUC of identifying 10 users using RF classifier.
As demonstrated in Table 4, unfiltered data is better for identification not only in terms of identification accuracy but also in terms of other crucial metrics like Precision (PRE), Recall (REC), Specificity (SPE), F-score (F1), Geometric Mean (GEO), and Index of Balanced Accuracy (IBA).
4.2. Feature selection Results
We used ANN, RF, SVM, VC, and XGBoost to evaluate the impact of certain standard feature selection methods, including correlation coefficients, information gain, Fisher score, and RFW, as they achieved the most favorable outcomes in the previous set of assessments. The identification accuracy of several scenarios, where various subsets of features were picked using various selection approaches, is shown in Table 5. In general, while utilizing no feature selection approach, the identification accuracy reported by all classifiers examined was higher. However, all classifiers showed accuracy results when utilizing RFE that were comparable to those achieved when the classifiers were applied to all features, especially when using subgroups of 20, or 30. Evidently, the accuracy score increased as the number of features increased, demonstrating that the statistically extracted features contribute well to class distinction.
4.3. Classifiers comparisons
We use a reasonably big number of metrics in order to determine the best possible classifier for the proposed identification system, as each has its own strengths and weaknesses. For example, The measures that are most frequently used to evaluate the performance of classification algorithms are accuracy, precision, sensitivity, and specificity [53]. These metrics, however, are not enough for classifier evaluation in class imbalanced learning and are susceptible to data distribution [54]. On the other hand, the true negatives and classes’ contributions to overall performance are not taken into consideration by GEO and F1 [41], however, because they are less influenced by the majority classes in the imbalanced data, they are beneficial evaluation measures for the performance of different machine learning methods [55]. The IBA metric combines a measure of how dominating the class with the highest individual accuracy rate is with an unbiased index of its overall accuracy [41]. Previous studies indicated that all performance metrics, with the exception of the AUC, were weakened by skewed data distributions [56,57,58]. For these reasons, we selected the AUC in addition to the aforementioned metrics to get a better insight into the performance of the proposed identification system using a specific classifier.
The highlighted values in Table 6 show the best results of different metrics obtained after applying all classifiers employed to identify 10 users based on their accelerometer signals obtained from the original HMOG dataset without filtering. The LSTM deep learning model had the best performance, scoring 89% overall accuracy, 89% precision, 89% recall, 99% specificity, 88% f1-score, 93% Gmean, 86% IBA, and 99% AUC. The XGBoost classifier came in second, scoring 88% overall accuracy, 88% precision, 88% recall, 99% specificity, 88% f1-score, 93% Gmean, 86% IBA, and 99% AUC.
Given that the HMOG is a class-imbalanced dataset, XGBoost’s successful performance may be explained by its capacity to modify the training process to place a greater emphasis on the misclassification of the minority class in such datasets. [44,51]. Based on the results shown in Table 6, apparently, The LSTM is the best choice for the proposed identification system, because it effectively addresses the vanishing gradient and long-term dependency issues and concentrates on the pertinent time series data [59,60]. Figure 10 shows the accuracy and loss curves during the training of the LSTM model on 10 users.
It is important to note that all machine learning methods tested in all experiments used a 5-fold cross-validation approach with their own default parameters.
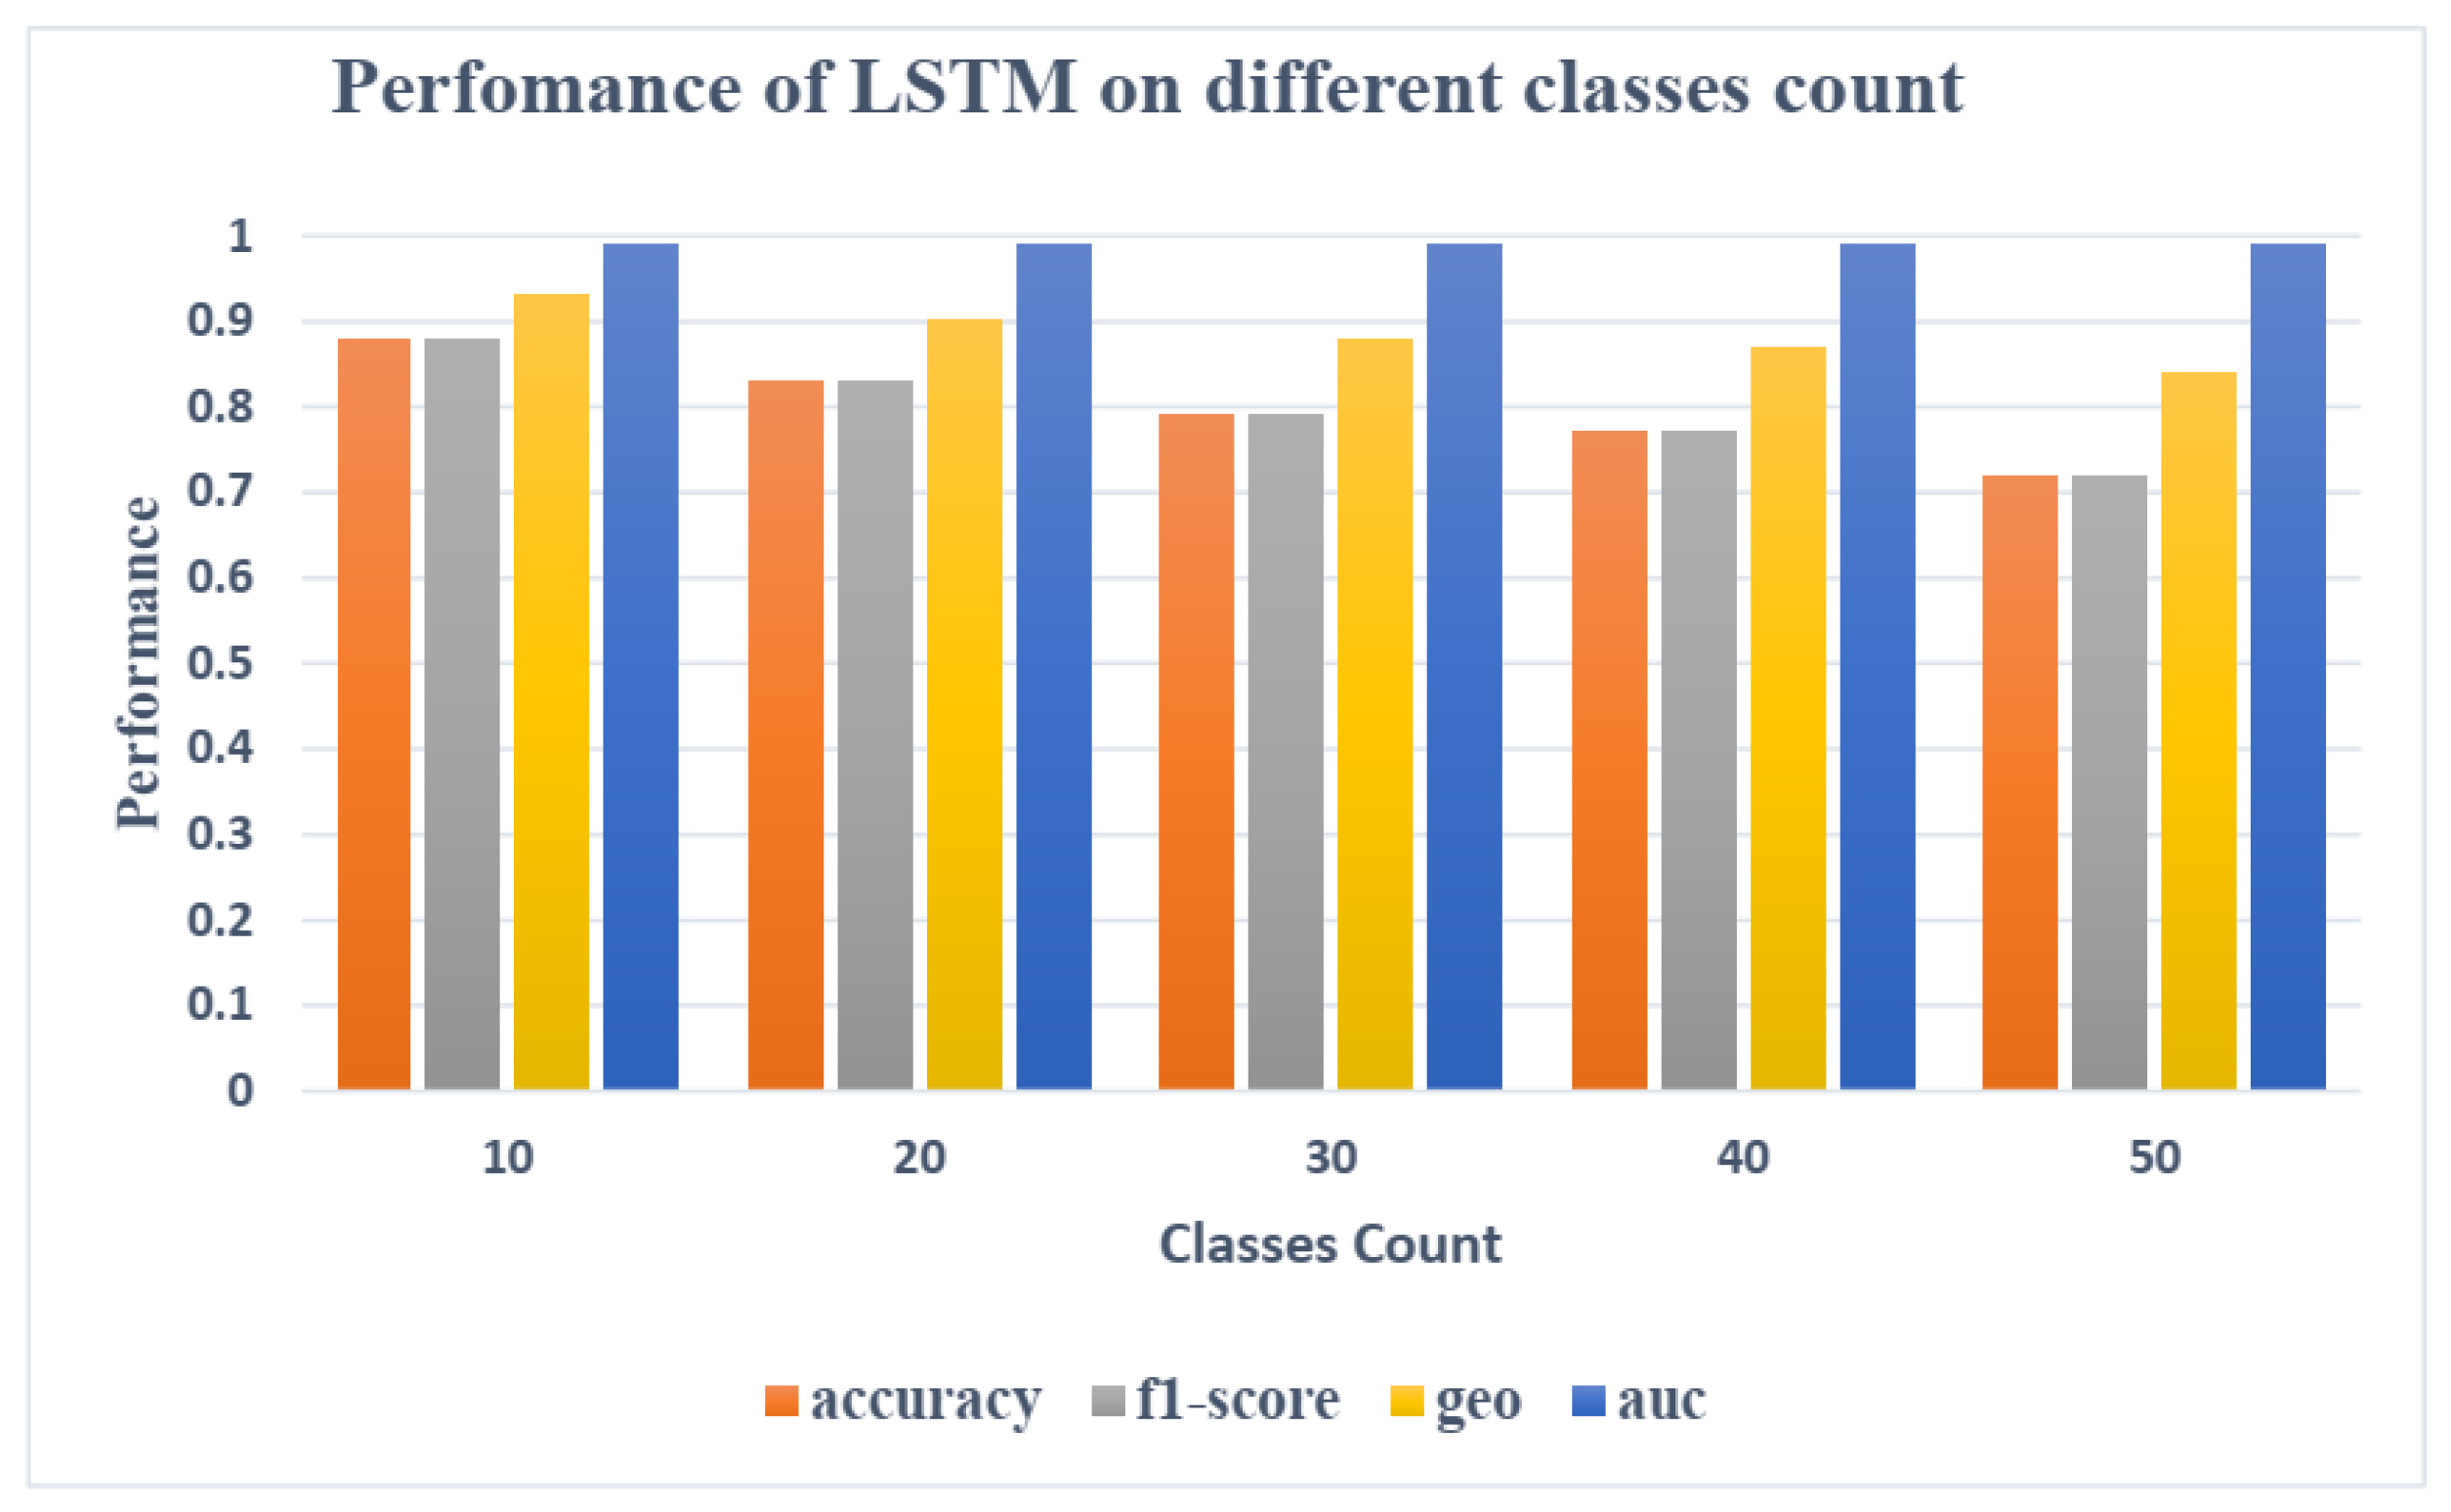
Almost similar results were obtained when we increase the number of users to 20, 30, and 40, Figure 11 shows that AUC maintains its value despite the increase in class numbers. The F1-score and Gmean were also found to be less affected by the number of classes since they are computed for each class and then averaged over all classes, so they are less influenced by the number of classes than, for example, Accuracy and other metrics as shown in Figures 4.5 and 4.6, which illustrate the performance of the two top classifiers, XGBoost and LSTM respectively, using four metrics (Accuracy, F1-score, Gmean, and AUC) for identifying varying numbers of users (10, 20, 30, 40 and 50).
Figure 11.
AUC results of identifying (a) 10 users (b) 20 users(c) 30 users, and (d) 40 users.
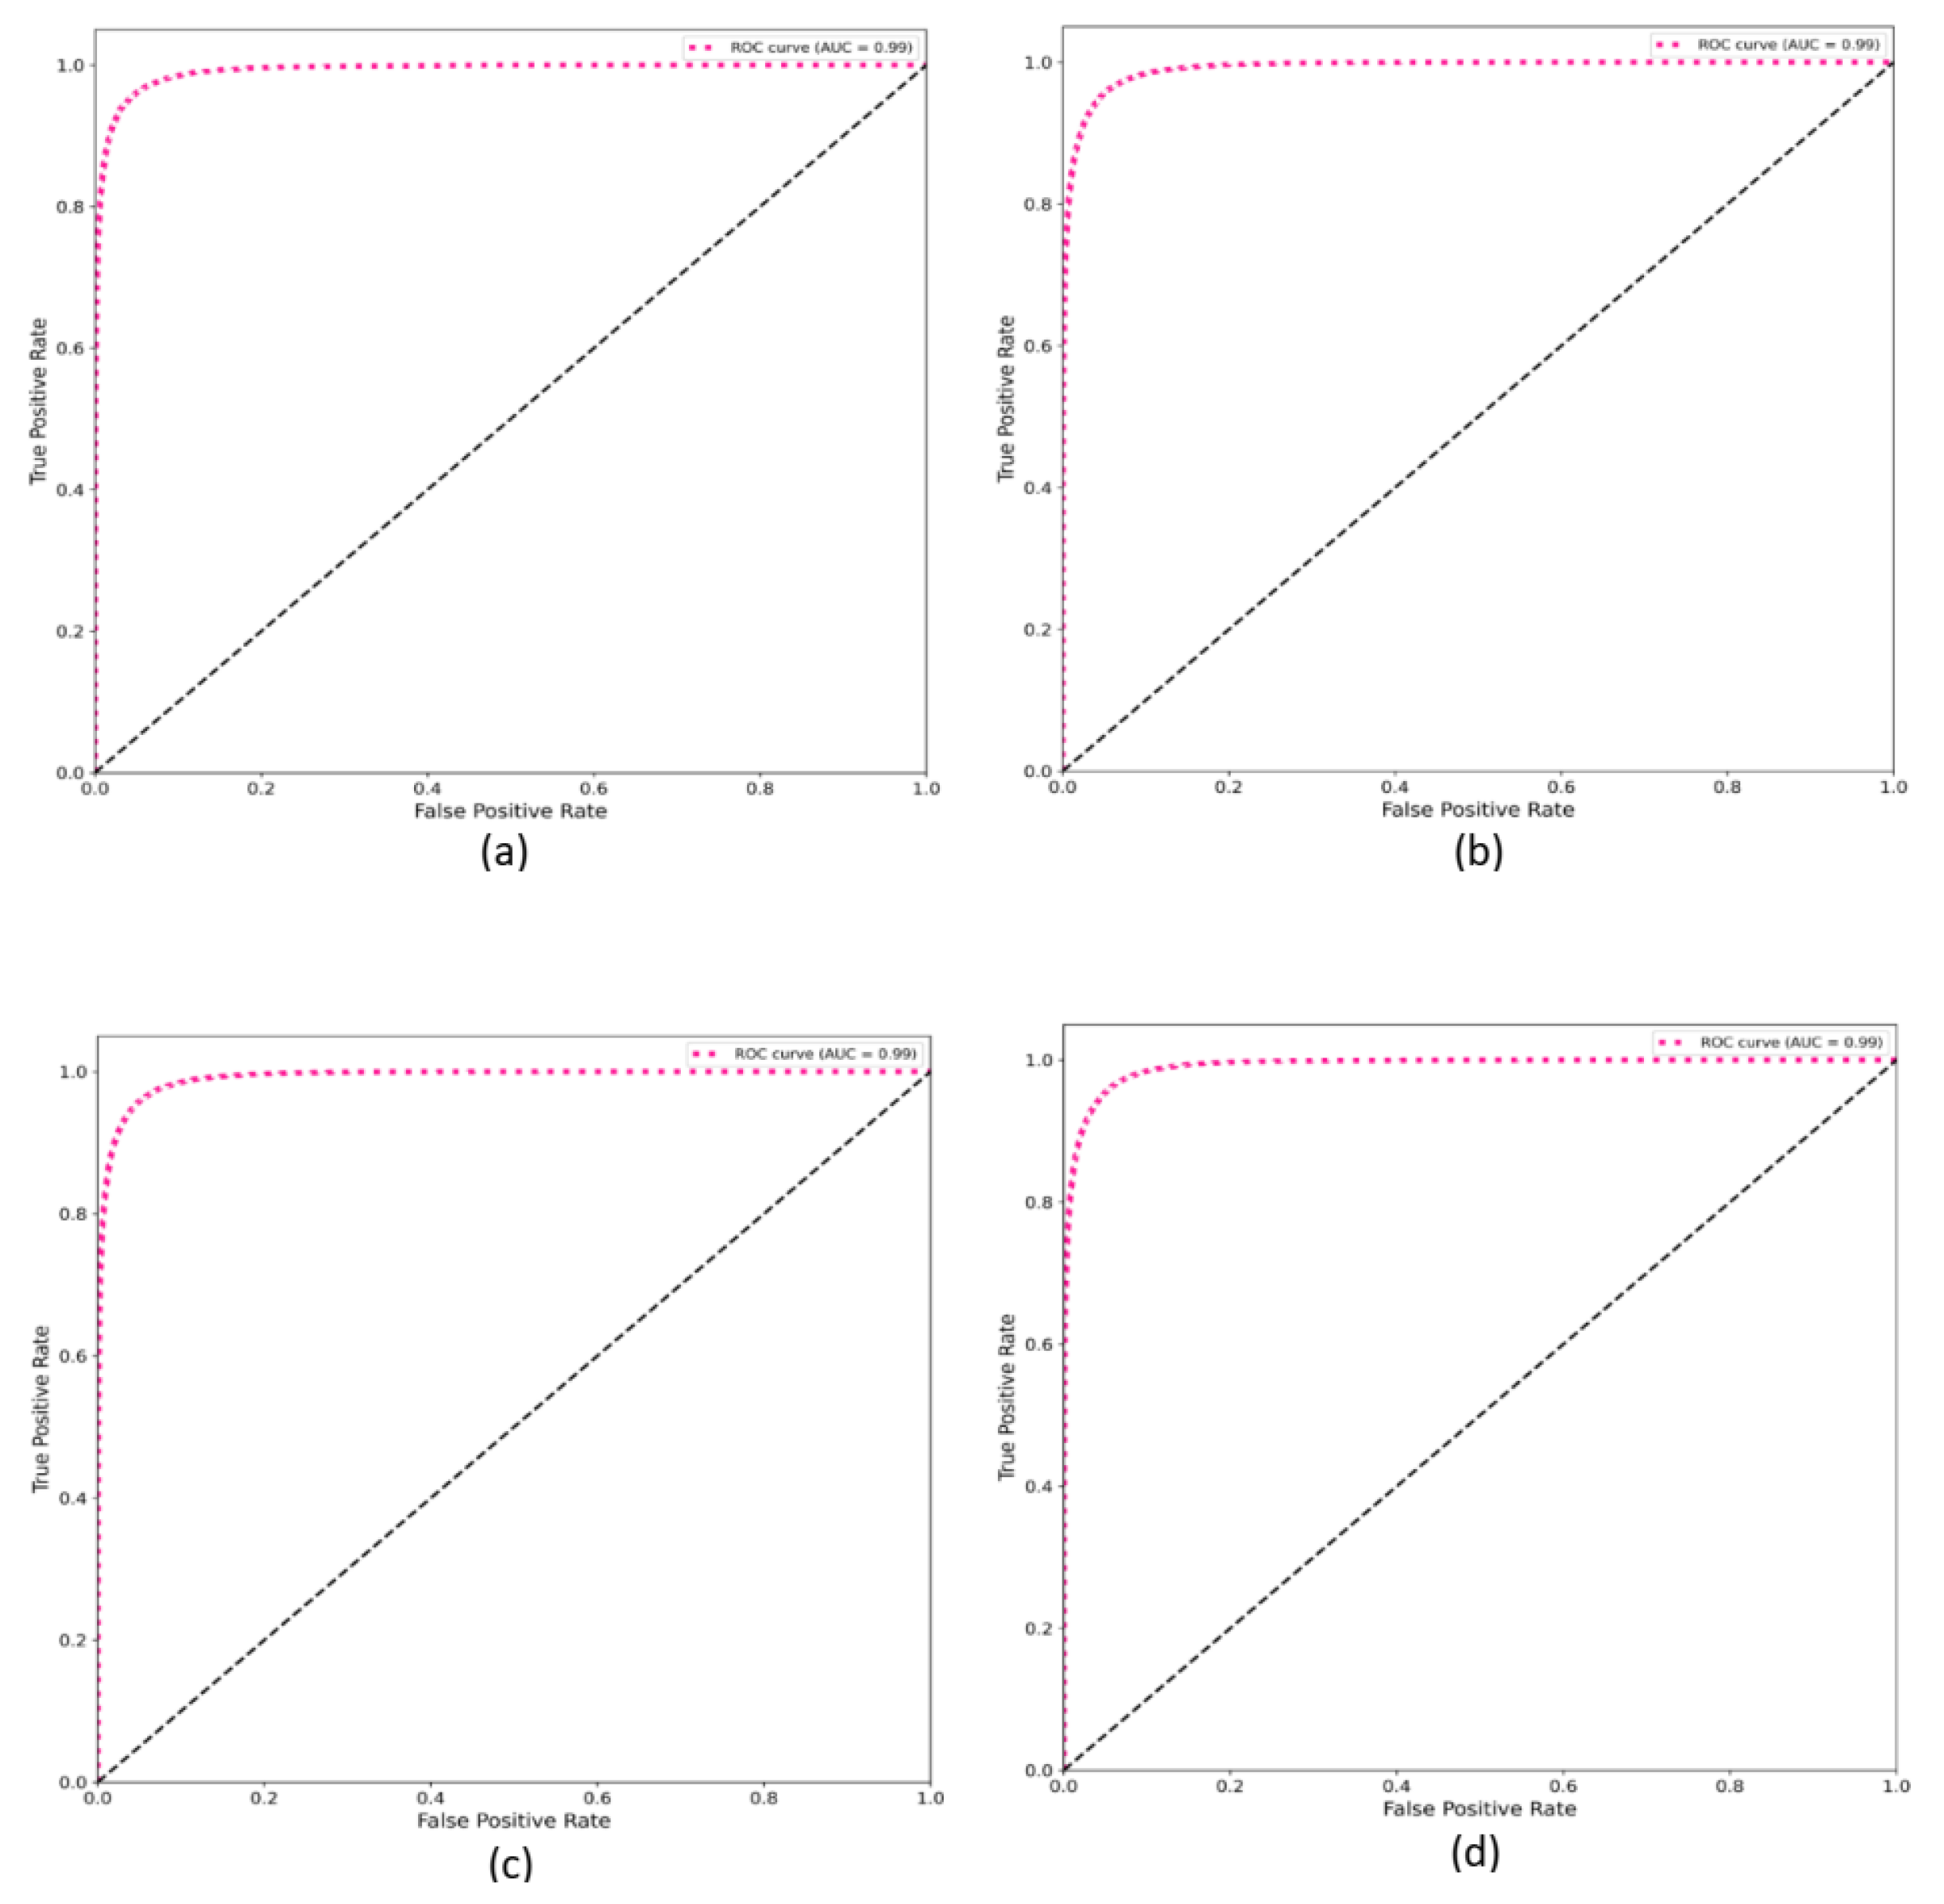
Figure 12.
The identification performance of the XGBoost on different numbers of users.

Figure 13.
The identification performance of the LSTM on different numbers of users.
4.4. Comparison to state-of-the-art methods
Table 7 shows the comparison to some of the state-of-the-art methods that use the HMOG dataset. The used sensors, the datasets, the approach, and the evaluation metrics are shown in this table. As we mentioned before in the related work section none of the earlier studies evaluate their models with important metrics like IBA, AUC, and Specificity which are important to evaluate models’ performance.
As shown in Table 7, the proposed identification system using LSTM based on the aforementioned statistical features obtained from the smartphone accelerometer signal outperforms existing techniques, which were primarily developed for the authentication of a user (a binary classification problem), whereas our system is created for the identification of multiple users (a multi-class classification problem), which is a more challenging problem in machine learning, as supported by García-Pedrajas and Ortiz-Boyer, who argued that many classifiers either perform better with binary classification problems or are created expressly for them, which is a problem in the general case of classification [61].
5. Conclusions
In this paper, we investigated the applicability of smartphone accelerometer data in identifying users and proposed the best components that can be used for a complete application. To this end, we used a number of machine learning methods to learn the accelerometer data of each user in order to identify them. These include a few chosen techniques from deep learning, traditional classifiers, and voting classifiers, all of which were trained using the users’ accelerometer signals obtained from HMOG public dataset [18]. In addition, we investigate the use of some pre-processing methods to clean the data, and some feature selection methods to improve the performance of the identification system.
Our large set of experiments yields the following conclusions:
- The LSTM deep learning algorithm, followed by XGBoost, has the best identification performance.
- Band-pass filtering the statistical features obtained from the accelerometer signal degrades the identification results.
- The RFE feature selection approach outperformed the other examined methods, however, we still advise employing all statistical features due to their significance because doing so somewhat improves the identification results, especially when using LSTM.
- When the number of users is increased from 10 to 50, the proposed identification system still achieves high identification performance.
However, the limitation of this study includes:
- Out of the three sensors, we only used the data from the accelerometer, leaving out the information from the gyroscope and magnetometer, which might be beneficial to the identification process.
- The magnitude signal, and the FFT of the magnitude were both used to extract the statistical features. It is necessary to investigate additional methods for reducing the dimensionality of time series, such as wavelet and discrete cosine transformations.
These limitations will be the focus of our future research so as to be able to devise a more accurate identification system.
Author Contributions
For research articles with several authors, a short paragraph specifying their individual contributions must be provided. The following statements should be used “Conceptualization, E.A., and A.H.; methodology, E.A., M.AG., A.T., M.AR., M.AL., I.A., and A.H.; software, A.T., I.A., A.M., A.A., and M.AB.; validation, M.AG., A.T., M.AR., M.AL., and A.M.; formal analysis, E.A., M.AG., A.T., M.AR., M.AL., I.A., and A.M.; investigation, A.M., A.A., M.AB., and A.H.; resources, E.A., M.AG., A.T., M.AR., and M.AL.; data curation, I.A., A.M., A.A., M.AB., and A.H.; writing—original draft preparation, E.A., M.AG., A.T., M.AR., and M.AL.; writing—review and editing, A.H., I.A., A.M., A.A., and M.AB.; visualization, E.A., and A.H.; supervision, A.H.; project administration, M.AG., and A.H. All authors have read and agreed to the published version of the manuscript.
Funding
This research received no external funding.
Institutional Review Board Statement
Not applicable.
Informed Consent Statement
Not applicable.
Data Availability Statement
For the purposes of this study, all experiments were performed using the HMOG smartphone dataset, which was obtained from [23].
Acknowledgments
We truly appreciate the reviewers’ voluntary efforts and thank them for their input.
Conflicts of Interest
The authors declare no conflict of interest.
References
- Meng, Q.; Lu, P.; Zhu, S. A Smartphone-enabled IoT System for Vibration and Noise Monitoring of Rail Transit. IEEE Internet of Things Journal 2023. [Google Scholar] [CrossRef]
- Mnasri, S.; Nasri, N.; Alrashidi, M.; van den Bossche, A.; Val, T. IoT networks 3D deployment using hybrid many-objective optimization algorithms. Journal of Heuristics 2020. [Google Scholar] [CrossRef]
- Abdallah, W.; Mnasri, S.; Nasri, N.; others. Emergent IoT Wireless Technologies beyond the year 2020: A Comprehensive Comparative Analysis. 2020 International Conference on Computing and Information Technology (ICCIT-1441). IEEE, 2020, pp. 1–5. [CrossRef]
- Tlili, S.; Mnasri, S.; Val, T. A multi-objective Gray Wolf algorithm for routing in IoT Collection Networks with real experiments. 2021 National Computing Colleges Conference (NCCC). IEEE, 2021, pp. 1–5. [CrossRef]
- Rasool, G.; Hussain, Y.; Umer, T.; Rasheed, J.; Yeo, S.F.; Sahin, F. Design Patterns for Mobile Games Based on Structural Similarity. Applied Sciences 2023, 13, 1198. [Google Scholar] [CrossRef]
- Hassanat, A.B.; Altarawneh, G.; Tarawneh, A.S.; Faris, H.; Alhasanat, M.B.; de Voogt, A.; Al-Rawashdeh, B.; Alshamaileh, M.; Prasath, S.V. On Computerizing the Ancient Game of Tab. International Journal of Gaming and Computer-Mediated Simulations (IJGCMS) 2018, 10, 20–40. [Google Scholar] [CrossRef]
- Tai, Y.; Yu, T.T. Using smartphones to locate trapped victims in disasters. Sensors 2022, 22, 7502. [Google Scholar] [CrossRef] [PubMed]
- Skurowski, P.; Nurzyńska, K.; Pawlyta, M.; Cyran, K.A. Performance of QR code detectors near Nyquist limits. Sensors 2022, 22, 7230. [Google Scholar] [CrossRef] [PubMed]
- Soni, V.; Yadav, H.; Semwal, V.B.; Roy, B.; Choubey, D.K.; Mallick, D.K. A Novel Smartphone-Based Human Activity Recognition Using Deep Learning in Health care. Machine Learning, Image Processing, Network Security and Data Sciences: Select Proceedings of 3rd International Conference on MIND 2021. Springer, 2023, pp. 493–503. [CrossRef]
- Shaw, B.; Kesharwani, A. Moderating effect of smartphone addiction on mobile wallet payment adoption. Journal of Internet Commerce 2019, 18, 291–309. [Google Scholar] [CrossRef]
- Hassanat, A.B.; Albustanji, A.A.; Tarawneh, A.S.; Alrashidi, M.; Alharbi, H.; Alanazi, M.; Alghamdi, M.; Alkhazi, I.S.; Prasath, V.S. DeepVeil: deep learning for identification of face, gender, expression recognition under veiled conditions. International Journal of Biometrics 2022, 14, 453–480. [Google Scholar] [CrossRef]
- Hassanat, A.B.; Prasath, V.S.; Al-kasassbeh, M.; Tarawneh, A.S.; Al-shamailh, A.J. Magnetic energy-based feature extraction for low-quality fingerprint images. Signal, Image and Video Processing 2018, 12, 1471–1478. [Google Scholar] [CrossRef]
- Tarawneh, A.S.; Hassanat, A.B.; Alkafaween, E.; Sarayrah, B.; Mnasri, S.; Altarawneh, G.A.; Alrashidi, M.; Alghamdi, M.; Almuhaimeed, A. DeepKnuckle: Deep Learning for Finger Knuckle Print Recognition. Electronics 2022, 11, 513. [Google Scholar] [CrossRef]
- Zhao, S.; Fei, L.; Wen, J. Multiview-Learning-Based Generic Palmprint Recognition: A Literature Review. Mathematics 2023, 11, 1261. [Google Scholar] [CrossRef]
- Hassanat, A.; Al-Awadi, M.; Btoush, E.; Al-Btoush, A.; Alhasanat, E.; Altarawneh, G. New mobile phone and webcam hand images databases for personal authentication and identification. Procedia Manufacturing 2015, 3, 4060–4067. [Google Scholar] [CrossRef]
- Hassanat, A.B. On identifying terrorists using their victory signs. Data Science Journal 2018, 17. [Google Scholar] [CrossRef]
- Hassanat, A.B.; Btoush, E.; Abbadi, M.A.; Al-Mahadeen, B.M.; Al-Awadi, M.; Mseidein, K.I.; Almseden, A.M.; Tarawneh, A.S.; Alhasanat, M.B.; Prasath, V.S.; others. Victory sign biometrie for terrorists identification: Preliminary results. 2017 8th International Conference on Information and Communication Systems (ICICS). IEEE, 2017, pp. 182–187. [CrossRef]
- Yang, Q.; Peng, G.; Nguyen, D.T.; Qi, X.; Zhou, G.; Sitová, Z.; Gasti, P.; Balagani, K.S. A multimodal data set for evaluating continuous authentication performance in smartphones. Proceedings of the 12th ACM Conference on Embedded Network Sensor Systems, 2014, pp. 358–359. [CrossRef]
- Sudhakar, S.R.V.; Kayastha, N.; Sha, K. ActID: An efficient framework for activity sensor based user identification. Computers & Security 2021, 108, 102319. [Google Scholar] [CrossRef]
- Ram, V.S.S.; Kayastha, N.; Sha, K. OFES: Optimal feature evaluation and selection for multi-class classification. Data & Knowledge Engineering 2022, 139, 102007. [Google Scholar] [CrossRef]
- Hall, M.A. Correlation-based feature selection for machine learning. PhD thesis, The University of Waikato, 1999.
- Cherifi, F.; Omar, M.; Amroun, K. An efficient biometric-based continuous authentication scheme with HMM prehensile movements modeling. Journal of information security and applications 2021, 57, 102739. [Google Scholar] [CrossRef]
- Sitová, Z.; Šeděnka, J.; Yang, Q.; Peng, G.; Zhou, G.; Gasti, P.; Balagani, K.S. HMOG: New behavioral biometric features for continuous authentication of smartphone users. IEEE Transactions on Information Forensics and Security 2015, 11, 877–892. [Google Scholar] [CrossRef]
- Yoneda, K.; Weiss, G.M. Mobile sensor-based biometrics using common daily activities. 2017 IEEE 8th Annual Ubiquitous Computing, Electronics and Mobile Communication Conference (UEMCON). IEEE, 2017, pp. 584–590. [CrossRef]
- Wu, G.; Wang, J.; Zhang, Y.; Jiang, S. A continuous identity authentication scheme based on physiological and behavioral characteristics. Sensors 2018, 18, 179. [Google Scholar] [CrossRef]
- Kononenko, I.; others. Estimating attributes: Analysis and extensions of RELIEF. ECML. Citeseer, 1994, Vol. 94, pp. 171–182. [CrossRef]
- Primo, A.; Phoha, V.V.; Kumar, R.; Serwadda, A. Context-aware active authentication using smartphone accelerometer measurements. Proceedings of the IEEE conference on computer vision and pattern recognition workshops, 2014, pp. 98–105.
- Sprager, S.; Juric, M.B. An efficient HOS-based gait authentication of accelerometer data. IEEE transactions on information forensics and security 2015, 10, 1486–1498. [Google Scholar] [CrossRef]
- Jain, A.; Kanhangad, V. Exploring orientation and accelerometer sensor data for personal authentication in smartphones using touchscreen gestures. Pattern recognition letters 2015, 68, 351–360. [Google Scholar] [CrossRef]
- Muaaz, M.; Mayrhofer, R. Smartphone-based gait recognition: From authentication to imitation. IEEE Transactions on Mobile Computing 2017, 16, 3209–3221. [Google Scholar] [CrossRef]
- Abuhamad, M.; Abuhmed, T.; Mohaisen, D.; Nyang, D. AUToSen: Deep-learning-based implicit continuous authentication using smartphone sensors. IEEE Internet of Things Journal 2020, 7, 5008–5020. [Google Scholar] [CrossRef]
- Li, Y.; Zou, B.; Deng, S.; Zhou, G. Using feature fusion strategies in continuous authentication on smartphones. IEEE Internet Computing 2020, 24, 49–56. [Google Scholar] [CrossRef]
- Wang, R.; Tao, D. Context-aware implicit authentication of smartphone users based on multi-sensor behavior. IEEE Access 2019, 7, 119654–119667. [Google Scholar] [CrossRef]
- Alzubaidi, A.; Kalita, J. Authentication of smartphone users using behavioral biometrics. IEEE Communications Surveys & Tutorials 2016, 18, 1998–2026. [Google Scholar] [CrossRef]
- Shen, C.; Chen, Y.; Guan, X. Performance evaluation of implicit smartphones authentication via sensor-behavior analysis. Information Sciences 2018, 430, 538–553. [Google Scholar] [CrossRef]
- Maghsoudi, J.; Tappert, C.C. A behavioral biometrics user authentication study using motion data from android smartphones. 2016 European intelligence and security informatics conference (EISIC). IEEE, 2016, pp. 184–187. [CrossRef]
- Ehatisham-ul Haq, M.; Azam, M.A.; Loo, J.; Shuang, K.; Islam, S.; Naeem, U.; Amin, Y. Authentication of smartphone users based on activity recognition and mobile sensing. Sensors 2017, 17, 2043. [Google Scholar] [CrossRef]
- Shen, C.; Li, Y.; Chen, Y.; Guan, X.; Maxion, R.A. Performance analysis of multi-motion sensor behavior for active smartphone authentication. IEEE Transactions on Information Forensics and Security 2017, 13, 48–62. [Google Scholar] [CrossRef]
- Lee, W.H.; Lee, R. Implicit sensor-based authentication of smartphone users with smartwatch. In Proceedings of the Hardware and Architectural Support for Security and Privacy 2016; 2016; pp. 1–8. [CrossRef]
- Mohamed, M.; Cheffena, M. Received signal strength based gait authentication. IEEE Sensors Journal 2018, 18, 6727–6734. [Google Scholar] [CrossRef]
- García, V.; Mollineda, R.A.; Sánchez, J.S. Index of balanced accuracy: A performance measure for skewed class distributions. Pattern Recognition and Image Analysis: 4th Iberian Conference, IbPRIA 2009 Póvoa de Varzim, Portugal, June 10-12, 2009 Proceedings 4. Springer, 2009, pp. 441–448. 10 June. [CrossRef]
- Tarawneh, A.S.; Hassanat, A.B.; Altarawneh, G.A.; Almuhaimeed, A. Stop Oversampling for Class Imbalance Learning: A Review. IEEE Access 2022. [Google Scholar] [CrossRef]
- Chen, T.; He, T.; Benesty, M.; Khotilovich, V.; Tang, Y.; Cho, H.; Chen, K.; Mitchell, R.; Cano, I.; Zhou, T.; others. Xgboost: extreme gradient boosting. R package version 0.4-2 2015, 1, 1–4.
- Mushava, J.; Murray, M. A novel XGBoost extension for credit scoring class-imbalanced data combining a generalized extreme value link and a modified focal loss function. Expert Systems with Applications 2022, 202, 117233. [Google Scholar] [CrossRef]
- Hassanat, A.B.; Tarawneh, A.S.; Abed, S.S.; Altarawneh, G.A.; Alrashidi, M.; Alghamdi, M. Rdpvr: Random data partitioning with voting rule for machine learning from class-imbalanced datasets. Electronics 2022, 11, 228. [Google Scholar] [CrossRef]
- Zhuravlev, Y.I.; Laptin, Y.; Vinogradov, A.; Zhurbenko, N.; Likhovid, A. Nonsmooth optimization methods in the problems of constructing a linear classifier. International Journal Information Models and Analyses 2012, 1, 103–111. [Google Scholar]
- Chakraborty, M.; Das, S. Determination of signal to noise ratio of electrocardiograms filtered by band pass and Savitzky-Golay filters. Procedia Technology 2012, 4, 830–833. [Google Scholar] [CrossRef]
- Hess, C.W.; Pullman, S.L. Tremor: clinical phenomenology and assessment techniques. Tremor and Other Hyperkinetic Movements 2012, 2, 1–15. [Google Scholar] [CrossRef]
- Jaén-Vargas, M.; Leiva, K.M.R.; Fernandes, F.; Gonçalves, S.B.; Silva, M.T.; Lopes, D.S.; Olmedo, J.J.S. Effects of sliding window variation in the performance of acceleration-based human activity recognition using deep learning models. PeerJ Computer Science 2022, 8, e1052. [Google Scholar] [CrossRef]
- Galar, M.; Fernandez, A.; Barrenechea, E.; Bustince, H.; Herrera, F. A review on ensembles for the class imbalance problem: bagging-, boosting-, and hybrid-based approaches. IEEE Transactions on Systems, Man, and Cybernetics, Part C (Applications and Reviews) 2011, 42, 463–484. [Google Scholar] [CrossRef]
- Chen, T.; Guestrin, C. Xgboost: A scalable tree boosting system. Proceedings of the 22nd acm sigkdd international conference on knowledge discovery and data mining, 2016, pp. 785–794. [CrossRef]
- De Luca, C.J.; Gilmore, L.D.; Kuznetsov, M.; Roy, S.H. Filtering the surface EMG signal: Movement artifact and baseline noise contamination. Journal of biomechanics 2010, 43, 1573–1579. [Google Scholar] [CrossRef]
- He, H.; Garcia, E.A. Learning from imbalanced data. IEEE Transactions on knowledge and data engineering 2009, 21, 1263–1284. [Google Scholar] [CrossRef]
- Elazmeh, W.; Japkowicz, N.; Matwin, S. Evaluating misclassifications in imbalanced data. Machine Learning: ECML 2006: 17th European Conference on Machine Learning Berlin, Germany, September 18-22, 2006 Proceedings 17. Springer, 2006, pp. 126–137. 18 September. [CrossRef]
- Barandela, R.; Sánchez, J.S.; Garcıa, V.; Rangel, E. Strategies for learning in class imbalance problems. Pattern Recognition 2003, 36, 849–851. [Google Scholar] [CrossRef]
- Perusquía-Hernández, M.; Dollack, F.; Tan, C.K.; Namba, S.; Ayabe-Kanamura, S.; Suzuki, K. Smile Action Unit detection from distal wearable Electromyography and Computer Vision. 2021 16th IEEE International Conference on Automatic Face and Gesture Recognition (FG 2021). IEEE, 2021, pp. 1–8. [CrossRef]
- Namba, S.; Sato, W.; Osumi, M.; Shimokawa, K. Assessing automated facial action unit detection systems for analyzing cross-domain facial expression databases. Sensors 2021, 21, 4222. [Google Scholar] [CrossRef] [PubMed]
- Jeni, L.A.; Cohn, J.F.; De La Torre, F. Facing imbalanced data–recommendations for the use of performance metrics. 2013 Humaine association conference on affective computing and intelligent interaction. IEEE, 2013, pp. 245–251. [CrossRef]
- Alawneh, L.; Mohsen, B.; Al-Zinati, M.; Shatnawi, A.; Al-Ayyoub, M. A comparison of unidirectional and bidirectional lstm networks for human activity recognition. 2020 IEEE International Conference on Pervasive Computing and Communications Workshops (PerCom Workshops). IEEE, 2020, pp. 1–6. [CrossRef]
- Yue-Hei Ng, J.; Hausknecht, M.; Vijayanarasimhan, S.; Vinyals, O.; Monga, R.; Toderici, G. Beyond short snippets: Deep networks for video classification. Proceedings of the IEEE conference on computer vision and pattern recognition, 2015, pp. 4694–4702.
- García-Pedrajas, N.; Ortiz-Boyer, D. An empirical study of binary classifier fusion methods for multiclass classification. Information Fusion 2011, 12, 111–130. [Google Scholar] [CrossRef]
- Cho, K.; Van Merriënboer, B.; Bahdanau, D.; Bengio, Y. On the properties of neural machine translation: Encoder-decoder approaches. arXiv preprint arXiv:1409.1259 2014. [CrossRef]
- Bradbury, J.; Merity, S.; Xiong, C.; Socher, R. Quasi-recurrent neural networks. arXiv preprint arXiv:1611.01576 2016. [CrossRef]
Figure 1.
Flowchart of the major steps in the proposed identification system.
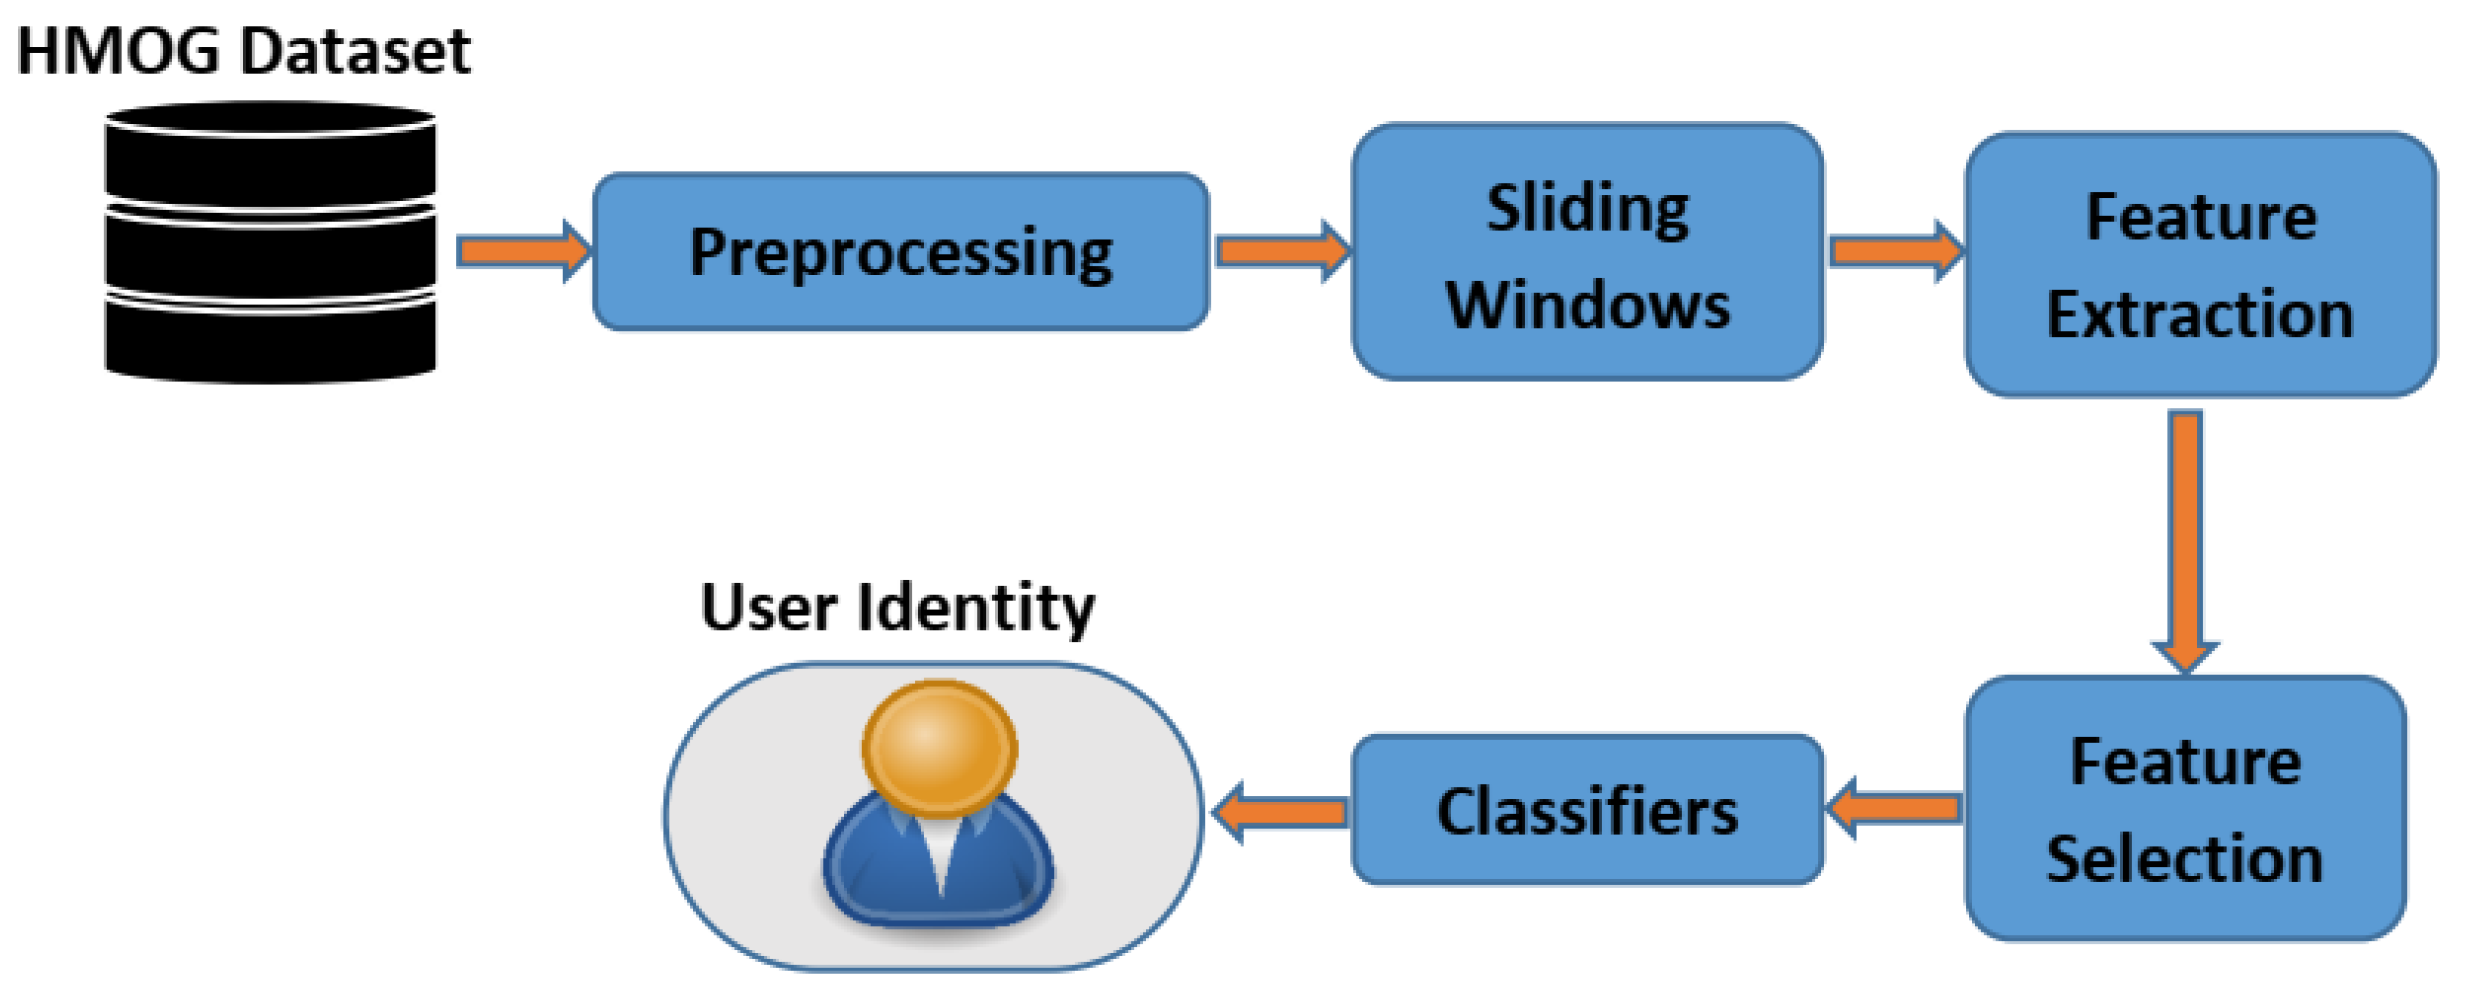
Figure 3.
The used Overlapping Sliding Window Technique.
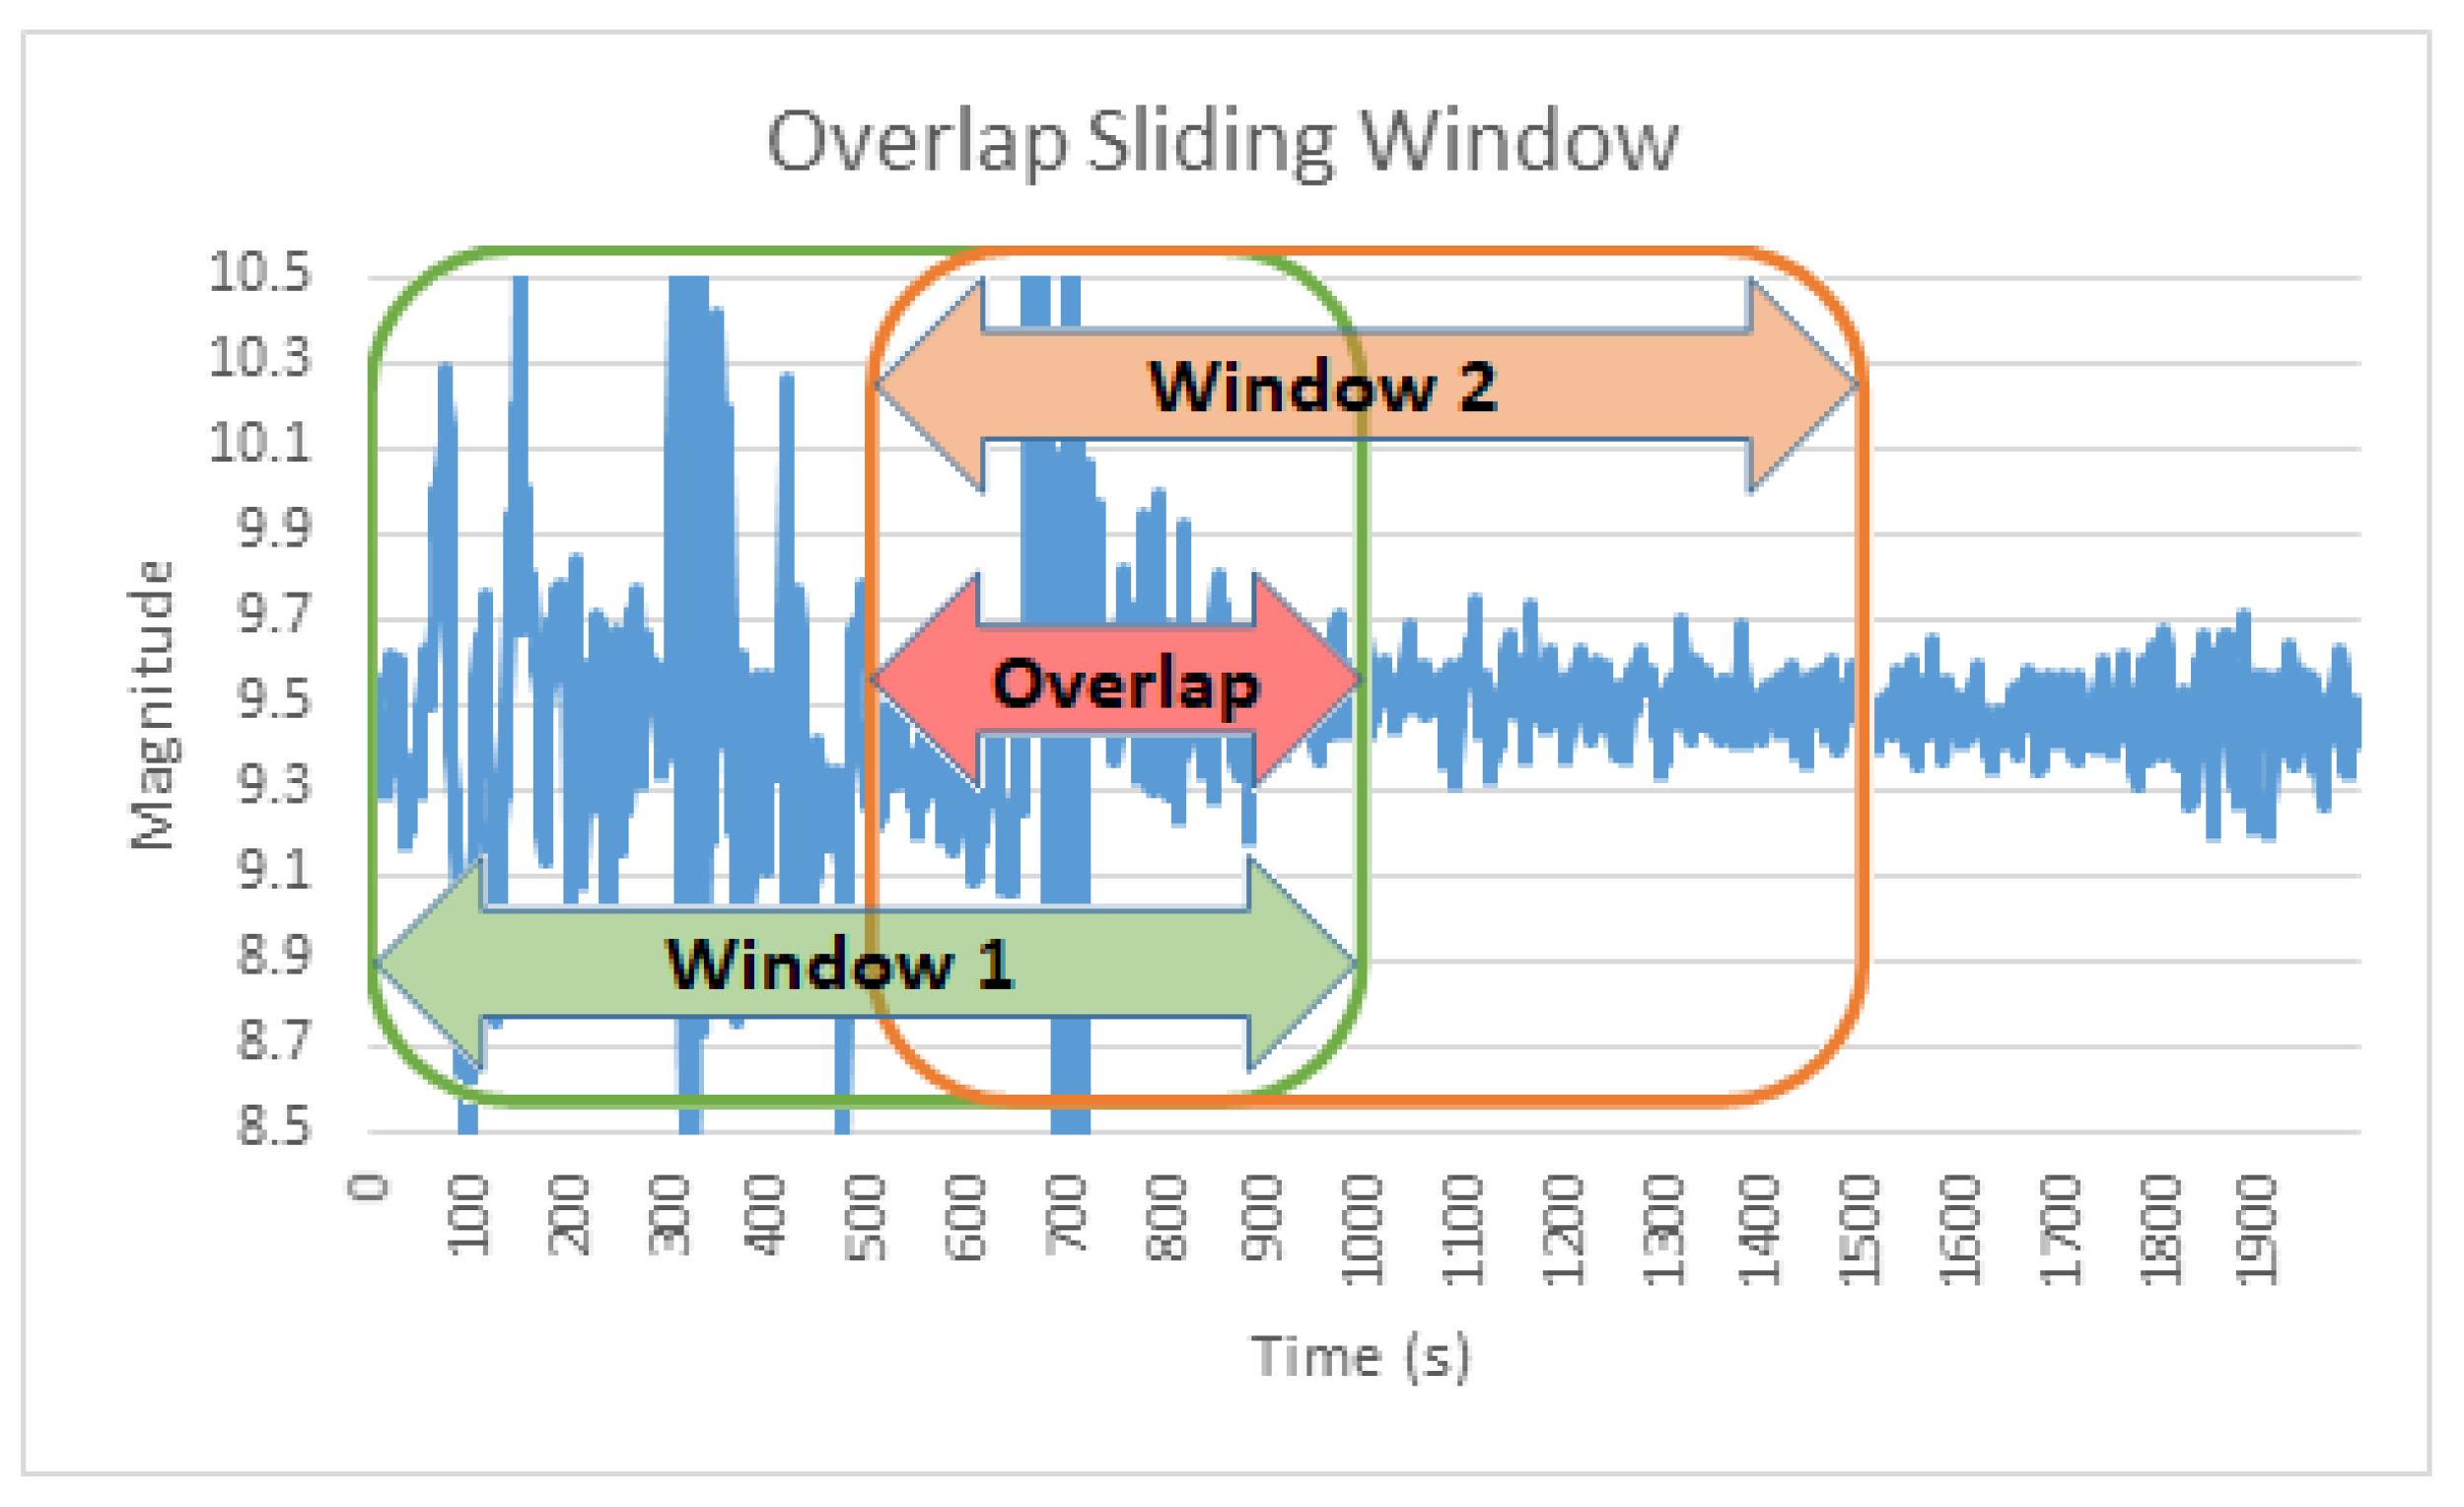
Figure 4.
The Correlation coefficients of all features listed in Table 3.
Figure 4.
The Correlation coefficients of all features listed in Table 3.
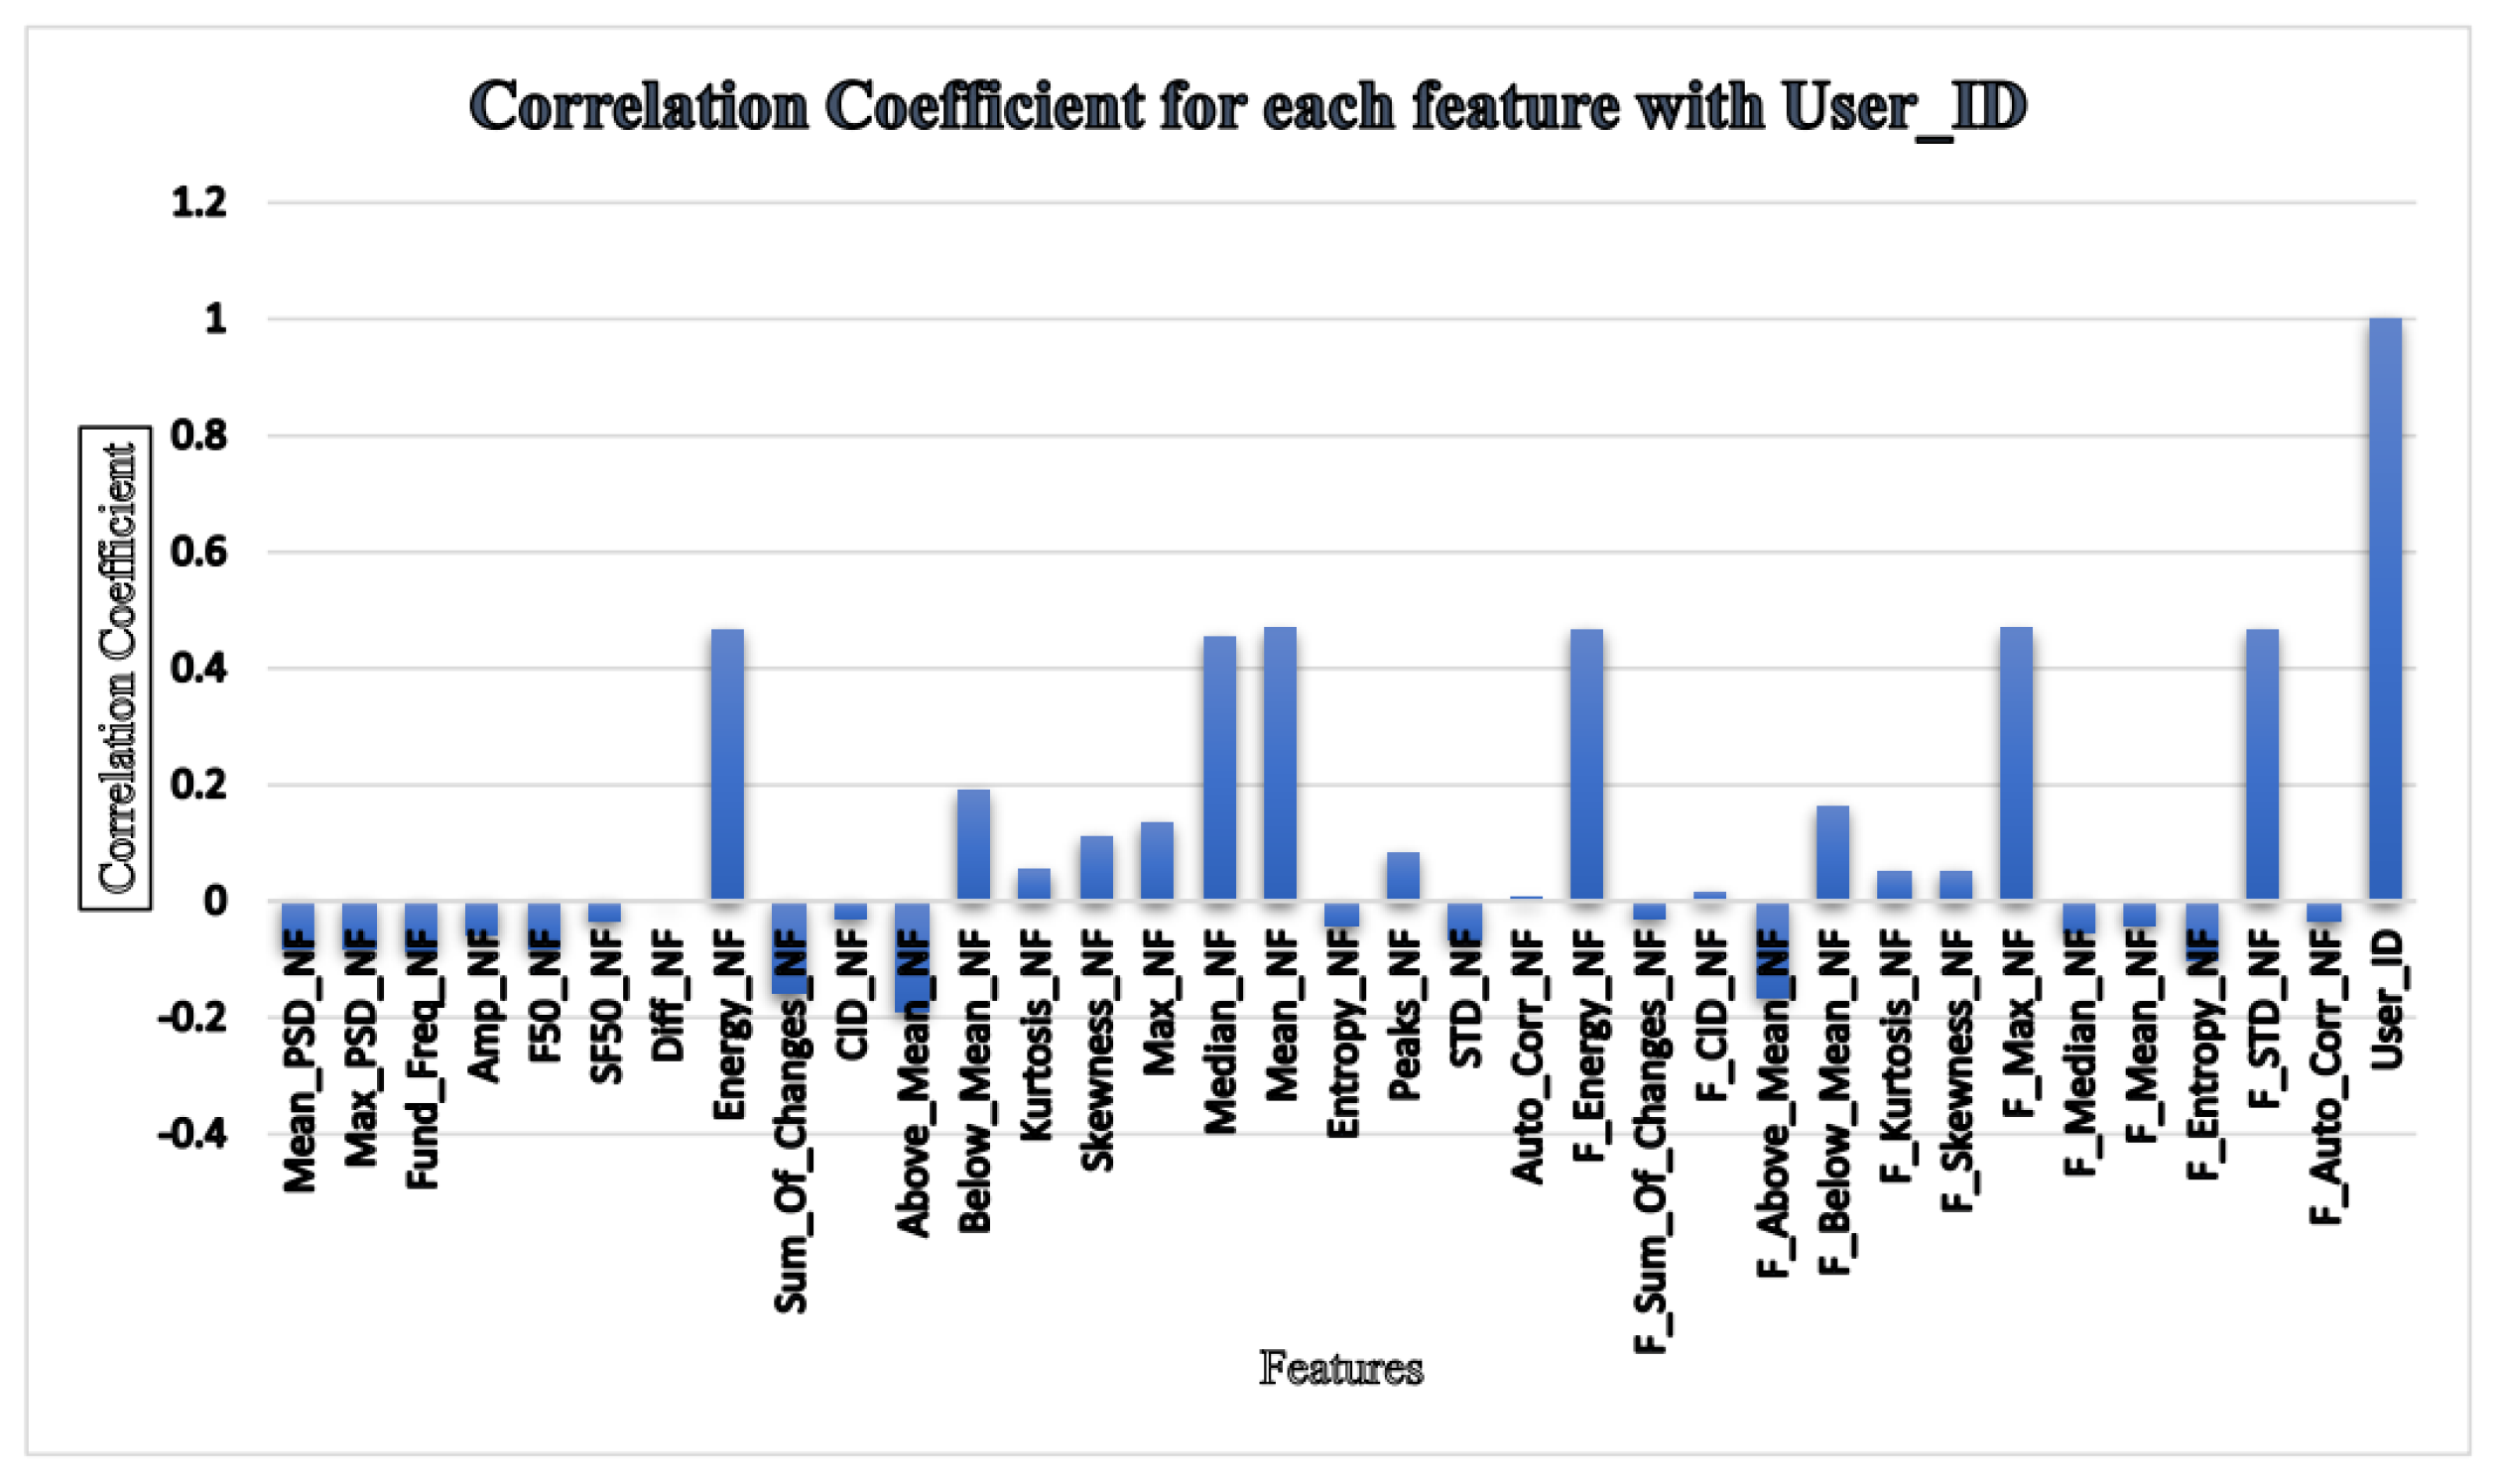
Figure 5.
The Fisher Score ranking all features listed in Table 3.
Figure 5.
The Fisher Score ranking all features listed in Table 3.
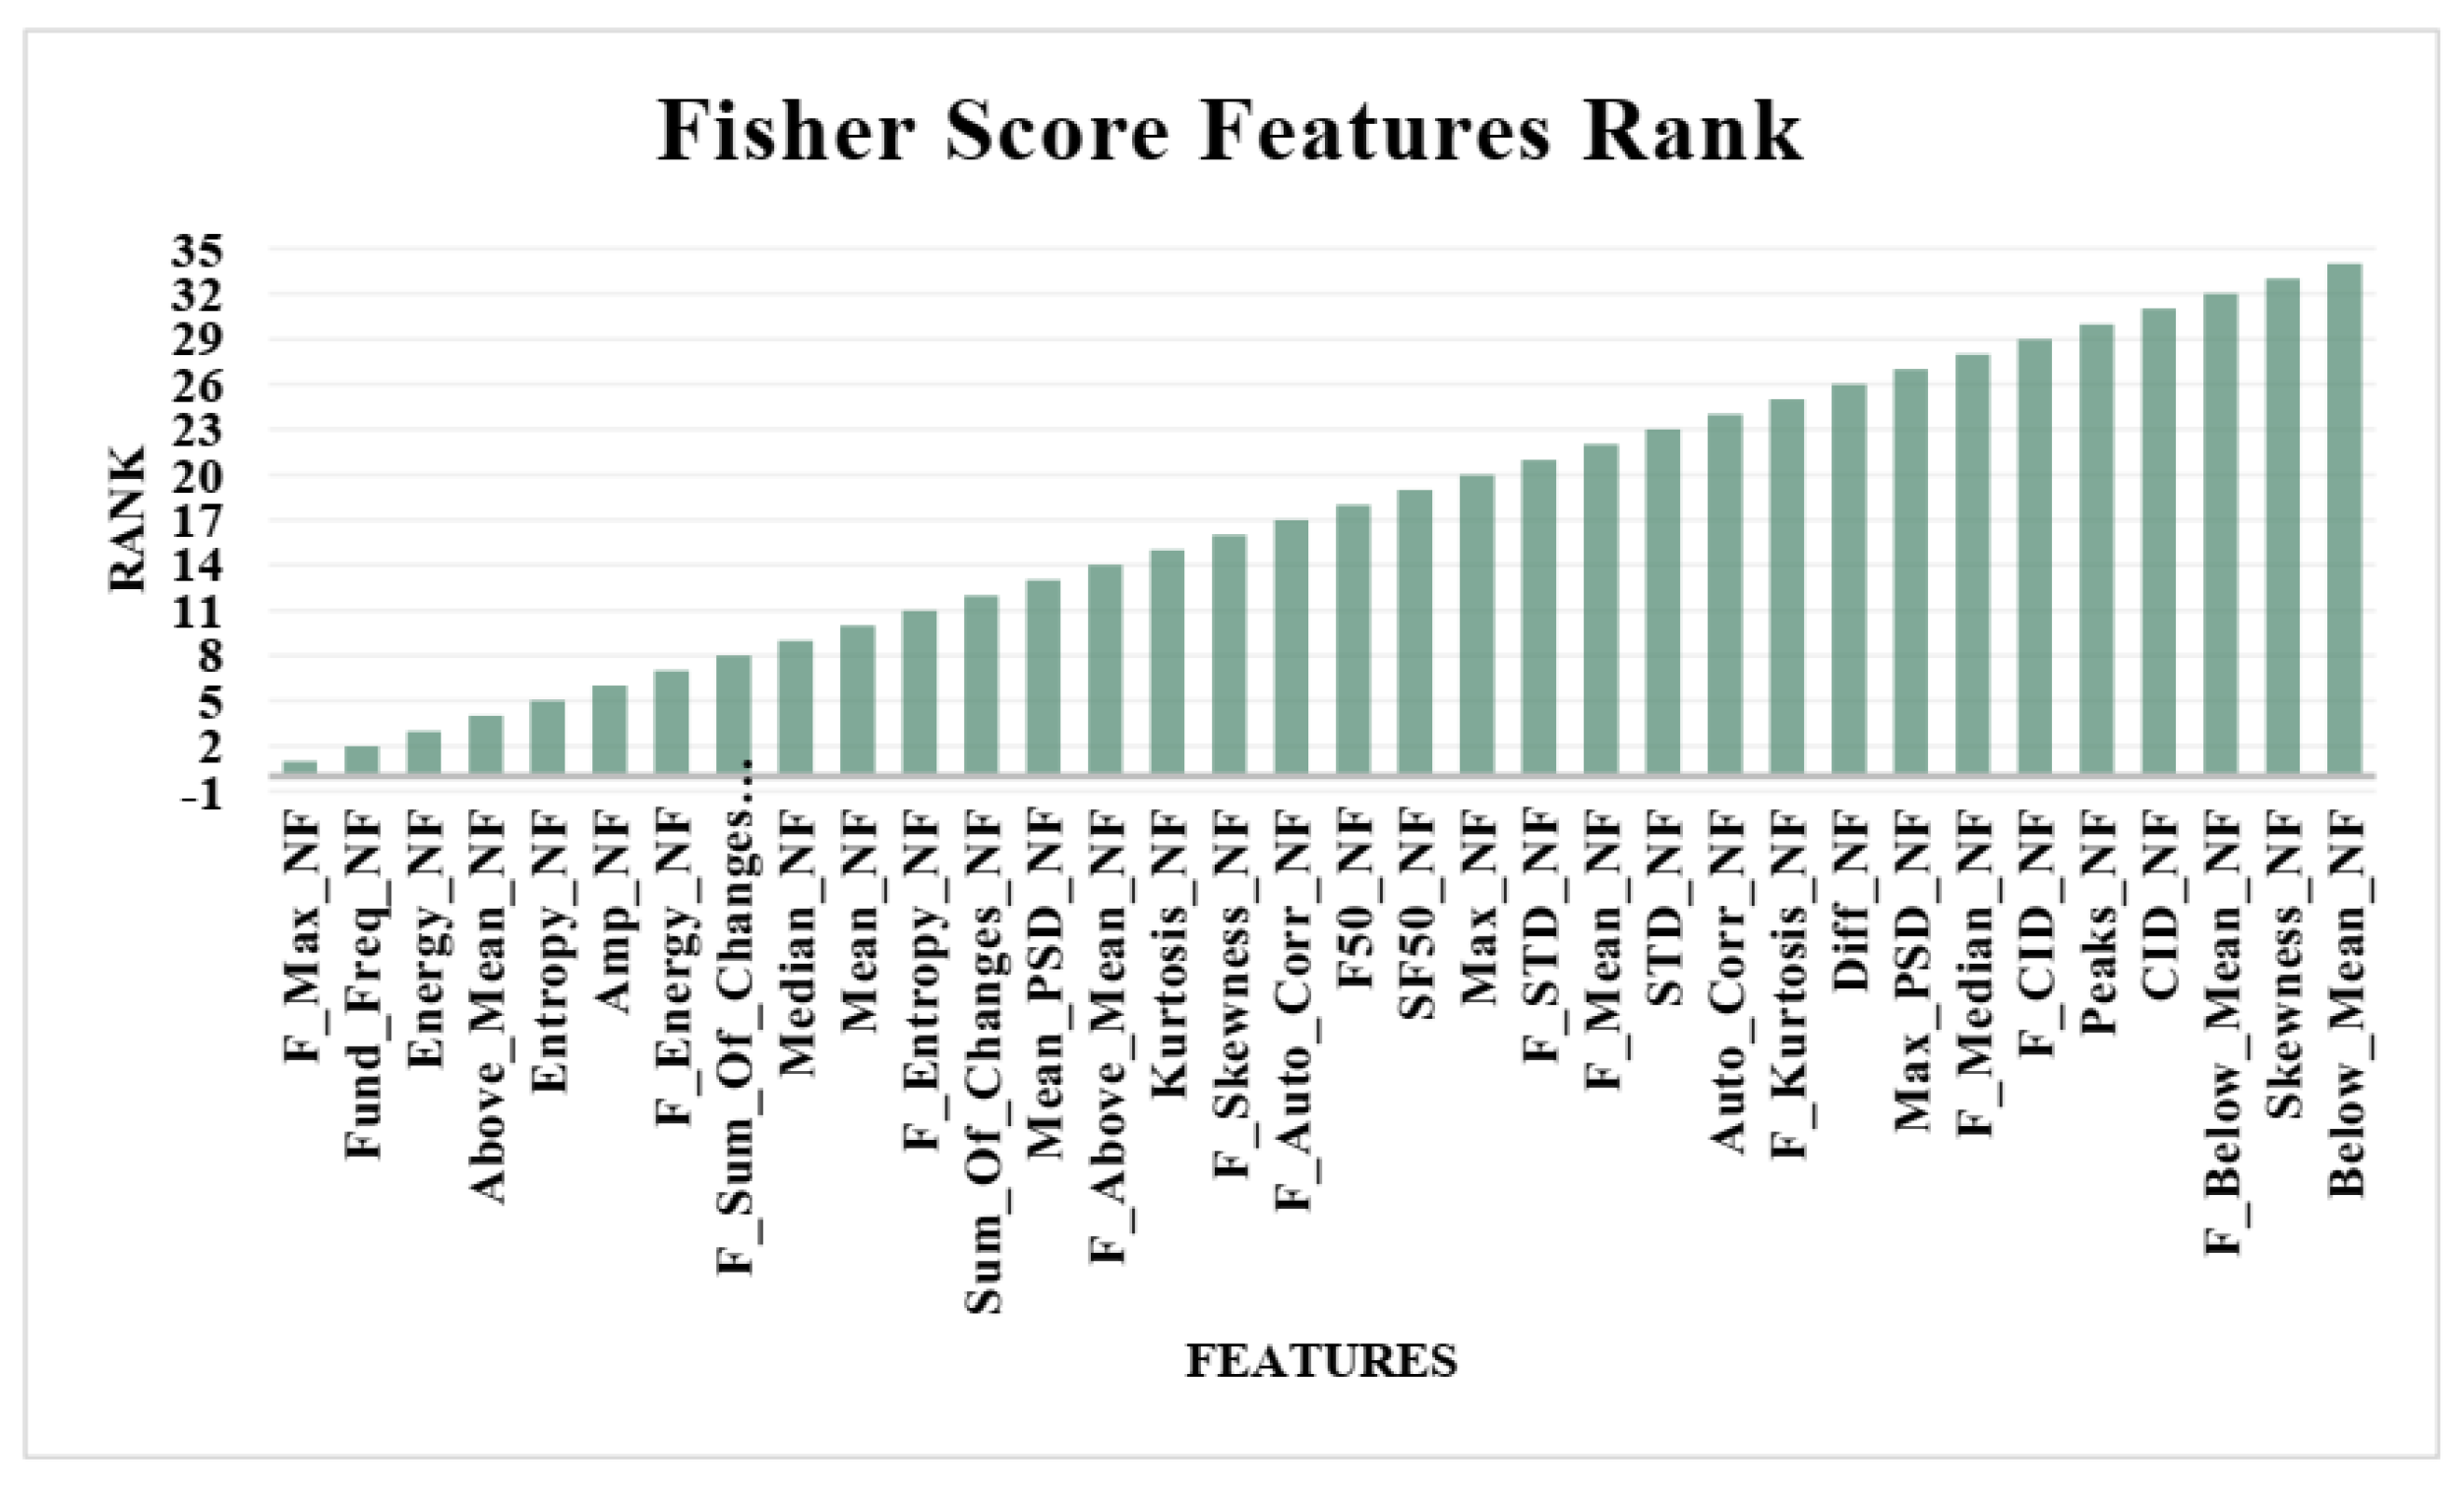
Figure 6.
The Information Gain of each feature listed in Table 3.
Figure 6.
The Information Gain of each feature listed in Table 3.

Figure 7.
Features ranking by RFE and RF of all features listed in Table 3.
Figure 7.
Features ranking by RFE and RF of all features listed in Table 3.
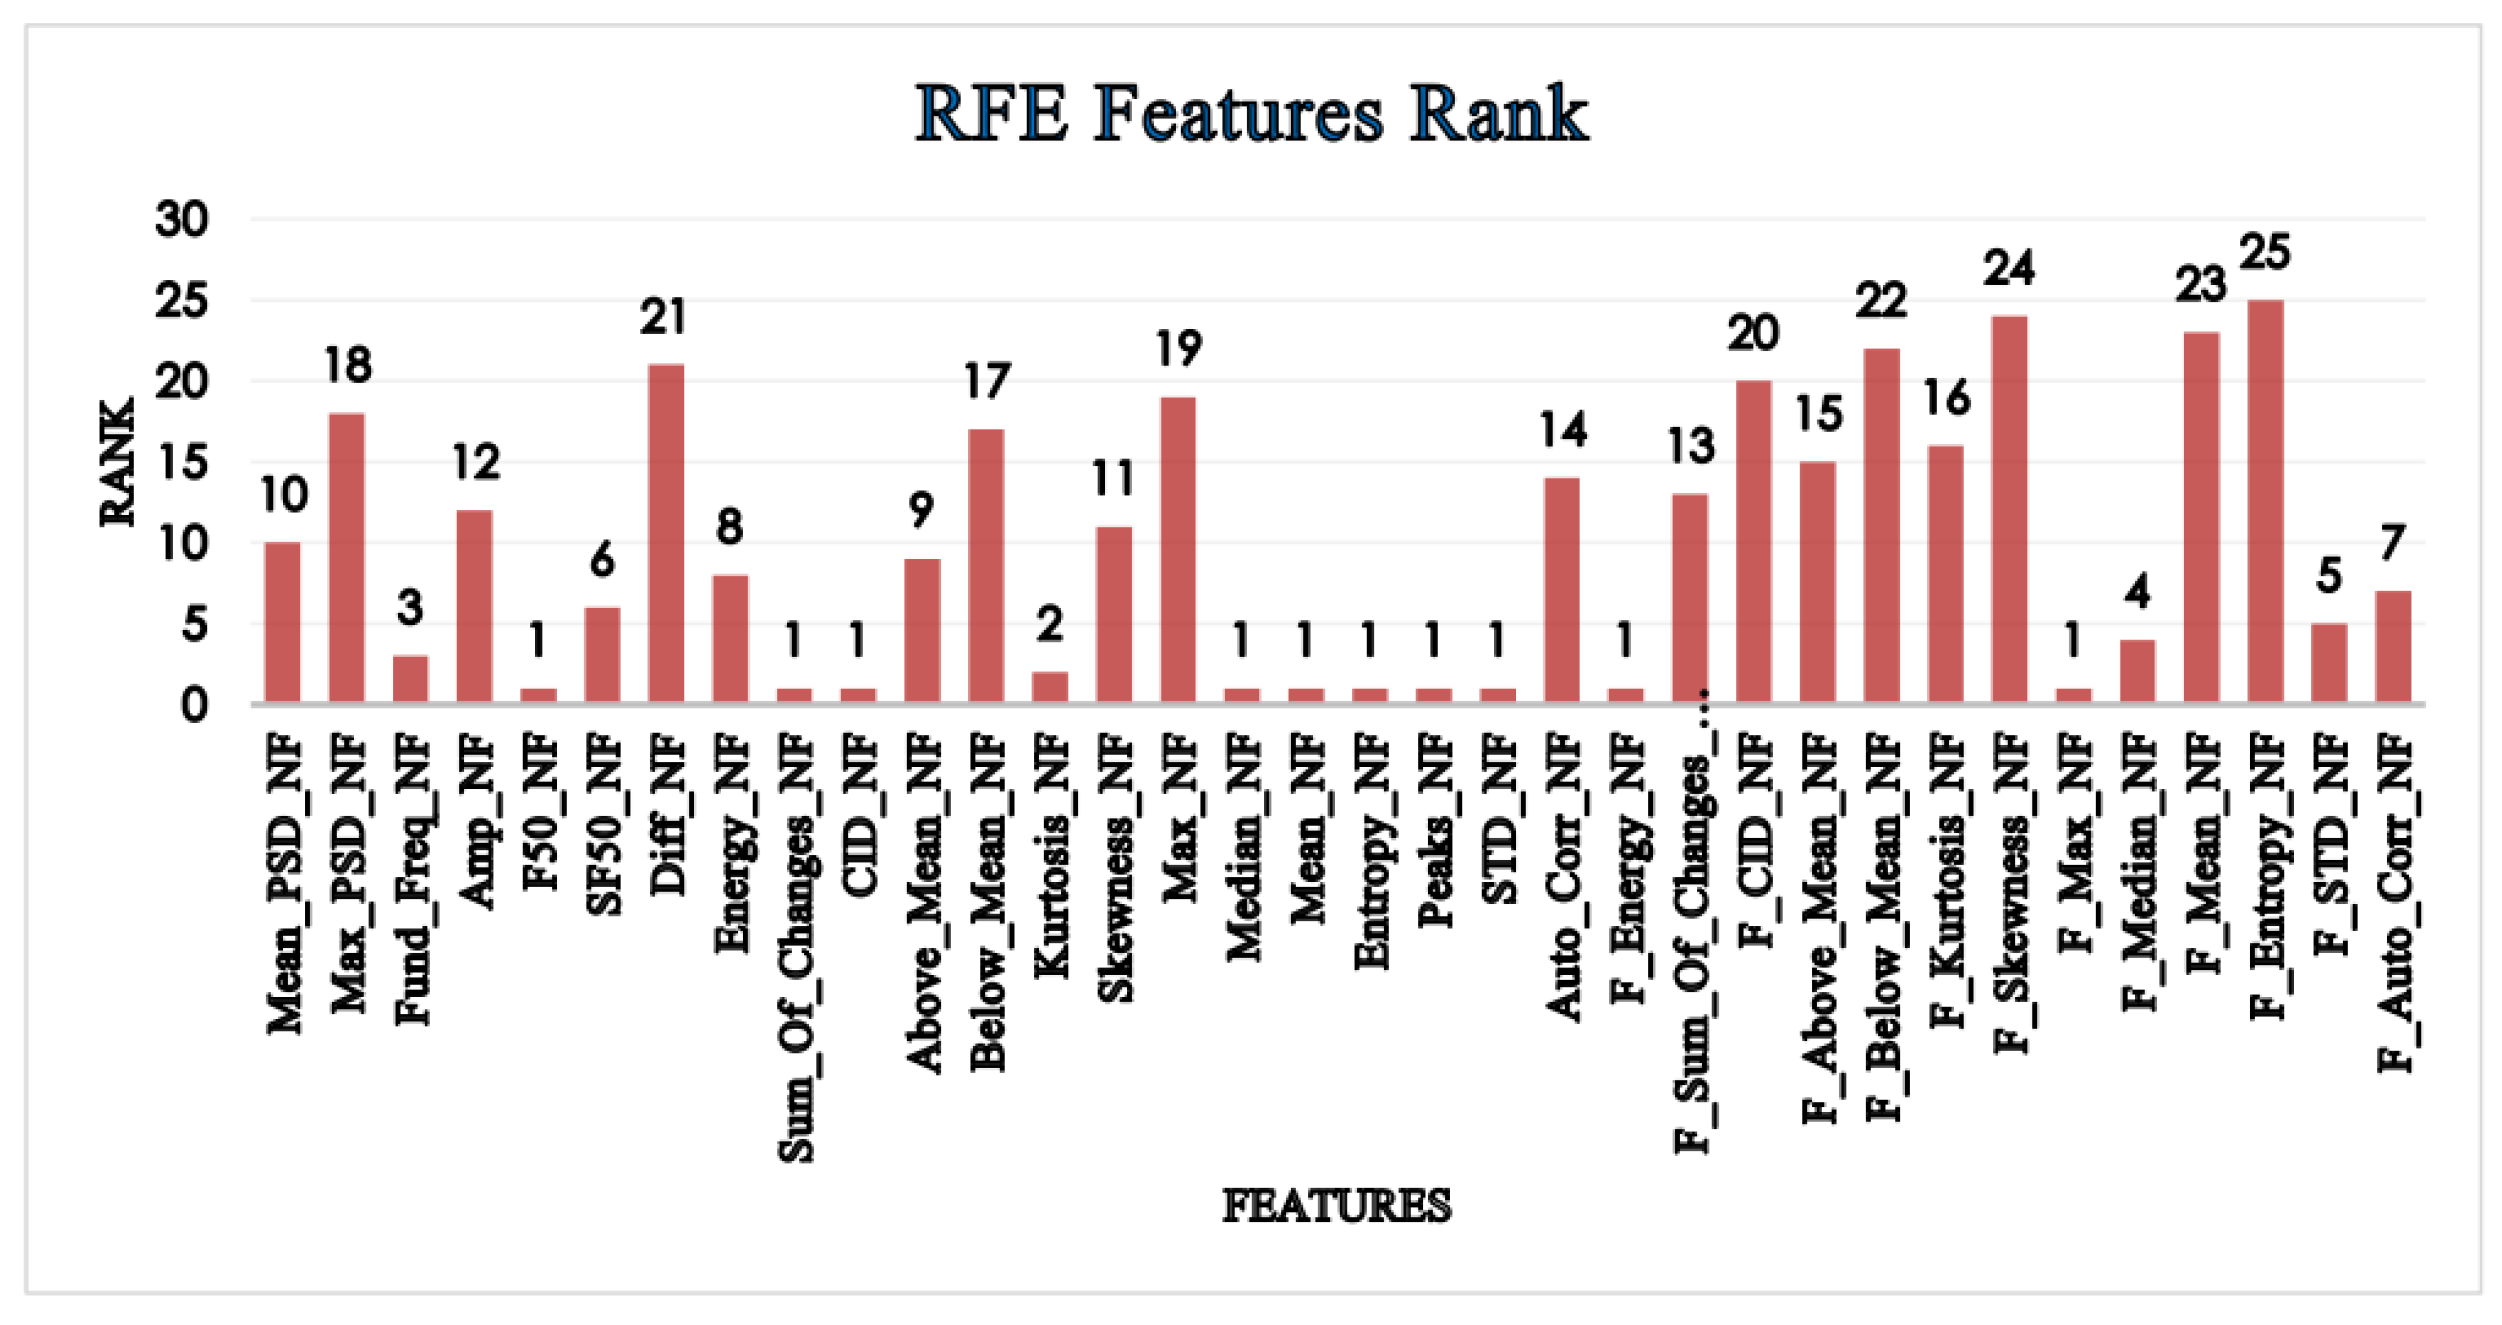
Figure 8.
Classifiers’ overall accuracy on filtered and unfiltered data.
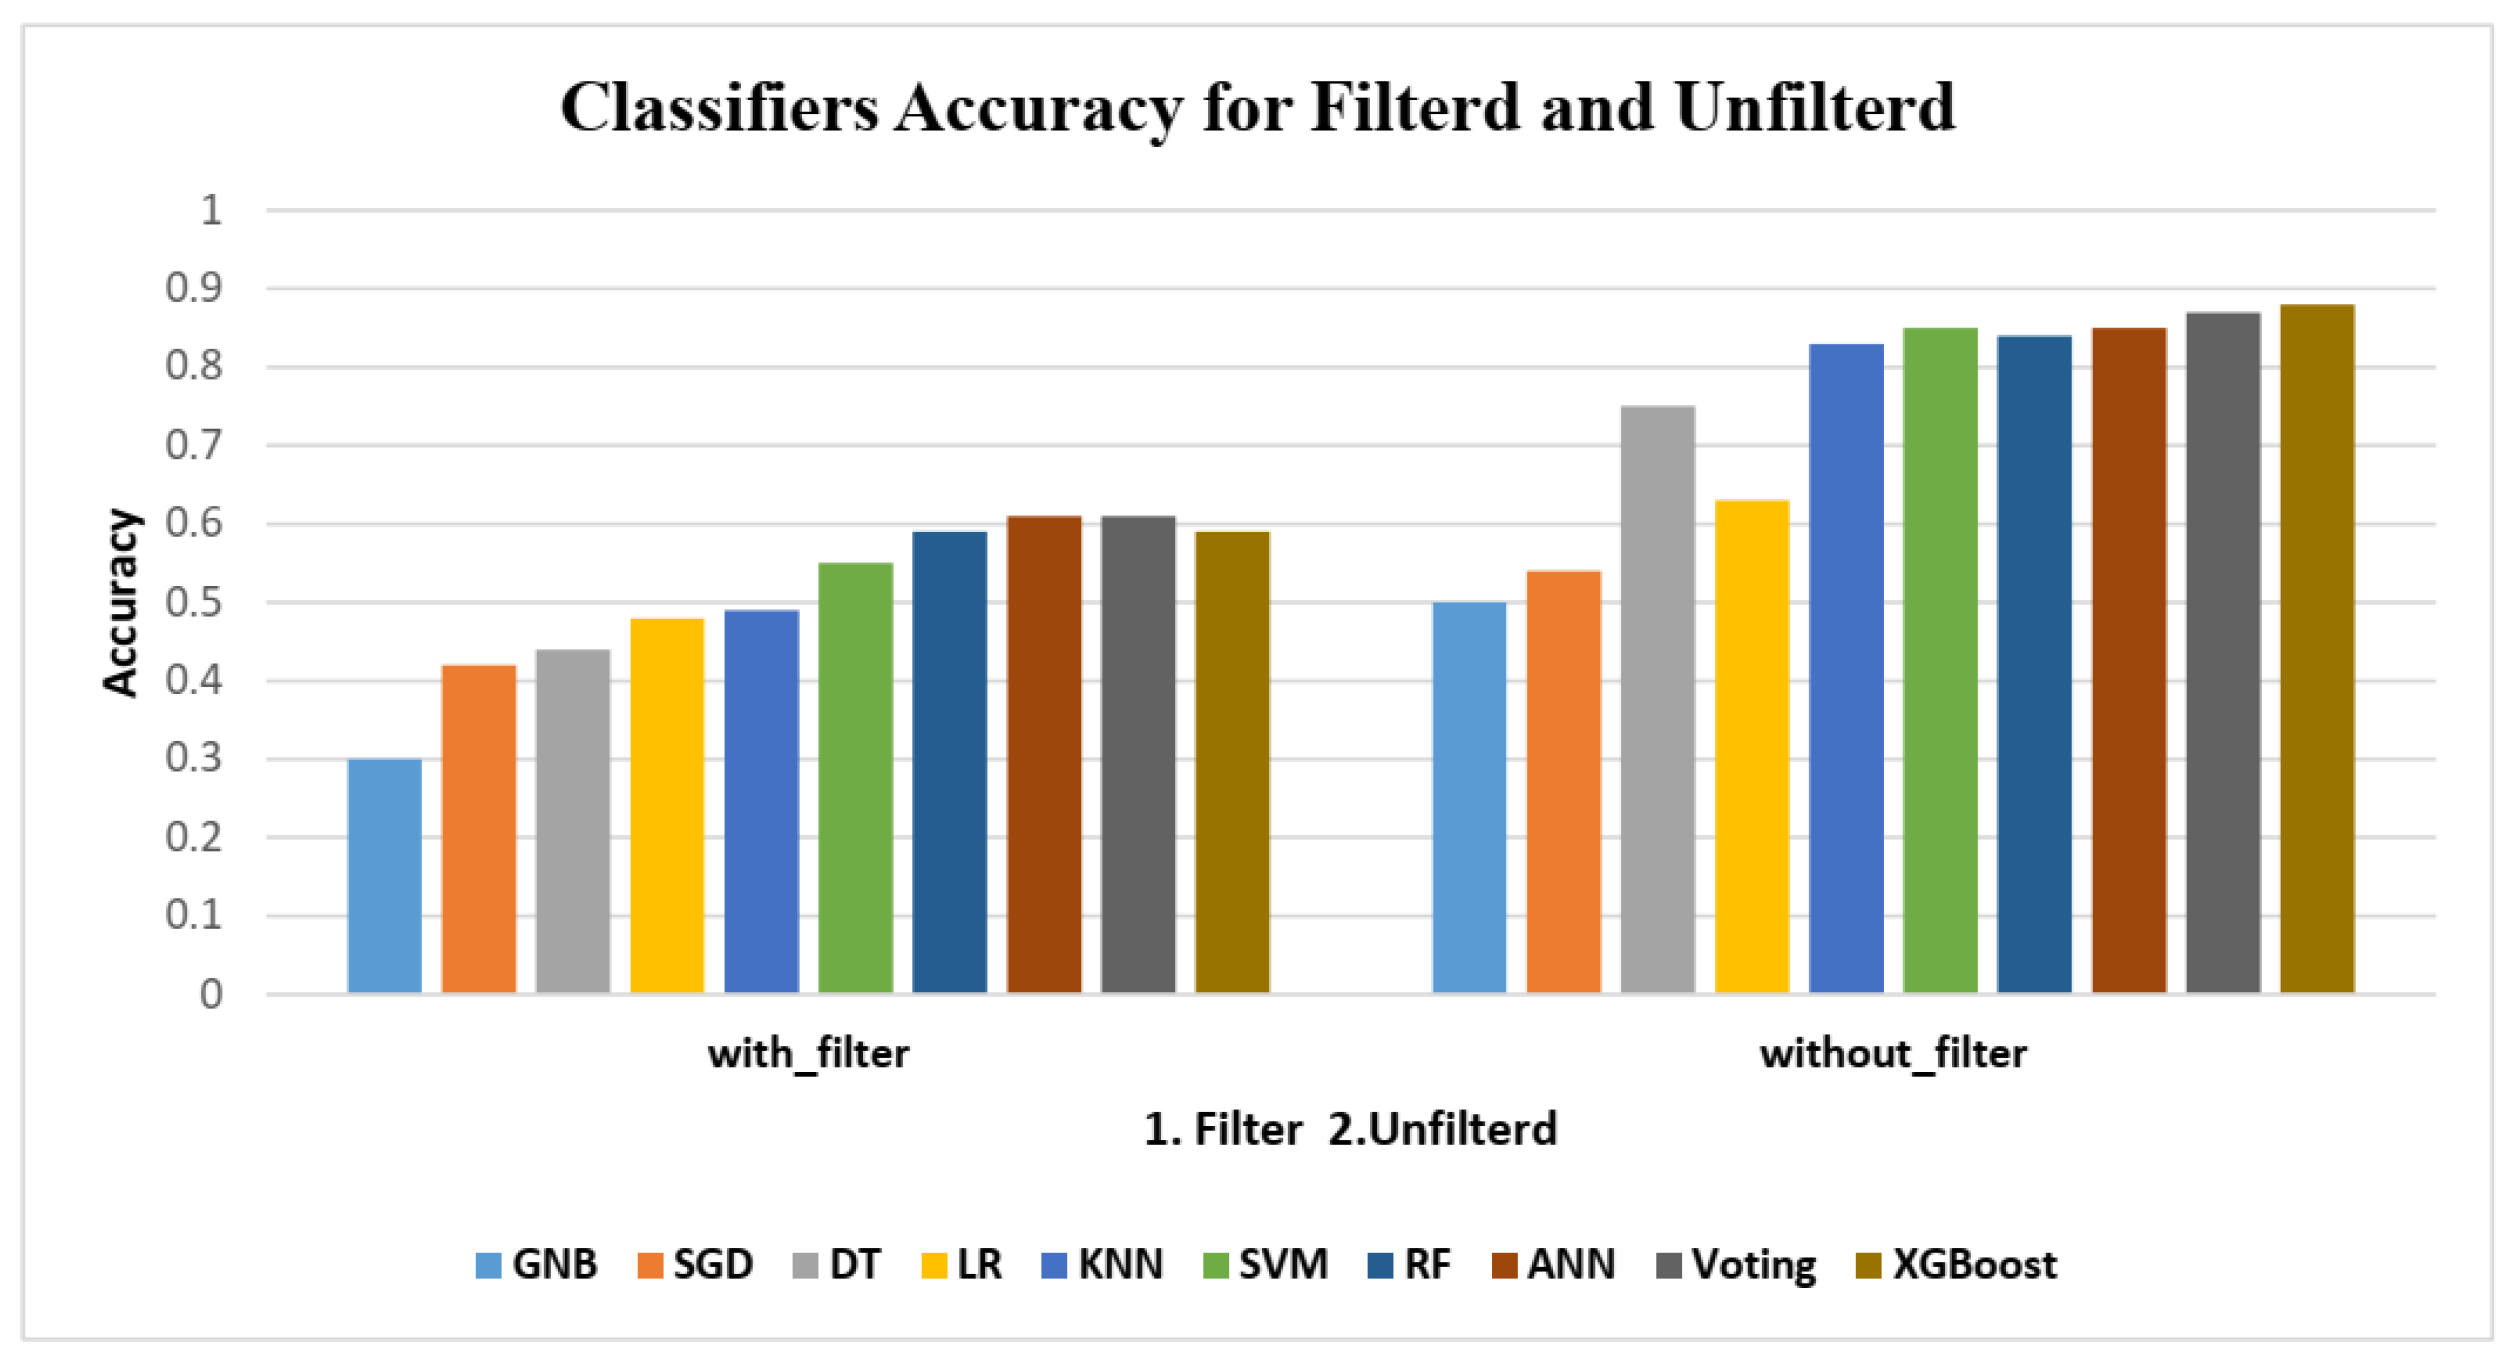
Figure 9.
AUC of identifying 10 users using RF classifier, (left) AUC results of the unfiltered data, (right) AUC results of the filtered data.
Figure 9.
AUC of identifying 10 users using RF classifier, (left) AUC results of the unfiltered data, (right) AUC results of the filtered data.
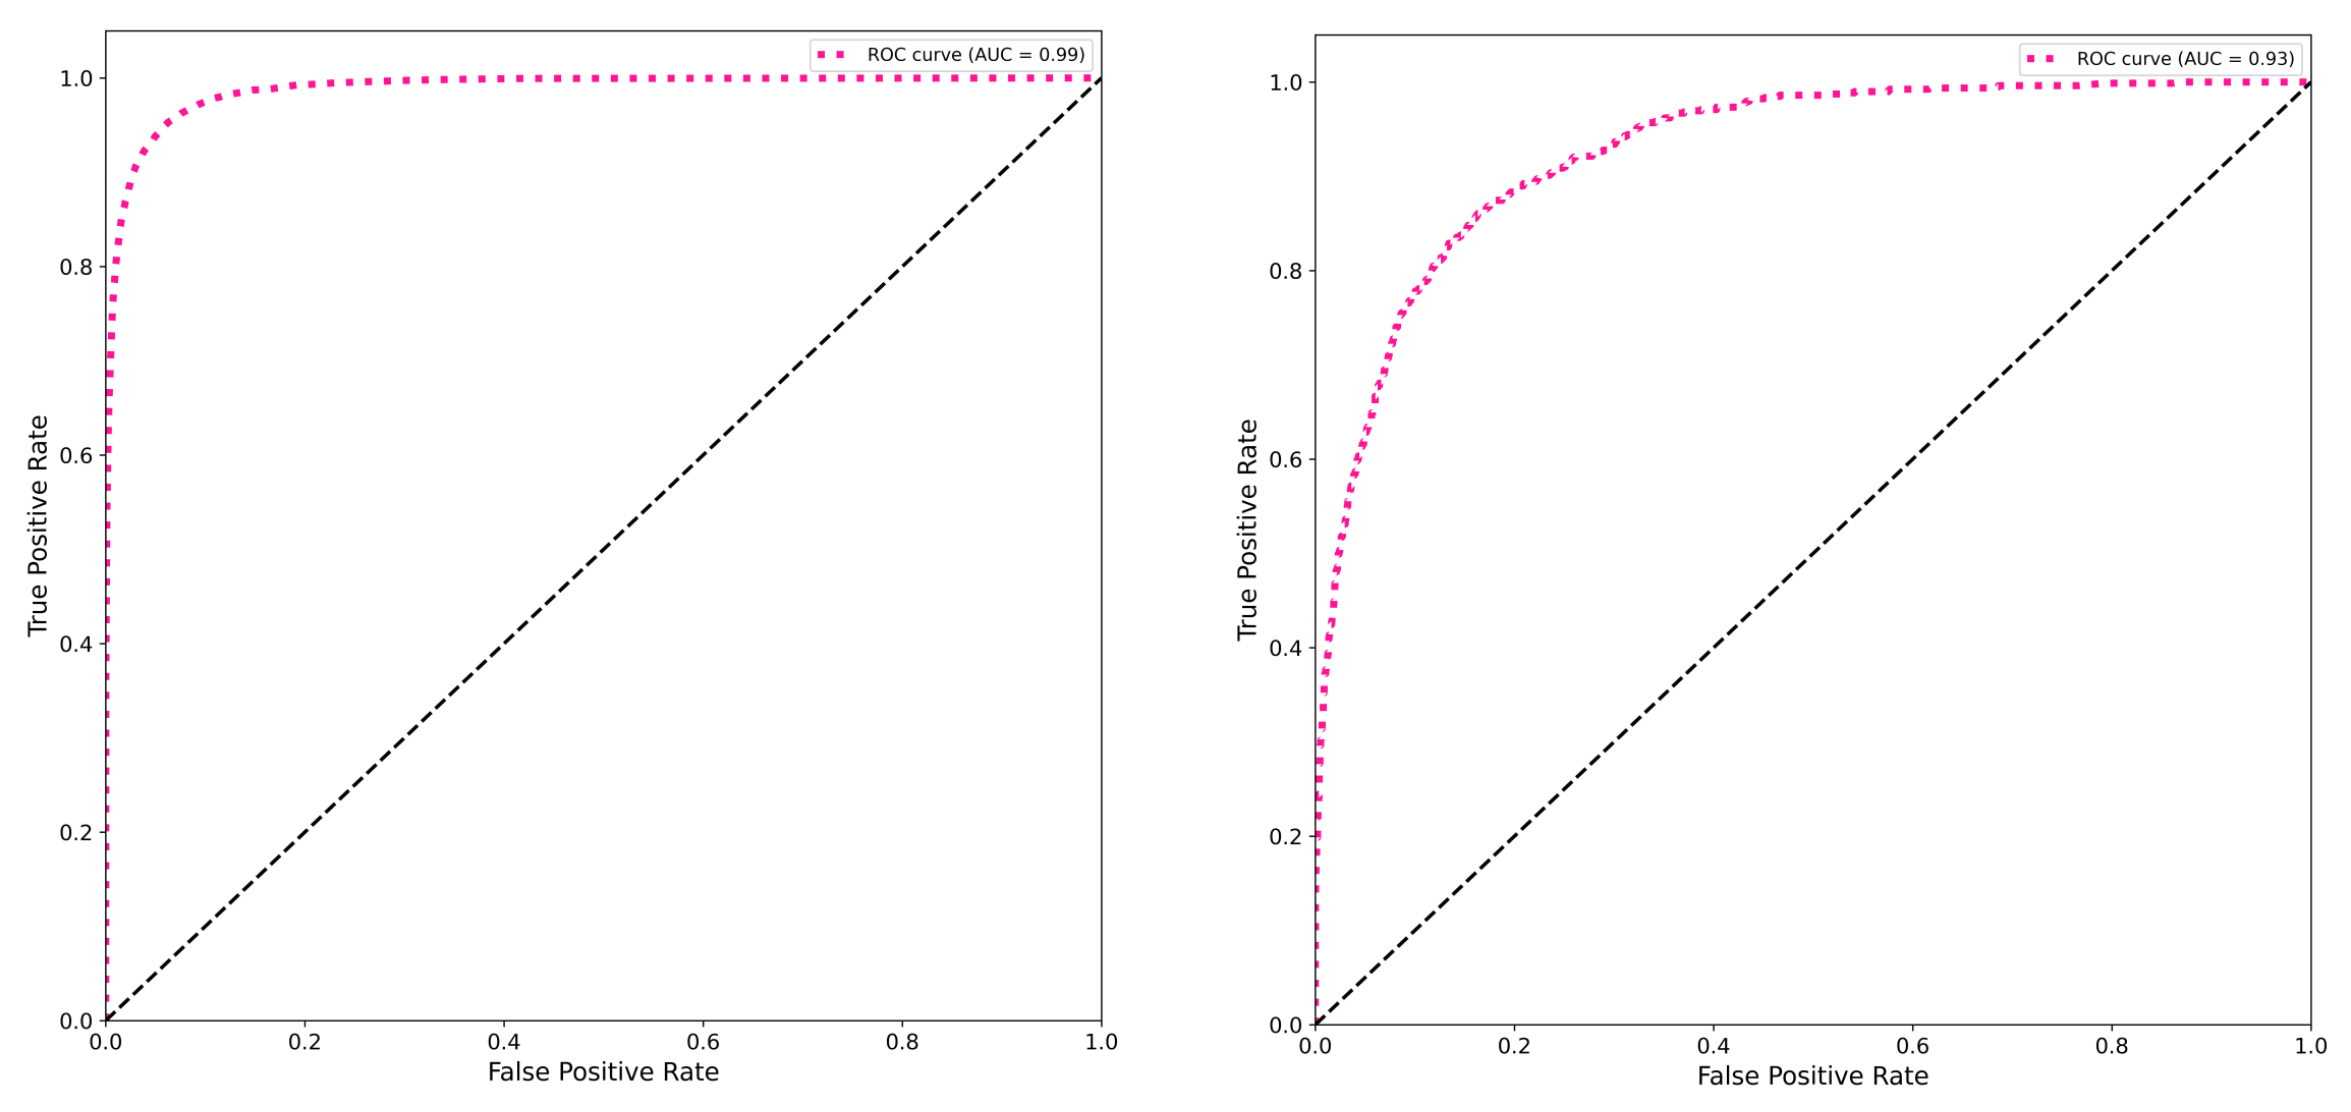
Figure 10.
Accuracy and loss of the LSTM model trained and validated on 10 users.
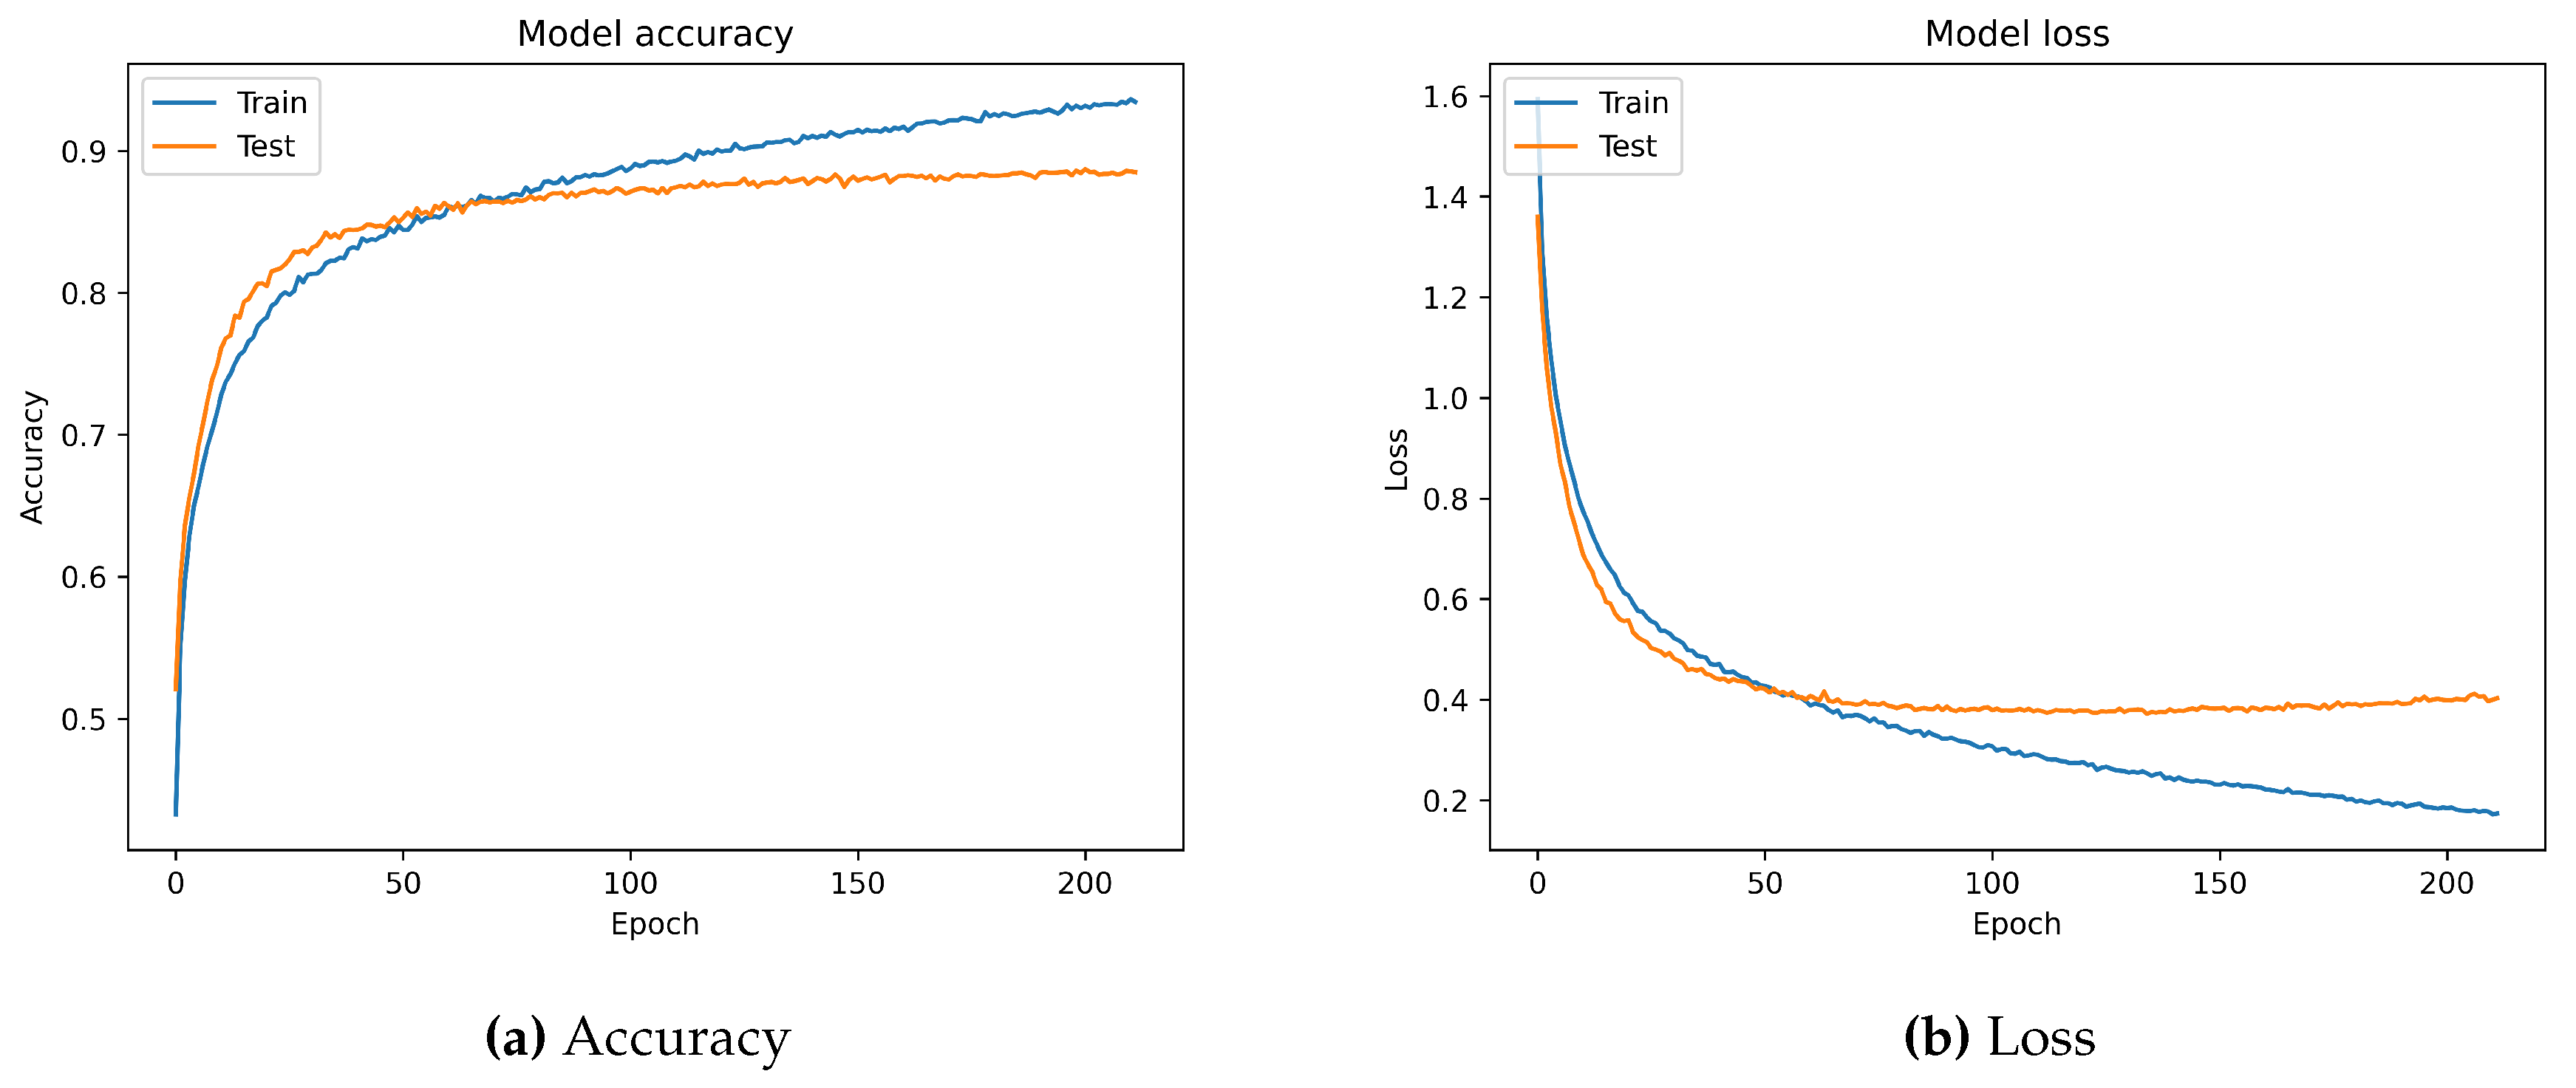

Table 1.
Summary of HMOG dataset characteristics.
| Category | Content |
|---|---|
| Accelerometer | Timestamp, acceleration force along X/Y/Z- axis |
| Subjects | 53 (males), 47 (females) |
| Number of Examples/Subject(Class) | in the range of 1162 to 4639 |
Table 2.
The extracted statistical Features.
| Feature | Description | Equation | From Mag | From FFT |
|---|---|---|---|---|
| Above mean | Count of acceleration measurements that are larger than the mean acceleration value of a corresponding window. |
√ | ||
| Above mean | Count of frequencies that are larger than the mean frequency value of a corresponding window. |
√ | ||
| below mean | Count of acceleration measurements that are smaller than the mean acceleration value of a corresponding window. |
√ | ||
| below mean | Count of frequencies that are smaller than the mean frequency value of a corresponding window. |
√ | ||
| Complexity-invariant distance | Calculate how complex the time series (number of peaks, valleys, etc...) |
√ | ||
| Complexity-invariant distance | Calculate how complex the frequency series (number of peaks, valleys, etc...) |
√ | ||
| Skewness | Measure of symmetry at the right and the left of center point of window. |
√ | ||
| Skewness | Measure of symmetry at the right and the left of the center point of the window. |
√ | ||
| Standard deviation | The average amount of how far each acceleration value lies from the mean acceleration. |
√ | ||
| Standard deviation | The average amount of how far each frequency value lies from the mean frequency. |
√ | ||
| Sample entropy | The Complexity of physiological frequency-series signals. |
√ | √ | |
| Maximum acceleration | The Maximum magnitude value. | √ | ||
| Maximum frequency | The Maximum frequency value. | √ | ||
| Median | The middle number in the sorted magnitude values. |
√ | ||
| Median | The middle number in the sorted frequency values. |
√ | ||
| Mean | Average of magnitude in a corresponding window. |
√ | ||
| Mean | Average of frequencies in a corresponding window. |
√ |
Table 3.
The extracted statistical Features – continue.
| Feature | Description | Equation | From Mag | From FFT |
|---|---|---|---|---|
| Kurtosis | Measure of acceleration outliers in a corresponding window. |
√ | ||
| Kurtosis | Measure of frequency outliers in a corresponding window. |
√ | ||
| Autocorrelation | Serial correlation value with lag=1 of accelerations within a corresponding window. |
√ | ||
| Autocorrelation | Serial correlation value with lag=1 of frequencies within a corresponding window. |
√ | ||
| Sum of absolute differences | Sum over the absolute value of consecutive changes in the Magnitude series. |
√ | ||
| Sum of absolute differences | Sum over the absolute value of consecutive changes in the frequency series. |
√ | ||
| Energy | Sum of All squared accelerations for the corresponding window. |
√ | ||
| Energy | Sum of All squared frequencies for the corresponding window. |
√ | ||
| Peaks | Number of peaks (values bigger than its 2 neighbors). |
√ | ||
| Amplitude of peak Power Spectrum Density | Amplitude of the maximum signal power. |
√ | ||
| Median frequency | Frequency that dividing the total power area into two equal amplitude parts |
√ | ||
| Frequency dispersion | dispersion of sample frequencies within a corresponding window |
√ | ||
| Fundamental frequency | Frequency which carries the maximum energy |
√ | ||
| Frequency difference | Sum over the difference value of consecutive changes in the frequency series |
√ | ||
| Spectral centroid Amplitude | Weighted average of the amplitude spectrum of frequencies of a corresponding window |
√ | ||
| Maximum weighted PSD | The Maximum spectral energy of frequency component within the corresponding window |
√ |
Table 4.
All Classifiers’ performance on Filtered and Unfiltered signals.
| Without filter | With filter | |||||||||||
|---|---|---|---|---|---|---|---|---|---|---|---|---|
| Classifier | PRE | REC | SPE | F1 | GEO | IBA | PRE | REC | SPE | F1 | GEO | IBA |
| ANN_MLP | 0.85 | 0.85 | 0.98 | 0.85 | 0.91 | 0.82 | 0.61 | 0.61 | 0.95 | 0.61 | 0.76 | 0.56 |
| DT | 0.75 | 0.75 | 0.97 | 0.75 | 0.85 | 0.71 | 0.45 | 0.44 | 0.94 | 0.44 | 0.64 | 0.39 |
| GNB | 0.5 | 0.5 | 0.94 | 0.46 | 0.65 | 0.44 | 0.31 | 0.3 | 0.91 | 0.29 | 0.48 | 0.25 |
| KNN | 0.83 | 0.83 | 0.98 | 0.83 | 0.9 | 0.8 | 0.5 | 0.49 | 0.94 | 0.48 | 0.67 | 0.44 |
| LR | 0.63 | 0.63 | 0.95 | 0.62 | 0.77 | 0.58 | 0.49 | 0.48 | 0.94 | 0.48 | 0.67 | 0.43 |
| RF | 0.84 | 0.84 | 0.98 | 0.84 | 0.91 | 0.81 | 0.59 | 0.59 | 0.95 | 0.59 | 0.74 | 0.54 |
| SGD | 0.55 | 0.54 | 0.94 | 0.53 | 0.71 | 0.49 | 0.43 | 0.42 | 0.93 | 0.41 | 0.62 | 0.37 |
| SVM | 0.85 | 0.85 | 0.98 | 0.85 | 0.91 | 0.82 | 0.55 | 0.55 | 0.95 | 0.54 | 0.72 | 0.5 |
| Voting | 0.87 | 0.87 | 0.98 | 0.87 | 0.92 | 0.84 | 0.61 | 0.61 | 0.95 | 0.61 | 0.76 | 0.56 |
| XGBoost | 0.88 | 0.88 | 0.99 | 0.88 | 0.93 | 0.86 | 0.6 | 0.6 | 0.95 | 0.6 | 0.75 | 0.55 |
Table 5.
Identification accuracy with different feature selection methods and subsets.
| Corr. Coef. | Fisher Score | Info. Gain | RFE | All Feat | ||||||
|---|---|---|---|---|---|---|---|---|---|---|
| Classifier | Top 10 |
Top 20 |
Top 30 |
Over 0.1 |
Over 0.15 |
10 Feat |
20 Feat |
30 Feat |
||
| ANN_MLP | 0.77 | 0.59 | 0.82 | 0.84 | 0.83 | 0.8 | 0.79 | 0.84 | 0.84 | 0.85 |
| RF | 0.8 | 0.59 | 0.82 | 0.83 | 0.83 | 0.82 | 0.81 | 0.84 | 0.84 | 0.84 |
| SVM | 0.76 | 0.58 | 0.8 | 0.85 | 0.83 | 0.78 | 0.77 | 0.85 | 0.85 | 0.85 |
| Voting | 0.79 | 0.6 | 0.83 | 0.86 | 0.85 | 0.81 | 0.8 | 0.86 | 0.87 | 0.87 |
| XGBoost | 0.82 | 0.6 | 0.86 | 0.87 | 0.86 | 0.85 | 0.83 | 0.88 | 0.88 | 0.88 |
Table 6.
Classifiers performance with different metrics.
| Classifier | PRE | REC | SPE | F1 | GEO | IBA | AUC | ACC |
|---|---|---|---|---|---|---|---|---|
| ANN | 0.85 | 0.85 | 0.98 | 0.85 | 0.91 | 0.82 | 0.99 | 0.85 |
| DT | 0.75 | 0.75 | 0.97 | 0.75 | 0.85 | 0.71 | 0.86 | 0.75 |
| GNB | 0.5 | 0.5 | 0.94 | 0.46 | 0.65 | 0.44 | 0.87 | 0.5 |
| KNN | 0.83 | 0.83 | 0.98 | 0.83 | 0.90 | 0.8 | 0.96 | 0.83 |
| LR | 0.63 | 0.63 | 0.95 | 0.62 | 0.77 | 0.58 | 0.93 | 0.63 |
| RF | 0.84 | 0.84 | 0.98 | 0.84 | 0.91 | 0.81 | 0.99 | 0.84 |
| SGD | 0.55 | 0.54 | 0.94 | 0.53 | 0.71 | 0.49 | 0.90 | 0.54 |
| SVM | 0.85 | 0.85 | 0.98 | 0.85 | 0.91 | 0.82 | 0.99 | 0.85 |
| Voting | 0.87 | 0.87 | 0.98 | 0.87 | 0.92 | 0.84 | 0.99 | 0.88 |
| XGBoost | 0.88 | 0.88 | 0.99 | 0.88 | 0.93 | 0.86 | 0.99 | 0.88 |
| LSTM | 0.89 | 0.89 | 0.99 | 0.88 | 0.93 | 0.86 | 0.99 | 0.89 |
Table 7.
Results comparison to some related work.
| Work | Sensors | Dataset | Approach | Metrics |
|---|---|---|---|---|
| [22] | Accelerometer Gyroscope Gravity |
HMOG, Proprietary dataset |
HMM-UBM | HMOG EER 14.8%, Proprietary dataset EER 19.2% |
| [23] | Accelerometer Gyroscope Magnetometer |
HMOG combined with Tab and Keystroke | SVM | HMOG EER 13.62% HMOG, TAP, AND KEYSTROKE EER 7.16% |
| Ours | Accelerometer | HMOG | LSTM | PRE 89% REC 89% SPE 99% F1 88% GEO 93% IBA 86% AUC 99% ACC 89% |
Disclaimer/Publisher’s Note: The statements, opinions and data contained in all publications are solely those of the individual author(s) and contributor(s) and not of MDPI and/or the editor(s). MDPI and/or the editor(s) disclaim responsibility for any injury to people or property resulting from any ideas, methods, instructions or products referred to in the content. |
© 2023 by the authors. Licensee MDPI, Basel, Switzerland. This article is an open access article distributed under the terms and conditions of the Creative Commons Attribution (CC BY) license (http://creativecommons.org/licenses/by/4.0/).
Copyright: This open access article is published under a Creative Commons CC BY 4.0 license, which permit the free download, distribution, and reuse, provided that the author and preprint are cited in any reuse.


