Submitted:
29 May 2023
Posted:
02 June 2023
You are already at the latest version
Abstract
Lodging is a common problem in maize production that seriously impacts yield, quality, and the capacity for mechanical harvesting. Evaluation of site-specific lodging risks requires establishment of a method for multi-year monitoring. In this study, spectral images collected by the Sentinel-2 satellite were processed to obtain three types of data: gray-level co-occurrence matrix texture (GLCM), vegetation indices (VIs), and spectral reflectance (SR). Lodging classification models were then established with Random Forest (RF) using each of the three data types separately (the GLCM, VI, and SR models) and in combination (SR+VI model, SR+GLCM model, VI+GLCM mod-el, and SR+VI+GLCM model). By gradually removing features with low importance scores from the SR+VI+GLCM model and analyzing the changes in the overall accuracy (OA), the optimal set of predictive variables was identified and used to construct the optimal model. A model built us-ing data from a single timepoint in 2021 was tested on data collected at a similar timepoint in 2019 and vice versa to assess interannual model generalizability. The results of this study demon-strate that for monitoring maize lodging, models constructed with a single feature type, the GLCM model had significantly lower accuracy compared to the VI and SR models. During certain growth stages, the model constructed with combined features had significantly higher accuracy in monitoring maize lodging compared to models constructed with a single feature. During the pro-cess of selecting the optimal predictive variables, it was found that the accuracy of the model did not increase as the number of predictive variables increased. The results show that the positive and negative validation models had an accuracy of 96.55% and 95.18%, with kappa values of 0.93 and 0.83, respectively. This indicates that the model has strong generality for the same repro-ductive stage between years. This study provides a detailed method for large-scale maize lodging monitoring, allowing for identification of optimal planting practices to reduce the probability of lodging and ultimately improving regional maize yield and quality.
Keywords:
Sentinel-2 multispectral data
; Maize lodging
; Random Forest classification
; Predictive variables
; Model generalizability
1. Introduction
During maize production, lodging can seriously damage the canopy structure, affecting photosynthate production and even causing plant death or premature senescence [1,2]. Lodging causes a reduction in maize yield by 5% to 28% [3,4]. Lodging is affected by a combination of factors, including climatic conditions, variety-specific susceptibility, and plant management practices [5]. Areas with unfavorable combinations of these factors experience frequent lodging disasters, drastically limiting maize production in those locations. Effectively addressing the impact of lodging on maize yield requires establishment of an evaluation system to identify areas that are particularly susceptible to lodging, varieties that are resistant to lodging, and beneficial growth management practices.
Although combinations of key climatic factors affect regional lodging risks [6], the relationship between lodging and interacting meteorological factors is too complex to establish an accurate model to predict regional lodging risks. Remote sensing technologies, which allow fast and accurate field monitoring, have been widely used to monitor crop lodging [7,8,9]. The most valuable method of this type that has been developed to date is satellite remote sensing, which can be used to rapidly obtain data for a geographically extensive range, allowing effective real-time lodging analysis at the city or county scale. This allows governments to conduct targeted improvements in regional planning and crop management measures, reducing lodging risks and thus stabilizing and improving crop yield and quality. Sentinel-series satellites are frequently used in crop lodging studies [7,10,11,12] because they have high resolution and high revisit rates and capture data in many spectral bands. Some researchers have studied crop lodging using Synthetic Aperture Radar (SAR) satellite data [13,14], but due to the strong randomness of the scattered signals in SAR data, monitoring crop lodging with SAR data still has uncertainty [15]. Using unmanned aerial vehicles (UAVs) equipped with spectral or Light Detection and Ranging (LiDAR) sensors to monitor crop failure can achieve better crop lodging monitoring. [16,17]. However, the limited range of UAV monitoring makes it difficult to obtain data for a large geographic area, which restricts their application in crop lodging risk monitoring.
Random Forest (RF) classifiers have been widely used in construction of crop lodging models. Both Qu et al. and Guan et al. used RF in maize lodging classification models [11,18]. Zhou et al. used remote-sensing data obtained from the Gaofen-1 satellite (GF-1) to establish models based on RF and partial least squares (PLS) to monitor maize lodging levels at the regional level. The results showed that the RF model performed significantly better than the PLS model in monitoring maize lodging levels [19]. RF can be used to identify predictive variables (features) with the strongest influence in a model [20]. For example, Liu et al. used an RF-based model to estimate maize yield at several stages of fertility, then analyzed the feature importance indices at each stage [17]; Zheng et al. used relative importance values from an RF model to select the single best variable for rice yield prediction [21].
Previous studies primarily used differences in plant reflectance characteristics before and after lodging to detect areas affected by lodging, which yielded good results. However, such studies did not focus on model generalizability between years, making it difficult to provide long-term regional inversion risk determinations. This study used Sentinel-2 satellite spectral data and RF algorithm to construct multiple models for monitoring maize, and determined the accuracy of specific spectral and textural feature combinations to detect maize lodging. It analyzed the relationship between predictor variables and overall accuracy (OA), and evaluated the transferability of a model built from single-view images after lodging occurrence to similar images captured in a different year. The study established a valuable maize lodging risk monitoring model, which will enable researchers to accurately identify factors associated with lodging and help reduce lodging risks in the future.
2. Materials and Methods
2.1. Study area
The study area was located at the junction of Yihe Tara Town and Jianhua Town in Kailu County, Tongliao City, Inner Mongolia (43°40'40–43°43'40 "N; 121°8'20–121°12'40 "E). This region is within a middle temperate regional climate zone and has a semi-arid continental monsoon climate with dry, windy conditions, a long frost-free period, sufficient sunshine, and high cumulative temperatures [22], making it suitable for maize growth and development.
2.2. Survey of ground data
Based on the information provided by the Tongliao City Bureau of Agriculture and Animal Husbandry, the study area suffered large-scale maize lodging from 2019 to 2021. From July 13 to July 18, 2022, our research group, guided by the staff of the Kailu County Agricultural Extension Center, visited villages where large-scale maize lodging occurred within the past three years. With the guidance of local farmers, we identified and located the lodged and non-lodged areas. The cell phone software "GPS Toolbox" (using the WGS-84 coordinate system) was used to record the latitudes and longitudes of the identified lodging and non-lodging areas. The GPS Toolbox has a positioning accuracy of 10 meters, but in outdoor areas with open space, the positioning accuracy can be between 3 and 5 meters [23]. Points within the maize areas that did not recover naturally from lodging or were not manually straightened were classified as lodged points, while points within maize areas that did not experience lodging were classified as non-lodged points. The points were then overlaid onto remote sensing images, and a manual visual inspection was conducted to ensure that only points within the study area were retained. In 2019, we recorded 141 lodged points and 150 non-lodged points. In 2021, we recorded 149 lodged points and 165 non-lodged points, as shown in Figure 1. These identified sample points were inputted into a Random Forest classifier for further study. In this study, the "Define Projection" tool in ArcGIS 10.8 was used to convert the coordinates of the sample points to the projection coordinate system "WGS84_UTM_Zone_50N", in order to ensure the consistency between the coordinates of the sample points and the coordinate system used in the remote sensing image data, and to facilitate accurate spatial analysis and data overlay operations.
2.3. Satellite data sources
We here used Sentinel-2 multispectral image analysis to construct maize lodging models. Sentinel-2 is a satellite with wide-field, high-resolution, multispectral imaging capacity that has a global revisit frequency of 5 d. The data collected by this satellite are freely accessible and suitable for assessing vegetation conditions and soil and water cover. Sentinel-2 images used in this study were obtained directly from Google Earth Engine (GEE). Maize harvesting typically begins on October 1 in the Tongliao region; data were used from the time of lodging occurrence until October 1 of 2019 and 2021. Data were filtered to include only images with < 10% cloud cover. Sentinel-2 images used for lodging monitoring in this study and data regarding the corresponding maize growth periods are shown in Table 1. The present study utilized all the bands with 10-meter and 20-meter resolution in Sentinel-2 imagery. Resampling methods can be used to standardize the resolution of different spectral bands, which facilitates vegetation index calculation. To avoid the influence of other features on maize lodging monitoring, images taken prior to lodging occurrence were used to extract the maize growing area in subsequent images. Specifically, an image taken on July 20, 2019, by Sentinel-2 and an image taken on July 1, 2021, by the Gaofen-6WFV satellite(GF-6WFV) were used to extract the maize growing region.
2.3. Lodging monitoring indicators
Lodging affects the uptake and transport of nutrients in maize plants, leading to reductions in water and chlorophyll content. We therefore used vegetation indices (VIs) that are sensitive to both chlorophyll and water levels and have previously been published as indicators of lodging (Table 3).
Lodging is also associated with significant changes in the maize canopy structure. Textural features are sensitive to object structure. Li et al. showed that the mean values of the gray-level co-occurrence matrix (GLCM) texture for the three bands (red, green, and blue) can be used to accurately monitor maize lodging [33]. This study converted these three bands to grayscale maps in Google earth engine (GEE) with the following Equation (1). The eight GLCM features of each image (Table 4) were then extracted in a 3 * 3 window.
The R, G, and B represent the red, blue, and green spectral bands in the Sentinel-2 multispectral imagery.
2.4. Lodging classification model
2.4.1. Model building
By combining spectral reflectance (SR), vegetation index (VI), and gray-level co-occurrence matrix (GLCM) features in various ways, RF models were constructed, including the SR model, VI model, GLCM model, (SR+VI) model, (SR+GLCM) model, (VI+GLCM) model, and (SR+VI+GLCM) model. The entire dataset was randomly divided into a training set (70% of the points) and a validation set (30%). Each model used 150 decision trees; 13 seeds were used by the random number generator; and the maximum depth of the decision tree was set such that each leaf was “pure” (i.e., each leaf contained fewer than the minimum number of samples needed to split the internal nodes). We used the McNemar test method to analyze the significance differences between different models. Predictive variable importance scores were analyzed in the SR+VI+GLCM models. The optimal feature set was selected by cumulatively removing the features with the lowest importance values and analyzing associated changes in model accuracy. The optimal feature set was used to construct the final RF model. This optimal model was then used to analyze the model generalizability (i.e., model accuracy in application to data from a different year than the training set). First, a model using the optimal feature set was constructed using data from the image taken on September 18, 2021 (at 131 days after seeding). The resulting model was then tested on data collected on September 19, 2019 (at 133 days after seeding). Next, a model using the optimal feature set was generated from data collected on September 19, 2019, and tested using data collected on September 18, 2021. These results were used to assess model generalizability.
2.4.2. Accuracy evaluation
As described above, the model was trained on a randomly-selected 70% of the data points and validated with the remaining 30%. This division and training were repeated 10 times. Maize lodging monitoring accuracy was evaluated using OA, user's accuracy (UA), producer's accuracy (PA), and the kappa coefficient (kappa). OA is the most commonly-used evaluation index in semantic segmentation. It refers to the ratio of correctly predicted instances out of the total number of instances, with a higher OA ratio corresponding to a more reliable model. In this study, OA was calculated as follows:
where the true positive (TP) value is the number of points accurately predicted as lodged; true negative (TN) is the number of points accurately predicted as non-lodged; false positive (FP) is the number of points incorrectly predicted as lodged; and false negative (FN) is the number of points inaccurately predicted as non-lodged. UA refers to the percentage of accurately predicted lodged points (TP) out of all points predicted as lodged (TP+FP):
PA is the percentage of all lodged points (TP+FN) accurately predicted as lodged (TP):
The kappa coefficient is used for consistency testing and can also be used to measure classification accuracy. It is calculated as follows:
where pe is the sum of the "product of actual and predicted numbers" for all categories, divided by the "square of the total number of samples".
3. Results
3.1. Extraction of maize planting area
The maize planting area was extracted from each image to prevent irrelevant image features from influencing maize lodging monitoring. Monitoring maize areas using the RF classification method. In 2019, the OA was 97.12% with a kappa value of 0.94; in 2021, the OA was 96.82% with a kappa value of 0.93. The models built for both years therefore had high classification accuracy and met the conditions for sufficiently monitoring maize lodging. Some plots in the study area were planted with other crops between 2019 and 2021, resulting in a smaller maize planting area in 2021 (Figure 2).

Table 5.
Maize planting region extraction results in 2019 and 2021.
| Maize area | Non-maize area | OA | Kappa | |||
|---|---|---|---|---|---|---|
| Correct | Error | Correct | Error | |||
| 2019 | 285 | 6 | 220 | 9 | 97.12% | 0.94 |
| 2021 | 305 | 9 | 212 | 8 | 96.82% | 0.93 |
3.2. Feature responses to maize lodging
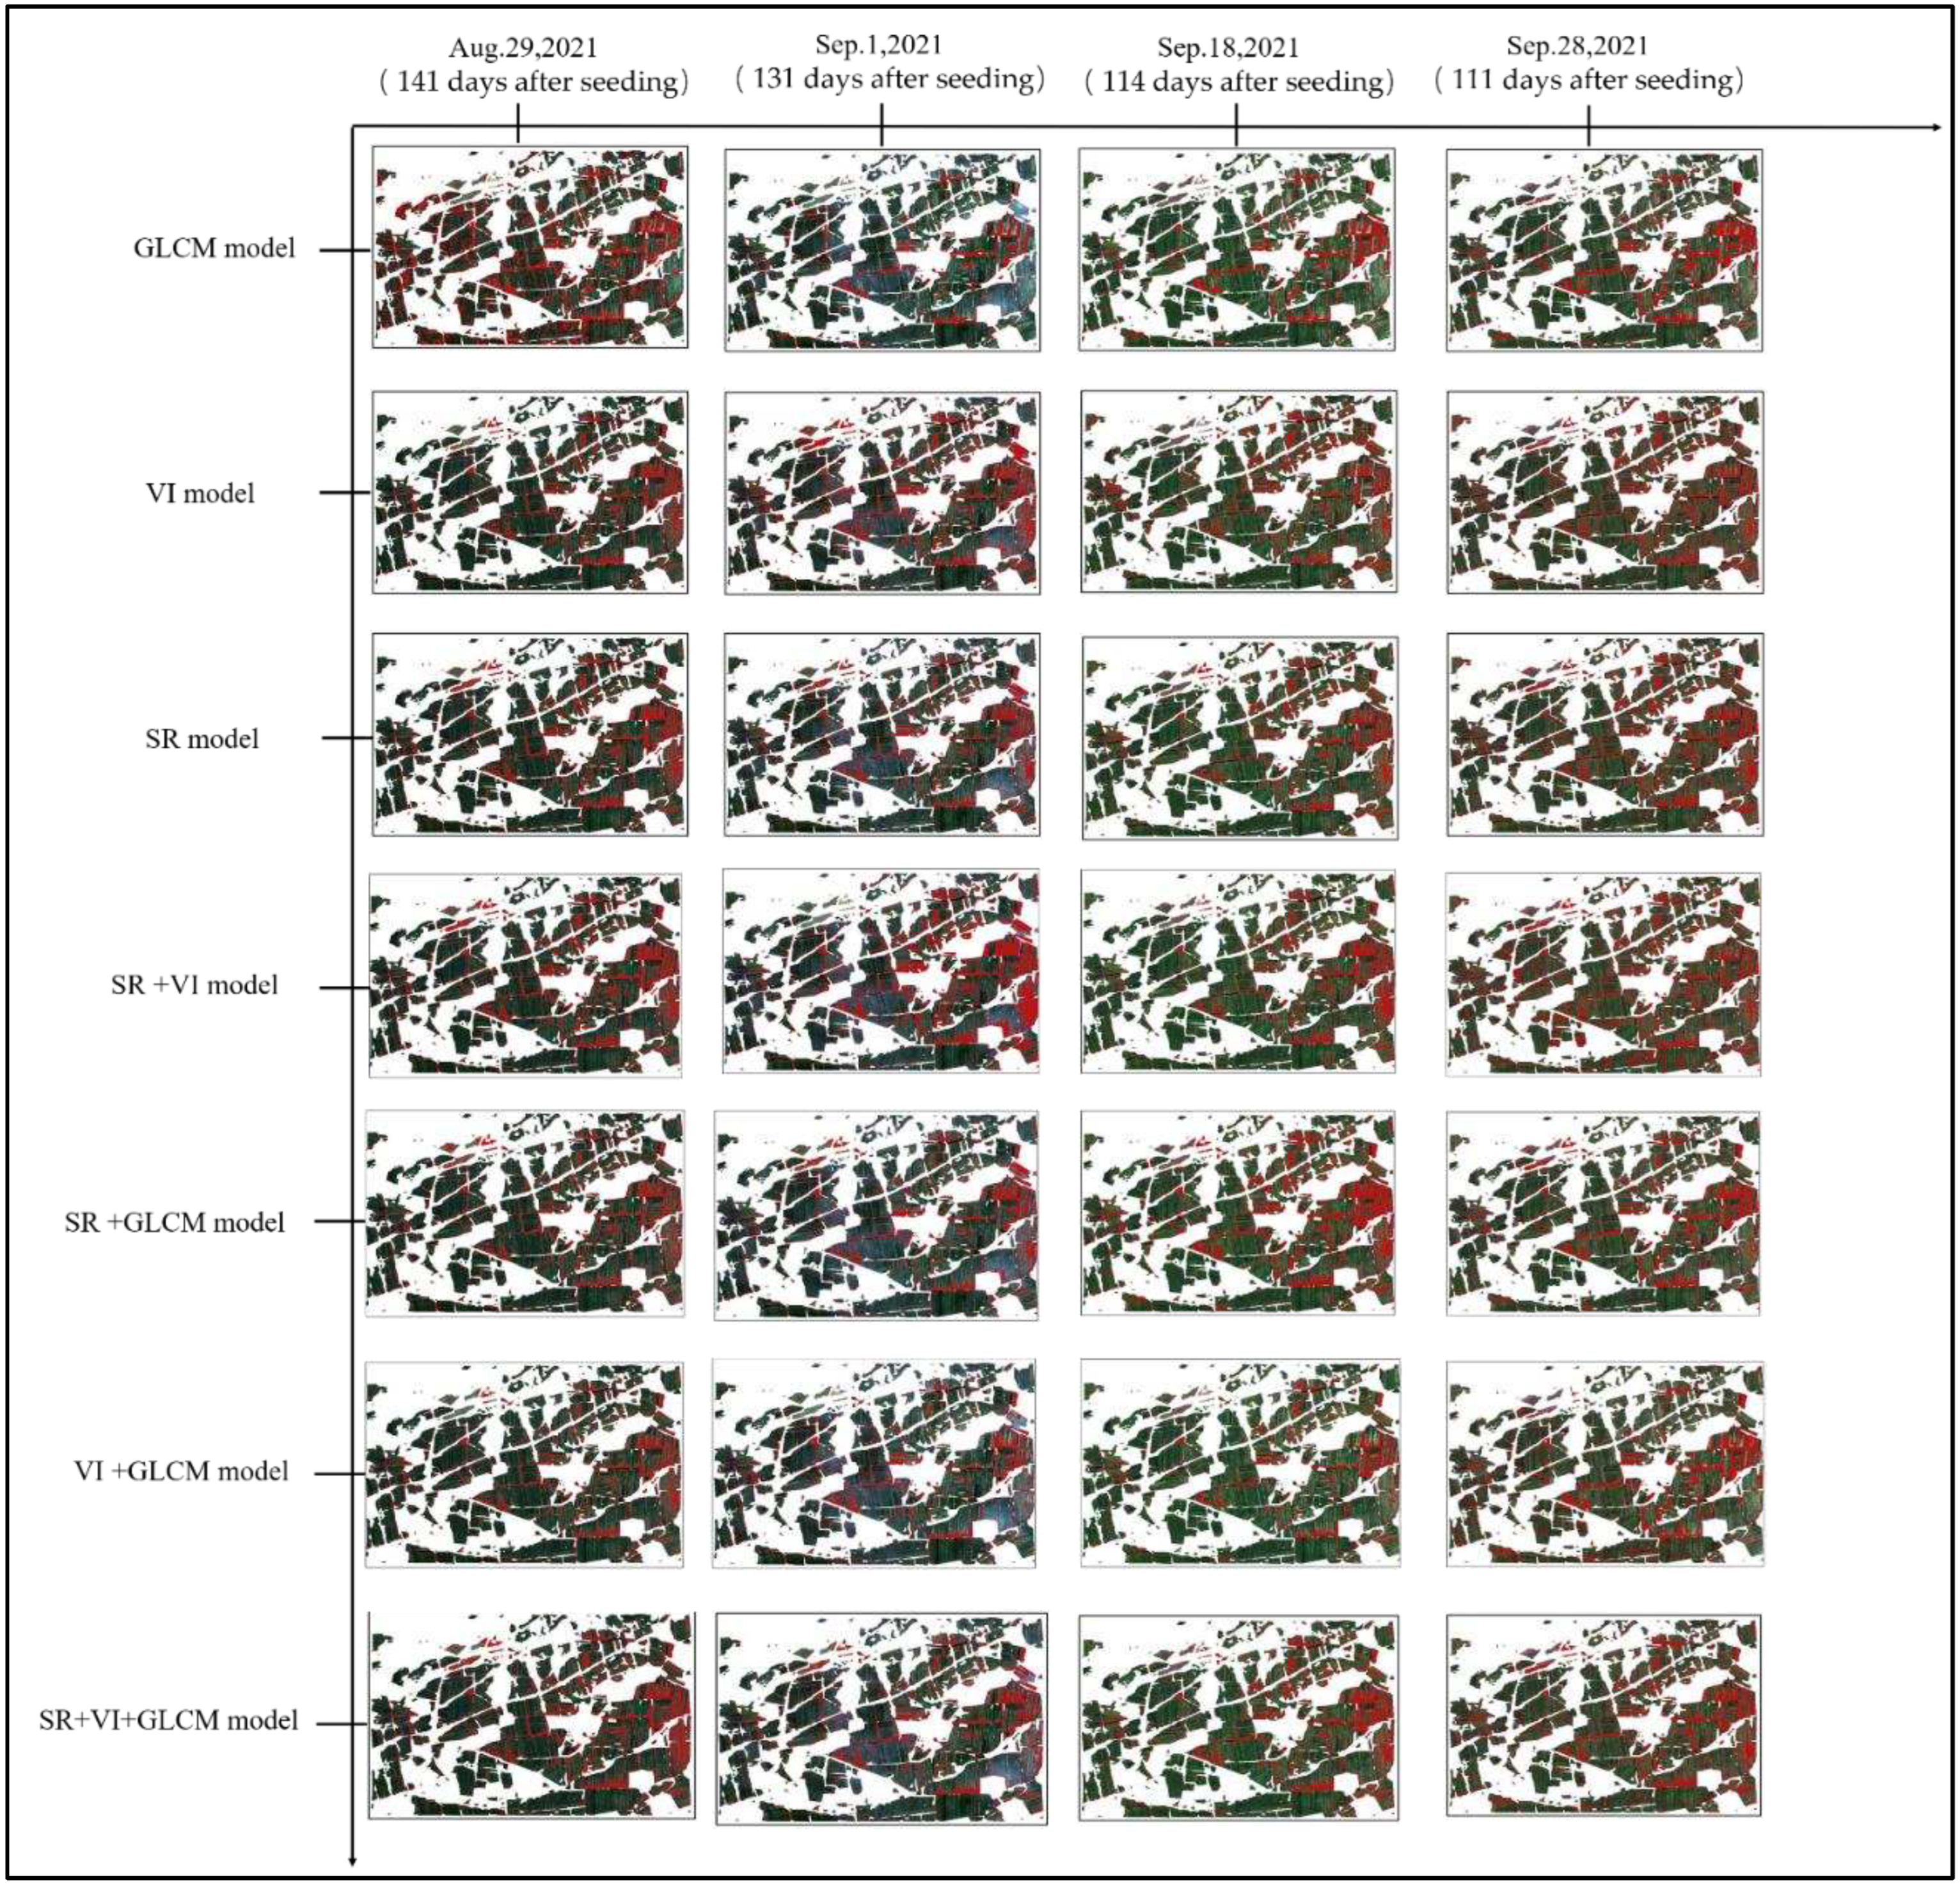
Different models were used for monitoring lodging at multiple growth stages after its occurrence, and the monitoring capability of different features for lodging was analyzed. Table 6 shows that the average overall accuracy (OA) of the GLCM model is below 90%, and the average Kappa coefficient is mostly below 80%. In contrast, the average OA of the SR model, VI model, SR+VI model, SR+GLCM model, VI+GLCM model, and SR+VI+GLCM model is mostly above 90%, and the average Kappa coefficient is mostly above 80%. Average OA and Average Kappa are the average results obtained by validating 10 randomly selected sample points. Based on the McNemar test results in Figure 4, there is a significant difference between the GLCM model and the other models, indicating that the response of the GLCM model to maize lodging detection is significantly lower than that of other features. During the image monitoring of maize lodging on September 1, 2021 (124 d) and September 28, 2021 (151 d), there is a significant difference between the SR+VI+GLCM model and the single models composed of SR, VI, and GLCM. Similarly, during the image monitoring of maize lodging on August 29, 2021 (121 d), there is a significant difference between the SR+VI+GLCM model and the single models composed of VI and GLCM. These results suggest that the accuracy of the models constructed with multiple feature combinations is better than that of models constructed with a single feature. However, there is no significant difference between the SR+VI+GLCM model and the SR+VI model, VI+GLCM model, and SR+GLCM model, indicating that the accuracy of the model does not necessarily increase with the number of features.
Figure 3.
Classification results of models built with different feature sets. The red area represents the lodging area detected by different models, and the green area corresponds to the RGB map of maize during the maize growth period in 2021.
Figure 3.
Classification results of models built with different feature sets. The red area represents the lodging area detected by different models, and the green area corresponds to the RGB map of maize during the maize growth period in 2021.
3.3. Relationships between predictive variables and OA
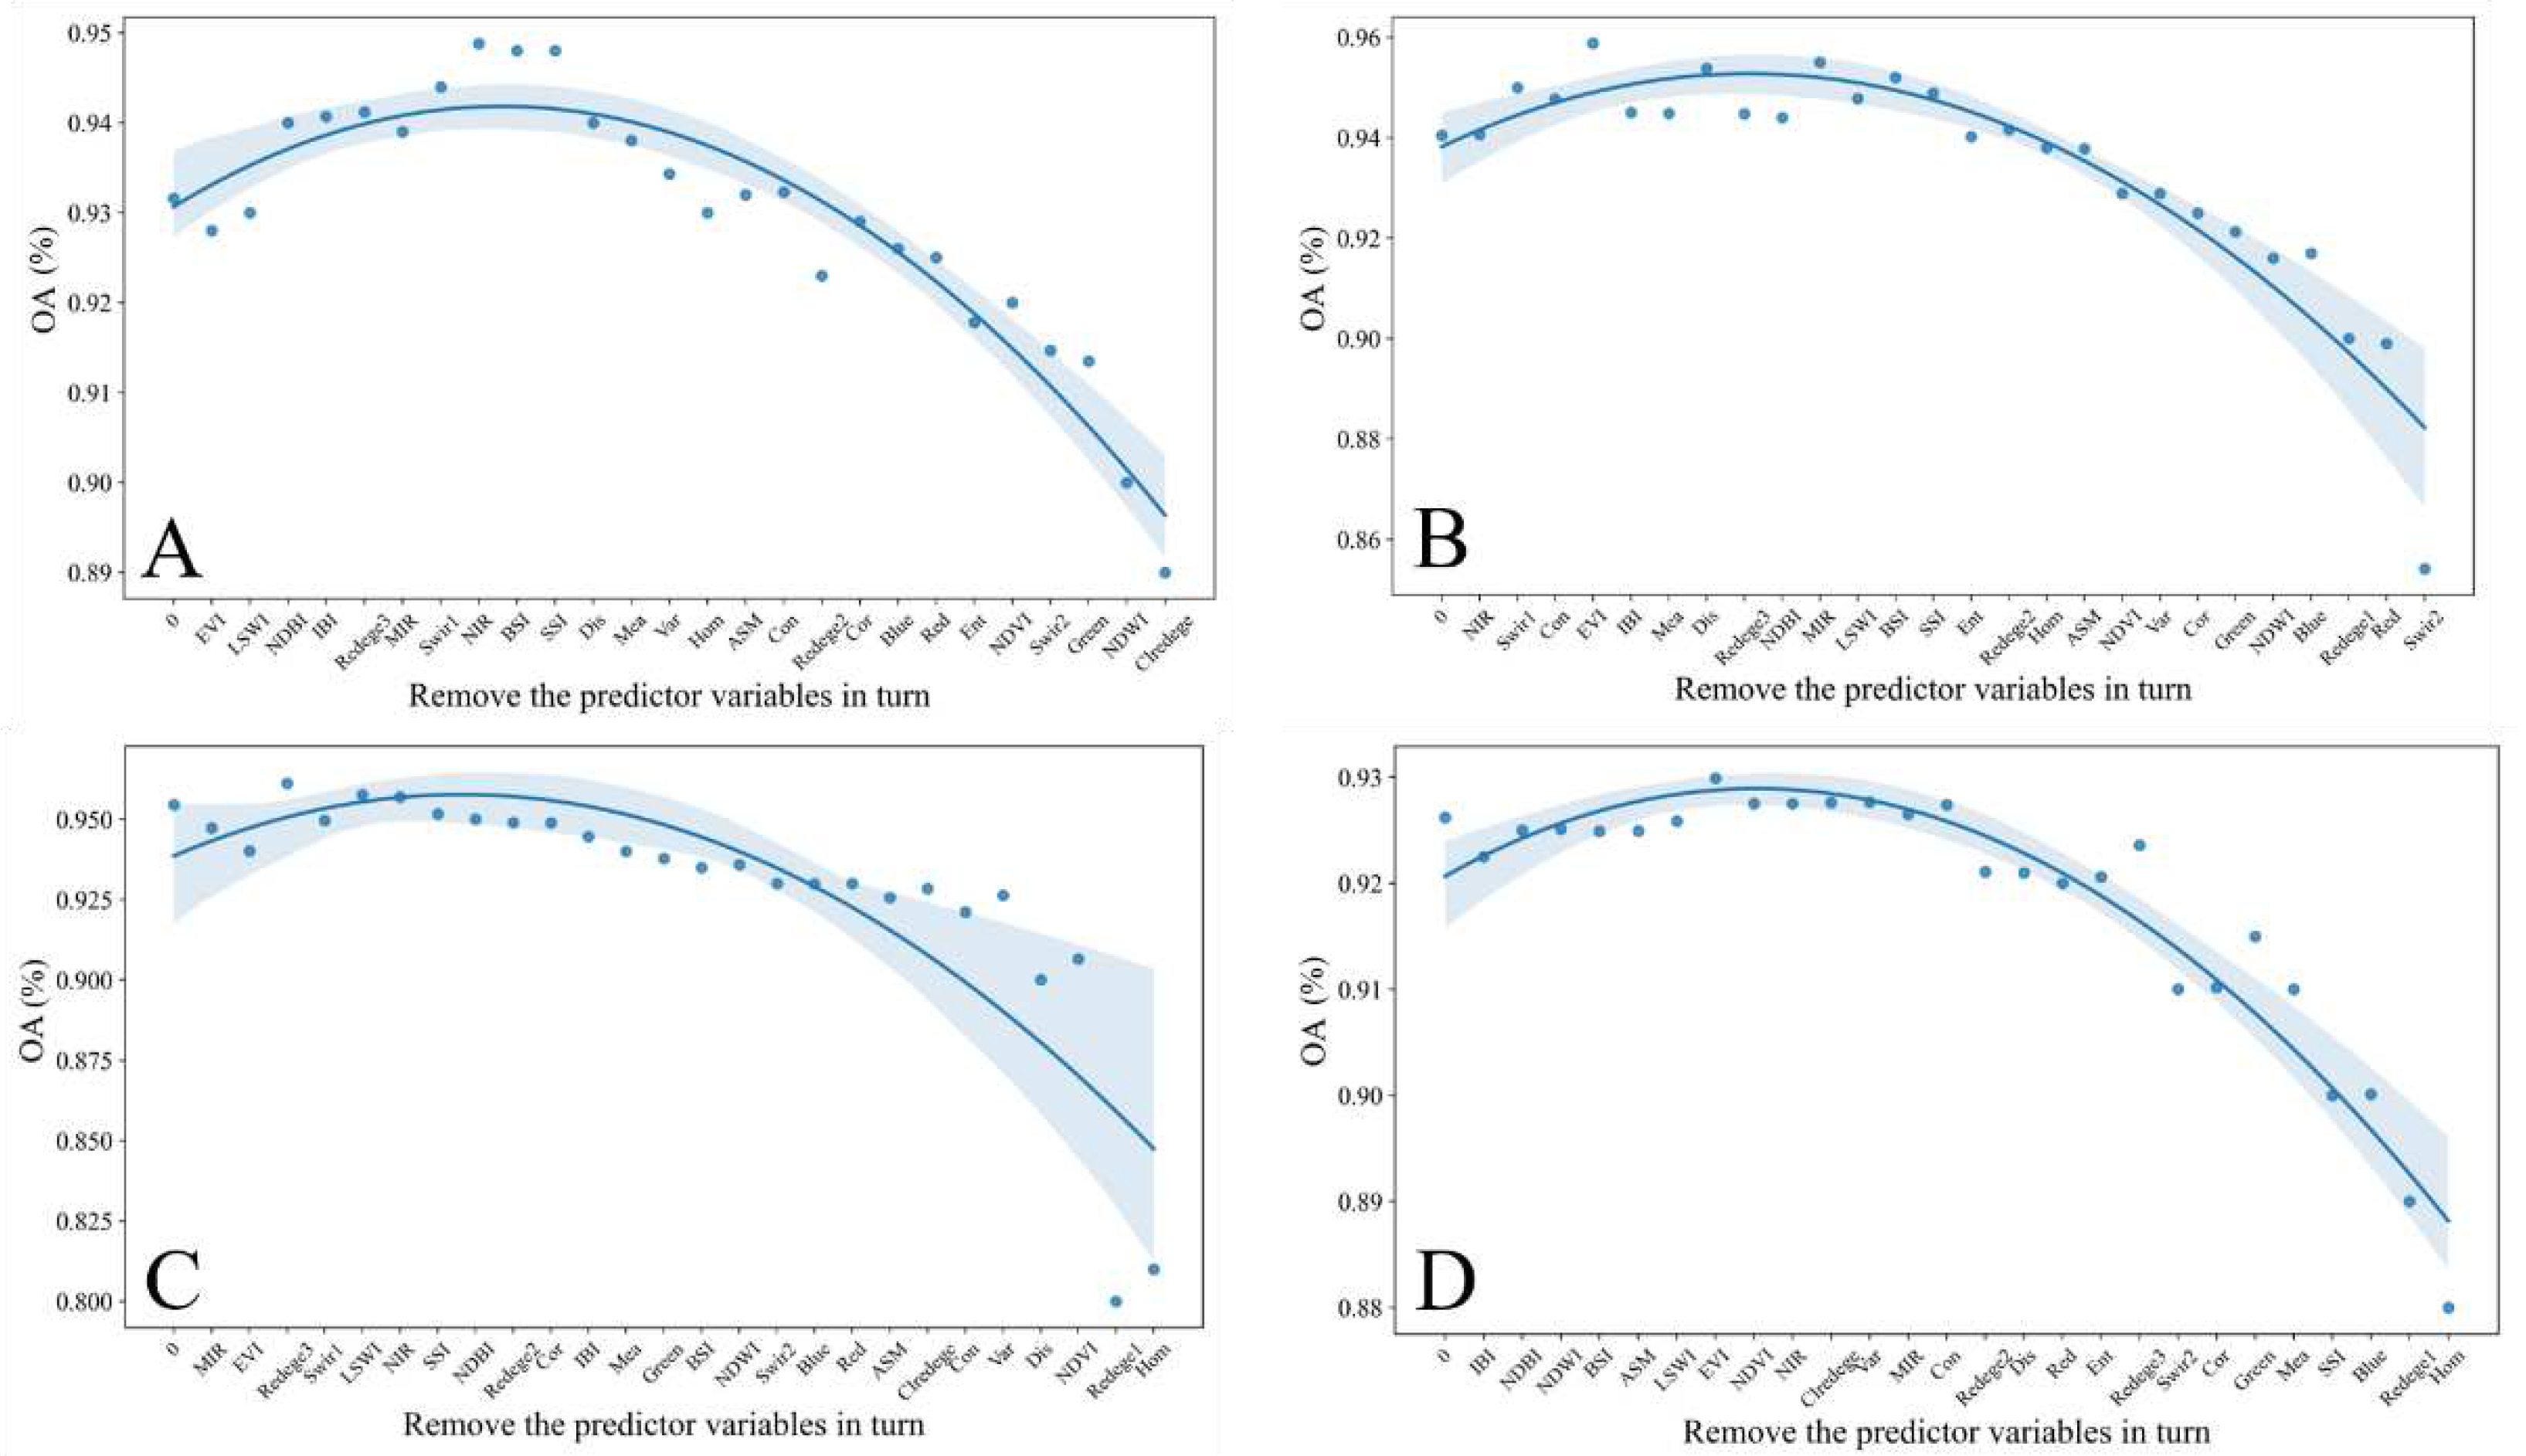
Predictive variables were extracted from Sentinel-2 images collected at multiple timepoints after lodging, and the features that optimized model accuracy were then identified. The results indicated that a larger number of predictive variables did not necessarily increase model accuracy. Based on the SR+VI+GLCM model, predictive variables were ordered by importance score, then removed from the model in ascending order. The OA values of the resulting models first increased, then decreased. This indicated that monitoring accuracy could be improved by removal of some features of relatively low importance, but that OA suffered when predictive variables with higher importance scores were discarded. The features included in the model with the highest OA value were selected as the optimal predictive variables.
Figure 5.
Maize lodging model performance with cumulative removal of predictive variables. Model performance was assessed in terms of overall accuracy (OA). Performance is shown for models built with data collected at (A) 111 days after seeding, (B) 114 days after seeding, (C) 131 days after seeding, and (D) 141 days after seeding.
3.4. Model generalizability
To determine whether the models built here would allow for stable monitoring of lodging risk within a single region, the generalizability was assessed. Specifically, the model built from the data collected on September 18, 2021, was tested on data collected on September 19, 2019, to analyze the interannual generalizability. The UA, PA, OA, and kappa values were 100%, 90.07%, 95.18%, and 0.83, respectively, demonstrating very high accuracy. The reverse process was also conducted: the optimal predictive features for the data from September 19, 2019, were used to build a model that was tested on data from September 18, 2021. The UA, PA, OA, and kappa values of these predictions were 100%, 95.97%, 96.55%, and 0.93, respectively. These results indicated that the model was highly generalizable; a model built with data from one timepoint in a single year could be used to accurately monitor maize lodging in the same area at a similar timepoint of a different year, allowing this model to be used in multi-year studies of regional lodging risk.
Figure 6.
Data used for model generalizability testing.
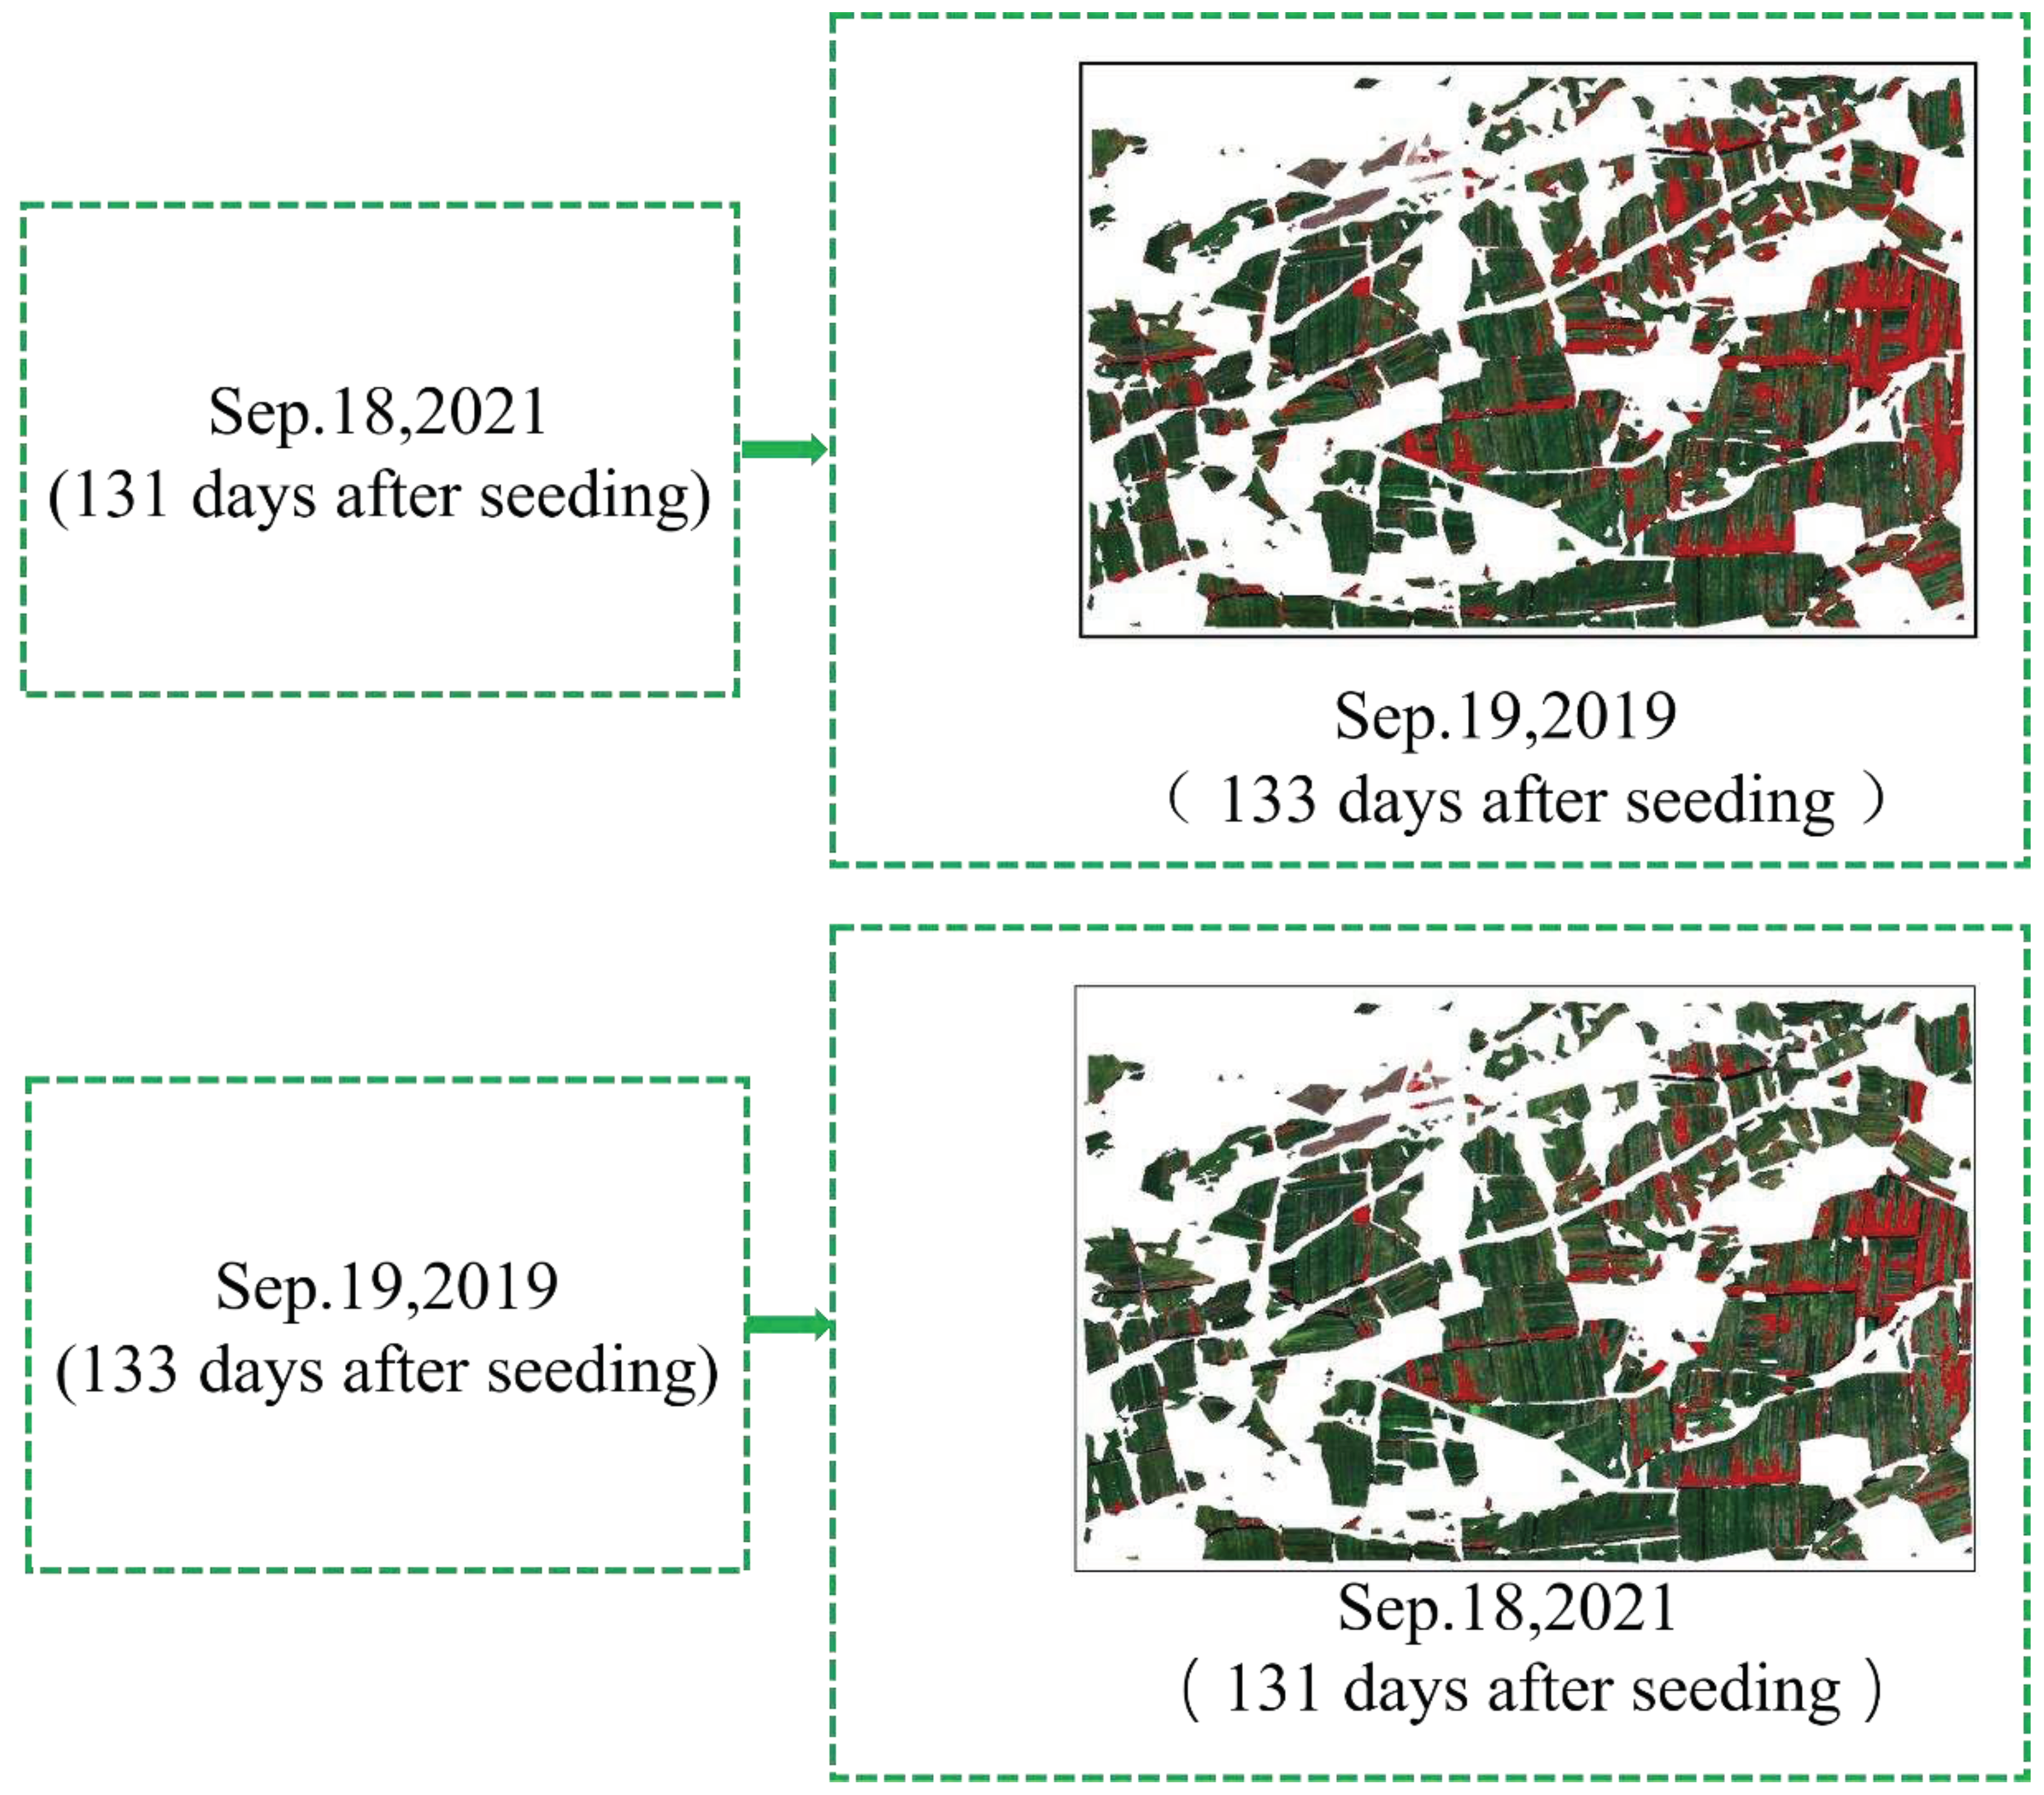
Table 7.
Results of model generalizability testing.
| Model Building Image | Model Portability Imaging | lodging | no-lodging | UA | PA | OA | Kappa | ||
| Correct | Error | Correct | Error | ||||||
| Sep.18,2021 (131 days after seeding) |
Sep.19,2019 (133 days after seeding) |
127 | 14 | 150 | 0 | 100% | 90.07% | 95.18% | 0.83 |
| Sep.19,2019 (133 days after seeding) |
Sep.18,2021 (131 days after seeding) |
143 | 6 | 165 | 0 | 100% | 95.97% | 96.55% | 0.93 |
4. Discussion
4.1. Feature responses to maize lodging
In the present study, we analyzed the effects of maize characteristics on a model of lodging monitoring. Qian et al. previously used UAVs to monitor the degree of maize lodging and found that VI features were more closely associated with lodging than GLCM features were [16]. Li et al. constructed classification models using spectral band features or GLCM to monitor maize lodging and found that spectral data had stronger responses to maize lodging than GLCM features did [37]. We here used multispectral data from the Sentinel-2 satellite to monitor maize lodging. We found that GLCM features less accurately predicted lodging compared to FB or VI features, consistent with previous studies. Xin et al. and others used UAV remote sensing technology to monitor crop lodging and found that models based on texture features had higher accuracy than those based on vegetation indices and spectral bands [38]. The reason for this phenomenon may be that the spatial resolution of satellite remote sensing technology is lower than that of UAV remote sensing technology, which results in many texture features being unclearly represented in satellite remote sensing images.
4.2. Monitoring of maize lodging across developmental stages
In contrast to previous studies, we here analyzed maize lodging monitoring results at several timepoints by gradually removing insensitive predictor variables. The accuracy of lodging monitoring was improved when some of the least important features were removed from the model. This was likely because inclusion of a large number of irrelevant and redundant features can increase model complexity, leading to overfitting and thus to poorer results [38]. This study also demonstrated that images at any timepoints after the occurrence of lodging can be used for lodging monitoring. The importance of specific features differed between timepoints, particularly at timepoints before lodging compared to after lodging. This was likely because the nutrient transport capacity is rapidly reduced when lodging first occurs, leading to sharp decreases in chlorophyll a and chlorophyll b content [39]; normal maize plants still contain high levels of nutrients at this timepoint, so the differences in chlorophyll content between lodged and non-lodged plants are greatest immediately after lodging. As the growing season progressed, the chlorophyll content of non-lodged maize also decreased sharply due to the gradual spring maize harvesting period in Northeast China (around September 28 in 2021). The difference between normal and lodged maize were gradually decreased in vegetation index and partial spectral reflectance.
4.3. Temporal generalizability of the model
To assess the interannual generalizability of the model, a maize lodging classification model developed from data in one year was used to monitor maize lodging in a different year. Wang et al., Shu et al., Zhao et al., and Chen et al. have previously used satellite Synthetic Aperture Radar (SAR)data to monitor lodging in maize, rice, wheat, and sugar cane [40,41,42,43]. Chauhan et al., Chen et al., and Sun et al. have conducted remote monitoring of lodging in maize, rice, wheat, and other crops using spectral data collected with UAVs [44,45,46]. Zhang et al. and Jiang et al. have also monitored wheat lodging at multiple timepoints using a deep-learning model to analyze data collected with UAVs [44,47]. Although these previous studies have demonstrated the effectiveness of satellite remote sensing for monitoring lodging, there are no relevant studies on the interannual generalizability of the models. We here used RF to build a simple, stable model with high interannual generalizability. The results clearly showed that a model built with data from one timepoint in a single year could be used to accurately classify lodging among images from similar timepoints in other years. Furthermore, model generalizability was independent of the time after lodging occurrence. The present study is a valuable resource for analysis of the causes of perennial and extensive maize lodging. Improved planting methods are expected to reduce the probability of lodging, thus increasing maize yield and quality in this region.
5. Conclusions
This study establishes a robust but simple model for maize lodging classification based on spectral imaging data. The model was shown to have high interannual generalizability (OA > 95% and kappa > 0.8) among images collected at similar timepoints after lodging occurrence. Overall, classification models built from data collected at several timepoints after lodging onset had high accuracy. The accuracy of the model built using GLCM features was significantly lower than that of the other models. The accuracy of the SR + VI + GLCM model was significantly higher than that of the models built using only SR, VI, or GLCM features, but was not significantly higher than that of the SR + VI, SR + GLCM, and VI + GLCM models. Removal of features with low importance scores in the SR+VI+GLCM model led first to an increase in OA, then a subsequent decrease. This study provides technical support for large-scale lodging monitoring and establishes a method for analysis of the causes underlying widespread, multi-year maize lodging. Application of this model is expected to promote improvement of planting measures, which could reduce the probability of lodging and improve regional maize yield and quality.
Author Contributions
Conceptualization, H.G. and B.M.; Investigation, H.G., B.M., G.Z., B.X., J.X., and D.F.; Methodology, H.G., B.M., C.N., K.W., R.X., J.X., H.G., B.J., B.X., H.Y., P.H., and S.G.; Validation, H.G. and B.M.; Writing – original draft, H.G. and B.M.; Writing – review & editing, H.G., B.M., and S.L. All authors have read and approved the published version of the manuscript.
Funding
Funding for this project was provided by the Inner Mongolia Science and Technology Major Project (2021ZD0003), the National Key Research and Development Program of China (2016YFD0300605), the Modern Agro-industry Technology Research System in China (CARS-02-25), the China Agriculture Research System of MOF and MARA, and the Agricultural Science and Technology Innovation Program (CAAS-ZDRW202004).
Data Availability Statement
Not applicable.
Acknowledgments
We gratefully thank the staff of the Xinxiang Experimental Station for experimental support.
Conflicts of Interest
The authors declare no conflict of interest.
References
- Xue, J.; Wang, K.; Xie, R.; Gou, L.; Zhang, W.; Ming, B.; Hou, P.; Li, S. Research Progress on Lodging in Late Growth Stage of Maize. Chinese Agricultural Science 2018, 51, 1845-1854.
- Berry, P.M.; Sterling, M.; Spink, J.H.; Baker, C.J.; Sylvester-Bradley, R.; Mooney, S.J.; Tams, A.R.; Ennos, A.R. Understanding and Reducing Lodging in Cereals. In Advances in Agronomy Volume 84; Advances in Agronomy; 2004; pp. 217-271.
- Norberg, O.S.; Mason, S.C.; Lowry, S.R. Ethephon influence on harvestable yield, grain quality, and lodging of corn. Agronomy Journal 1988, 80, 768-772. https://doi.org/10.2134/agronj1988.00021962008000050015x. [CrossRef]
- Minami, M.; Ujihara, A. Effects of lodging on dry matter production, grain yield and nutritional composition at different growth stages in maize (Zea mays L.). Japanese Journal of Crop Science 1991, 60, 107-115. https://doi.org/10.1626/jcs.60.107. [CrossRef]
- Xue, J.; Xie, R.Z.; Zhang, W.F.; Wang, K.R.; Hou, P.; Ming, B.; Gou, L.; Li, S.K. Research progress on reduced lodging of high-yield and -density maize. Journal of Integrative Agriculture 2017, 16, 2717-2725. https://doi.org/10.1016/s2095-3119(17)61785-4. [CrossRef]
- Zan, X.L.; Xing, Z.Y.; Gao, X.; Liu, W.; Zhang, X.D.; Liu, Z.; Li, S.M. Risk Assessment of Different Maize (Zea mays L.) Lodging Types in the Northeast and the North China Plain Based on a Joint Probability Distribution Model. Isprs International Journal of Geo-Information 2021, 10. https://doi.org/10.3390/ijgi10110723. [CrossRef]
- Kumpumaki, T.; Linna, P.; Lipping, T.; Ieee. CROP LODGING ANALYSIS FROM UAS ORTHOPHOTO MOSAIC, SENTINEL-2 IMAGE AND CROP YIELD MONITOR DATA. In Proceedings of the 38th IEEE International Geoscience and Remote Sensing Symposium (IGARSS), Valencia, SPAIN, Jul 22-27, 2018; pp. 7723-7726.
- Sun, Q.; Gu, X.H.; Chen, L.P.; Xu, X.B.; Pan, Y.C.; Hu, X.Q.; Xu, B. Monitoring rice lodging grade via Sentinel-2A images based on change vector analysis. International Journal of Remote Sensing 2022, 43, 1549-1576. https://doi.org/10.1080/01431161.2021.2012293. [CrossRef]
- Guan, H.X.; Liu, H.J.; Meng, X.T.; Luo, C.; Bao, Y.L.; Ma, Y.Y.; Yu, Z.Y.; Zhang, X.L. A Quantitative Monitoring Method for Determining Maize Lodging in Different Growth Stages. Remote Sensing 2020, 12. https://doi.org/10.3390/rs12193149. [CrossRef]
- Chauhan, S.; Darvishzadeh, R.; Lu, Y.; Boschetti, M.; Nelson, A. Understanding wheat lodging using multi-temporal Sentinel-1 and Sentinel-2 data. Remote Sensing of Environment 2020, 243. https://doi.org/10.1016/j.rse.2020.111804. [CrossRef]
- Guan, H.; Huang, J.; Li, X.; Zeng, Y.; Su, W.; Ma, Y.; Dong, J.; Niu, Q.; Wang, W. An improved approach to estimating crop lodging percentage with Sentinel-2 imagery using machine learning. International Journal of Applied Earth Observation and Geoinformation 2022, 113. https://doi.org/10.1016/j.jag.2022.102992. [CrossRef]
- Chauhan, S.; Darvishzadeh, R.; Boschetti, M.; Nelson, A. Discriminant analysis for lodging severity classification in wheat using RADARSAT-2 and Sentinel-1 data. ISPRS Journal of Photogrammetry and Remote Sensing 2020, 164, 138-151. https://doi.org/10.1016/j.isprsjprs.2020.04.012. [CrossRef]
- Shu, M.; Zhou, L.; Gu, X.; Ma, Y.; Sun, Q.; Yang, G.; Zhou, C. Monitoring of maize lodging using multi-temporal Sentinel-1 SAR data. Advances in Space Research 2020, 65, 470-480. https://doi.org/10.1016/j.asr.2019.09.034. [CrossRef]
- Chen, J.; Li, H.; Han, Y.; Ieee. POTENTIAL OF RADARSAT-2 DATA ON IDENTIFYING SUGARCANE LODGING CAUSED BY TYPHOON. In Proceedings of the 5th International Conference on Agro-Geoinformatics (Agro-Geoinformatics), Inst Agr Resources & Regional Planning, Chinese Acad Agr Sci, Tianjin, PEOPLES R CHINA, 2016 Jul 18-20, 2016; pp. 36-41.
- Guan, H.; Huang, J.; Li, L.; Li, X.; Ma, Y.; Niu, Q.; Huang, H. A Novel Approach to Estimate Maize Lodging Area With PolSAR Data. Ieee Transactions on Geoscience and Remote Sensing 2022, 60. https://doi.org/10.1109/tgrs.2022.3216341. [CrossRef]
- Sun, Q.; Chen, L.P.; Xu, X.B.; Gu, X.H.; Hu, X.Q.; Yang, F.T.; Pan, Y.C. A new comprehensive index for monitoring maize lodging severity using UAV-based multi-spectral imagery. Computers and Electronics in Agriculture 2022, 202. https://doi.org/10.1016/j.compag.2022.107362. [CrossRef]
- Liu, Y.; Nie, C.; Zhang, Z.; Wang, Z.; Ming, B.; Xue, J.; Yang, H.; Xu, H.; Meng, L.; Cui, N.; et al. Evaluating how lodging affects maize yield estimation based on UAV observations. Frontiers in Plant Science 2023, 13. https://doi.org/10.3389/fpls.2022.979103. [CrossRef]
- Qu, X.; Shi, D.; Gu, X.; Sun, Q.; Hu, X.; Yang, X.; Pan, Y. Monitoring Lodging Extents of Maize Crop Using Multitemporal GF-1 Images. IEEE Journal of Selected Topics in Applied Earth Observations and Remote Sensing 2022, 15, 3800-3814. https://doi.org/10.1109/jstars.2022.3170345. [CrossRef]
- Zhou, L.; Zhang, Y.; Cheng, Z.; Gu, X.; Yang, G.; Sun, Q.; Shu, M. Analysis of Hyperspectral Response of Leaf Area Index of Maize under Lodging Stress at Different Growth Stages. Remote Sensing Technology and Application 2019, 34, 766-774.
- Sibanda, M.; Onisimo, M.; Dube, T.; Mabhaudhi, T. Quantitative assessment of grassland foliar moisture parameters as an inference on rangeland condition in the mesic rangelands of southern Africa. International Journal of Remote Sensing 2021, 42, 1474-1491. https://doi.org/10.1080/01431161.2020.1832282. [CrossRef]
- Zheng, H.; Ji, W.; Wang, W.; Lu, J.; Li, D.; Guo, C.; Yao, X.; Tian, Y.; Cao, W.; Zhu, Y.; et al. Transferability of Models for Predicting Rice Grain Yield from Unmanned Aerial Vehicle (UAV) Multispectral Imagery across Years, Cultivars and Sensors. Drones 2022, 6. https://doi.org/10.3390/drones6120423. [CrossRef]
- Sun, H.; Song, Y.; Liu, Y. Summary of 30 Years of Climate in Tongliao Region. Agricultural Technology Service 2017, 34, 101.
- Alshibani, A. Automation of Measuring Actual Productivity of Earthwork in Urban Area, a Case Study from Montreal. Buildings 2018, 8, 178. [CrossRef]
- Pettorelli, N.; Vik, J.O.; Mysterud, A.; Gaillard, J.-M.; Tucker, C.J.; Stenseth, N.C. Using the satellite-derived NDVI to assess ecological responses to environmental change. Trends in Ecology & Evolution 2005, 20, 503-510. https://doi.org/10.1016/j.tree.2005.05.011. [CrossRef]
- Huete, A.; Didan, K.; Miura, T.; Rodriguez, E.P.; Gao, X.; Ferreira, L.G. Overview of the radiometric and biophysical performance of the MODIS vegetation indices. Remote Sensing of Environment 2003, 83, 195-213. [CrossRef]
- Chen, Y.; Sun, L.; Pei, Z.; Sun, J.; Li, H.; Jiao, W.; You, J. A Simple and Robust Spectral Index for Identifying Lodged Maize Using Gaofen1 Satellite Data. Sensors (Basel) 2022, 22. https://doi.org/10.3390/s22030989. [CrossRef]
- Yan, D.; Wang, Y.; Peng, S.; Wu, J.; Yang, G.; Zhang, Y.; Zheng, X.; Ming, G.; Shang, W.; Li, S. Method for extracting water surface area based on remote sensing image, involves extracting water surface area from satellite remote sensing normalized difference water index image by using threshold process. CN111832575-A.
- Zarco-Tejada, P.J.; Miller, J.R.; Noland, T.L.; Mohammed, G.H.; Sampson, P.H. Scaling-up and model inversion methods with narrowband optical indices for chlorophyll content estimation in closed forest canopies with hyperspectral data. Ieee Transactions on Geoscience and Remote Sensing 2001, 39, 1491-1507. https://doi.org/10.1109/36.934080. [CrossRef]
- Chandrasekar, K.; Sai, M.V.R.S.; Roy, P.S.; Dwevedi, R.S. Land Surface Water Index (LSWI) response to rainfall and NDVI using the MODIS Vegetation Index product. International Journal of Remote Sensing 2010, 31, 3987-4005. https://doi.org/10.1080/01431160802575653. [CrossRef]
- Smith, D.M. Gas turbine engine for vehicle has borescope inspection (BSI) plug which is threaded and received within BSI port, such that one of multiple of detents of BSI plug is engageable with scallops of ring. US2018252118-A1; US10533448-B2.
- Zhou, F.; Li, N.; Lv, H. Method for rapidly extracting water-tight surface information of plain river network area, involves calculating standard difference of time sequence NDBI, calculating proper threshold value, and obtaining waterproof information. CN111783625-A.
- Field, W.B.; Gillespie, M.J.; Lawson, E.M.; Maria, B.H.J.; Pluijms, D.A.; Barten, H.J.M. Operating method of image reader adapted for processing information bearing indicia (IBI), involves reversing image of IBI that is not decodable, and decoding reversed image. US2009255994-A1; US8210436-B2.
- Li, Z.; Chen, Z.; Wang, L.; Liu, J.; Zhou, Q. Extraction of Maize Lodging Area Based on Small Unmanned Aerial Vehicle Remote Sensing. Transactions of the Chinese Society of Agricultural Engineering 2014, 30, 207-213.
- Hall-Beyer, M. Practical guidelines for choosing GLCM textures to use in landscape classification tasks over a range of moderate spatial scales. International Journal of Remote Sensing 2017, 38, 1312-1338. https://doi.org/10.1080/01431161.2016.1278314. [CrossRef]
- Haralick, R.M.; Shanmugam, K.S.; Dinstein, I.h. Textural Features for Image Classification. IEEE Trans. Syst. Man Cybern. 1973, 3, 610-621. [CrossRef]
- Park, Y.; Guldmann, J.-M. Measuring continuous landscape patterns with Gray-Level Co-Occurrence Matrix (GLCM) indices: An alternative to patch metrics? Ecological Indicators 2020, 109. https://doi.org/10.1016/j.ecolind.2019.105802. [CrossRef]
- Li, Z.; Chen, Z.; Ren, G.; Li, Z.; Wang, X. Estimation of Maize Lodging Area Based on Worldview-2 Images. Transactions of the Chinese Society of Agricultural Engineering 2016, 32, 1-5. [CrossRef]
- Zhou, Y. Research on Imbalanced Data Classification Algorithm Based on Double Cost-sensitive Random Forest. Master's Thesis, Harbin University of Science and Technology, 2021.
- Sun, Q.; Gu, X.H.; Chen, L.P.; Xu, X.B.; Wei, Z.H.; Pan, Y.C.; Gao, Y.B. Monitoring maize canopy chlorophyll density under lodging stress based on UAV hyperspectral imagery. Computers and Electronics in Agriculture 2022, 193. https://doi.org/10.1016/j.compag.2021.106671. [CrossRef]
- Wang, J.N.; Li, K.; Shao, Y.; Zhang, F.L.; Wang, Z.Y.; Guo, X.Y.; Qin, Y.; Liu, X.C. Analysis of Combining SAR and Optical Optimal Parameters to Classify Typhoon-Invasion Lodged Rice: A Case Study Using the Random Forest Method. Sensors 2020, 20. https://doi.org/10.3390/s20247346. [CrossRef]
- Shu, M.Y.; Zhou, L.F.; Gu, X.H.; Ma, Y.T.; Sun, Q.; Yang, G.J.; Zhou, C.Q. Monitoring of maize lodging using multi-temporal Sentinel-1 SAR data. Advances in Space Research 2020, 65, 470-480. https://doi.org/10.1016/j.asr.2019.09.034. [CrossRef]
- Zhao, L.; Yang, J.; Li, P.; Shi, L.; Zhang, L. Characterizing Lodging Damage in Wheat and Canola Using Radarsat-2 Polarimetric SAR Data. Remote Sensing Letters 2017, 8, 667-675. https://doi.org/10.1080/2150704x.2017.1312028. [CrossRef]
- Chen, J.S.; Li, H.Z.; Han, Y.; Ieee. POTENTIAL OF RADARSAT-2 DATA ON IDENTIFYING SUGARCANE LODGING CAUSED BY TYPHOON. In Proceedings of the 5th International Conference on Agro-Geoinformatics (Agro-Geoinformatics), Inst Agr Resources & Regional Planning, Chinese Acad Agr Sci, Tianjin, PEOPLES R CHINA, Jul 18-20, 2016; pp. 36-41.
- Jiang, S.S.; Hao, J.Y.; Li, H.; Zuo, C.Z.; Geng, X.; Sun, X.Y. Monitoring Wheat Lodging at Various Growth Stages. Sensors 2022, 22. https://doi.org/10.3390/s22186967. [CrossRef]
- Tian, M.; Ban, S.; Yuan, T.; Ji, Y.; Ma, C.; Li, L. Monitoring of lodged rice using low-altitude UAV based multispectral image. Acta Agriculturae Shanghai 2018, 34, 88-93.
- Sun, Q.; Sun, L.; Shu, M.Y.; Gu, X.H.; Yang, G.J.; Zhou, L.F. Monitoring Maize Lodging Grades via Unmanned Aerial Vehicle Multispectral Image. Plant Phenomics 2019, 2019. https://doi.org/10.34133/2019/5704154. [CrossRef]
- Zhang, D.Y.; Ding, Y.; Chen, P.F.; Zhang, X.Q.; Pan, Z.G.; Liang, D. Automatic extraction of wheat lodging area based on transfer learning method and deeplabv3+network. Computers and Electronics in Agriculture 2020, 179. https://doi.org/10.1016/j.compag.2020.105845. [CrossRef]
Figure 1.
The areas analyzed in this study: Yihe Tara Town and Jianhua Town, Kailu County, Tongliao City, Inner Mongolia. Satellite images were taken on (A) August 29, 2021, and (B) September 19, 2019. Red and yellow dots indicate lodged and non-lodged points, respectively.
Figure 1.
The areas analyzed in this study: Yihe Tara Town and Jianhua Town, Kailu County, Tongliao City, Inner Mongolia. Satellite images were taken on (A) August 29, 2021, and (B) September 19, 2019. Red and yellow dots indicate lodged and non-lodged points, respectively.
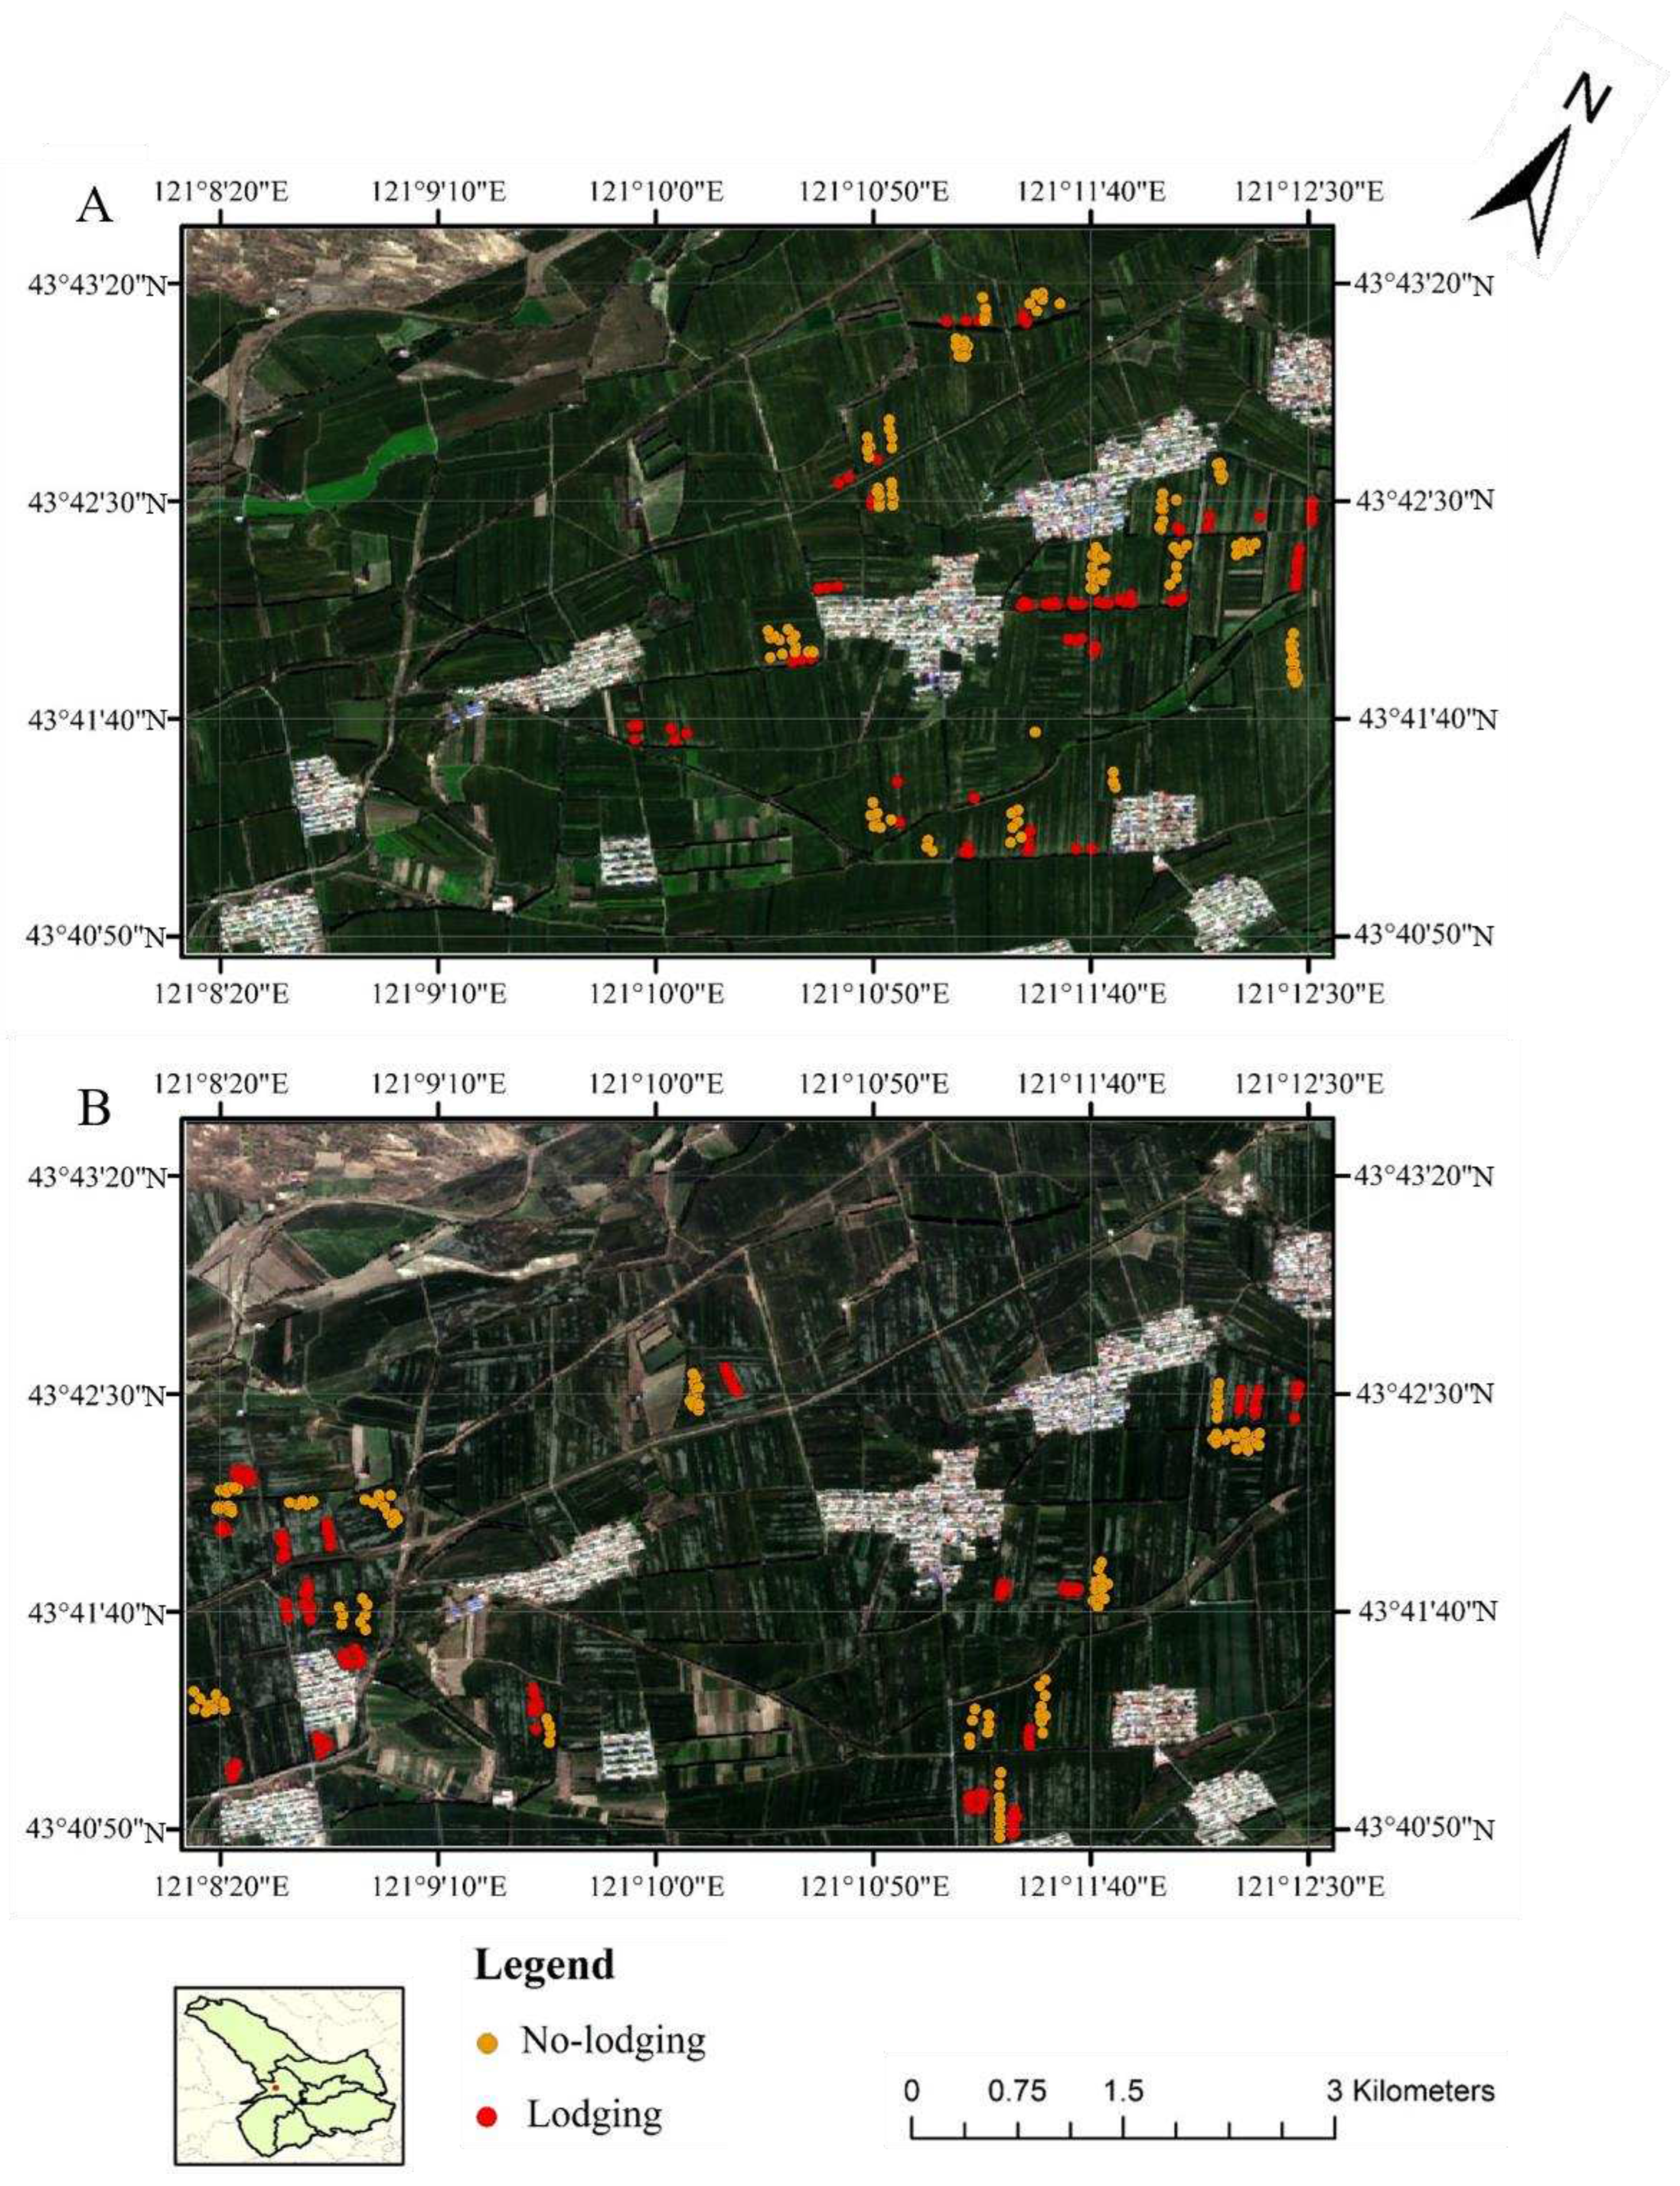
Figure 2.
Regional spatial distribution of the maize planting area in 2019 and 2021.
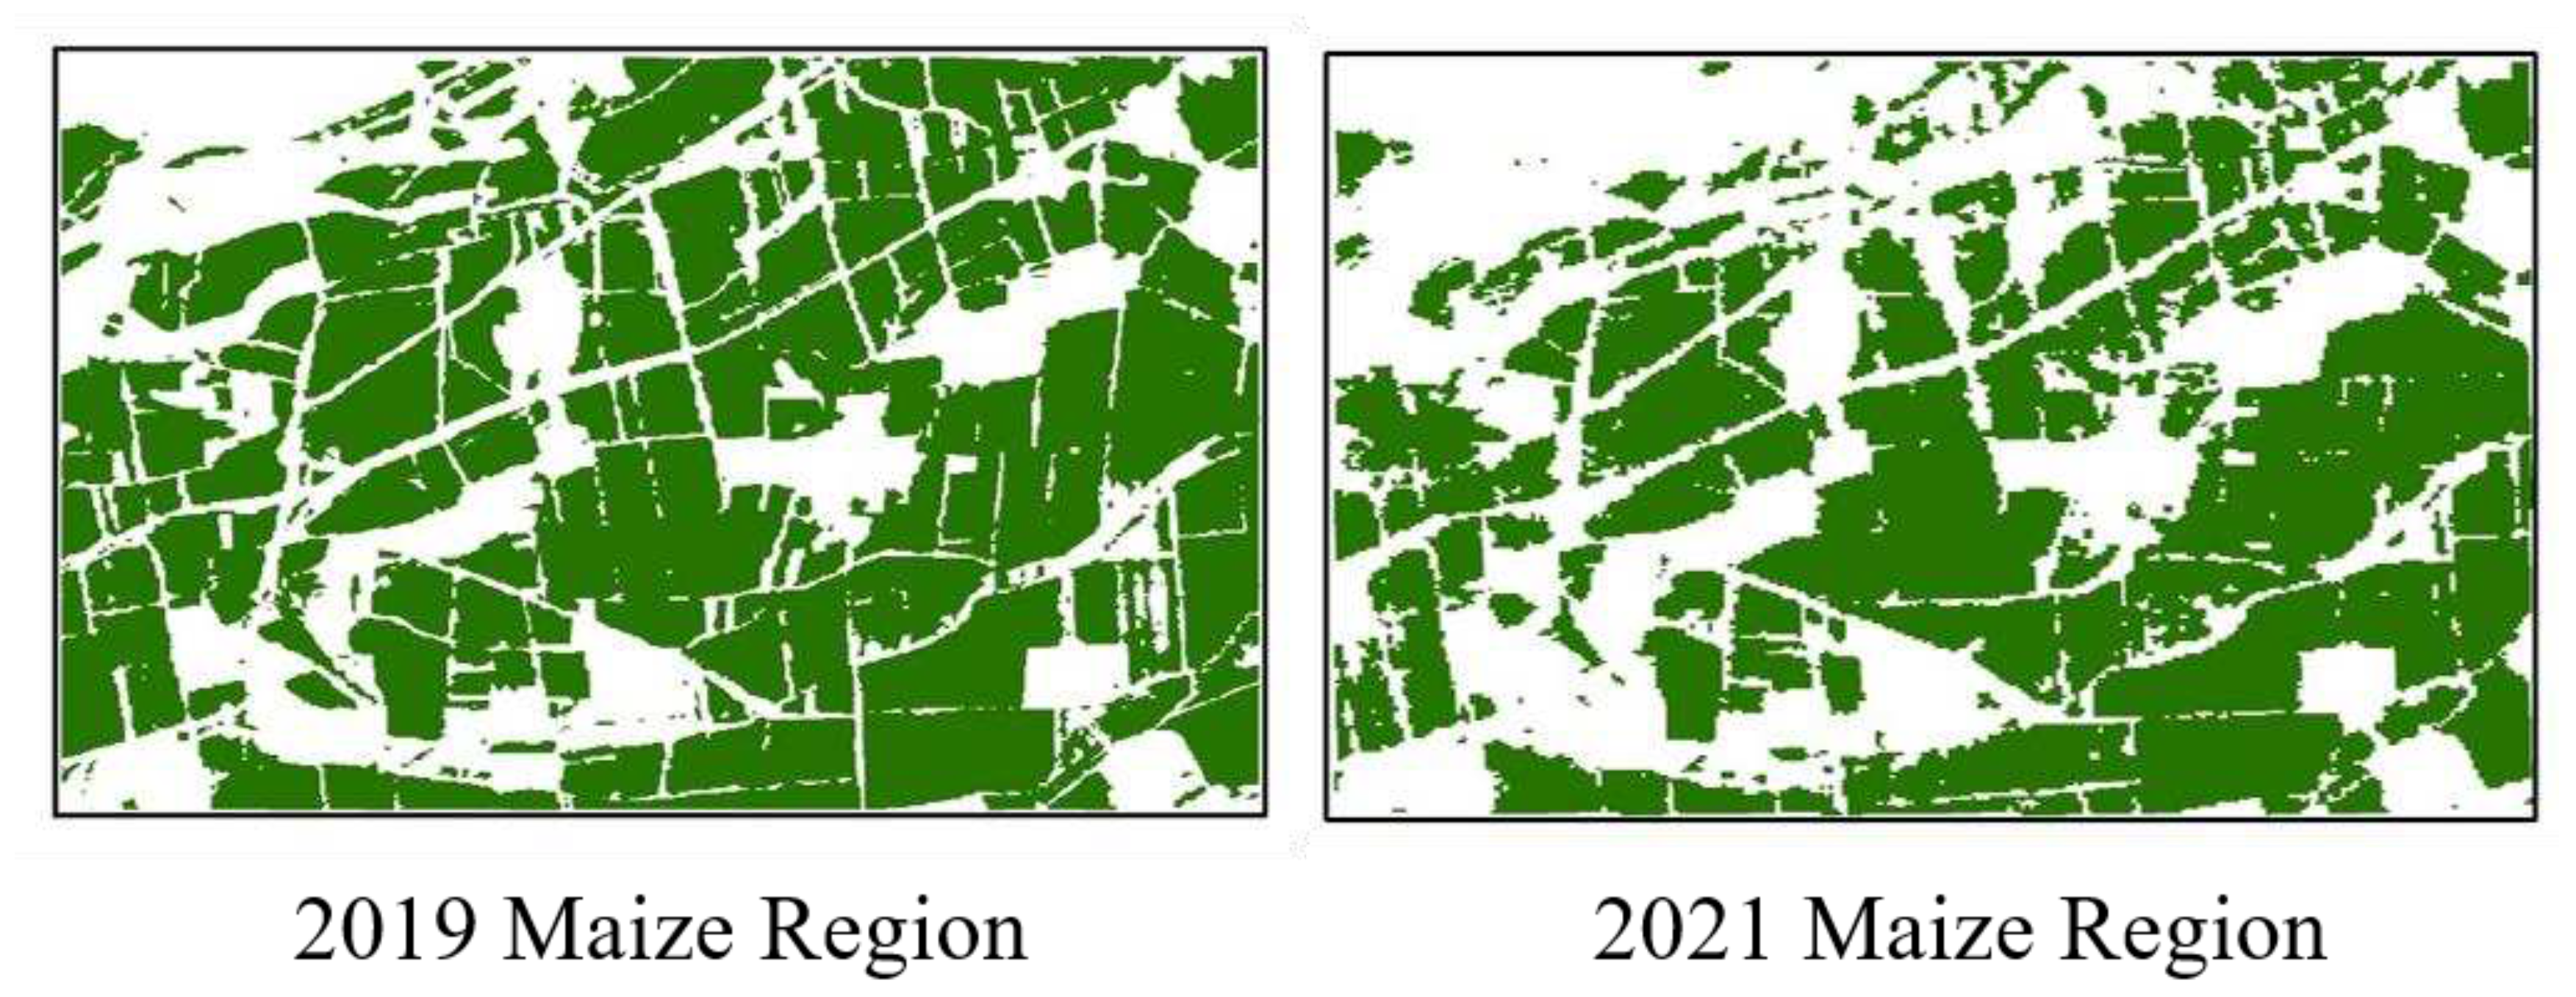
Figure 4.
The McNemar test results between different models. This figure shows the McNemar test results between models built with data collected at 111 days after maize seeding in 2021 (A), 114 days after maize seeding in 2021 (B), 131 days after maize seeding in 2021 (C), and 141 days after maize seeding in 2021 (D). The blue asterisk in the figure indicates that the monitoring accuracy of the model constructed by combining features along the horizontal axis is significantly higher than that of the vertical axis. The red asterisk in the figure indicates that the monitoring accuracy of the model constructed by combining features along the vertical axis is significantly higher than that of the horizontal axis.
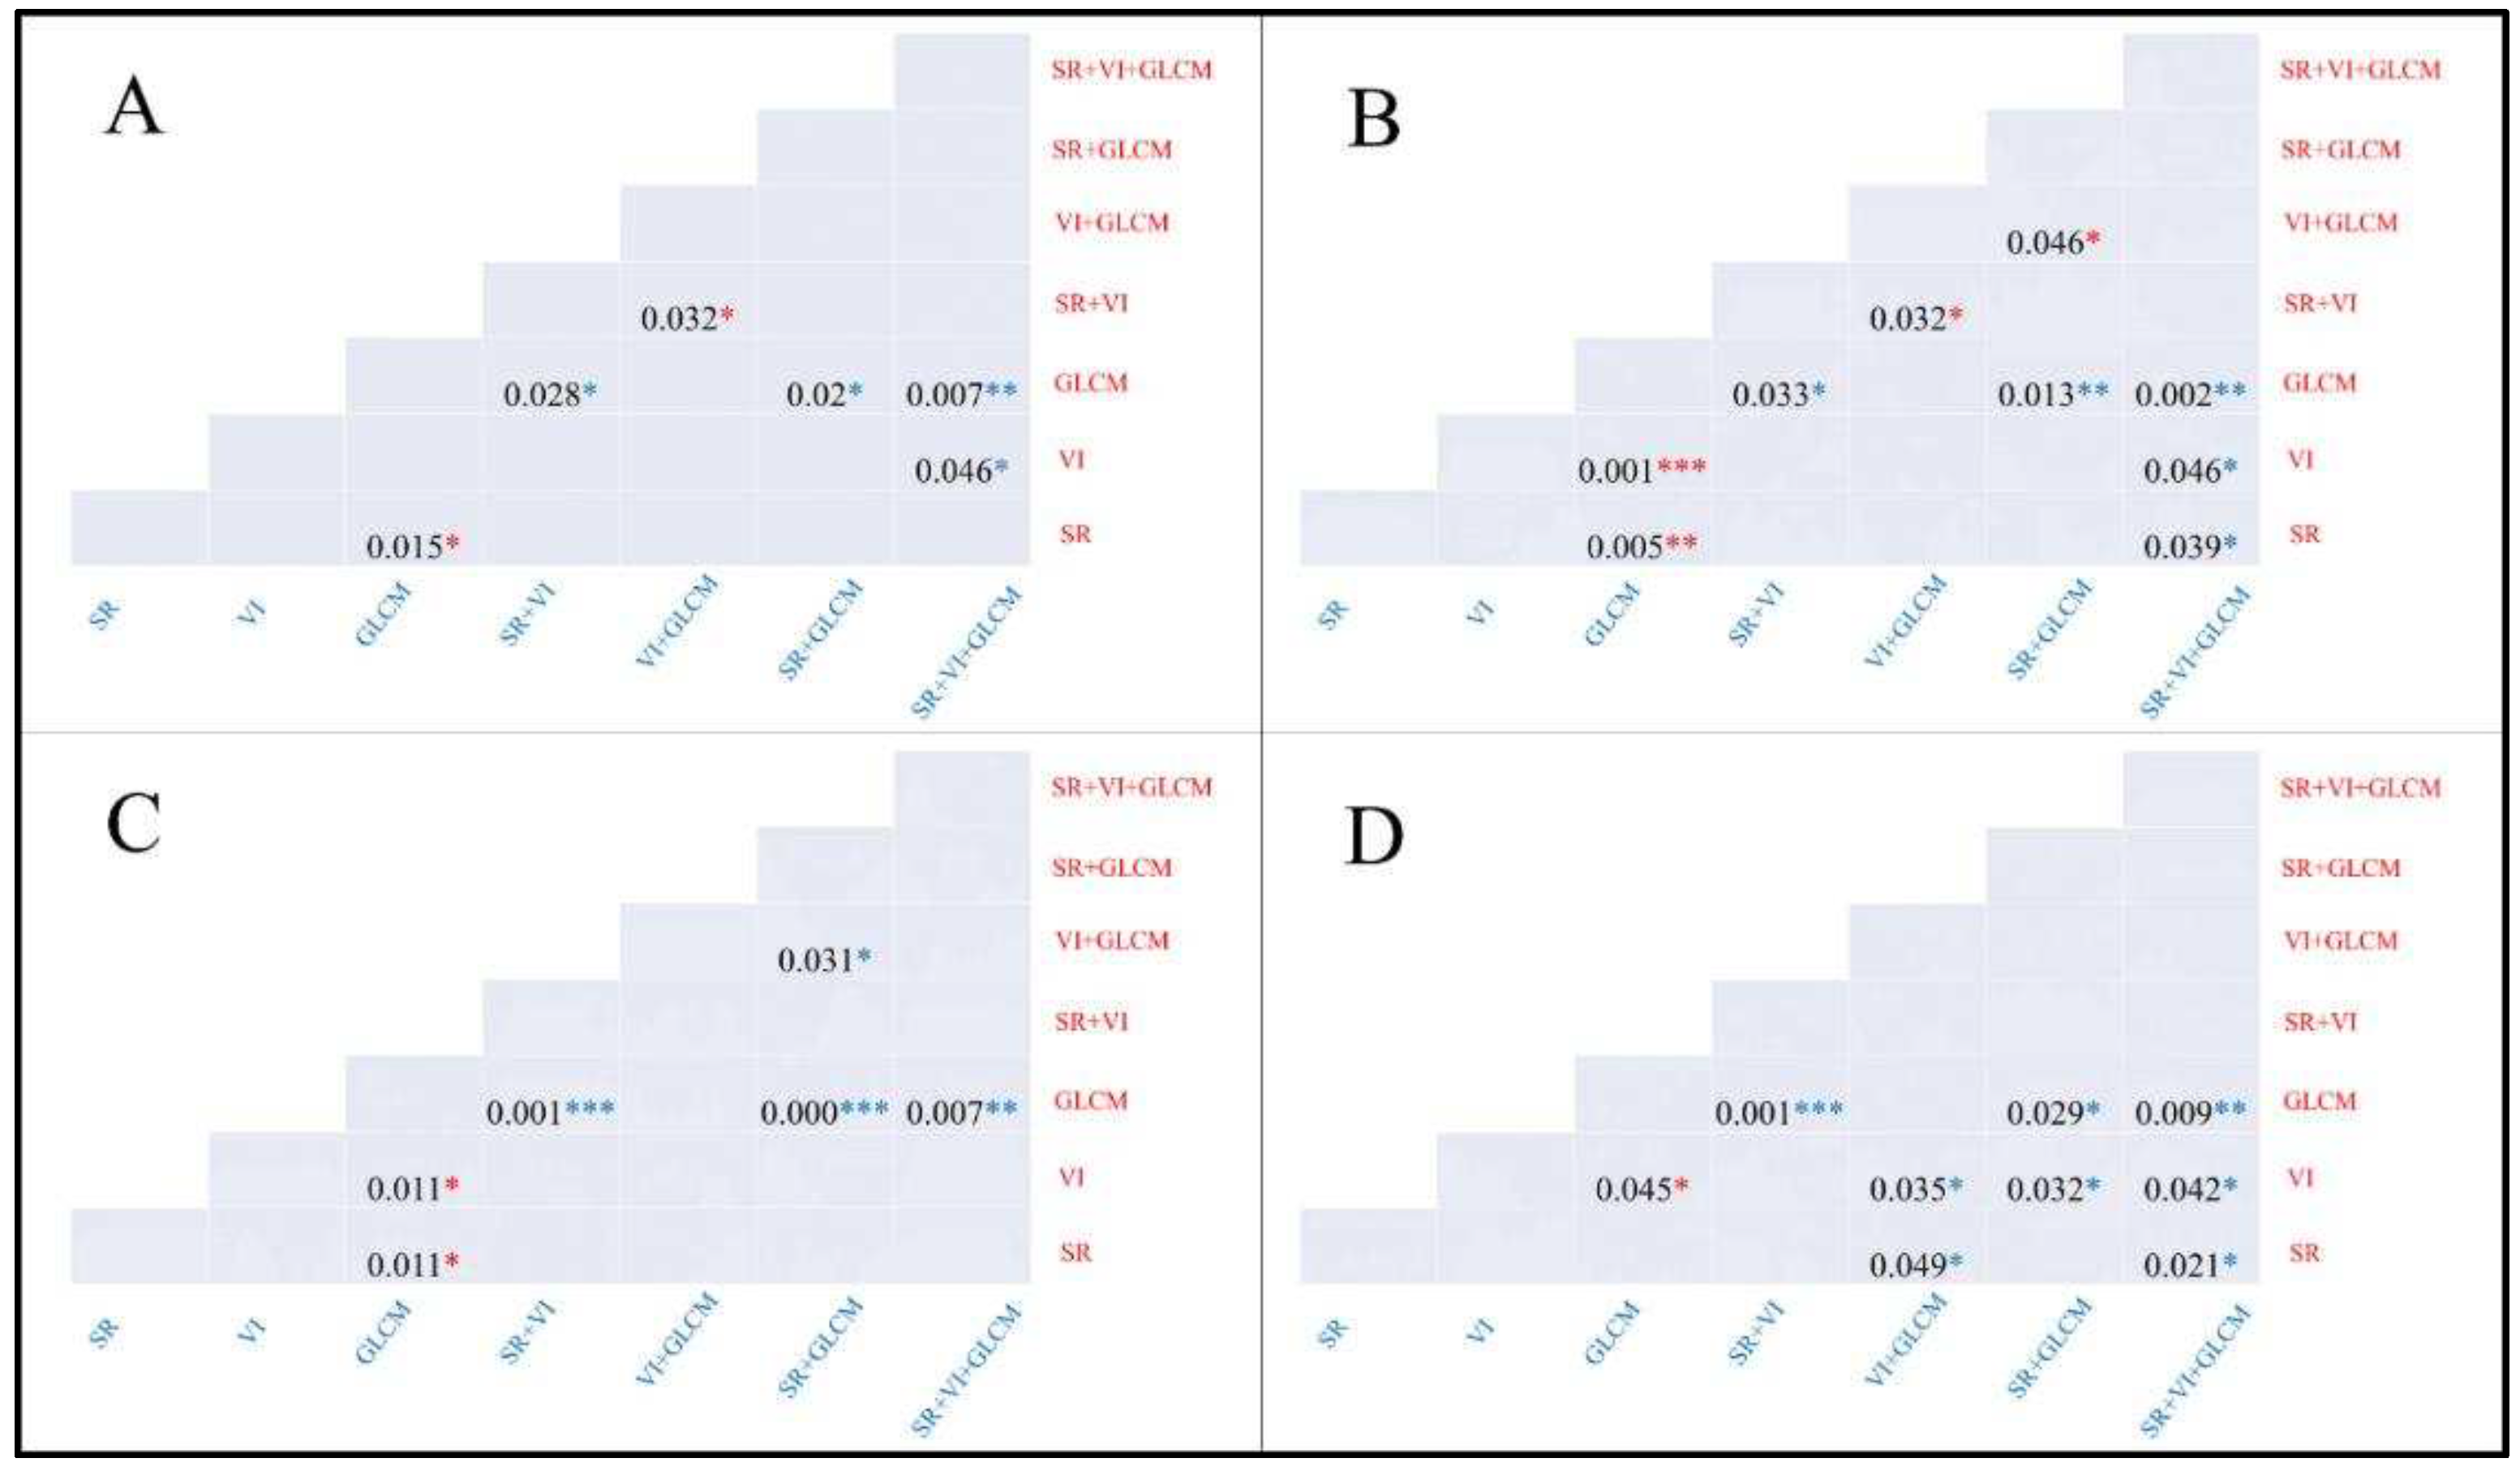
Table 1.
Metadata for images analyzed in this study.
| Growing period of maize | Image Time | Type of sensor |
|---|---|---|
| 111 days after seeding | Aug. 29, 2021 | Sentinel-2 |
| 114 days after seeding | Sep. 1, 2021 | Sentinel-2 |
| 131 days after seeding | Sep. 18, 2021 | Sentinel-2 |
| 141 days after seeding | Sep. 28, 2021 | Sentinel-2 |
| 133 days after seeding | Sep. 19, 2019 | Sentinel-2 |
Table 2.
Wavebands analyzed in this study.
| Band | Resolution (m) | Center wavelength (m) | Description |
|---|---|---|---|
| B2 | 10 | 490 | Blue |
| B3 | 10 | 560 | Green |
| B4 | 10 | 665 | Red |
| B5 | 20 | 705 | Rededge1 |
| B6 | 20 | 740 | Rededge2 |
| B7 | 20 | 783 | Rededge3 |
| B8 | 10 | 842 | NIR |
| B8A | 20 | 865 | MIR |
| B11 | 20 | 1610 | Swir1 |
| B12 | 20 | 2190 | Swir2 |
Table 3.
Vegetation indices used in this study.
| Vegetation index name | Expression | References |
|---|---|---|
| Normalized Difference Vegetation Index (NDVI) | [24] | |
| Enhanced Vegetation Index (EVI) | [25] | |
| Spectral vegetation index and (SSI) | [26] | |
| Green Normalized Difference Vegetation Index (NDWI) | [27] | |
| RedEdge Chlorophyll Index (CIrededge) | [28] | |
| Land Surface Water Index (LSWI) | [29] | |
| Bare Soil Index (BSI) | [30] | |
| RedEdage Normalized Difference Vegetation Index (NDBI) | [31] | |
| Normalized Building Index (IBI) | [32] |
Table 4.
Formulae and descriptions of textural features used in this study.
| Texture | Formula | Meaning |
|---|---|---|
| Mean | Average gray level in the window. | |
| Variance | Variance of gray level in the window. | |
| Contrast | Metric of the local change in pixel value between adjacent pixels. | |
| Dissimilarity | Metric that reflects the difference in grayscale. | |
| Entropy | Measure of the disorder across an image. | |
| Angular Secondary Moment | Metric of the uniformity of the image gray level distribution. | |
| Correlation | Metric of linearity between adjacent pixels. | |
| Homogeneity | Measure of the homogeneity across the window. |
Table 6.
The average overall accuracy (OA) and average kappa value of different models constructed from images at different time points after lodging.
Table 6.
The average overall accuracy (OA) and average kappa value of different models constructed from images at different time points after lodging.
| Model constructed from different features | Average monitoring accuracy | Images from different growth stages | |||
| Aug.29th2021 (121 d) |
Sep. 1st,2021 (124 d) |
Sep.18th,2021 (141 d) |
Sep.28th,2021 (151 d) |
||
| GLCM model | Average OA | 89.09% | 87.33% | 89.98% | 87.82% |
| Average Kappa | 0.78 | 0.78 | 0.81 | 0.77 | |
| VI model | Average OA | 94.65% | 92.66% | 91.65% | 89.80% |
| Average Kappa | 0.9 | 0.85 | 0.83 | 0.79 | |
| SR model | Average OA | 92.59% | 91.73% | 93.49% | 90.91% |
| Average Kappa | 0.86 | 0.83 | 0.87 | 0.82 | |
| SR+VI model | Average OA | 93.77% | 94.6% | 91.5% | 90.80% |
| Average Kappa | 0.85 | 0.89 | 0.85 | 0.8 | |
| SR+GLCM model | Average OA | 93.91% | 92.3% | 94% | 91.13% |
| Average Kappa | 0.86 | 0.84 | 0.87 | 0.83 | |
| VI+GLCM model | Average OA | 92.06% | 90.39% | 92.06% | 90.65% |
| Average Kappa | 0.84 | 0.83 | 0.84 | 0.85 | |
|
SR+VI+GLCM model |
Average OA | 93.16% | 94.05% | 93.40% | 92.62% |
| Average Kappa | 0.86 | 0.88 | 0.86 | 0.84 | |
Disclaimer/Publisher’s Note: The statements, opinions and data contained in all publications are solely those of the individual author(s) and contributor(s) and not of MDPI and/or the editor(s). MDPI and/or the editor(s) disclaim responsibility for any injury to people or property resulting from any ideas, methods, instructions or products referred to in the content. |
© 2023 by the authors. Licensee MDPI, Basel, Switzerland. This article is an open access article distributed under the terms and conditions of the Creative Commons Attribution (CC BY) license (http://creativecommons.org/licenses/by/4.0/).
Copyright: This open access article is published under a Creative Commons CC BY 4.0 license, which permit the free download, distribution, and reuse, provided that the author and preprint are cited in any reuse.


