
Submitted:
31 May 2023
Posted:
01 June 2023
You are already at the latest version
Abstract
Background: Chronic, non-cancer pain represents a serious public health and economic issue affecting approximately 20% of the global population. Chronic pain can affect many aspects of patient’s lives, including mental health, employment, and relationships. Current medical management is largely focussed on investigating and managing acute pain. Patients and clinicians are now increasingly aware of the potential benefits of combined treatments or complex interventions in alleviating chronic pain. These approaches include both physical interventions, such as exercise or yoga, as well as psychological support including cognitive behavioural therapy (CBT) and talking therapies. Methods: This study used network meta-analyses to explore the prevalence of complex interventions in pain management, and the effects of these interventions on quality of life, using outcome measures including intensity of chronic pain, assessment of functional disability and participant’s psychological state. Results: Psychological interventions were associated with improvements in pain intensity and depression. Exercise and manipulation technique-based treatments provided a statistically significant reduction in pain intensity. This effect was enhanced when exercise and CBT were combined. Mensendieck somatocognitive therapy (MSCT) plus standard gynaecological treatment (STGT) treatments appeared to have a better effect on chronic pain than multimodal exercise plus CBT treatment. Combined MSCT and STGT treatment, and multimodal exercise plus CBT treatments, reduced pain intensity, whilst MSCT+STGT treatments had a slightly better effect than exercise plus CBT treatment.Conclusions: Complex interventions have become more popular with patients as the risks associated with other interventions including surgery and pharmacological management have become better understood. These interventions can have a significant positive effect both on the physical and psychological health of patients. The analysis presented in this study suggests that further work is warranted in this area and that additional studies are required, both in more geographically diverse locations, and with larger cohorts.
Keywords:
chronic pain
; non-pharmaceutical pain management
; interventions
Introduction
Chronic non-cancer pain impacts approximately 20% of the global population with a significant physical and mental health impact on the patient and their family [1]. The incidence of chronic pain may increase with advancing age, biological gender and lifestyle [2]. The focus of medical management is predominantly aimed at investigating and managing acute painful conditions. A lack of adequate resource allocations for managing chronic long-term painful conditions appropriately has resulted in chronic pain becoming a serious public health issue posing a large economic burden to healthcare and social care [3]. The delay in addressing the effects of chronic pain can result in mental health issues, breakdown of relationships, fatigue, lack of motivation, and affect patient’s ability to remain in employment, or to return to work following sick leave. Failure to manage chronic pain appropriately therefore impacts both social well-being and economic productivity of populations.
Patients and clinicians now have a better understanding of both the management of long-term conditions including chronic pain, and the limitations of surgical and pharmacological interventions. As an example, spinal surgeries for managing chronic back and neck pain may lead to persistent pain and disabilities which could be attributed to the index condition or the treatment [1]. Pharmacological treatment options including NSAIDs, neuropathic pain medications and weak and strong opioids are no longer recommended for long term use due to their adverse side-effect profile; some patients find it difficult to tolerate these treatments, even at lower doses. The liberal use of opioids for managing chronic non-cancer pain in the western world has created an addiction problem for public health systems of epidemic proportions [4].
The importance of addressing psychological well-being and social care for effective management is being widely accepted and there is increasing awareness of establishing care delivery through community services incorporating exercise therapy, health coaching and social prescribing. Additionally, there is increasing recognition of the utility of psychology services, and patients are being offered support not only through pain clinics, but also through community-based services where they can even self-refer for assessment and support [1]. Patients can now be offered counselling, talking therapy, cognitive behavioural therapy (CBT), mindfulness and eye movement desensitization and reprocessing (EMDR). Psychology services can help to alleviate patients discomfort and stress, as well as equipping patients with self-management strategies to deal with their chronic pain.
Timely access to medical care and potential cost implications, as well as reluctance to take medications, can result in patients seeking advice and treatment from non-medical practitioners. This may also be rooted in cultural beliefs and availability of services. Physiotherapist sessions including manipulations, and exercise therapies including Pilates and other core-strengthening exercises and “alignment and adjustment treatments” by chiropractors and osteopaths are often sought by patients before seeking a conventional clinician. In Europe and the Americas and further east, yoga, tai chi, qi gong, massage, acupuncture, aromatherapy, reflexology and reiki practitioners are involved in managing pain and pain-related issues [3]. Practices such as yoga, tai chi, qi gong, massage, acupuncture, aromatherapy, reflexology and reiki, have now gained popularity across the globe in recent years, and some therapies like acupuncture are funded through healthcare systems. Anecdotally, small case series or individual patients claim significant benefit from some of these treatments, but there is paucity of evidence from reliable clinical trials or real-world data. Some of these treatments have been accessed by patients as part of early intervention and management even during the acute stage of their pain and there are significant variations in practice and how the treatments are delivered depending on the practitioner and remunerations.
Multidisciplinary management of pain employs the use of both psychological and physical therapies as a part of a multi-modal analgesic strategy. Studies have shown the benefit of using cognitive behavioural therapy with pharmacological management or exercise, rehabilitation and pain management programmes with pain interventional procedures and neuromodulation [5]. For the purpose of this study, complex interventions are defined as two or more clinical or non-clinical interventions used to treat non-cancer pain. The aim of this study was to demonstrate the prevalence of complex interventions used for the purpose of pain management.
Methods
We developed a systematic methodology and published this in PROSPERO (CRD42021235384) with the aim to demonstrate the prevalence of combined minimally invasive interventions used for the purpose of pain management. For the purpose of this study, two or more clinical or non-clinical interventions used to treat non-cancer pain was defined as complex interventions.
Eligibility criteria
The search strategy included key words of chronic pain, complex interventions, non-opioids, acute pain, pain management, rehabilitation, physiotherapy, non-clinical interventions, cognitive behavioural therapy, CBT, back pain and analgesics. We used multiple databases of PubMed, Science direct, ProQuest, Web of science, Ovid Psych INFO, PROSPERO, EBSCOhost, MEDLINE, ClinicalTrials.gov and EMBASE. All randomised clinical trials, epidemiology and mixed-methods studies peer reviewed and published in English between the 1st January 1990 and 31st April 2022 were included. All commentaries, editorials, opinions and grey literature were excluded from the final sample pool.
Data extraction
Data were extracted from the eligible studies using a study specific excel extraction template which included age, sex, outcome, outcomes measures, intervention and type used, geographical location and statistical details such as mean, median, standard deviation and confidence intervals. The final data pool was examined by two independent investigators before the statistical analysis was completed. All disputes around study eligibility were discussed and agreed with the Chief Investigator.
Outcome measures
Outcome measures included intensity of chronic pain, assessment of functional disability, and participants’ psychological state during treatment. For pain intensity, a variety of methods were used, including visual analogue scale (VAS), numeric rating scale (NRS), Graded Chronic Pain Scale (GCPS), Brief Pain Inventory (BPI), Neck Pain Index (NPI, only used for chronic neck pain). For all measurements of pain intensity, a larger value indicated a worse condition of chronic pain. Assessment of functional disability of pain was differentiated according to types of pain. Neck-related disability was assessed by Neck Disability Index (NDI) and a modified version of NDI, while functional disability of low back pain and other types of pain was assessed by Roland Disability Questionnaire (also called Roland Morris Disability Questionnaire, RDQ or RMQ), Oswestry Disability Questionnaire (also called Oswestry Disability Index, ODQ or ODI) and a modified version of ODQ. A higher value of neck pain and low back pain represented poor physical function and greater disability. Psychological state of participants included several measurements, including depression and anxiety. Considering the impact of the number of studies on the results of network meta-analysis, depression was selected as a measurement of effectiveness on chronic pain, which was assessed by Patient Reported Outcomes Institute Measurement System (PROMIS), Beck Depression Inventory (BDI), Centre for Epidemiological Studies Depression Scale (CES-D) and Hospitality Anxiety and Depression Scale (HADS). A higher score indicated greater severity of depression.
Statistical analysis plan
Currently a variety of interventions are used to assess chronic pain with a large number of variables. In order to answer the research question comprehensively, all the data gathered was reported using a pairwise meta-analysis (PMA) and network meta-analysis (NMA) were performed. The NMA pooled standardized mean difference (SMD) with a 95% confidence interval (CI) to report the effectiveness of interventions for each study. The PMA combined the result of two or more studies which were used to compare the effectiveness of two or more interventions [6]. NMA was used to report indirect comparisons of the interventions in instances where there was more than two and all the comparisons of studies formed one or more networks.
SMD was used instead of mean difference (MD) to calculate the dimensionless effect measure as there were a number of pain variables. The dimensionless effect measure was defined as the mean difference divided by a standard deviation based either on a single treatment group or both treatment groups, reported as
where denoted the number of patients in the experimental treatment , denoted standard deviation of response in the experimental treatment , , denoted the mean response in the treatment and .
Statistical significance effect would be concluded based on the hypothesis test of network SMD.
Statistical heterogeneity was reported using the Cochrane's Q test and statistic, and statistically significant heterogeneity was considered present at larger than 50% and p value of Cochrane's Q smaller than 0.05. In comparison, there is no heterogeneity if is less than or equal to 50% with a large p-value indicates weak heterogeneity [7]. In the presence of high heterogeneity, the random effects model was employed whilst the fixed effects model was used in the presence of weak or no heterogeneity [8]. Publication bias was evaluated with funnel plots if a network included over 10 studies [9], and the funnel plot asymmetry was tested using Egger’s test. A p-value larger than 0.05 of Egger’s test was considered as the lack of significant publication bias [10].
Results
Of the 168 systematically included studies (Table 1), 46 were selected for the meta-analysis. Of the 46 studies, 14 were about exercise related interventions such as yoga, qigong, pilates and exercise whilst 12 were about acupuncture related intervention; 14 reported cognitive behavioral therapy (CBT) related interventions, and 6 indicated sports massage related interventions.
Network Meta-analysis
The study sample was categorised into four networks of exercise-related, acupuncture-related, CBT-related and massage-related interventions. Effect of interventions within each network was compared directly and indirectly using a NMA method.
Publication bias
Publication bias of networks with more than ten studies was assessed using funnel plots (Figure 28 (a)-(g)). Besides, Egger’s test was used as a statistical method to evaluate publication bias of network meta-analysis (result shown in Table 3).
According to the test of funnel plot asymmetry, only one network, the network with acupuncture related interventions (Figure 28(c)), had a p-value smaller than .05 and asymmetry of funnel plot, which indicated significant publication bias in this network. Other networks (Figure 28 (a), (b), (d)-(g)) did not show significant publication bias.
When focusing on the asymmetrical network, there were four points on the far-right side of the reference line, which represented the comparison of Acupuncture vs control treatment in the study No.74. Since the mean difference between two treatments seemed larger than other studies with the same comparison, the funnel plot showed these large mean differences as the dots on the right outside 95% CI (i.e., the dotted line on both sides of the reference line).
Discussion
This study explored 168 studies that evaluated non-clinical and clinical-interventions for pain management with a total sample size of 21,305. Most patients with long-term chronic pain conditions preferred clinically effective but minimally invasive interventions that had fewer side effects in comparison to pharmacological and medical device treatments. Our findings indicate that the minimally invasive and combined treatment approach may have improved the quality of life.
In clinical practice, routine therapeutic interactions such as physiotherapy or yoga or pilates was preferred by patients especially with lower back pain and could be cost-effective in comparison to pharmacological or medical device use to support patient recovery and simultaneously support their physical and psychological wellbeing. The potential for enhancing the benefits of pilates, yoga and various other forms of exercise therapy in combination with cognitive behavioural therapy could also assist other pain conditions such as Fibromyalgia based on our findings although larger sample sizes would be required along with longitudinal data to better assess the generalisability and applicability to a wider population.
Our analyses demonstrated that the findings were from differing geographical locations of Europe, Australia, India, Iran, Africa, south and north Americas. The variation in demographics and healthcare system practices could influence pain management outcomes. Of the 168 studies, 91 were from Europe which could have some parity with routine clinical practices although differences in phenotypic characteristics can widen the applicability of the findings.
Another key finding of our pooled sampled was small sample sizes with only one study having a statistically significant sample size of 3451 [11] and therefore the possibility of showing generalisability to a wider population. The smaller effect sizes within each study allowed the NMA to explore direct and indirect comparisons of the interventions by combining the observations reported by way of outcomes such as pain intensity, pain disability, psychological state and depression.
Psychological interventions such as CBT showed significance in improving pain intensity and depression and it is likely that combining CBT with exercise therapy, physical therapy or massage therapy could lead to better therapeutic outcomes; future clinical trials should be designed accordingly and this would also be aligned to real-world clinical practice.
The use of exercise and related treatments demonstrated statistically significant heterogeneity. The home exercise and manipulation technique-based treatments provided a statistically significant reduction in pain intensity. When exercise treatment was compared to a control and qigong treatment, there was a statistically significant increase in pain intensity and pain disability which could lead to increased apathy in continuing with the exercise programme. This would act as an advisory to better define exercise programs and to use other modalities including short-term pharmacological therapy or targeted nerve blocks for managing pain intensity for better outcomes. Based on this evidence, exercise could be considered as a better treatment for pain management as it improves function and mobility and could be part of a long-term management strategy. The generalisability of these findings would require statistically significant sample sizes to be used when conducting future studies with clear use of case definitions indicating the primary and secondary causes of pain. Direct comparisons of home exercise, physical therapy and aerobic exercise indicated a reduction in pain disability scores based on a of SMD of -4.86 and -4.42, respectively. Further reductions in pain disability were observed when exercise treatments were combined with CBT. The direct comparisons between routine care and acupuncture related treatments indicated a statistically significant reduction in pain intensity. Direct comparisons between routine care, cognitive plus relaxation, indicated an increase in pain intensity, whilst MSCT plus STGT, and multimodal exercise plus CBT treatment provided a statistically significant decrease in pain intensity. MSCT+STGT treatments appeared to have had a better effect in pain intensity among chronic pain populations than multimodal exercise plus CBT treatment. MSCT+STGT treatment, and multimodal exercise plus CBT treatments, reduced pain intensity, whilst MSCT+STGT treatments had a slightly better effect than multimodal exercise plus CBT treatment (with a SMD of -3.6 and -3.35, respectively).
Due to the lack of studies comparing exercise treatment with analgesics, there is no evidence to demonstrate the effectiveness and efficacy of the combined approach, although this is a preferred approach in clinical practice.
The Witt et al. [11] study is the largest RCT on acupuncture for managing neck pain; less than a third of the patients were randomised and the non-randomised group had more severe pain and disability at baseline but showed higher levels of improvement for both pain intensity and pain disability. By contrast, systematic review and NMA of 40 RCTs reviewed the comparative effectiveness of physical exercise interventions for chronic non-specific neck pain but showed no superiority for any specific type of physical exercise with only low-quality evidence for various exercise treatments [12].
Future clinical trials should look at comparing exercise with other modalities including local or systemic analgesia, acupuncture and CBT for better outcomes than exercise therapy alone.
Pain disability is a complex issue where there is limited knowledge available regarding the underlying mechanisms of common chronic pain conditions as lower back pain. For patients with demonstrable compression of a nerve root and spinal degeneration, chronic pain can be debilitating. Experience with pain is heterogeneous, hence, the degree of discomfort is not necessarily relational to the physical or physiological damage. The physiological factors may equally not have an impact on the transition from acute to chronic pain, to functional disability. Therefore, the physiological manifestations may inextricably intertwine with psychological factors. The pain disability findings from this study indicate key evidence to these phenomena where no treatments showed a statistical significance increase in depression. In clinical practice, management plans should have a combination of treatments to reduce pain intensity enabling active interventions like exercise or Pilates, thereby achieving a reduction in pain disability.
Pain disability is a complex issue where there is limited knowledge available with the underlying mechanisms of common chronic pain conditions as lower back pain. For patients with demonstratable compression of a nerve root and spinal degeneration, chronic pain can be debilitating. Experience with pain is heterogeneous hence, the degree of discomfort is not necessarily relational to the physical or physiological damage. The physiological factors may equally not have an impact on the transition from acute to chronic pain to functional disability. Therefore, the physiological manifestations may inextricably intertwine with psychological factors. The pain disability findings from this study indicate key evidence to this phenomena where no treatments showed a statistical significance increase in depression. Treatments such as treatment programs with combination of treatments such aligned to post massage could reduce pain intensity thereby reaching a reduction in pain disability.
Conclusion
The study shows combined interventions for non-cancer chronic pain management need further evidence, including longitudinal data. Future research should not be limited to the use of randomised controlled clinical trials or clinical studies, but real-world data that can demonstrate crucial information that could aid best clinical practices. Developing clinical and patient reported outcomes with aligned outcome measures could support the development of optimal evidence that can enhance precision clinical practice at a fraction of the current per patient cost. As the addition of psychological interventions alongside physical and exercise therapy showed improvements with mental health and wellbeing, these should be considered for better parameter selection. In conjunction with the findings, we recommend combining physical and psychological therapies alongside other routine treatments but with early diagnosis approaches to optimise clinical care offered to patients.
Author Contributions
AS and GD developed the study protocol and embedded this within the POP project. GD and JQS designed and completed the study analysis. The data extraction was completed by HC and CD. All authors critically appraised and commented on previous versions of the manuscript. All authors read and approved the final manuscript.
Funding
Internal funding.
Code Availability
The authors will consider sharing the novel code created upon receipt of reasonable requests.
Ethics Approval
Not applicable.
Consent to Participate
Not applicable.
Consent for Publication
All authors consented to publish this manuscript.
Availability of Data and Material
The authors will consider sharing the dataset gathered upon receipt of reasonable requests.
Conflicts of Interest
AS has received funding from Nevro and Medtronic. PP has received research grants from Novo Nordisk, Queen Mary University of London, John Wiley & Sons, Otsuka, outside the submitted work. All other authors report no conflict of interest. The views expressed are those of the authors and not necessarily those of the NHS, the National Institute for Health Research, the Department of Health and Social Care or the Academic institutions.
References
- Cohen SP, Vase L, Hooten WM. Chronic Pain 1 Chronic pain: an update on burden, best practices, and new advances. www.thelancet.com. 2021. Available: www.thelancet.
- Fayaz A, Croft P, Langford RM, Donaldson LJ, Jones GT. Prevalence of chronic pain in the UK: a systematic review and meta-analysis of population studies. Open. 2016;6: 10364. [CrossRef]
- Domenichiello AF, Ramsden CE. The silent epidemic of chronic pain in older adults. Progress in Neuro-Psychopharmacology and Biological Psychiatry. Elsevier Inc.; 2019. pp. 284–290. [CrossRef]
- Opioid overdose. Who.int : www.who.
- Lim J, Choi S, Lee JW, Jang JH, Moon JY, Kim YC, et al. Cognitive-behavioral therapy for patients with chronic pain. Medicine (Baltimore). 2018; 97(23):. [CrossRef]
- Schwarzer G, Carpenter JR, Rücker G. Meta-Analysis with R. Cham: Springer International Publishing; 2015. [CrossRef]
- Higgins JPT, Thompson SG. Quantifying heterogeneity in a meta-analysis. Stat Med. 2002;21: 1539–1558. [CrossRef]
- Borenstein M, Hedges L V., Higgins JPT, Rothstein HR. A basic introduction to fixed-effect and random-effects models for meta-analysis. Res Synth Methods. 2010;1: 97–111. [CrossRef]
- Egger M, Smith GD, Schneider M, Minder C. Bias in Meta-Analysis Detected by a Simple, Graphical Test. Journal. 1997. Available: https://www.jstor. 2517.
- Sterne JAC, Sutton AJ, Ioannidis JPA, Terrin N, Jones DR, Lau J, et al. Recommendations for examining and interpreting funnel plot asymmetry in meta-analyses of randomised controlled trials. BMJ (Online). 2011;343. [CrossRef]
- Witt CM, Jena S, Brinkhaus B, Liecker B, Wegscheider K, Willich SN. Acupuncture for patients with chronic neck pain. Pain. 2006;125: 98–106. [CrossRef]
- De Zoete RMJ, Armfield NR, McAuley JH, Chen K, Sterling M. Comparative effectiveness of physical exercise interventions for chronic non-specific neck pain: A systematic review with network meta-analysis of 40 randomised controlled trials. British Journal of Sports Medicine. BMJ Publishing Group; 2021. pp. 730–742. [CrossRef]
Figure 1.
Network plot of pain intensity under exercise-related treatments in the first subnet.
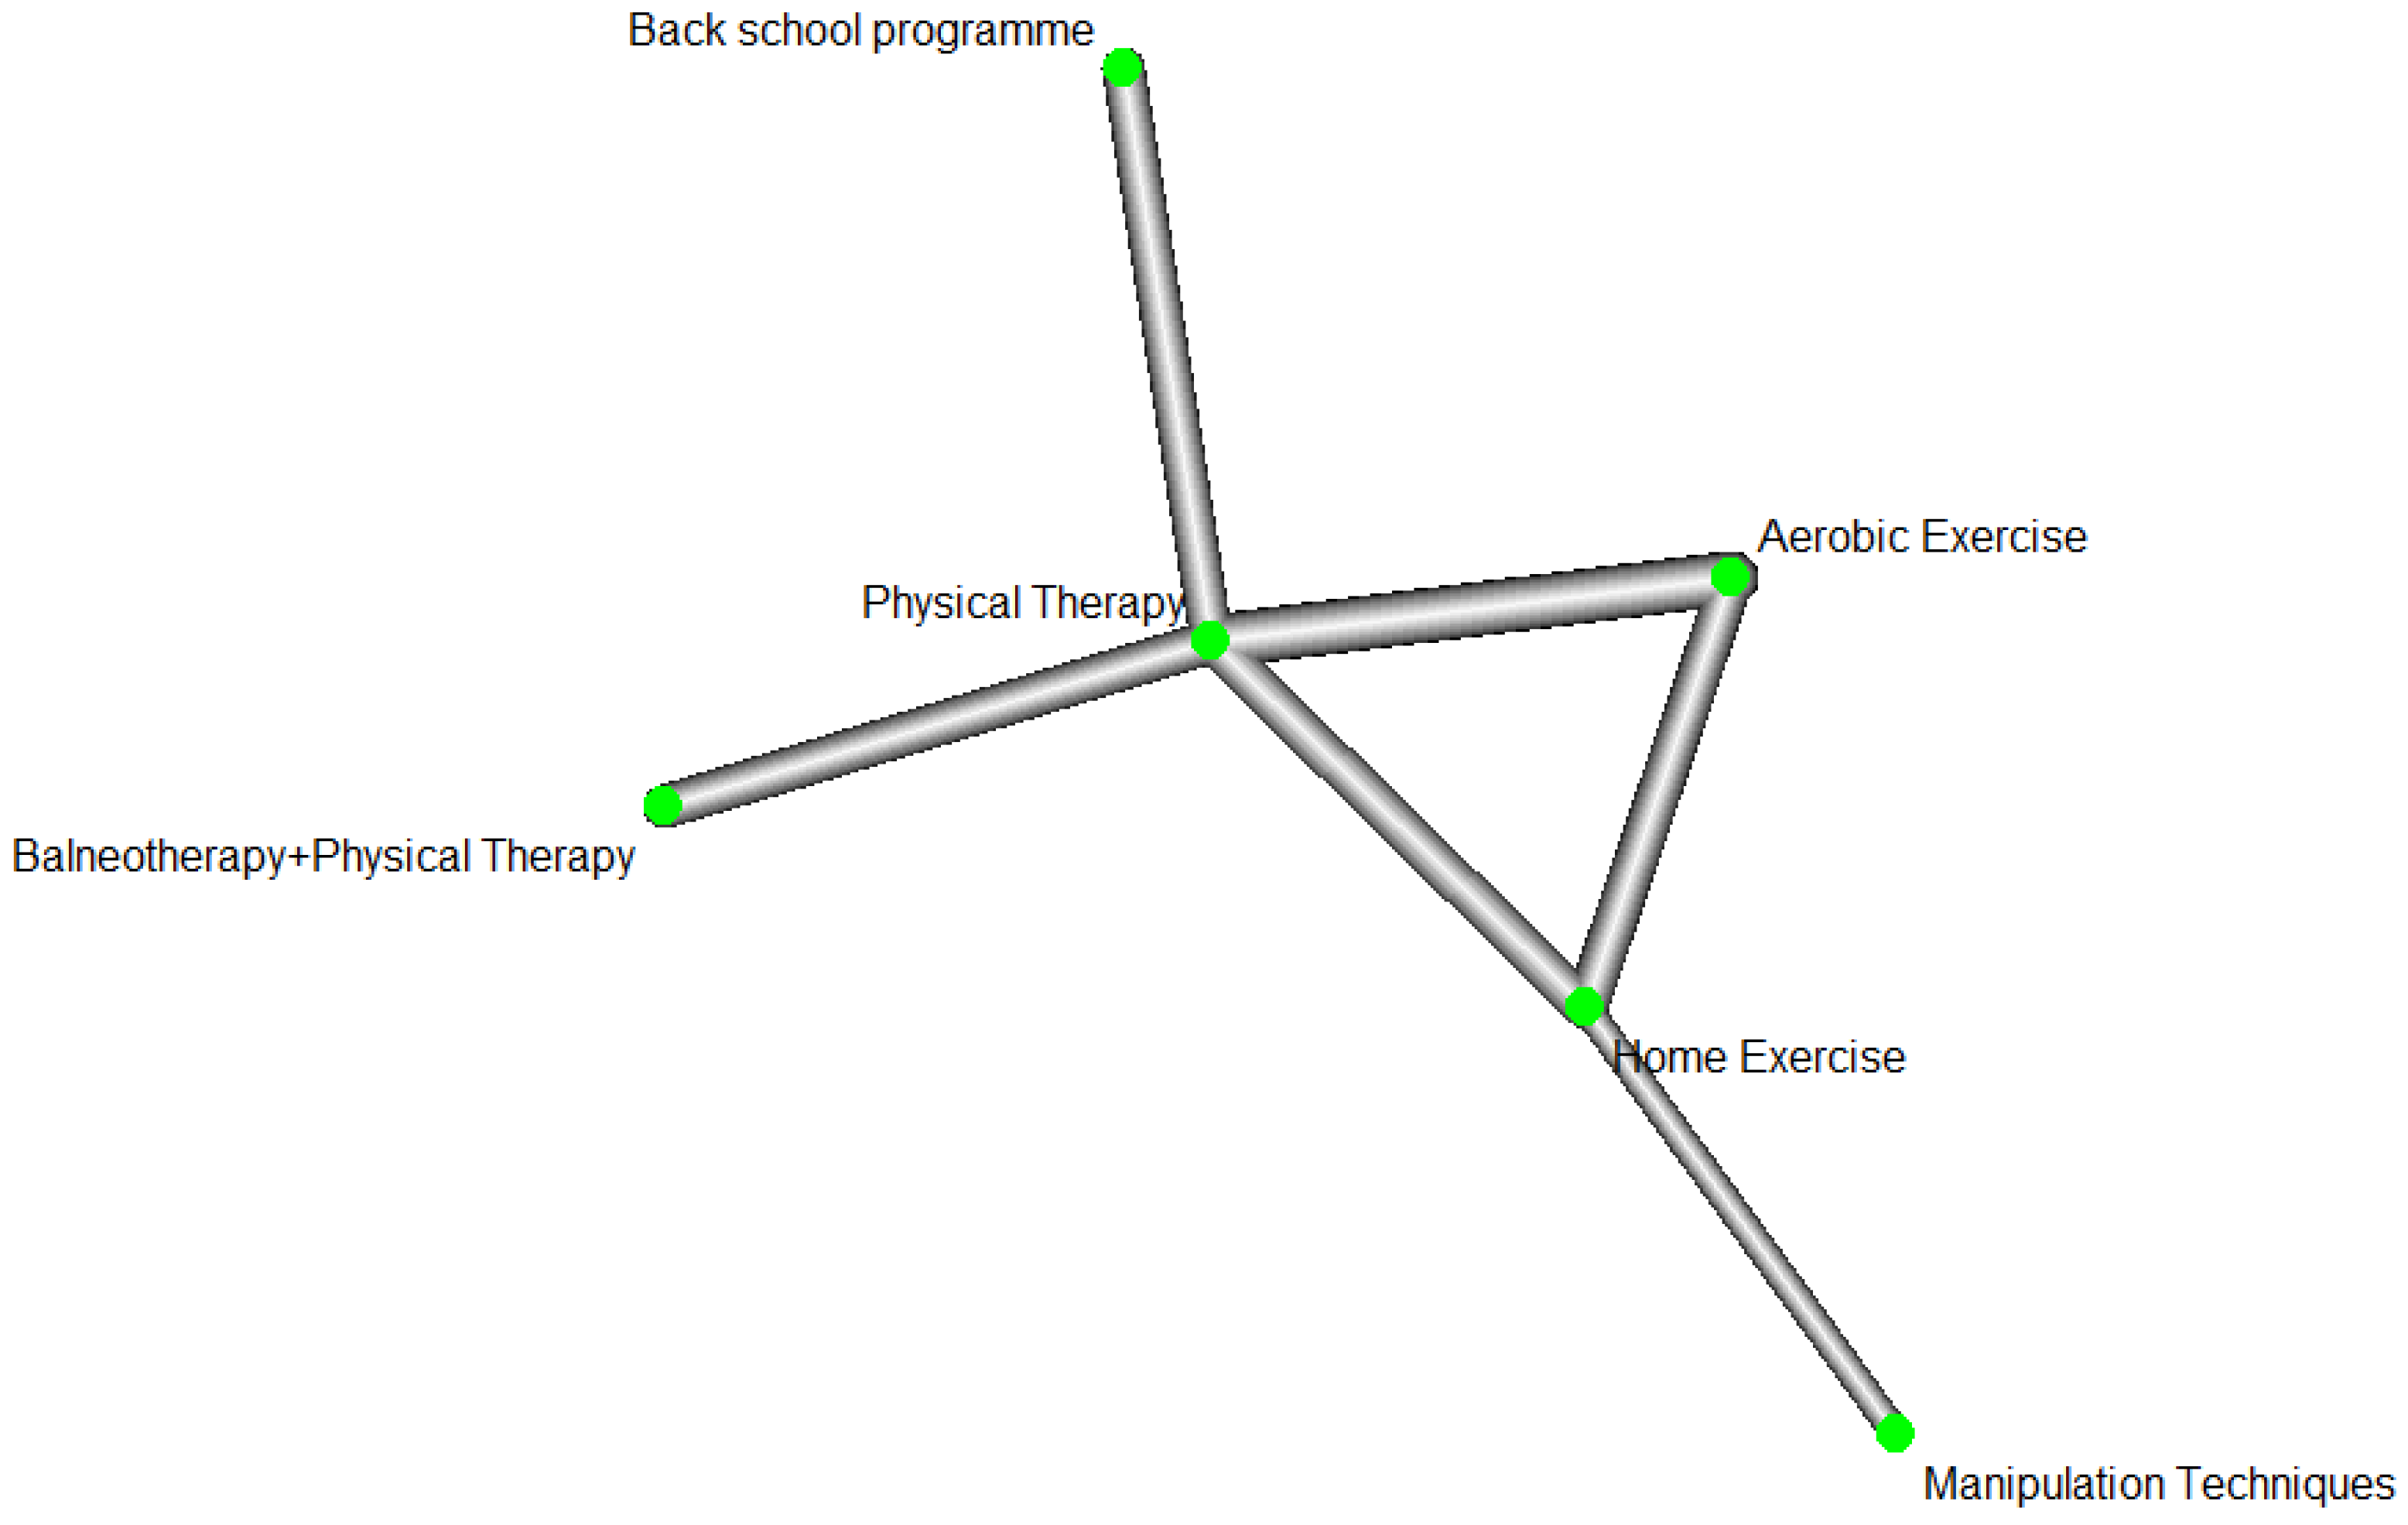
Figure 2.
Forest plot of pain intensity under all direct comparisons of exercise-related treatments in the first subnet.
Figure 2.
Forest plot of pain intensity under all direct comparisons of exercise-related treatments in the first subnet.
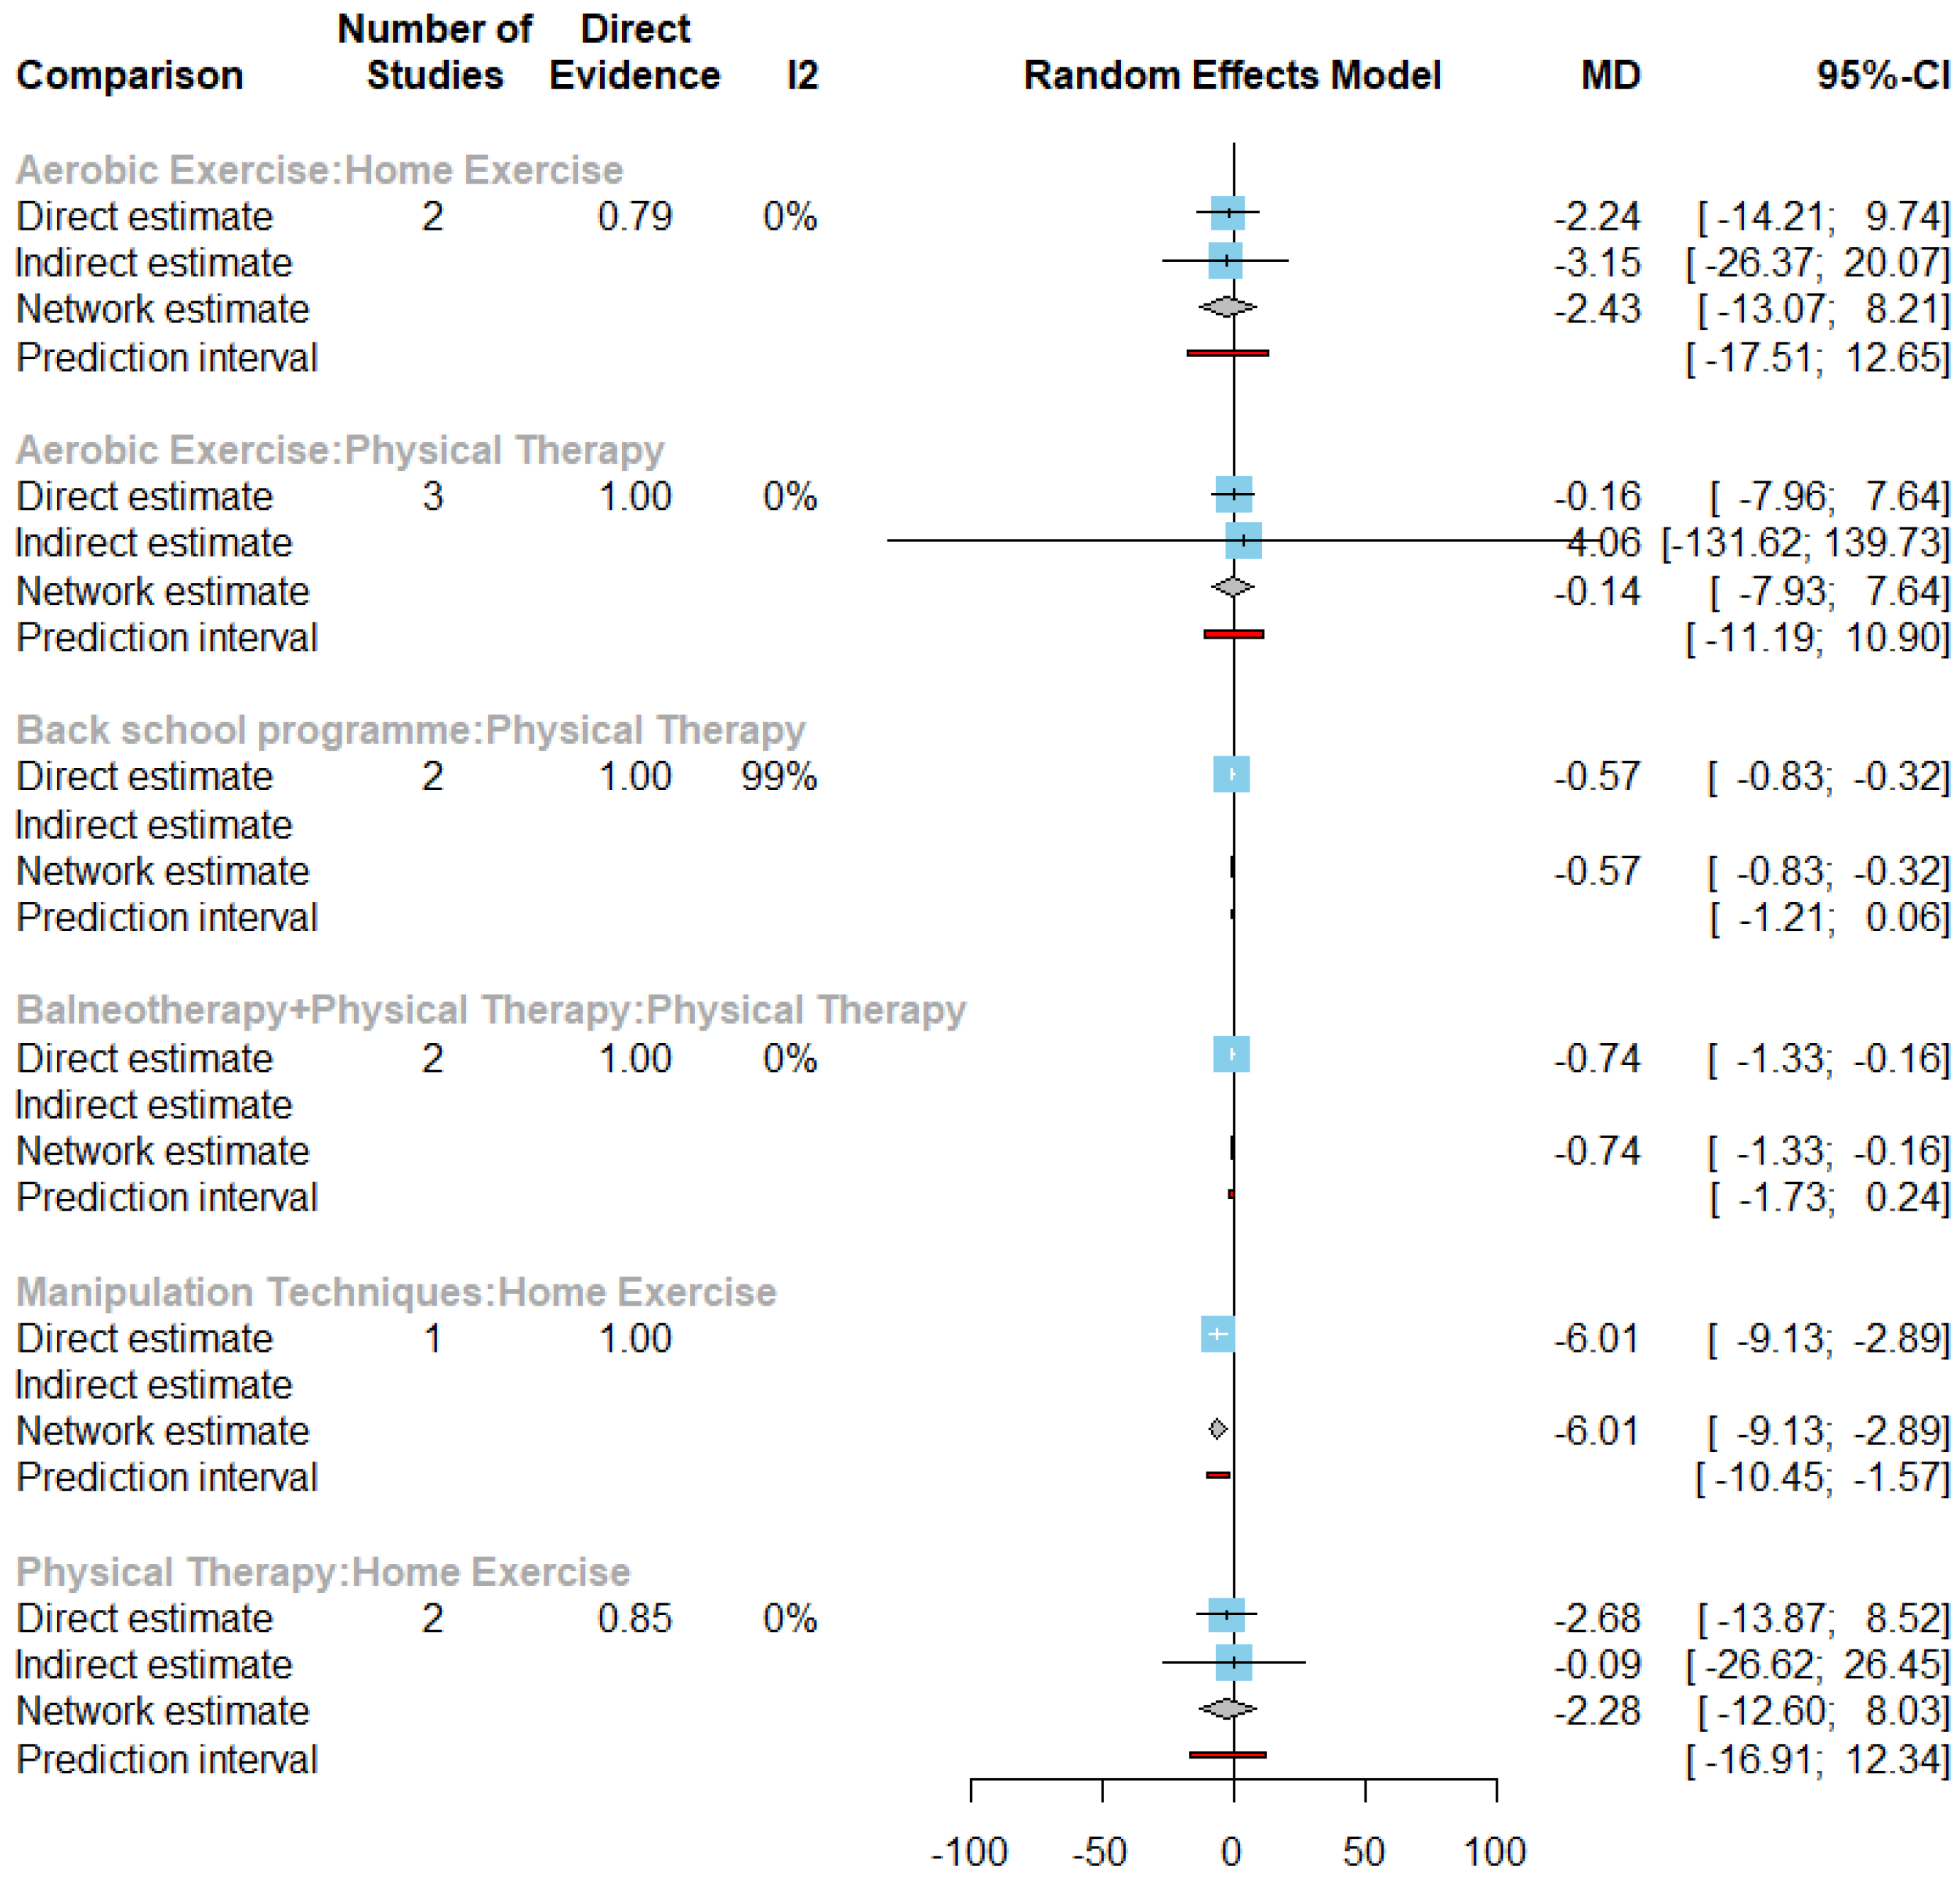
Figure 3.
Forest plot of all exercise-related treatments compared with control treatment in the first subnet.
Figure 3.
Forest plot of all exercise-related treatments compared with control treatment in the first subnet.
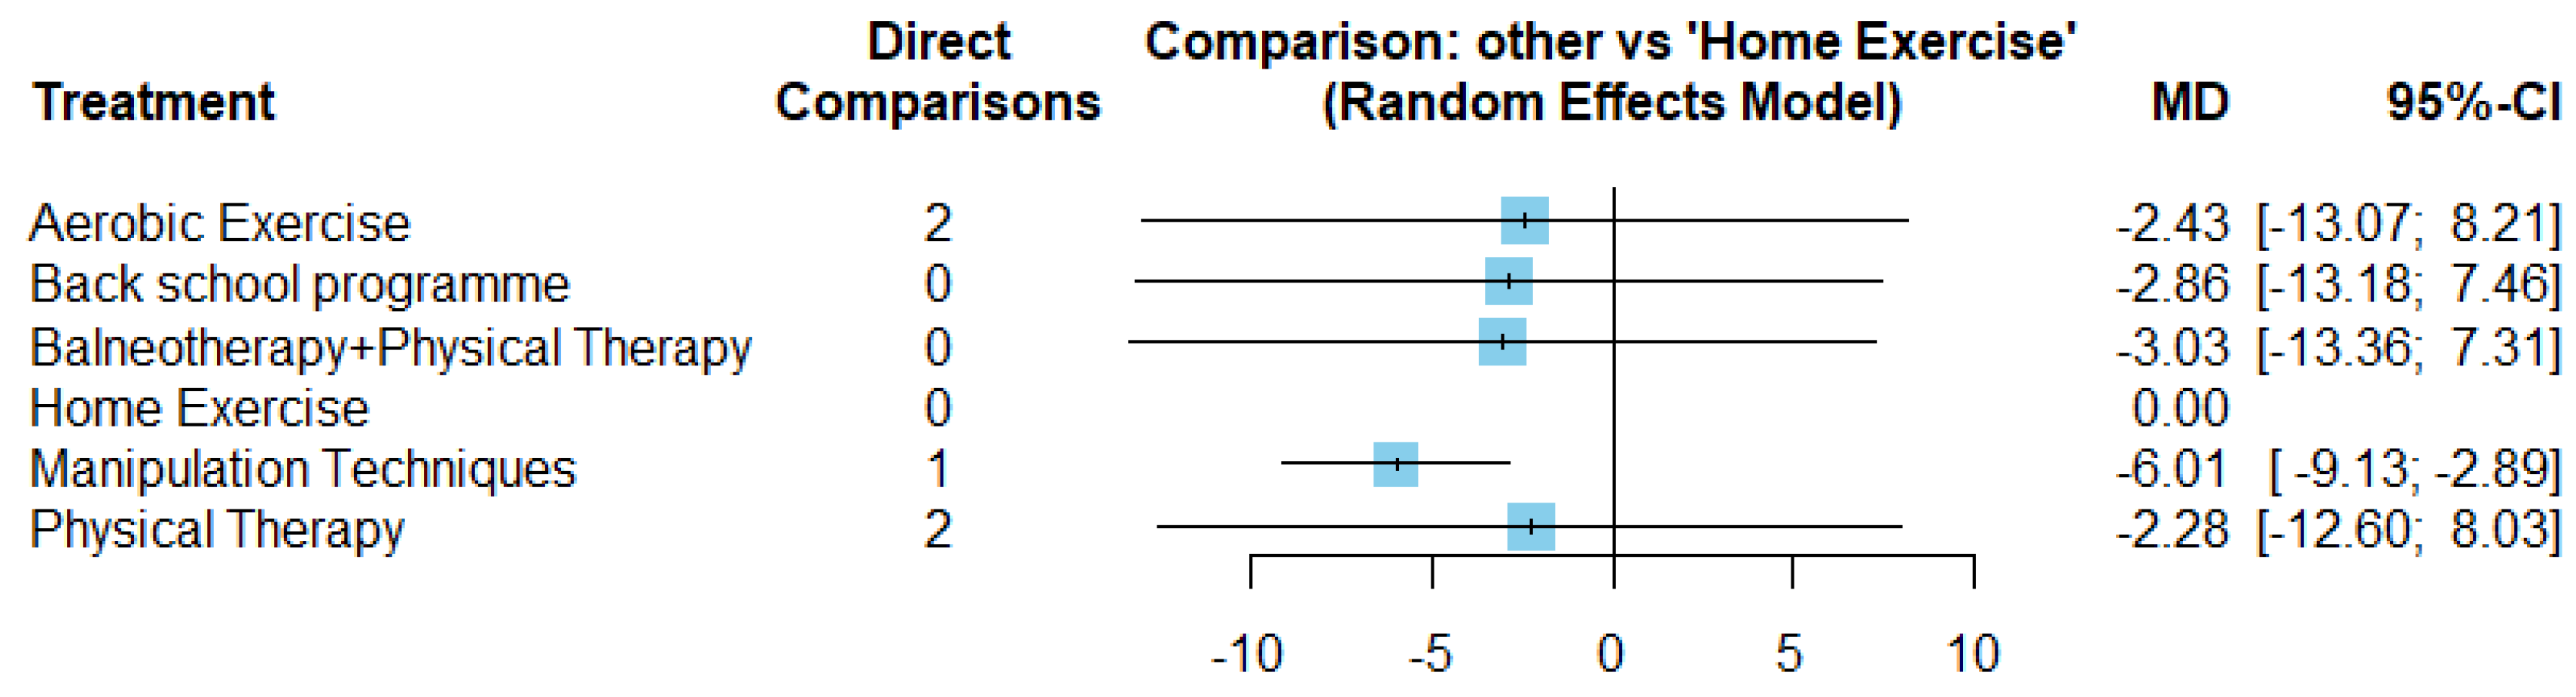
Figure 4.
Network plot of pain intensity under exercise-related treatments in the second subnet.
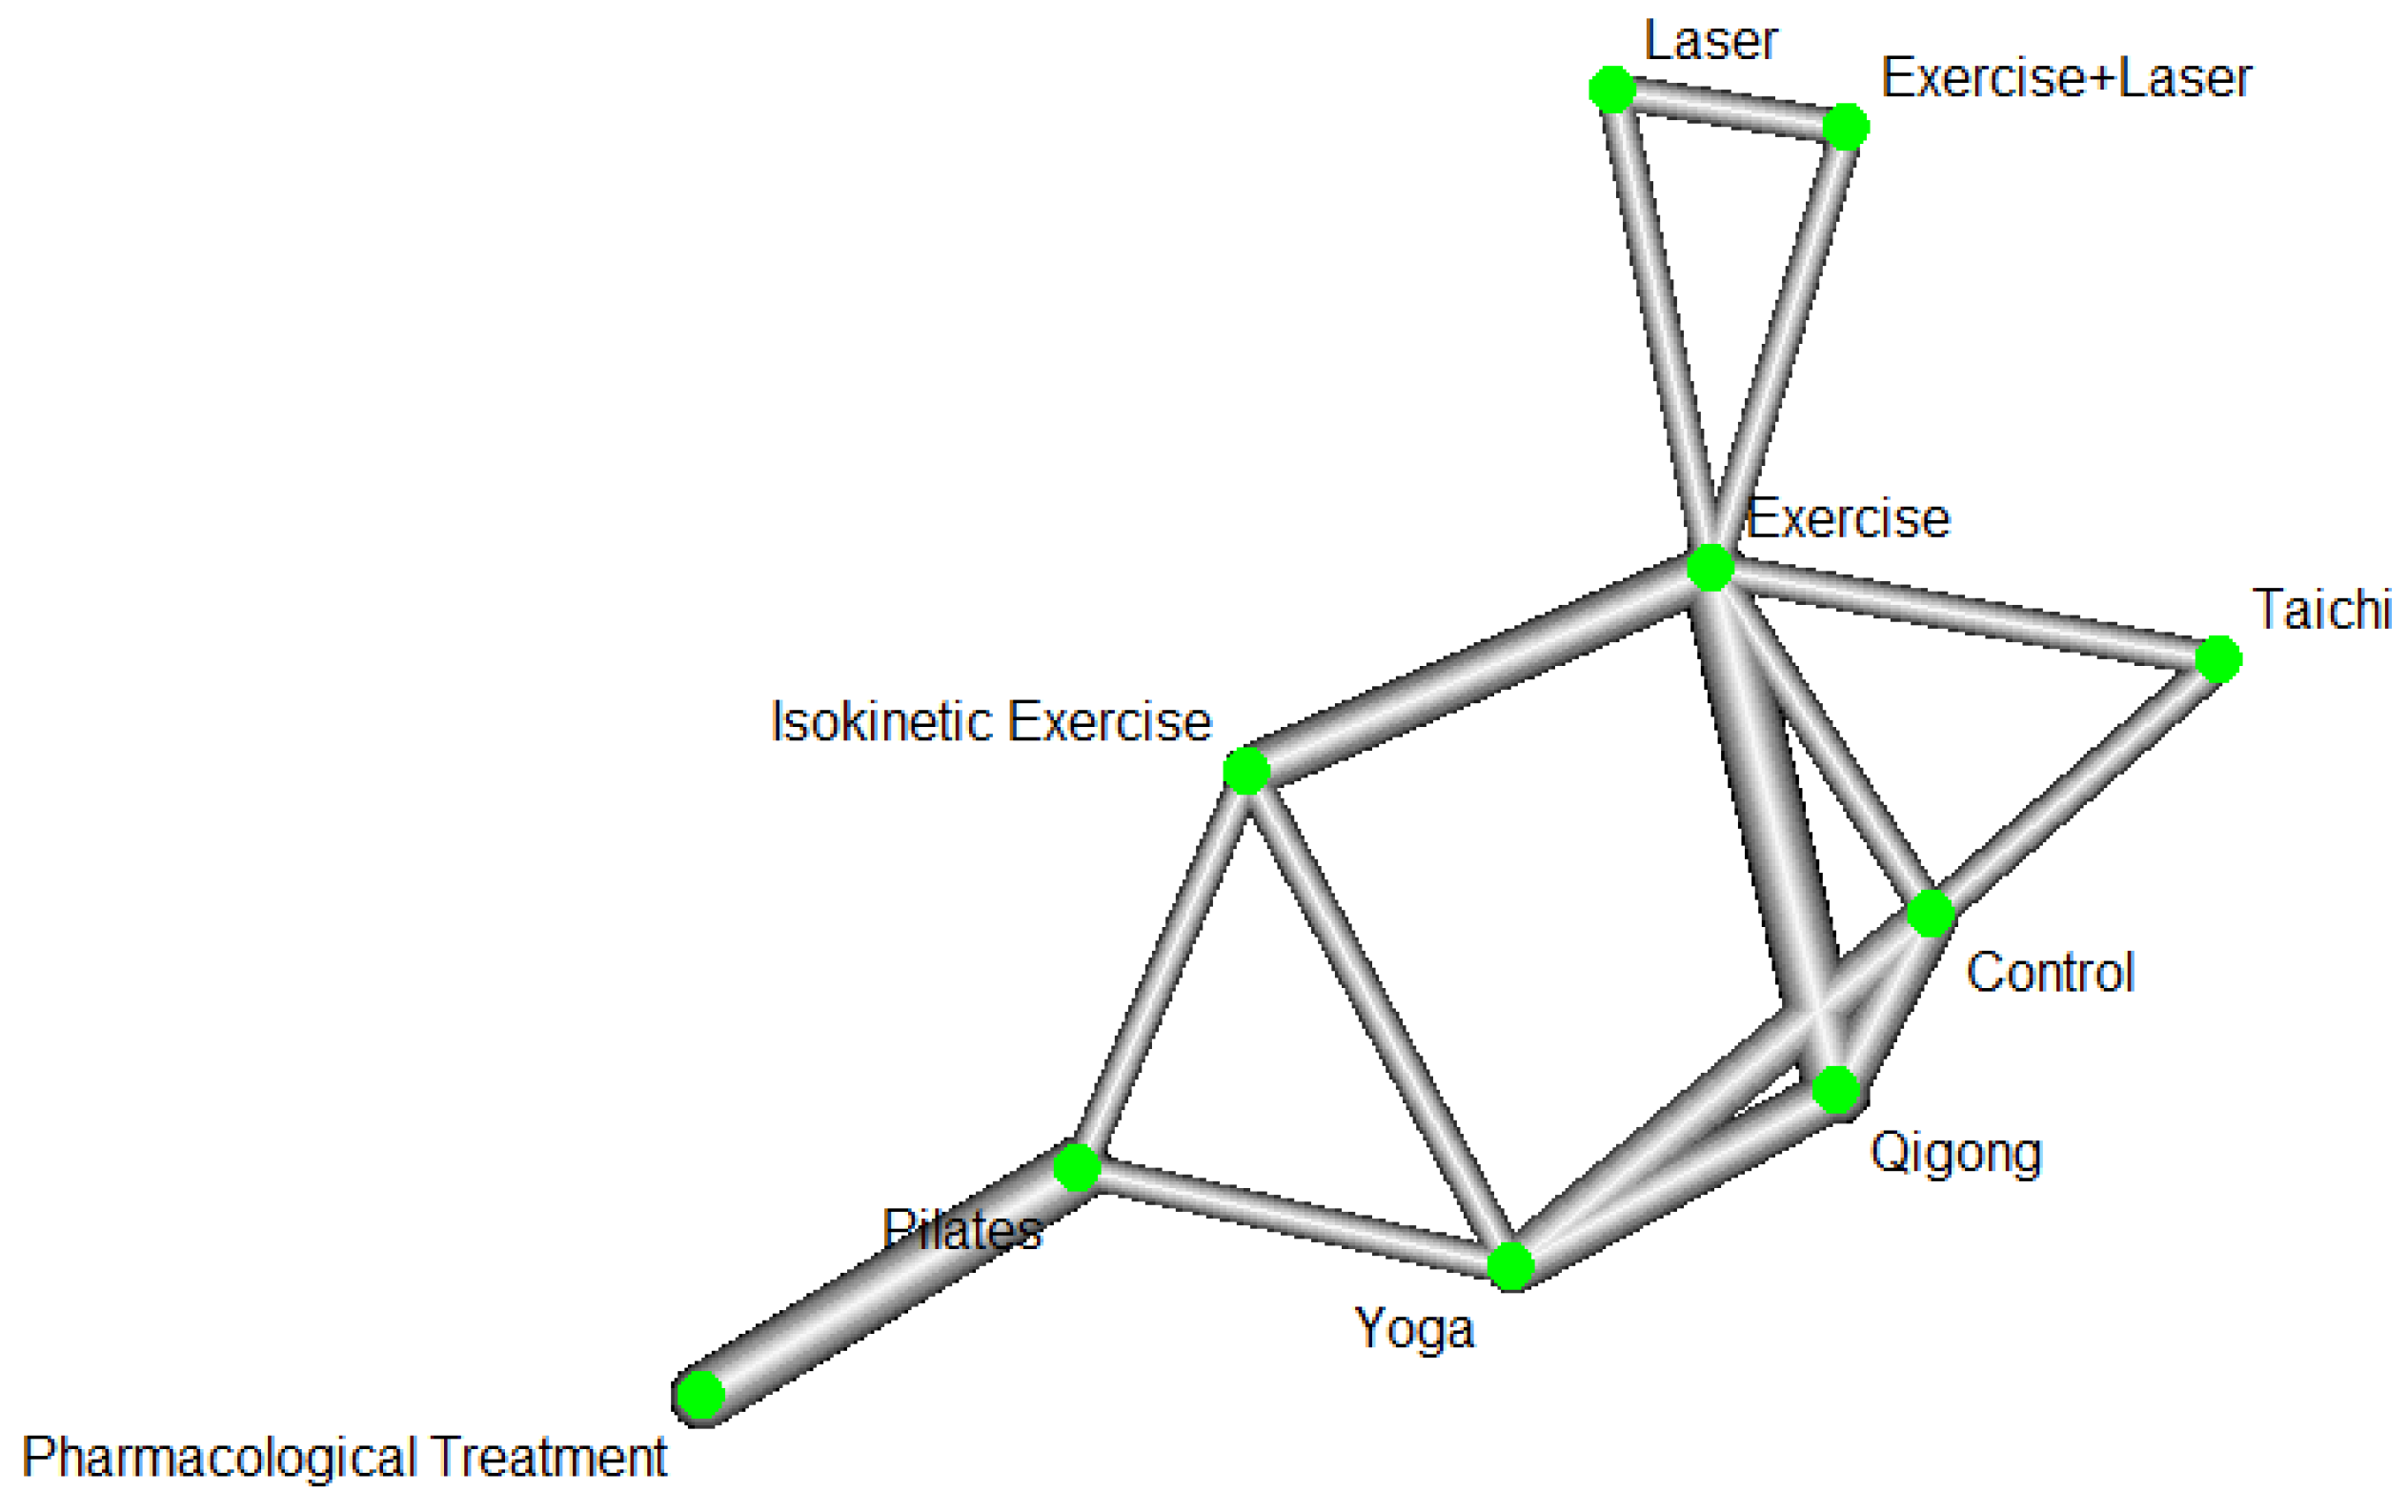
Figure 5.
Forest plot of pain intensity under all direct comparisons of exercise-related treatments in the second subnet.
Figure 5.
Forest plot of pain intensity under all direct comparisons of exercise-related treatments in the second subnet.
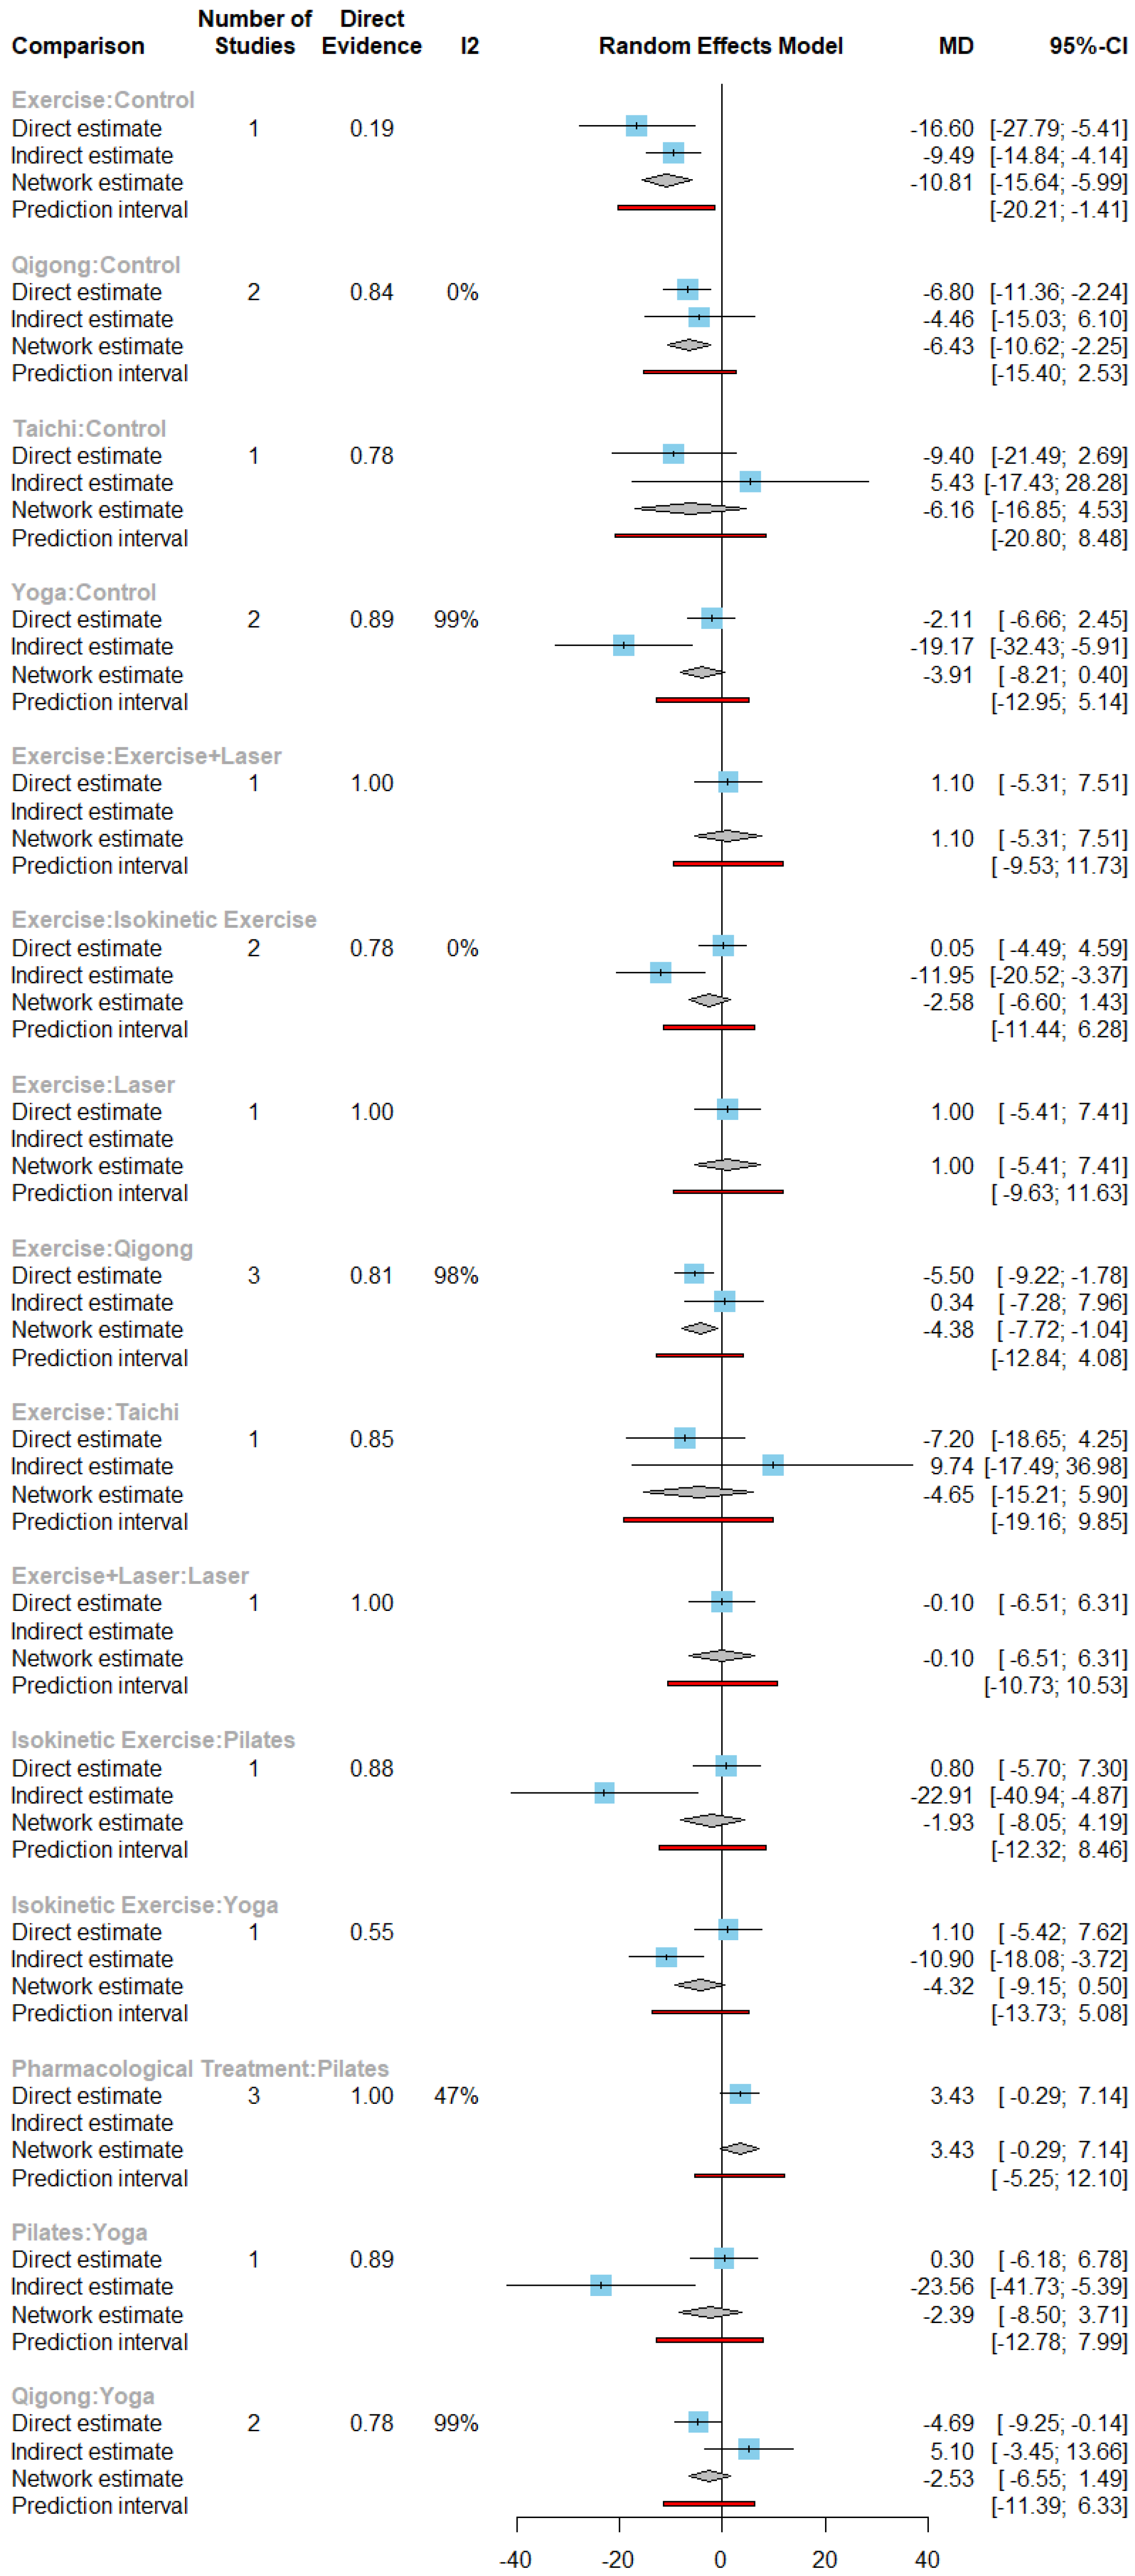
Figure 6.
Forest plot of pain intensity under all exercise-related treatments compared with control treatment in the second subnet.
Figure 6.
Forest plot of pain intensity under all exercise-related treatments compared with control treatment in the second subnet.
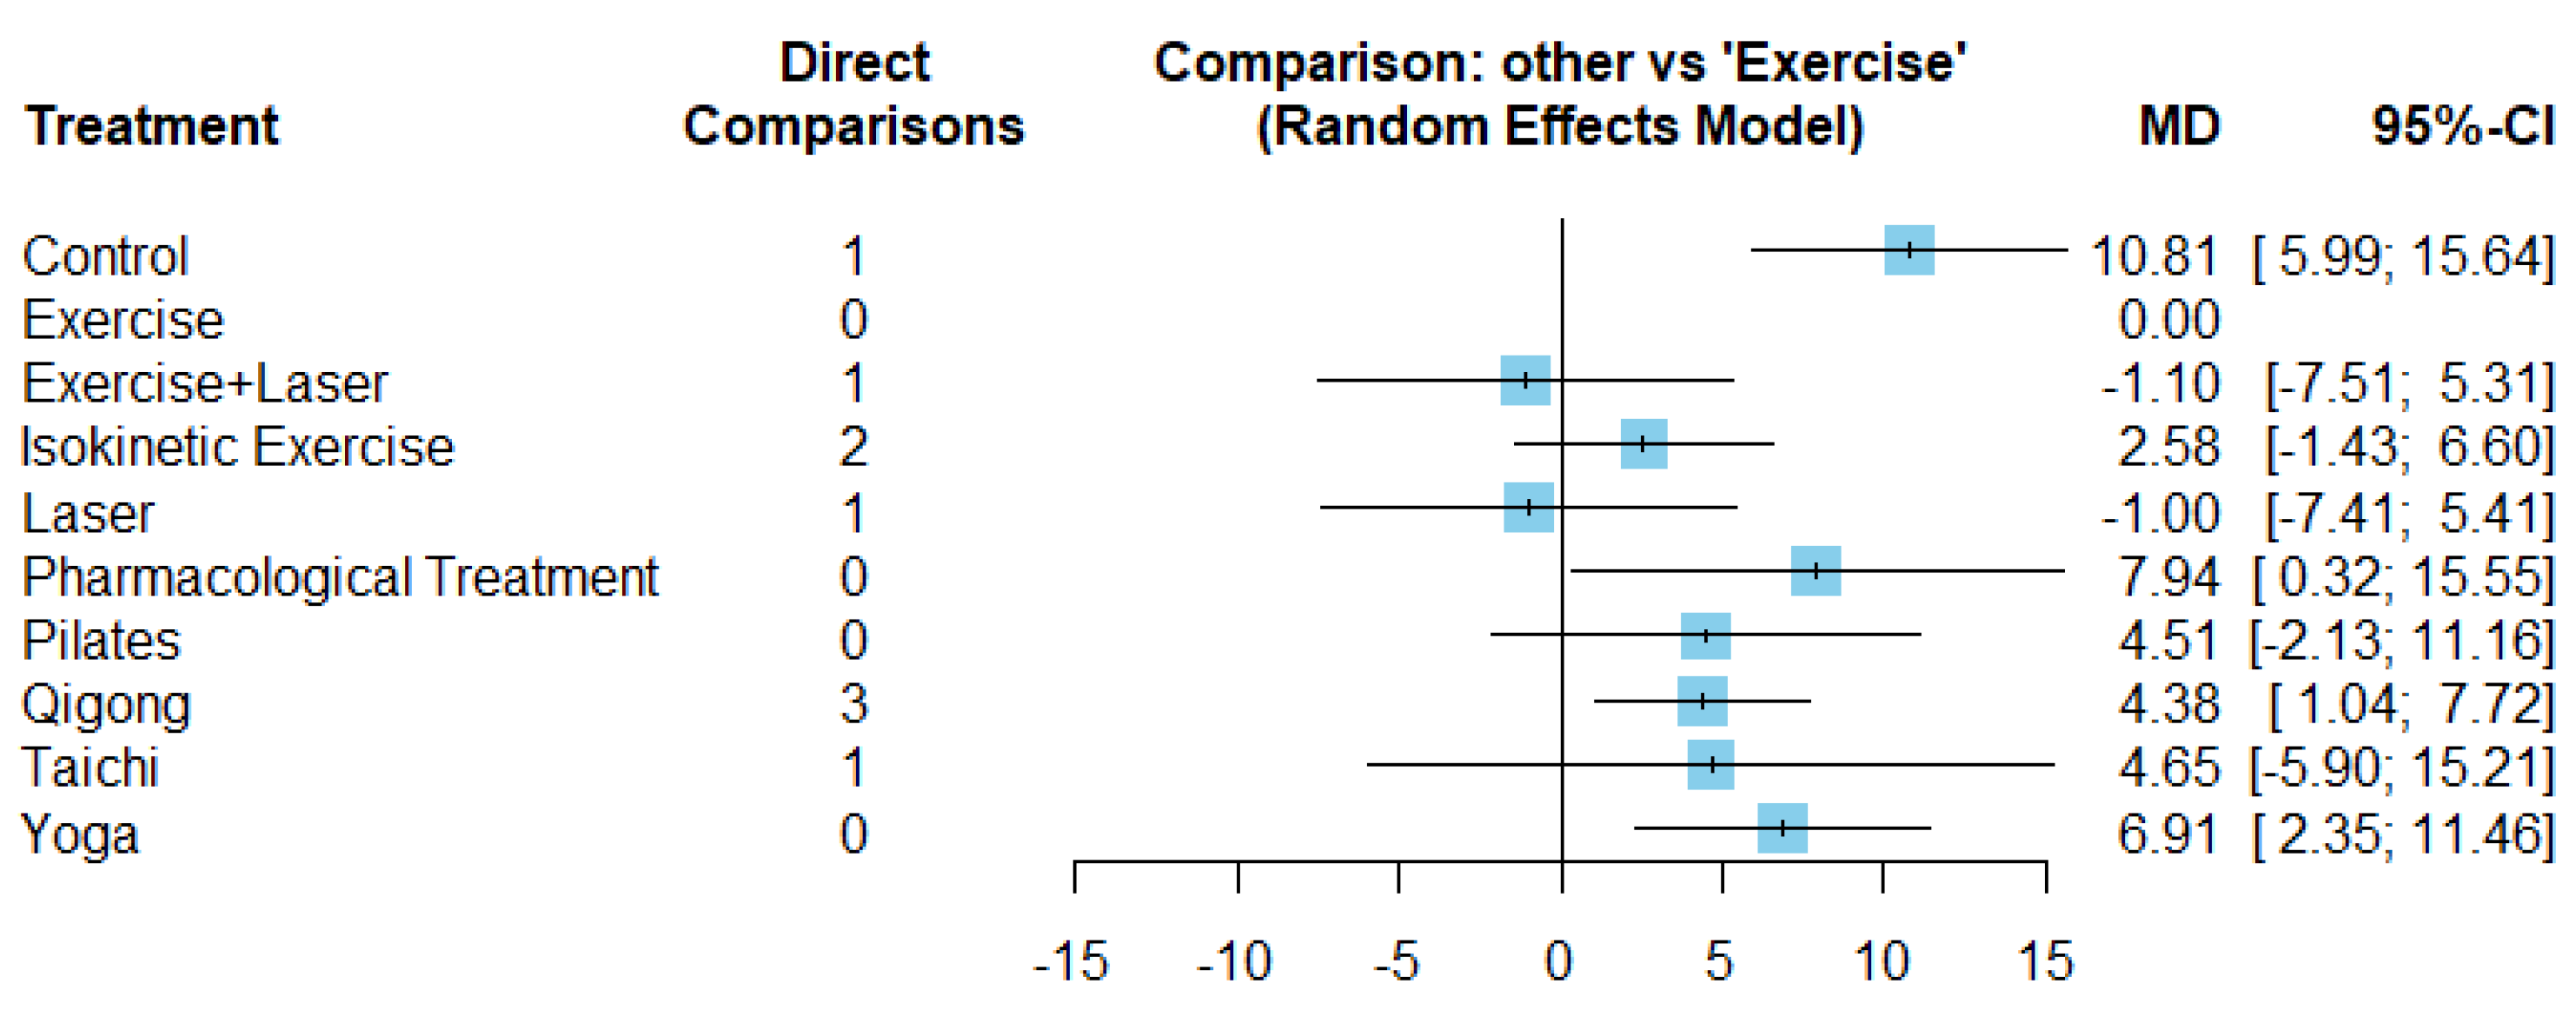
Figure 7.
Network plot pain disability under exercise-related treatments in the first subnet.
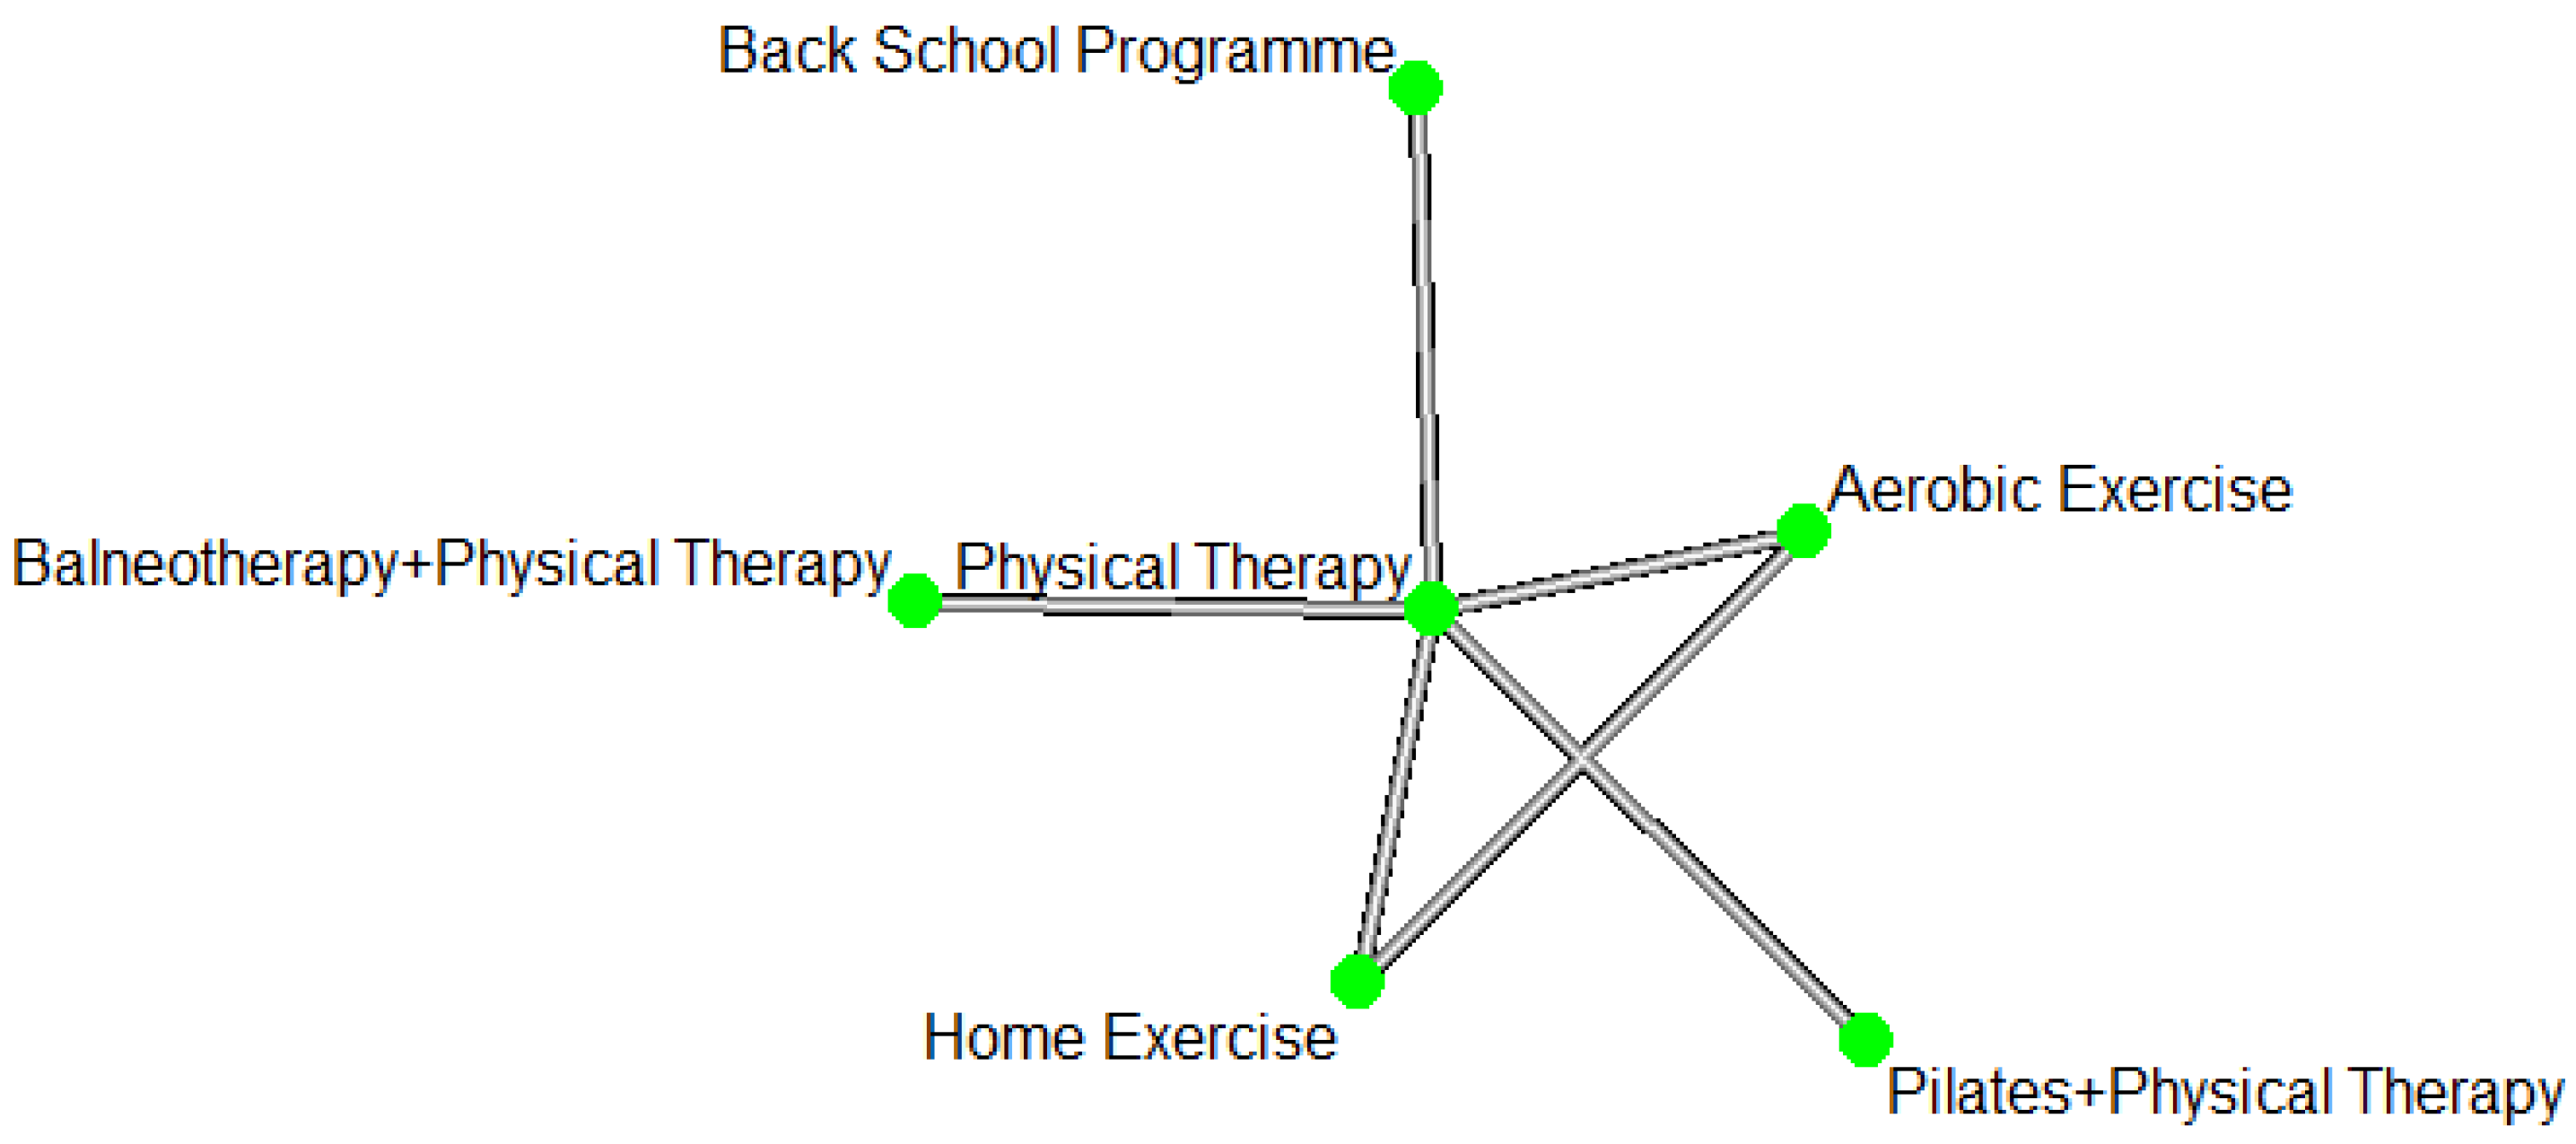
Figure 8.
Forest plot of pain disability in the studies of exercise-related treatments in the first subnet.
Figure 8.
Forest plot of pain disability in the studies of exercise-related treatments in the first subnet.
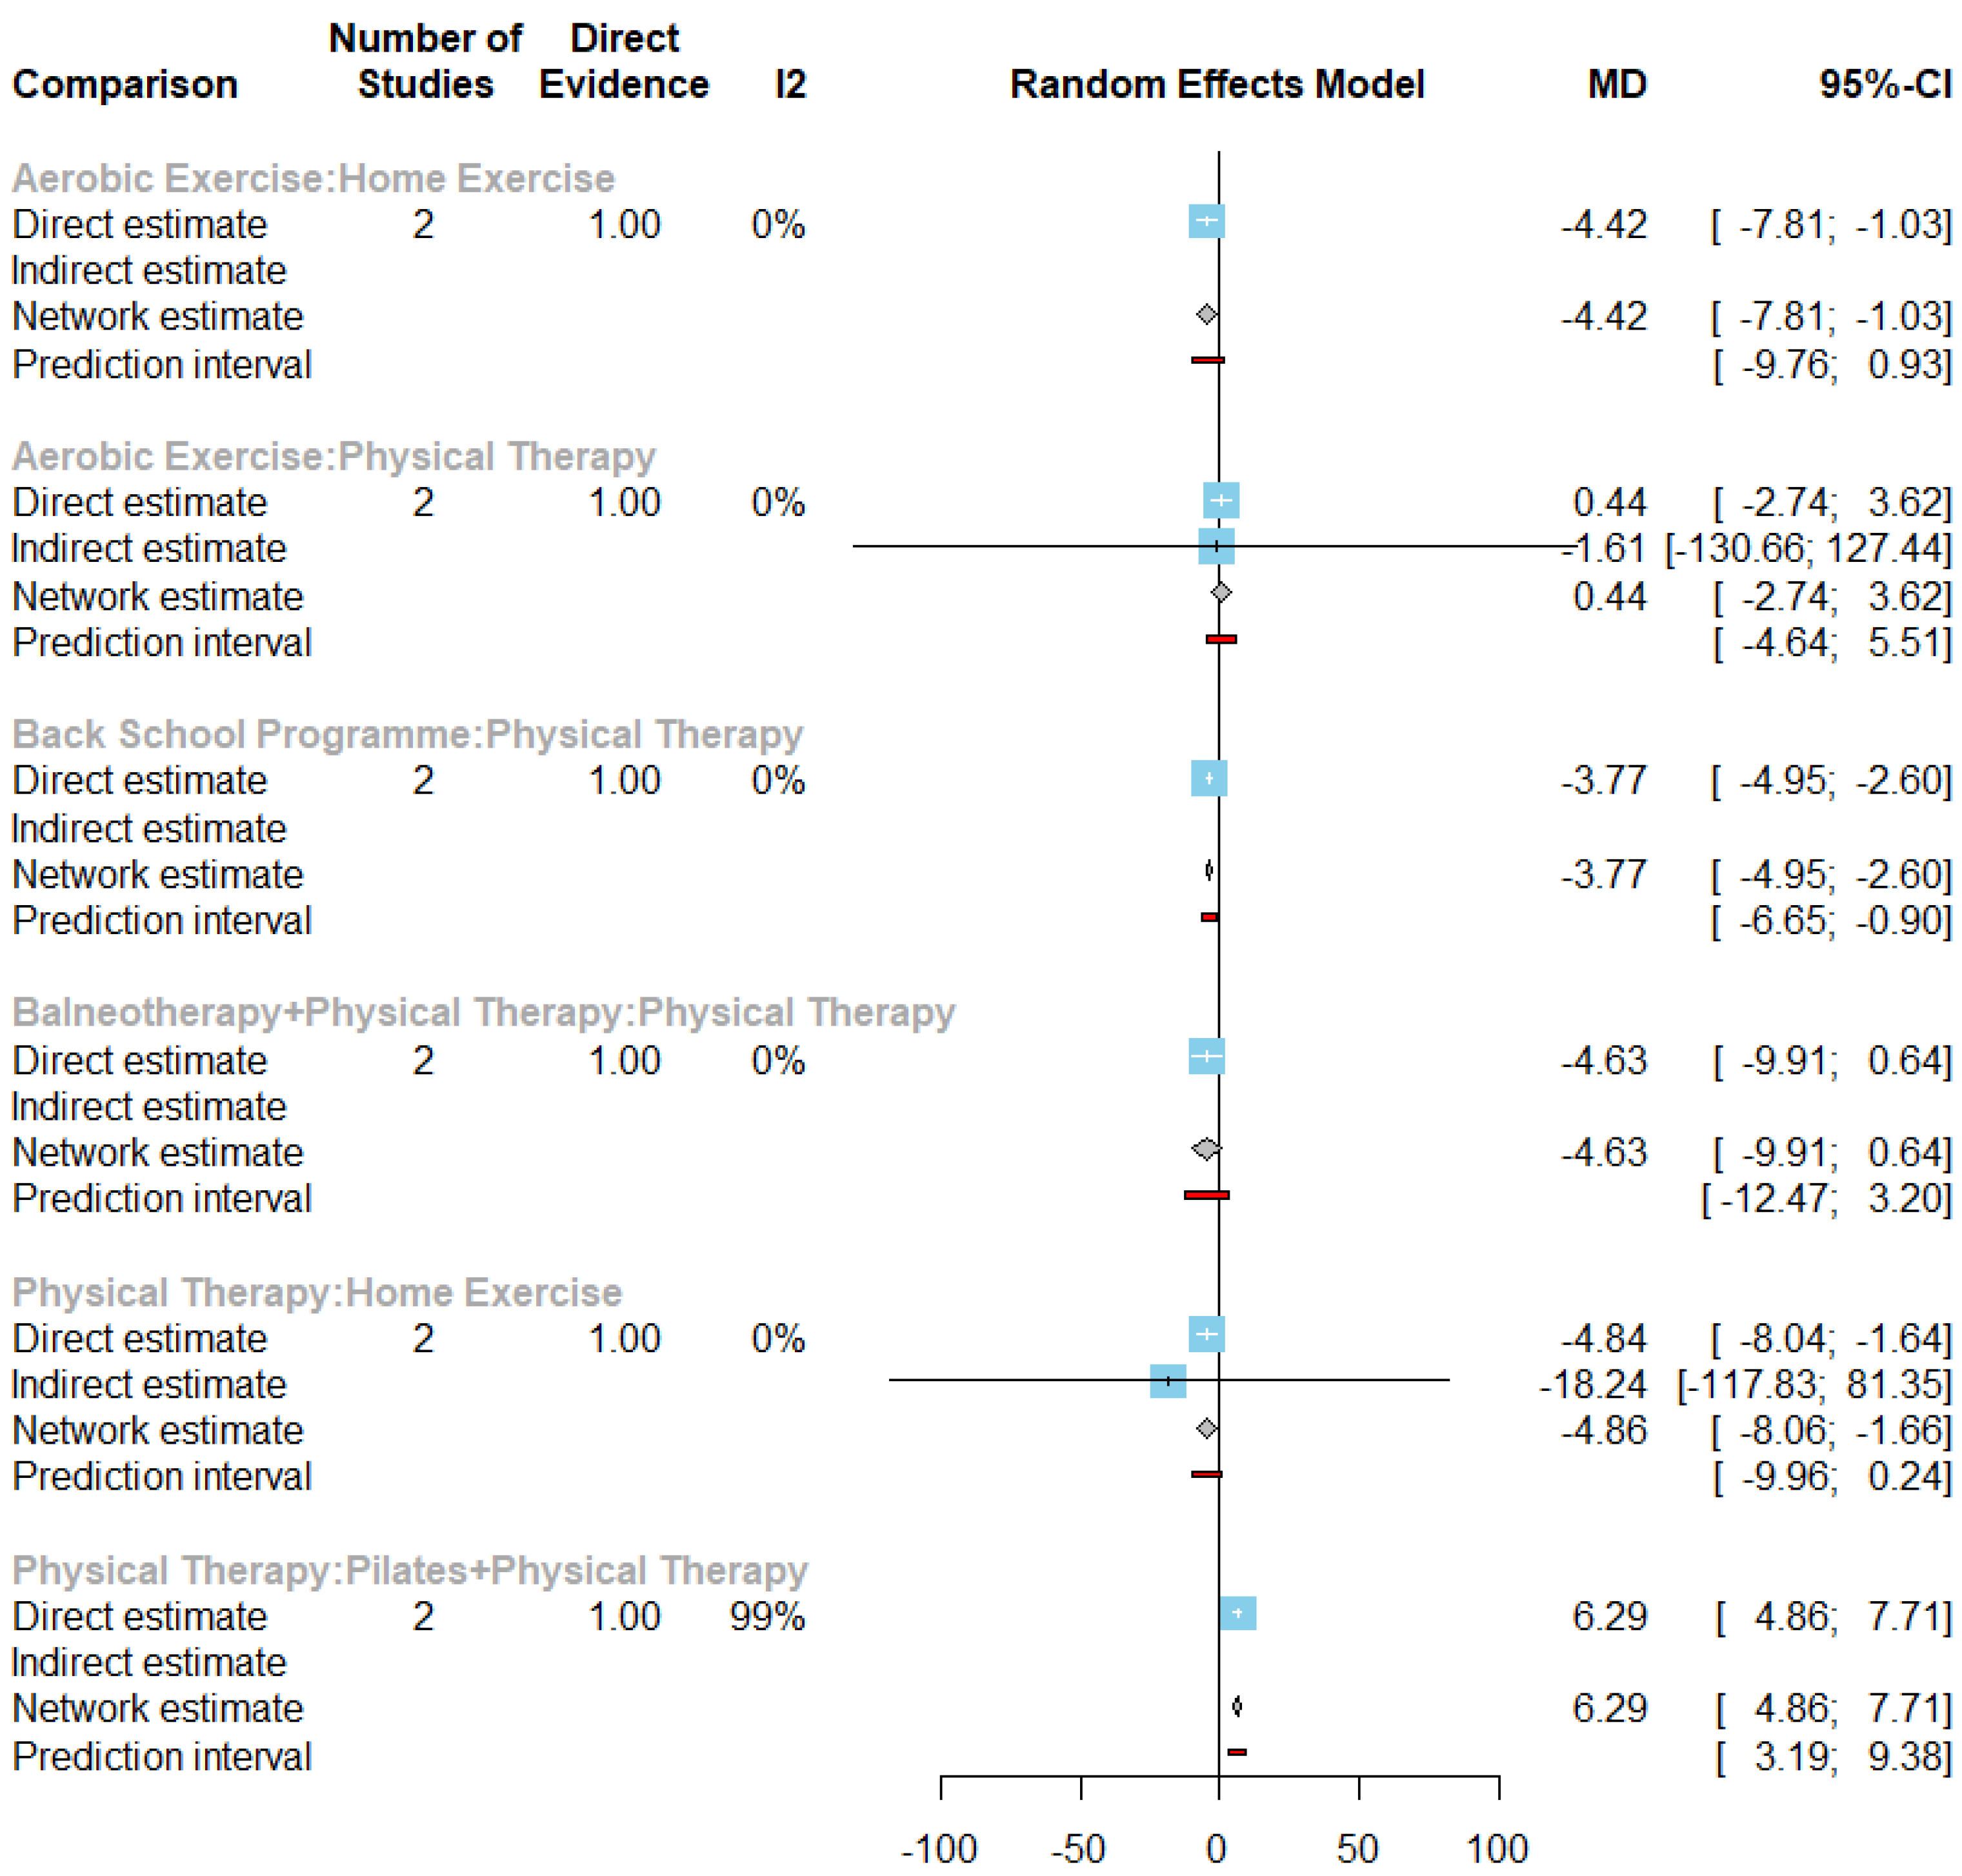
Figure 10.
Network plot of pain disability under exercise-related treatments in the second subnet.
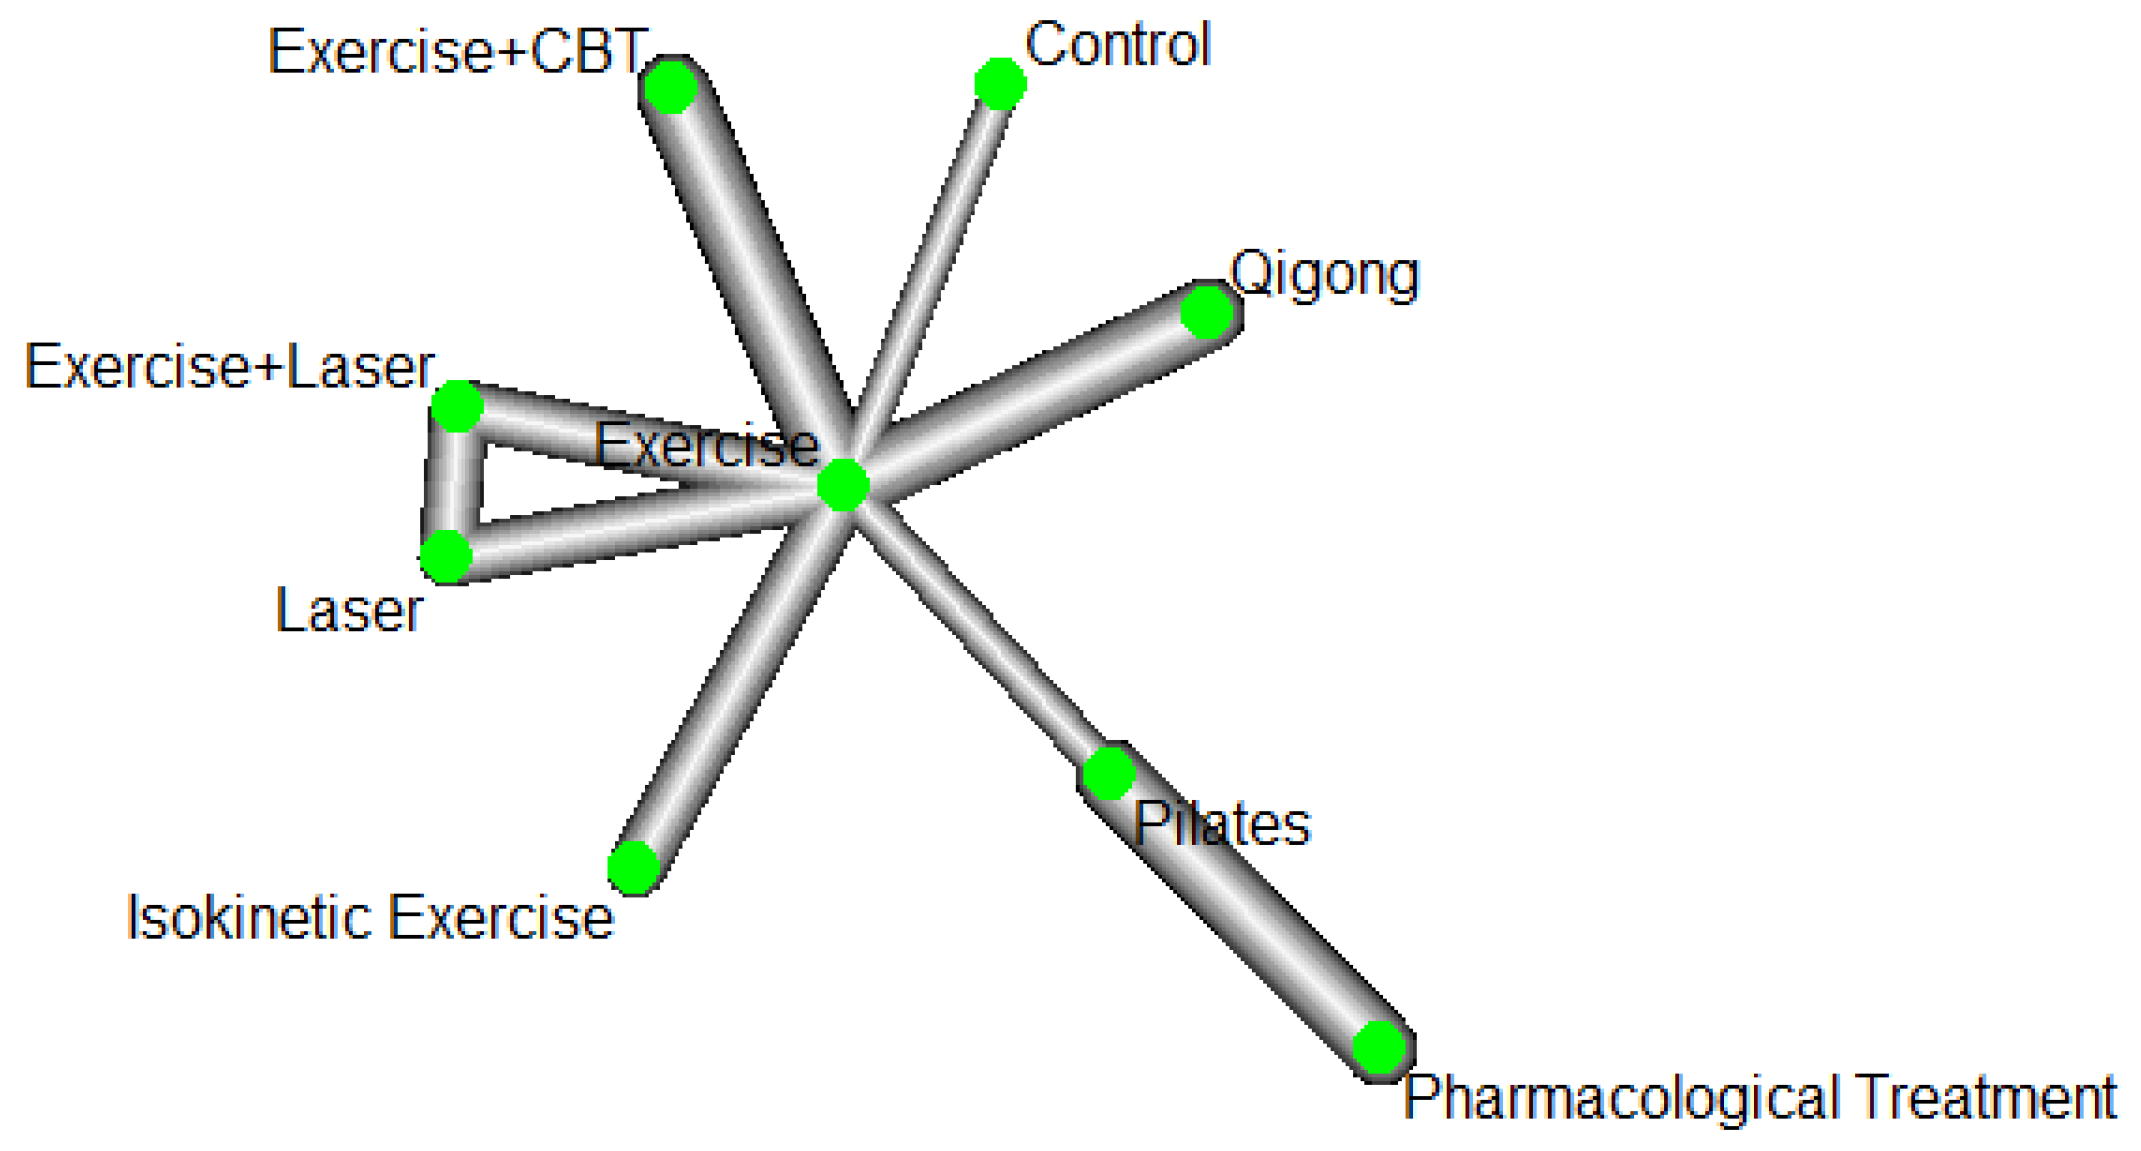
Figure 11.
Forest plot of direct comparisons of pain disability under exercise-related treatments in the second subnet.
Figure 11.
Forest plot of direct comparisons of pain disability under exercise-related treatments in the second subnet.
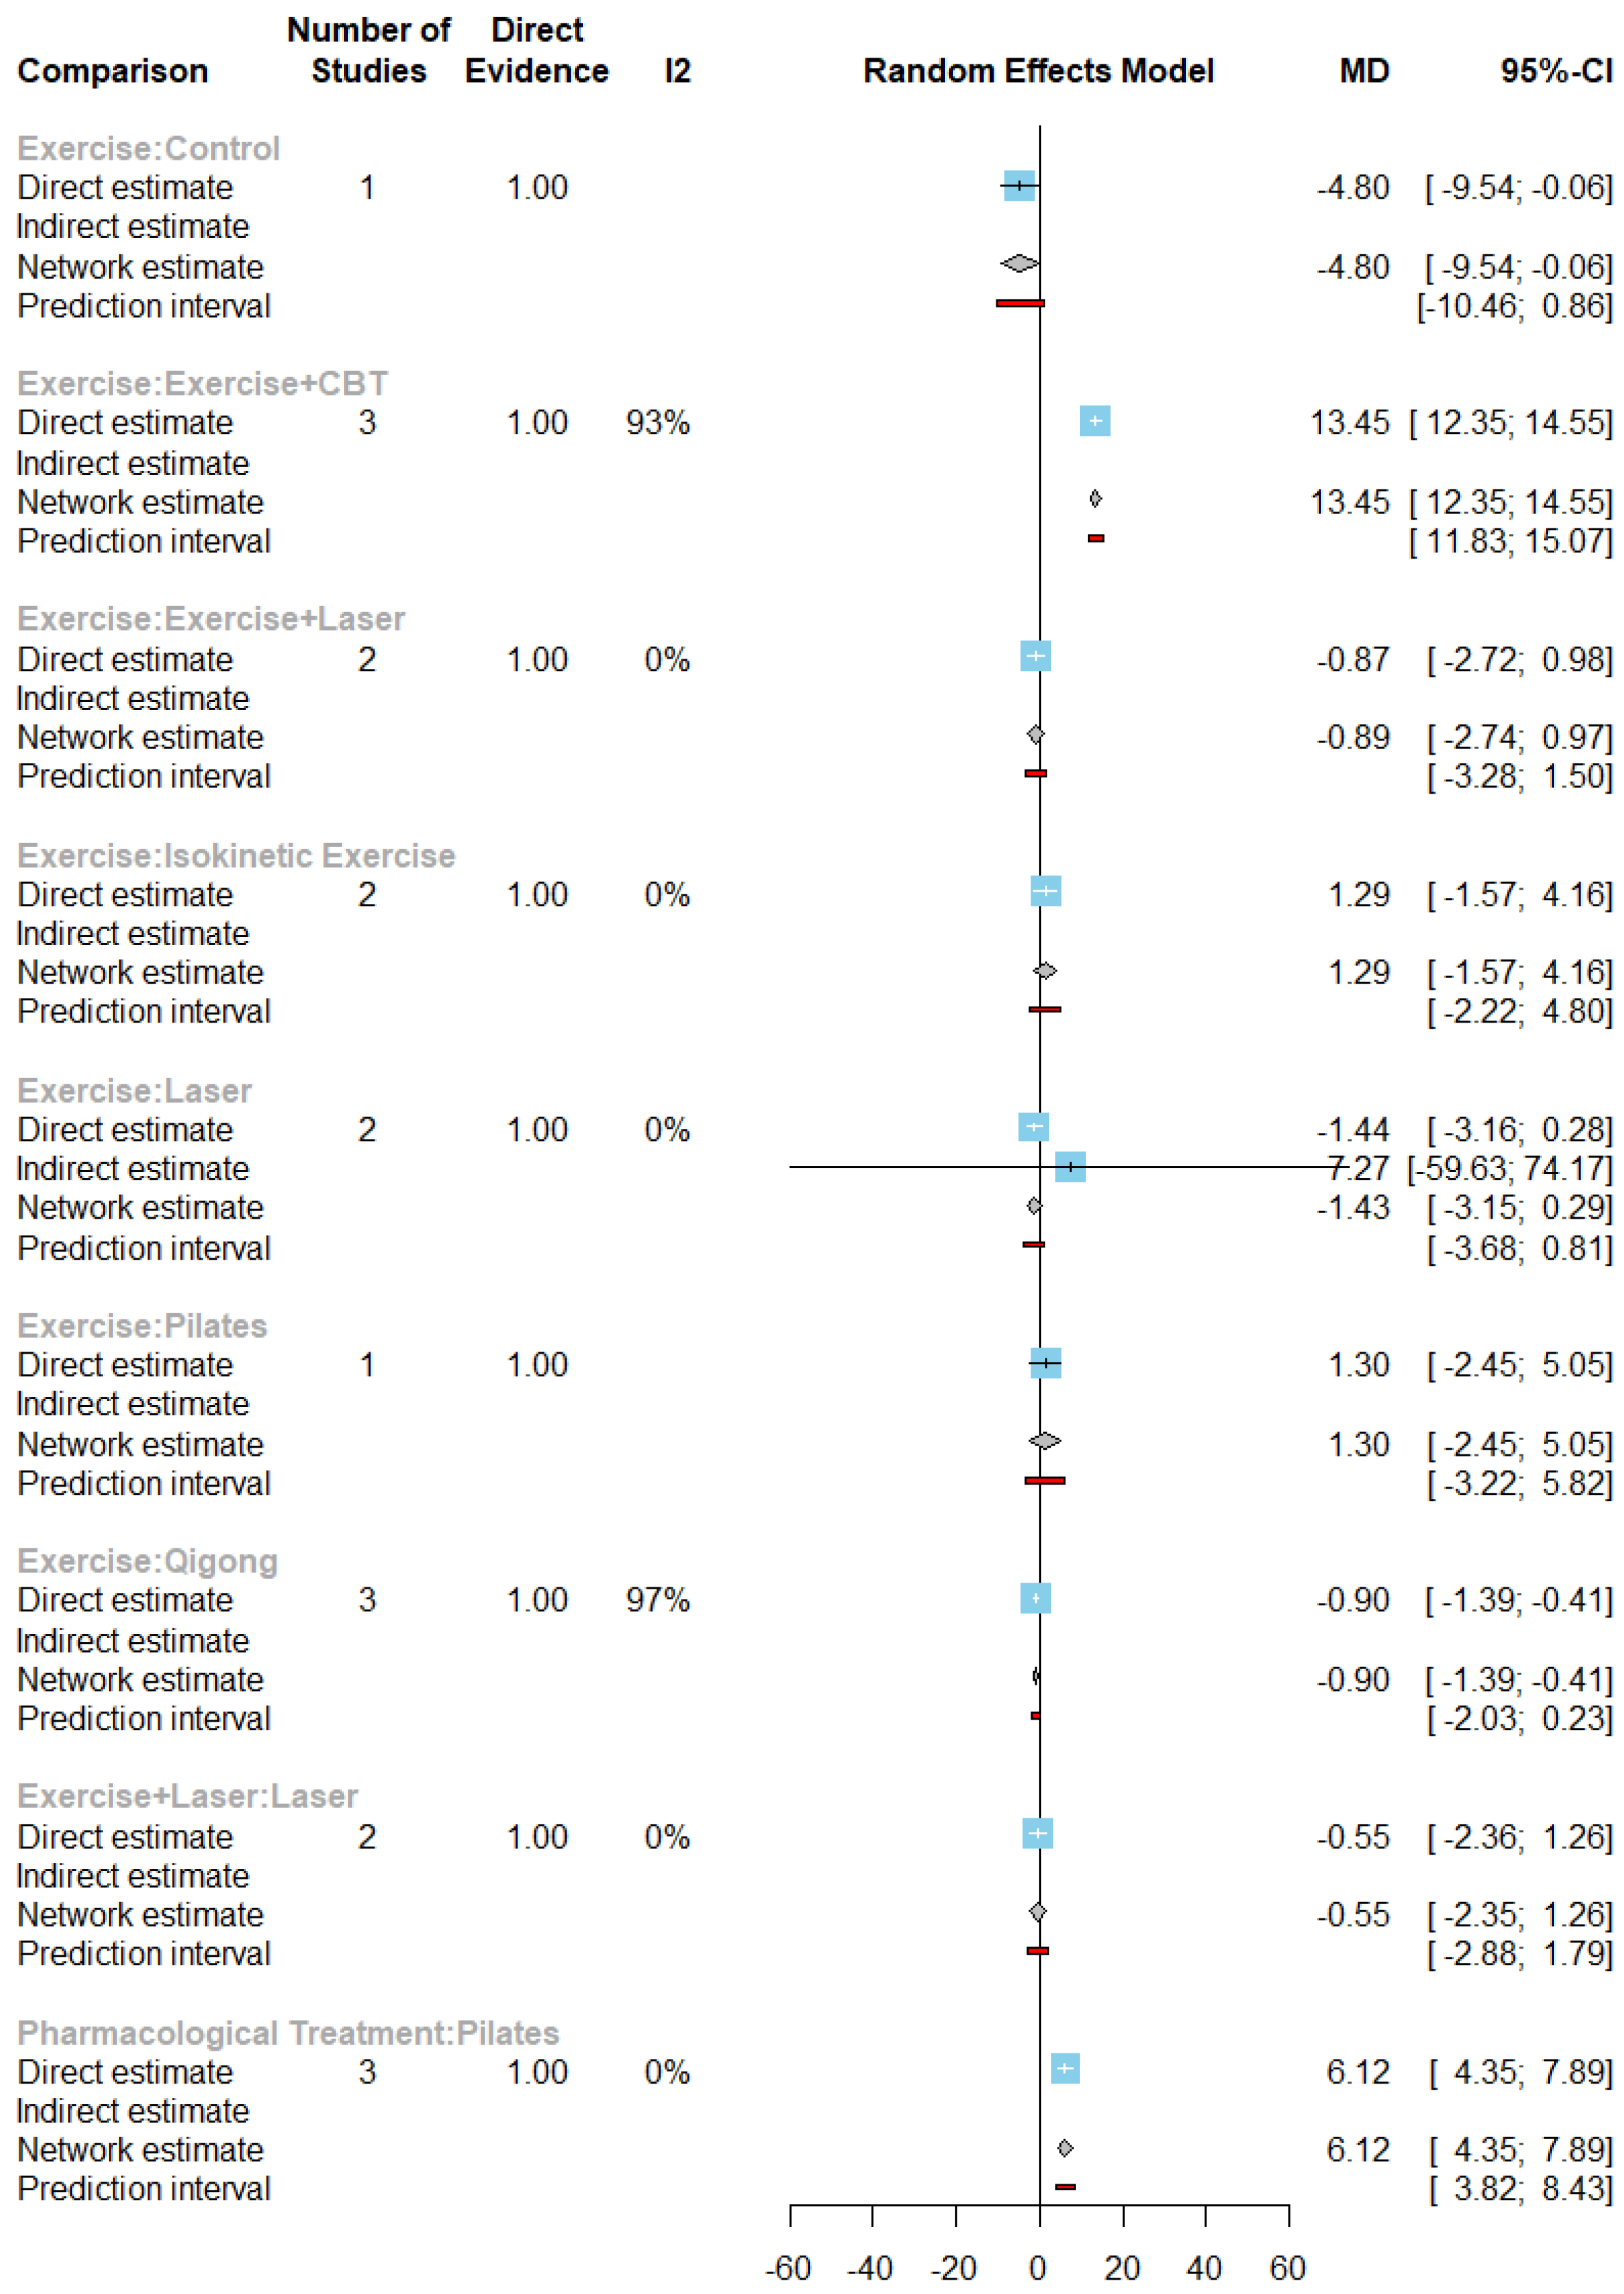
Figure 13.
Network plot of acupuncture-related treatments.
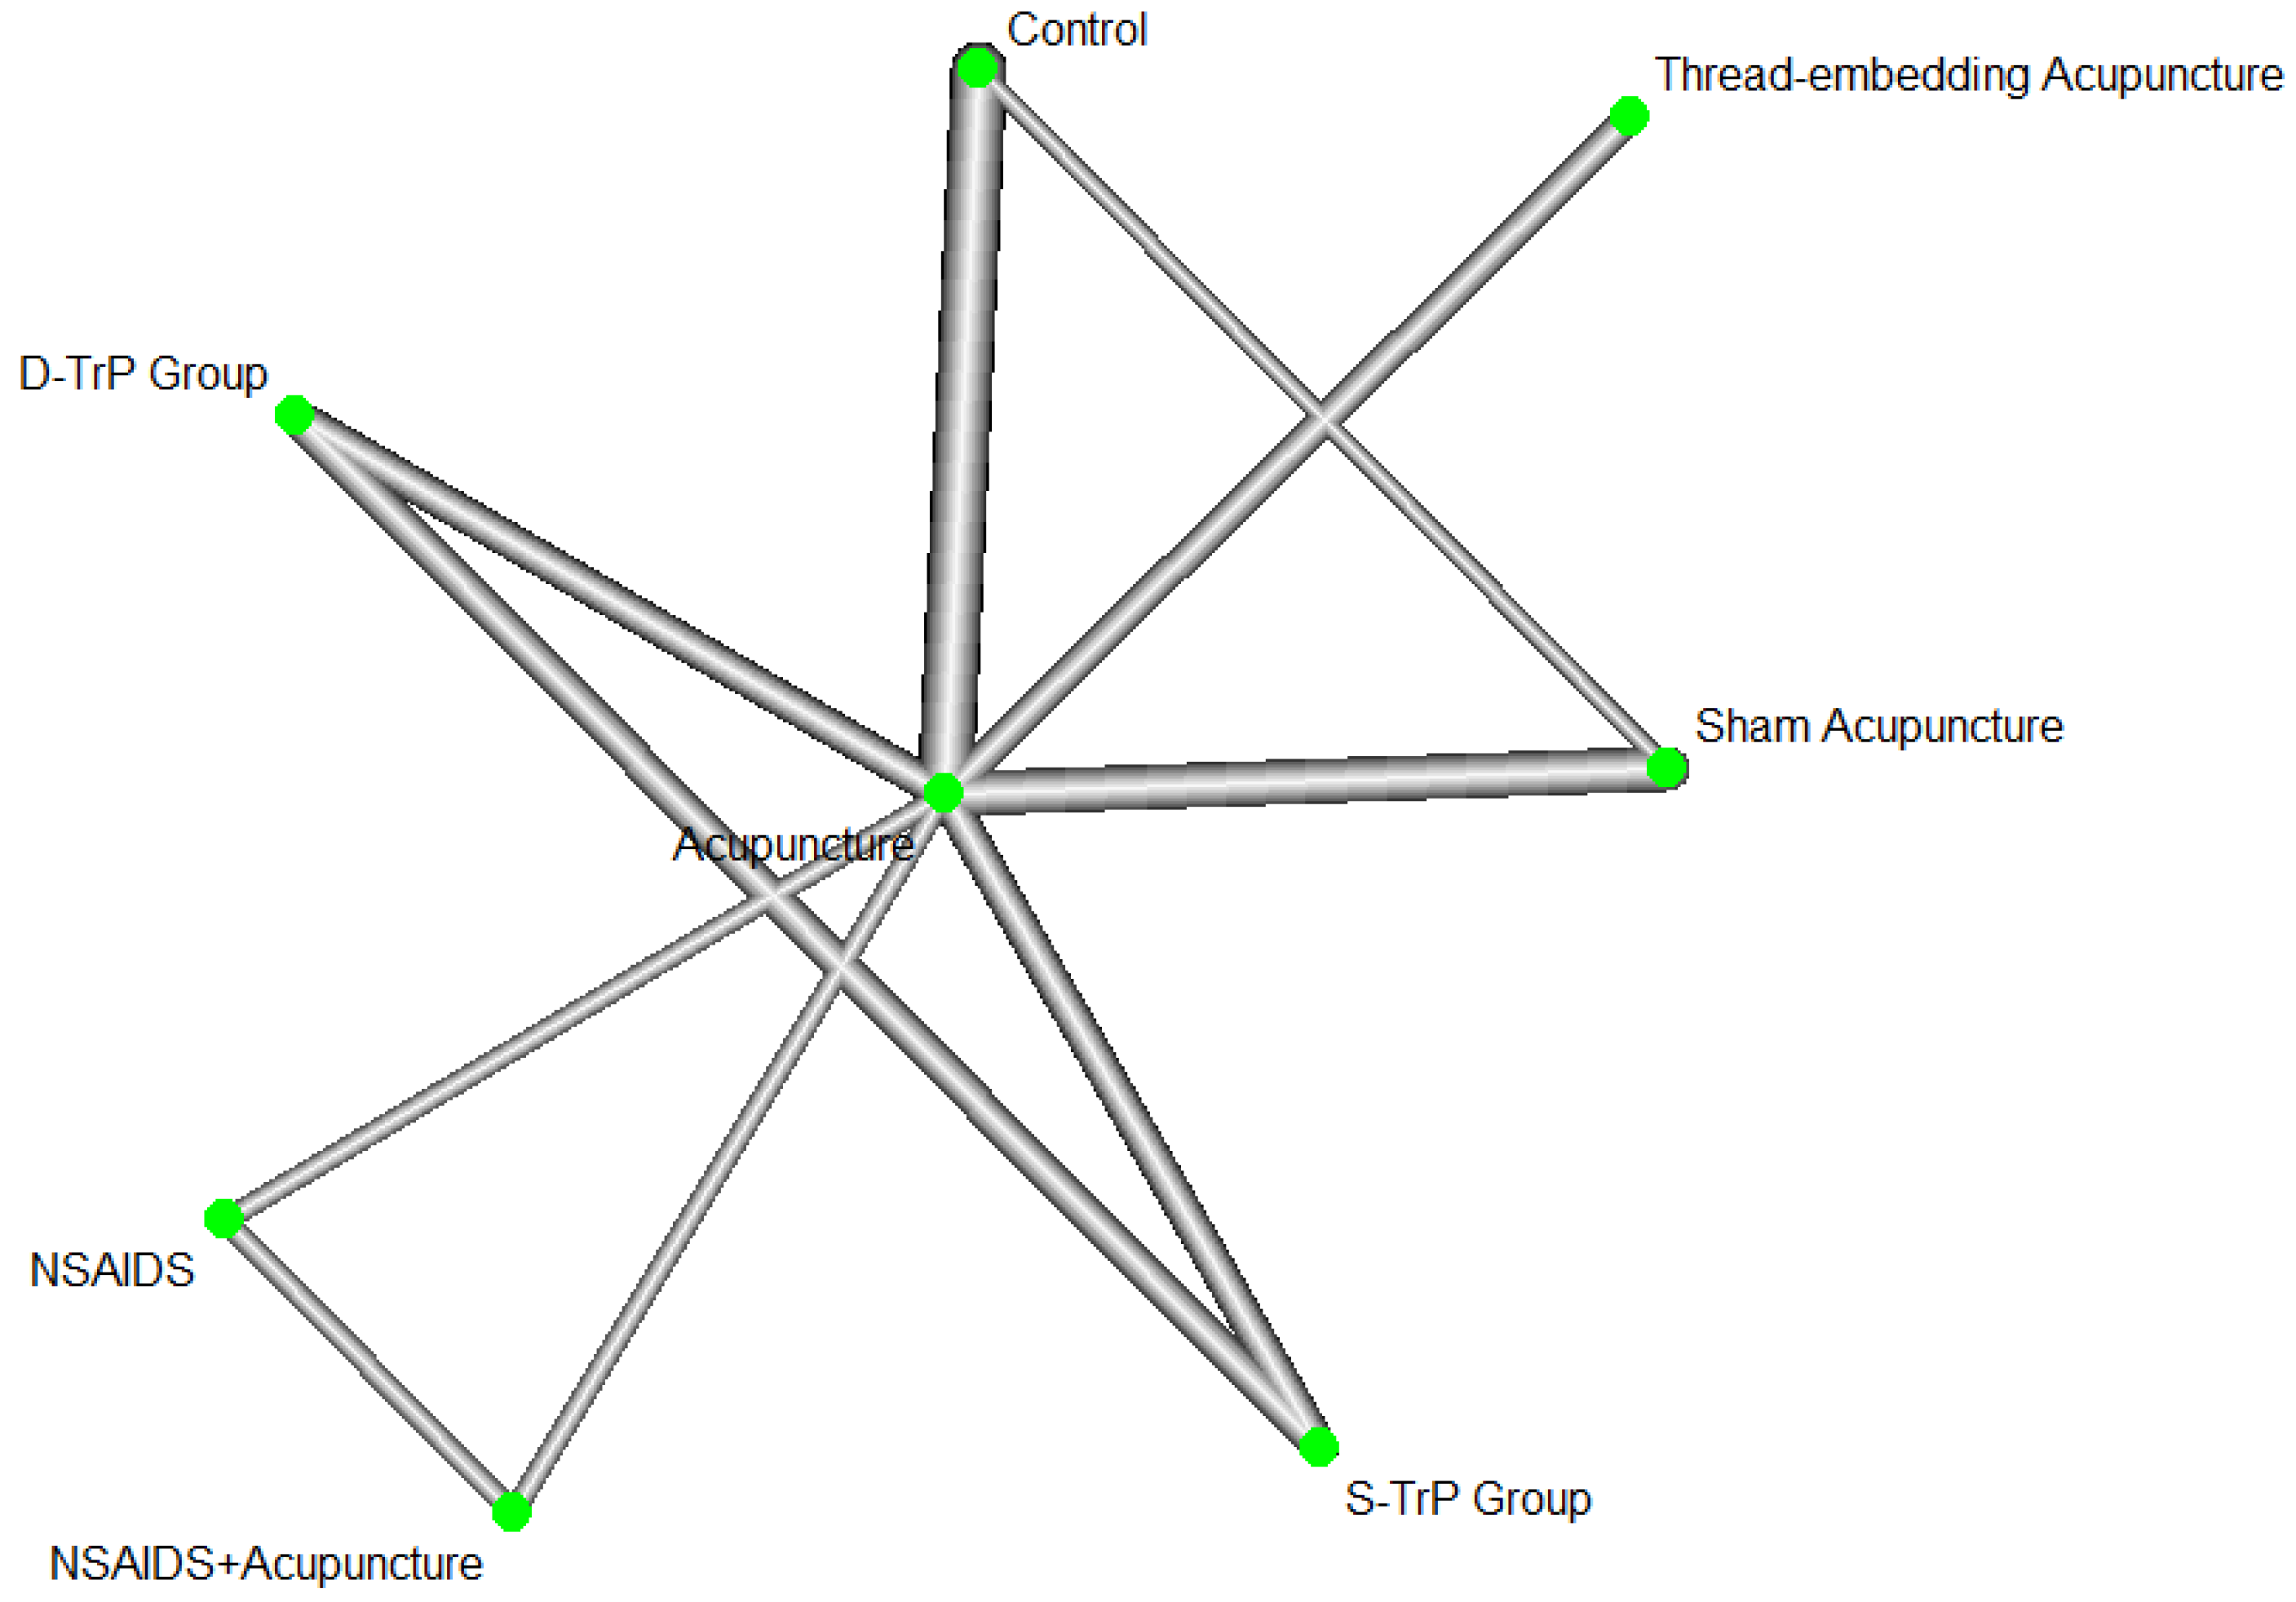
Figure 14.
Forest plot of direct comparisons in the studies of acupuncture-related treatments.
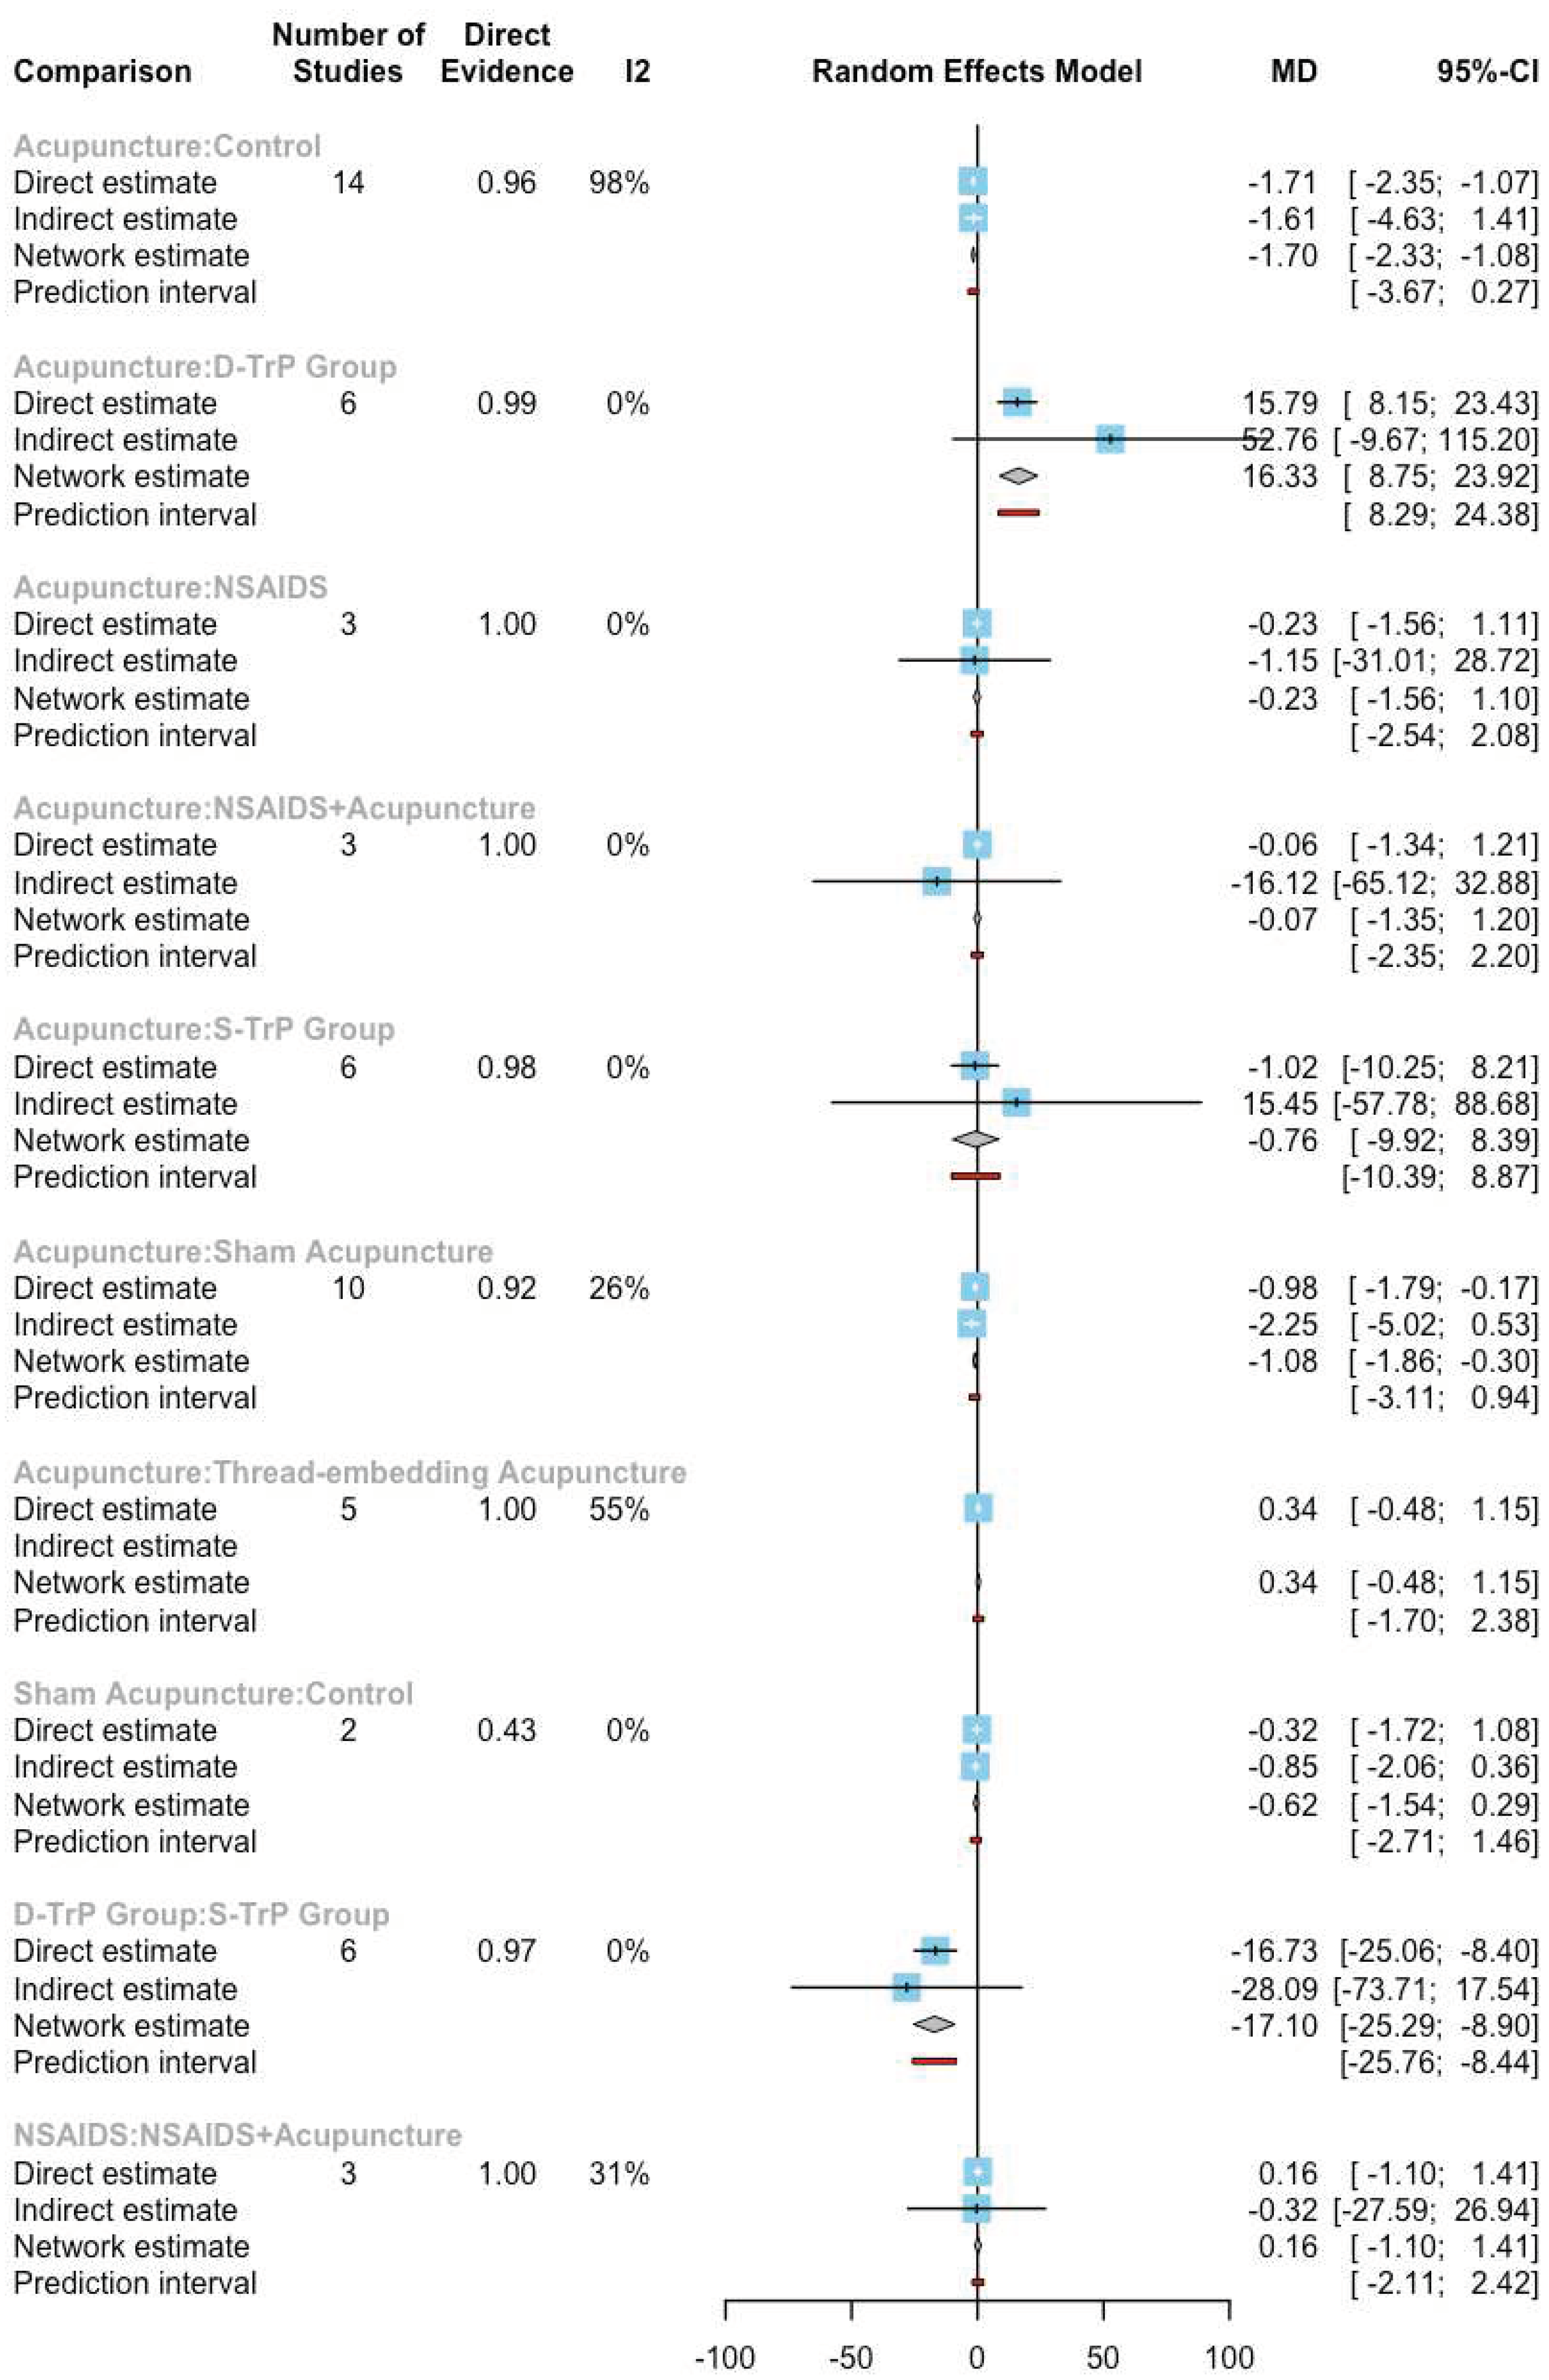
Figure 16.
Network plot of pain intensity under CBT-related treatments.
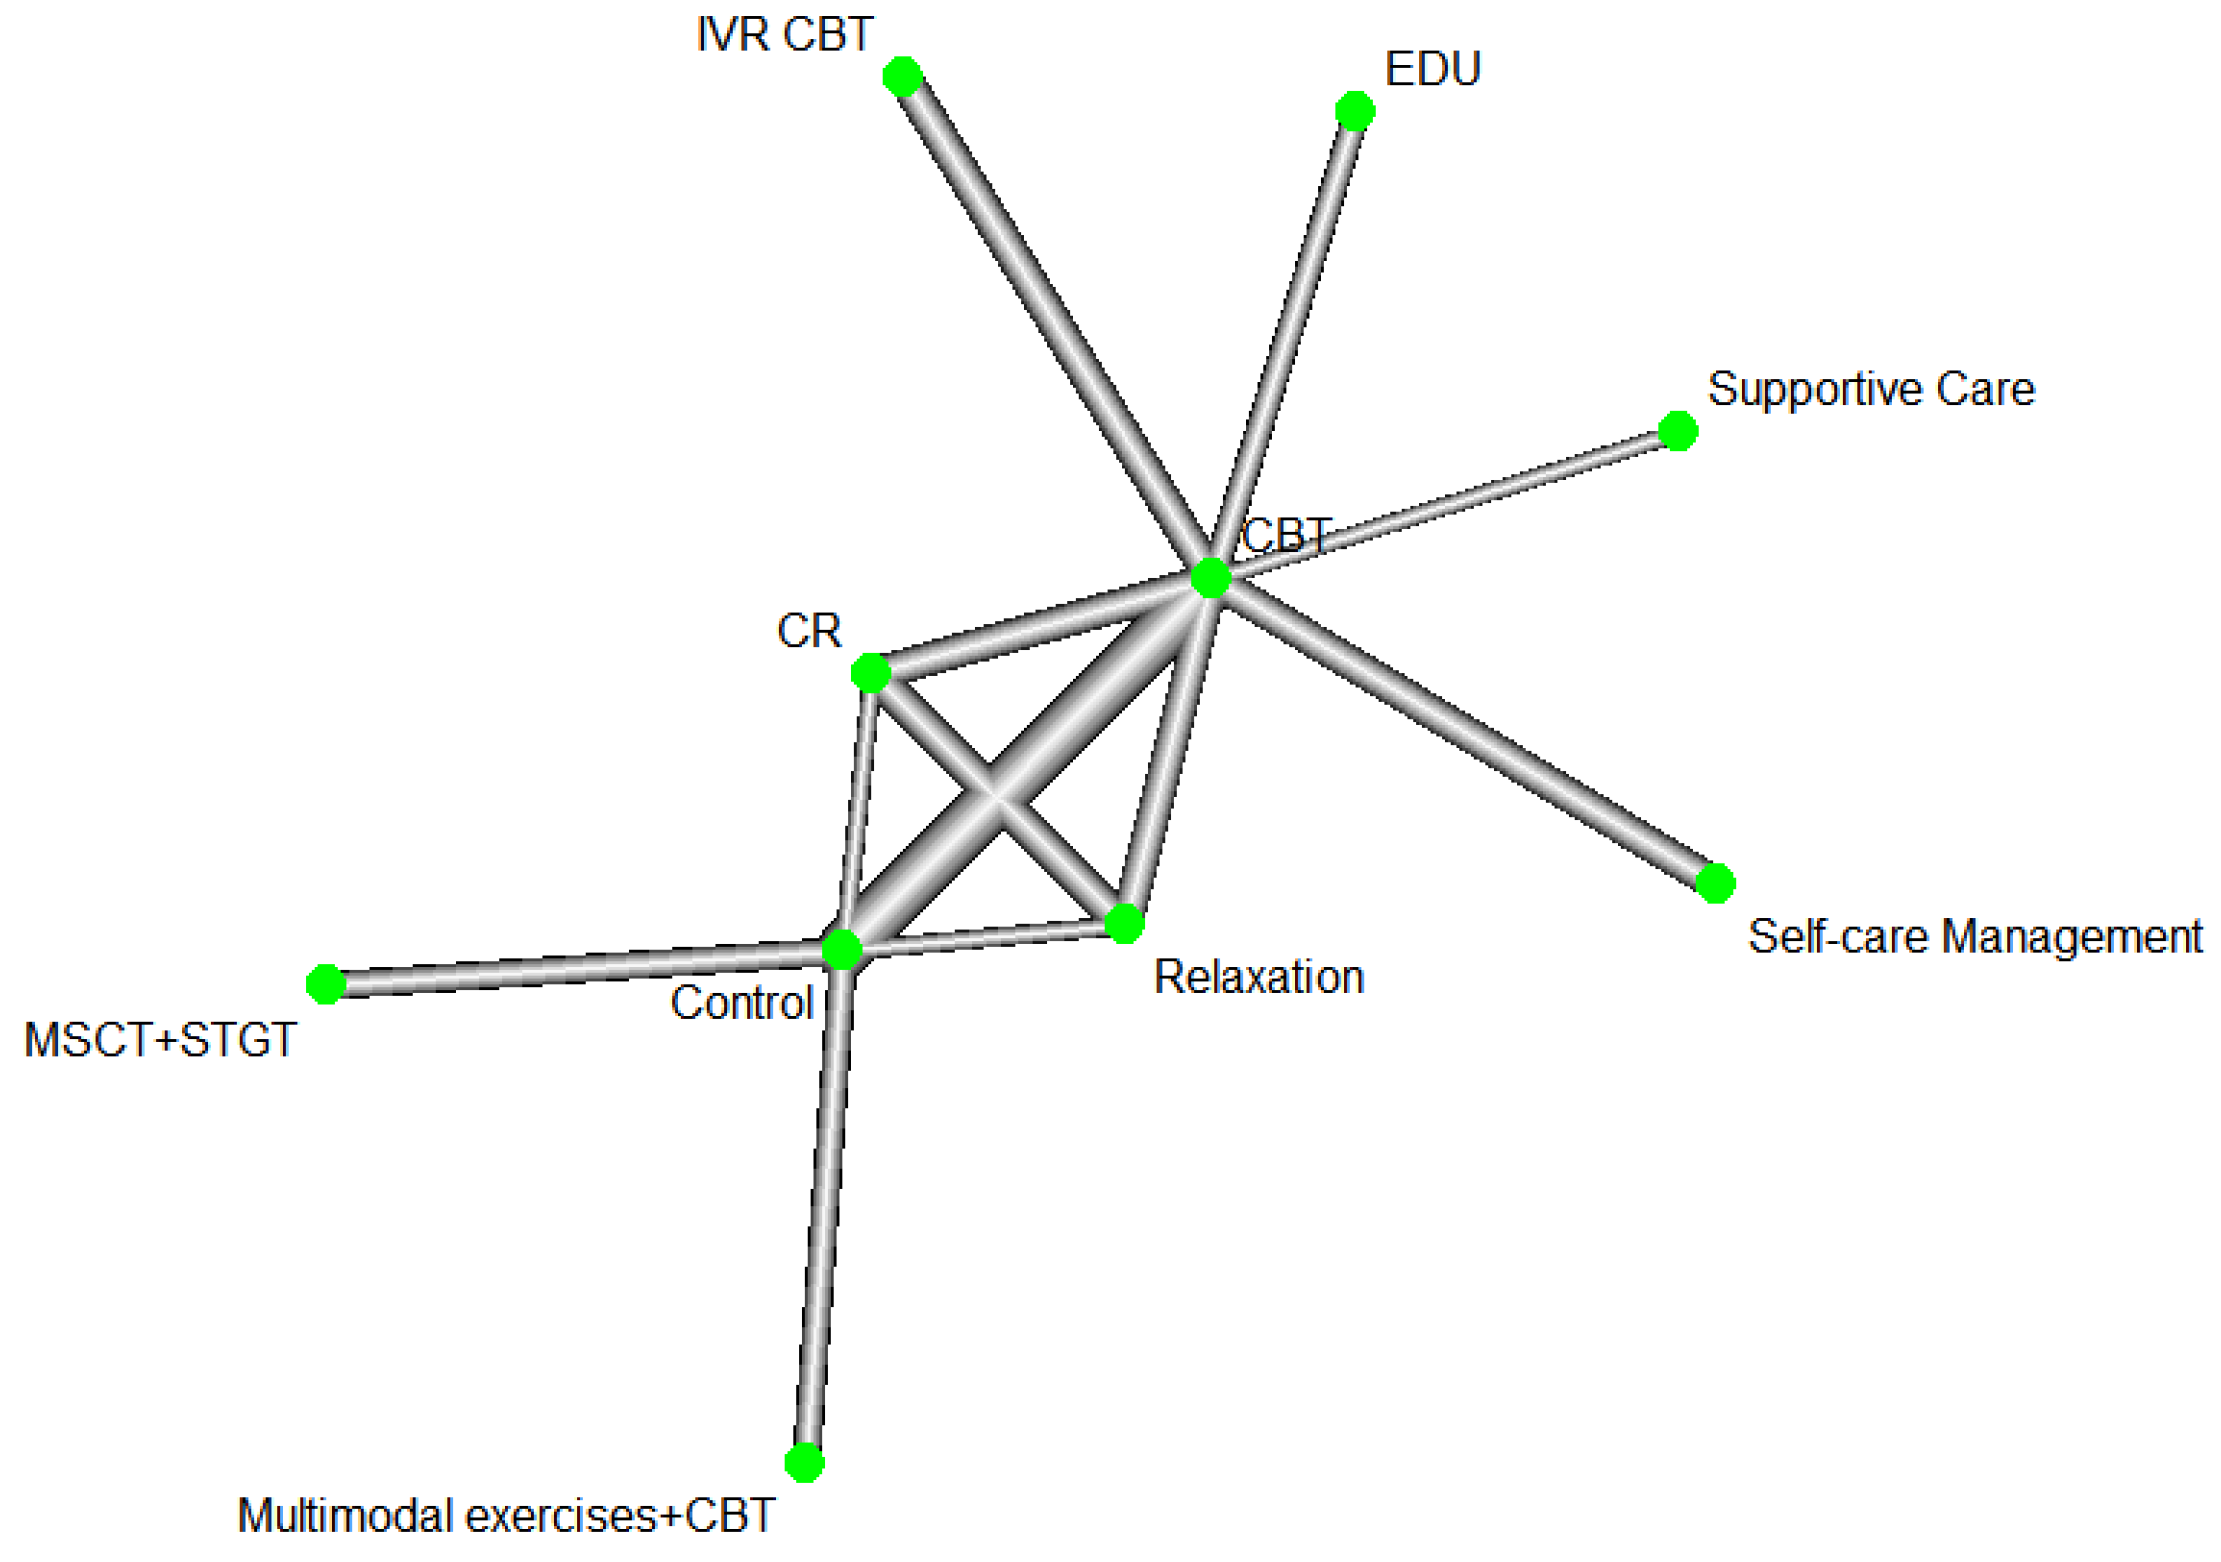
Figure 17.
Forest plot of pain intensity under direct comparisons in the studies of CBT-related treatments.
Figure 17.
Forest plot of pain intensity under direct comparisons in the studies of CBT-related treatments.
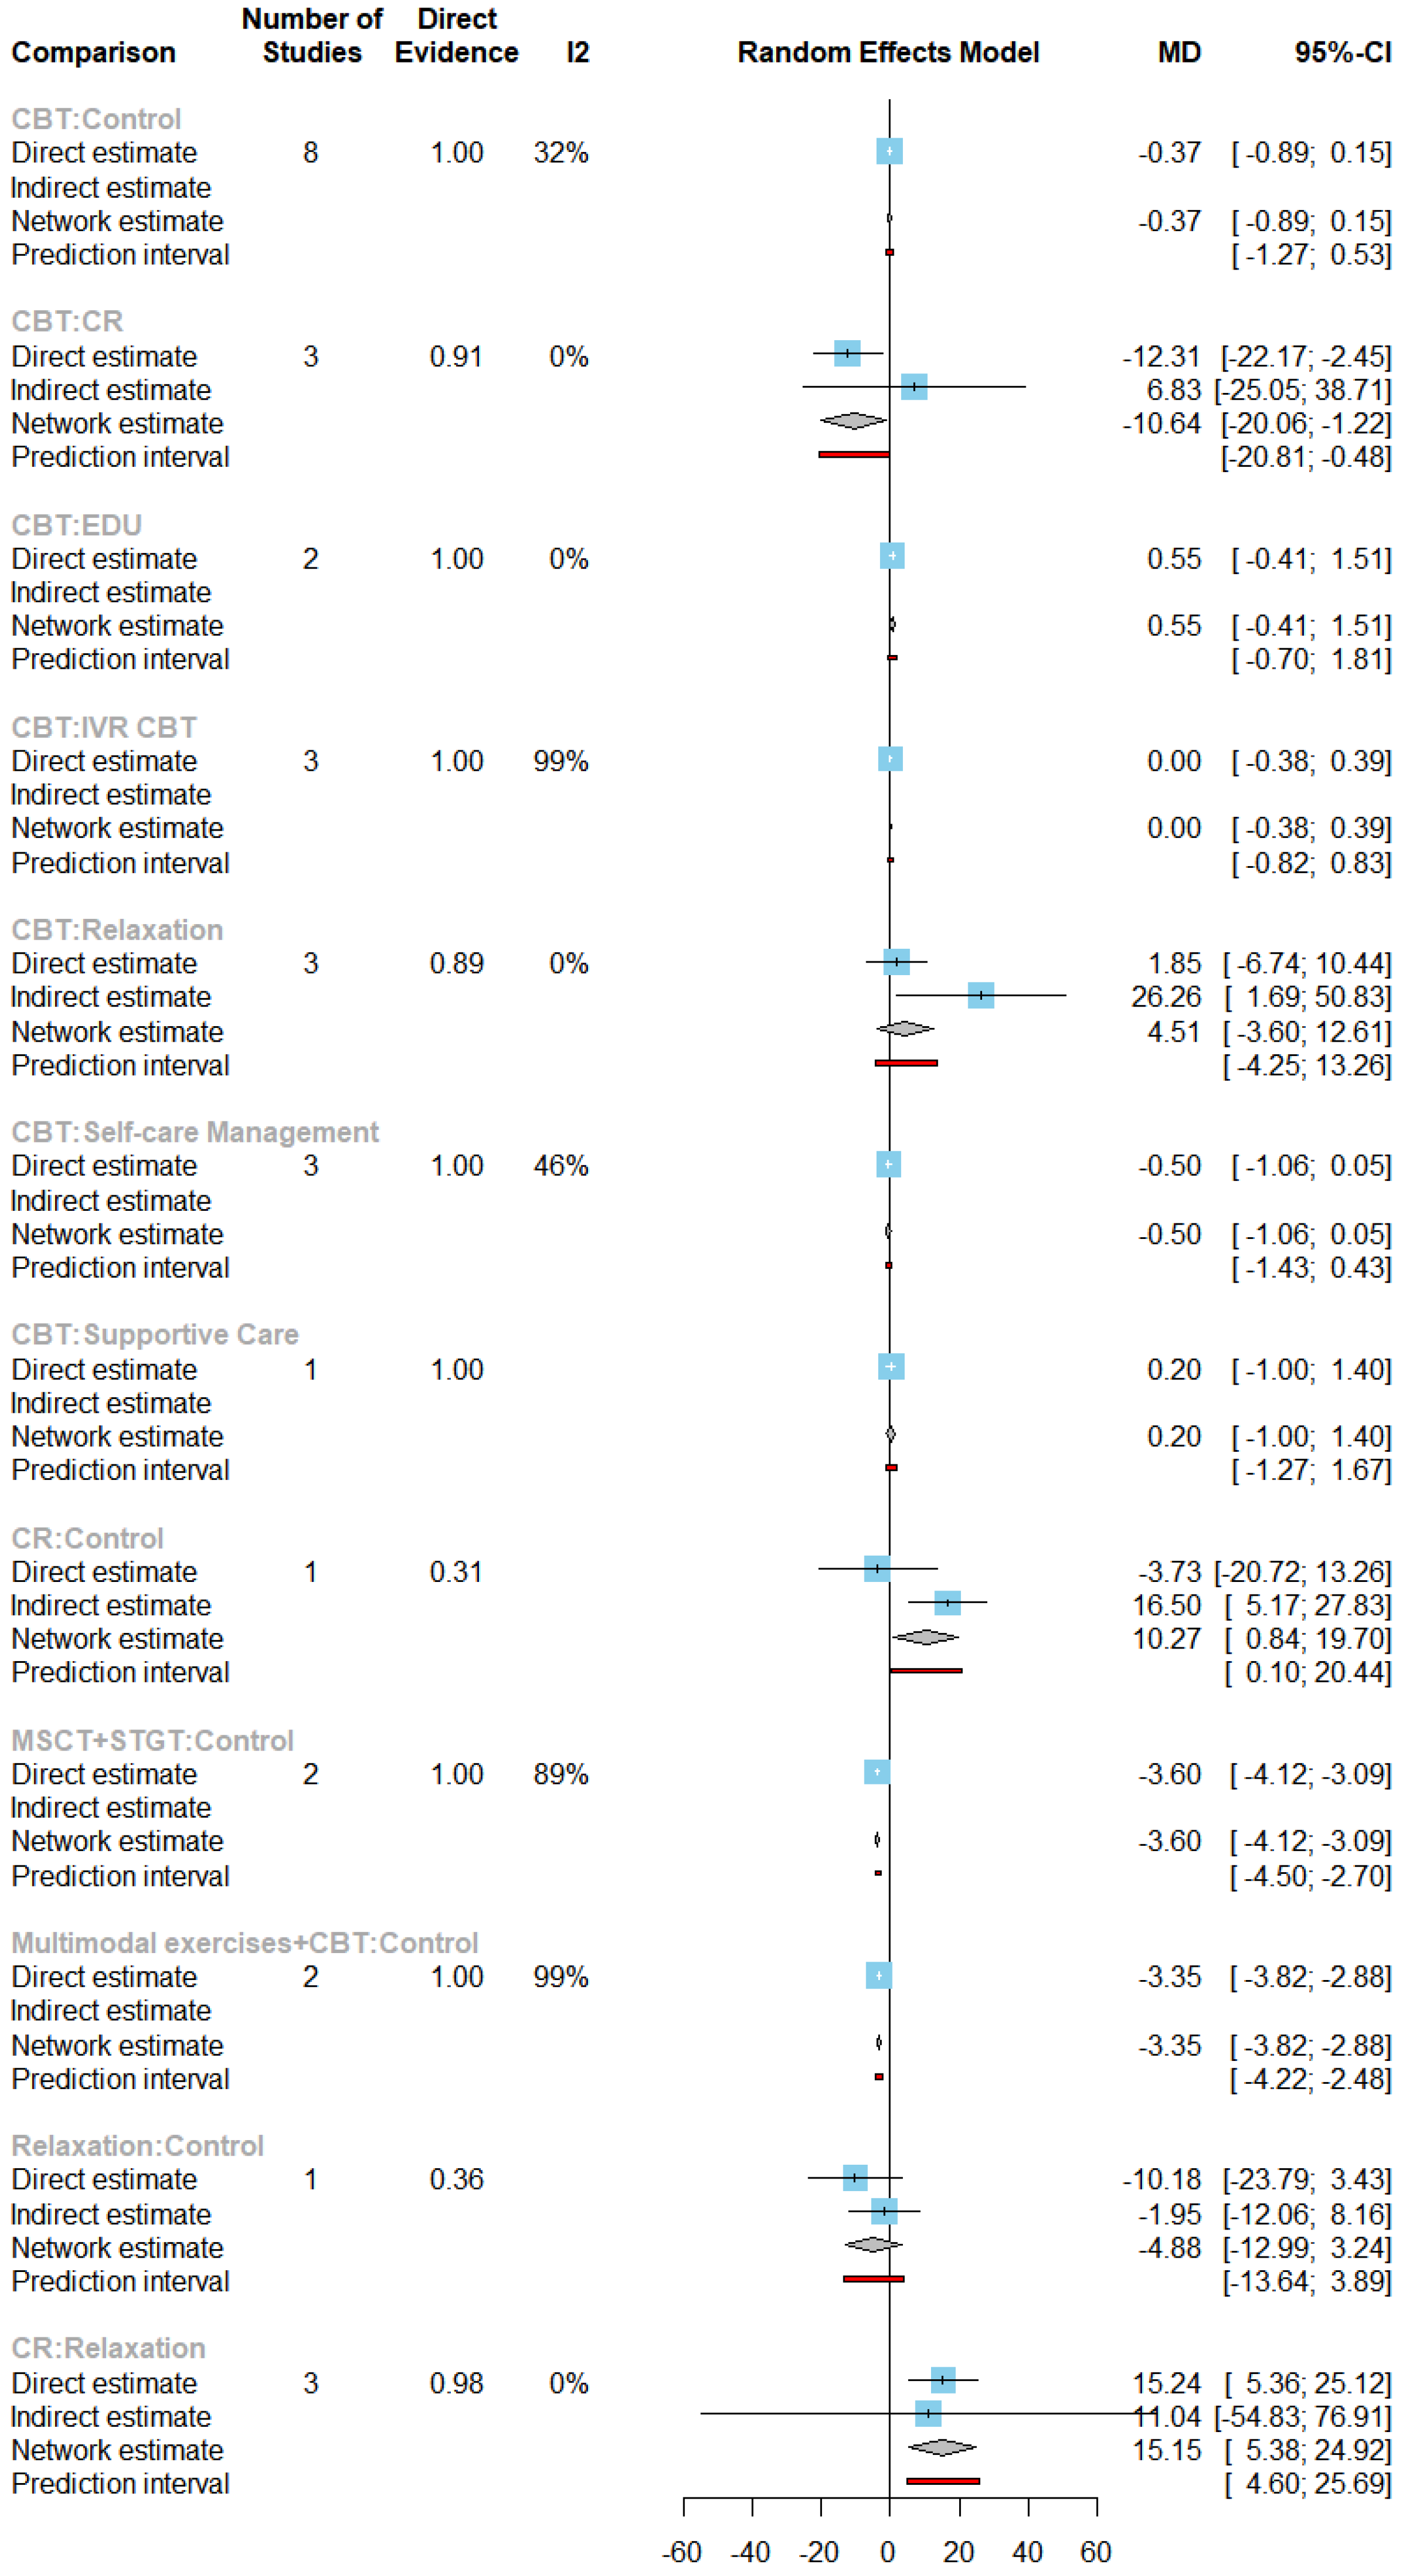
Figure 19.
Network plot of depression under CBT-related treatments.
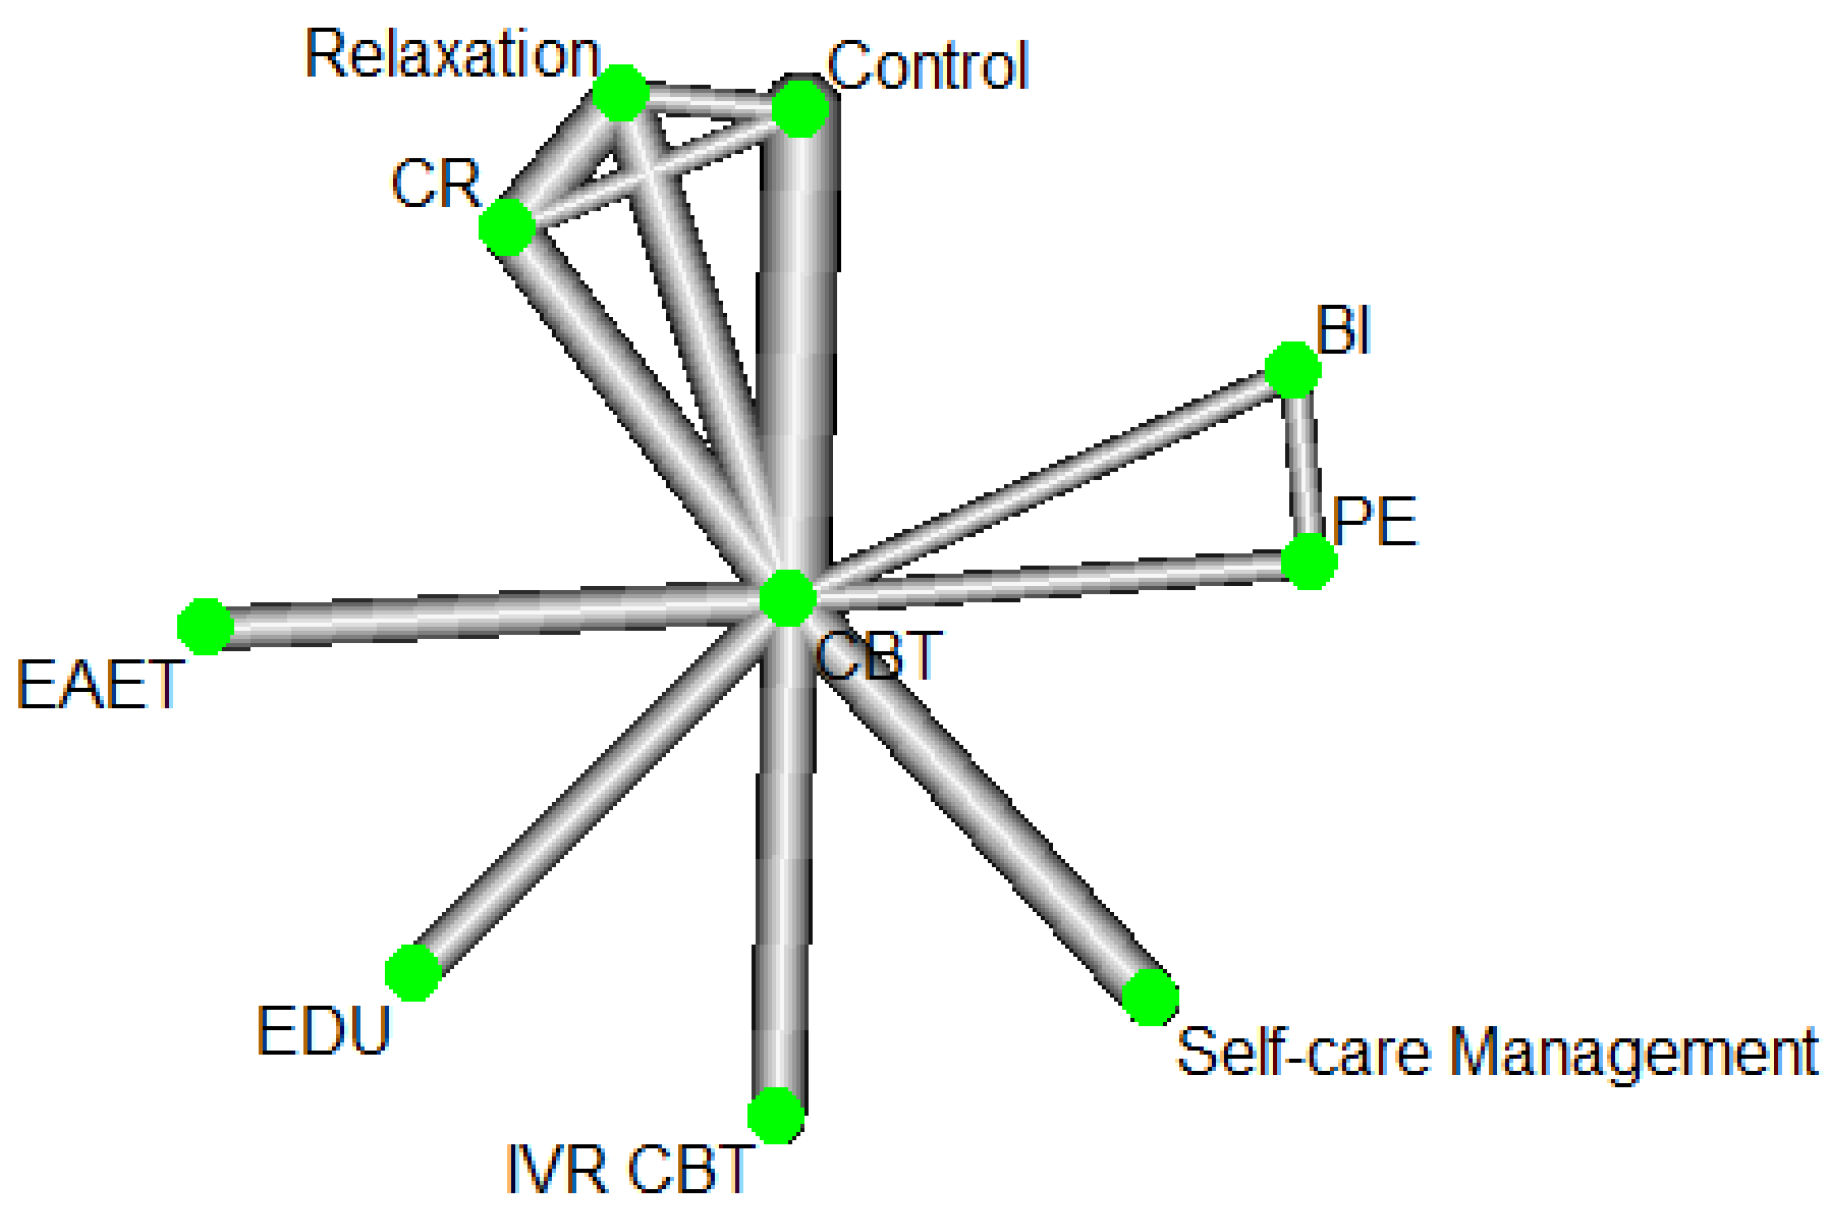
Figure 20.
Forest plot of depression under direct comparisons of CBT-related treatments.
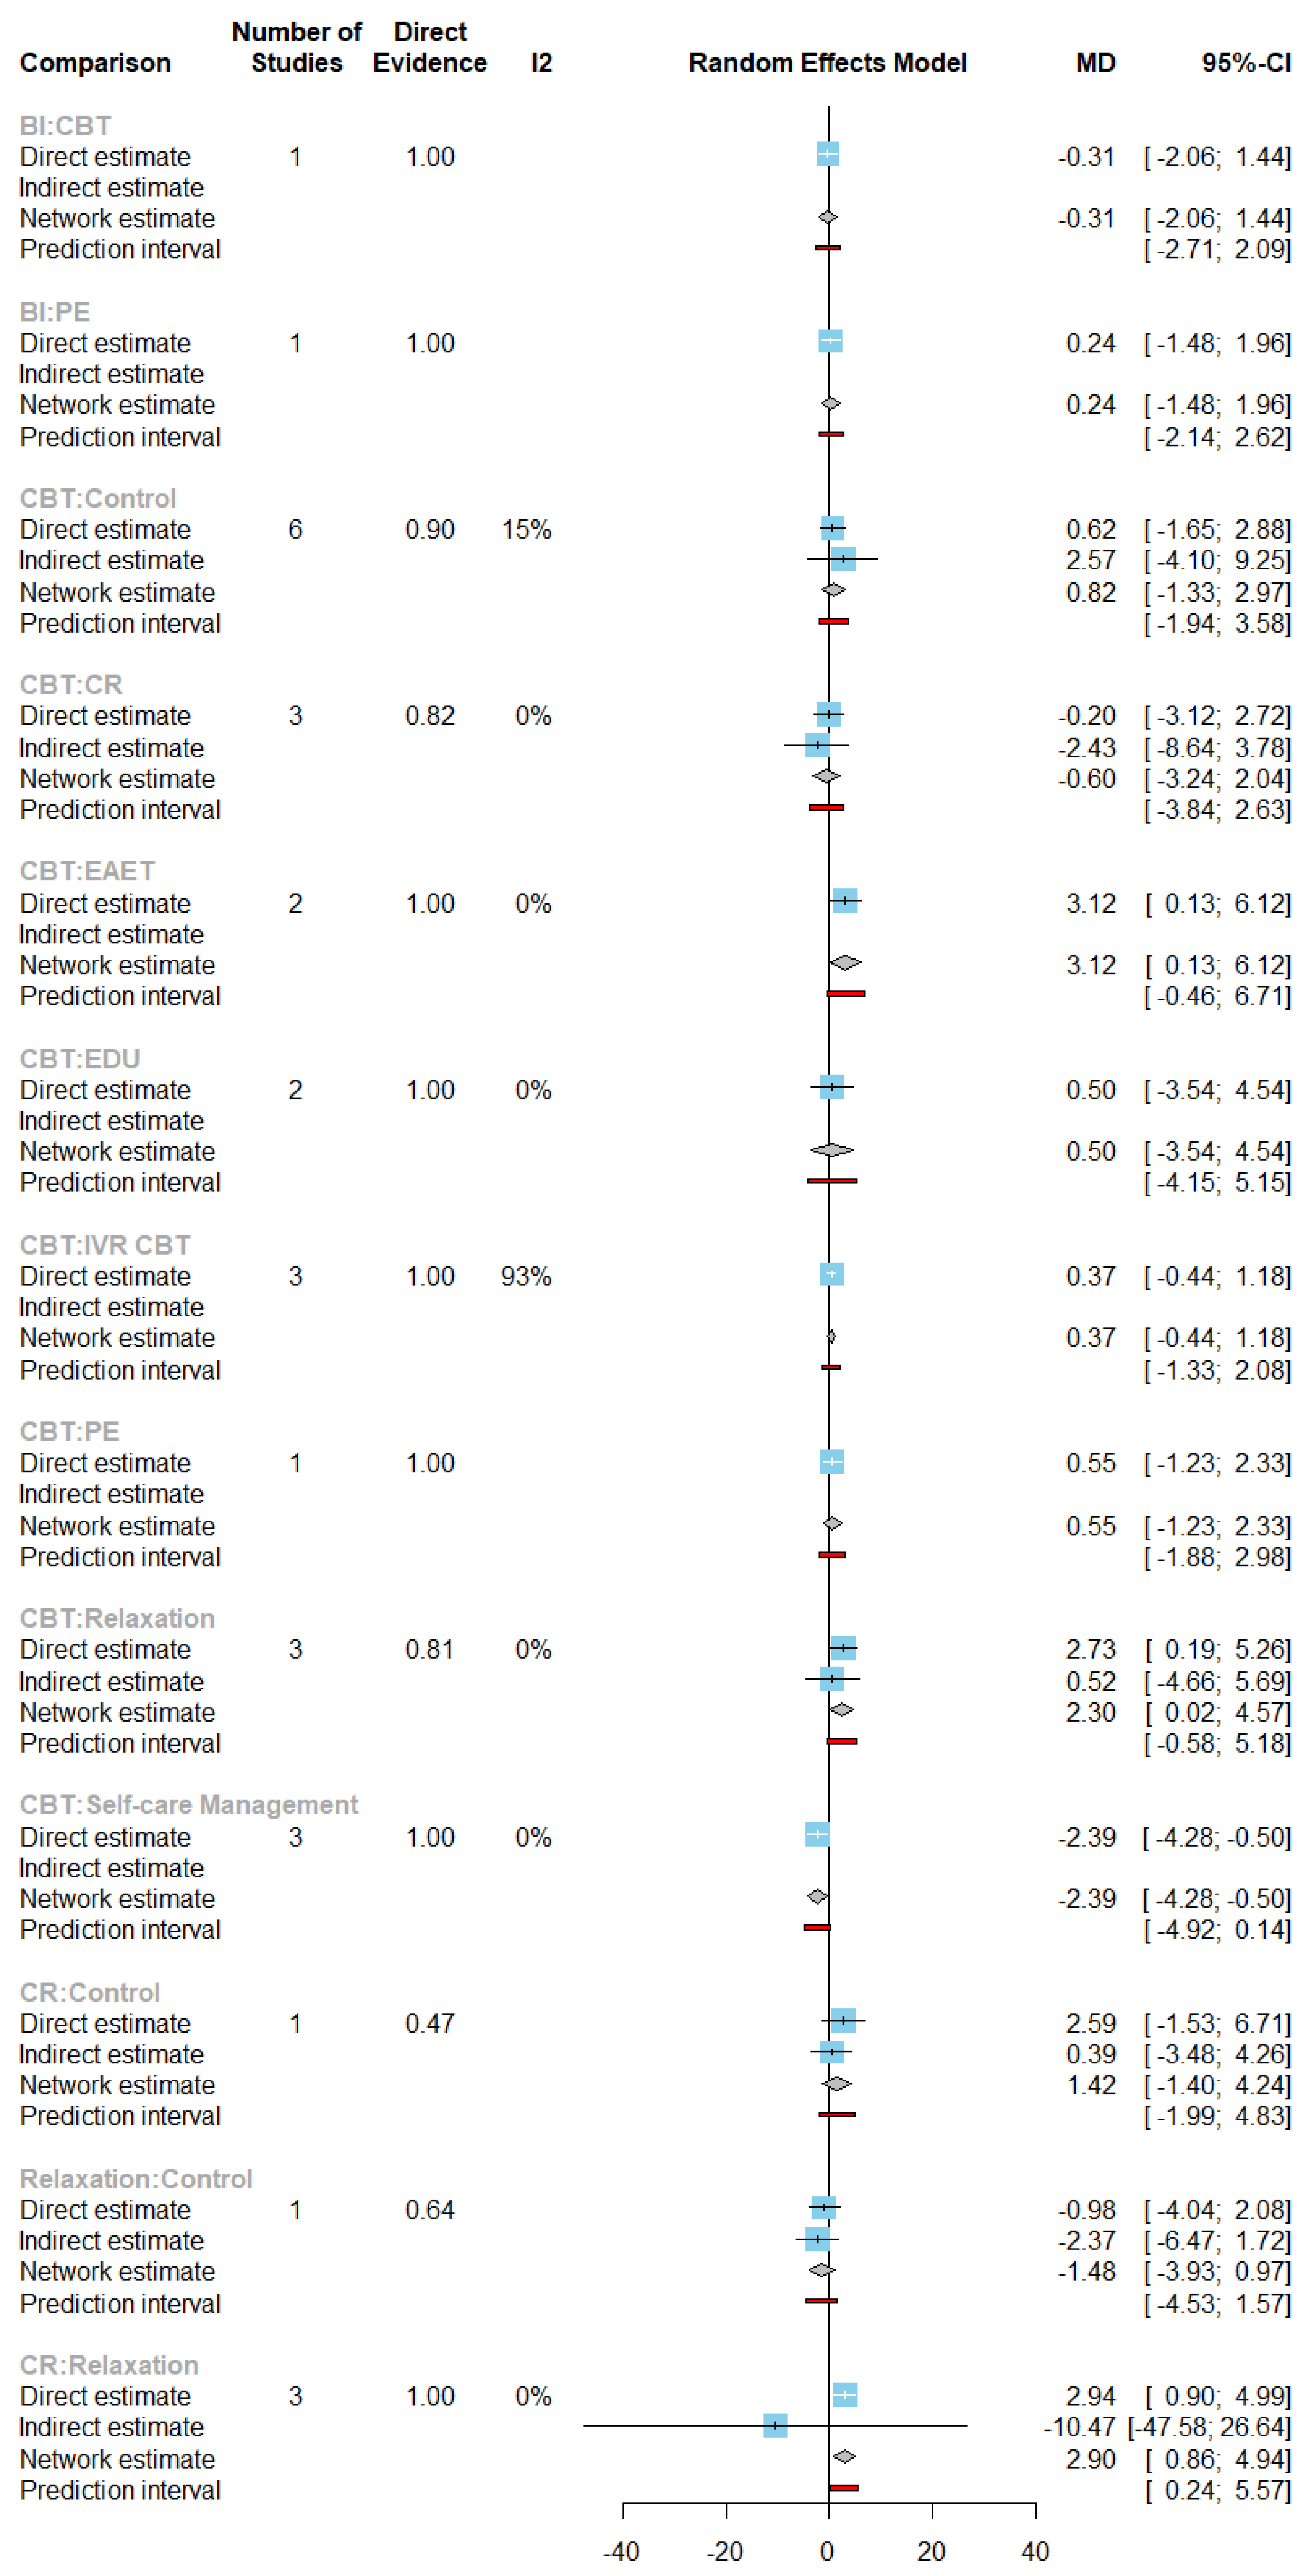
Figure 22.
Network plot of pain intensity under massage-related treatments.
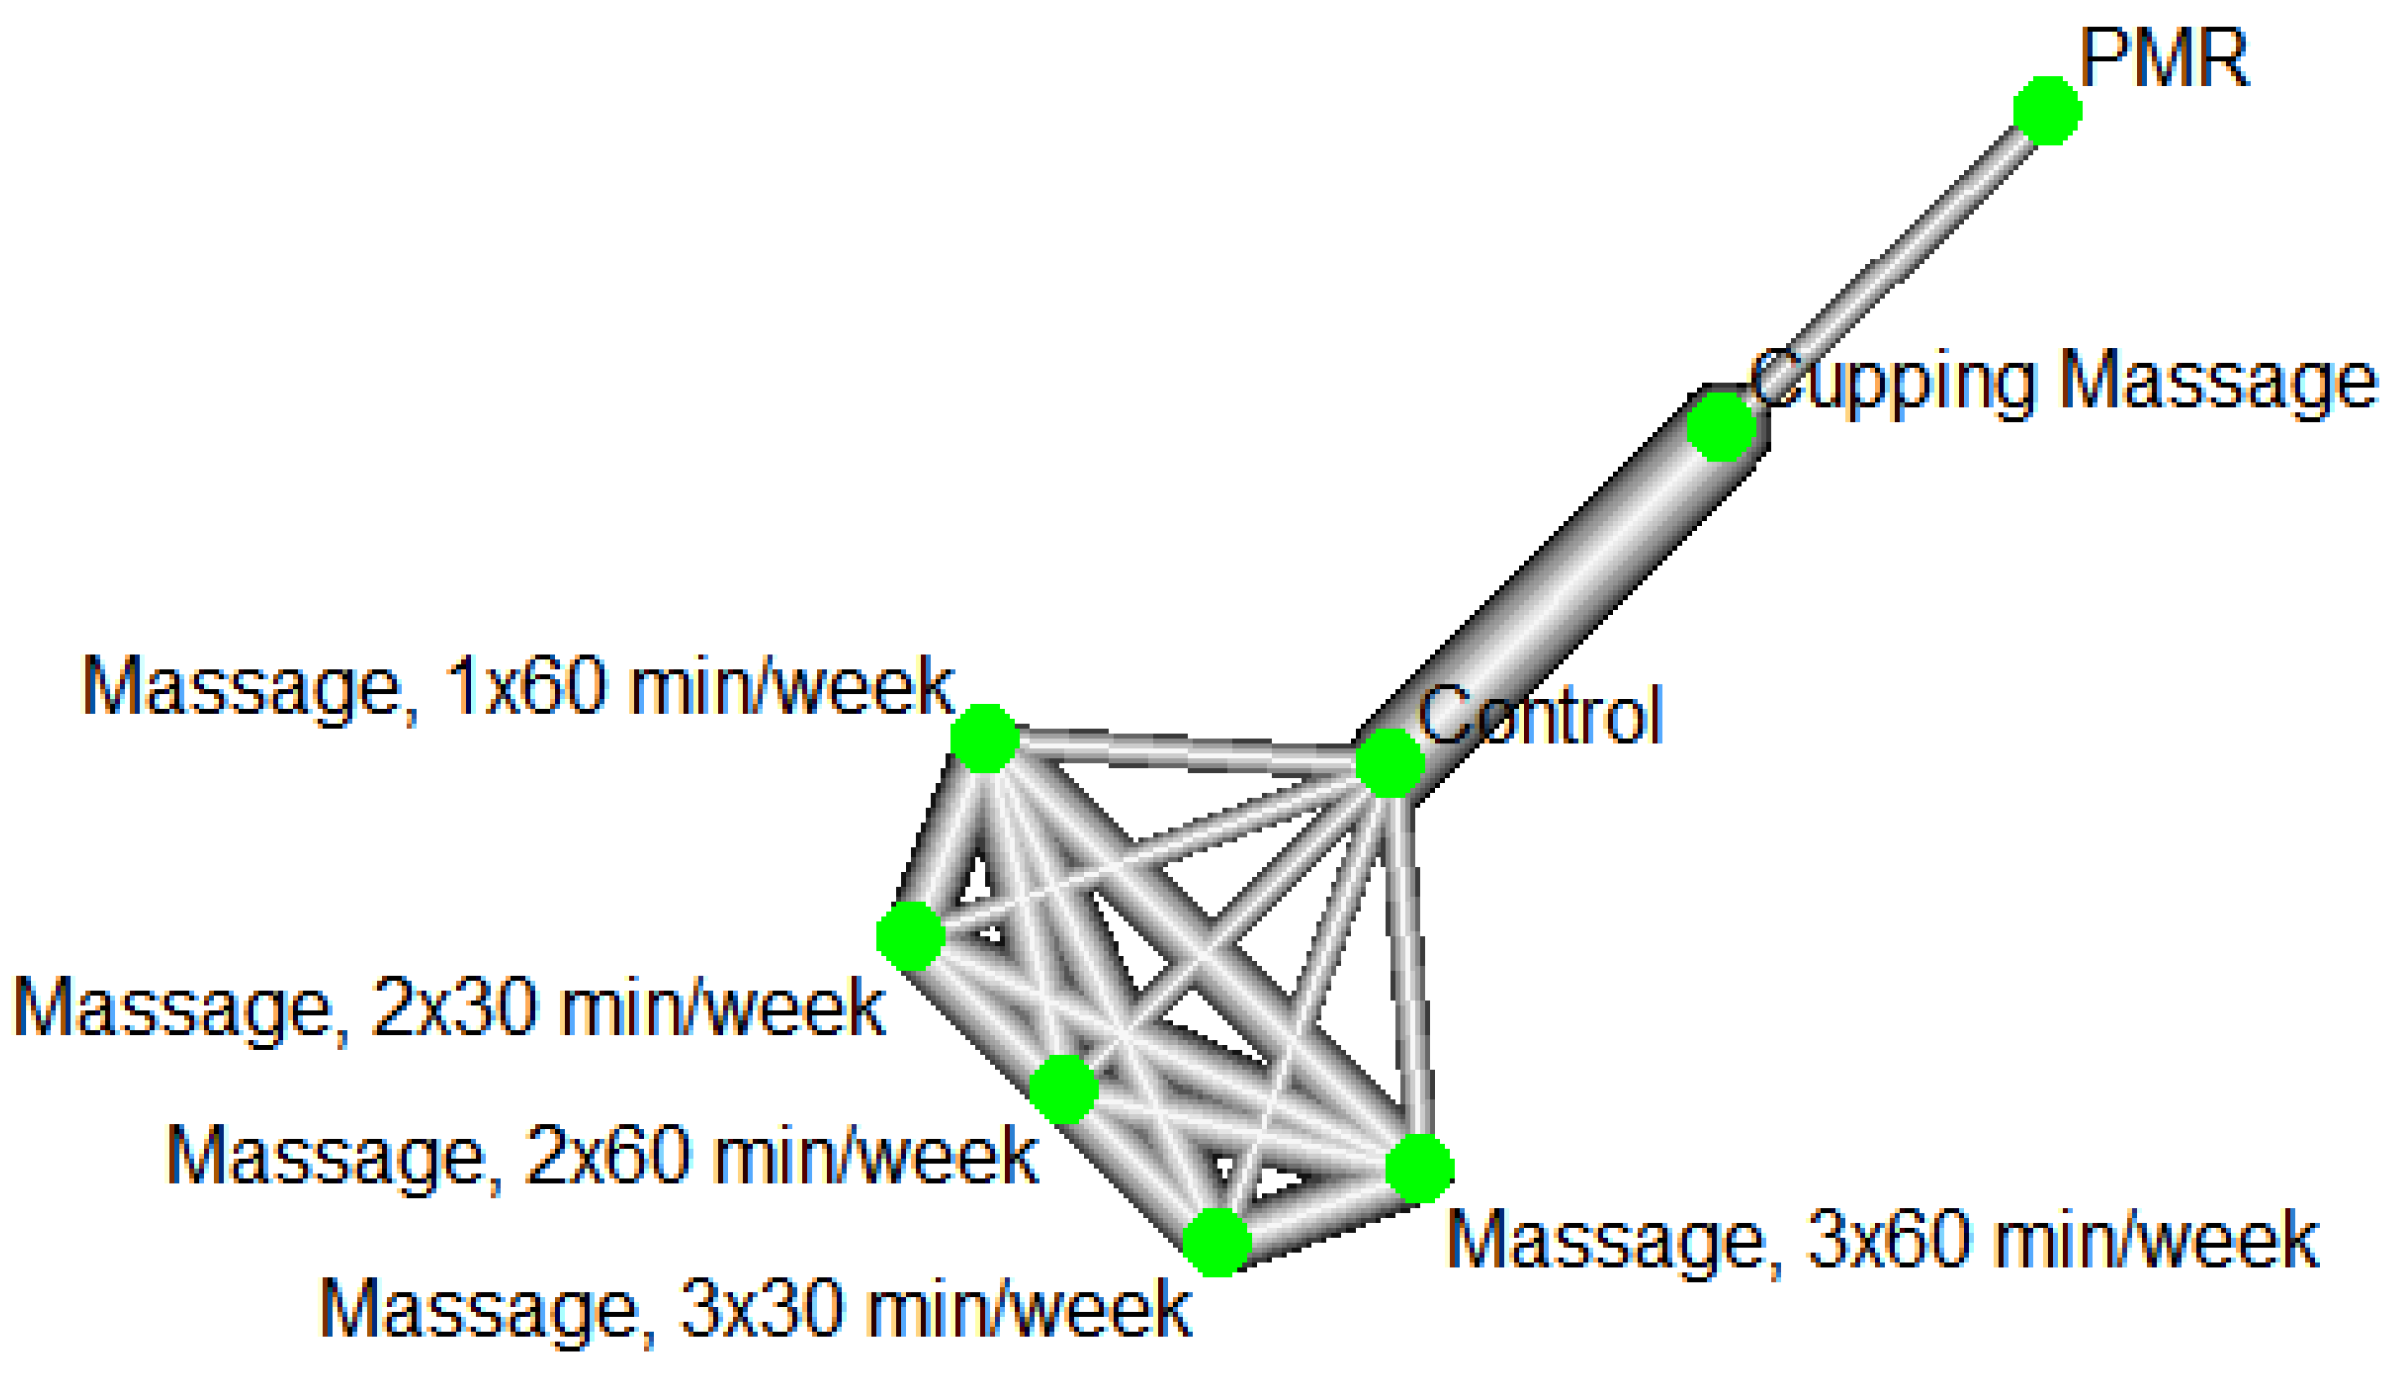
Figure 23.
Forest plot of pain intensity under direct comparisons in the studies of massage-related treatments.
Figure 23.
Forest plot of pain intensity under direct comparisons in the studies of massage-related treatments.
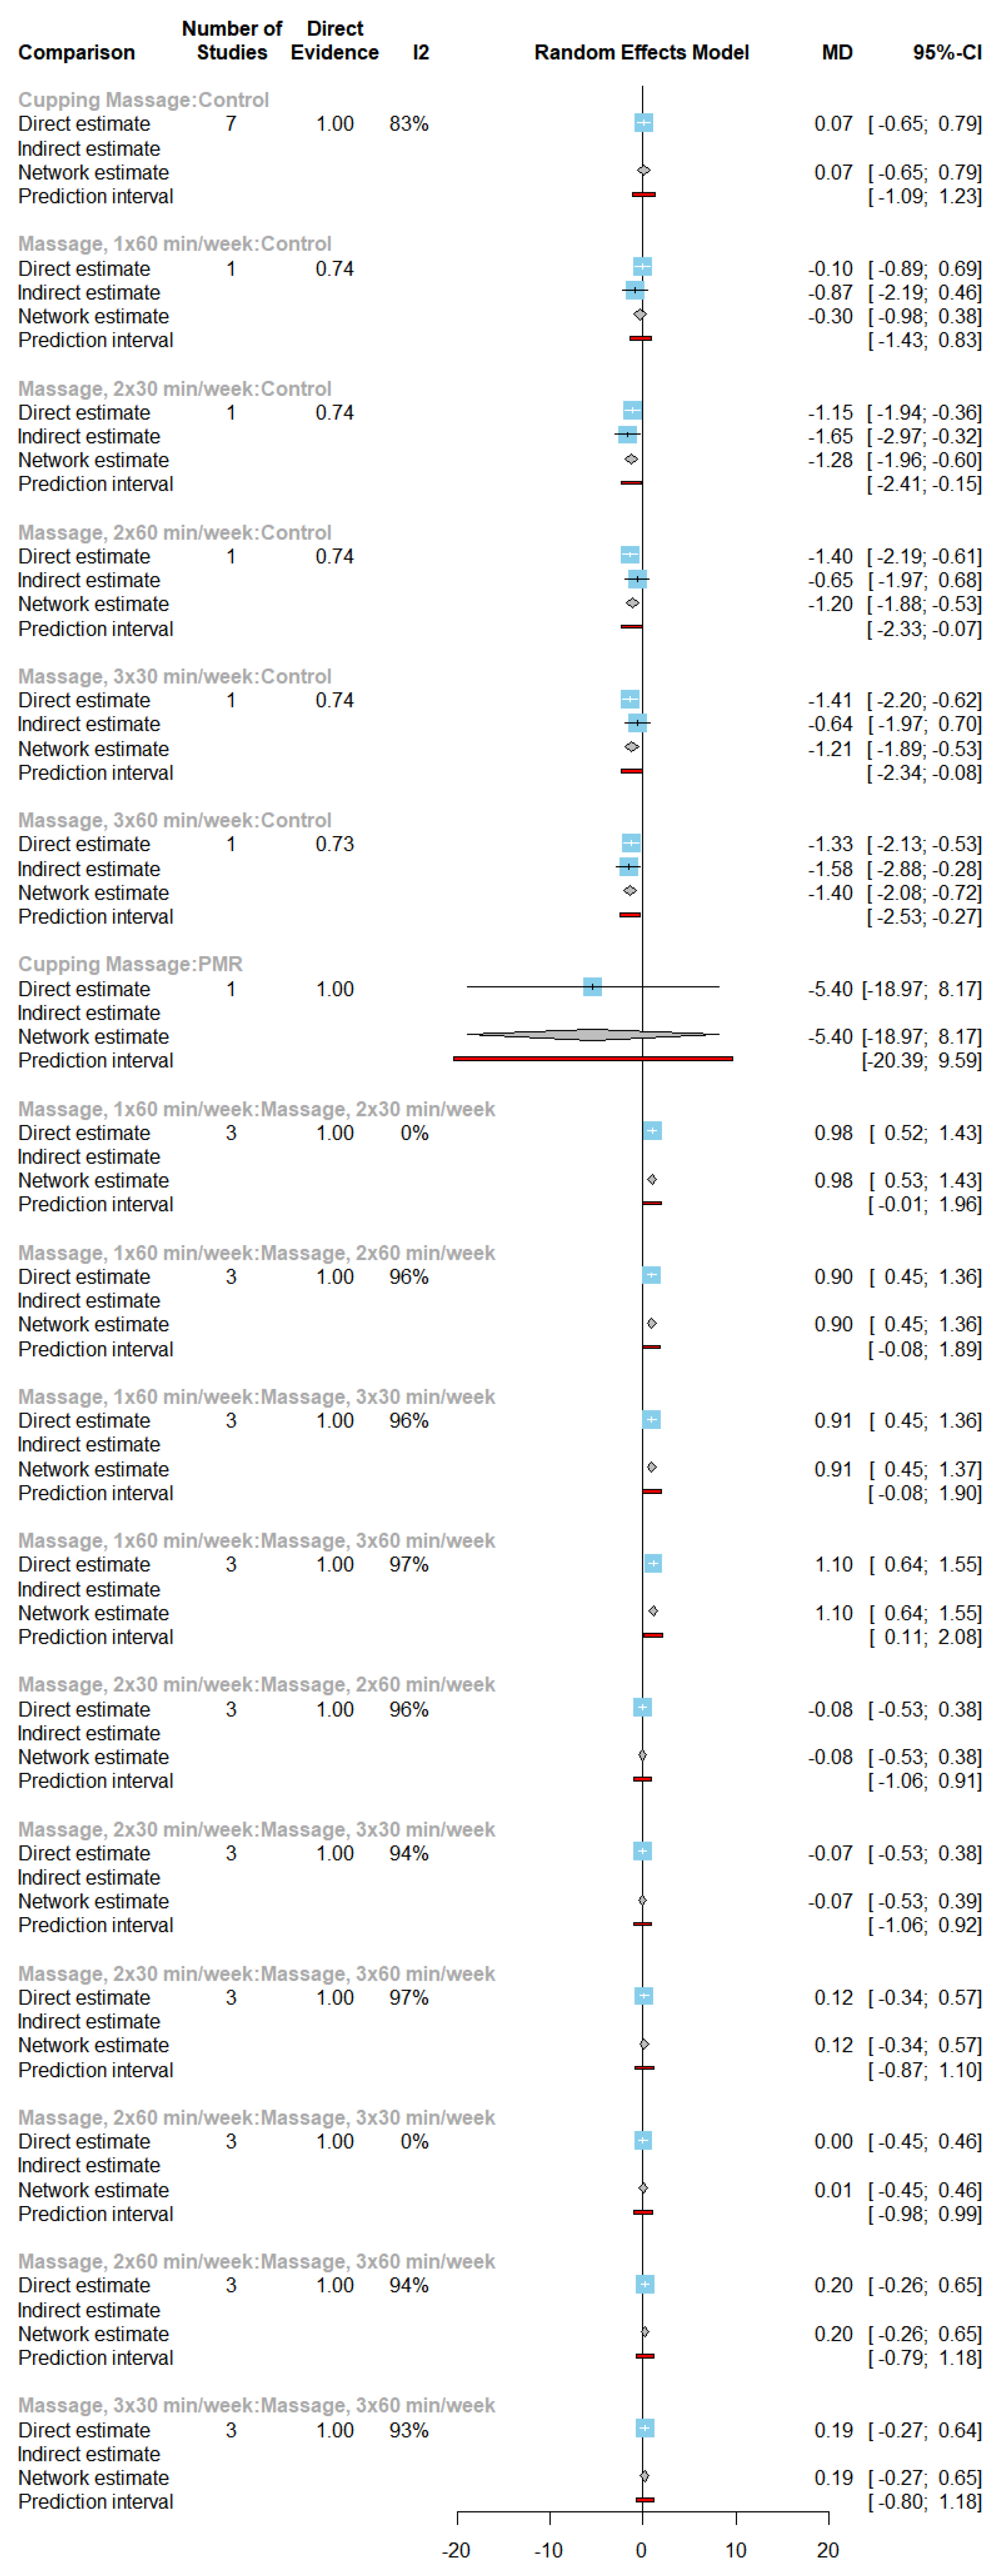
Figure 25.
Network plot of pain disability under massage-related treatments.

Figure 26.
Forest plot of pain disability under direct comparisons in the studies of massage-related treatments.
Figure 26.
Forest plot of pain disability under direct comparisons in the studies of massage-related treatments.
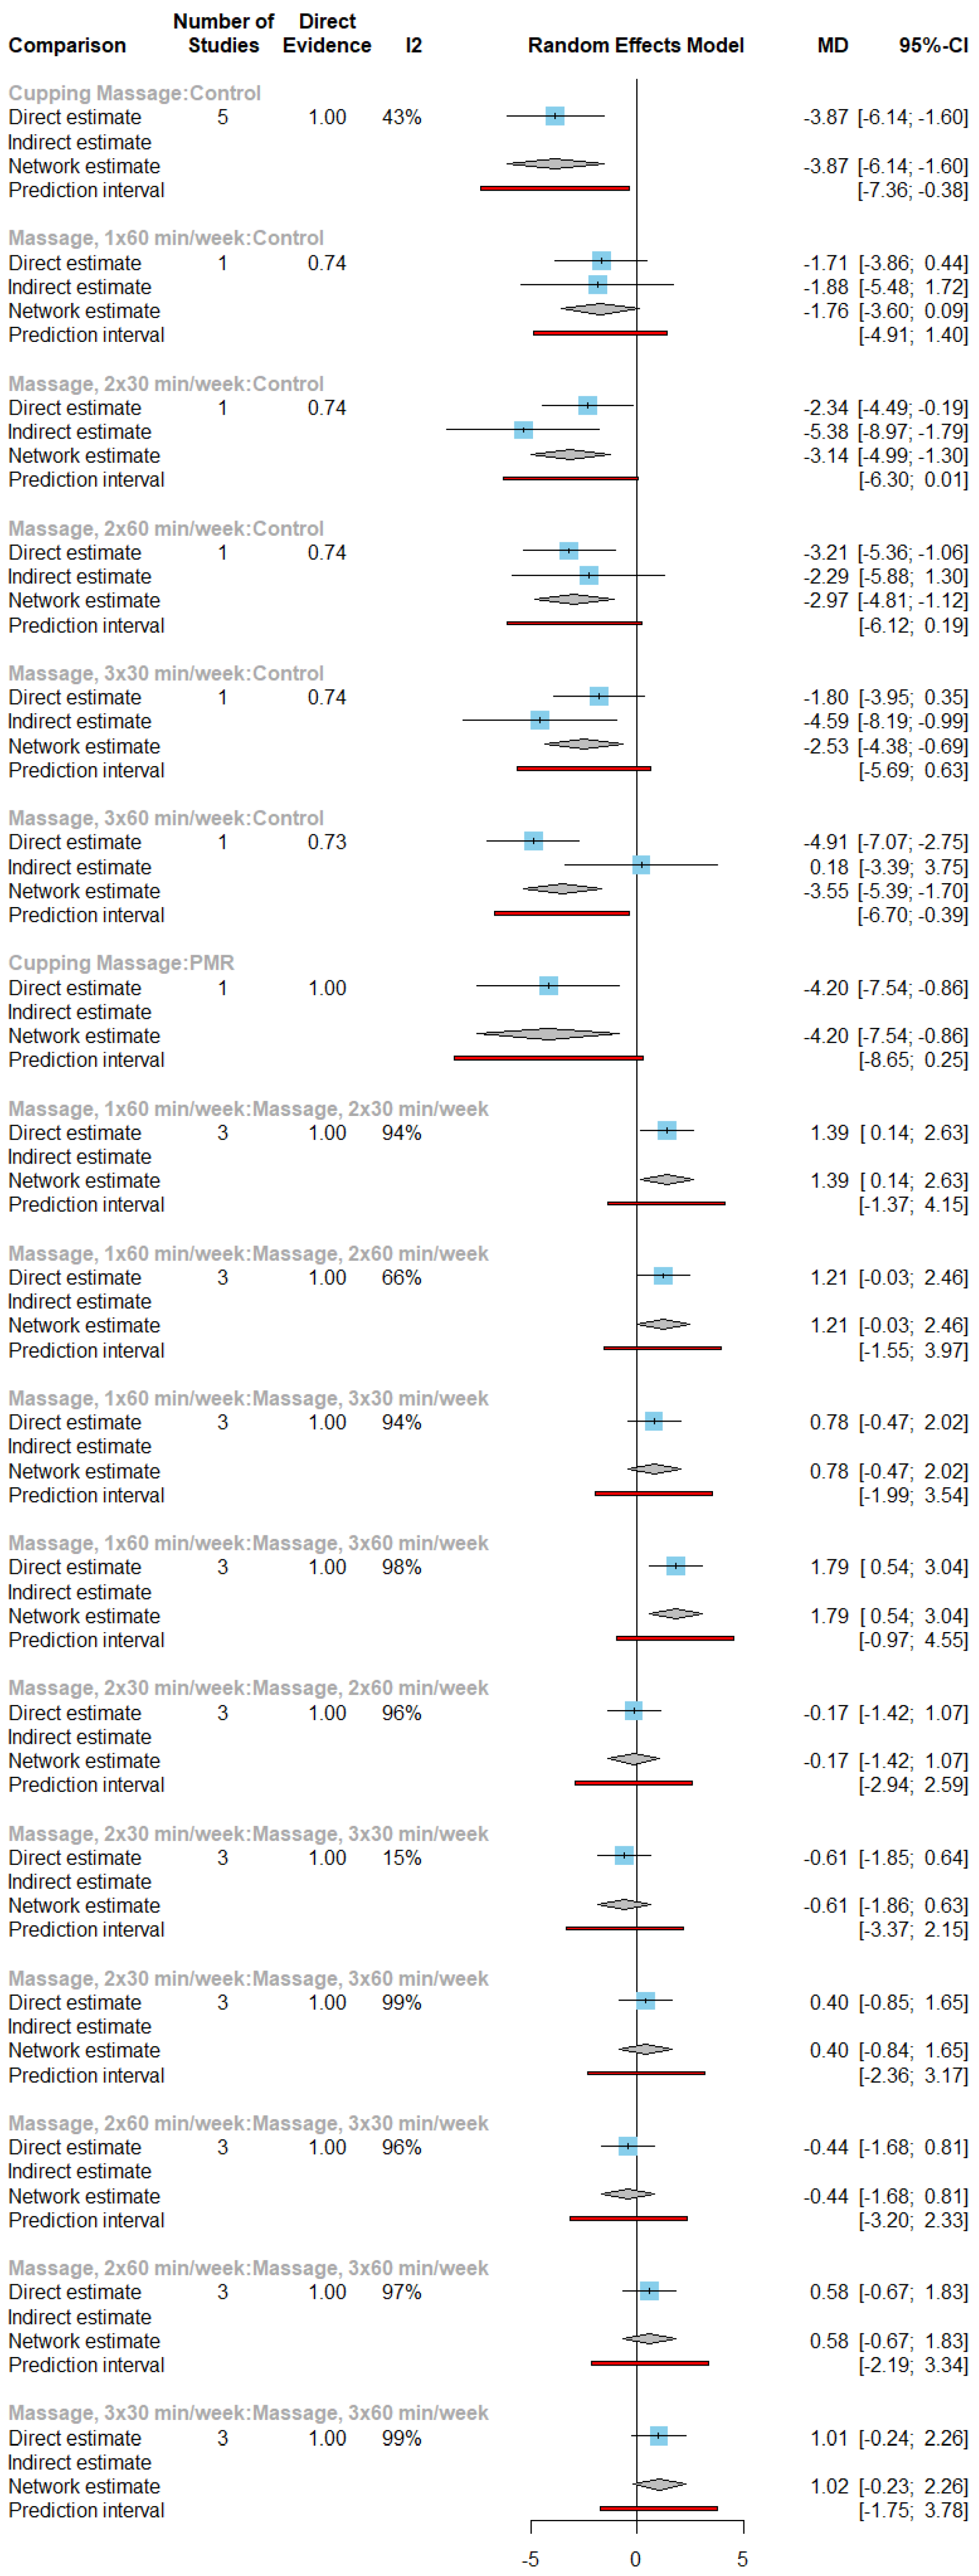
Figure 28.
Funnel plots of mean difference centered at comparison-specific effect. (a) Pain intensity under exercise-related comparisons; (b) Pain disability under exercise-related comparisons; (c) Pain intensity under acupuncture-related comparisons; (d) Pain intensity under CBT-related comparisons; (e) Depression under CBT-related comparisons; (f) Pain intensity under massage-related comparisons; (g) Pain disability under massage-related comparisons.
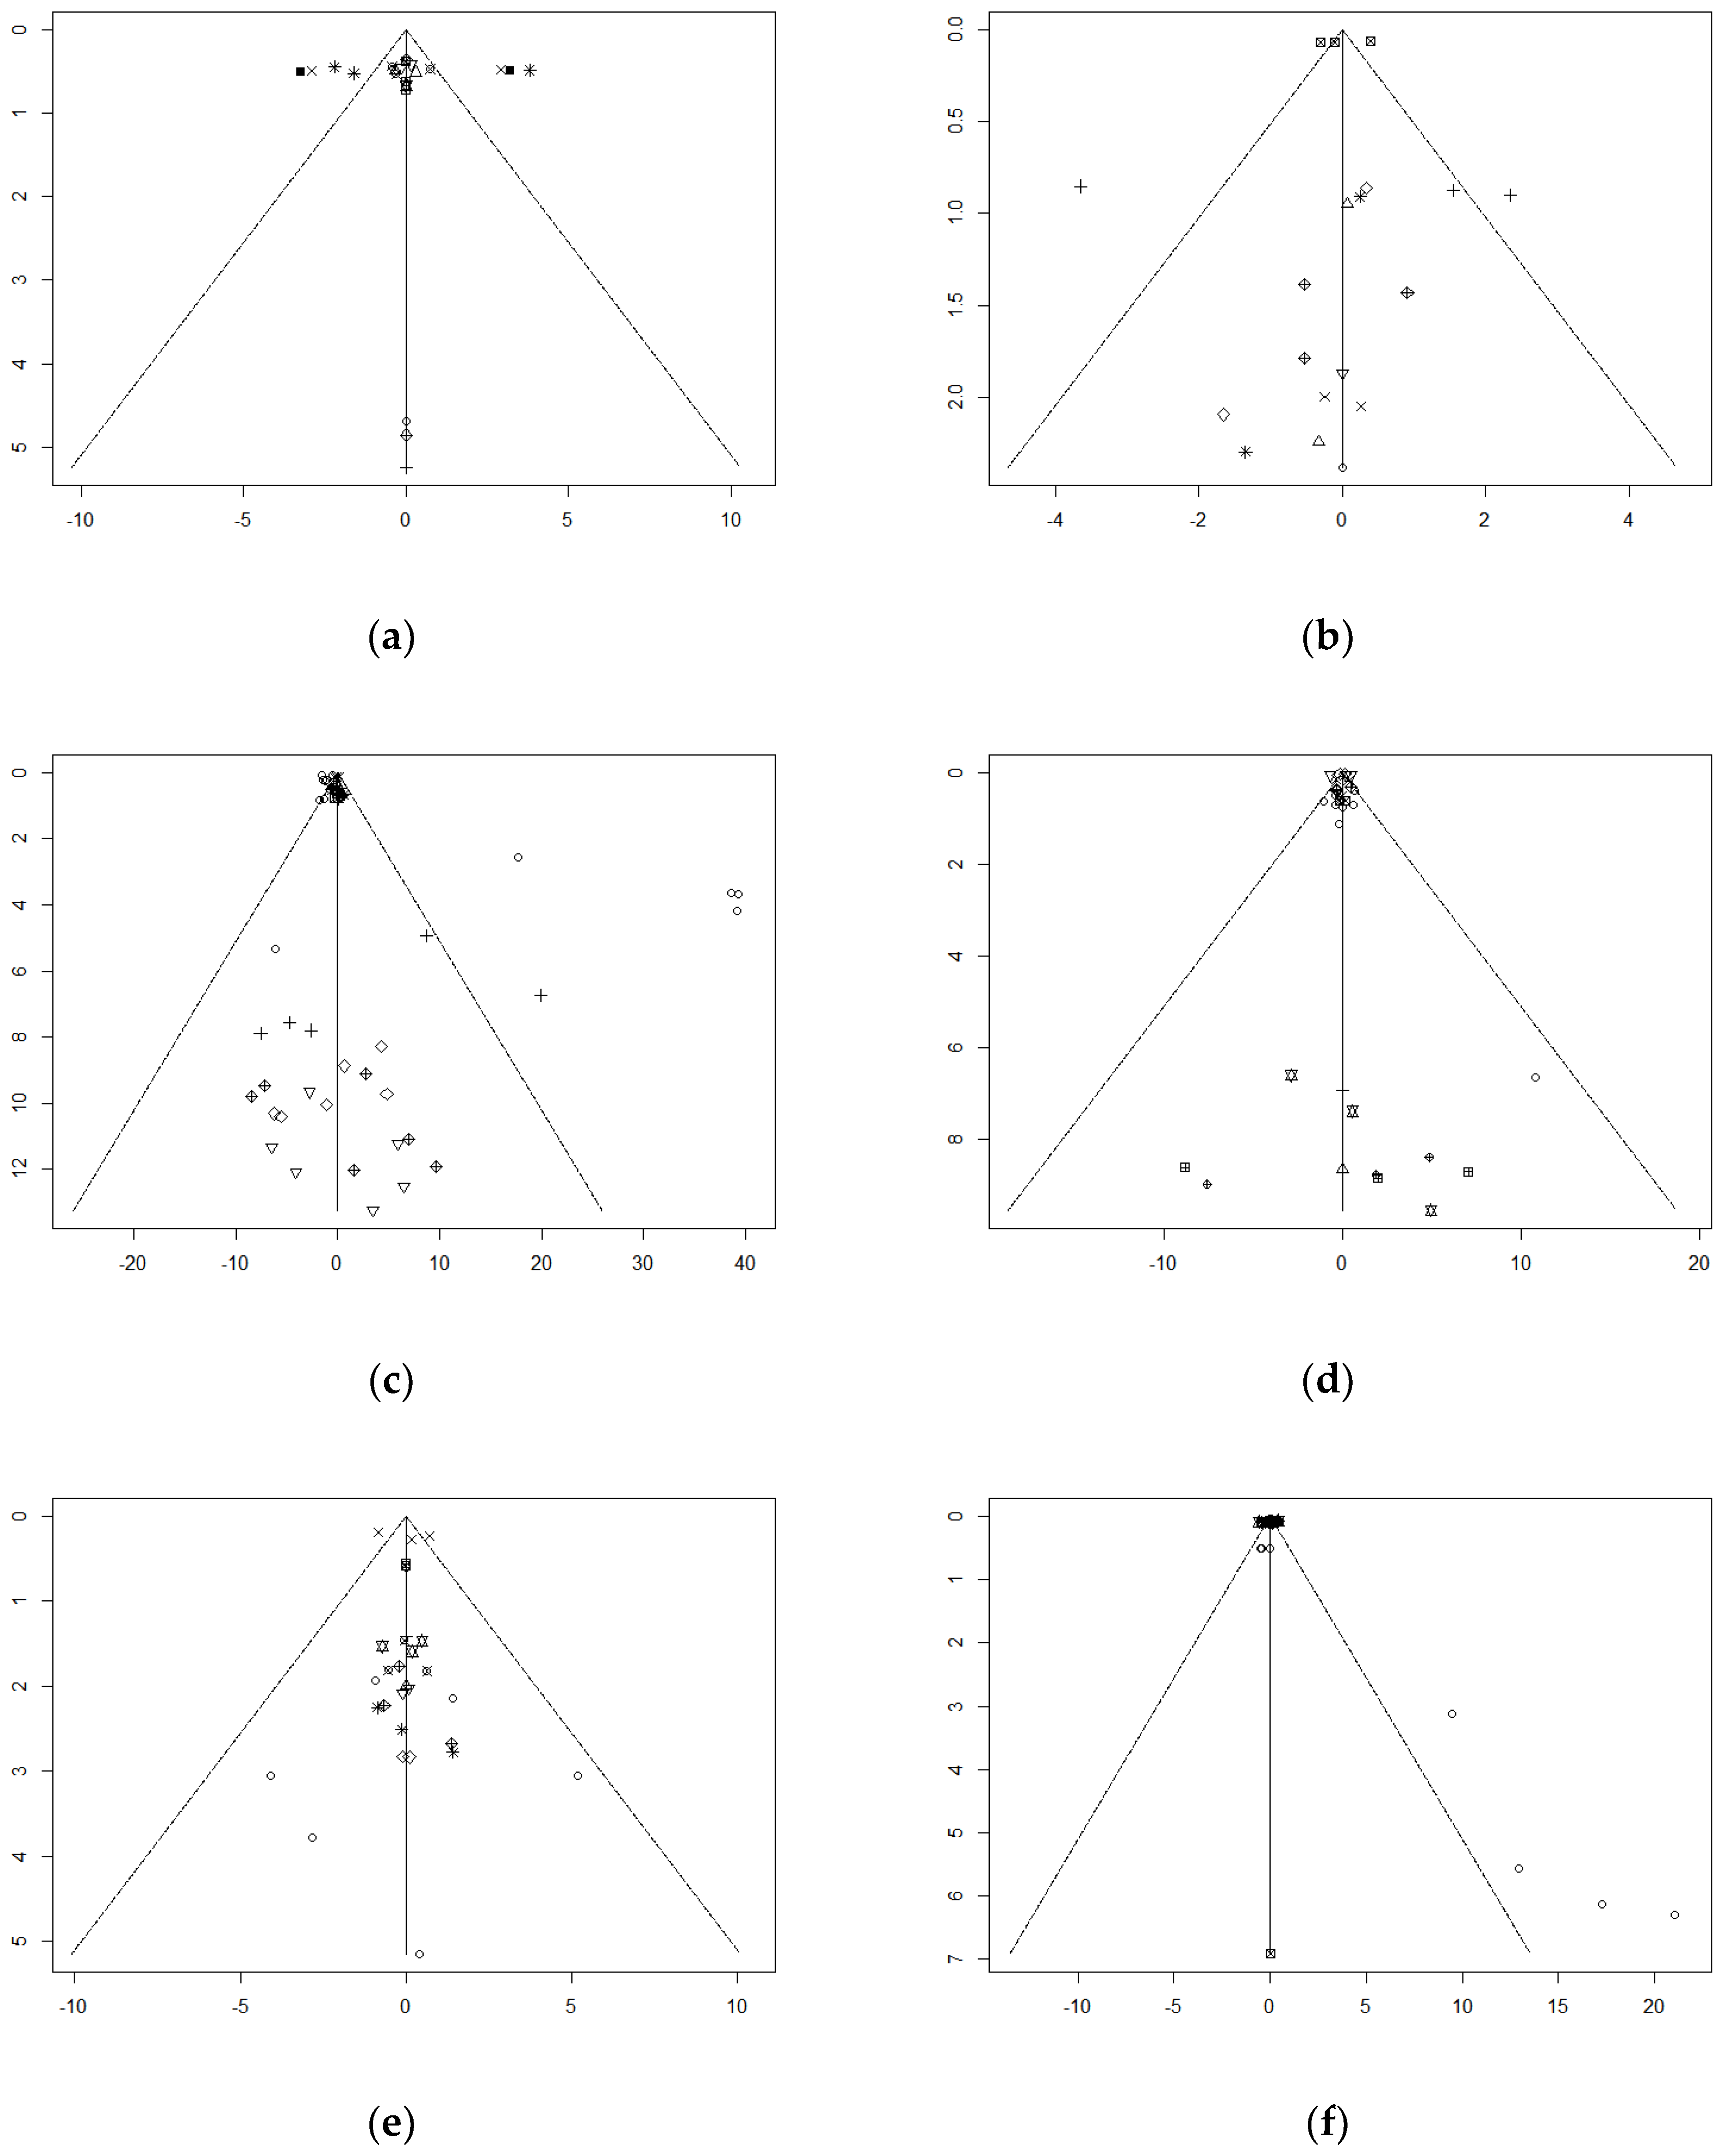
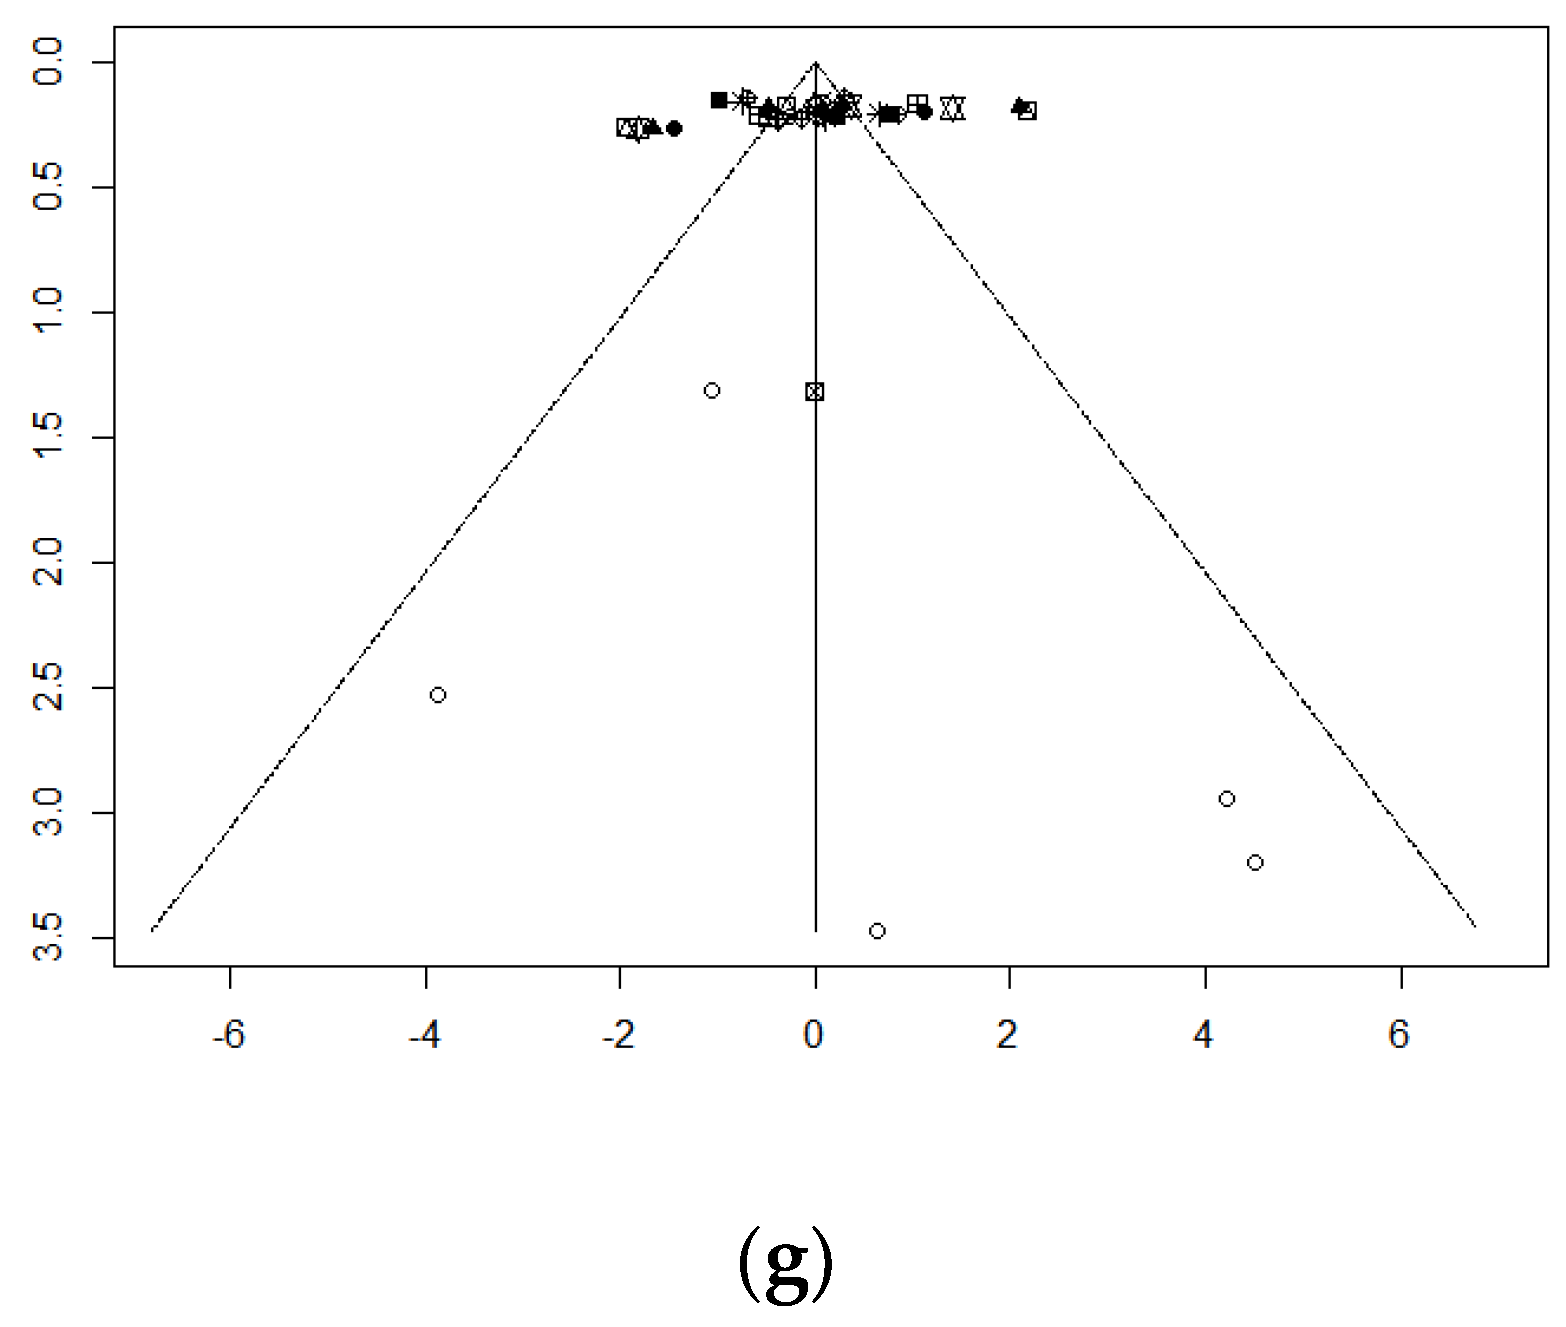

Table 1.
Characteristics of the studies included in systematic review.
| Study ID | Authors | Year | Study Type | Sample Size | Country | Mean | Meta-analysis inclusion Y/N |
|---|---|---|---|---|---|---|---|
| 1 | Gardiner et al. | 2019 | Single-blind RCT | 159 | USA | 50.5 | N |
| 2 | Malfliet et al. | 2018 | 2-center, Triple-blind RCT | 120 | Belgium | 37.5 | N |
| 3 | Gkolias et al. | 2019 | Double-blind RCT | 21 | Greece | 58.76 | N |
| 4 | Turner et al. | 2021 | Cohort study | 328 | USA | 53.17 | N |
| 5 | Lehinger et al. | 2020 | RCT | 103 | USA | 45.33 | N |
| 6 | Gkolias et al. | 2019 | Double-blind RCT | 21 | Greece | 58.76 | N |
| 7 | Loose et al. | 2021 | Single-blind RCT | 99 | Germany | 51.7 | N |
| 8 | Miller-Matero et al. | 2021 | RCT | 60 | USA | 61.9 | N |
| 9 | Yarns et al. | 2020 | RCT | 53 | USA | 73.5 | Y |
| 10 | Muthulingam et al. | 2021 | Double-blind RCT | 38 | Denmark | 56.6 | N |
| 11 | Regina Wing Shan et al. | 2021 | RCT | 72 | China | 70.3 | N |
| 12 | Kohns et al. | 2020 | RCT | 104 | USA | 44.35 | N |
| 13 | Hooten et al. | 2018 | RCT | 100 | USA | 39 | N |
| 14 | Damush et al. | 2015 | RCT | 250 | USA | 55.1 | N |
| 15 | Turner et al. | 2018 | RCT | 111 | USA | 56.5 | N |
| 16 | Lee et al. | 2018 | Two-arm, Assessor-blind RCT | 36 | Korea | 51.125 | Y |
| 17 | Koyuncu et al. | 2016 | RCT | 60 | Turkey | 52.7 | Y |
| 18 | Cederbom et al. | 2019 | RCT | 105 | Norway | 85 | N |
| 19 | Reneman et al. | 2018 | Single-blind, two armed RCT | 201 | Germany | 43.8 | N |
| 20 | Nygaard et al. | 2020 | RCT | 62 | Norway | 38.1 | N |
| 21 | Kisling et al. | 2021 | RCT | 381 | Germany | 11.4 | N |
| 22 | Öte Karaca et al. | 2016 | RCT | 50 | Turkey | 43.7 | Y |
| 23 | Matthias et al. | 2020 | RCT | 215 | USA | 58.6 | N |
| 24 | Heathcote et al. | 2018 | RCT | 66 | UK | 13.48 | N |
| 25 | Hüppe et al. | 2019 | RCT | 552 | Germany | 53.5 | N |
| 26 | Stahlschmidt et al. | 2018 | RCT | 107 | Germany | 13.8 | N |
| 27 | Dogan et al. | 2021 | RCT | 419 | Germany | 14.3 | N |
| 28 | Heapy et al. | 2016 | RCT | 230 | USA | 57.9 | N |
| 29 | Carty et al. | 2019 | RCT | 62 | USA | 46.03 | N |
| 30 | Ziadni et al. | 2021 | RCT | 104 | USA | 48.6 | N |
| 31 | Bourke et al. | 2014 | RCT | 641 | UK | 38.5 | N |
| 32 | Gardiner et al. | 2016 | RCT | 159 | USA | 50.5 | N |
| 33 | Mehlsen et al. | 2017 | RCT | 500 | Denmark | 54.2 | N |
| 34 | Corrêa et al. | 2016 | RCT | 150 | Brazil | 51.2 | N |
| 35 | Cederbom et al. | 2014 | RCT | 23 | Sweden. | 84.5 | N |
| 36 | Smith et al. | 2019 | RCT | 80 | Australia | 45 | N |
| 37 | Monticone et al. | 2016 | RCT | 170 | Italy | 53.8 | Y |
| 38 | Baker et al. | 2018 | RCT | 39 | Australia | 43.3 | Y |
| 39 | Karlsson et al. | 2014 | RCT | 57 | Sweden. | 44 | N |
| 40 | Lauche et al. | 2013 | RCT | 200 | Germany | 51.4 | Y |
| 41 | Lluch et al. | 2014 | RCT | 23 | Spain | 38.9 | N |
| 42 | Brage et al. | 2015 | Single-blind RCT | 200 | Denmark | 42.14 | N |
| 43 | Meeus et al. | 2014 | Double-blind RCT | 70 | Belgium | 54.25 | N |
| 44 | Chelimsky et al. | 2013 | RCT | 31 | USA | 53.4 | N |
| 45 | Lauche et al. | 2016 | RCT | 114 | Germany | 49.4 | Y |
| 46 | Beinert et al. | 2018 | RCT | 29 | Germany | 45.5 | N |
| 47 | Fernández-Carnero et al. | 2018 | RCT | 54 | Spain | 20.91 | N |
| 48 | Guillory et al. | 2015 | RCT | 68 | USA | 48.59 | N |
| 49 | Jeitler et al. | 2014 | RCT | 89 | Germany | 49.7 | N |
| 50 | Lane et al. | 2017 | RCT | 316 | USA | range: 18–75 | N |
| 51 | Van Oosterwijck et al. | 2013 | Double-blind RCT | 30 | Belgium | 45.8 | N |
| 52 | Löffler et al. | 2017 | Double-blind RCT | 20 | Germany | 44.8 | N |
| 53 | Kroenke et al. | 2014 | Double-blind RCT | 250 | USA | 55.2 | N |
| 54 | Weeks et al. | 2015 | RCT | 20 | USA | 60.2 | N |
| 55 | Buhrman et al. | 2015 | RCT | 52 | Sweden | 50.69 | N |
| 56 | Weiner et al. | 2019 | RCT | 55 | USA | 69.1 | N |
| 57 | Sahin et al. | 2011 | RCT | 146 | Turkey | 47.25 | Y |
| 58 | Ang et al. | 2010 | RCT | 250 | USA | 55.5 | N |
| 59 | Makino et al. | 2013 | RCT | 39 | Japan | - | N |
| 60 | Vanti et al. | 2019 | RCT | 64 | Italy | 48.3 | N |
| 61 | Plews-Ogan et al. | 2005 | RCT | 30 | USA | 46.5 | N |
| 62 | Holmberg et al. | 2014 | A qualitative interview study | 20 | Germany | 76 | N |
| 63 | Cook et al. | 2015 | RCT | 179 | USA | 47.1 | Y |
| 64 | Chen et al. | 2019 | RCT | 204 | USA | 55 (median) | Y |
| 65 | de Araujo Cazotti et al. | 2018 | RCT | 64 | Brazil | 48.8 | Y |
| 66 | Lauche et al. | 2012 | RCT | 40 | Germany | 49.2 | N |
| 67 | Murtezani et al. | 2011 | RCT | 101 | Kosovo | 50.6 | N |
| 68 | Rutledge et al. | 2018 | RCT | 61 | USA | 62.5 | Y |
| 69 | Hechler et al. | 2013 | RCT | 120 | Germany | 14 | N |
| 70 | Hinman et al. | 2012 | RCT | 282 | Australia | 64.3 | N |
| 71 | Flack et al. | 2018 | RCT | 104 | Germany | 14.3 | N |
| 72 | Blödt et al. | 2015 | RCT | 127 | Germany | 46.7 | Y |
| 73 | Lauche et al. | 2015 | RCT | 72 | Germany | 39.9 | N |
| 74 | Zhang et al. | 2015 | RCT | 80 | China | 45 | Y |
| 75 | Galindez-Ibarbengoetxea et al. | 2017 | Single-blind RCT | 27 | Spain | 33.29 | Y |
| 76 | Haugstad et al. | 2008 | RCT | 20 | Norway | - | Y |
| 77 | Kumar et al. | 2016 | RCT | 64 | Germany | 54.8 | Y |
| 78 | Sherman et al. | 2014 | RCT | 228 | USA | 46.75 | Y |
| 79 | Thorn et al. | 2011 | RCT | 83 | USA | 50.2 | Y |
| 80 | Fink et al. | 2002 | RCT | 45 | Austria | 52.5 | N |
| 81 | Kabay et al. | 2009 | RCT | 89 | Turkey | 37.7 | N |
| 82 | Gur et al. | 2003 | RCT | 75 | Turkey | 35.7 | Y |
| 83 | Racine et al. | 2020 | RCT | 69 | Canada | 51.12 | N |
| 84 | Turner et al. | 2006 | RCT | 158 | USA | 37.3 | Y |
| 85 | Michalsen et al. | 2016 | RCT | 68 | Germany | 55 | N |
| 86 | Trapp et al. | 2015 | RCT | 30 | Germany | 45.53 | N |
| 87 | Lee et al. | 2019 | RCT | 25 | Malaysia | 65.63 | N |
| 88 | Rothman et al. | 2013 | RCT | 182 | Sweden | - | N |
| 89 | Durmus et al. | 2013 | Single-blind RCT | 41 | Germany | 54.9 | N |
| 90 | Teut et al. | 2016 | RCT | 176 | Germany | 73 | Y |
| 91 | Elder et al. | 2017 | RCT | 138 | USA | 48.7 | N |
| 92 | Walach et al. | 2003 | RCT | 19 | Germany | 39.4 | N |
| 93 | Durmus et al. | 2013 | Single-blind RCT | 60 | Turkey | 48.7 | N |
| 94 | Heutink et al. | 2014 | RCT | 31 | The Netherlands | 56.5 | N |
| 95 | Karst et al. | 2000 | Double-blind RCT | 39 | Germany | 49 | Y |
| 96 | Koldaş Doğan et al. | 2016 | Double-blind RCT | 49 | turkey | 52.14 | N |
| 97 | Berry et al. | 2015 | RCT | 85 | Canada | 50.4 | N |
| 98 | Lauche et al. | 2013 | RCT | 61 | Germany | 54.16 | Y |
| 99 | Yeh et al. | 2015 | RCT | 61 | USA | 60.97 | N |
| 100 | Magalhães et al. | 2015 | RCT | 66 | Brazil | 46.6 | N |
| 101 | Haugstad et al. | 2006 | RCT | 20 | Norway | 32.3 | Y |
| 102 | Cho et al. | 2013 | Assessor-blinded RCT | 45 | Korea | 38.8 | Y |
| 103 | Sayilir & Yildizgoren | 2017 | A randomised, follow-up study | 55 | Turkey | 51.1 | N |
| 104 | Braun et al. | 2011 | RCT | 48 | Germany. | 58.5 | N |
| 105 | Lin et al. | 2013 | RCT | 63 | China | 39.9 | N |
| 106 | Ferrell et al. | 1997 | RCT | 29 | USA | 73 | N |
| 107 | Zhang et al. | 2013 | RCT | 206 | China | 45.8 | N |
| 108 | Sköld et al. | 2013 | RCT | 152 | Sweden | 39.4 | N |
| 109 | Bello et al. | 2015 | RCT | 80 | Ghana | 45 | N |
| 110 | Hinman et al. | 2014 | RCT | 2882 | Australia | 63.5 | N |
| 111 | Witt et al. | 2006 | A Multicentre RCT plus a Non-randomized Cohort. | 3451 | Germany | 49.8 | N |
| 112 | Lluch et al. | 2013 | n experimental study | 35 | India | 42 | N |
| 113 | Monticone et al. | 2016 | RCT | 150 | Italy | 53.2 | Y |
| 114 | Palermo et al. | 2020 | RCT | 143 | USA | 14.5 | N |
| 115 | He et al. | 2005 | RCT | 24 | Norway | 47 | N |
| 116 | Itoh et al. | 2004 | RCT | 35 | Japan | 71.9 | Y |
| 117 | Koldaş Doğan et al. | 2008 | RCT | 55 | Turkey | 40.2 | Y |
| 118 | Civelek et al. | 2012 | RCT | 100 | turkey | 51.8 | N |
| 119 | Özkul et al. | 2015 | RCT | 24 | Turkey | 32.33 | N |
| 120 | Salo et al. | 2012 | RCT | 101 | Finland | 41 | N |
| 121 | Williams et al. | 2018 | RCT | 159 | Australia | 56.7 | N |
| 122 | Turner & Jensen | 1993 | RCT | 102 | USA | 42 | Y |
| 123 | García-Pérez-Juana et al. | 2018 | RCT | 54 | Spain | 37 | N |
| 124 | Ólason et al. | 2017 | RCT | 115 | Iceland | 37.32 | Y |
| 125 | Ebadi et al. | 2017 | RCT | 30 | Iran | 44.26 | N |
| 126 | Fuentes et al. | 2014 | Double-blind RCT | 117 | Canada | 30 | N |
| 127 | Linden et al. | 2014 | RCT | 103 | Germany | 50 | Y |
| 128 | Licciardone et al. | 2013 | Double-blind RCT | 455 | USA | 41 | N |
| 129 | Falla et al. | 2013 | RCT | 46 | Denmark | 39.1 | N |
| 130 | Heapy et al. | 2017 | RCT | 125 | USA | 57.9 | Y |
| 131 | Sanei et al. | 2020 | RCT | 52 | Iran | 37.25 | N |
| 132 | Kääpä et al. | 2006 | RCT | 120 | Finland. | 46 | N |
| 133 | Monticone et al. | 2014 | RCT | 20 | Italy | 58.9 | Y |
| 134 | Di Cesare et al. | 2011 | RCT | 62 | Italy | 52.5 | Y |
| 135 | Yan et al. | 2020 | RCT | 20 | China | 53.65 | Y |
| 136 | Von Korff et al. | 2005 | RCT | 240 | USA | 49.7 | N |
| 137 | Defrin et al. | 2005 | RCT | 22 | Israel. | 44.5 | N |
| 138 | Cramer et al. | 2013 | RCT | 36 | Germany | 47.8 | N |
| 139 | Cruz-Díaz et al. | 2015 | RCT | 97 | Spain | 71.14 | N |
| 140 | Häkkinen et al. | 2007 | RCT | 125 | Finland | 42.5 | N |
| 141 | Monticone et al. | 2018 | RCT | 30 | Italy | 48.6 | N |
| 142 | Uluğ et al. | 2018 | RCT | 56 | Turkey | 39.7 | Y |
| 143 | Sertpoyraz et al. | 2009 | RCT | 40 | Turkey | 38.75 | Y |
| 144 | Rizzo et al. | 2018 | RCT | 100 | Brazil | 51.7 | N |
| 145 | S. Lee & B. Lee | 2009 | RCT | 63 | USA | 39.8 | N |
| 146 | Garcia et al. | 2020 | Double-blind RCT | 188 | USA | 51.5 | N |
| 147 | Almeida Silva et al. | 2021 | RCT | 90 | Brazil | 30 | Y |
| 148 | Loizidis et al. | 2020 | RCT | 25 | Greece | 44 | N |
| 149 | Nabeta & Kawakita | 2002 | RCT | 34 | Japan | 34.2 | Y |
| 150 | Gilmore et al. | 2019 | RCT | 28 | USA | 46.5 | N |
| 151 | Poleshuck et al. | 2014 | RCT | 61 | USA | 36.7 | N |
| 152 | Zhang et al. | 2014 | RCT | 54 | China | 22.29 | N |
| 153 | Cho et al. | 2013 | RCT | 130 | Korea | 42.06 | Y |
| 154 | Zhu & Polus | 2002 | Single-blind RCT | 29 | Australia | 50 | Y |
| 155 | Gur et al. | 2004 | Double-blind RCT | 60 | Turkey | 31.72 | N |
| 156 | Liang et al. | 2011 | Single-blind RCT | 190 | China | 36.72 | Y |
| 157 | Andrade Ortega et al. | 2014 | RCT | 149 | Spain | 44.2 | N |
| 158 | Ylinen et al. | 2006 | RCT | 180 | Finland. | 46 | N |
| 159 | Cruz-Díaz et al. | 2015 | Single-blind RCT | 101 | Spain | 71.05 | Y |
| 160 | Ylinen et al. | 2003 | RCT | 180 | Finland | 45.7 | N |
| 161 | Morone et al. | 2008 | RCT | 25 | USA | 74.1 | N |
| 162 | Vibe Fersum et al. | 2019 | RCT | 121' | Norway | 43 | Y |
| 163 | Meissner et al. | 2016 | RCT | 60 | Germany | 35.6 | N |
| 164 | Harris et al. | 2017 | RCT | 214 | Norway | 44.8 | N |
| 165 | Narouei et al. | 2020 | Single-blind RCT | 32 | Iran | 32.18 | N |
| 166 | Ghasabmahaleh et al. | 2020 | RCT | 44 | Iran | 44.3 | N |
| 167 | Thomas et al. | 2020 | RCT | 162 | USA | 25 | N |
| 168 | Lauche et al. | 2016 | RCT | 81 | Germany | 65.9 | N |
Table 3.
Results of Egger's Test.
| Network | Measurements | p-value of Egger’s Test |
| Exercise-related comparisons | pain intensity | 0.9791 |
| Exercise-related comparisons | pain disability | 0.8671 |
| Acupuncture-related comparisons | pain intensity | 0.0082 |
| CBT-related comparisons | pain intensity | 0.8404 |
| CBT-related comparisons | depression | 0.6502 |
| Massage-related comparisons | pain intensity | 0.8347 |
| Massage-related comparisons | pain disability | 0.6890 |
Disclaimer/Publisher’s Note: The statements, opinions and data contained in all publications are solely those of the individual author(s) and contributor(s) and not of MDPI and/or the editor(s). MDPI and/or the editor(s) disclaim responsibility for any injury to people or property resulting from any ideas, methods, instructions or products referred to in the content. |
© 2024 by the authors. Licensee MDPI, Basel, Switzerland. This article is an open access article distributed under the terms and conditions of the Creative Commons Attribution (CC BY) license (https://creativecommons.org/licenses/by/4.0/).
Copyright: This open access article is published under a Creative Commons CC BY 4.0 license, which permit the free download, distribution, and reuse, provided that the author and preprint are cited in any reuse.


