Submitted:
26 May 2023
Posted:
30 May 2023
Read the latest preprint version here
Abstract
Cell identity is determined by chromatin structure and the profiles of gene expression, which are dependent on chromatin accessibility and DNA methylation of regions critical for gene expres-sions, such as enhancers and promoters. These epigenetic modifications are required for mamma-lian development and are essential for the establishment and the maintenance of the cellular iden-tity. DNA methylation was once thought to be a permanent repressive epigenetic mark, but sys-tematic analysis in various genomic contexts reveals a more dynamic regulation than previously thought. In fact, both active DNA methylation and demethylation occur during cell fate commit-ment and terminal differentiation. To link methylation signatures of specific genes to their ex-pression profiles, we have determined the methyl-CpG configurations of the promoters of five genes switched on and off during murine postnatal brain differentiation by bisulfite-targeted se-quencing. We report here the structure of significant, dynamic and stable methyl-CpG profiles as-sociated with silencing or activation of expression of genes during brain postnatal differentiation. Strikingly, these methylation cores mark different mouse brain areas and cell types derived from the same areas during postnatal differentiation.
Keywords:
methyl-CpG
; DNA methylation
; gene expression
; cell identity
1. Introduction
DNA methylation is a covalent modification of cytosine in genomic DNA that in vertebrates predominantly occurs on the CpG (methyl-CpG) dinucleotide and is frequently associated with long-term transcriptional repression [1,2]. Methyl-CpG is established and maintained by the action of the maintenance and de novo DNA methyltransferases DNMT1 and DNMT3A/B/L, respectively [2]. Conversely, methyl-CpG can be removed by dilution through passive demethylation by inactivation of DNMTs, or by active demethylation mediated by the Ten-eleven translocation (TET) proteins and the base excision repair (BER) TDG pathway [3]. Notably, several recent studies suggest that the functions of methyl-CpG and its oxidized derivatives, such as hydroxymethylation (hydroxy-methyl-CpG), could be far more complex than previously thought and that depending on the cell type, methyl-CpG could recruit a wide variety of transcriptional modulators and even be compatible with transcriptional activation in certain biological contexts [4,5,6,7]. The fact that methyl-CpG can be stably propagated through cell divisions underlies its potential to serve as a form of cellular epigenetic memory implicated in embryogenesis, cellular differentiation, and reprogramming. The last decade has seen a technological revolution that has enabled the interrogation of methyl-CpG state on a genome-wide scale and at single base resolution. Studies utilizing these whole-genome methodologies have provided important insights regarding the genomic location and spatiotemporal dynamics of methyl-CpG in various experimental models [8,9]. Through the combination of high throughput methyl-CpG profiling techniques and functional studies in diverse model systems, our understanding of methyl-CpG function in genome regulation is rapidly advancing.
In a previous study, we presented a new tool to analyze DNA methylation in complex DNA sequence populations. MethCoresProfiler identifies and tracks epiallele (alleles different only by methylation) families in complex cell populations such as those derived from the brain during postnatal differentiation [10]. MethCoresProfiler sorts out complex populations of DNA sequences derived from specific loci harboring a nucleus or core of CpGs, which are stably methylated in most sequences in the population. These methylated cores define and mark the epialleles derived from a single ancestor (epiallele family). With time, CpGs surrounding the core CpGs, not included in the core on the basis of frequency in the sequence population, change the methylation status and contribute to the polymorphism and heterogeneity of methylation profiles of all the epialleles derived from the same ancestor (family). It is worth noting that in complex mixtures of methylated DNA molecules, the frequency of the individual epialleles is never statistically significant because they are formed by stable (core) and unstable CpGs [10]. In simpler words, the methylation cores define CpGs subjected to selection and characterize a stable core in families of epialleles. The same applies to negatively selected epialleles, which disappear with time in the population of sequences. In both cases, positive and negative selection of epiallele families implies selection on the expression of the gene(s) represented in each family. With the publicly available MethCoresProfiler, we are able to generate high-resolution and dynamic epigenetic maps of specific loci [10], for example, during neurodevelopment. In fact, during the development of the brain, stem cell fate decisions are tightly correlated with their epigenetic status [11]. To map and identify positive DNA methylation changes during the neurodevelopment, we performed targeting-bisulfite amplicon sequence analysis of five genes involved in murine brain stem cell differentiation to identify and characterize short methyl-CpG configurations associated with the specific timing of expression of these genes during mouse brain postnatal differentiation. Our data demonstrate that specific short methyl-CpGs cores in the promoters of these genes are tightly associated with induction or activation of transcription during brain differentiation in both the brain areas and isolated cells.
2. Results
2.1. Specific methylated cores mark the promoters of genes involved in murine postnatal brain differentiation.
Cellular differentiation is characterized by reducing the proliferation potential and the expression of markers defining the cell type identity. The reduction of the developmental potential is driven by epigenetic changes that prevent the risks linked to the expression of non-lineage-related genes in adult cells [12,13,14]. In this context, the specific role of methylation of the regulatory gene regions that control cell differentiation is still debated. Moreover, methylated segments of differentiation or stemness genes are highly polymorphic and heterogeneous because, when transcribed, they display stochastic hydroxy-methyl-CpGs, which greatly dilute stable methylated and inheritable sequences subjected to selection [10]. Indeed, in several cases where methylation was measured at the single cell level, a remarkable degree of methylation polymorphism was found in all cell types with no evidence of clonal and stable epialleles [15,16]. The considerable degree of heterogeneity is also demonstrated by measurements of the entropy index, i.e., the number of individual species within a population of epialleles, according to Shannon [17]. Furthermore, limited sampling and variability in mean methylation of individual CpGs in the sequence populations introduce additional bias into the analysis. As mentioned above, we have solved this problem by extracting common methylation signatures or cores in the population of heterogeneous sequences. In this way, we can identify stable families of epialleles and study their evolution over time, for example, during the differentiation of stem cells [10].
We have applied this approach to study the epigenetic evolution of some genes, induced or repressed, during murine brain postnatal differentiation. We analyzed the promoter methylation configuration of genes markers of pluripotency (such as NANOG) [18], or of neuronal (TUBB3, DDO) [19,20], glial cells (GFAP) [21], differentiation or production of brain-derived neurotrophic factor (BDNF) [22] at various time points during postnatal mouse brain differentiation. We report here the identification of gene-specific methylation signatures that characterize epiallele families that evolve by gaining or losing methyl groups associated with silencing or induction of gene expression during mouse brain postnatal differentiation.
2.1.1. NANOG repression is associated with de novo formation of a methylated core in the promoter.
NANOG is a key regulator of self-renewal and maintenance of pluripotency in undifferentiated embryonic stem cells. Each embryonic stem cell (ESC) in a population displays fluctuating Nanog expression resulting in heterogeneity of Nanog levels that affect cell fate specification. During stem cell differentiation, NANOG is progressively silenced. We examined the methylation status of the NANOG promoter (Figure 1A) during ESC differentiation (Figure 1B). We found that all the cytosines in the region underwent progressive methylation during differentiation with different rates (Figure 1C), generating heterogeneous and polymorphic methylation profiles of the promoter molecules (Figure 1D). Using the tool indicated above (MethCoresProfiler) we identified in this heterogenous population of promoter sequences a stable CpG core tightly associated with differentiating cells. At T2-4, the NANOG promoter shows the first round of methylation at several CpGs, but the stable and statistically relevant methylation core appears and stabilizes at T8-14 (Figure 1E-F). In addition, we note a transient methylation at CpGs 80, which is rapidly substituted by the stable core of CpGs 365-375. With time the entire promoter region becomes methylated in differentiated cells. We hypothesize that CpGs 80 is OH methylated and with its demethylation at T8, favors the appearance of the core 365-375, which initiates the methylation of the promoter and the silencing of the gene (Figure 1E,F,G).
2.1.2. TUBB3 promoter methylation does not control the expression during neuronal differentiation.
TUBB3 is almost exclusively expressed in neurons and is induced early during differentiation and reprogramming of neurons [23,24]. Examining the methylation status of the TUBB3 promoter (Figure 2A), we identified a stable methylated nucleus at CpGs 22-35 (Figure 2E), which is present at the time 0 and does not significantly change over time (Figure 2B and 2C) during differentiation.
This segment upstream of the gene in mice and humans contains binding sites for several DNA-binding proteins, mainly located on the positive (+) strand [25]. This evidence suggests that TUBB3 expression is not controlled by DNA methylation of the proximal promoter during postnatal brain differentiation (Figure 2G).
2.1.3. BDNF gene activation parallels the loss of the methylated core at the promoter during brain differentiation.
Brain-derived neurotrophic factor (BDNF) is a member of the neurotrophin growth factor family that stimulates neurons' differentiation, maturation, and survival by suppressing apoptosis. BDNF also exerts a neuroprotective effect under adverse conditions [26]. We examined the epigenetic configuration of the BDNF promoter during differentiation and found a significant reduction of methylation (Figure 3A, Figure 3B). All CpGs in the promoter were found methylated in T0 cells in a small fraction of the cells, except CpGs 81-83, which constitutes a methylation core in the BDNF promoter present in the majority of undifferentiated cells (T0) (Figure 3). Induction of differentiation was associated with a sharp loss of methylation of all CpGs methylated at low frequency and of the CpGs 81-83 of the core in the BDNF promoter at T0-T2 (Figure 3C). The loss of methylation reduced the epigenetic heterogeneity, and the Shannon entropy during differentiation (Figure 3D). However, our analysis reveals also that the methylated core, CpGs 81-83, present at T0 increased transiently at T2 and decreased at T8-T14 (Figure 3E,3F, 3G). These 81-83 CpGs were methylated at T0 and T2 in both strands of the BDNF promoter, with a slight preference for the (-) strand (Figures S1-S2). The transient methylation increase of the 81-83 CpGs in the early phases of differentiation suggests a priming effect of this core on BDNF expression induced by differentiation, due to OH demethylation similarly to CpG 80 in the NANOG promoter, which signals the end of transcription induced by differentiation (Figure 1).
2.1.4. GFAP gene activation changes the configuration of the promoter methylated core.
Glial fibrillary acidic protein (GFAP) is the primary intermediate filament (IF) protein in astrocytes. In the human brain, GFAP isoforms display unique expression profiles, which suggest distinct functional roles. One isoform, GFAPδ, is expressed in proliferative radial glia precursors during human brain development. In humans, GFAP is a marker of neural stem cells [27]. We examined the methylation profile(s) of the GFAP promoter during mouse brain postnatal differentiation. We found that (Figure 4A), during ESC differentiation, all cytosines in the promoter sequence (Figure 4B) at low frequency undergo methylation (Figure 4C). In this context, we identified a stable methylation core at CpGs 35-84 in undifferentiated cells, which changed its structure at T4 (84-304) and stabilized at T8-T14 (Figure 4E). This nucleus (84-304 CpGs) becomes dominant in the whole population (Figure 4F) and marks the transcriptional GFAP activation [28] (Fabiana Passaro et al., in preparation).
2.1.5. DDO gene promoter methylation profile and expression during postnatal brain differentiation.
DDO (d-aspartate oxidase) levels are induced during brain differentiation and are inhibited in the adult brain, mirroring, reciprocally, d-aspartate levels, which are low in adults [29]. We examined the methylation status of the DDO promoter (Figure 5A), which shows a transient increase at T4 and returned to the baseline levels at T8-T14 (Figure 5B). This methylation involves all cytosines in the locus (Figure 5C) and correlates with a transient reduction of population heterogeneity at T4 (Figure 5D). We identified a methylation core in the DDO promoter at position 105-138-150 at T0-T2 which becomes fully methylated at T4 (105-138-150-226-293-343) and changes configuration at T8-T14 (105-138) (Figure 5E). This nucleus (105-138) significantly increases its frequency in the population up to T4 and then decreases (Figure 5F) marking the activation of the DDO transcription [30,31] (Fabiana Passaro et al, in preparation).
2.2. CpG methylation cores define cell identity.
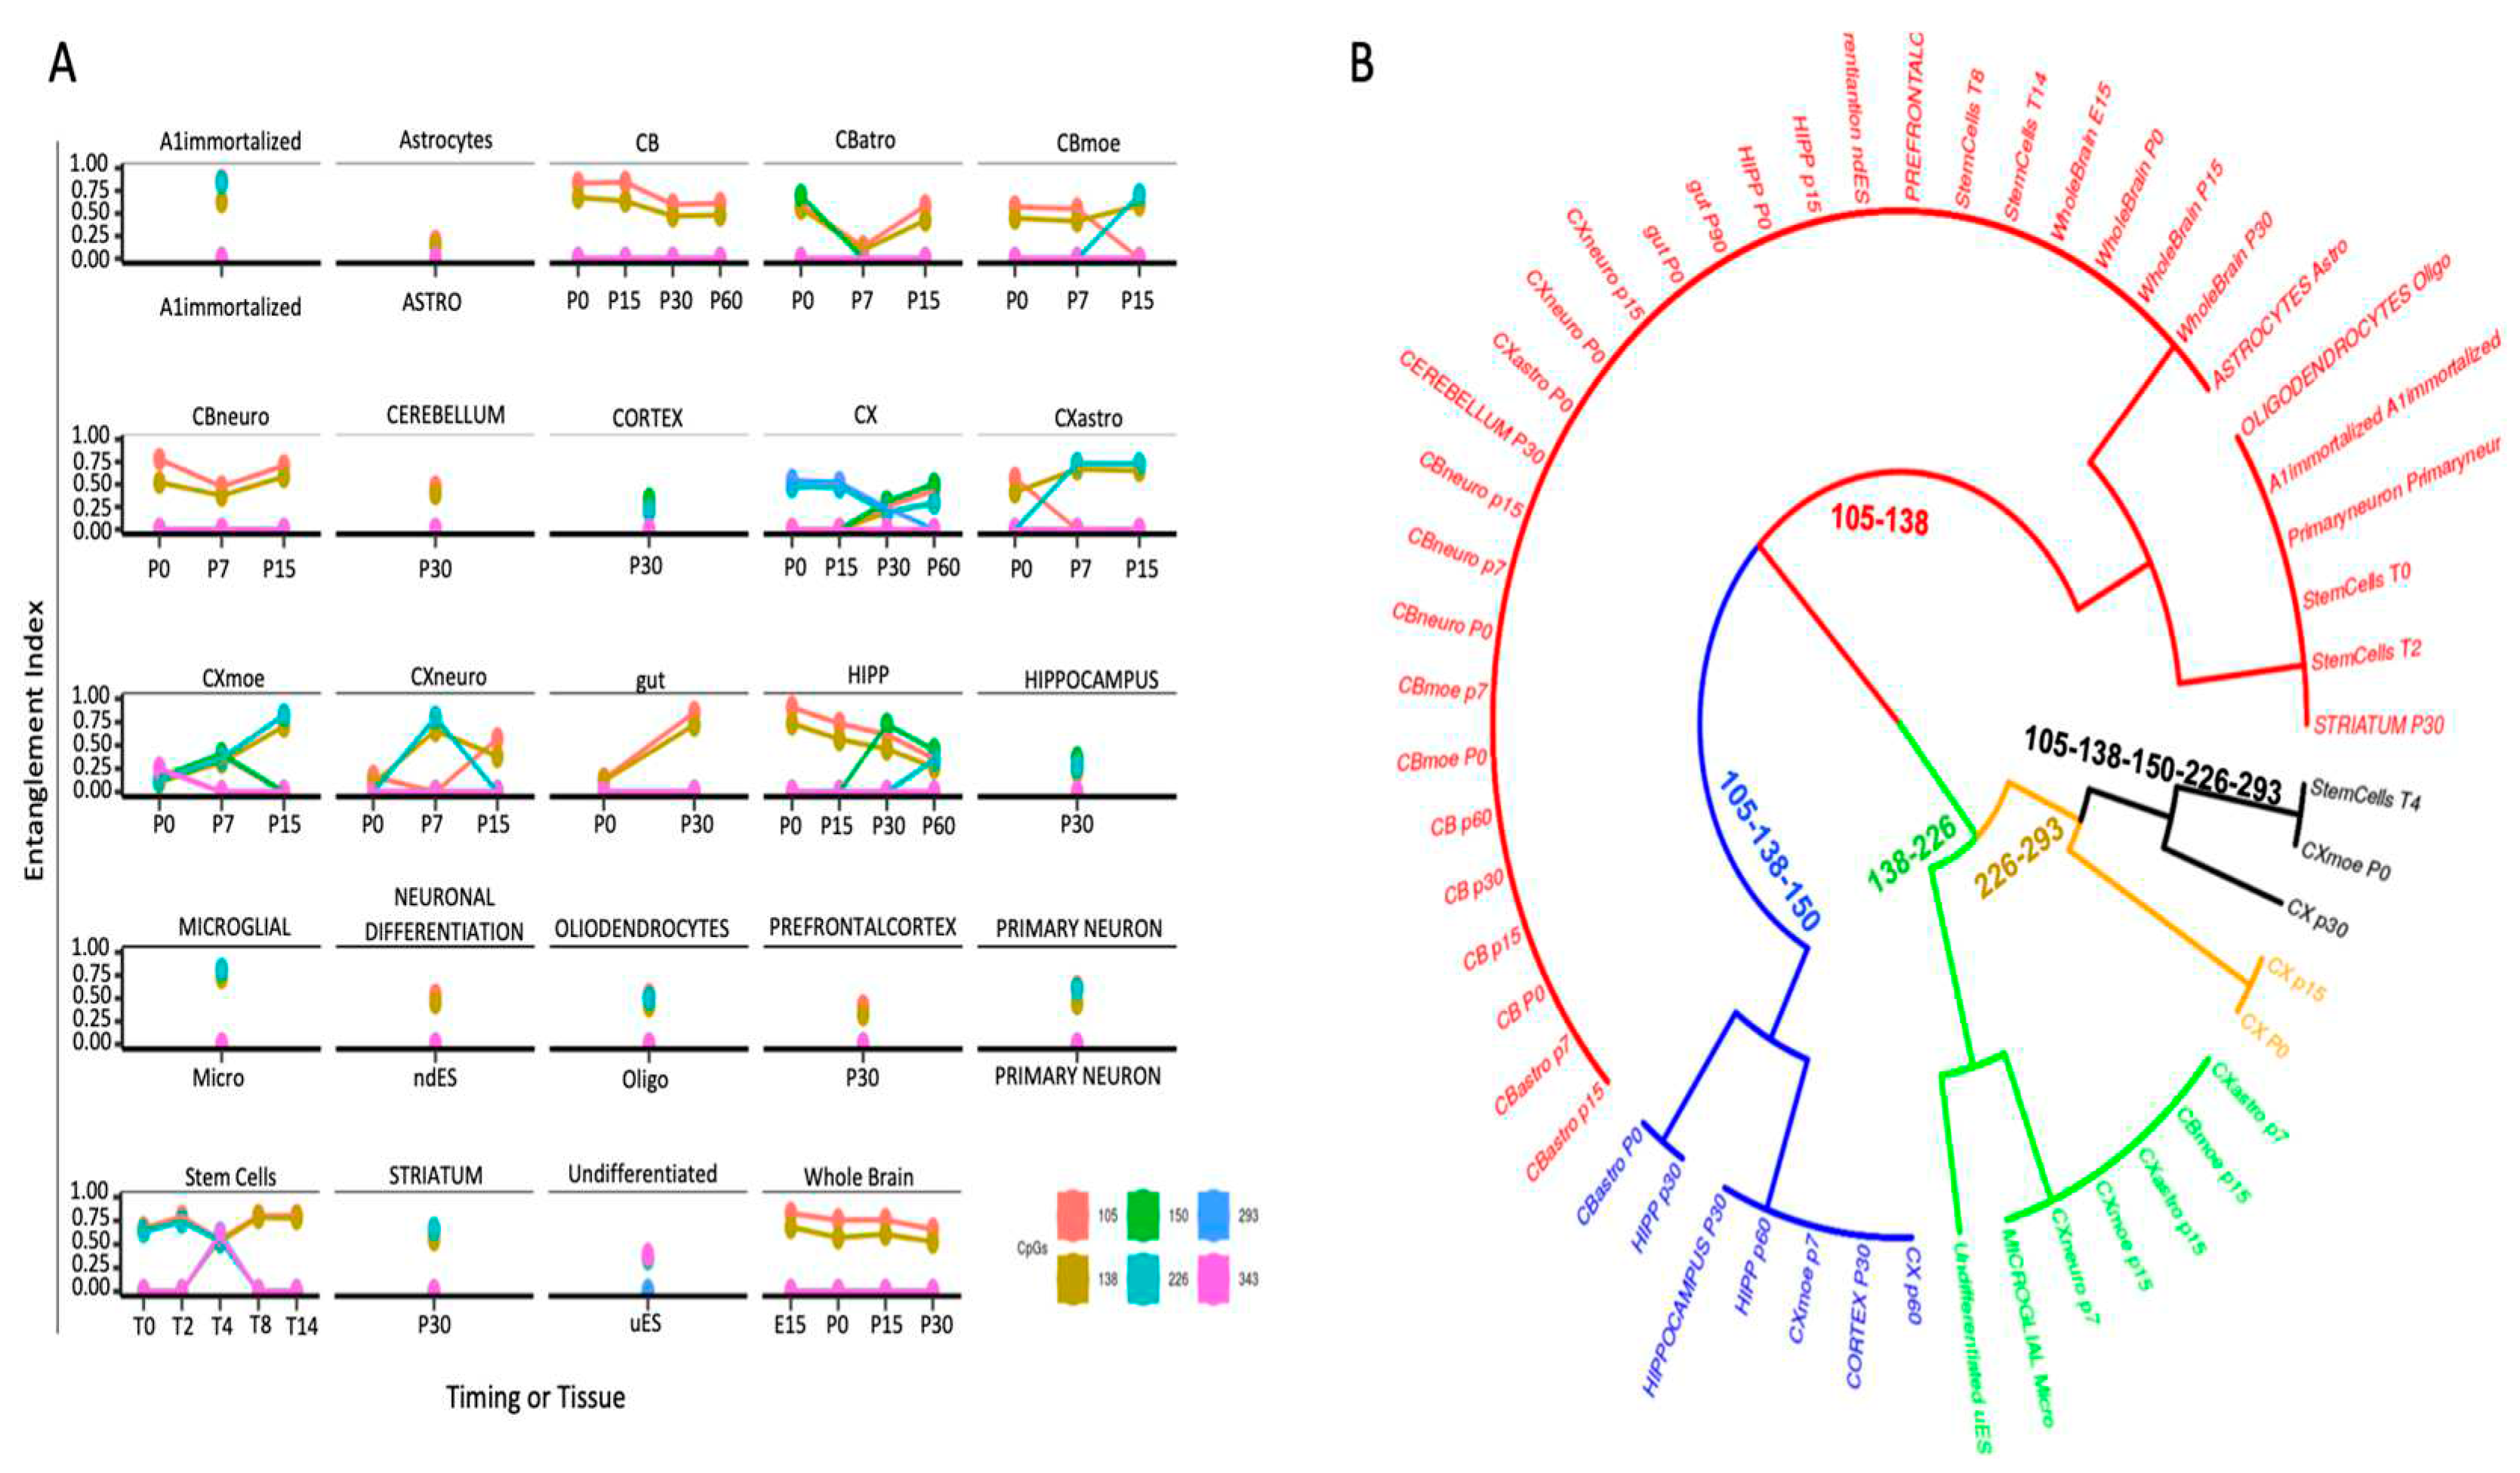
Taken together, these data suggest that the methylation cores in the promoter mark the genes that determine the cell identity. To strengthen this hypothesis, we further explored the presence of methylation cores in the region surrounding the promoter of the DDO gene in the whole brain during development (accession number PRJEB16320) [30,31]. In the 3Kb region surrounding the DDO locus, analyzed by dividing it into seven amplicons, we found changes in methylation and methylated core structures only upstream of the DDO promoter (-1000 to +1) (Figures S3-S6) [30]. Moreover, we found the same methylated core (105-138) in region R4, which overlaps our analyzed region in Figure 5 (Figure S5). To demonstrate that this core is associated with cell identity, we analyzed the methylation status of the DDO located in the R4 region in the DNA extracted from brain areas, several cell types isolated from the same brain areas, immortalized A1 neuronal cells, c-myc immortalized neurons at different passages and ESCs upon induction of neural differentiation [30] and and gut (Figure 6A) [30]. Strikingly, this core and its components mark all brain areas and the cells isolated from the same brain areas [10]. The correlation between the presence of the DDO methylation core and the brain areas and/or cells isolated from the same areas is shown in Figure 6B, in which each core component is identified by the location of the CpG (105-138-150-226-293 relative to the DDO transcription start site) and a color code that marks the specific cell type and the mouse brain area(s) a different time during postnatal differentiation. Specifically, this tree displays several branches that link cells or brain areas to the specific DDO core segments: 1. cells (neural differentiated ES/Oligodendrocytes/Astrocytes) and cerebellum/prefrontal/striatum area, (red, CpG 105-138); 2. cortex (black, CpG 105-138-150-226-293 and brown, CpG 226-293); 3. cortex/microglia/undifferentiated ES (green, CpG 138-226); 4. hippocampus (blue, 105-138-150).
3. Discussion
Specific memory mechanisms that regulate gene expression patterns epigenetically have evolved to establish and maintain cellular identity during development. Once determined, these lineage-specific expression profiles must be maintained across cell divisions, defining active or inactive gene expression states [32]. The most noticeable of these marks is the methylation of the carbon-5 of cytosine (5mC), which has traditionally been thought incompatible with active transcription when found near gene regulatory regions. 5mC can modulate transcription factor binding [33] or induce the binding of specific 5mC-binding proteins, which can lead to the recruitment of co-repressor complexes to methylated target promoters.
The data we have shown demonstrate that heterogeneity of methylation profiles at the promoter sites of genes expressed or silenced during mouse postnatal brain differentiation is apparently not substantial because we can identify stretches of 3 or 4 non-contiguous CpGs, which are present in the majority of sequences analyzed. However, considering that in a promoter segment, at low levels, every CpGs is transiently methylated and demethylated during transcription [4,8,10,15,16], every transcribed CpG is detectable as methyl-C when exposed to bisulfite [5]. By extracting non-contiguous significant CpGs methylated from pools of sequences, we identify methylated CpGs which are stable and highly frequent in the population (methylation cores or nuclei). These cores are statistically significant because they are present in molecules non-identical individually but derived from the same original precursor (epiallele family) [10]. We have identified several epiallele families in the promoters of 5 genes activated or repressed during postnatal mouse brain differentiation. These families are characterized by cores of 3- 4- 6- methylated CpGs that are found in various combinations in different cell types and brain areas. Progressive demethylation of these cores in the promoters of several genes involved in mouse brain postnatal differentiation is associated with the activation of transcription of specific cells and areas of differentiating mouse brain (BDNF, Figure 3). The contrary (progressive methylation) of the NANOG promoter is associated with silencing. However, we also find the presence of the promoter methylation core related to the activation of transcription in the GFAP promoter [21]. The best example of how a methylation core might associate with induction or timely inhibition of transcription is provided by the DDO promoter across 3Kb of a genomic region. DDO promoter displays a methylation core undergoing transient methylation early during differentiation (T4) followed by demethylation at late stages (T8-T14).
Moreover, we show that differentiated stem cells and neurons expressing DDO all acquire variants same original methylated core (Figure 6A), which in this case can be considered an identity marker of the precursor cell (Figure 6B). It is worth noting that single methylated CpG, entropy, or average methylation are not comparable and do not reveal this similarity (Figure S7). Unexpectedly, we find the same neural signature in the gut cells (Figure 6), suggesting that the enteric nervous system (ENS) derives from the migratory capacity of the neural crest [34,35].
We are aware that the main limitation of this study is the circumstantial nature of the evidence associated with the cell type identity and methylation cores in neurodevelopment. Although we did not demonstrate that methylation promoter profiles de facto silence or activate transcription, the promoter methylation cores we have identified are tightly associated with the dynamic expression profiles of 4 genes important in the development and differentiation of ES and mouse brain.
4. Materials and Methods
ESC culture and differentiation
E14Tg2a (BayGenomics) mouse ESCs were maintained as described elsewhere [36]. To induce neural differentiation, ESCs were plated onto gelatin-coated dishes at low density (1×10³-5×10³ cells/cm2) in the following differentiation medium: knockout DMEM supplemented with 10% KSR, 2 mM glutamine, 100 U/ml penicillin/streptomycin (Invitrogen), 0.1 mM β-mercaptoethanol (Sigma).
RT-PCR
Total RNAs were extracted using Trizol (Invitrogen). RNA (2 μg/reaction) was reverse-transcribed using M-MuLV reverse transcriptase (Biolabs). The list of primers is reported in supplementary material Table S1.
DNA extraction
DNA was extracted from cell pellets. DNA was prepared using DNeasy® Blood & Tissue Kit (Qiagen, Hilden, Germany), following the manufacturer's instructions. DNA was quality checked by 260/280 absorbance ratio using NanoDrop 2000 (Thermo Scientific) and quantified using Qubit® 2.0 Fluorometer with the dsDNA broad-range assay kit (Invitrogen, Q32850).
Bisulfite treatment and amplicon library preparation
Bisulfite treatment was performed using EZ DNA Methylation Kit (Zymo Research). Genomic DNA (2 μg) was converted with a “C/T conversion reagent” and eluted in 50 µl of H2O following the manufacturer's instruction. A double-step PCR strategy was used to generate an amplicon library of bisulfite-treated DNA sequenced by Illumina Miseq Sequencer to evaluate the DNA methylation levels. The quality of each amplicon was checked by Agilent 2100 Bioanalyzer using the DNA 1000 Kit (Agilent Technologies, Santa Clara, CA), according to the manufacturer's instructions. Amplicons were pooled at an equimolar ratio and then diluted to a final concentration of 8 picomolar. Phix control libraries (Illumina) were combined with normalized library [15% (v/v)] to increase the diversity of base calling during sequencing. The amplicon library was subjected to sequencing using V3 reagent kits on the Illumina MiSeq system (Illumina). Paired-end sequencing was performed in 281 cycles per read (281×2). An average of 210,000 reads/sample were used for further analysis. The bisulfite conversion rate was estimated as 98–99%, as calculated by spike-in experiments performed by adding fully unmethylated M13mp18 double-strand DNA (New England BioLabs) in 10 representative samples (primers pairs are reported in Table 1). The list of primers is reported in supplementary material Table S1.
Sequence handling
Paired-end reads in FASTQ format from the ENA database (accession number: PRJEB16320) and produced in our lab were merged using the PEAR (paired-end read merger) tool, setting a minimum of 40 nucleotides as the overlapping region. We retained only those reads with a mean quality score (Phred) >33 and a length between 400 and 500 nucleotides. The resulting reads were then converted in FASTA format using the PRINSEQ (preprocessing and information of sequence) tool. To extract mCpG configurations in single DNA molecules reads in FASTA format were processed using ampliMethProfiler (available at https://sourceforge.net/projects/amplimethprofiler/) applying several quality filters. We retained only reads characterized by (i) length ±50% compared with the reference length, (ii) at least 80% sequence similarity of the primer with the corresponding gene, (iii) at least 98% bisulfite efficiency, and (iv) alignment of at least 60% of their bases with the reference sequences. The methylation status of all cytosines in the CpG sequence context is coded as methylated (1) or unmethylated (0). Reads with ambiguous calls (including gaps or A or G) at the CpG dinucleotide were removed. The data, in binary formats, were successively analyzed with the MethCoresProfiler [10].
Statistical analysis
Methylation average data are expressed as means ± standard deviation. Comparisons between 2 groups were performed using the unpaired Student t-test. Multiple comparisons were made by 1-way ANOVA followed by the Tukey post-hoc test. A P-value ≤ 10^-10 was considered statistically significant. Pearson correlation test was used to assess the relationship among the epialleles distribution within each stages group. PCA was performed on the abundance of each 64 epialleles in the analyzed cell population. PC1 explained 31.2%, and PC2 explained 29% of the observed variance. All statistical analyses were performed using JMP software (SAS, Cary, NC).
5. Conclusions
DNA methylation is an epigenetic modification essential for mammalian development and is crucial for establishing and maintaining cellular identity. Active DNA methylation and demethylation occur during cell fate commitment and terminal differentiation. Recent data provide insights into the contribution of several epigenetic factors and DNA methylation to establishing cellular memory during embryonic development and the modulation of cell type-specific gene regulatory programs to ensure proper differentiation [38]. Here, we demonstrated that the configurations of methyl-CpGs (methylated nuclei) define cellular identity and correlate with the regulation of gene expression.
Supplementary Materials
The following supporting information can be downloaded at the website of this paper posted on Preprints.org.
Author Contributions
M.C. and F.P. performed in vitro experiments. T.I., V.M., M.V., and A.F. performed bioinformatic analysis, analyzed the results, and prepared figures. F.P., M.C., A.Porcellini and A.Pezone supervised the experiments, analyzed the results, and provided scientific interpretations; A.Pezone wrote the paper. All authors discussed the results and provided input on the manuscript.
Funding
This work was partly supported by Fondazione Medicina Molecolare e Terapia Cellulare, Universita’ Politecnica delle Marche; Epigenomics Flagship Project—EPIGEN, C.N.R. Funding for open access charge: Epigenomics Flagship Project, Fondazione Cariplo Ricerca Biomedica sulle malattie legate all’invecchiamento, ref. 2016-1031, and the POR Campania FESR 2014-2020 “SATIN” grant. A.Pezone is supported by the Italian Ministry of University and Scientific Research (P.R.I.N. 2017237P5x).
Institutional Review Board Statement
Not applicable.
Informed Consent Statement
Not applicable.
Data Availability Statement
The datasets generated for this study are available to the corresponding author upon request.
Acknowledgments
The authors thank Enrico Vittorio Avvedimento for revising the manuscript and discussing dynamic epigenetics and cell identity.
Conflicts of Interest
The authors declare no conflict of interest.
References
- Moore, L., Le, T. & Fan, G. DNA Methylation and Its Basic Function. Neuropsychopharmacol 38, 23–38 (2013). [CrossRef]
- Tramontano A., Boffo F.L., Russo G., De Rosa M., Iodice I., Pezone A. Methylation of the suppressor gene: mechanism and consequences. Biomolecules. 2020; 10:446.
- Jin B, Ernst J, Tiedemann RL, et al. Linking DNA methyltransferases to epigenetic marks and nucleosome structure genome-wide in human tumor cells. Cell Rep. 2012;2(5):1411-1424. [CrossRef]
- Huang Y., Pastor W.A., Shen Y., Tahiliani M., Liu D.R., Rao A. The behavior of 5-hydroxymethylcytosine in bisulfite sequencing. PLoS One. 2010; 5:e8888.
- Rasmussen KD, Helin K. Role of TET enzymes in DNA methylation, development, and cancer. Genes Dev. 2016 Apr 1;30(7):733-50. PMID: 27036965; PMCID: PMC4826392. [CrossRef]
- Huang Y, Pastor WA, Shen Y, Tahiliani M, Liu DR, Rao A. The behavior of 5-hydroxymethylcytosine in bisulfite sequencing. PLoS One. 2010;5(1):e8888. Published 2010 Jan 26. [CrossRef]
- Song CX, He C. Potential functional roles of DNA demethylation intermediates. Trends Biochem Sci. 2013;38(10):480-484. [CrossRef]
- Xie H., Wang M., de Andrade A., Bonaldo M. de F., Galat V., Arndt K., Soares M.B. Genome-wide quantitative assessment of variation in DNA methylation patterns. Nucleic Acids Res. 2011; 39:4099–4108. [CrossRef]
- Barros-Silva D, Marques CJ, Henrique R, Jerónimo C. Profiling DNA Methylation Based on Next-Generation Sequencing Approaches: New Insights and Clinical Applications. Genes (Basel). 2018 Aug 23;9(9):429. PMID: 30142958; PMCID: PMC6162482. [CrossRef]
- Pezone A, Tramontano A, Scala G, et al. Tracing and tracking epiallele families in complex DNA populations. NAR Genom Bioinform. 2020;2(4):lqaa096. Published 2020 Nov 16. [CrossRef]
- Podobinska M, Szablowska-Gadomska I, Augustyniak J, Sandvig I, Sandvig A, Buzanska L. Epigenetic Modulation of Stem Cells in Neurodevelopment: The Role of Methylation and Acetylation. Front Cell Neurosci. 2017;11:23. Published 2017 Feb 7. [CrossRef]
- Kim M., Costello J. DNA methylation: an epigenetic mark of cellular memory. Exp. Mol. Med. 2017; 49:e322.
- Basu, A., Tiwari, V.K. Epigenetic reprogramming of cell identity: lessons from development for regenerative medicine. Clin Epigenet 13, 144 (2021). [CrossRef]
- Yang, Y.; Fan, X.; Yan, J.; Chen, M.; Zhu, M.; Tang, Y.; Liu, S.; Tang, Z. A comprehensive epigenome atlas reveals DNA methylation regulating skeletal muscle development. Nucleic Acids Res. 2021, 49, 1313–1329. [CrossRef]
- Li S, Garrett-Bakelman F, Perl AE, et al. Dynamic evolution of clonal epialleles revealed by methclone. Genome Biol. 2014;15(9):472. Published 2014 Sep 27. [CrossRef]
- Li S, Garrett-Bakelman FE, Chung SS, et al. Distinct evolution and dynamics of epigenetic and genetic heterogeneity in acute myeloid leukemia. Nat Med. 2016;22(7):792-799. [CrossRef]
- Shannon C.E. A mathematical theory of communication. Bell Syst. Tech. J. 1948; 27:379–423.
- Verma R, Liu J, Holland MK, Temple-Smith P, Williamson M, Verma PJ. Nanog is an essential factor for induction of pluripotency in somatic cells from endangered felids. Biores Open Access. 2013;2(1):72-76. [CrossRef]
- Radwitz J, Hausrat TJ, Heisler FF, Janiesch PC, Pechmann Y, Rübhausen M, Kneussel M. Tubb3 expression levels are sensitive to neuronal activity changes and determine microtubule growth and kinesin-mediated transport. Cell Mol Life Sci. 2022 Oct 29;79(11):575. PMID: 36309617; PMCID: PMC9617967. [CrossRef]
- Errico F, Cuomo M, Canu N, Caputo V, Usiello A. New insights on the influence of free d-aspartate metabolism in the mammalian brain during prenatal and postnatal life. Biochim Biophys Acta Proteins Proteom. 2020;1868(10):140471. [CrossRef]
- Jurga AM, Paleczna M, Kadluczka J, Kuter KZ. Beyond the GFAP-Astrocyte Protein Markers in the Brain. Biomolecules. 2021 Sep 14;11(9):1361. PMID: 34572572; PMCID: PMC8468264. [CrossRef]
- Bathina S, Das UN. Brain-derived neurotrophic factor and its clinical implications. Arch Med Sci. 2015 Dec 10;11(6):1164-78. Epub 2015 Dec 11. PMID: 26788077; PMCID: PMC4697050. [CrossRef]
- Busskamp V, Lewis NE, Guye P, et al. Rapid neurogenesis through transcriptional activation in human stem cells. Mol Syst Biol. 2014;10(11):760. Published 2014 Nov 17. [CrossRef]
- Pang ZP, Yang N, Vierbuchen T, et al. Induction of human neuronal cells by defined transcription factors. Nature. 2011;476(7359):220-223. Published 2011 May 26. [CrossRef]
- Raspaglio G, Petrillo M, Martinelli E, et al. Sox9 and Hif-2α regulate TUBB3 gene expression and affect ovarian cancer aggressiveness. Gene. 2014;542(2):173-181. [CrossRef]
- He M, Wang J. Decreased serum brain-derived neurotrophic factor in Chinese patients with Type 2 diabetes mellitus. Acta Biochim Biophys Sin (Shanghai). 2014;46(5):426-427. [CrossRef]
- Mamber C, Kamphuis W, Haring NL, Peprah N, Middeldorp J, Hol EM. GFAPδ expression in glia of the developmental and adolescent mouse brain. PLoS One. 2012;7(12):e52659. [CrossRef]
- Ahmed AI, Shtaya AB, Zaben MJ, Owens EV, Kiecker C, Gray WP. Endogenous GFAP-positive neural stem/progenitor cells in the postnatal mouse cortex are activated following traumatic brain injury. J Neurotrauma. 2012;29(5):828-842. [CrossRef]
- Koga R., Miyoshi Y., Sakaue H., Hamase K., Konno R. Mouse D-amino-acid oxidase: distribution and physiological substrates. Front.Mol. Biosci. 2017; 4:82. [CrossRef]
- Florio E, Keller S, Coretti L, et al. Tracking the evolution of epialleles during neural differentiation and brain development: D-Aspartate oxidase as a model gene. Epigenetics. 2017;12(1):41-54. [CrossRef]
- Punzo D, Errico F, Cristino L, et al. Age-Related Changes in D-Aspartate Oxidase Promoter Methylation Control Extracellular D-Aspartate Levels and Prevent Precocious Cell Death during Brain Aging. J Neurosci. 2016;36(10):3064-3078. [CrossRef]
- Breiling, A., Lyko, F. Epigenetic regulatory functions of DNA modifications: 5-methylcytosine and beyond. Epigenetics & Chromatin 8, 24 (2015). [CrossRef]
- Luo C, Hajkova P, Ecker JR. Dynamic DNA methylation: In the right place at the right time. Science. 2018;361(6409):1336-1340. [CrossRef]
- Fuentealba L.C., Rompani S.B., Parraguez J.I., Obernier K., Romero R., Cepko C.L., Alvarez-Buylla A. Embryonic origin of postnatal neural stem cells. Cell. 2015; 161:1644–1655. [CrossRef]
- Anderson RB, Newgreen DF, Young HM. Neural Crest and the Development of the Enteric Nervous System. In: Madame Curie Bioscience Database [Internet]. Austin (TX): Landes Bioscience; 2000-2013. Available from: https://www.ncbi.nlm.nih.gov/books/NBK6273/.
- Niwa, H., Miyazaki, Ji. & Smith, A. Quantitative expression of Oct-3/4 defines differentiation, dedifferentiation or self-renewal of ES cells. Nat Genet 24, 372–376 (2000). [CrossRef]
- Maltsev VA, Rohwedel J, Hescheler J, Wobus AM. Embryonic stem cells differentiate in vitro into cardiomyocytes representing sinusnodal, atrial and ventricular cell types. Mech Dev. 1993;44(1):41-50. [CrossRef]
- Mònica Suelves, Elvira Carrió, Yaiza Núñez-Álvarez, Miguel A. Peinado, DNA methylation dynamics in cellular commitment and differentiation, Briefings in Functional Genomics, Volume 15, Issue 6, November 2016, Pages 443–453. [CrossRef]
Figure 1.
Methylation of NANOG promoter during stem cell differentiation. (A) The structure of the NANOG promoter. All CpGs upstream the transcription start site (TSS) are shown as black lines and circles. (B) Average methylation of the 6 CpGs shown in (A) in the DNA during stem cell differentiation at different time points (T0, T2, T4, T8, and T14, CpGs are indicated as color-coded squares on the right. (C) Average methylation of each CpG shown in (A). (D) Shannon entropy of the methylated molecules in the same samples and time points. (E) The structure and the composition of the methylated cores at different time points. Each CpG is labeled with a color code on the panel's right side. (F) Frequency of methylated core in the total population. (G) Gene expression analysis. A pairwise comparison between each pair was performed with the student’s t-test: *P < 0.05 versus T0.
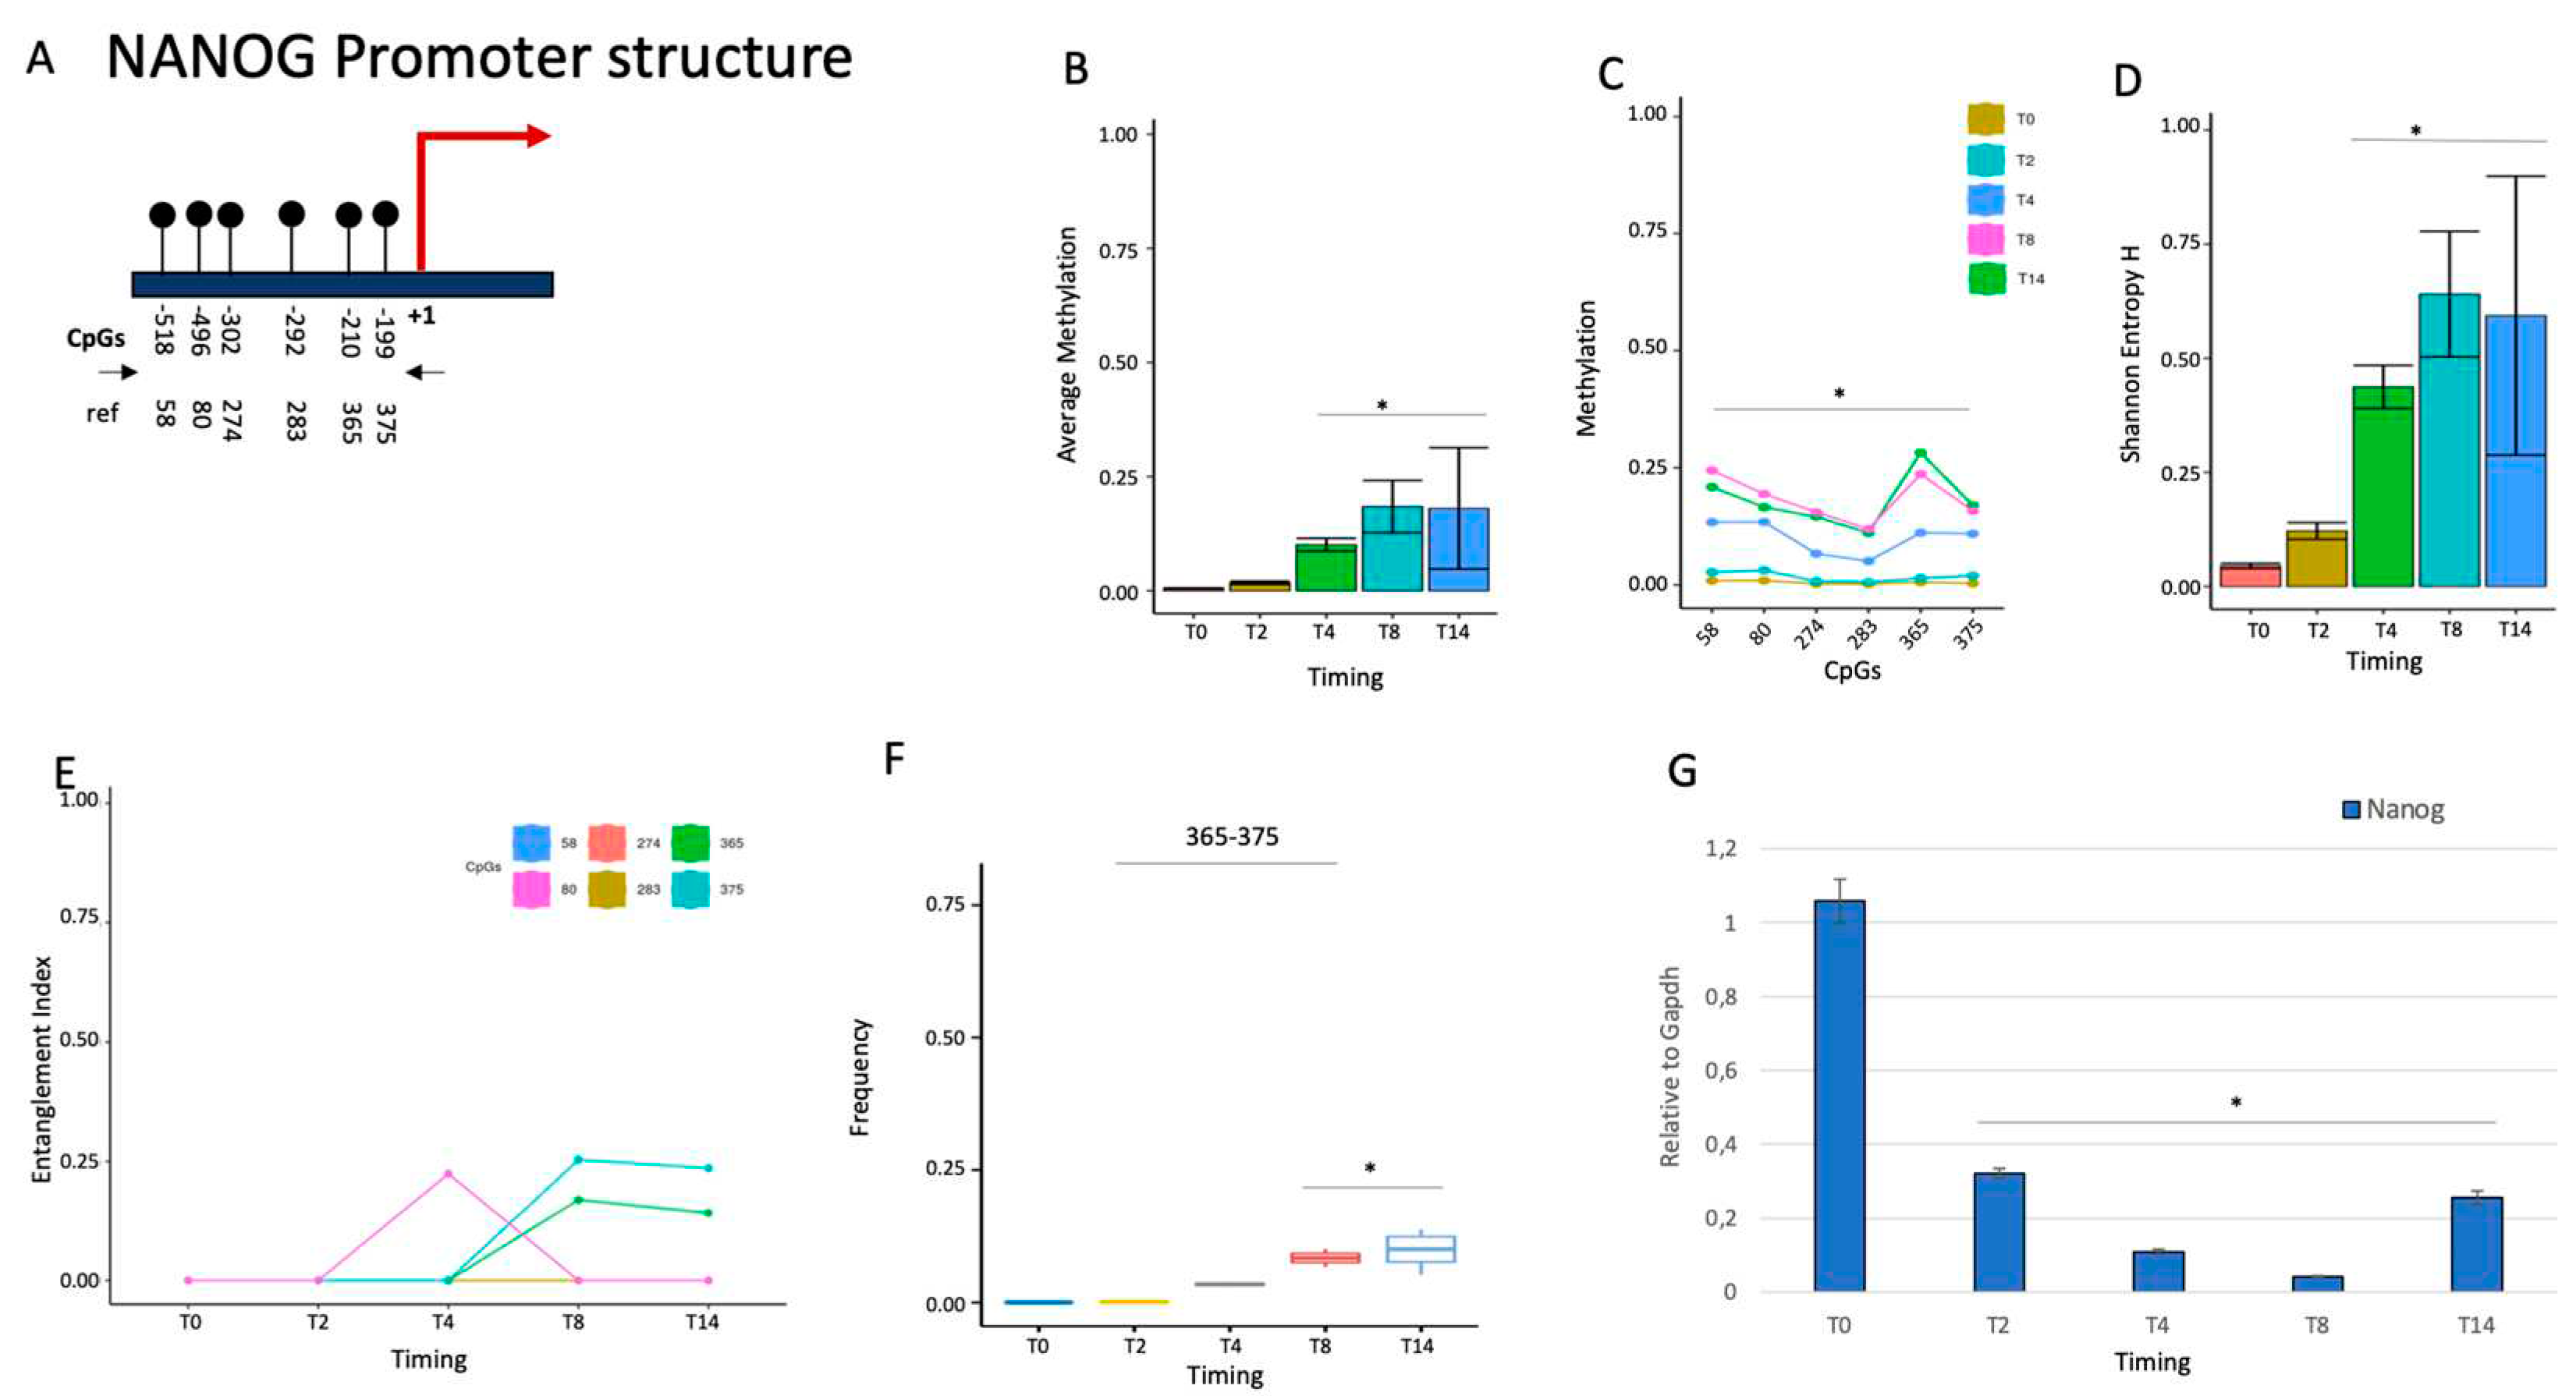
Figure 2.
Methylation configuration of TUBB3 promoter during stem cell differentiation. (A) Structure of the TUBB3 promoter. All CpGs are shown as black lines and circles. (B) Average methylation of the 18 CpGs shown in (A) during stem cell differentiation at different time points (T0, T2, T4, T8, and T14, color-coded squares on the right). (C) Average methylation of each CpG in the populations of molecules. (D) Shannon entropy of the methylated molecules in the same samples and time points. (E) The structure and the composition of the methylated cores at different time points. Each CpG is labeled with a color code on the panel's right side. (F) Frequency of methylated core in the total population. (G) Gene expression analysis. A pairwise comparison between each pair was performed with the student’s t-test: *P < 0.05 versus T0.
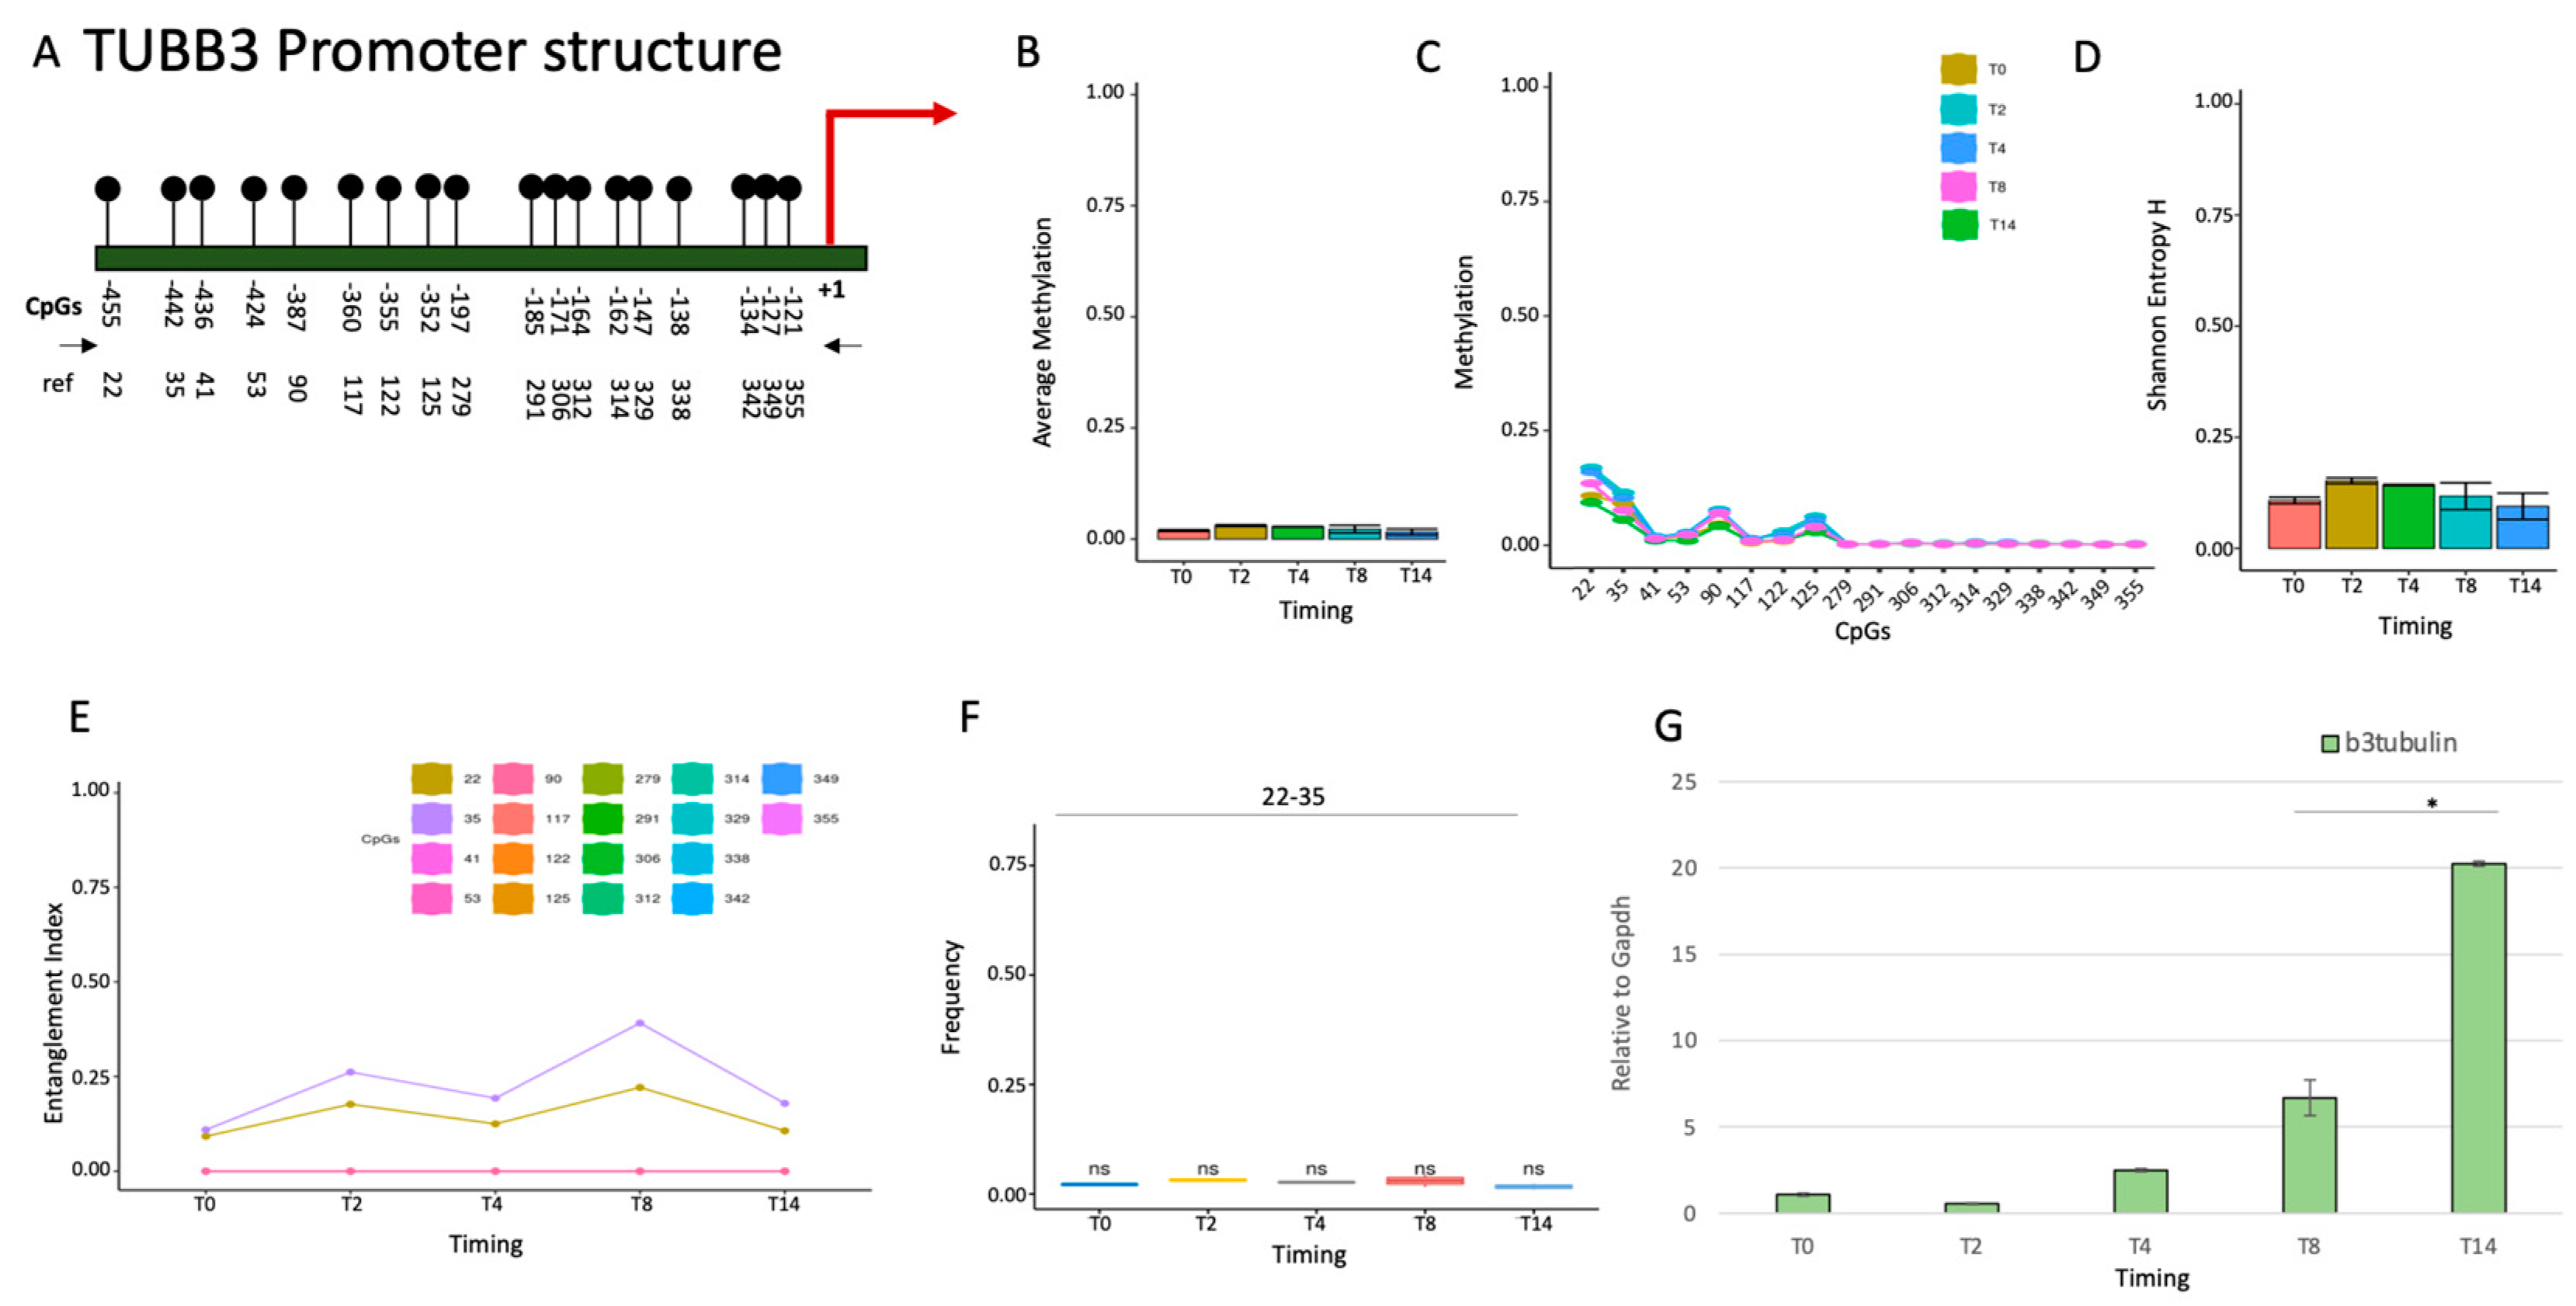
Figure 3.
Methylation configuration of BDNF promoter during stem cell differentiation. (A) Structure of the BDNF promoter. The CpGs are shown as black lines and circles. (B) Average methylation of the 13 CpGs shown in (A) in the DNA during stem cell differentiation at different time points (T0, T2, T4, T8, and T14, color-coded squares on the right). (C) Average methylation of each CpG indicated in A. (D) Shannon entropy of the methylated molecules in the same samples and time points. (E) The structure and the composition of the methylated cores at different time points. Each CpG is labeled with a color code on the panel's right side. (F) Frequency of methylated core in the total population. (G) Gene expression analysis. A pairwise comparison between each pair was performed with the student’s t-test: *P < 0.05 versus T0.
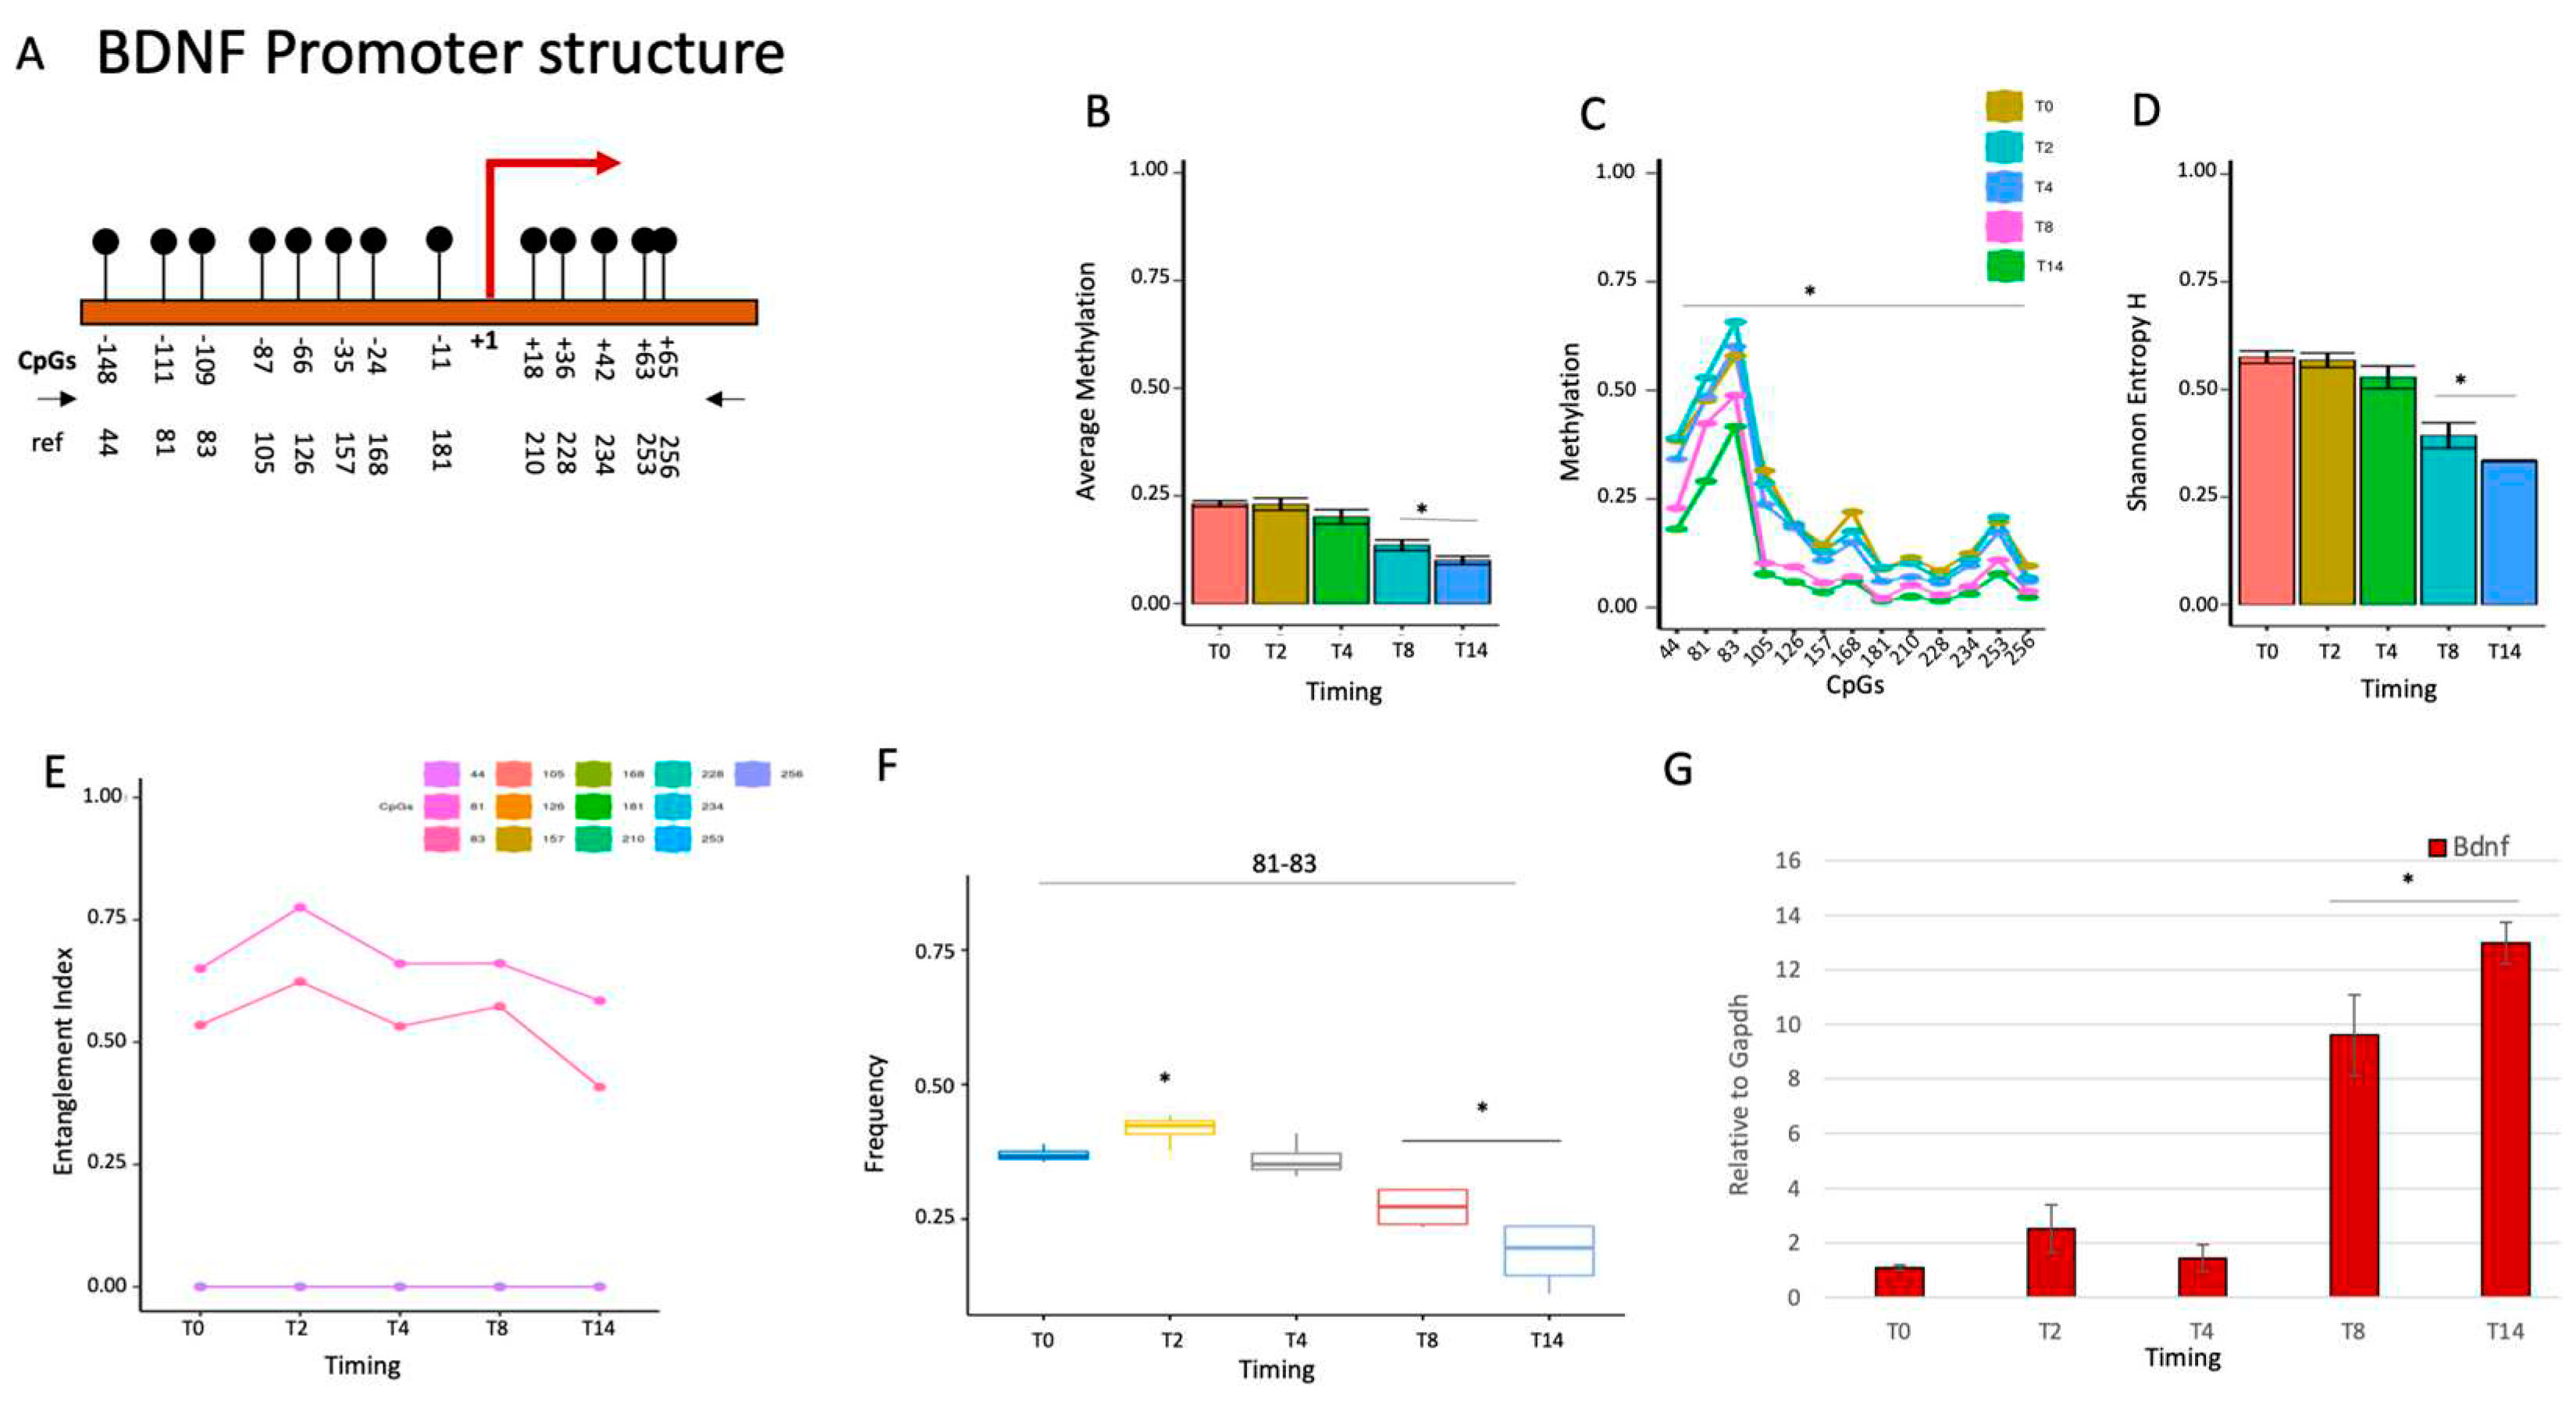
Figure 4.
Methylation configuration of GFAP promoter during stem cell differentiation. (A) Structure of the NANOG promoter. The CpGs are shown as black lines and circles. (B) Average methylation of the 12 CpGs shown in (A) in cells during stem cell differentiation at different time points (T0, T2, T4, T8, and T14, color-coded squares on the right). (C) Average methylation of each CpG as shown in (A). (D) Shannon entropy of the methylated molecules in the same samples and time points. (E) The structure and the composition of the methylated cores at different time points. Each CpG is labeled with a color code on the panel's right side.(F) Frequency of the methylated core in the total population. A pairwise comparison between each pair was performed with the student’s t-test: *P < 0.05 versus T0.
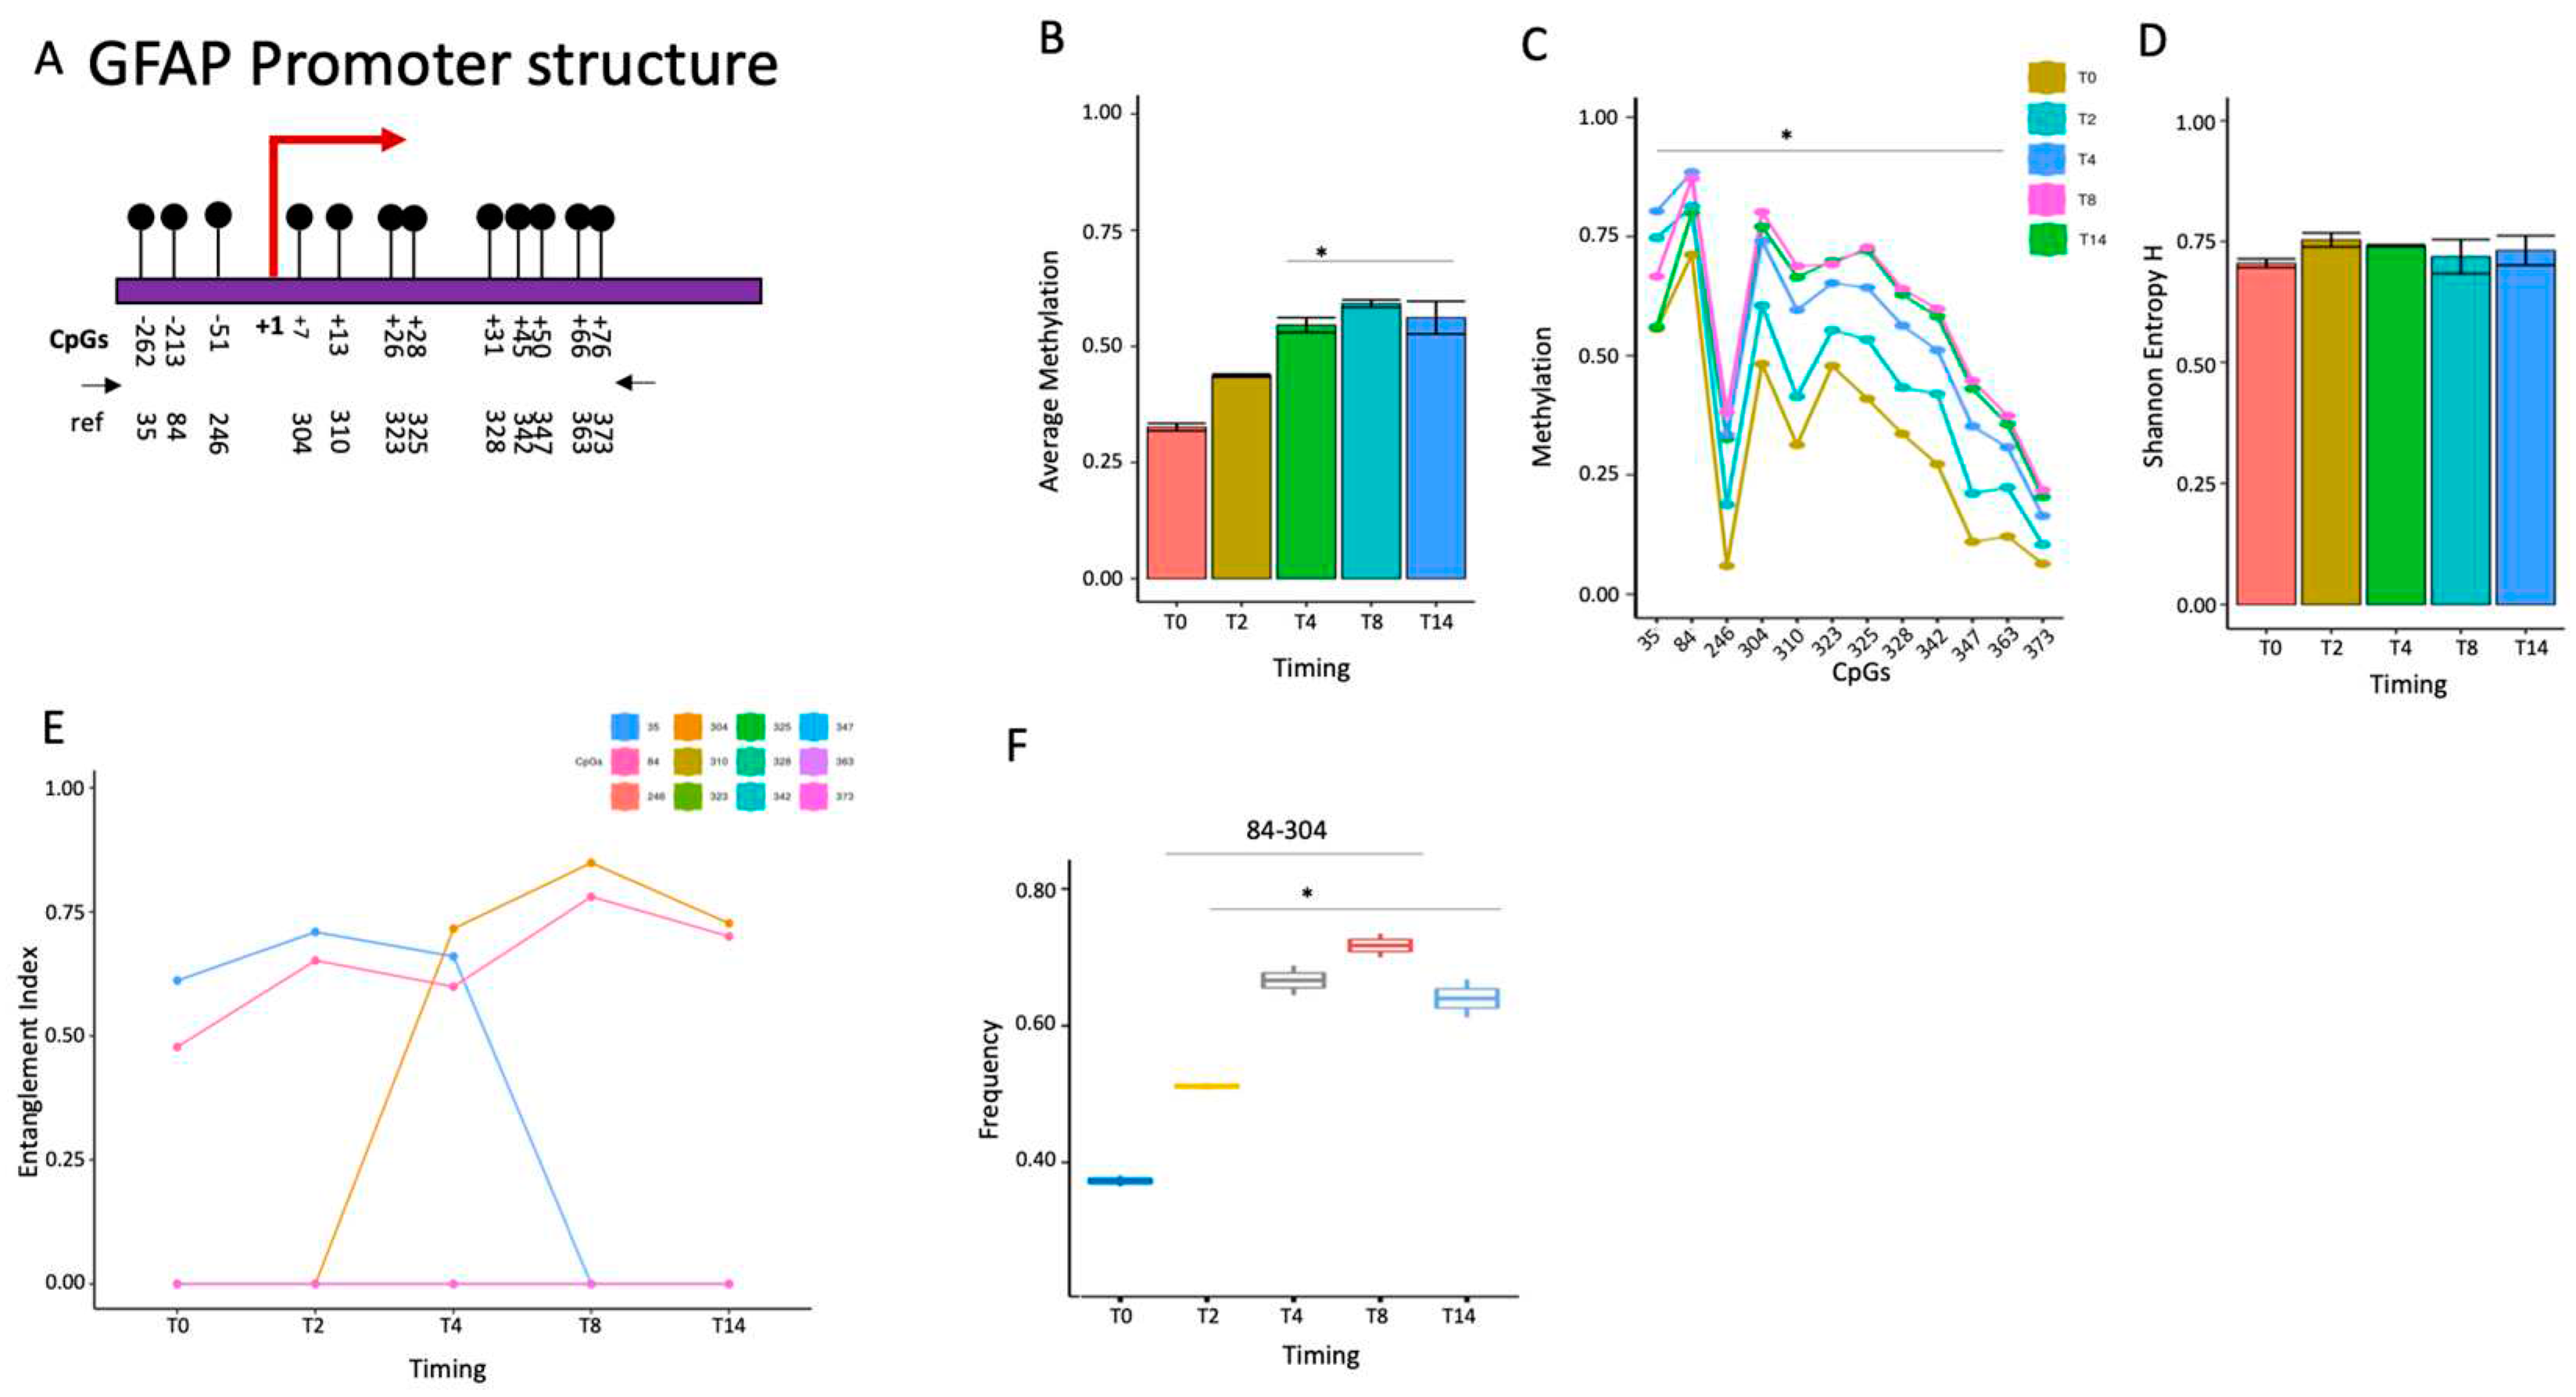
Figure 5.
Methylation status of DDO promoters during stem cell differentiation. (A) Structure of the DDO promoter. The CpGs are shown as black lines and circles. (B) Average methylation of the 6 CpGs shown in (A) in the DNA extracted during stem cell differentiation at different time points (T0, T2, T4, T8, and T14, color-coded squares on the right). (C) Average methylation of each CpG identified as shown in (A) in the populations of molecules. (D) Shannon entropy of the methylated molecules in the same samples and time points. (E)The structure and the composition of the methylated cores at different time points. Each CpG is labeled with a color code on the panel's right side. (F) Frequency of methylated core in the total population. A pairwise comparison between each pair was performed with the student’s t-test: *P < 0.05 versus T0.
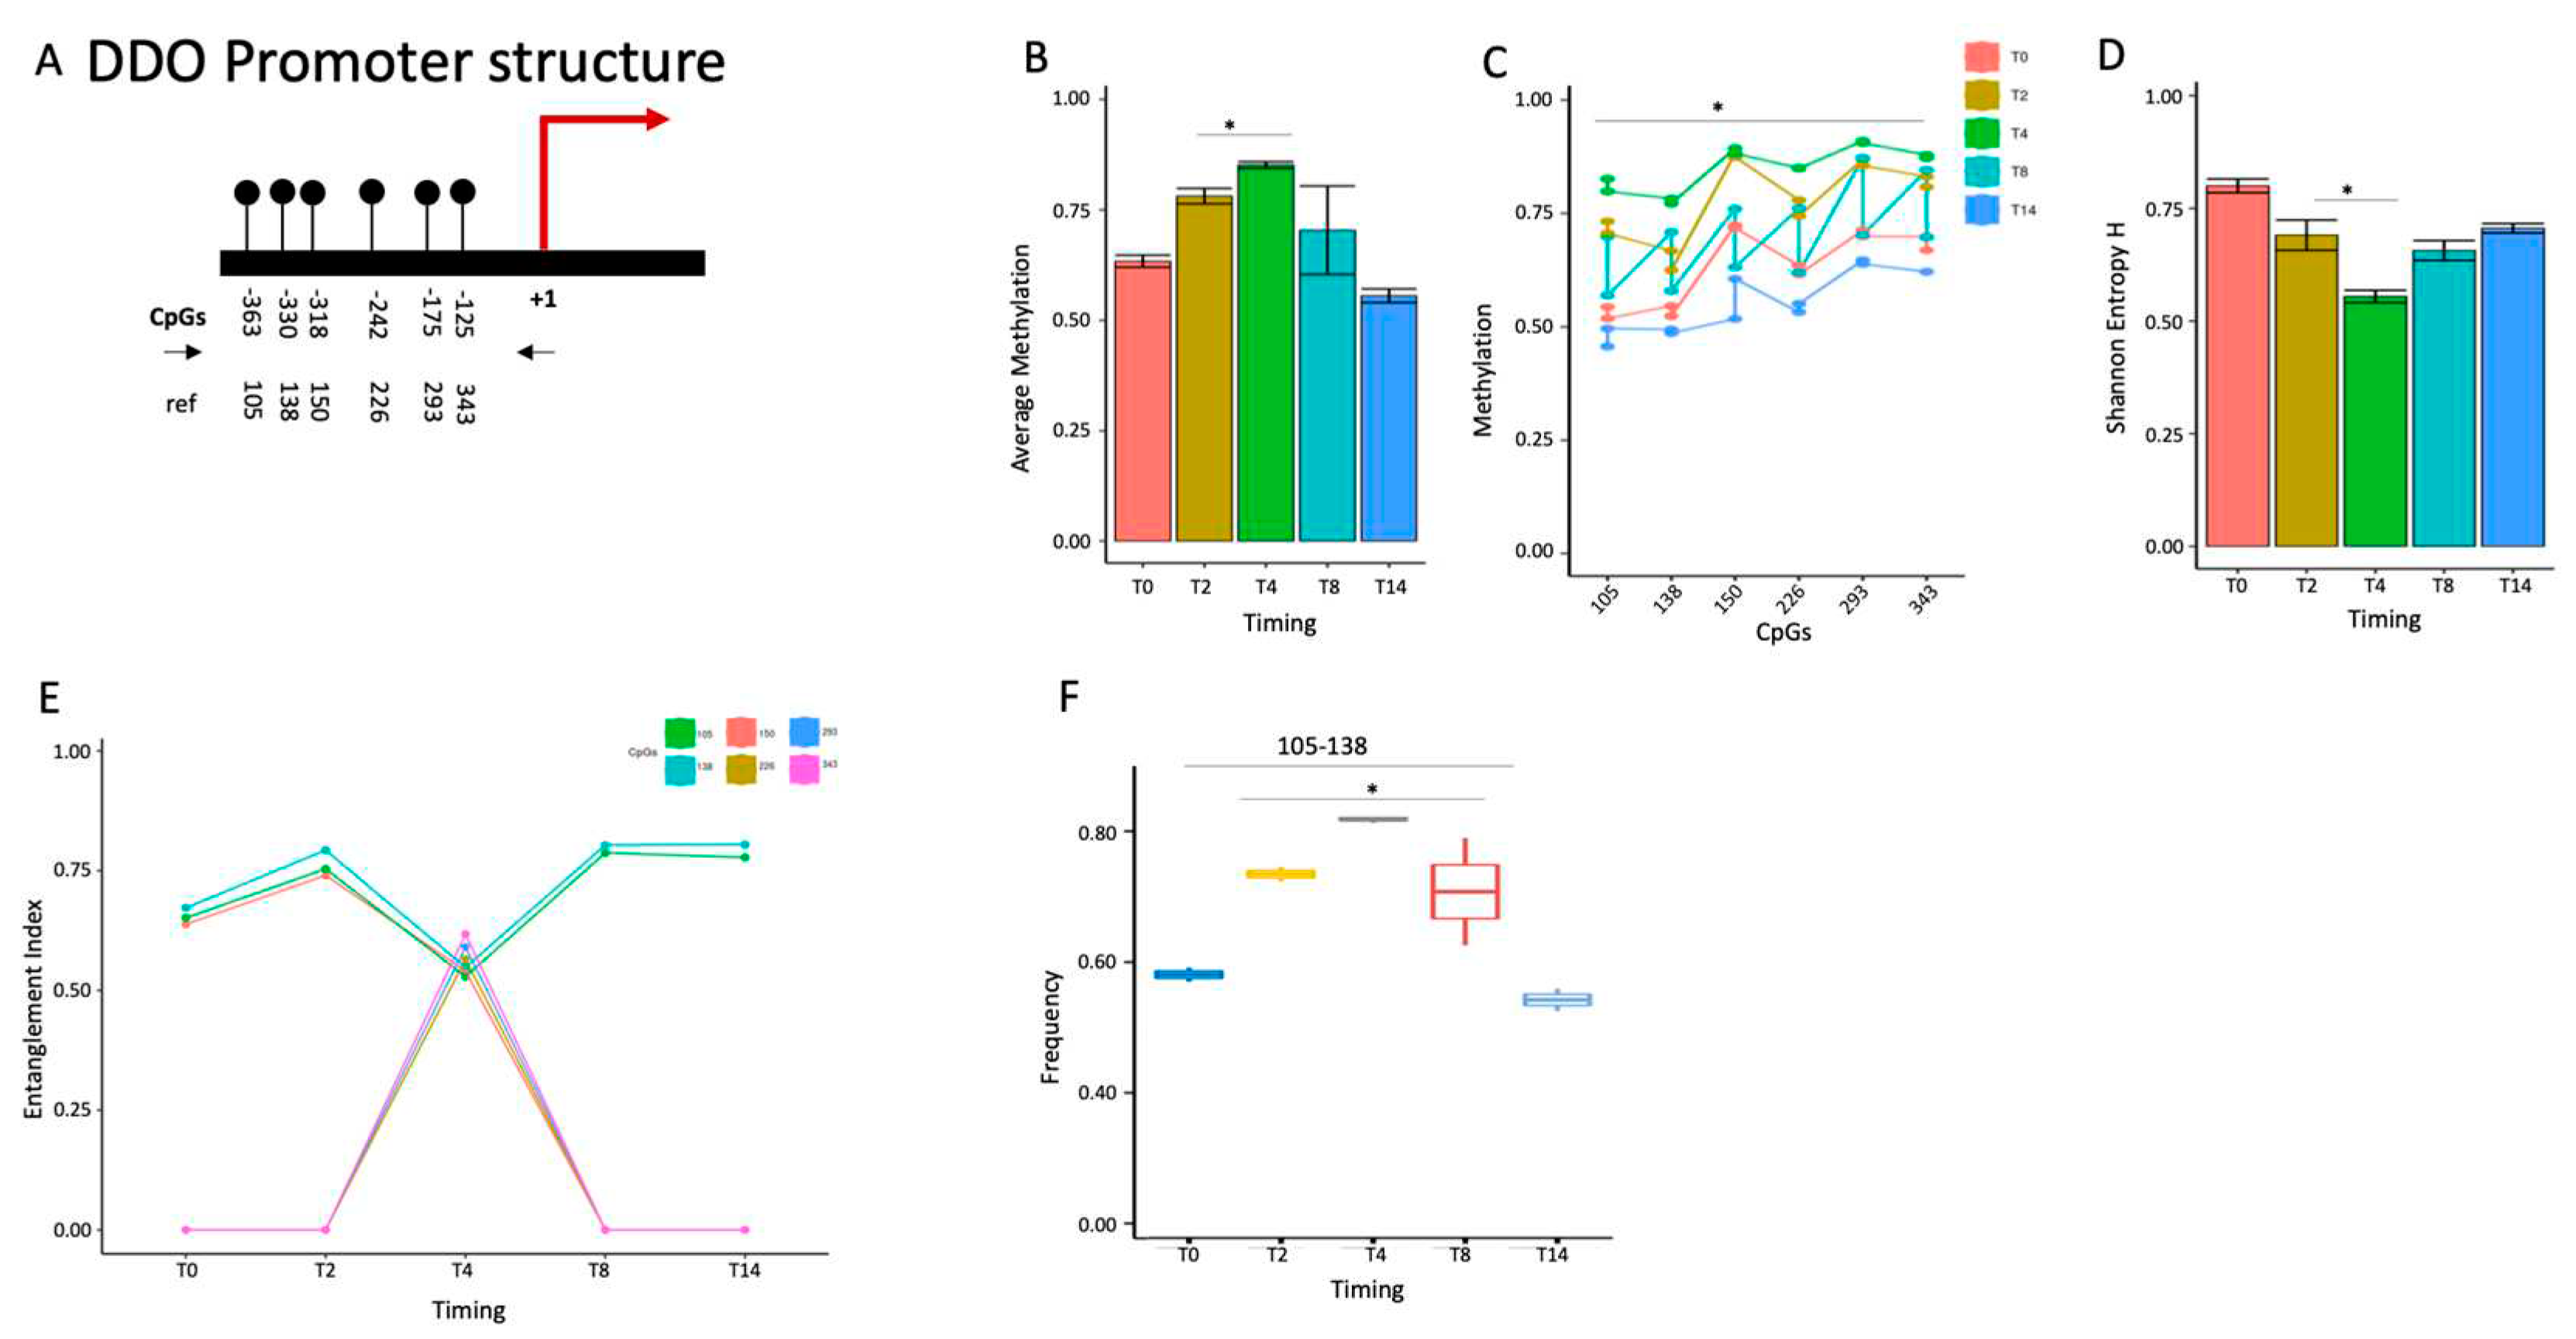
Figure 6.
The methyl-CpG configurations of the DDO promoter define cell identity. (A) The structure and the composition of the DDO promoter methylated core at different time points in isolated cell populations and mouse brain areas (Figure S5). Each CpG is labeled with a color code on the panel’s right side. (B) A phylogenetic tree that represents cell identity relationships and methyl-CpGs configuration.
Disclaimer/Publisher’s Note: The statements, opinions and data contained in all publications are solely those of the individual author(s) and contributor(s) and not of MDPI and/or the editor(s). MDPI and/or the editor(s) disclaim responsibility for any injury to people or property resulting from any ideas, methods, instructions or products referred to in the content. |
© 2023 by the authors. Licensee MDPI, Basel, Switzerland. This article is an open access article distributed under the terms and conditions of the Creative Commons Attribution (CC BY) license (http://creativecommons.org/licenses/by/4.0/).
Copyright: This open access article is published under a Creative Commons CC BY 4.0 license, which permit the free download, distribution, and reuse, provided that the author and preprint are cited in any reuse.


