Submitted:
23 May 2023
Posted:
25 May 2023
You are already at the latest version
Preprints on COVID-19 and SARS-CoV-2
Abstract
Abstract. Background: COVID-19's first victim was announced by Chinese health authorities on the 11th of January 2020. On January 13, the first official case was reported outside China, in Thailand. On January 25, the same occurred in São Paulo and on March 8, the first case was recorded in Minas Gerais. From that point onwards until the 3rd of October 2020, a total of 370,911 cases and 9,204 deaths were recorded in the state. This study aims to investigate spatiotemporal patterns of COVID-19 with incidence from March 22 to October 3 of 2020. Methods: The database itself was obtained from Health Division of Minas Gerais state. The vulnerability index was calculated using a principal component analysis. Moran's I autocorrelation was tested, z-score and P-value < 0.05. Results: From March 22 to October 3 of 2020 the incidence level varied from 45.680/100,000 to 312.130/100,000. The most influential variables were: illiteracy, gross domestic product and breath apparel per municipality. The clusters were concentrated in the metropolitan area of Belo Horizonte, Zona da Mata and Triangulo Mineiro. Conclusion: The spatial distribution of COVID-19 from week 13 until week 40 showed that different levels of endemicity and mesoregional vulnerabilities were represented in these maps.
Keywords:
COVID-19
; Clusters
; Multivariate geospatial model
; Minas Gerais state
1. Introduction
COVID-19, an infectious disease caused by the severe acute respiratory syndrome coronavirus 2 (SARS-CoV-210), was discovered in the city of Wuhan, in Central China. The first cases were reported between early October and mid-November of 2019 and were all related to people who had been to a popular market in the city of Wuhan. There, wild animals that could be sick were traded and as such transmitted the virus to people. From January 2020 onwards, the disease spread globally (Roberts et al., 2021).
COVID-19’s first victim was announced by Chinese health authorities on January 11. On the 20th of January, China declared a health emergency as a consequence of the disease outbreak. On January 13, 2020 the first case of the disease was reported outside China, in a city in Thailand. And in Brazil, the first case of the disease was registered on January 25, 2020 in São Paulo.
On March 11 of the same year, due to the serious state of dissemination with 118,000 infections in 114 countries and 4,291 deaths, the World Health Organization (WHO) declared a pandemic state. By May 2021, more than 170,439,049 cases and 3,540,394 deaths had been reported worldwide. In Brazil, the numbers reached 16,515,120 cases and almost 500,000 deaths, which showed how the virus spread quickly (https://covid.saude.gov.br/). Updated data from WHO reports in 2023 registered 764,474,387 cummulative cases and 6,915,286 cummulative deaths, classifying Brazil between countries with the most cases and deaths reported worldwide (World Health Organization., 2021).
In Brazil, the virus originated at first from people who travelled from other countries. First in capitals such as São Paulo and Rio de Janeiro and from there spreading until it reached the mid-cities and metropolitan areas of Brazil (R. B. Guimarães et al., 2020). Several factors made containing the virus in the country a huge challenge. As stated by Werneck and Carvalho (2020), little is known about the transmission characteristics of COVID-19 in a scenario of populations living with high social inequality, in precarious conditions of housing and sanitation, without systematic access to water and in a situation of agglomeration (Werneck & Carvalho, 2020).
The virus, as well as all over the world, spread rapidly throughout the Brazilian national territory. Cities and federative units had gone through a state of public calamity, thousands of people lost their loved ones and a new routine was imposed on the lives of many Brazilians.
A new reality became part of the family of thousands of Brazilians. For the few who could, social distancing was the ideal alternative, but for most of the population that was a distant reality. According to Wasdani and Prasad (2020), whatever social distancing measures are deemed necessary by a government to contain the proliferation of COVID-19, they can only be successful if there is sufficient economic support for those who occupy the most vulnerable spaces and associated with sustainable and efficient planning (Wasdani & Prasad, 2020).
The high densities of cities, mobility, sanitation, lack of public spaces, influence greatly the pandemic. This by facilitating dissemination and preventing social distance which is one of the ways to prevent contagion. Urban planning shows, once again, to be a key element in times of pandemic. The coronavirus disease of 2019 (COVID-19) pandemic caused a global health crisis thereby affecting more than 216 countries and territories(Yang & Wang, 2020). According to a World Health Organization (WHO) report, more than 50 million confirmed cases of COVID-19 and over 1.6 million deaths have been recorded as of 10 Nov 2020(World Health Organization, 2020; World Health Organization., 2021). The epidemiological distribution of the disease is heterogeneous across the globe, as well as within countries, with multiple factors being strong predictors of transmission of the virus (Ji et al., 2020; Mehra et al., 2020). Globally, the highest burden of COVID-19 cases has been reported in the USA, India, and Brazil (Yang & Wang, 2020). The number of cases and deaths due to COVID-19 affected most parts of the country. A modelling study showed that COVID-19 is expected to have caused severe health and economic consequences in several countries(Mckibbin & Fernando, 2020) but did not produce a homogenously distributed effect within the respective country.
The risk of COVID-19 infection in Brazil differed between states and municipalities, suggesting the need to design and implement local and context-specific measures. A systematic review showed that different factors such as suitable access to health care, comorbidity and sociodemographic factors determine the risk of COVID-19 transmission. Understanding the spatial and temporal distribution of COVID-19 at local level can help effective and efficient resource mobilisation efforts such as providing training for health care workers, supplying hospitals with necessary equipment, prioritising testing practices or distributing hand sanitizer and protective facemasks. It can also help to design methods for targeted intervention and stimulate further study on COVID-19 in each country. Therefore the aims of this study were: 1) to investigate spatiotemporal patterns of COVID-19 reported incidence in the state of Minas Gerais, Brazil, through a geographical approach; 2) to predict the geospatial distribution and identify socioeconomic and environmental variables that impact the spread of COVID-19 in Minas Gerais.
2. Materials and Methods
2.1. Study area
Minas Gerais state is located in the southeastern region of Brazil (18.5122° S, 44.5550° W) and borders the states of São Paulo (SP), Goiás (GO), Mato Grosso do Sul (MS), Espírito Santo (ES), Bahia (BA), and Rio de Janeiro (RJ). The state comprises 853 municipalities and had an estimated population of 21,411,923 inhabitants in 2022 and occupies an area of 586,521,123 km². The geographical divisions are: Campo das Vertentes, Central Mineira, Metropolitana de Belo Horizonte, Noroeste de Minas, Norte de Minas, Oeste de Minas, Sul de Minas, Triângulo Mineiro, Vale do Jequitinhonha, Vale do Mucuri, Vale do Rio Doce, Zona da Mata (Figure 1).
The first case of COVID-19 was recorded in March 8, 2020. Until October 3, a total of 370,911 cases and 9,204 deaths were recorded in the state.
2.2. Data sources and variable selection
The data used for this study was obtained from multiple sources. Weekly reported COVID-19 cases in Minas Gerais state were used from the Ministry of Health (MoH) (https://covid.saude.gov.br/). Furthermore, urban population, estimated income, gross domestic product, demographical density, sanitation and illiteracy by Brazilian Institute of Geography and Statistics (IBGE) were used. As base map, road maps and municipalities’ shape files provided by the Brazilian Institute for Geography and Statistics [Instituto Brasileiro de Geografia e Estatística] (IBGE, malhas digitais) website were implemented. COVID-19 records were spatially indexed by joining a table of data to a map layer, based on the field GEOCOD, with seven numbers, found in both tables. A spreadsheet detailing variable information by municipality was associated with the weekly reports of incidence of COVID-19. The outcome was defined as the Incidence per epidemiological from week 13 to 40 of 2020.
The explanatory variables analyzed were: incidence of deaths of respiratory disease; incidence of deaths associated with diabetes complication; incidence of deaths of cancer; incidence of deaths by circulatory diseases, such as stroke; age 60 years old or older; Mechanical ventilators per 1,000 persons; nursery beds per 1,000 persons; physicians per 1000 persons; beds per 1,000 persons; quick test for covid-19; polymerase chain reaction for covid-19; percentage of population with private insurance; income higher than a Brazilian minimum income (approximately U$ 244/month); gross domestic product; urban population; demographical density (population/area); Sanitation; Illiteracy; Gini index; Human development index (based in the Brazilian census of 2010).
2.3. Statistical analysis
Principal components analysis
Vulnerability index to COVID-19 infection was calculated using a principal component analysis (PCA). The socioeconomic and demographic indicators used to estimate the vulnerability index were human development index, illiteracy rate, pross domestic product, sanitation, and urbanization. Health care related factors such as mechanical ventilators per 1000 person, physicians per 1,000 person and percentage of private health insurance holders were also included in the PCA of the vulnerability index analysis. These potential indicators were selected based on evidence of association with COVID-19 infection from regression models. The risk maps were then created for risk of infection from the composite index using geospatial analysis techniques.
2.4. Statistical analysis
A descriptive analysis was undertaken, calculating means with standard deviations (SD) for normally distributed continuous variables, medians with an interquartile range (IQR) for non-normally distributed continuous variables and percentages for categorical variables. A generalized linear modelling approach was used to further define hotspots and quantify socioeconomic and demographic drivers of COVID-19 risk. Bivariate analysis was conducted and variables with P-value < 0.2 were selected for a multivariate spatial model. Variance inflation factors (VIF) were used to check for the presence of multicollinearity among covariates.
2.5. Geospatial analysis/Cluster analysis
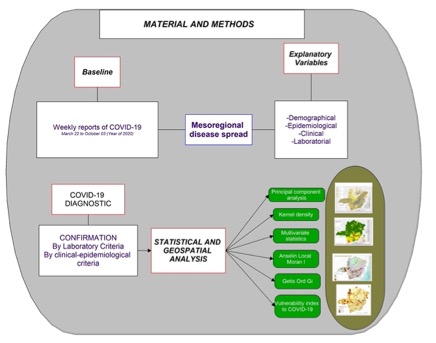
All data obtained from the different sources was georeferenced by using Geographic Information Systems. Spatial autocorrelation was explored at a global scale using Moran’s I statistic and at a local scale using local indicators of spatial association (LISA), estimated using the Anselin Local Moran’s I statistic, and the Getis-Ord statistic. The LISA and the Getis-Ord statistics were used to detect local clustering of COVID-19 and to identify the locations of hot-spots(Anselin, 2010). The methods framework is shown in the Figure 2.
3. Results
3.1. Characteristics of the study population
From March 22 to October 3 of 2020, a total of 370,911 confirmed COVID-19 cases were reported by State Secretary of Health in Minas Gerais, including an accumulated incidence varying from 45.680/100,000 to 312.130/100,000. Until then, a total of 9,204 deaths was recorded in the state. At the last week of analysis, week 40 of 2020, only 256 from the 853 municipalities in Minas Gerais had not recorded Covid-19 cases. The 60 years old or older population in the municipalities varied from 4.67 to 21.39%.
3.2. Principal components and statistical analysis
Multivariate factor analysis processes were run, carried out with the SPSS/IBM software, determining the indicator specification groups.

Table 1.
Univariate regression model for COVID-19 at municipality-level in Minas Gerais state.
| Data | OR | Sig. |
|---|---|---|
| Death circulatory system | 2.637 | 0.105 |
| Death diabetes complication | 3.212 | 0.073 |
| Death câncer | 3.002 | 0.084 |
| Gross domestic product (municipality) | 12.973 | 0.000 |
| Urban population | 3.359 | 0.067 |
| Breath apparell per 1,000 hab | 6.021 | 0.014 |
| Iliteracy | 11.613 | 0.001 |
Source: https://www.coronavirus.saude.mg.gov.br/. Date: 10/03/2020. *Method: Stepforward conditional with Wald method of confidence interval measure.
3.3. Geospatial analysis/Cluster analysis
Results of the Choropleth maps, composited at the municipality level by week periods, are shown in Figure 3. A significant incidence spot occurred from Metropolitan Region of Belo Horizonte (MRBH) towards the east of the state in week 13, the first week with cases reported. In week 15, spots of incidences expanded towards the south of the state. In week 20, the expansion occurred towards west and north. Weeks 25, 30, 35 and 40, showed regional expansion of the disease, highlighting the importance of hubs like MRBH, south of MG, Zona da Mata and Triângulo Mineiro, the most populated regions of the state. This pattern essentially shows the introduction, possibly through the roads, and regional secondary expansion of the disease (Figure 3).
3.4. Global Moran’s I
The Global Moran’s I spatial analysis showed spatial autocorrelation, with the Moran’s I index and p-value shown as per below:
Week 13: P value=0.000142; Z score=3.805526; index= 0.031777
Week 15: P value<0.0001; Z score= 8.980319; index= 0.077936
Week 35: P value<0.0001; Z score= 9.943836; index= 0.101237
Week 40: P value<0.000001; Z score= 4.942783; index= 0.041999
Moran maps identified a high-high cluster in the MRBH and in the south by week 13. Week 15 highlighted a high-high cluster around MRBH and another around the south of the state. Week 20 showed a high-high cluster in the same areas, including the Zona da Mata region and its municipalities. Week 25 showed a new cluster around Governador Valadares, in the west, and Patos de Minas, in the east. In week 30, for the first time, high-high clusters shifted location to the Triângulo Mineiro region. In week 35, high-high clusters expanded throughout entire Triângulo Mineiro and south of the state. Week 40 showed high-high clusters in the west, Governador Valadares and Triângulo Mineiro.
Getis Ord Gi Maps show the hotspots and cold spots of the disease during the respective period. This analysis showed two hotspots in week 13 in Belo Horizonte and Patos de Minas. Week 15 highlighted hotspots in Belo Horizonte and another around Varginha and Pouso Alegre, in the south of the state. Week 20 showed hotspots in Belo Horizonte, in the south of MG, in Juiz de Fora and in Patos de Minas. Week 25 showed new hotspots in the west, Governador Valadares and Triângulo Mineiro. It also showed the persistence of the spread in Belo Horizonte and Patos de Minas. In week 30, hot spots had occurred in the Triângulo Mineiro, south of MG, Belo Horizonte and west of MG, representing corridors along the main roads of the state. In week 35, the hotspots expand around entire Triângulo Mineiro, Belo Horizonte, east and the south of the state. Week 40 showed only two hotspots, Triângulo Mineiro and the west (Figure 4).
3.5. Vulnerability to Covid-19
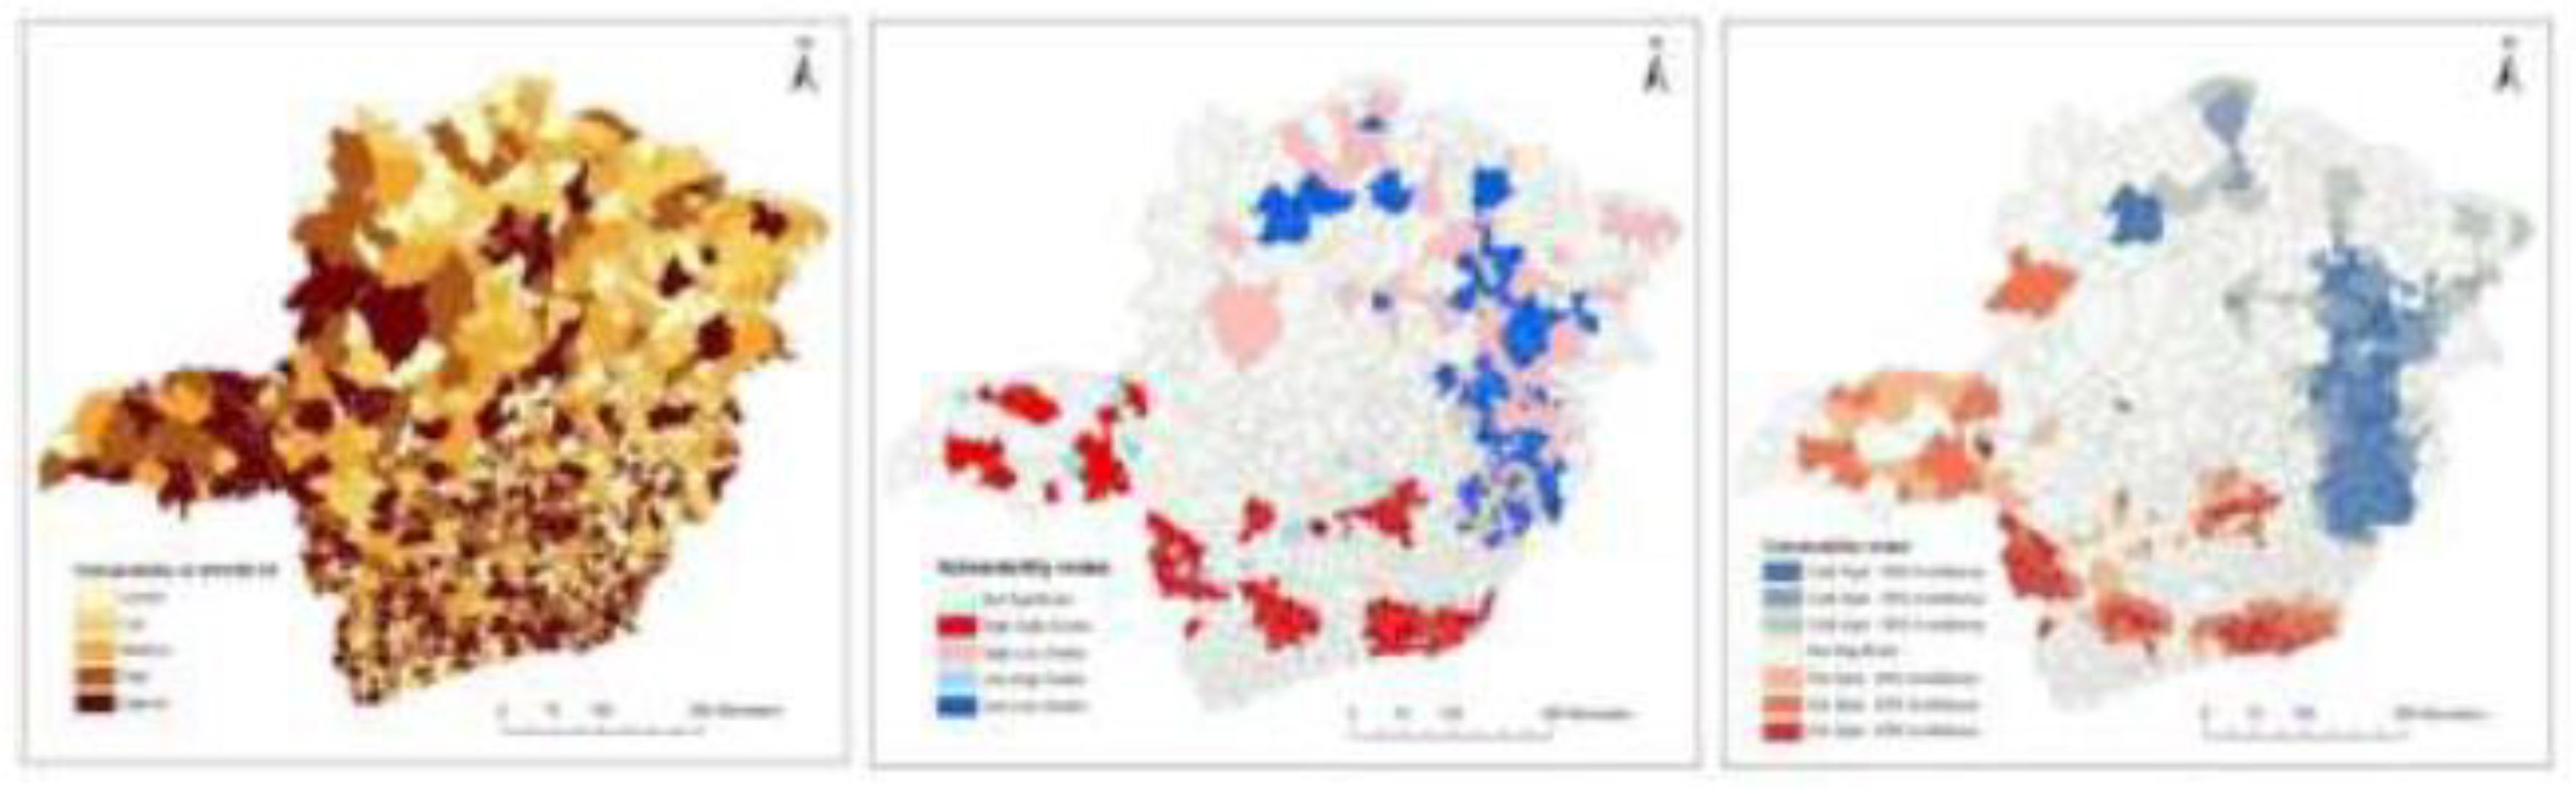
The map highlights that most parts of the state are likely to have a relatively high vulnerability and a substantial risk of COVID-19 infection. Most parts of the state are identified as vulnerable to COVID-19 infection, except the north-east parts of the state. Peripheral areas of the country bordering other states in the east and south parts of the province appeared to be vulnerable to COVID-19 infection. These outlying areas are characterised by older population. They also had high urban population which were found to be important indicators of COVID-19 transmission.
Three maps of vulnerability to COVID-19 were created in order to understand the persistence of hotspots and clusters and the correlation between presence of COVID-19 and associated variables along the time series. The Moran and Getis-Ord Gi vulnerability maps showed almost the same information, the importance of the Fringe border between Minas Gerais and the states of São Paulo and Rio de Janeiro. The Vulnerability map extracted from the associated variables showed vulnerabilities in all of the regions of Minas Gerais, the Highest in the Triângulo Mineiro, east, Zona da Mata and MRBH (Figure 5).
The vulnerability map of COVID-19 infection in Minas Gerais state is illustrated in Figure 6.
4. Discussion
The data suggests an increased risk of COVID-19 infection in the mid-size cities along our time series analysis, and a hypothesis is that time and lockdown actions and hospitalization coverage by the public healthcare in Brazil has impacted the virus interurban spread. A novel strategy is used to address time series of COVID-19, based on an integrated approach, describing the first spread of the disease in Minas Gerais in four phases: phase 1 with still low transmission. Phase 2 with significant increase of the transmission due the flexibilization of protection measures and economical pressure. Phase 3 with rapid progression towards the mid cities and the continuation of flexibilization in the measures and phase 4 with a small insignificant reduction of cases but highlighting the spread through small cities with poor public health services(Lima et al., 2020).
The assumptions with regards to mid cities spread and whether speedy actions can make difference were validated. The results in this research were divided in choropleth maps, Anselin Local Morans I statistic, Getis Ord Gi, vulnerability to COVID-19 and multivariate analysis. Bivariate analysis with Variance inflation factors (VIF) was conducted and variables with P-value < 0.2 were selected for a multivariate spatial model. The most influential variables in the bivariate model were: illiteracy, gross domestic product and breath apparel per municipality. The clusters were concentrated in the metropolitan area of Belo Horizonte, Juiz de Fora, Uberlândia, Patos de Minas and Governador Valadares. The first cases were shown in Metropolitan Region of Belo Horizonte (MRBH) and then spreaded to Triângulo Mineiro
In this study, the choropleth maps showed the spread of the disease throughout the major roads of the state of Minas Gerais: BR – 381 Rodovia Fernão Dias, BR – 116 Rio-Bahia, BR – 262, BR – 050, BR – 153, BR – 365, BR – 135, BR – 459, BR – 267, BR – 265, confirming what other authors hypothesized. (https://www.mg.gov.br/pagina/rodovias) (Lima et al., 2020).
The Central Region of Minas Gerais, where Belo Horizonte is located, was the place of the first COVID-19 infection in the state (Figure 1). Also called Metropolitan Region of Belo Horizonte, it is a mountainous area and one of the richest in the country in mineral resources. An industrial complex, called Quadrilátero Ferrífero, of mining, steel, automobile, mechanics, textiles, electrical, auto parts and cement sectors stands out. Greater Belo Horizonte is an area of great industrial dynamism, with an automobile company and metallurgical, mechanical and countless other industries.
The Triângulo Mineiro region is composed by mid-sized cities such as Uberlândia (larger population), Uberaba, Araguari and Ituiutaba, and presented the most impressive increase in number of cases of COVID-19 from the week 13 on. It is one of the richest regions in the state, based on Agriculture among the most advanced in the world in terms of productivity(E. N. Guimarães, 2010).
The Zona da Mata Mineira is located in the southeast and the biggest city is Juiz de Fora. Transmission started from week 20 on. It rapidly created a cluster in the same week (Figure 5), and became one of the most important clusters from week 20 onwards (Figure 5). It then presented one of the most vulnerable concentrations for COVID-19 (Figure 6). The region’s Industrialization advanced a lot in recent years and still stands out, with steel, zinc metallurgy and textile industry, an emerging automobile and auto parts hub, headed by Mercedes-Benz as well as an agricultural and dairy farming area, which mainly supplies Greater Rio de Janeiro and MRBH (Da Silva Araújo Gonçalves et al., 2020).
Sul de Minas (Gerais) is one of the most developed regions of the state, having several cities where companies from different sectors are installed, such as: mechanics, agro-industrial, electronics, clothing, footwear and non-metallic minerals(Simões & Antigo, 2022). This region presented a very important concentration of cases and clusters because of its border with the state of São Paulo, the main transmission area in Brazil. The southern border of the state showed vulnerability with clusters and hotspots on weeks 15, 20, 30 and 35 (Figure 4 and Figure 5).
Comparisons between week 13 and week 40 showed Triângulo mineiro as the main area of spread of COVID-19 in the phase 2. In addition, the areas surrounding Mid-cities popped up from week 30 to 35. This suggests the pandemic peak in 2020 occurred for the first time during this period. A hypothesis is that a higher circulation of the virus in the state occurred for the first time in between weeks 30 and 35. After this period it took approximately more than 10 weeks until every part of the state had at least one case of COVID-19. This period before week 30 is considered as the period in which the virus spread by proximity. This because of the health service in mid-cities that support the towns around (Coura-Vital et al., 2021).
This study highlighted the power of an integrated approach through Geographical Analysis, based on research measures and cluster analysis of COVID-19. In this case, there could potentially be a clear relation between the nosogeographic entity and specific patterns for these areas. There was the relationship between the key areas, such as Triângulo Mineiro, MRBH, South and North of the state were the highest virus circulation beated records each week (Magalhães et al., 2020).
5. Conclusions
Ongoing studies in Brazil are showing that by applying spatial analysis techniques it is possible to understand how the transmission of diseases takes place, determining areas of low or high risk. Extensive urbanized endemic areas increased the number of cases and the spatial spread of COVID-19, becoming a challenge for quick geospatial-based answers.
The spatial distribution of COVID-19 from week 13 until week 40 showed that different levels of endemicity and mesoregional vulnerabilities were represented in these maps. This is a larger utility of Geospatial analysis, because it can lead to cost-effective actions for epidemic surveillance and response.
Author Contributions
Conceptualization, data curation, formal analysis, funding acquisition – EF. Conceptualization, data curation, formal analysis – KA. Data curation, formal analysis – IC, LS and IP. Conceptualization, writing – review & editing – SL, JL and SO.
Funding
This research was not funded by any specific project grant.
Acknowledgments
Esri – ArcGis Pro license, version 2.7: licensed for educational purposes due to the COVID-19 Pandemic, assigned to Instituto Pró-cidade Futura, from March to December 2020. Linked project: Geotecnologias aplicadas a saúde: monitoramento da COVID-19 utilizando a plataforma ARCGIS em Minas Gerais. SIEX-UFU. 2020.
Conflicts of Interest
The authors declare no conflict of interest.
References
- Anselin, L. (2010). Local Indicators of Spatial Association-LISA. Geographical Analysis, 27(2), 93–115. https://doi.org/10.1111/j.1538-4632.1995.tb00338.x. [CrossRef]
- Coura-Vital, W., Cardoso, D. T., Ker, F. T. de O., Magalhães, F. D. C., Bezerra, J. M. T., Viegas, A. M., Morais, M. H. F., Bastos, L. S., Reis, I. A., Carneiro, M., & Barbosa, D. S. (2021). Spatiotemporal dynamics and risk estimates of covid-19 epidemic in minas gerais state: Analysis of an expanding process. Revista Do Instituto de Medicina Tropical de Sao Paulo, 63. https://doi.org/10.1590/s1678-9946202163021. [CrossRef]
- Da Silva Araújo Gonçalves, I., Pereira, P. F., Silva, M. B. L., Ladeira, F. B., Moreira, T. R., Cotta, R. M. M., & Da Costa, G. D. (2020). Nutritional status coverage trend registered in the SISVAN web in seven municipalities of the Zona da Mata Mineira, Brazil, from 2008 to 2017, and its association with socio-economic, demographic and organisation of health system variables. Journal of Nutritional Science, 9, 1–8. https://doi.org/10.1017/jns.2019.42. [CrossRef]
- Guimarães, E. N. (2010). Formação e desenvolvimento econômico do Triângulo Mineiro: integração nacional e consolidação regional. (1st ed., Vol. 1). EDUFU.
- Guimarães, R. B., de Castro Catão, R., da Silva Martinuci, O., Pugliesi, E. A., & Matsumoto, P. S. S. (2020). O raciocinio geografico e as chaves de leitura da Covid-19 no territorio brasileiro. Estudos Avancados, 34(99), 119–140. https://doi.org/10.1590/S0103-4014.2020.3499.008. [CrossRef]
- Ji, Y., Ma, Z., Peppelenbosch, M. P., & Pan, Q. (2020). Potential association between COVID-19 mortality and health-care resource availability. In The Lancet Global Health (Vol. 8, Issue 4, p. e480). Elsevier Ltd. https://doi.org/10.1016/S2214-109X(20)30068-1. [CrossRef]
- Lima, S. do C., Fonseca, E. da S., & Santos, F. de O. (2020). Situação epidemiológica e difusão da COVID-19 pela rede urbana de Minas Gerais, Brasil. Hygeia - Revista Brasileira de Geografia Médica e Da Saúde, 243–250. https://doi.org/10.14393/hygeia0054711. [CrossRef]
- Magalhães, S. C. M., Santos, F. de O., Lima, S. do C., & Fonseca, E. da S. (2020). Situação epidemiológica da transmissão da COVID-19 no Norte de Minas Gerais, Brasil. Hygeia, 80–87.
- Mckibbin, W., & Fernando, R. (2020). Crawford School of Public Policy CAMA Centre for Applied Macroeconomic Analysis The Brookings Institution Centre of Excellence in Population Ageing Research The Global Macroeconomic Impacts of COVID-19: Seven Scenarios *.
- Mehra, M. R., Desai, S. S., Kuy, S., Henry, T. D., & Patel, A. N. (2020). Cardiovascular Disease, Drug Therapy, and Mortality in Covid-19. New England Journal of Medicine, 382(25), e102. https://doi.org/10.1056/nejmoa2007621. [CrossRef]
- Roberts, D. L., Rossman, J. S., & Jarić, I. (2021). Dating first cases of COVID-19. PLoS Pathogens, 17(6). https://doi.org/10.1371/journal.ppat.1009620. [CrossRef]
- Simões, A. C. R., & Antigo, M. F. (2022). Municipal and household deprivations in Minas Gerais: an analysis of regional inequality in the years 2000. Nova Economia, 32(1), 63–95. https://doi.org/10.1590/0103-6351/6640. [CrossRef]
- Wasdani, K. P., & Prasad, A. (2020). The impossibility of social distancing among the urban poor: the case of an Indian slum in the times of COVID-19. In Local Environment (Vol. 25, Issue 5, pp. 414–418). Routledge. https://doi.org/10.1080/13549839.2020.1754375. [CrossRef]
- Werneck, G. L., & Carvalho, M. S. (2020). A pandemia de COVID-19 no Brasil: Crônica de uma crise sanitária anunciada. In Cadernos de Saude Publica (Vol. 36, Issue 5). Fundacao Oswaldo Cruz. https://doi.org/10.1590/0102-311X00068820. [CrossRef]
- World Health Organization. (2020). Coronavirus disease 2019 (COVID-19): situation report, 146.
- World Health Organization. (2021). WHO Coronavirus Disease (COVID-19) Dashboard. https://covid19.who.int/?gclid=EAIaIQobChMI_pimwrWM7gIVUgSRCh28Xwi-EAAYASAAEgLcv_D_BwE.
- Yang, P., & Wang, X. (2020). COVID-19: a new challenge for human beings. In Cellular and Molecular Immunology (Vol. 17, Issue 5, pp. 555–557). Springer Nature. https://doi.org/10.1038/s41423-020-0407-x. [CrossRef]
Figure 1.
Geographical divisions of Minas Gerais state, Brazil.
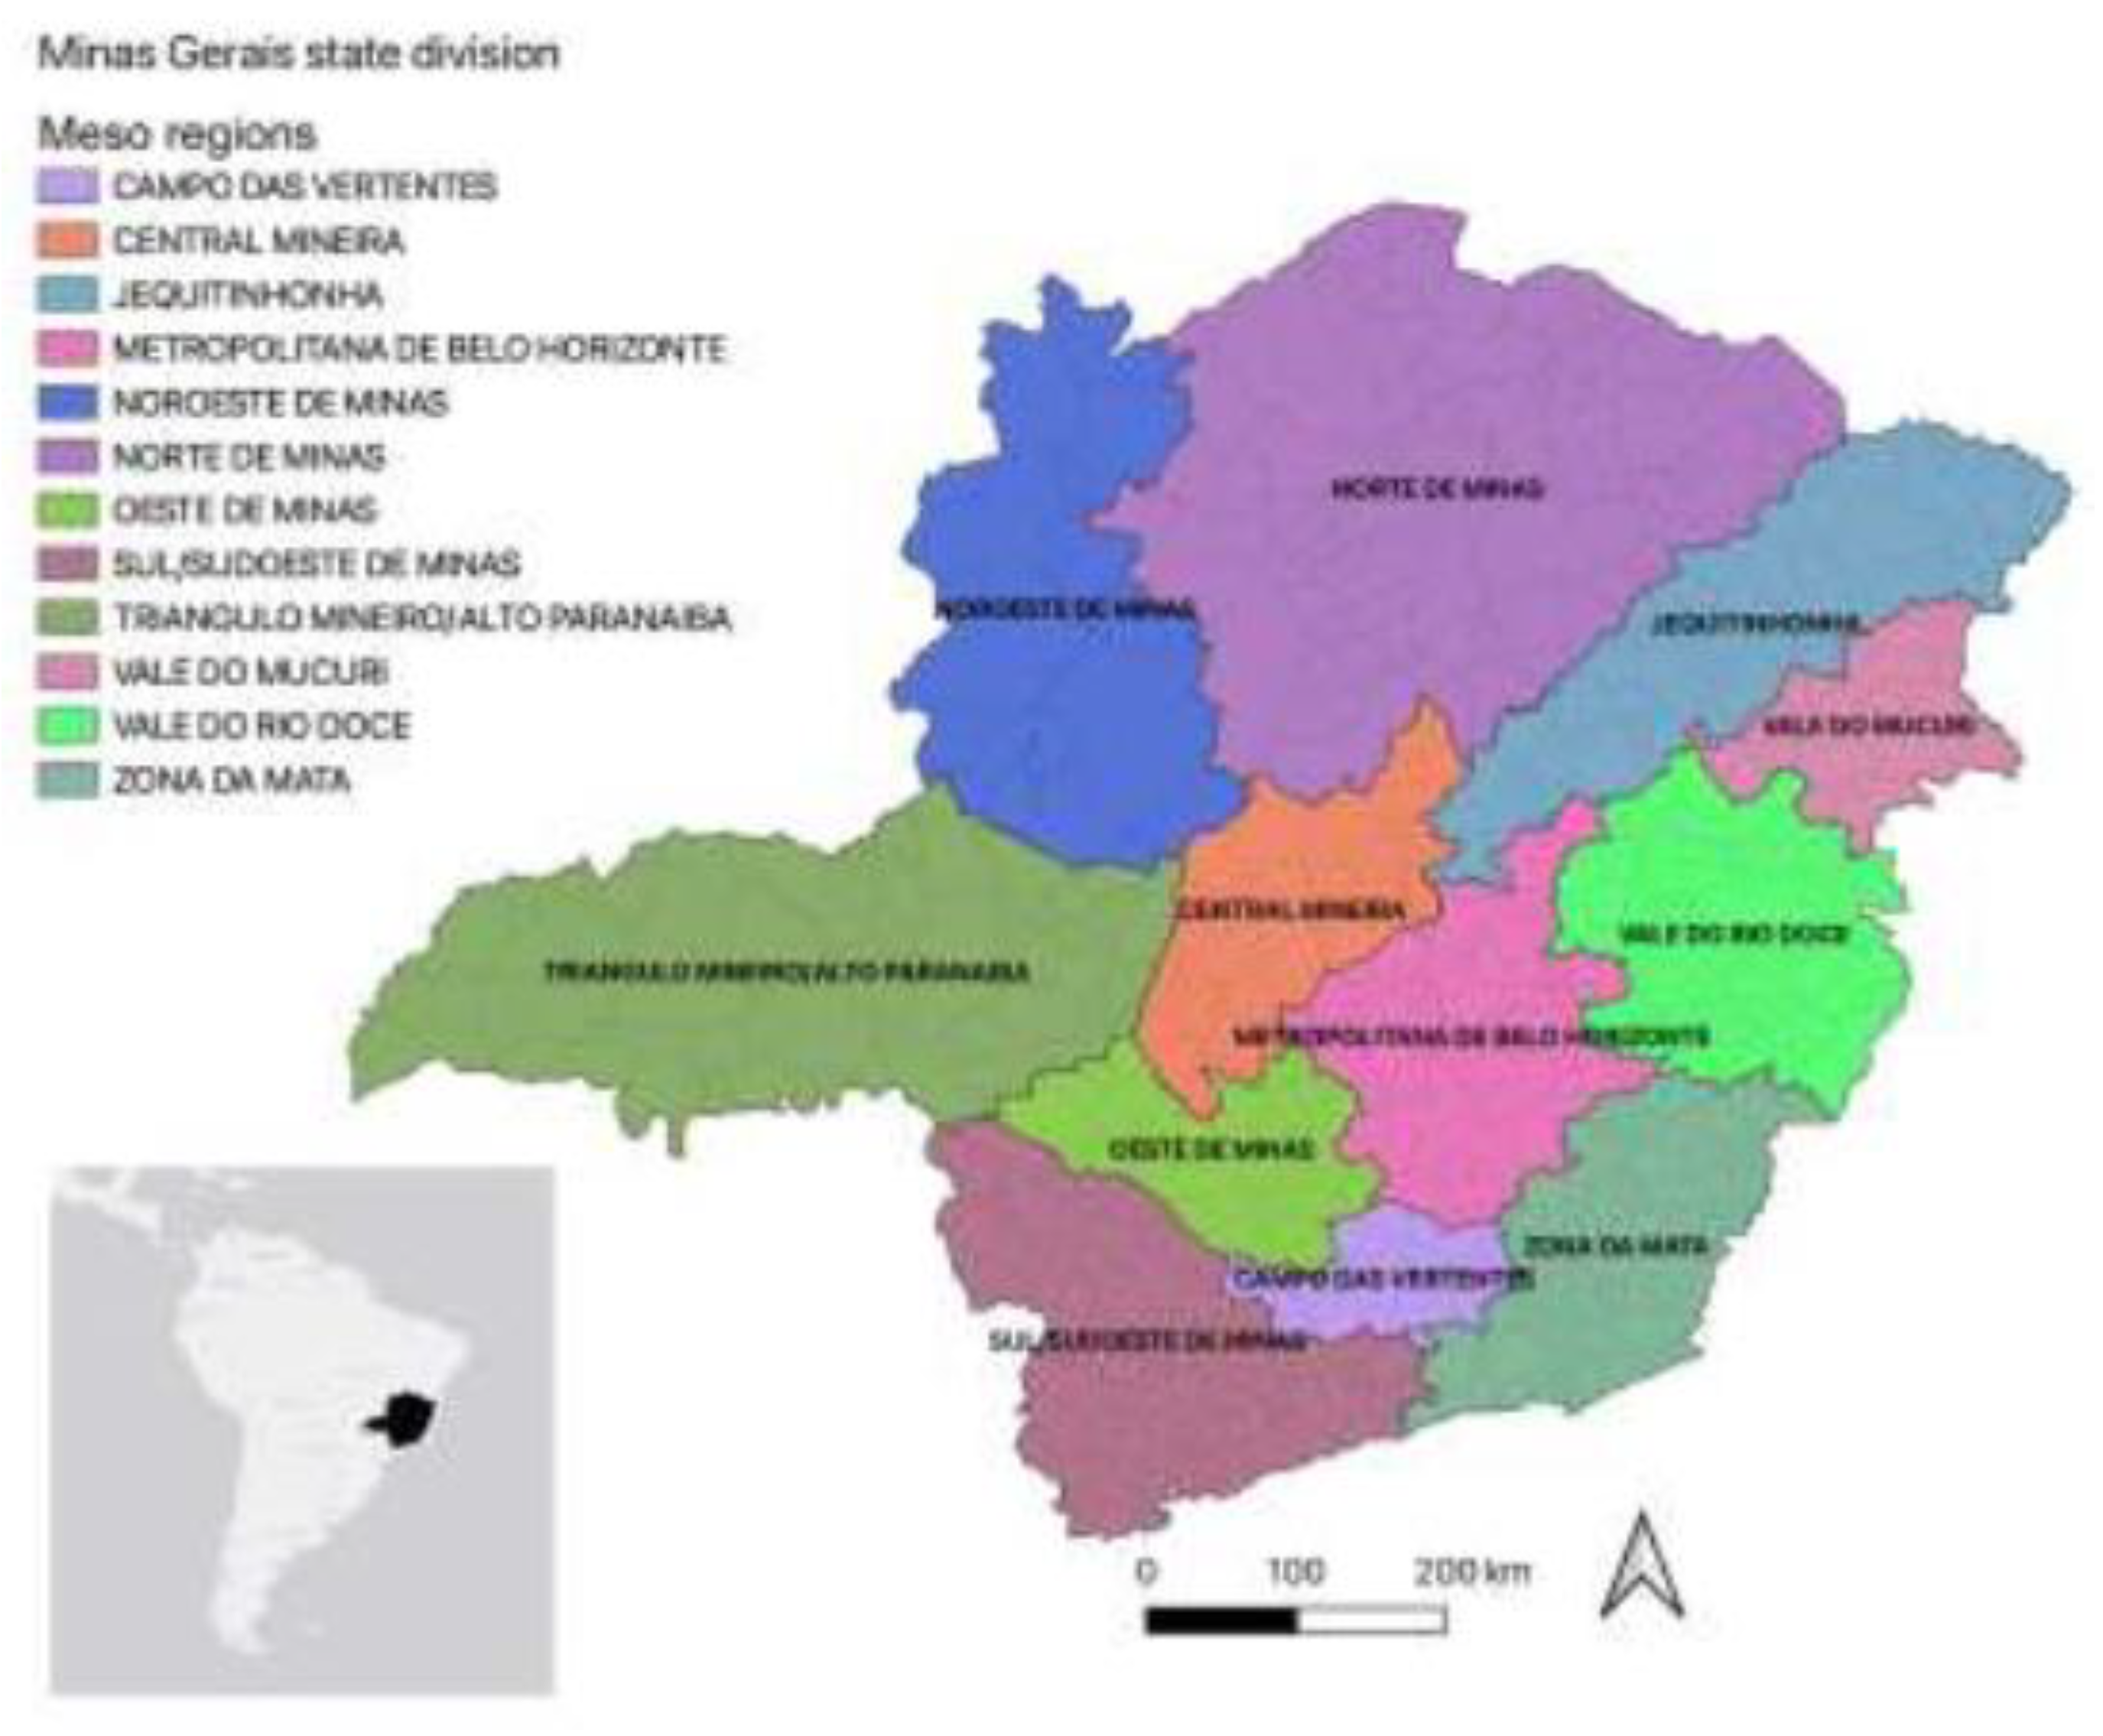
Figure 2.
Graphical abstract of the study.
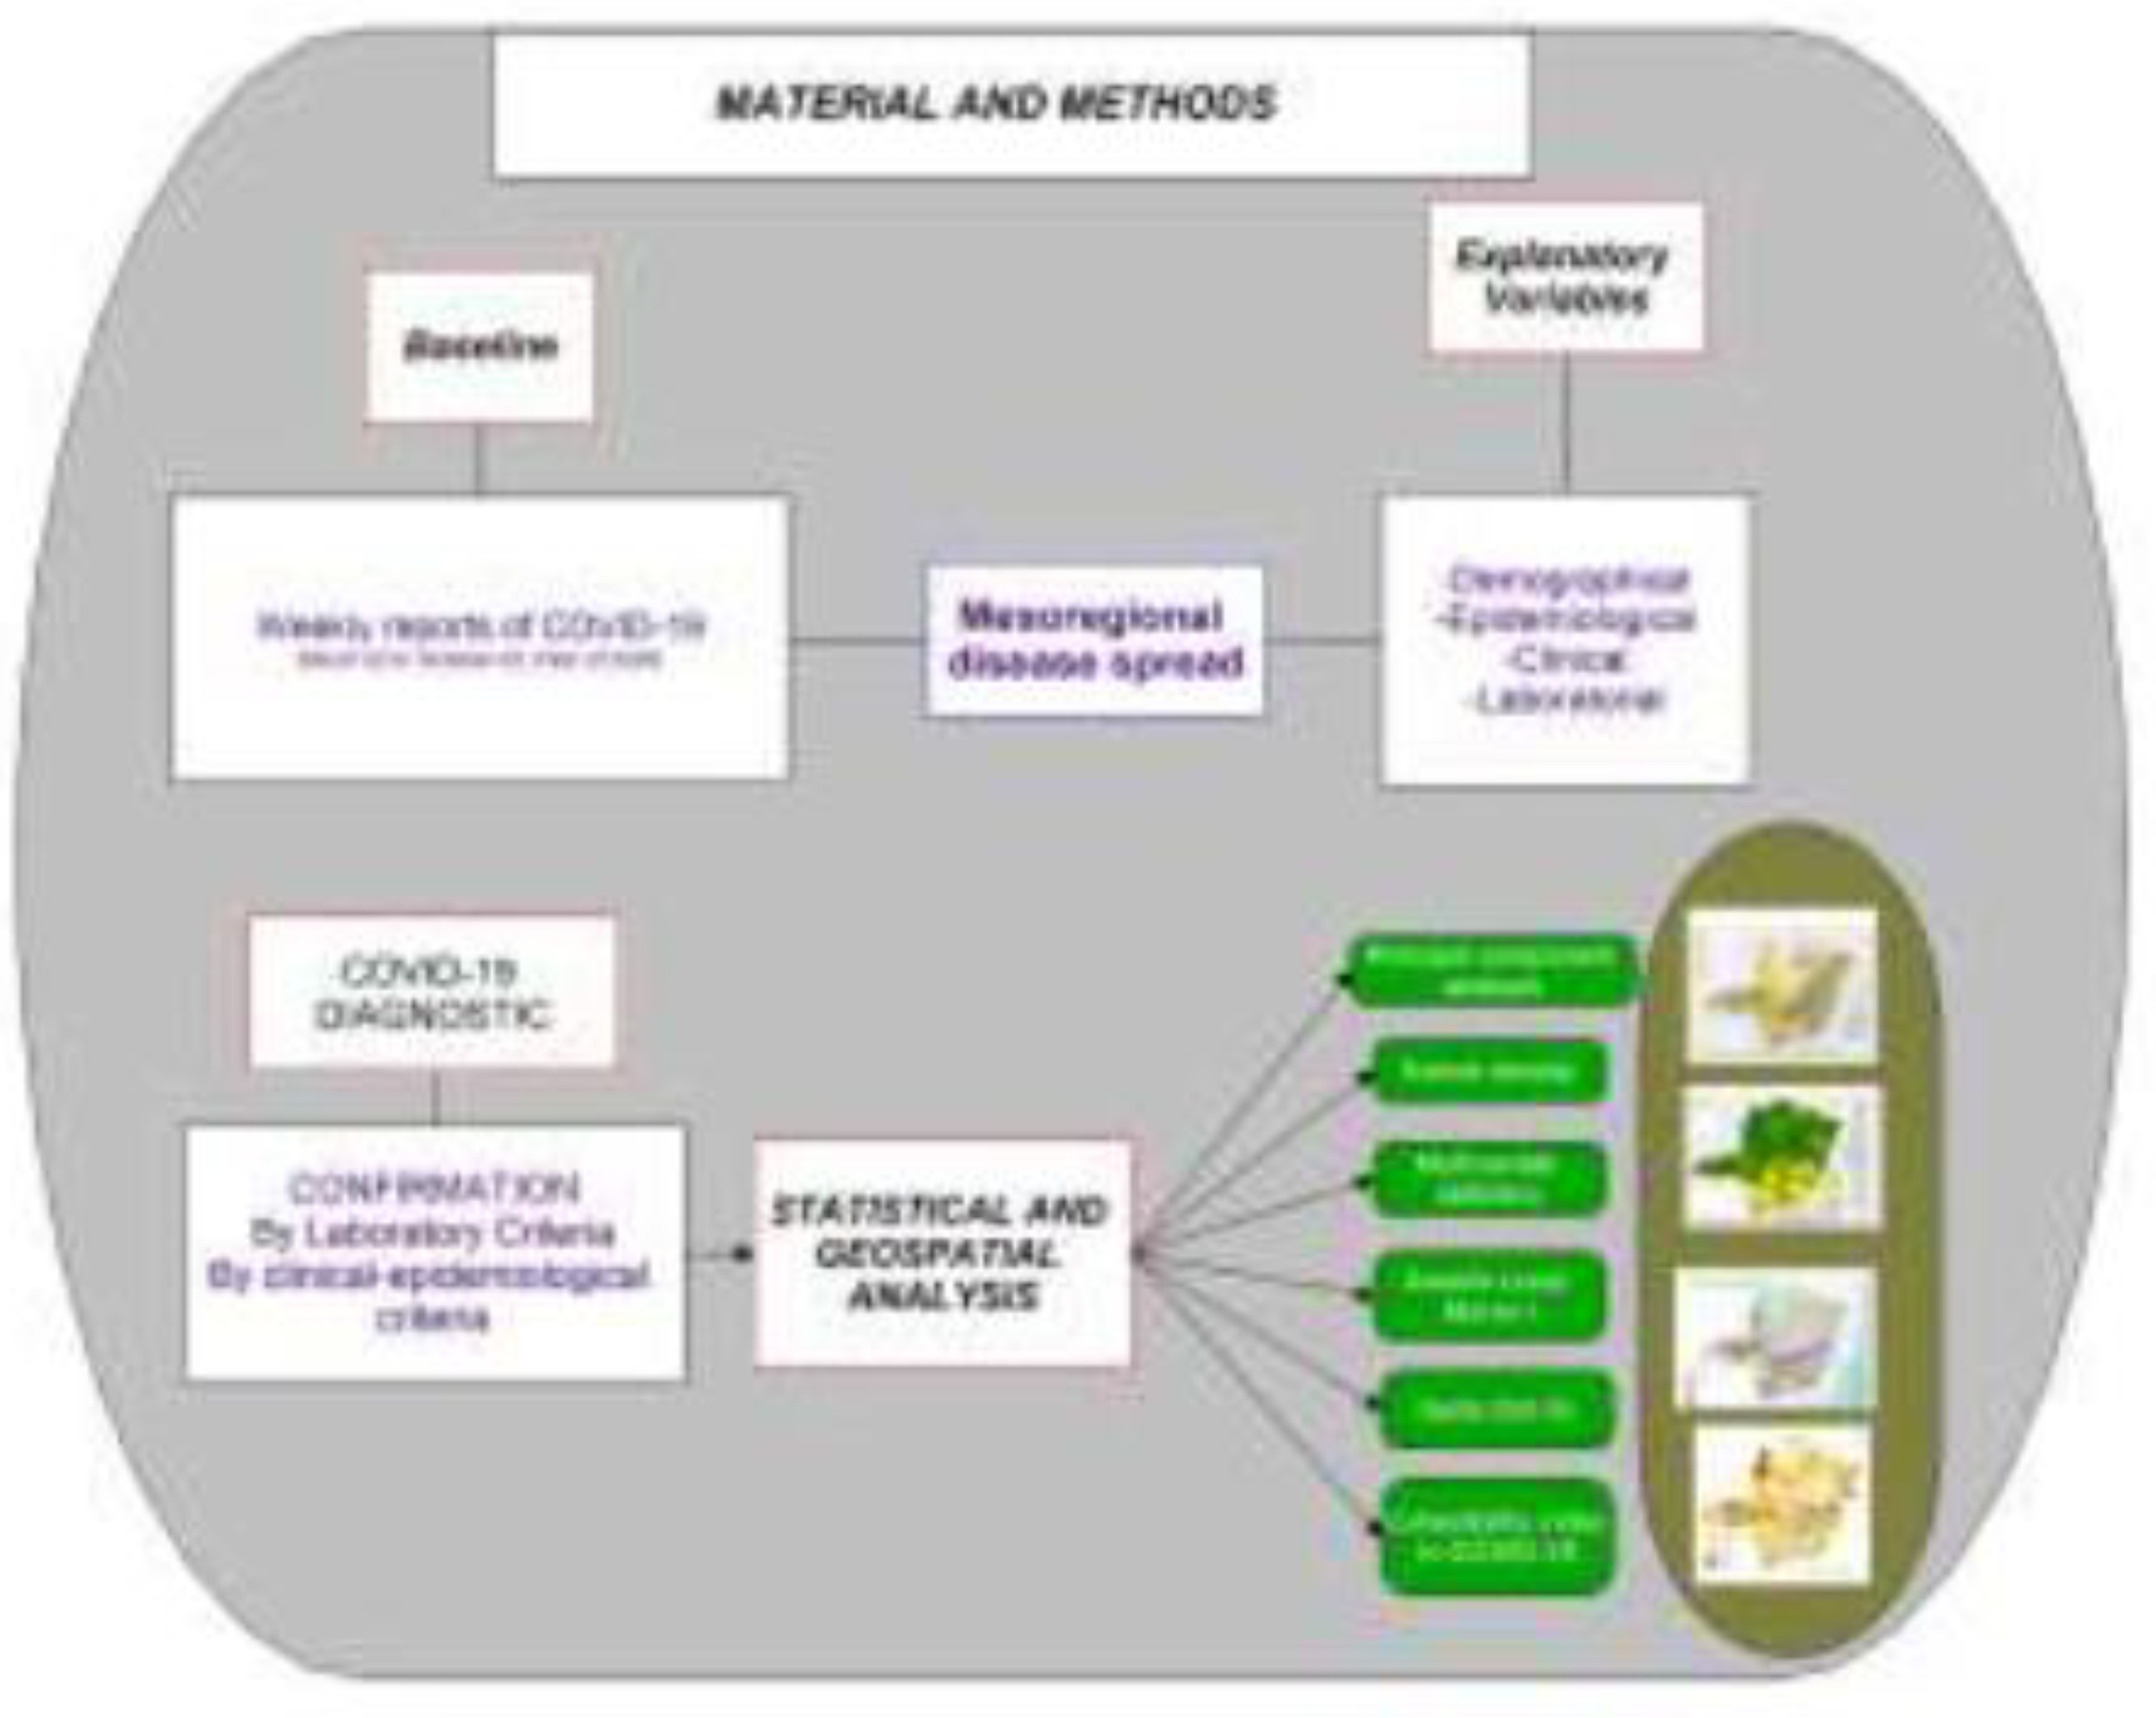
Figure 3.
Choropleth map showing the incidence rate of COVID-19 in Minas Gerais state from 22 Mar 2020 until 3 Oct 2020. From the top-left to bottom-right: Weeks 13, 15, 20, 25, 30, 35 and 40. Source: https://www.coronavirus.saude.mg.gov.br/ and IBGE, malhas digitais.
Figure 3.
Choropleth map showing the incidence rate of COVID-19 in Minas Gerais state from 22 Mar 2020 until 3 Oct 2020. From the top-left to bottom-right: Weeks 13, 15, 20, 25, 30, 35 and 40. Source: https://www.coronavirus.saude.mg.gov.br/ and IBGE, malhas digitais.
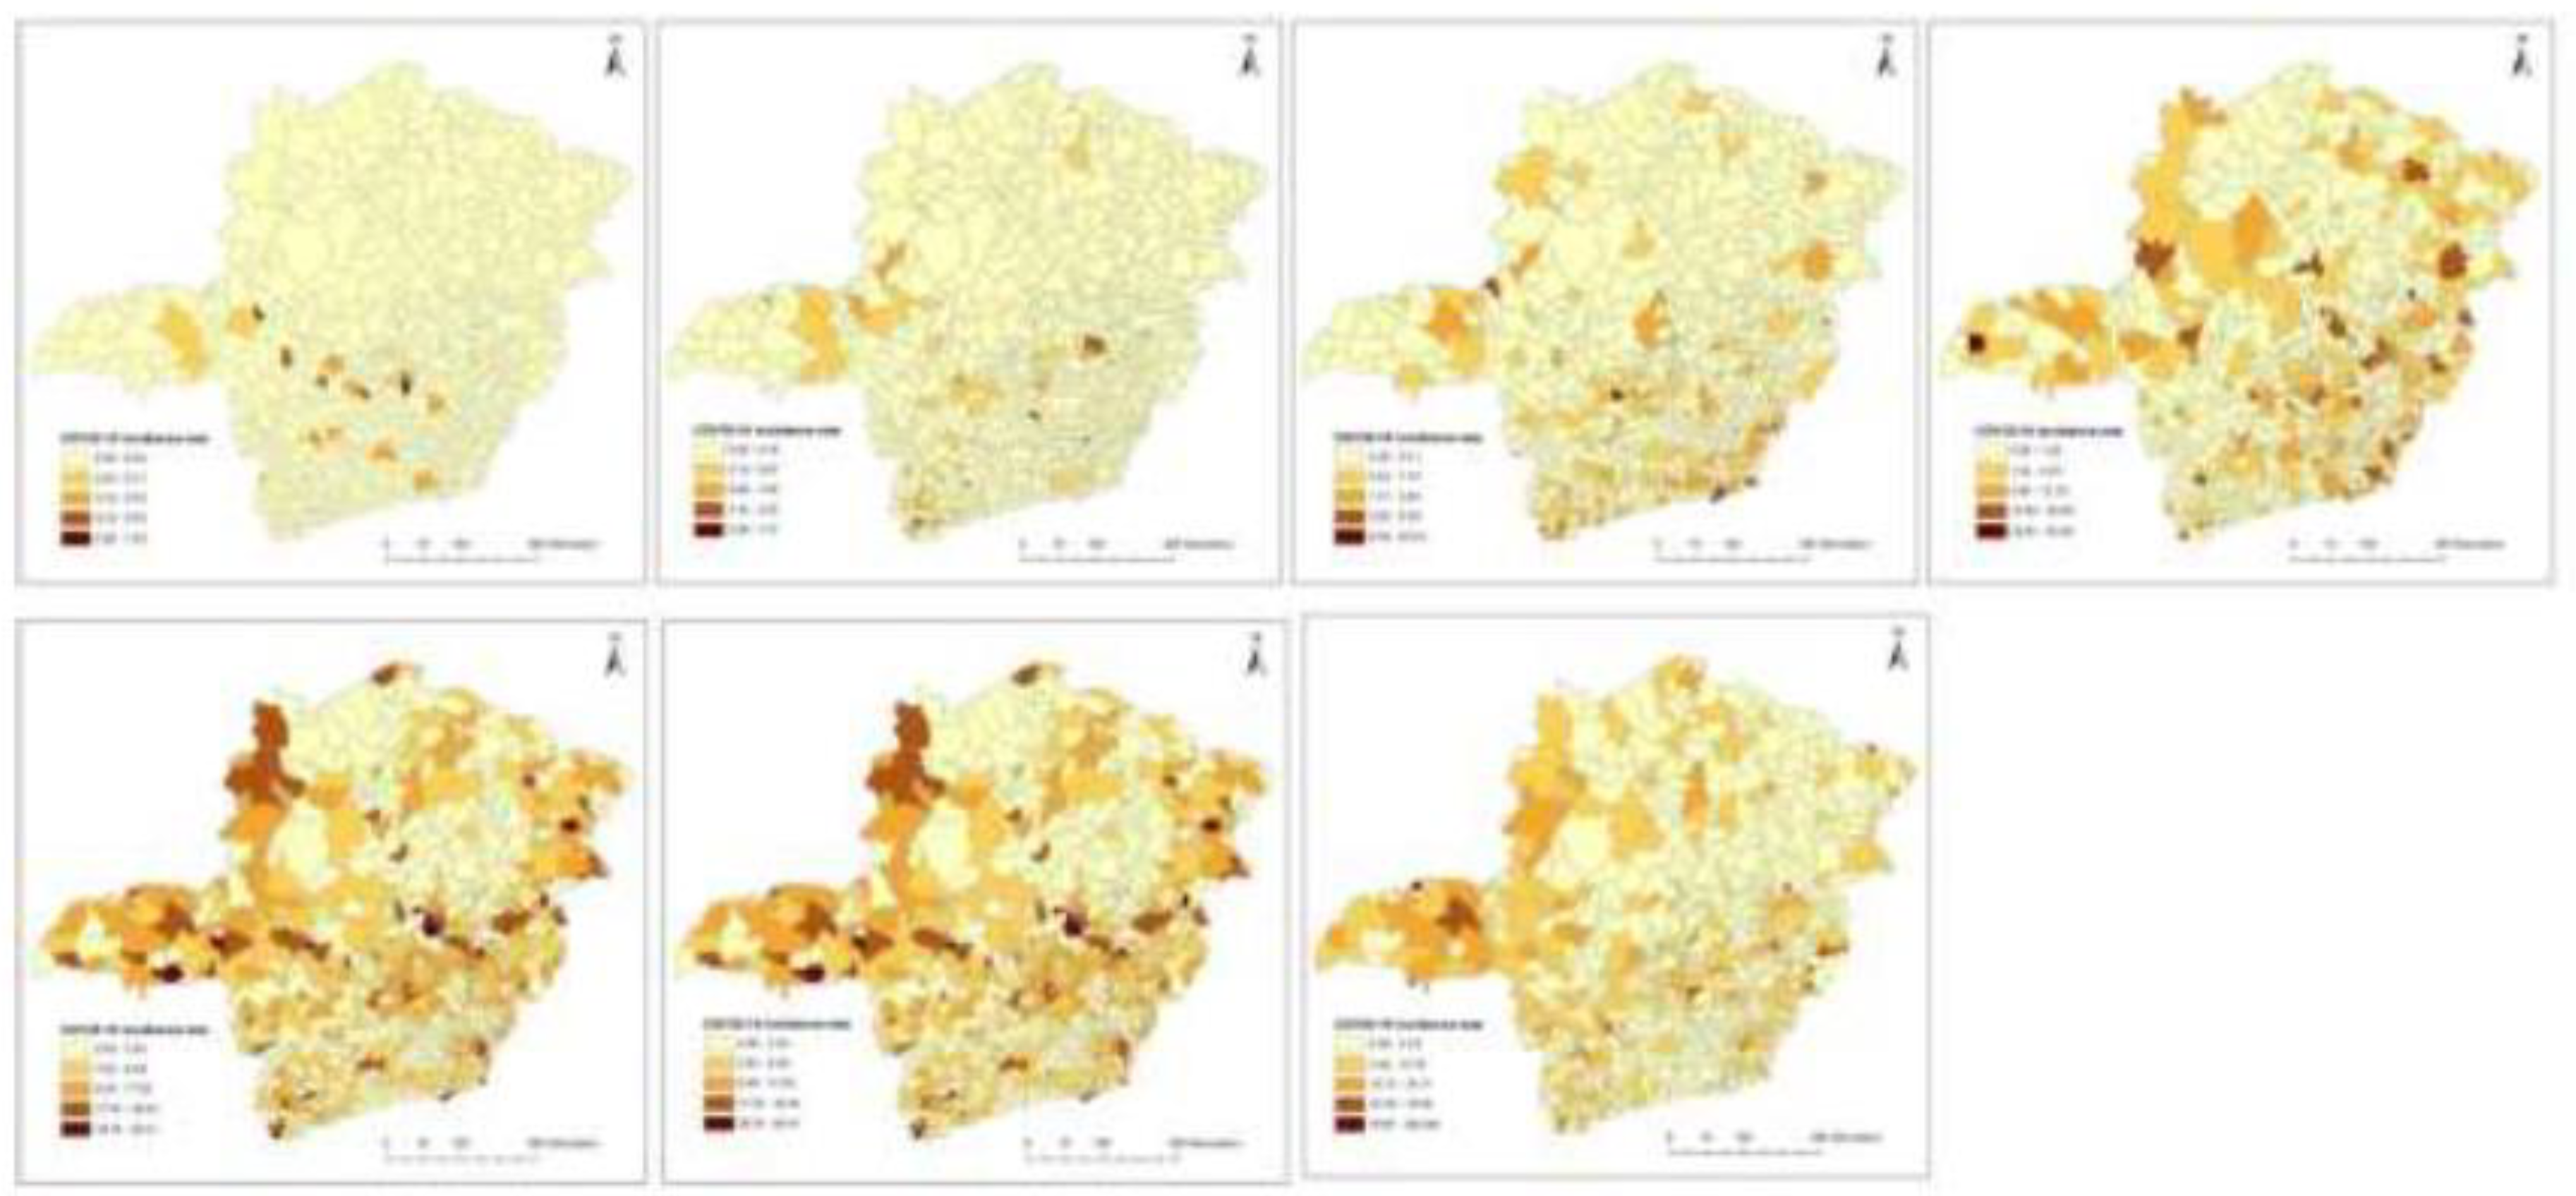
Figure 4.
Spatial clustering of COVID-19 at municipality-level in Minas Gerais state based on local indicators of spatial association using Anselin Local Moran’s I statistic, from 22 Mar 2020 to 3 Oct 2020. Source: https://www.coronavirus.saude.mg.gov.br/ and IBGE, malhas digitais. From the top-left to bottom-right: Weeks 13, 15, 20, 25, 30, 35 and 40.
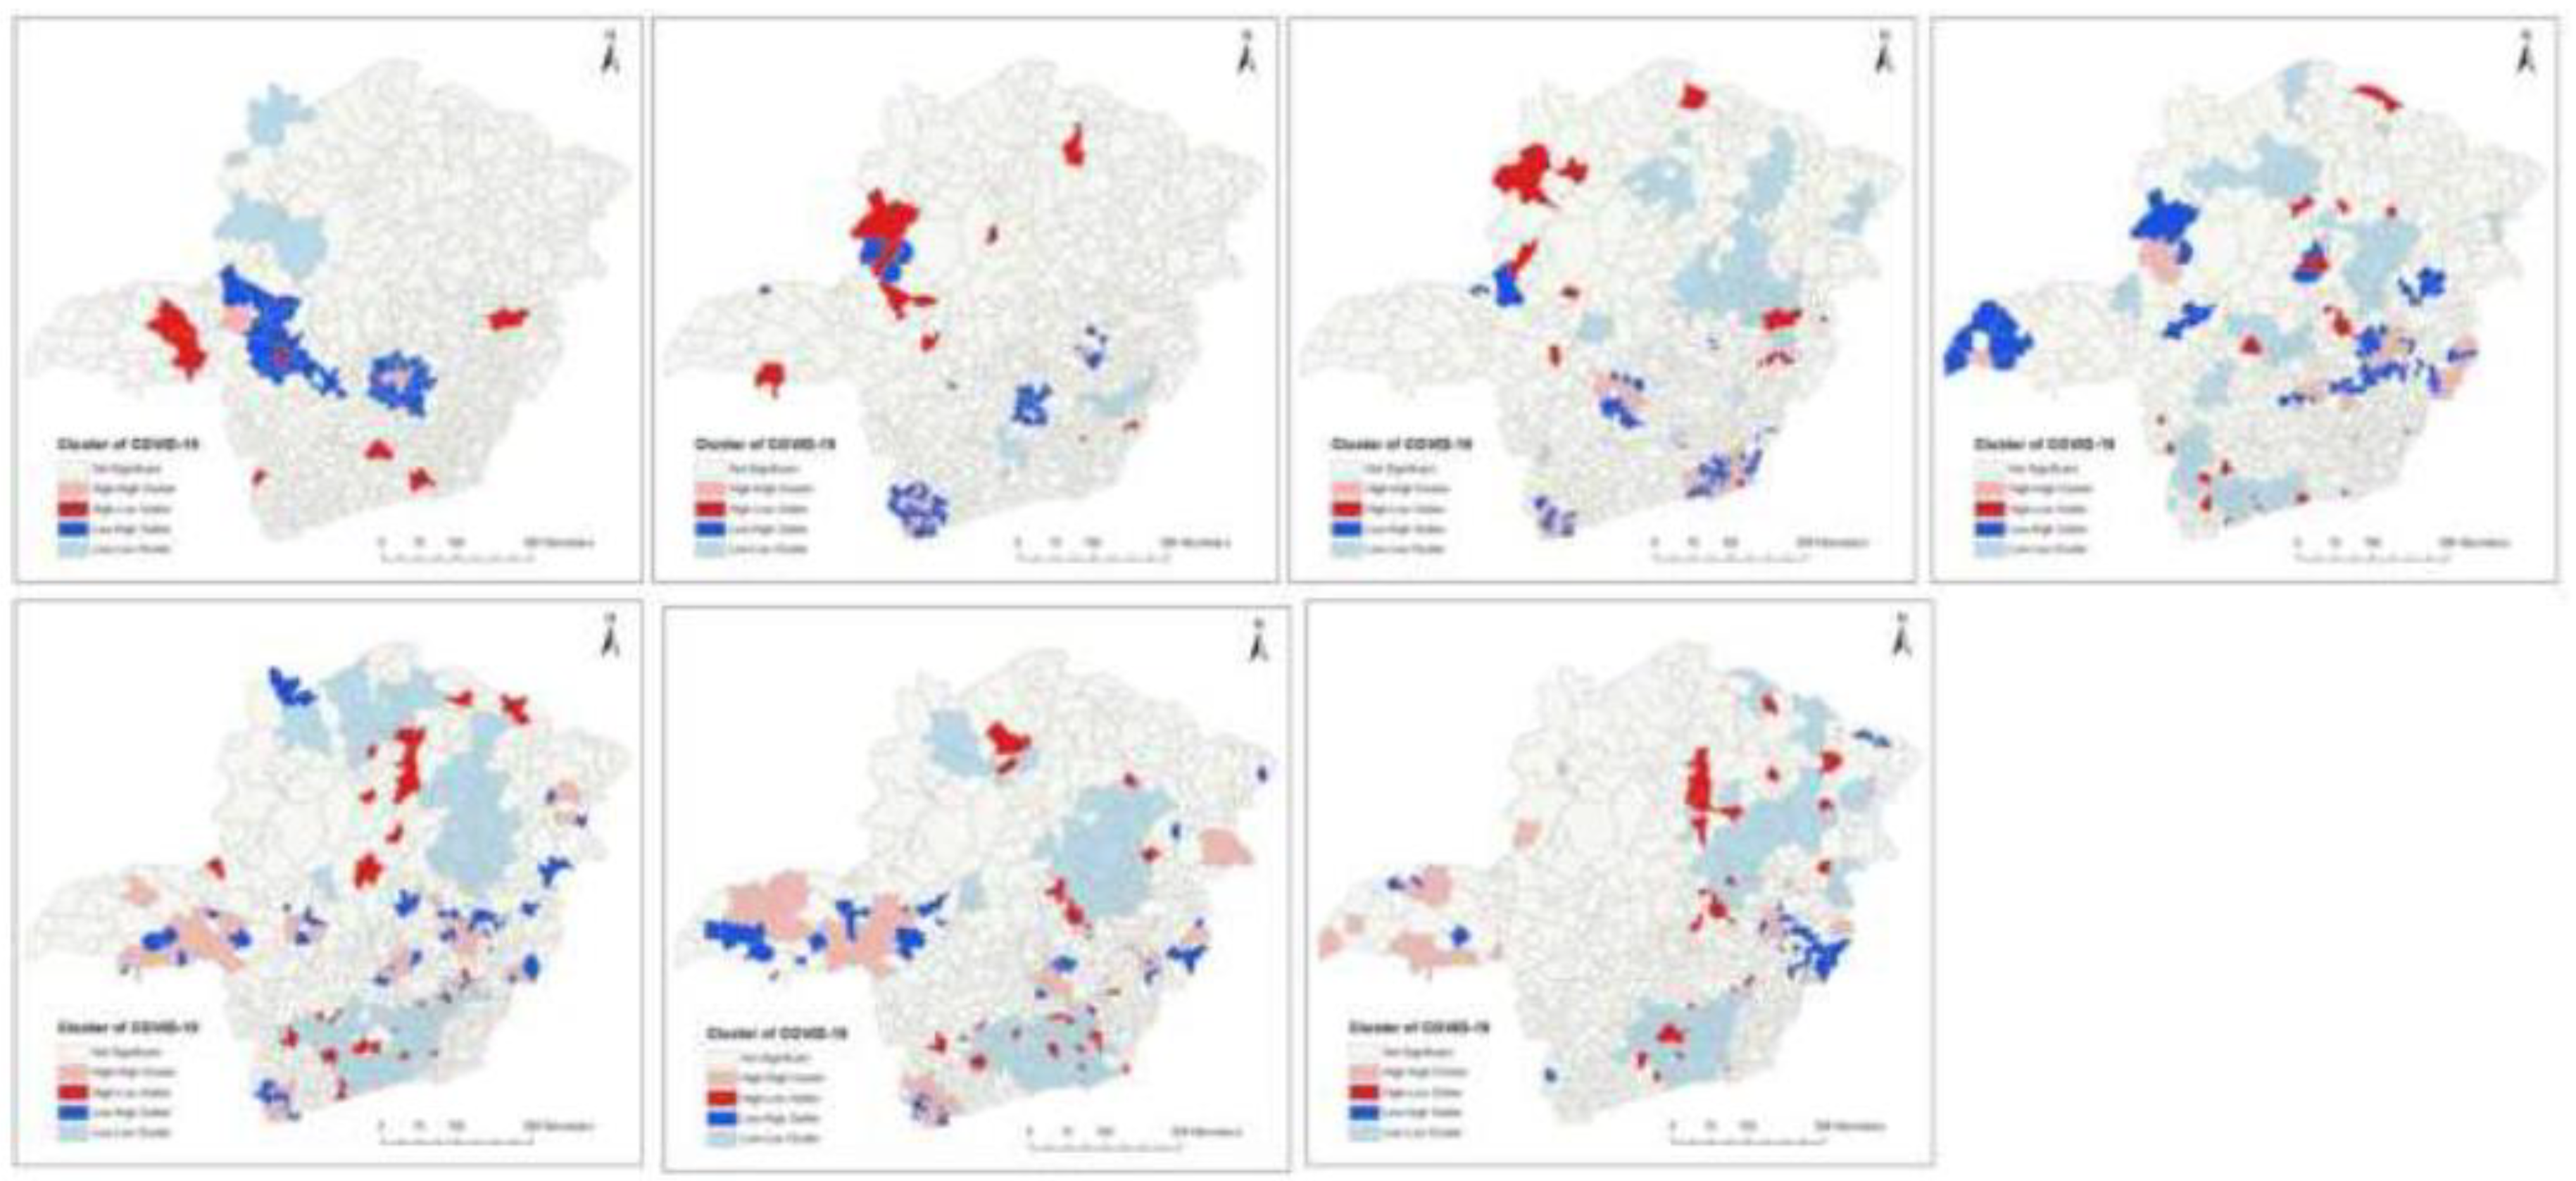
Figure 5.
Spatial clustering of COVID-19 at municipality-level in Minas Gerais state, based on the Getis-Ord Gi* statistic, from 22 Mar 2020 to 3 Oct 2020. Source: https://www.coronavirus.saude.mg.gov.br/ and IBGE, malhas digitais. From the top-left to bottom-right: Weeks 13, 15, 20, 25, 30, 35 and 40.
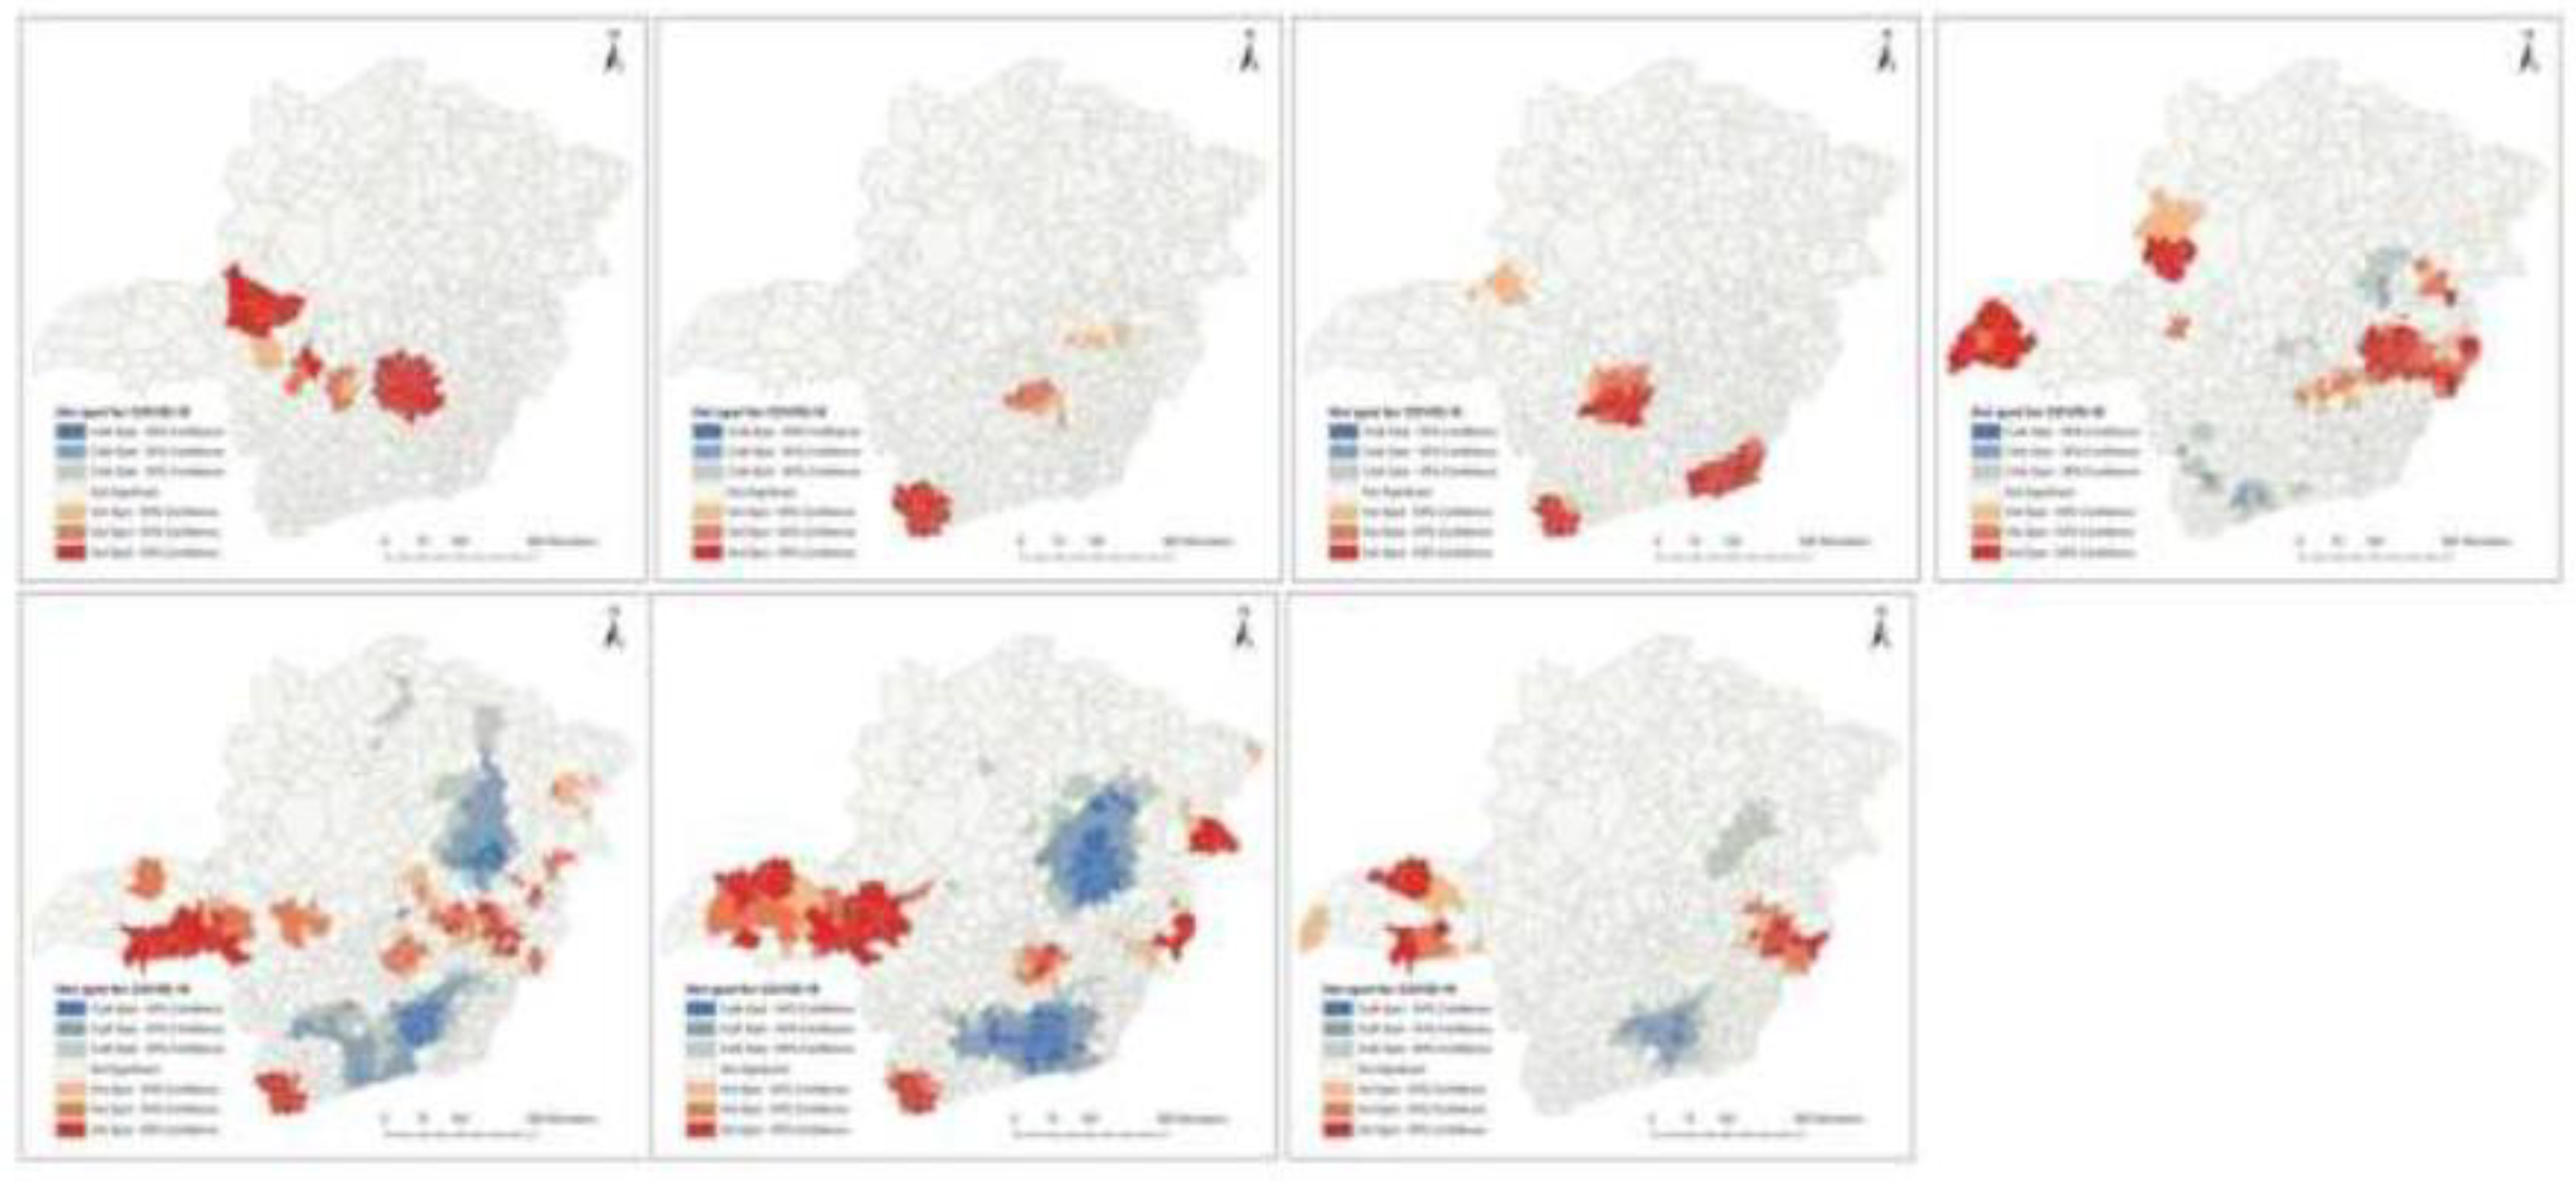
Figure 6.
Vulnerability index to COVID-19 at municipality-level in Minas Gerais state, generated using PCA from variables significantly associated with COVID-19, from 22 Mar 2020 to 3 Oct 2020. Source: https://www.coronavirus.saude.mg.gov.br/ and IBGE, malhas digitais. From left to right: vulnerability qualitative index, vulnerability with accumulated clusters and vulnerability with accumulated hotspots.
Disclaimer/Publisher’s Note: The statements, opinions and data contained in all publications are solely those of the individual author(s) and contributor(s) and not of MDPI and/or the editor(s). MDPI and/or the editor(s) disclaim responsibility for any injury to people or property resulting from any ideas, methods, instructions or products referred to in the content. |
© 2023 by the authors. Licensee MDPI, Basel, Switzerland. This article is an open access article distributed under the terms and conditions of the Creative Commons Attribution (CC BY) license (http://creativecommons.org/licenses/by/4.0/).
Copyright: This open access article is published under a Creative Commons CC BY 4.0 license, which permit the free download, distribution, and reuse, provided that the author and preprint are cited in any reuse.


