Submitted:
17 May 2023
Posted:
24 May 2023
You are already at the latest version
Abstract
The issue of polarization, as opposed to inequality, has been little explored for European countries. in this paper, using harmonized data produced by Luxembourg Income Study Database, observes income trends for 12 European countries, showing an increase in polarization in many of the countries considered. the drivers that led to this concentration of income are also analyzed, noting heterogeneous factors within countries.
Keywords:
Europe
; Income Distrubution
; Relative Distribution
; RIF-regression
Introduction
Income polarization as a notion is comparatively understudied, particularly in Europe, compared to inequality and poverty, which have both gotten a lot of attention in the literature. Although both categories are sensitive to the middle of the distribution, income polarization and inequality are two distinct phenomena. While income inequality focuses on how far apart various members of a society are from the general mean, income polarization contrasts the homogeneity within a group with the overall variability of a particular community (Castro, 2003). Income polarization therefore resembles segregation more than income disparity (Esteban and Ray, 1994).
The middle class is dwindling, which may be related to income polarization. Every civilization needs a prosperous middle class since it is linked to high income, rapid economic expansion, and social and political stability (Easterly 2001; Pressman 2007). High income polarization, on the other hand, suggests a divided society and may result in the creation of social conflict, discontent, and tension (Esteban and Ray 1994, 1999; Gradin 2000; Zhang and Kanbur 2001). Although income inequality and income polarization both indicate shifts in the middle of the income distribution, income polarization is more likely to result in social unrest and political unrest.
In addition to causing societal discontent and conflict, income polarization can also have negative effects. First of all, less social mobility results from a highly income-polarized society since it may be challenging for the comparatively poor to advance up the income scale (Motiram and Sarma 2014). Polarization of income also has an impact on economic growth (Brzezinski 2013; Ezcurra 2009). One explanation is that the social unrest and political unpredictability that underlie income polarization could adversely affect market operations, labor relations, and the security of property rights (Keefer and Knack 2002). Moreover, income polarization is detrimental to health because it lowers the availability of some public goods and increases psychosocial stress due to social friction and conflict (Pérez and Ramos 2010).
This article contributes to the literature by observing the polarization trends in 12 European countries for the period from the early 2000s to the end of the second decade of the century. To observe these trends, this paper uses the "relative distribution" method (Handcock and Morris, 1998, 1999), a non-parametric approach.
Therefore, within the relative distribution framework, the paper applies a novel methodology to identify the covariates of distributional changes. The key value offered is that it allows for a highly detailed and helpful investigation of the elements that induce income polarization.
The paper is organized as follows. Section 2 provide a literature review on the issue of polarization in Europe. Section 3 discusses the data and provides summary statistics Section 4 outlines the distinctive features of the relative distribution approach and presents the proposed RIF-regression approach. Section 5 details the main findings of the study. Section 6 provides summary conclusions.
Literature review
Income polarization, defined as a divergence of income levels in a population, has been a topic of great interest in recent years, particularly outside of Europe. Scholars have examined income polarization in countries such as China (Araar 2008; Zhang and Kanbur 2001), India (Chakravarty and Majumder 2001; Motiram and Sarma 2014), Nigeria (Awoyemi and Araar 2009; Clementi et al. 2015), Sub-Saharian Africa (Clementi et al. 2019, 2021, 2022) and Latin American countries (Deutsch, Silber and Yalonetzky 2014; Gasparini et al. 2008), as well as in more developed countries such as the United States and Canada (D’Ambrosio and Wolff 2001; Foster and Wolfson 1992, 2010). While there has been some research on income polarization in Europe, studies specifically focused on this topic are relatively rare, and little attention has been paid to income polarization in Central and Eastern European new member states (CEE NMS).
One of the few case studies on income polarization in European countries is Hussain's (2009) study of Denmark. The author uses data from the Danish Income Distribution Survey to analyze income polarization from 1987 to 2000. The results show that income polarization in Denmark increased during this time period, particularly in the 1990s. The author also notes that the increase in income polarization was driven by changes in employment patterns and wage differentials.
Gigliarano and Mosler (2009) examine income polarization in Germany from 1991 to 2005 using data from the German Socio-Economic Panel. They find that income polarization increased in Germany during this time period, with the greatest increase occurring in the early 2000s. The authors also note that the increase in income polarization was primarily driven by changes in employment patterns and wage differentials, as well as by changes in social transfers and taxes.
D’Ambrosio (2001) and Poggi and Silber (2010) analyze income polarization in Italy using data from the Italian Household Income and Wealth Survey. D'Ambrosio's study focuses on the period from 1987 to 1995, while Poggi and Silber examine the period from 1993 to 2006. Both studies find that income polarization in Italy increased during their respective time periods. Poggi and Silber note that the increase in income polarization was driven by changes in employment patterns and wage differentials, as well as by changes in social transfers and taxes.
Brzezinski (2011) examines income polarization in Poland from 1998 to 2008 using data from the Polish Household Budget Survey. The author finds that income polarization in Poland increased during this time period, particularly in the early 2000s. The increase in income polarization was primarily driven by changes in employment patterns and wage differentials, as well as by changes in social transfers and taxes.
Gradín (2000) studies income polarization in Spain using data from the Spanish Household Expenditure Survey. The author examines income polarization from 1985 to 1994 and finds that income polarization increased during this time period, particularly in the early 1990s. The increase in income polarization was primarily driven by changes in employment patterns and wage differentials.
Atkinson and Brandolini (2013) analyze income polarization in Europe using data from the European Union Statistics on Income and Living Conditions. The authors examine income polarization in several European countries from the mid-1990s to the late 2000s. They find that income polarization increased in many European countries during this time period, particularly in Southern and Eastern Europe.
Data and summary statistics
In this paper, data are used from Luxembourg Income Study Database (LIS)[1]. LIS acquires datasets with income, wealth, employment, and demographic data from many high- and middle-income countries, harmonizes them to enable cross-national comparisons. Data used cover 12 European countries[2], for which two surveys are available.
The variable used in the first part for the distribution analysis is household disposable income, net of income taxes and contributions[3].
To analyze the impact of social conditions on polarization trends in the second part of the paper, demographic, geographic, employment status and educational level of the head of household variables are used.
The period of analysis covers about two decades for all countries. Before turning to the analysis of polarization using the relative distribution method, it is interesting to look at some statistics regarding the trend of income inequality in the countries analyzed.

Table 1.
Summary statistics and inequality and polarization indices.
| Country | Year | P10 | P25 | P50 | Mean | P75 | P90 | Gini | Fgt0 | FW |
| Austria | 2000 | 15453.1 | 21222.0 | 28213.5 | 30736.8 | 36628.5 | 48616.9 | 25.4 | 13.7 | 20.1 |
| 2019 | 17059.0 | 25105.6 | 34097.5 | 37783.3 | 46174.6 | 61489.0 | 27.4 | 15.4 | 21.7 | |
| Belgium | 2000 | 14104.1 | 18805.4 | 27002.7 | 30313.4 | 35868.5 | 47013.6 | 28.8 | 16.2 | 22.0 |
| 2017 | 15335.6 | 21104.6 | 30880.9 | 32847.5 | 40884.2 | 51391.1 | 26.0 | 18.4 | 22.1 | |
| Denmark | 2000 | 15953.2 | 20758.6 | 28254.5 | 29686.8 | 35772.6 | 43914.9 | 22.5 | 13.1 | 18.2 |
| 2016 | 17606.8 | 22771.4 | 31255.8 | 34168.6 | 41277.4 | 52309.4 | 25.5 | 12.8 | 20.5 | |
| Finland | 2000 | 12605.8 | 16324.7 | 22272.2 | 24495.9 | 28995.4 | 36976.2 | 25.3 | 12.7 | 20.0 |
| 2016 | 15827.0 | 20916.9 | 28139.0 | 31381.4 | 37410.7 | 48046.0 | 25.8 | 12.6 | 20.4 | |
| France | 2000 | 12744.5 | 17415.9 | 24065.7 | 27858.2 | 33224.6 | 46376.4 | 29.4 | 14.9 | 23.6 |
| 2018 | 13815.4 | 19275.9 | 26970.8 | 31095.5 | 36605.6 | 50458.9 | 30.2 | 16.0 | 23.0 | |
| Germany | 2000 | 15184.2 | 20825.9 | 27538.6 | 30606.1 | 36915.0 | 48383.3 | 25.9 | 12.5 | 20.7 |
| 2019 | 15291.0 | 22182.4 | 31483.6 | 35222.0 | 42200.6 | 56566.9 | 29.3 | 17.2 | 22.8 | |
| Ireland | 2000 | 9322.0 | 14279.8 | 22236.7 | 25007.8 | 31176.6 | 41731.6 | 31.3 | 22.5 | 26.4 |
| 2019 | 16008.1 | 21494.2 | 30308.7 | 34853.2 | 42441.0 | 55680.9 | 28.7 | 15.5 | 23.8 | |
| Italy | 2000 | 8945.6 | 13425.4 | 20400.7 | 23793.6 | 29665.8 | 40105.7 | 33.4 | 20.1 | 28.2 |
| 2016 | 8206.8 | 12741.7 | 19503.7 | 22359.3 | 28518.8 | 39064.8 | 33.9 | 21.1 | 29.1 | |
| Luxembourg | 2000 | 21288.6 | 27628.0 | 37282.0 | 42403.1 | 51239.9 | 69413.8 | 26.2 | 12.3 | 22.8 |
| 2019 | 21967.5 | 30451.9 | 43198.6 | 49813.8 | 61648.5 | 82427.8 | 29.6 | 16.4 | 25.5 | |
| Netherland | 1999 | 15596.0 | 20104.8 | 26656.0 | 28670.3 | 34764.7 | 43537.3 | 23.1 | 11.1 | 19.0 |
| 2018 | 16802.5 | 22378.2 | 30833.0 | 34284.5 | 41330.4 | 53688.4 | 27.0 | 13.8 | 21.6 | |
| Spain | 2000 | 9857.0 | 14486.5 | 22246.8 | 26265.5 | 32556.0 | 46205.8 | 33.7 | 20.8 | 29.2 |
| 2016 | 8852.7 | 14606.6 | 23047.6 | 26407.8 | 34173.7 | 46516.1 | 34.1 | 22.6 | 29.6 | |
| United Kingdom | 2000 | 10543.7 | 14622.7 | 22152.3 | 27690.4 | 32969.3 | 47166.8 | 35.7 | 20.3 | 29.5 |
| 2020 | 14228.5 | 19148.3 | 27222.5 | 31741.7 | 38876.6 | 54271.9 | 30.5 | 15.5 | 25.8 |
Source: Authors’ calculations based on LIS data.
Methodology
Polarization and Relative Distribution
In the analysis of income distribution, the topic of polarization has gained significance over the past 20 years (Foster and Wolfson, 1992; Esteban and Ray, 1994; Wolfson, 1994, 1997), and it now appears that polarization is widely recognized as a separate concept from inequality.
Regardless of where a community is positioned along the income scale, a broad definition of income polarization (Esteban and Ray, 1994) describes it as the "clustering" of a population around two or more poles of the distribution. In a multi-group setting, the idea of income polarization aims to quantify the degree of potential conflict present in a given distribution (see Esteban and Ray, 1999, 2008, 2011). The concept is to think of society as a collection of groups, where members of one group have traits in common with one another (i.e., a sense of "identification") but vary from members of other groups (i.e., a sense of "alienation") in terms of the same traits.
Therefore, political or social conflict is more likely the more homogeneous and separate the groups are, that is, when the within-group income distribution is more concentrated around its local mean and the between-group income distance is greater (see, inter alia, Gradín, 2000, Milanovic, 2000, D’Ambrosio, 2001, Zhang and Kanbur, 2001, Montalvo and Reynal-Querol, 2002, Duclos et al., 2004, Lasso de la Vega and Urrutia, 2006, Esteban et al., 2007, Gigliarano and Mosler, 2009, and Poggi and Silber, 2010).
While summary measures of income polarization are frequently used in literature, a different (yet non-parametric) approach has emerged to measure the growth of the middle class and the level of household income polarization in a number of middle- and high-income nations. This approach is known as the "relative distribution" and combines the strengths of summary polarization indices with the details of distributional change provided by the kernel density estimates.
The relative distribution method has been employed by Alderson et al. (2005), Massari et al. (2009a,b), Alderson and Doran (2011), Borraz et al. (2013), Clementi and Schettino (2013, 2015), Clementi et al. (2015, 2017, 2019, 2021, 2022), Molini and Paci (2015), Petrarca and Ricciuti (2016), Nissanov and Pittau (2016).
More formally,[4] let Y0 be the income variable for the reference population and Y the income variable for the comparison population. The relative distribution is defined as the ratio of the density of the comparison population to the density of the reference population evaluated at the relative data r:
where
f (·) and f0 (·) denote the density functions of Y
and Y0, respectively, and yr =
is
the quantile function of Y0. When no changes occur between
the two distributions, g(r) has a uniform distribution; a value of g(r)
higher (lower) than 1 means that the share of households in the comparison
population is higher (lower) than the corresponding share in the reference
population at the rth quantile of the latter.
One
of the major advantages of this method is the possibility to decompose the
relative distribution into changes in location and changes in shape. The
decomposition can be written as:
F
0L
(yr)
is the
median-adjusted density function:
where the value is the difference between the medians of the comparison and reference distributions—alternative indices like the mean and/or multiplicative location shift can also be considered.
The relative distribution approach also includes a median relative polarization index, which is a measurement of the degree to which the comparison distribution is more polarized than the reference one:
The MRP index can be additively decomposed into the contributions to overall polarization made by the lower and upper halves of the median-adjusted relative distribution, enabling one to distinguish downgrading from upgrading. In terms of data, the lower relative polarization (LRP) index and the upper relative polarization (URP) index can be calculated as shown in Equations (5) and (6):
with MRP = . The MRP, LRP and URP indexes range from -1 to 1, and equal 0 when there is no change.
RIF-regression model
To analyze the drivers of income polarization in the countries under consideration will be used the Recentered Influence Function (RIF) regression. The strength of the correlation between a modest change in one covariate and a change in a relative polarization index (such as MRP, LRP, or URP) can be calculated using this method.
The influence function (Cowell and Victoria-Feser, 1996) captures the effects of explanatory variables on the distributional statistic of interest while also reflecting the influence of a single observation on a given distributional statistic, such as a particular quantile.
Firpo et al. (2009) propose a simple modification in which the quantile is added back to the influence function, resulting in what the authors call the “re-centered influence function” (RIF):
Where is the quantile of the distribution of household incomes , and is the influence function. With this result, Firpo et al. (2009) show that we can model the conditional expectation of the RIF as a simple linear function of the explanatory variables.
In practice, following the Firpo et al.’s (2009) procedure, one can first obtain an estimate of the RIF for each income by using Equation (6) above; then, the following equation can be estimated using an ordinary least squares method (OLS):
where is a constant, denotes a realization of the explanatory variable, is the corresponding coefficient, and is the corresponding error term. The estimated model parameters , termed “unconditional quantile partial effect”, can be interpreted as the effect of a small change in the distribution of on the quintile – when the distribution of other covariates remains unchanged – or as linear approximation of the effect of large changes of on (e.g., Firpo et al., 2018).
Although Firpo et al. (2009) initially concentrated on the analysis of partial eects of explanatory variables on unconditional quantiles of the dependent variable, the underlying ideas of this methodology have been applied to other distributional statistics (for example, see Essama-Nssah and Lambert 2012, Rios-Avila 2020, and Jann 2021)[5].
Results
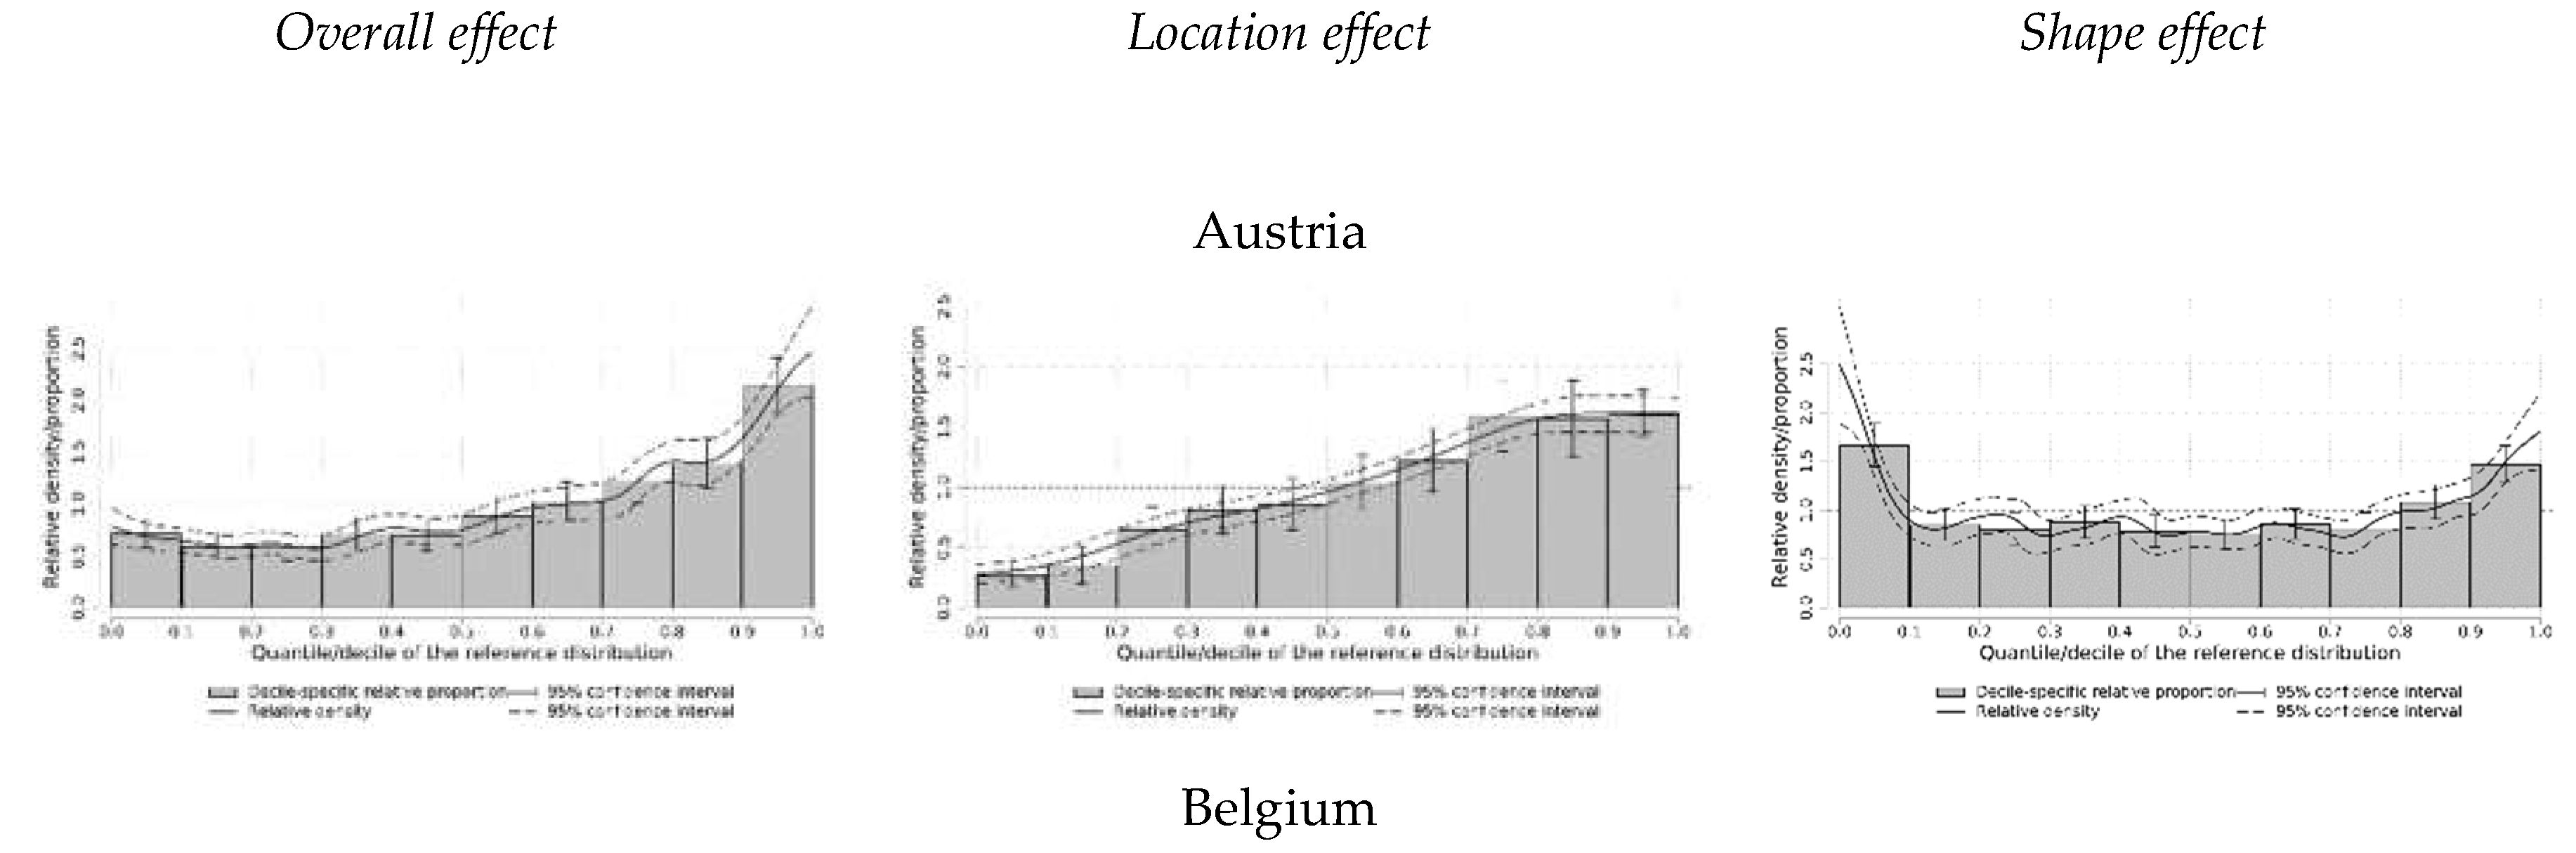
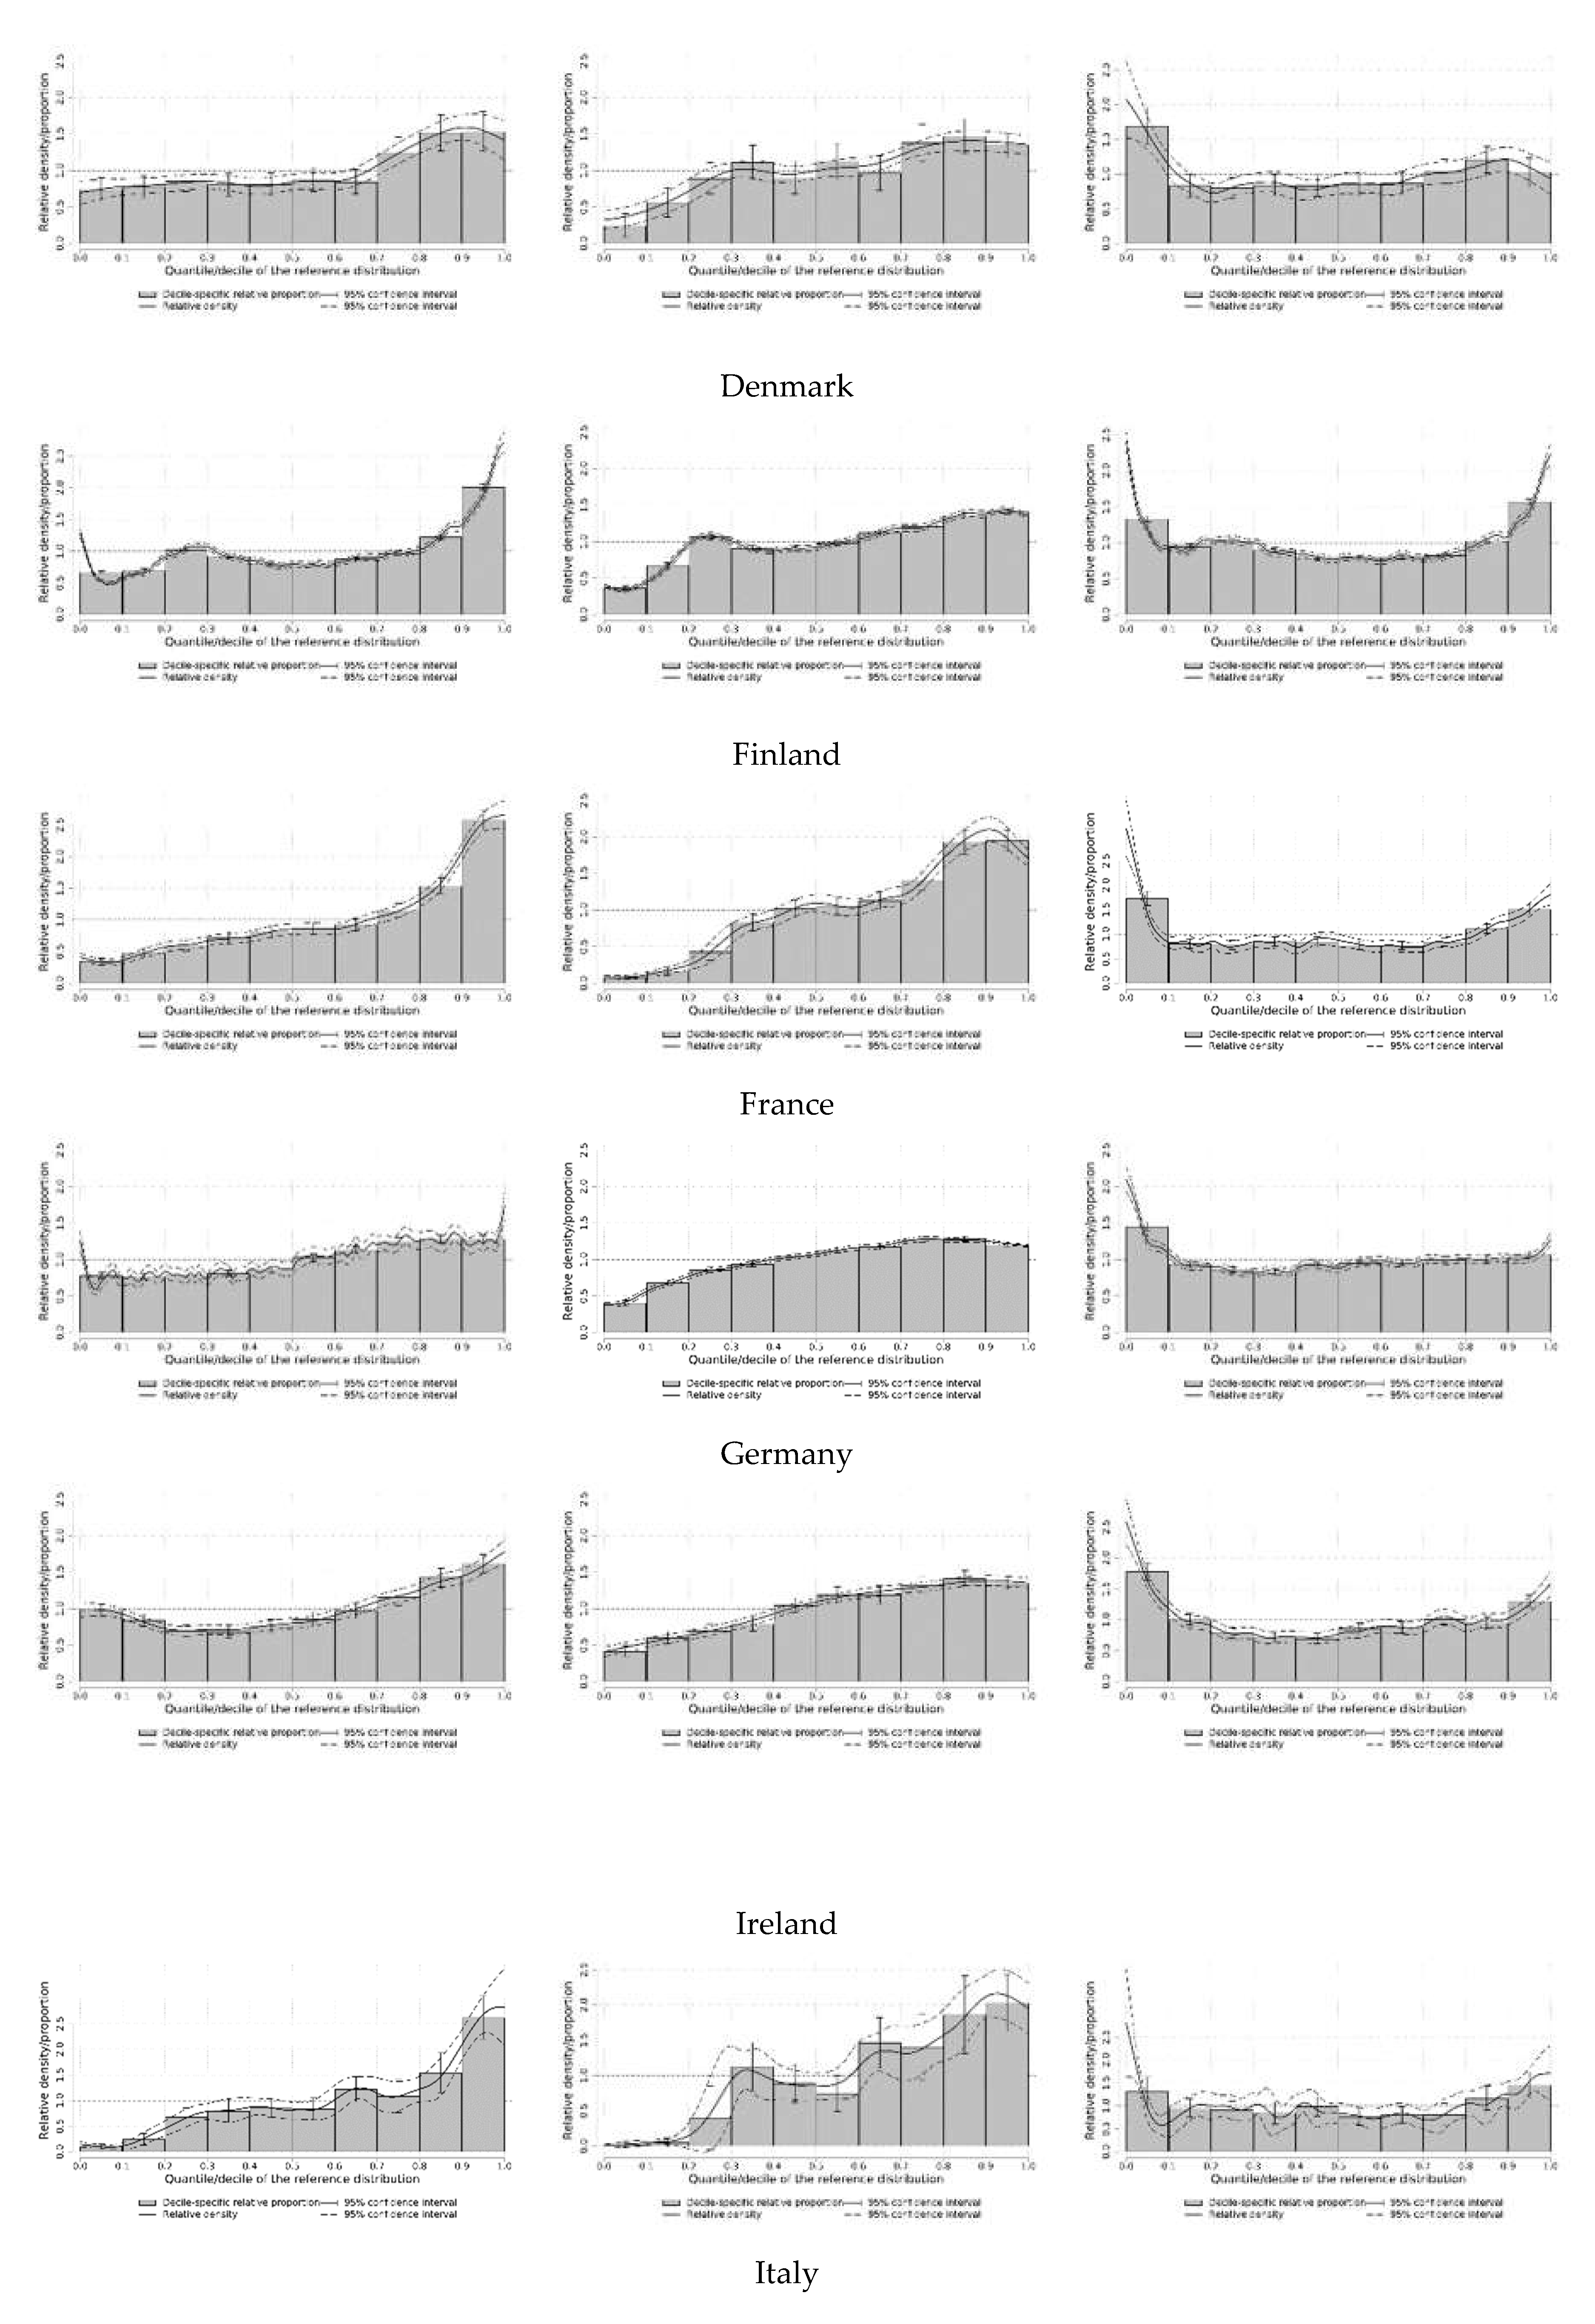
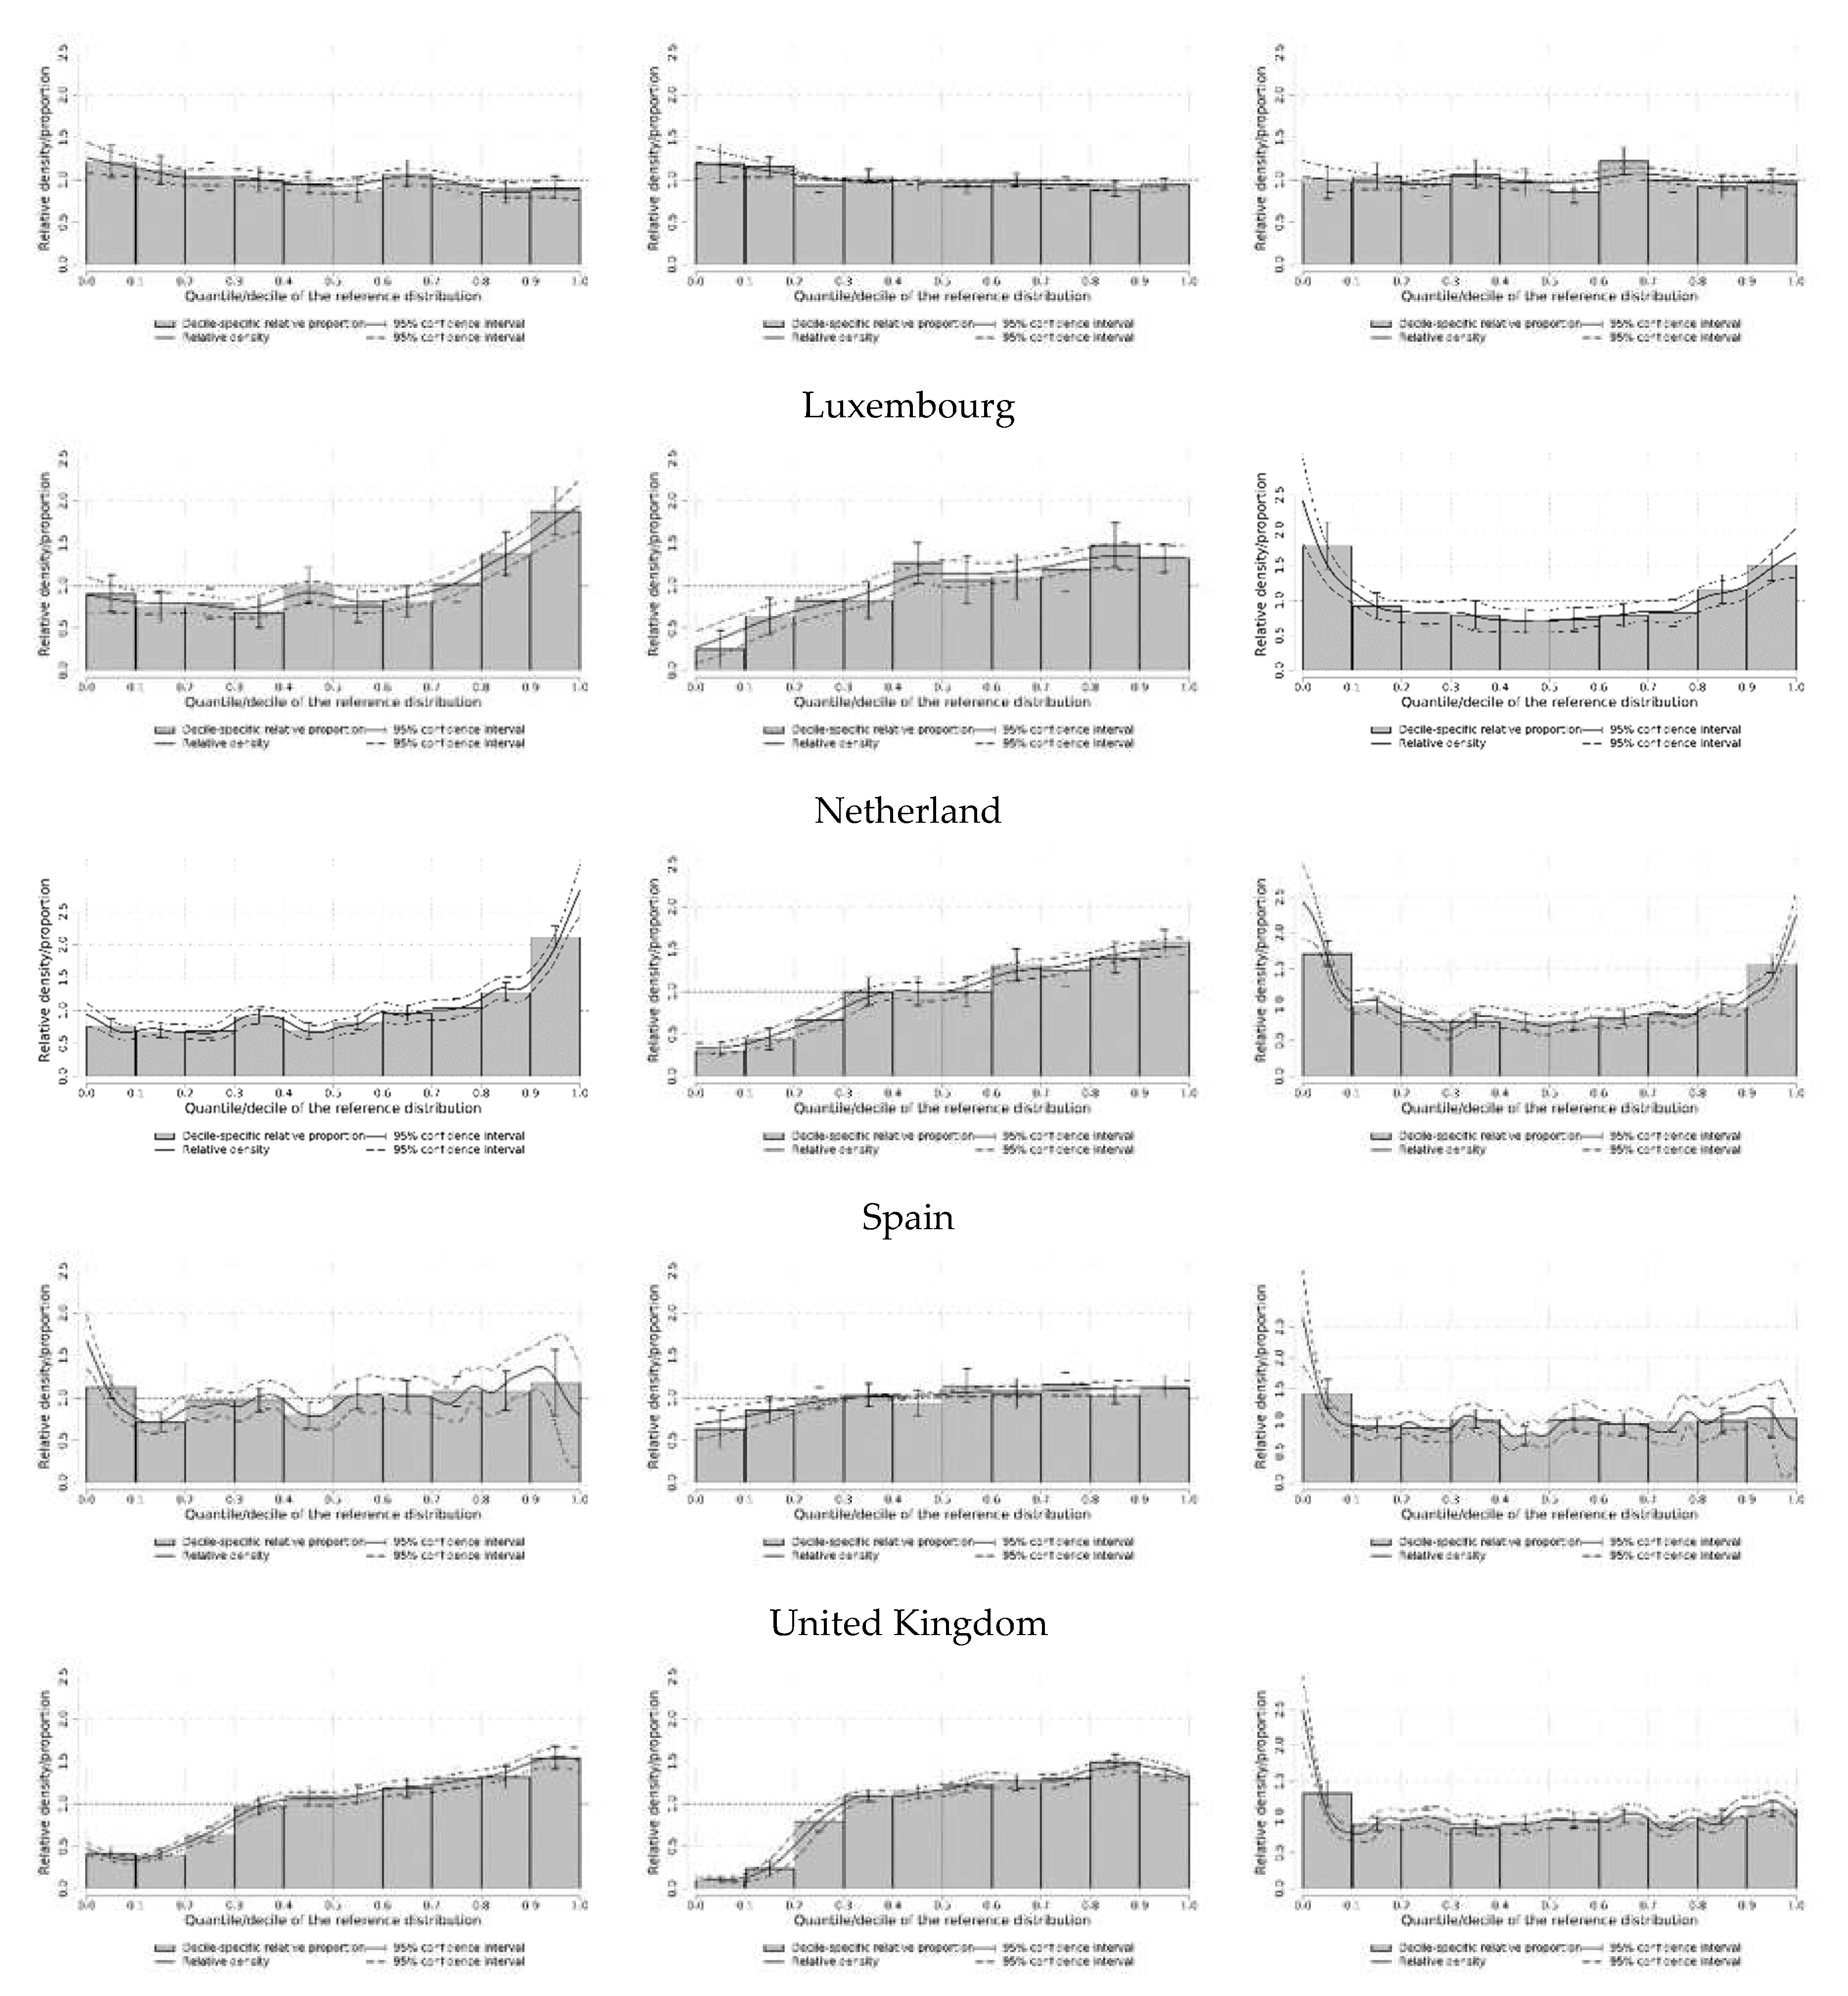
Relative distribution results
Relative distribution indices show a homogenous pattern throughout European countries surveyed. MRP, LRP and URP indices are specified in Table 2, and graphs for each country, that allow an immediate and easy-to-read view of changes in distribution, are available in the appendix. All are undergoing an accentuated polarization process as evidenced by the positive and significant value of the MRP.
There are two important aspects to consider. as noted in Table 1, the results obtained with this method are contrasted with the inequality results obtained with traditional measures (e.g., Gini index), where we do not observe a clear and common trend across countries. This underscores the importance of looking at the income distribution from different vantage points as well, to capture changes in the distribution, as relative distribution does.
The second aspect to consider is where in what part of the distribution this concentration occurs. In 9 out of 11 countries (we exclude Italy from the analysis, where the index values are non-significant), the LRP index values is higher than the URP value, showing a more pronounced concentration in the lower tail than in the upper tail. This aspect is very significant, because it leads, on the one hand, to a general worsening of the income distribution, and on the other hand, a progressive emptying of the middle class, which, as the results show, is sucked into the lower tail of the distribution.
Rif-regression results
In this section are presented the results of RIF-regressions for the three polarization indices and different independent variables. The independent variables are divided into different categories, such as the sector of employment, education level, country of birth, and area of residence. Each category has a base group against which the other groups are compared. The coefficients and standard errors for each independent variable are presented in the tables. Asterisks next to a coefficient indicate the level of statistical significance of that variable: *** denotes significance at the 1% level, ** at the 5% level, and * at the 10% level.
Table 3 presents the results of a RIF-regression analysis with the MRP index as the dependent variable and several independent variables. The independent variables are divided into different categories, and each category has a base group against which the other groups are compared. The results indicate that the sector of employment, education level, country of birth, area of residence, and age have significant effects on the median relative polarization in some countries. For example, being employed in the agricultural sector has a positive effect on the median relative polarization in Austria and Belgium, while the industry sector has a negative effect in some countries. Education level also has a significant effect, with those having a high level of education having a positive effect on the median relative polarization in all countries. The country of birth and area of residence also have significant effects, with being born outside the country and living in rural areas having negative effects on the median relative polarization.
Table 4 shows the results of a regression analysis with the dependent variable being the lower relative polarization index of income, and several independent variables are used to explain the variation in the dependent variable across different sectors and countries. The independent variables are grouped into four categories: sector, education, country of birth, and area. The coefficients of these binary variables indicate the effect of being in that subcategory on the dependent variable compared to the base category. The results indicate that the industry and services sector have a positive effect on the dependent variable, compared to not being employed. Having a high level of education has a positive effect, while being born outside the country has a negative effect on the dependent variable. Living in rural areas also has a negative effect on the dependent variable.
Table 5 displays the results of a regression analysis where the dependent variable is the upper relative polarization index of income, and various independent variables are examined across different countries. The results show that workers in the agricultural sector have a positive and significant effect on the upper relative polarization index of income compared to the not employed group, while workers in the industry and services sectors have a negative and significant effect. Education level also has a significant effect, with workers having a high education level having a positive and significant effect on the index compared to those with a low education level. Being born outside the country has a negative and significant effect on the index, while living in rural areas has a negative and significant effect on the index.
Conclusions
Income polarization is a concept that is gaining increasing importance in the analysis of income distribution in Europe. Although often confused with income inequality, income polarization is a distinct phenomenon that focuses on the homogeneity within a group rather than the differences between groups. The reduction of the middle class is a significant factor that may contribute to income polarization. High levels of income polarization can lead to social unrest, political instability, and economic downturns. This article has used the relative distribution method and econometric decomposition to examine the trends in income polarization in 12 European countries over the past two decades. The analysis has identified the main drivers of polarization and their impact on observable and unobservable characteristics. The data used in the analysis were obtained from the Luxembourg Income Study Database (LIS) and cover income, wealth, employment, and demographic data. The paper has contributed to the literature by providing a granular analysis of distributional changes that an analysis based on standard inequality decompositions would not allow. The results of the analysis show that polarization has increased over the past two decades in most of the countries examined, and the main drivers of this trend have been changes in the labor market and education. The implications of these findings are significant, as income polarization has far-reaching effects on society, the economy, and individual well-being. A highly polarized society can result in the creation of social conflict, discontent, and tension. It can also lead to a lack of social mobility, economic growth, and negatively impact health outcomes. Therefore, policies aimed at reducing income polarization are necessary to promote social and political stability, economic growth, and individual well-being. The findings of this study suggest that policies focused on improving access to education and addressing labor market issues are key to reducing income polarization in Europe. In addition, policies aimed at promoting more inclusive growth and reducing the concentration of wealth can also be effective in reducing income polarization. Overall, this study contributes to the growing literature on income polarization in Europe by providing a granular analysis of the main drivers of polarization and their impact on distributional changes. The findings of this study can inform policymakers and researchers on the need for policies aimed at reducing income polarization to promote social and political stability, economic growth, and individual well-being. The results also highlight the importance of addressing labor market and education issues to reduce income polarization. Finally, further research is needed to explore the complex relationships between income polarization, inequality, and poverty, and to identify effective policy measures to address these issues.
Appendix
Figure A1.
Source: Authors’ calculations based on LIS data.
References
- S. Alderson, J. Beckfield, and F. Nielsen. 2005. Exactly How Has Income Inequality Changed? Patterns of Distributional Change in Core Societies. International Journal of Comparative Sociology, 46:405-423. [CrossRef]
- Alderson, A. S., & Doran, K. 2011. Global inequality, within-nation inequality, and the changing distribution of income in seven transitional and middle-income societies. Inequality Beyond Globalization: Economic Changes, Social Transformations, and the Dynamics of Inequality, 183-200.
- Borraz, F., González, N., & Rossi, M. 2013. Polarization and the middle class in Uruguay. Latin american journal of economics, 50(2), 289-326.
- Brzezinski, M. 2013. “Income Polarization and Economic Growth.” Working Paper, National Bank of Poland, Poland.
- Castro, J. V. 2003. “Regional Convergence, Polarisation and Mobility in the European Union, 1980–1996.” Journal of European Integration 25 (1):73–86. [CrossRef]
- Clementi, F. and Schettino, F. 2013. Income polarization in Brazil, 2001-2011: a distributional analysis using PNAD data. Economics Bulletin, 33(3). [CrossRef]
- Clementi, F. and Schettino, F. 2015. Declining inequality in Brazil in the 2000s: what is hidden behind?. Journal of International Development, 27(7), 929-952. [CrossRef]
- Clementi, F., Dabalen A. L., Molini, V., and Schettino, F. 2015. When the Centre Cannot Hold: Patterns of Polarization in Nigeria. Review of Income and Wealth. [CrossRef]
- Clementi, F., Fabiani, M. and Molini, V. 2019. The devil is in the detail: growth, inequality and poverty reduction in Africa in the last two decades in Journal Of African Economies; 28.4; Oxford, Oxford University Press; pp. 408 – 434.
- Clementi, F., Fabiani, M. and Molini, V. 2021. How polarized is sub-Saharan Africa? A look at the regional distribution of consumption expenditure in the 2000s in Oxford Economic Papers; 73; Oxford, Oxford University Press; pp. 796 – 819. [CrossRef]
- Clementi, F., Fabiani, M., Molini, V. and Zizzamia, R.. 2022. Are we really painting the devil on the walls? Polarization and its drivers in Sub-Saharan Africa in the past two decades in Journal Of African Economies; 31; Oxford, Oxford University Press; pp. 124 - 146. [CrossRef]
- Clementi, F., Molini, V. and Schettino, F. 2017. All that Glitters is Not Gold: Polarization Amid Poverty Reduction in Ghana. World Development. [CrossRef]
- D’Ambrosio, C. 2001. Household Characteristics and the Distribution of Income in Italy: An Application of Social Distance Measures. Review of Income and Wealth, 47:43-64. [CrossRef]
- de la Vega, M. C. L., & Urrutia, A. M. 2006. An alternative formulation of the Esteban-Gradín-Ray extended measure of polarization. Journal of Income Distribution, 15(3-4), 42-54. [CrossRef]
- Easterly, W. 2001. “The Middle Class Consensus and Economic Development.” Journal of Economic Growth 6:317–35.
- Esteban, J.-M., and D. Ray. 1994. “On the Measurement of Polarization.” Econometrica: Journal of the Econometric Society 62:819–51.
- Esteban, J.-M. and Ray, D. 1999. Conflict and distribution, Journal of Economic Theory, 87, 379–415. [CrossRef]
- Esteban, J.-M. and Ray, D. 2008. Polarization, fractionalization and conflict, Journal of Peace Research, 45, 163–82.
- Esteban, J.-M. and Ray, D. 2011. Linking conflict to inequality and polarization, American Economic Review, 101, 1345–74.
- Esteban, J., Gradín, C., & Ray, D. 2007. An extension of a measure of polarization, with an application to the income distribution of five OECD countries. The Journal of Economic Inequality, 5, 1-19. [CrossRef]
- Ezcurra, R. 2009. “Does Income Polarization Affect Economic Growth? the Case of the European Regions.” Regional Studies 43:267–85. [CrossRef]
- Firpo S, Fortin N and Lemieux T (2018) Decomposing Wage Distributions Using Recentered Inuence Function Regressions. Econometrics 6: 28. [CrossRef]
- Firpo S, Fortin NM and Lemieux T (2009) Unconditional Quantile Regressions. Econometrica 77: 953-973.
- Fortin N, Lemieux T and Firpo S (2011) Decomposition Methods in Economics. In: Ashenfelter O and Card D (eds.) Handbook of Labor Economics, volume 4A. Amsterdam: North-Holland, pp. 1-102.
- Foster J. E.,Wolfson M. C. 1992. Polarization and the Decline of the Middle Class: Canada and the US. OPHIWorking Paper 31, University of Oxford,Oxford, 1992. 8: 247–73.
- Gigliarano, C., & Mosler, K. 2009. Constructing indices of multivariate polarization. The Journal of Economic Inequality, 7, 435-460. [CrossRef]
- Gradín, C. 2000. “Polarization by Sub-Populations in Spain, 1973–91.” Review of Income and Wealth 46:457–74.
- Handcock M. S., Morris M. 1998. ‘Relative Distribution Methods’, Sociological Methodology, 28: 53–97.
- Handcock M. S., Morris M. 1999. Relative Distribution Methods in the Social Sciences. New York, NY: Springer.
- Keefer, P., and S. Knack. 2002. “Polarization, Politics and Property Rights: Links Between Inequality and Growth.” Public Choice 111:127–54.
- Massari, R., Pittau, M. G. and Zelli, R. 2009a. A Dwindling Middle Class? Italian Evidence in the 2000s. Journal of Economic Inequality, 7:333-350. [CrossRef]
- Massari, R., Pittau, M. G. and Zelli, R. 2009b. Caos calmo: l’evoluzione dei redditi familiari in Italia. In L. Cappellari, P. Naticchioni, and S. Staffolani, editors, L’Italia delle disuguaglianze, pages 19-28. Carocci editore, Rome.
- Milanovic, B. 2000. The median-voter hypothesis, income inequality, and income redistribution: an empirical test with the required data. European Journal of Political Economy, 16(3), 367-410. [CrossRef]
- Molini, V., & Paci, P. 2015. Poverty reduction in Ghana—Progress and challenges.
- Montalvo, J., & Reynal-Querol, M. 2002. Why ethnic fractionalization? Polarization, ethnic conflict and growth. Polarization, Ethnic Conflict and Growth (September 2002). UPF Economics and Business Working Paper, (660).
- Motiram, S., and N. Sarma. 2014. “Polarization, Inequality, and Growth: The Indian Experience.” Oxford Development Studies 42:297–318. [CrossRef]
- Nissanov, Z., & Pittau, M. G. 2016. Measuring changes in the Russian middle class between 1992 and 2008: a nonparametric distributional analysis. Empirical Economics, 50, 503-530. [CrossRef]
- Pérez, C. B., and X. Ramos. 2010. “Polarization and Health.” Review of Income and Wealth 56:171–85.
- Petrarca, I., & Ricciuti, R.2016. Relative income distribution in six European countries. In Inequality after the 20th Century: Papers from the Sixth ECINEQ Meeting (Vol. 24, pp. 361-386). Emerald Group Publishing Limited.
- Poggi, A., & Silber, J. 2010. On polarization and mobility: a look at polarization in the wage–career profile in Italy. Review of Income and Wealth, 56(1), 123-140.
- Pressman, S. 2007. “The Decline of the Middle Class: An International Perspective.” Journal of Economic Issues 41:181–200.
- Wolfson, M.C. 1994. When inequalities diverge, The American Economic Review, 84, 353–8.
- Wolfson, M. C. 1997. Divergent inequalities: theory and empirical results. Review of Income and Wealth, 43(4), 401-421. [CrossRef]
- Zhang, X., and R. Kanbur. 2001. “What Difference Do Polarisation Measures Make? An Application to China.” Journal of Development Studies 37:85–98. [CrossRef]
Table 2.
Polarization indices, by country.
| Country | Indexa | Value | LBb | UBc | p-valued |
|---|---|---|---|---|---|
| Austria | MRP | 0.150 | 0.113 | 0.187 | 0.000 |
| LRP | 0.161 | 0.099 | 0.222 | 0.000 | |
| URP | 0.139 | 0.091 | 0.188 | 0.000 | |
| Belgium | MRP | 0.102 | 0.065 | 0.139 | 0.000 |
| LRP | 0.148 | 0.084 | 0.212 | 0.000 | |
| URP | 0.056 | 0.003 | 0.109 | 0.036 | |
| Denmark | MRP | 0.127 | 0.120 | 0.134 | 0.000 |
| LRP | 0.101 | 0.089 | 0.113 | 0.000 | |
| URP | 0.153 | 0.143 | 0.163 | 0.000 | |
| Finland | MRP | 0.155 | 0.134 | 0.177 | 0.000 |
| LRP | 0.157 | 0.117 | 0.197 | 0.000 | |
| URP | 0.153 | 0.126 | 0.181 | 0.000 | |
| France | MRP | 0.065 | 0.055 | 0.075 | 0.000 |
| LRP | 0.105 | 0.089 | 0.121 | 0.000 | |
| URP | 0.026 | 0.014 | 0.038 | 0.000 | |
| Germany | MRP | 0.148 | 0.127 | 0.168 | 0.000 |
| LRP | 0.213 | 0.178 | 0.247 | 0.000 | |
| URP | 0.082 | 0.054 | 0.111 | 0.000 | |
| Ireland | MRP | 0.120 | 0.070 | 0.170 | 0.000 |
| LRP | 0.090 | 0.001 | 0.180 | 0.047 | |
| URP | 0.150 | 0.088 | 0.211 | 0.000 | |
| Italy | MRP | -0.005 | -0.038 | 0.028 | 0.772 |
| LRP | 0.007 | -0.054 | 0.068 | 0.823 | |
| URP | -0.017 | -0.058 | 0.024 | 0.416 | |
| Luxembourg | MRP | 0.178 | 0.130 | 0.227 | 0.000 |
| LRP | 0.234 | 0.146 | 0.321 | 0.000 | |
| URP | 0.122 | 0.065 | 0.179 | 0.000 | |
| Netherland | MRP | 0.167 | 0.141 | 0.193 | 0.000 |
| LRP | 0.188 | 0.143 | 0.232 | 0.000 | |
| URP | 0.146 | 0.111 | 0.181 | 0.000 | |
| Spain | MRP | 0.045 | 0.016 | 0.075 | 0.002 |
| LRP | 0.081 | 0.030 | 0.132 | 0.002 | |
| URP | 0.010 | -0.025 | 0.046 | 0.569 | |
| United Kingdom | MRP | 0.058 | 0.030 | 0.085 | 0.000 |
| LRP | 0.083 | 0.035 | 0.132 | 0.001 | |
| URP | 0.032 | 0.002 | 0.061 | 0.031 |
Source: Authors’ calculations based on LIS data. Notes: aMRP = median relative polarization index; LRP = lower relative polarization index; URP = upper relative polarization index. bLower bound of the 95% confidence interval. cUpper bound of the 95% confidence interval. dRefers to the null hypothesis of no change with respect to the reference distribution, i.e. that the index equals 0.
Table 3.
Rif-regression results, MRP index.
| Austria | Belgium | Denmark | Finland | France | Germany | Ireland | Italy | Luxembourg | Netherland | Spain | U.K. | |
| Sector | ||||||||||||
| Not employed | (base) | (base) | (base) | (base) | (base) | (base) | (base) | (base) | (base) | (base) | (base) | (base) |
| Agriculture |
0.090** (0.040) |
0.095** (0.039) |
0.926*** (0.247) |
0.171*** (0.050) |
0.029 (0.173) |
-0.217 (0.214) |
0.047* (0.025) |
0.131*** (0.043) |
0.021 (0.053) |
0.195*** (0.061) |
0.078* (0.041) |
0.088 (0.313) |
| Industry |
0.004 (0.018) |
-0.002 (0.014) |
0.656*** (0.084) |
0.066** (0.029) |
-0.327*** (0.072) |
-0.062 (0.043) |
0.005 (0.013) |
0.000 (0.033) |
0.008 (0.016) |
-0.096*** (0.028) |
-0.034* (0.020) |
0.360*** (0.059) |
| Services |
0.002 (0.012) |
-0.015 (0.010) |
0.672*** (0.050) |
0.033 (0.022) |
-0.306*** (0.057) |
-0.021 (0.029) |
0.008 (0.009) |
-0.010 (0.024) |
0.025** (0.012) |
-0.049*** (0.016) |
-0.021 (0.016) |
0.218*** (0.042) |
| Education | ||||||||||||
| Low | (base) | (base) | (base) | (base) | (base) | (base) | (base) | (base) | (base) | (base) | (base) | (base) |
| Medium |
-0.001 (0.013) |
-0.019* (0.009) |
-0.242*** (0.050) |
-0.057** (0.024) |
0.230*** (0.052) |
-0.150*** (0.035) |
0.039*** (0.010) |
0.098*** (0.019) |
0.015 (0.010) |
-0.020 (0.016) |
0.099*** (0.016) |
0.064 (0.047) |
| High |
0.080*** (0.017) |
0.053*** (0.009) |
1.127*** (0.057) |
0.200*** (0.025) |
2.229*** (0.062) |
0.209*** (0.039) |
0.106*** (0.009) |
0.358*** (0.034) |
0.096*** (0.011) |
0.176*** (0.017) |
0.309*** (0.015) |
0.469*** (0.043) |
| Country of birth | ||||||||||||
| Born in the country | (base) | (base) | (base) | (base) | (base) | (base) | (base) | (base) | (base) | (base) | ||
| Born outside the country |
-0.014 (0.013) |
0.017*** (0.010) |
0.335*** (0.061) |
0.039 (0.033) |
-0.055*** (0.009) |
-0.173*** (0.040) |
-0.016* (0.009) |
0.074*** (0.023) |
-0.020 (0.020) |
-0.041 (0.0549 |
||
| Area | ||||||||||||
| Cities | (base) | (base) | (base) | (base) | (base) | (base) | (base) | (base) | ||||
| Towns and Suburbs |
-0.008 (0.012) |
-0.021*** (0.008) |
-0.650*** (0.052) |
-0.108*** (0.021) |
-0.461*** (0.076) |
-0.024** (0.010) |
-0.022 (0.013) |
-0.057*** (0.015) |
||||
| Rural areas |
-0.031** (0.012) |
-0.034*** (0.011) |
-0.609*** (0.081) |
-0.117*** (0.022) |
-0.570*** (0.087) |
-0.041*** (0.008) |
-0.017 (0.013) |
-0.102*** (0.013) |
||||
| Age |
0.001*** (0.000) |
-0.000 (0.000) |
0.009*** (0.001) |
0.001 (0.001) |
0.010*** (0.001) |
-0.003*** (0.001) |
0.001*** (0.000) |
0.000 (0.000) |
0.001** (0.000) |
0.000 (0.000) |
0.001* (0.000) |
0.000 (0.001) |
| Sex | ||||||||||||
| Male | (base) | (base) | (base) | (base) | (base) | (base) | (base) | (base) | (base) | (base) | (base) | (base) |
| Female |
0.016 (0.010) |
0.002 (0.007) |
0.219*** (0.048) |
-0.074*** (0.018) |
-0.329*** (0.049) |
-0.066*** (0.025) |
-0.003 (0.007) |
-0.053*** (0.016) |
-0.003 (0.009) |
-0.040*** (0.014) |
-0.034*** (0.012) |
0.155*** (0.036) |
| N° Household members |
-0.001 (0.004) |
-0.000 (0.003) |
-0.125*** (0.020) |
-0.053*** (0.007) |
-0.016 (0.019) |
-0.050*** (0.009) |
-0.003 (0.002) |
0.019** (0.008) |
-0.007** (0.003) |
-0.014*** (0.005) |
0.014*** (0.004) |
-0.067*** (0.016) |
Notes: Robust standard errors in brackets; * p < 0.10, ** p < 0.05, *** p < 0.01.
Table 4.
Rif-regression results, LRP index.
| Austria | Belgium | Denmark | Finland | France | Germany | Ireland | Italy | Luxembourg | Netherland | Spain | U.K. | |
| Sector | ||||||||||||
| Not employed | (base) | (base) | (base) | (base) | (base) | (base) | (base) | (base) | (base) | (base) | (base) | (base) |
| Agriculture |
0.118** (0.059) |
0.123 (0.077) |
1.906*** (0.427) |
0.267*** (0.088) |
-0.633** (0.298) |
-0.477 (0.408) |
0.093** (0.042) |
0.167** (0.076) |
-0.007 (0.095) |
0.236** (0.103) |
0.081 (0.076) |
-0.193 (0.489) |
| Industry |
0.004 (0.030) |
0.022 (0.024) |
2.232*** (0.151) |
0.152*** (0.051) |
-0.634*** (0.122) |
-0.080 (0.075) |
0.026 (0.024) |
0.061 (0.061) |
0.020 (0.032) |
-0.095* (0.051) |
0.019 (0.037) |
0.744*** (0.105) |
| Services |
-0.010 (0.020) |
0.012 (0.018) |
2.139*** (0.090) |
0.046 (0.040) |
-0.853*** (0.096) |
0.008 (0.047) |
0.025 (0.016) |
0.055 (0.046) |
0.056** (0.023) |
-0.068** (0.028) |
-0.011 (0.029) |
0.311*** (0.079) |
| Education | ||||||||||||
| Low | (base) | (base) | (base) | (base) | (base) | (base) | (base) | (base) | (base) | (base) | (base) | (base) |
| Medium |
-0.004 (0.024) |
-0.001 (0.017) |
0.025 (0.096) |
-0.067 (0.045) |
0.479*** (0.097) |
-0.196*** (0.064) |
0.066*** (0.019) |
0.152*** (0.038) |
0.032 (0.020) |
-0.055* (0.029) |
0.166*** (0.031) |
0.103 (0.088) |
| High |
0.063** (0.030) |
0.088*** (0.017) |
2.069*** (0.104) |
0.245*** (0.045) |
2.401*** (0.104) |
0.225*** (0.068) |
0.145*** (0.018) |
0.374*** (0.054) |
0.158*** (0.020) |
0.180*** (0.029) |
0.390*** (0.027) |
0.617*** (0.079) |
| Country of birth | ||||||||||||
| Born in the country | (base) | (base) | (base) | (base) | (base) | (base) | (base) | (base) | (base) | (base) | ||
| Born outside the country |
-0.019 (0.023) |
-0.025 (0.019) |
0.354*** (0.105) |
0.018 (0.059) |
-0.092*** (0.017) |
-0.344*** (0.075) |
-0.056*** (0.016) |
0.066 (0.040) |
-0.097** (0.039) |
-0.132 (0.098) |
||
| Area | ||||||||||||
| Cities | (base) | (base) | (base) | (base) | (base) | (base) | (base) | (base) | ||||
| Towns and Suburbs |
-0.010 (0.019) |
-0.022 (0.015) |
-0.464*** (0.089) |
-0.083** (0.038) |
-0.638*** (0.141) |
-0.035** (0.017) |
-0.028 (0.023) |
-0.059** (0.028) |
||||
| Rural areas |
-0.057*** (0.019) |
-0.037* (0.020) |
-0.192*** (0.146) |
-0.079** (0.040) |
-0.780*** (0.156) |
-0.047*** (0.015) |
-0.013 (0.024) |
-0.123*** (0.026) |
||||
| Age |
0.000 (0.000) |
-0.001** (0.000) |
0.000 (0.002) |
-0.001 (0.001) |
-0.004* (0.002) |
-0.005*** (0.001) |
0.001** (0.000) |
0.000 (0.001) |
0.001*** (0.001) |
-0.003*** (0.000) |
0.001 (0.001) |
-0.001 (0.002) |
| Sex | ||||||||||||
| Male | (base) | (base) | (base) | (base) | (base) | (base) | (base) | (base) | (base) | (base) | (base) | (base) |
| Female |
0.013 (0.016) |
-0.014 (0.013) |
0.079 (0.088) |
-0.077** (0.032) |
-0.496*** (0.086) |
-0.047 (0.045) |
0.001 (0.013) |
-0.040 (0.031) |
0.004 (0.017) |
-0.089*** (0.025) |
-0.044* (0.022) |
-0.226*** (0.066) |
| N° Household members |
-0.002 (0.006) |
0.006 (0.005) |
0.114*** (0.034) |
-0.079*** (0.012) |
-0.045 (0.034) |
-0.045*** (0.016) |
-0.005 (0.004) |
0.006 (0.014) |
-0.011 (0.007) |
-0.013 (0.009) |
0.029*** (0.008) |
-0.108*** (0.029) |
Notes: Robust standard errors in brackets; * p < 0.10, ** p < 0.05, *** p < 0.01.
Table 5.
Rif-regression results, URP index.
| Austria | Belgium | Denmark | Finland | France | Germany | Ireland | Italy | Luxembourg | Netherland | Spain | U.K. | |
| Sector | ||||||||||||
| Not employed | (base) | (base) | (base) | (base) | (base) | (base) | (base) | (base) | (base) | (base) | (base) | (base) |
| Agriculture |
0.062 (0.054) |
0.067* (0.040) |
-0.054 (0.353) |
0.075 (0.068) |
0.692*** (0.191) |
0.041 (0.163) |
0.000 (0.033) |
0.094** (0.041) |
0.049 (0.046) |
0.154* (0.084) |
0.075* (0.043) |
0.371 (0.232) |
| Industry |
0.005 (0.026) |
-0.027 (0.019) |
-0.920*** (0.119) |
-0.020 (0.035) |
-0.019 (0.089) |
-0.044 (0.058) |
-0.015 (0.018) |
-0.062 (0.040) |
-0.002 (0.014) |
-0.097** (0.043) |
-0.088*** (0.027) |
-0.023 (0.072) |
| Services |
0.014 (0.015) |
-0.043*** (0.012) |
-0.794*** (0.067) |
0.019 (0.025) |
0.240*** (0.064) |
-0.051 (0.044) |
-0.008 (0.011) |
-0.077*** (0.024) |
-0.004 (0.012) |
-0.030 (0.021) |
-0.031 (0.019) |
0.125*** (0.042) |
| Education | ||||||||||||
| Low | (base) | (base) | (base) | (base) | (base) | (base) | (base) | (base) | (base) | (base) | (base) | (base) |
| Medium |
0.002 (0.015) |
-0.037*** (0.012) |
-0.510*** (0.067) |
-0.048* (0.027) |
-0.019 (0.058) |
-0.104** (0.052) |
0.012 (0.012) |
0.044** (0.022) |
-0.001 (0.010) |
0.015 (0.021) |
0.032 (0.020) |
0.025 (0.052) |
| High |
0.097*** (0.021) |
-0.017 (0.012) |
0.186** (0.078) |
0.155*** (0.029) |
2.057*** (0.073) |
0.193*** (0.058) |
0.066*** (0.011) |
0.342*** (0.036) |
0.034*** (0.012) |
0.171*** (0.023) |
0.229*** (0.019) |
0.322*** (0.048) |
| Country of birth | ||||||||||||
| Born in the country | (base) | (base) | (base) | (base) | (base) | (base) | (base) | (base) | (base) | (base) | ||
| Born outside the country |
-0.010 (0.016) |
0.061*** (0.012) |
0.317*** (0.067) |
0.060 (0.045) |
-0.017* (0.010) |
-0.001 (0.031) |
0.022* (0.011) |
0.082*** (0.026) |
0.056** (0.023) |
0.050 (0.056) |
||
| Area | ||||||||||||
| Cities | (base) | (base) | (base) | (base) | (base) | (base) | (base) | (base) | ||||
| Towns and Suburbs |
-0.007 (0.017) |
-0.020* (0.011) |
-0.836*** (0.072) |
-0.134*** (0.025) |
-0.284*** (0.085) |
-0.014 (0.012) |
-0.016 (0.015) |
-0.055*** (0.019) |
||||
| Rural areas |
-0.005 (0.016) |
-0.031** (0.015) |
-1.025*** (0.115) |
-0.156*** (0.026) |
-0.360*** (0.107) |
-0.035*** (0.010) |
-0.021 (0.015) |
-0.082*** (0.018) |
||||
| Age |
0.001*** (0.001) |
0.001* (0.001) |
0.019*** (0.001) |
0.002*** (0.001) |
0.025*** (0.001) |
-0.001 (0.001) |
0.001* (0.000) |
0.001** (0.001) |
0.000 (0.000) |
0.002*** (0.001) |
0.001** (0.000) |
0.001 (0.001) |
| Sex | ||||||||||||
| Male | (base) | (base) | (base) | (base) | (base) | (base) | (base) | (base) | (base) | (base) | (base) | (base) |
| Female |
0.018 (0.012) |
0.019* (0.011) |
0.359*** (0.068) |
-0.071*** (0.021) |
-0.162*** (0.050) |
-0.086** (0.035) |
-0.006 (0.009) |
-0.066*** (0.020) |
-0.010 (0.011) |
0.008 (0.018) |
-0.025 (0.016) |
-0.084** (0.039) |
| N° Household members |
-0.000 (0.005) |
-0.008* (0.004) |
-0.364*** (0.028) |
-0.026*** (0.009) |
0.012 (0.022) |
-0.055*** (0.014) |
-0.001 (0.003) |
0.033*** (0.008) |
-0.003 (0.003) |
-0.016** (0.006) |
-0.001 (0.006) |
-0.027 (0.016) |
Notes: Robust standard errors in brackets; * p < 0.10, ** p < 0.05, *** p < 0.01.
| 1 | Luxembourg Income Study (LIS) Database, http://www.lisdatacenter.org (multiple countries; December 2022 – January 2023). Luxembourg: LIS. |
| 2 | Austria, Belgium, Denmark, Finland, France, Germany, Ireland, Italy, Luxembourg, Netherland, Spain and United Kingdom. |
| 3 | “Disposable household income” is usually the preferred measure for income distribution analysis, as it is the income available to households to support their consumption expenditure and savings during the reference period (Canberra Group, 2011). According to the LIS documentation (https://www.lisdatacenter.org/data-access/key-figures/methods/disposable/), this measure includes income received from work, wealth, and from direct government benefits, such as retirement or unemployment benefits. The measure then subtracts direct taxes paid, such as income taxes. |
| 4 | Here we limit ourselves to illustrating the basic concepts behind the use of the relative distribution method. Interested readers are referred to Handcock and Morris (1998, 1999) for a more detailed explication. |
| 5 | For a more specific observation of the use of RIF-regression applied to polarization indices, see Jann, 2021; Clementi and Fabiani, 2023 (mimeo). |
Disclaimer/Publisher’s Note: The statements, opinions and data contained in all publications are solely those of the individual author(s) and contributor(s) and not of MDPI and/or the editor(s). MDPI and/or the editor(s) disclaim responsibility for any injury to people or property resulting from any ideas, methods, instructions or products referred to in the content. |
© 2023 by the authors. Licensee MDPI, Basel, Switzerland. This article is an open access article distributed under the terms and conditions of the Creative Commons Attribution (CC BY) license (http://creativecommons.org/licenses/by/4.0/).
Copyright: This open access article is published under a Creative Commons CC BY 4.0 license, which permit the free download, distribution, and reuse, provided that the author and preprint are cited in any reuse.


