

Submitted:
19 May 2023
Posted:
22 May 2023
Read the latest preprint version here
Abstract
The safety of a pedestrian crossing may depend on infrastructure, vehicular and pedestrian traffic characteristics. This research portrayed the safety challenges caused by vehicles on crosswalk in the City of Kigali. Through observing the stopping of drivers in pedestrian crossing events, the study aimed to evaluate driver’s behaviors against traffic flow parameters. 10 collection sites were finally selected purposively and randomly to suit observations for data recording. A total of 10,259 crossing events were recorded within 280 hours. Statistical analysis, tests and Binary logistic regression model were used to evaluate the behaviors. Sadly,82.4% drivers violated crosswalks, endangering crossing. Motorcyclists exhibit the most aggressive behavior. Car drivers are relatively less aggressive,60% managed to brake in the events. Buses and bicycles share a negligible collective of 2%, being aggressive and would not stop. Cars are 10.389 times more likely to stop compared to bicycles. Having more vehicles in a row was safer to cross, for each unit increase on the vehicle density scale, there were 1.956 more chances that every driver would stop.13% to 21% of traffic variables predicted the variance in stopping behaviors model. Further research is needed to find other parameters that influence a driver to stop.
Keywords:
Pedestrian safety
; Traffic characteristics
; City of Kigali
; Binary logistic regression
1. Introduction
1.1. Traffic safety on pedestrian crossings
Pedestrian safety is regarded as one of the most challenging problems in urban transport [1], hence it should be jointly considered with the motorized transport system that plays a central role in the most societies. In many instances, commercial goods needed for everyday life are transported by road. In addition to this, residents of various places use motorized travel to reach their work or leisure destinations. While this advantage has been achieved, high levels of motorization contribute to serious consequences such as human and economic losses owed to road accidents [1].This being in mind, pedestrian safety has recently been recognized as a public health challenge worldwide [2].According to the [3] report on transportation considerations for the 2030 sustainable development goals, road safety remains an important development issue.
Contrary to the declining number of fatalities due to train–vehicle collisions at highway-rail grade crossings, the number of pedestrian and bicycle fatalities at highway- and pathway-rail grade crossings has increased in the last dozen years [4].A large number of deaths and injuries occur annually as a result of road crashes among pedestrians, especially in low-income countries. Globally, about 400,000 pedestrians are killed due to road traffic accidents [5].
To combat the issue of pedestrian deaths and injuries, engineers have come up with various ingenuity to address the issue. One of the most used pedestrian crossing type, a zebra crossing, was first designed and implemented in Slough, United Kingdom, in 1951 [6] Likewise, it’s the most popular pedestrian crossing in Rwanda.
The safety of a pedestrian facility may depend on various factors. According to [7],it mainly depends on its features and on how it is used. In other words, crossing infrastructure details and traffic characteristics. Models existing in literature are based both on traffic and pedestrian volumes information and on pedestrian crossing features, but in many cases traffic data are not available. This research focuses on safety of a pedestrian crossing, with taking into account existing traffic composition and volumes.
1.2. Pedestrian mobility in the City of Kigali
According to the 2018 Transport Master Plan, the population of Kigali stood at approximately 1.5 million. It was forecasted to grow to approximately 3.8 million in 2050. This is something that may raise the pressure on existing transport infrastructure, and thence on traffic safety measures that have been put in place [8].
According to this same survey, on average, the majority of employed citizens live within 2 km from their place of work. When comparing the mode of transport used to travel to work to the average monthly household income, it has been clear that the areas where people earn a higher income are also the areas where the usage of private car travel is more common. Since most urban citizen do not fall in this category, it was then concluded that the majority of employed citizens use walking as a mode of transport to their place of work [9].
More so, on schooling and other motives of people movements, it has been noticed that walking is the most popular mode of transport for students travelling to school [9]. In addition to this, the time of day that people will likely use to travel to work in Kigali is between 06:00 and 09:00 in the morning [10].
Figure 1.
Population concentration and potential mobility density in the City of Kigali [8]
Figure 1.
Population concentration and potential mobility density in the City of Kigali [8]
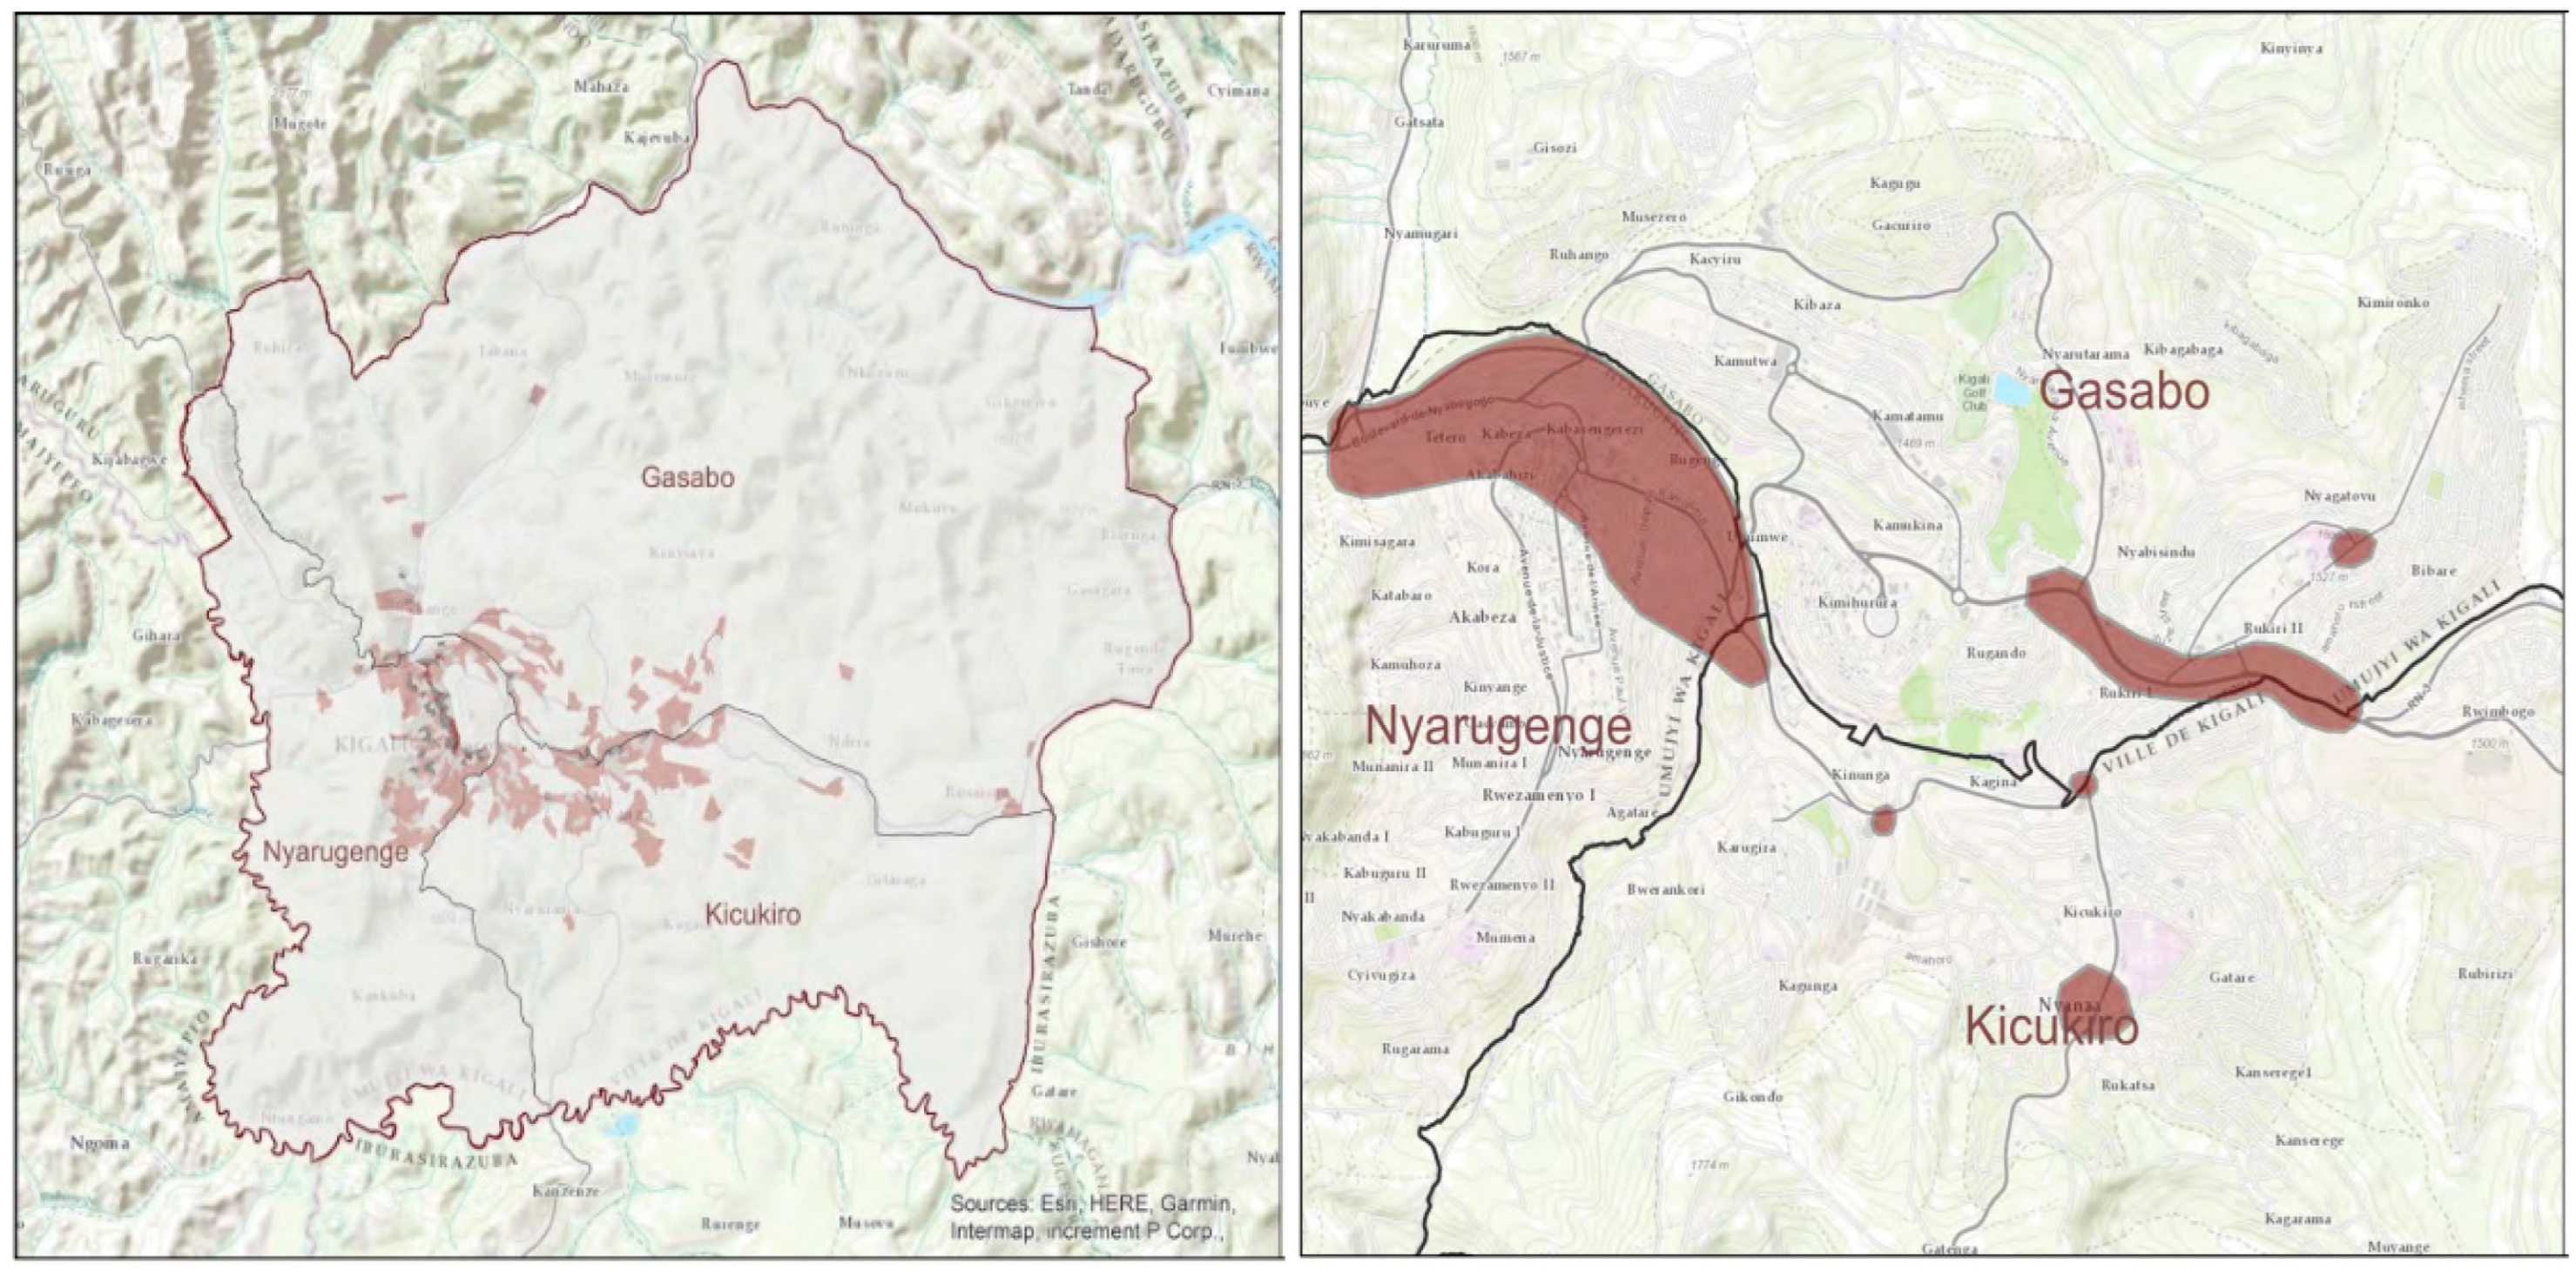
According to police data, road accidents that happen in the City of Kigali, do involve a lot of pedestrians and motorcycles. For instance, in the year of 2017 alone, 71% of total registered road accidents involved motorcycles (moto-taxis), pedestrians and bicycles. The KN 7 road, the KN 5 Road and city circle junctions, remain hotspots for fatal accidents in Kigali as determined from a study done from the police database [11].
1.3. Zebra characteristics and Traffic regulations
Pavement markings are an important means of traffic control on streets and roads. In some cases, the pavement markings are used to supplement general traffic regulations, or regulations and warnings given by signs and signals. In other cases, markings can be used without supplement by other devices [12]. The principal advantage of road markings is that they convey guidance or information to the driver without diverting attention from the roadway. Road crashes lead to huge social and economic losses and are often a result of unsafe road design and characteristics [13]. In bad weather conditions, this may be of vital importance to road safety [14].Pavement markings should therefore be given special attention with respect to both application and maintenance [12].
Same philosophy is used to convey guidance toward pedestrian crossings roads and it is very well known that the most crucial factors in road construction is the safety of road users [15]. Various markings, as shown later in this report, are drawn to guide drivers and pedestrians. At some special intersections, traffic lights are used to guide both drivers and pedestrians, while at most places, it’s only road markings. In Rwanda, it’s a traffic offense to violate pedestrian crossings such as a Zebra crossing. Since 2019, when the Government of Rwanda launched the safety week, it is in that regard that for the best practices, the pedestrian has a right of way of a vehicle, when the pedestrian has reached the crossing relatively as the first [16]. In such cases, the vehicle is supposed to stop, preferably somewhere in the deceleration zone, before the stop-line marking.
The government has continued to implement safer road programs through other government institutions to educate road users on effective and safe usage of the road. In 2017 the government reviewed laws on road safety to toughen penalties against traffic offenders. They have also committed to implementing all possible strategies to enhance road safety measures as evident by a campaign launched by the Rwanda National Police (RNP) and Ministry of Infrastructure (MININFRA) in 2017 to curb road accidents and promote road users respect so as to abide by road safety standards [17]. The vulnerable road user population, mainly pedestrian’s users [18] need a strong government road safety program for safe usage of roads.
2. Materials and Methods
2.1. Methodology
The studies used both quantitative and qualitative methods to analyze the safety and zebra crossing topics such as [19], [13], and [7]. In addition, other qualitative techniques were used commonly in terms of graphical analysis importantly photography based on time-lapse photos [20,21], and mapping of data through overlaying of graphical features [22,23]. The quantitative methods and techniques applied the structured observation to study behavioral patterns of the users [9,24], on the other hand, the quantitative methods used the statistical data to sort based on the software analysis [1,10,25]. Particularly, Chi-square and regression tests applied to measure two independents variable due to the association for the hypothesis through statistical tests [26,27,28].
2.2. Aims, Sampling and Scoping
In order to assess and portray safety challenges on pedestrian crossings, a survey was made on various crossing facilities in the City of Kigali. It has been designed in an observatory manner, to assess how drivers abide by the pedestrian crossing markings. It is also noted that Pedestrian interaction with any type of vehicles (Two or four wheel types) generates a serious conflict on roads while crossing at crosswalks [29]
Since the study area for this research was under the geographical scope of the city of Kigali, a non-probability purposive sampling was used to select pedestrian crossings. The journey started by surveying Kigali major road networks, in its main corridors. High traffic and low traffic areas were purposively sampled. Safety risk is hypothetically present in either situation.
2.3. Research Design
There are many pedestrian crossing facilities that exist and this research is only limited to crossings that fall in the category of white stripes on black road. They are commonly referred to as Zebra crossings. In the first place, the main research team made a tour of Kigali and identified more than 50 zebra crossings, in 3 districts that make Kigali. Nyarugenge is the most densely populated, second to Gasabo and Kicukiro. For uniformity in the data collection process, observation sites were reduced to the number of 15. The following criteria were employed to reduce the number of sites from 50 to 15. Selected crossings were those limited to the following factors:
- Existence of relatively high pedestrian mobility (Hospital, Market, School, Church);
- Existence of stop lines (white lines that mark the beginning of a Zebra crossing);
- No existence of Traffic Police or Traffic Cameras;
- No road humps before or after the crossing;
- No intersection around the crossing;
- No round-about around the crossing;
- Only for 1 carriage way, 2-way traffic;
For site randomization purposes, data collection sites were reduced from 15 to 10 using random probability sampling. This gave sampling an edge of statistical reliability and reduced purposive bias.
2.4. Observation Protocol
Data was collected using handheld cameras fixed on tripods. These cameras were positioned in an angle that can capture all pedestrian crossing events. Cameras were mounted on tripods, in hidden locations, to allow an almost purely anonymous observation. The local traffic safety law enforcement institution (Rwanda National Police) was informed of the survey for research ethics. In addition, a clearance letter from the University of Rwanda was passed to the City Council to reiterate the same.
Collectively, there were 10 data collectors, deployed to 10 data collection sites each. Data were collected for one week (7 days) during peak hours (6 - 8 AM and 5 - 8 PM). This research was therefore cross-sectional in nature. In bulk, total observation time counted to 280 hours. That is, 4 hours of recording per day, per site for seven days on 10 sites. Mathematically, it is can be as:
Every video was timestamped for further analysis. Geographical meta data such as altitude, wind speed, Global Positioning System (GPS) coordinates, micro maps and live location were appended to videos as well. These were enforced to help with data quality, reliability and future research. All data have been digitally archived on mass and cloud storage repositories.
2.5. Data Analysis
Using online questionnaire tools, to capture pedestrian crossing events, basic observation and replay of videos helped with spotting and noting down various traffic flow variables. These included, but were not limited to, type of vehicles, crossing times, stopping times, stopping distances, count of vehicles per crossing event and more. Zebra characteristics, mostly geometric, were also captured in a separate questionnaire. Tape measures, to the precision of 1cm, have been used to measure road marking characteristics, including, but not limited to, carriage way width, zebra lines lengths, distance between center lines and stopping lines, etc. Having collected an overwhelmingly large amount of data, this study will only seek to evaluate driver’s stopping behaviors with regard to various traffic flow characteristics.
2.6. Statistical Tests
To begin with, all data was stored in a central dataset to perform cleaning and critical joins. Using spatial dimensions attached to each entry, a spatial analysis was made. Using Tableau (Version 2021.4), spatial visualizations have been built to compare population densities, traffic densities and pedestrian crossing compliance on each surveyed site. Descriptive statistics have been used to portray safety challenges caused by vehicles. Cross tabulations and Pearson Chi-square tests have been used to evaluate probable dependencies of subject variables. To wind up the analysis part, Binary logistic regression models were built and have been used to evaluate driver’s stopping behaviors against traffic flow characteristics.
2.6.1. Chi-Square
Chi-square tests of independence test whether two qualitative variables are independent, that is, whether there exists a relationship between two categorical variables [27]. If the test shows no association between the two variables (i.e., the variables are independent), it means that knowing the value of one variable gives no information about the value of the other variable [26].
The Chi-square test of independence is a hypothesis test so it has a null (H0) and an alternative hypothesis (H1):
H0: the variables are independent, there is no relationship between the two categorical variables. Knowing the value of one variable does not help to predict the value of the other variable
H1: the variables are dependent, there is a relationship between the two categorical variables. Knowing the value of one variable helps to predict the value of the other variable
The calculation aspects of this test stems from the logic of Mathematical Probability. For two independents events A and B, the following probability equation should always hold true:
Therefore, the Chi-square test of independence works by comparing the observed frequencies (so the frequencies observed in your sample) to the expected frequencies if there was no relationship between the two categorical variables (so the expected frequencies if the null hypothesis was true). This difference, referred as the test statistic (or t-stat) and denoted by χ2, and is computed as follows:
O represents the observed frequencies and E the expected frequencies.
The test statistic alone is not enough to conclude for independence or dependence between the two variables. As previously mentioned, this test statistic (which in some sense is the difference between the observed and expected frequencies) must be compared to a critical value to determine whether the difference is large or small.
The critical value can be found in the statistical table of the Chi-square distribution and depends on the significance level, denoted α, and the degrees of freedom, denoted . The significance level is usually set equal to 5%.
Figure 2.
Chi-square Distribution.
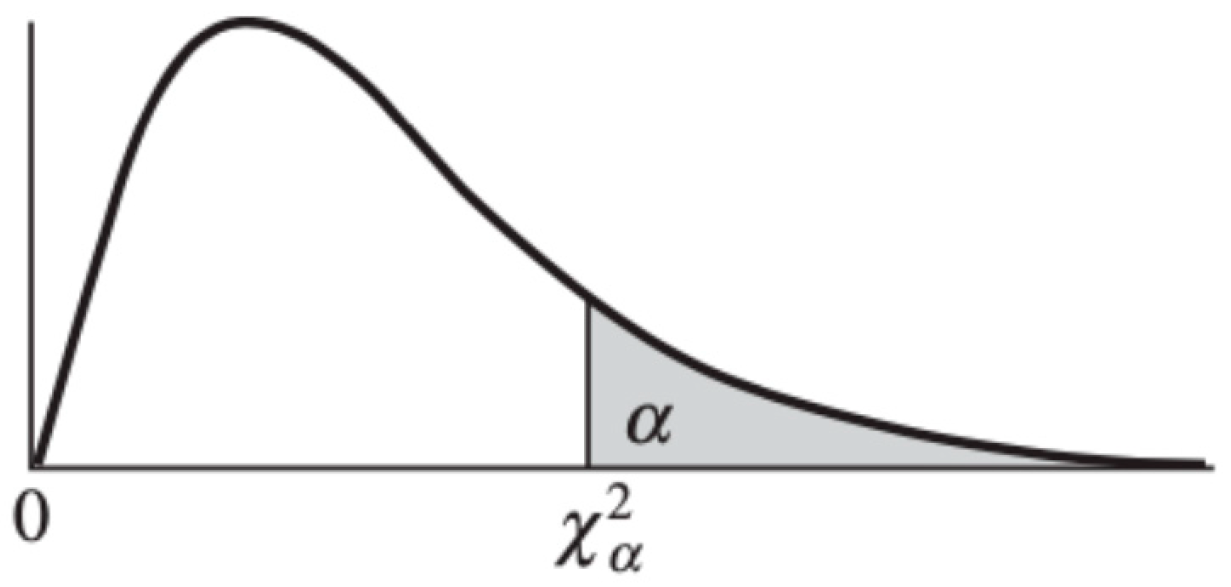
Like for many other statistical tests, when the test statistic is larger than the critical value, the null hypothesis is rejected at the specified significance level.
2.6.2. Binary Logistic Regression
Collected data was also analyzed using binary logistic regression. This one can predict the probability (P) of a specific event when the dependent variable is dichotomous [30] . In this study, the occurrence of a specific stopping behavior can be considered as a binary response variable. The driver will either stop or continue driving during a pedestrian crossing event. The log odds (logit) of P equals the natural logarithm of P/(1-P). Therefore, Binary logistic regression estimates the log odds of the independent variables as a linear combination as shown in the equation below:
In this equation, P is the probability of the behavior occurrence; Xn is the independent variable; and βn is the logistic regression coefficient. For each research question, the significance value of 0.05 was accepted as an influential predictor variable. For each model, the odds ratio was calculated to determine if there is an increase (>1) or decrease (0–1) in the probability of the behavior when the independent variables increase with one unit [31]. The Cox & Snell R Squared and Nagelkerke R Squared tests have been used to assess each model’s goodness of fit. The test determines the percentage of variance caused by independent variables in the equation [28]. SPSS 25.0 has been used for all statistical computations.
3. Results
3.1. Zebra Characteristics
According to the Figure 3, using satellite imagery, it is easy to track subject zebra crossings. Using remote sensing, on the 6m scale, on precise coordinates, it’s possible to estimate zebra crossing characteristics and track asymmetries. Generally, in road design, it’s normal to get non-uniform dimensions depending on terrain nature. The focus of this research is on investigating the relationship between zebra characteristics and vehicle’s (un)stopping behaviors. Stopping behaviors of vehicles are subject of pedestrian safety.
Figure 3.
From left to right, satellite visualization of data collection sites: 15, 14 and 12. The last mockup shows various dimensions that were measured using a tape measure. It’s already obvious that stopping line are not uniform on each zebra crossing.
Figure 3.
From left to right, satellite visualization of data collection sites: 15, 14 and 12. The last mockup shows various dimensions that were measured using a tape measure. It’s already obvious that stopping line are not uniform on each zebra crossing.
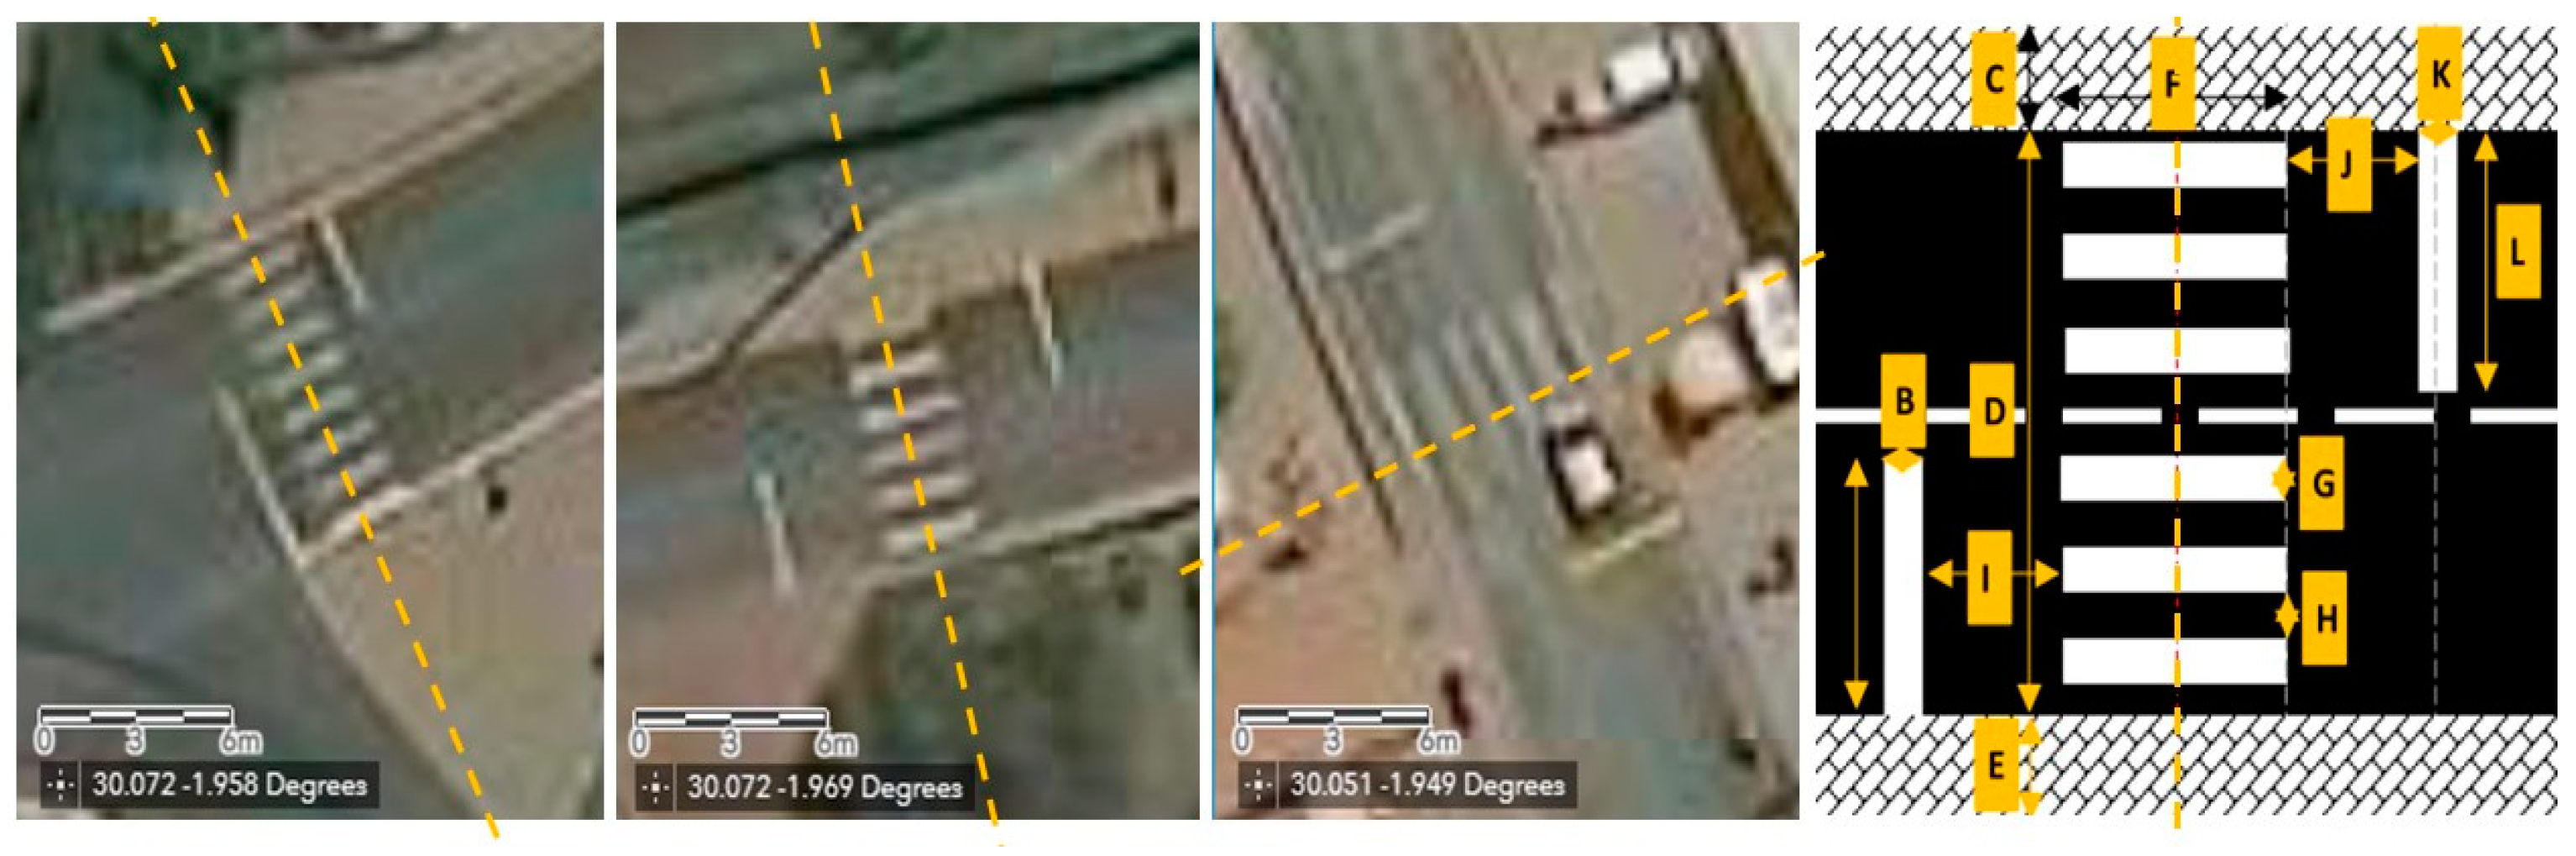
A pedestrian crossing can be characterized by various aspects. Some are inherently due to the way the road infrastructure has been set up. Other factors may depend of how markings have been drawn. In both cases, data collectors have collected important information using tape measures.
While sites have been trimmed down to granular uniformity details, recorded measurements still show that there are clear inconsistencies in Zebra characteristics in the City of Kigali. For instance, one site (Site 9) did not have a stop line one side of the lane. Zebra lines lengths also greatly vary in measure with μ=3.7m (mean) and σ=0.96m (standard deviation). Zebra lines lengths are arguably designed depending on pedestrian traffic on both ends of the road facility.

Table 1.
Zebra characteristics for selected sites. Quick analyses involving spark lines and bars have been done. Additional columns to show average measurements and standard deviations is shown as well. All are measured in meters.
Table 1.
Zebra characteristics for selected sites. Quick analyses involving spark lines and bars have been done. Additional columns to show average measurements and standard deviations is shown as well. All are measured in meters.
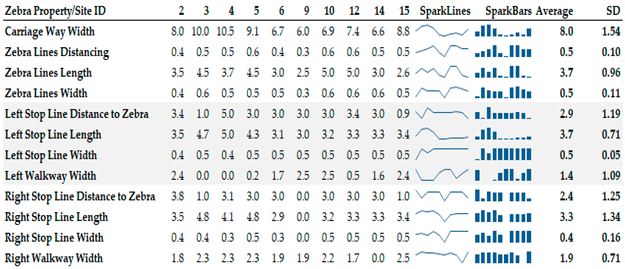
One other major characteristic with variability is the distance between stopping lines and zebra lines themselves. They were measured, on both lanes with maximum μ=2.9m and σ=1.25m. Zebra lines markings vary from country to country. Like all other road markings, there is no fixed or correct length. Most markings are adapted to the traffic situation, to address factors like overtaking possibility, design speed, and more. Therefore, design standards suggest acceptable ranges. Nonetheless, it is of great interests, to investigate whether zebra characteristics have any, or, are in anyway associated to drivers stopping behaviors in cases of pedestrian crossings. According to our observations, most measurements fell into acceptable ranges with some exceptions. This was partly due to the fact that data collection sites were hand-picked upon various factors.
Pedestrian walkways may affect pedestrian safety at pedestrian crossings. According to collected data, at least 3 out of 10 sites, did not have a pedestrian walkway on either of its lanes. It’s unknown whether this characteristic has a positive or negative stopping behavior toward drivers, but it’s arguably a non-ignorable safety risk for pedestrians. In most cases, when pedestrians are crossing, they tend to feel safer when the crossing destination is safer. The lack of pedestrian walkways in some roads therefore poses a significant hazard toward pedestrian safety. At worst cases, the lack of walkways was associated with existence of non-covered water canals and drenches. It’s therefore undeniably risky to cross over such a facility.
3.2. Spatial Analysis
This study was carried out in the capital city of Rwanda, Kigali. This analysis aims to visualize traffic flow on zebra crossings across the capital. Data collection sites were purposively distanced.
Figure 4.
From the left: Data collection sites on Kigali Map, Vehicle frequencies by type on stopping occasions, Vehicle activity when pedestrian are crossing on each site.
Figure 4.
From the left: Data collection sites on Kigali Map, Vehicle frequencies by type on stopping occasions, Vehicle activity when pedestrian are crossing on each site.
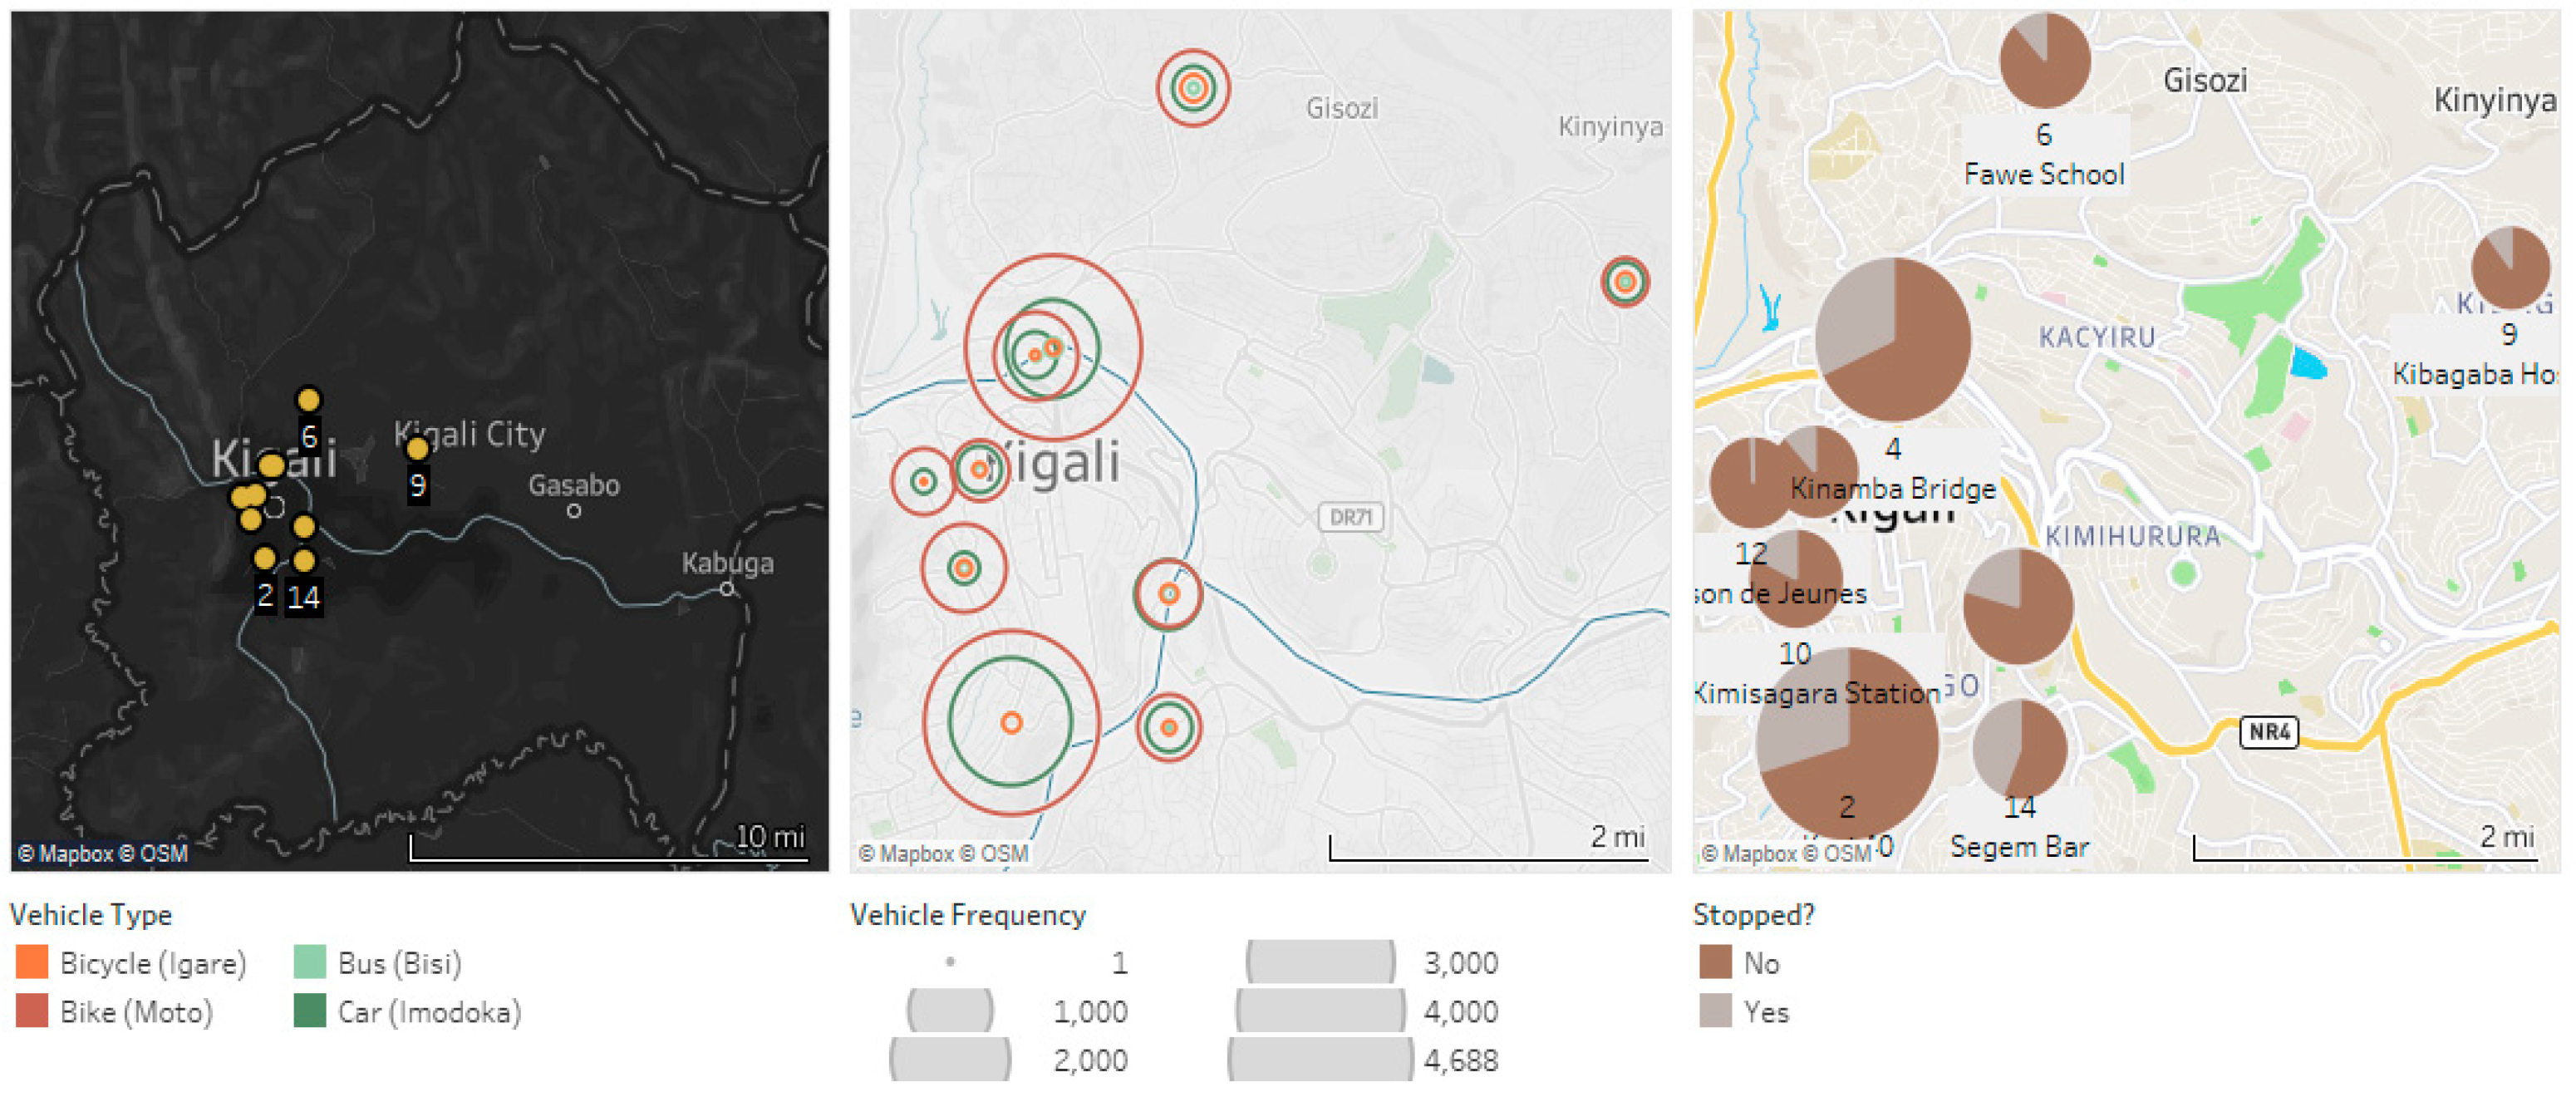
Spatial analysis data almost corresponds to population density map portrayed earlier in Figure 1. Transport by foot being the most used mode of transport to reach workplaces and schools, it shows on Figure 3. It is as, for relatively dense areas, there will be a lot of pedestrian traffic, thus prompting multiple vehicles to stop on crossing occasions. This is particularly true for site 2 and 4.
On a second glance, it’s almost noticeable that buses and bicycles are rarely spotted, which motorcycles and cars are in abundance. For dense areas, motorcycles do greatly outnumber cars. One of the reasons is arguably due to the economic profile of densely populated households. In places where there are a few residents, for instance, site 9 and 6, there will be relatively more cars since residents are more affluent.
3.3. Descriptive Analysis
The collection of data was long and interesting. Over 22,000 vehicles were identified in 10,259 stopping occasions. Across 10 sites; drivers, vehicles, pedestrians and road characteristics were different. This variety of situations came to interesting findings summarized in the following table:
Table 2.
Cross tabulation of major frequencies.
| Variable Name | Evening | Morning | Totals | |||
| N | % | N | % | N | % | |
| 11,354 | (51.5) | 10,704 | (48.5) | 22,058 | (100) | |
| Did the vehicle stop? | ||||||
| No | 9,124 | (41.4) | 9,049 | (41.0) | 18,173 | (82.4) |
| Yes | 2,230 | (10.1) | 1,655 | (7.5) | 3,885 | (17.6) |
| Vehicle Type | ||||||
| Bicycle | 95 | (0.4) | 245 | (1.1) | 340 | (1.5) |
| Motorbike | 7,499 | (34.0) | 7,366 | (33.4) | 14,865 | (67.4) |
| Bus | 89 | (0.4) | 116 | (0.5) | 205 | (0.9) |
| Car | 3,428 | (15.5) | 2,401 | (10.9) | 5,829 | (26.4) |
| Stopping Distance | ||||||
| Breached | 9,124 | (41.4) | 9,049 | (41.0) | 18,173 | (82.4) |
| < 0.5 Meters | 142 | (0.6) | 109 | (0.5) | 251 | (1.1) |
| < 1.0 Meters | 120 | (0.5) | 48 | (0.2) | 168 | (0.8) |
| < 1.5 Meters | 147 | (0.7) | 110 | (0.5) | 257 | (1.2) |
| < 2.0 Meters | 344 | (1.6) | 148 | (0.7) | 492 | (2.2) |
| < 2.5 Meters | 296 | (1.3) | 162 | (0.7) | 458 | (2.1) |
| < 3.0 Meters | 429 | (1.9) | 299 | (1.4) | 728 | (3.3) |
| < 3.5 Meters | 265 | (1.2) | 370 | (1.7) | 635 | (2.9) |
| Greater than 4m | 487 | (2.2) | 409 | (1.9) | 896 | (4.1) |
| Week Day | ||||||
| Monday | 1,230 | (5.6) | 1,175 | (5.3) | 2,405 | (10.9) |
| Tuesday | 1,400 | (6.3) | 1,690 | (7.7) | 3,090 | (14.0) |
| Wednesday | 1,536 | (7.0) | 2,064 | (9.4) | 3,600 | (16.3) |
| Thursday | 2,020 | (9.2) | 1,937 | (8.8) | 3,957 | (17.9) |
| Friday | 1,327 | (6.0) | 1,863 | (8.4) | 3,190 | (14.5) |
| Saturday | 2,241 | (10.2) | 1,224 | (5.5) | 3,465 | (15.7) |
| Sunday | 1,600 | (7.3) | 751 | (3.4) | 2,351 | (10.7) |
At a glance, zebra compliance is arguably in a bad shape and safety at pedestrian crossings is not the best. In all observed occasions, from Monday to Sunday, in morning and evening peak hours, only 17.6% of drivers stopped to allow pedestrian to cross. Everyone else just continued to drive while pedestrians are crossing, not to mention that those who stopped didn’t necessary stop far away from pedestrians. According to recorded observations, only 896 vehicles (4.1%) stopped at least 4m away from the Zebra center line.
The survey has identified four types of vehicles. Big ones on more than four wheels (Cars and Buses) and two-wheeled ones (Motorcycles and Bicycles). In terms of frequency, it’s clear that motorcycles are the most present vehicles on surveyed roads, with a prominence of 14,865 counts (67.4% of all surveyed vehicles). Cars come second with about a quarter prominence while bicycles and buses are rare with a collective negligible percentage of about 1.5% and 0.9 % respectively.
Figure 5.
Integral visualization of vehicle stopping behavior on all sites throughout the week.
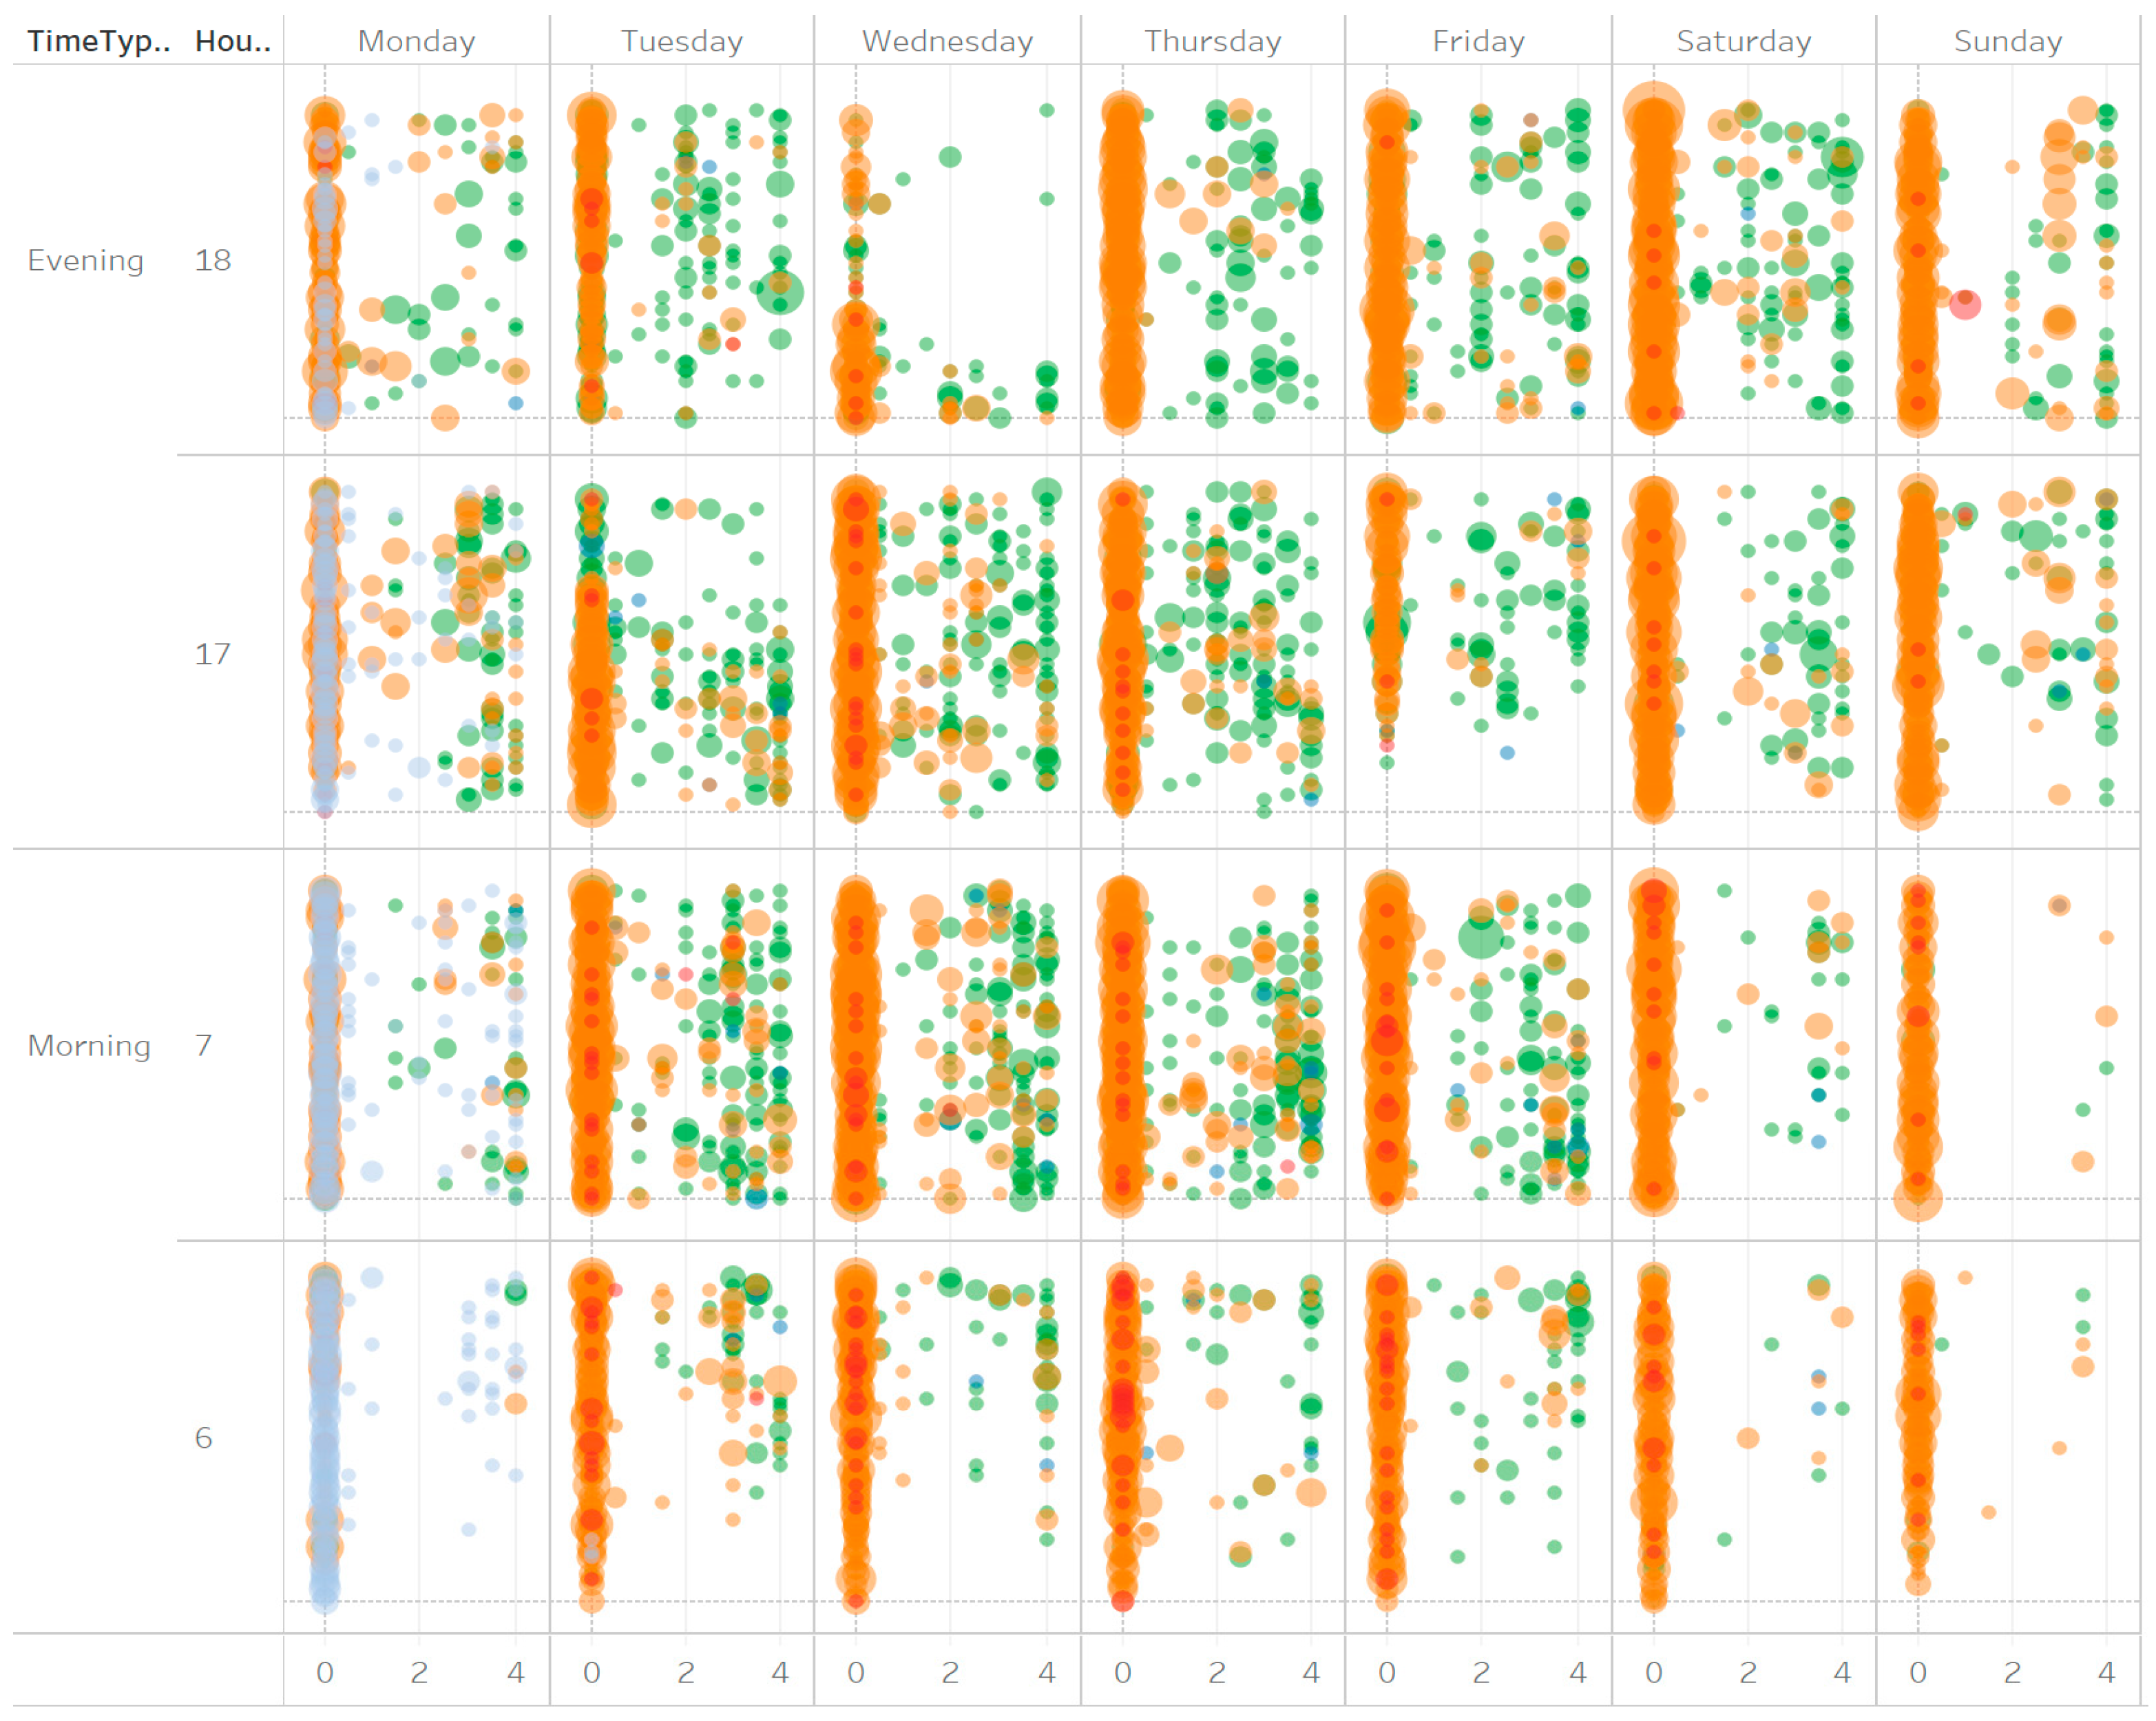
In this study, researchers tried to visualize four variables of traffic flow and pedestrian crossing events in one graph. These include: vehicle types, days of the week, peak hour periods (hours, minutes and seconds) and stopping distances. Advanced statistical and data computational tools have been used to come up with such a graphs
Figure 4 shown above, is a clear and integral visualization of pedestrian safety on zebra crossings in Kigali. From the left, on the upper axis, there are consecutive days of the week when the survey was carried. On the bottom x-axis, there are stopping distances per zebra crossings. Distance 0 is recorded for every vehicle which crossed the center line of the zebra, thence breaching safety regulations and putting pedestrians lives at risk.
On the Y-axis, the graph portrays traffic peak hours in a continuous fashion. By trimming out outliers and other edge observations, the graph shows data from the morning at 6:00 AM till 7:00 PM in the evening. A 4 – semi-transparent color legend variable has been used to portray vehicle type, while circle radii were used to showcase the density of the same.
On the granular level, there are obvious observations that can be noted. For instance, on the traffic flow aspect, there are a few vehicles in weekend mornings. Same is for a Wednesday evening, nevertheless this could have been an anomaly since it rained heavily in that evening halting pedestrian mobility and data collection altogether.
In addition, on the first day of recording data, observers and data analysts were at first agnostic of vehicle type, until when they realized that vehicles behave differently upon various crossing events. As shows the videos, two wheeled vehicles are likely to continue moving while pedestrian are crossing, even when four-wheeled (or more) ones have stopped to allow safe passage of pedestrians. From this point forward, vehicle types were recorded as part of the survey.
3.4. Stopping Behaviors
To compute various equation elements of the Chi-Square equation, the following table has been made:
Table 3.
Cross Tabulation and Chi-Square Values (Expected values in Bold).
| Did the vehicle stop? | No | Yes | Totals | |||||
| N | % | N | % | N | % | |||
| 18173 | (82.4) | 3885 | (17.6) | 22058 | (100.0) | |||
| 1.Peak Hour Period – X2 (1) =66.3, p<.001 | ||||||||
| Evening | 9124 | (41.4) | (42.4) | 2230 | (10.1) | (9.1) | 11354 | (51.5) |
| Morning | 9049 | (41.0) | (40.0) | 1655 | (7.5) | (8.5) | 10704 | (48.5) |
| 2.Vehicle Type – X2 (4) =2774, p<.001 | ||||||||
| Bicycles | 323 | (1.5) | (1.3) | 17 | (0.1) | (0.3) | 340 | (1.5) |
| Motorcycles | 13519 | (61.3) | (55.5) | 1346 | (6.1) | (11.9) | 14865 | (67.4) |
| Buses | 131 | (0.6) | (0.8) | 74 | (0.3) | (0.2) | 205 | (0.9) |
| Cars | 3522 | (16.0) | (21.8) | 2307 | (10.5) | (4.7) | 5829 | (26.4) |
| Null | 678 | (3.1) | (3.1) | 141 | (0.6) | (0.7) | 819 | (3.7) |
| 3.Day of the Week – X2 (6) =259.2, p<.001 | ||||||||
| Monday | 1897 | (8.6) | (9.0) | 508 | (2.3) | (1.9) | 2405 | (10.9) |
| Tuesday | 2391 | (10.8) | (11.5) | 699 | (3.2) | (2.5) | 3090 | (14.0) |
| Wednesday | 2898 | (13.1) | (13.4) | 702 | (3.2) | (2.9) | 3600 | (16.3) |
| Thursday | 3197 | (14.5) | (14.8) | 760 | (3.4) | (3.2) | 3957 | (17.9) |
| Friday | 2625 | (11.9) | (11.9) | 565 | (2.6) | (2.5) | 3190 | (14.5) |
| Saturday | 3107 | (14.1) | (12.9) | 358 | (1.6) | (2.8) | 3465 | (15.7) |
| Sunday | 2058 | (9.3) | (8.8) | 293 | (1.3) | (1.9) | 2351 | (10.7) |
| 4.Vehicle Density – X2 (2) =181.3, p<.001 | ||||||||
| Low | 3039 | (13.8) | (14.3) | 788 | (3.6) | (3.1) | 3827 | (17.3) |
| Medium | 4426 | (20.1) | (18.6) | 564 | (2.6) | (4.0) | 4990 | (22.6) |
| High | 10708 | (48.5) | (49.5) | 2533 | (11.5) | (10.6) | 13241 | (60.0) |
| 5.Pedestrian Density – X2 (3) =138.4, p<.001 | ||||||||
| Less Dense | 6327 | (28.7) | (27.6) | 1061 | (4.8) | (5.9) | 7388 | (33.5) |
| Dense | 1138 | (5.2) | (5.3) | 291 | (1.3) | (1.1) | 1429 | (6.5) |
| Very Dense | 4863 | (22.0) | (23.2) | 1353 | (6.1) | (5.0) | 6216 | (28.2) |
| Extremely Dense | 5845 | (26.5) | (26.2) | 1180 | (5.3) | (5.6) | 7025 | (31.8) |
Model Fit
A logistic regression was conducted to determine if five traffic flow variables (Vehicle type, peak hour period, day of the week, vehicle density and pedestrian density) are able to predict stopping behaviors of drivers to allow pedestrian use zebra crossings in safety. The results of the logistic regression were highly statistically significant, with X (13) =2954.6, p<.001, using the Omnibus Test.
Effect size
The variance in driver’s stopping behaviors predicted by traffic flow variables in the model ranges from 12.5% to 20.7% based on the Cox & Snell R Square or Nagelkerke R Square, respectively.
Classification Table
Without any predictor, the model would have predicted 82.4% of the stopping behavior correctly. On the flipside, with independent variables included, this number increases slightly with 0.50 basis points to 82.9%. Some statisticians refer this to percentage accuracy(PAC) in classification too.
Sensitivity
Percentage of cases in which Stopping at a Zebra crossing was observed ("yes") and were correctly predicted by the model. 9.5% of drivers who stopped were predicted by the model to have stopped. The positive predictive value is the percentage of correctly predicted cases with the observed characteristic (those who stopped) compared to the total number of cases that were predicted to stop. That is, of all cases predicted to stop, 93.7% were correctly predicted.
Specificity
Percentage of cases in which Stopping at a Zebra crossing was observed ("no") and were correctly predicted by the model. 98.6% of drivers who breached the zebra crossing were predicted by the model to have violated. The negative predictive value is the percentage of correctly predicted cases with the observed characteristic (those who breached) compared to the total number of cases that were predicted to breach. That is, of all cases predicted to violate, 99.9% were correctly predicted.
Table 4.
Logistic regression equation variables and their statistical significance.
| Lower | Upper | |||||||
| Variable | B | S.E. | Wald | df | Sig. | Exp(B) | 95% C.I. - Exp(B) | |
| Intercept | -3.390 | 0.266 | 162.468 | 1 | .000 | 0.034 | ||
| 1. Peak Hour Period | -0.311 | 0.040 | 59.095 | 1 | .000 | 0.733 | 0.677 | 0.793 |
| 2.Vehicle Type | ||||||||
| Bicycle (1) | 2289.644 | 4 | .000 | |||||
| Moto | 0.415 | 0.252 | 2.704 | 1 | .100 | 1.514 | 0.924 | 2.481 |
| Bus | 2.208 | 0.290 | 57.838 | 1 | .000 | 9.094 | 5.148 | 16.064 |
| Car | 2.341 | 0.252 | 86.486 | 1 | .000 | 10.389 | 6.343 | 17.014 |
| Null | 0.992 | 0.273 | 13.157 | 1 | .000 | 2.696 | 1.578 | 4.609 |
| 3.Day of the Week | ||||||||
| Monday (1) | 168.105 | 6 | .000 | |||||
| Tuesday | -0.078 | 0.081 | 0.923 | 1 | .337 | 0.925 | 0.789 | 1.085 |
| Wednesday | -0.162 | 0.080 | 4.061 | 1 | .044 | 0.851 | 0.727 | 0.996 |
| Thursday | -0.269 | 0.079 | 11.601 | 1 | .001 | 0.764 | 0.655 | 0.892 |
| Friday | -0.276 | 0.083 | 10.936 | 1 | .001 | 0.759 | 0.645 | 0.894 |
| Saturday | -0.884 | 0.088 | 100.973 | 1 | .000 | 0.413 | 0.348 | 0.491 |
| Sunday | -0.599 | 0.093 | 41.426 | 1 | .000 | 0.549 | 0.458 | 0.659 |
| 4.Vehicle Density* | 0.671 | 0.044 | 233.313 | 1 | .000 | 1.956 | 1.795 | 2.132 |
|
5.Pedestrian Density* |
-0.494 | 0.056 | 77.360 | 1 | .000 | 0.610 | 0.547 | 0.681 |
Model Summary
The model (traffic variables name them) explained between 12.5% (Cox & Snell R2) and 20.7% (Nagelkerke R2) of the variance in Driver’s stopping behaviors and correctly classified 82.9% of cases. Sensitivity was 9.5% and Specificity was 98.6%. The positive predictive value was 93.7%. and the negative predictive value was 99.9%.
4. Discussion
Based on the results of the Nagelkerke R2 as an adjusted version of the Cox & Snell R2 to adjust the scale of the statistic to cover the full range from 0 to 1. By the Value of around 21% change in the dependent variables (Driver’s Stop or Driver’s Non-stop) can be accounted to the independent variables in the model. Only about 13% to 21% of recorded traffic variables were able to predict the variance in stopping behaviors model, according to the Cox & Snell and Nagelkerke R2 values, respectively.
The model sensitivity also called as the true positive rate of 9.5% here, represents the percentage of the observed cases to fall under the category of driver’s behavior to stop (Target group). In brief the drivers rate of 9.5% will be predicted to stop at zebra crossings to let pedestrians to cross.
The model specificity also known as the true negative rate of 98.6% standing for the percentage of the observed behavior of the driver not to stop but to breach traffic rules shows the fall under the non-target category. The drivers’ behavior at a rate of 98.6% will be predicted not to stop but breaching at the zebra crossings.ie preventing the pedestrian’s rights to cross.
4.1. Effect of Peak Hour Period
As per the statistical raw data in Table 3 the peak hour period plays a minor role under descriptive statistics. Driver’s behaviors to give access to pedestrians to cross is better and more during evening times than mornings rated at. This may due to the fact that the evening period people are no longer stressed by the duty reporting delay but going at home. Hence still the probability of giving access to pedestrians is below 1 as per the odds ratio of 0.733 from Table 4.
4.2. Effect of Vehicle type
Vehicles under this research, vehicles were classified under two broad categories of four wheel vehicles (Cars and buses) and two wheel vehicles (Motorcycles and bicycles). Statistically Motorcycles represent 67.4%, Buses cover less than 1%, bicycles have 1.5% and Cars counts 26.4% of the vehicle population and all have different impact on the traffic flow characteristics specifically for motorcycles and cars based on their volume and effect on the predicted driver’s behavior model.
Cars, buses and motorcycles (moto) have their respective odds ratio of 10.389, 9.094 and 1.514 respectively greater than 1; hence the probability of falling into the target group to give access to crossing pedestrians is greater. Vehicle type has a considerable effect on driver’s behavior to the model and give access to crossing pedestrians.
4.3. Effect of Week Days
Considering weekdays and their effect on the driver’s behavior, the model shows that the odds ratio varies between 0.413 to 0.925 and still are less than one (1) reason why the probability of falling in to target group of stopping and giving access to pedestrian is very less and limited regardless of any day of the week. It can be noted that vehicle flow number during the week was found almost uniformly distributed from Tuesday to Saturdays and present an abrupt fall of around 3% on Sunday as per Table 3. This may be related to weekend break/off of activities.
4.4. Effect of Vehicle Density
Vehicle density is expressed in terms of number of vehicles per kilometer length of a roadway. Referring to Table 3 and Considering High vehicle densities informs that individual vehicles are very close to each other, while low densities indicate that greater distances between vehicles is experienced. In general practice high density vehicles will move slowly with a great chance to stop at any time, giving right to pedestrians to cross (10.6%), but low vehicle density implies that vehicles are more spaced and tend to move at high speed with little chance of stopping (3.1%) and give access. As per our research outcome, it is realized that the odds ratio of this independent variable is 1.956 that is greater than 1, giving the probability of falling under the target group of stopping and give access to crossing pedestrian being greater, hence the vehicle density being low, medium and high affect the driver’s behavior.
4.5. Effect of Pedestrian Density
The Pedestrian density was estimated based on the counting of number of people crossing at a particular road width in a crossing event and classified as Less Dense, Dense, Very Dense and Extremely Dense. As per this research the odds ratio for the pedestrian density variable is 0.610 i.e. less than 1 and indicates that the probability of drivers’ behavior to stop is minimum/less.
5. Conclusions
The analysis of the relationship between the dependent variables of Driver’s behaviors of “stopping” and “not stopping” to give access to pedestrians to cross based on independent variable Traffic characteristics of peak hour period, vehicle type, day of the week, vehicle density and pedestrian density in the City of Kigali showed the followings:
Week days is found to be the less insignificant traffic independent variables to affect the driver’s behavior as per the odds ratio of 0.413;
Pedestrian density could not really show its significance to the model due to the lack of information about its classification as far as traffic classification is concerned, but it showed that its contribution is insignificant. Further research is needed to look in to its specific categorization;
Peak hours could play an importance in analysis of the driver’s behavior and this necessitates further research as morning weekends of data collection show some critical information to share;
Vehicle Density and types are very important independent variable characteristics that affect greatly the driver’s behavior to give access to pedestrian to cross and that research has proved that in the model by displaying the odds ratios greater than 1;
Therefore, further research is encouraged to uncover other relevant parameters that would influence a driver to stop or not to stop. These may include external factors like infrastructure characteristics or internal factors that may be unique for each driver.
References
- D. Antov, T. Rõivas, M. Pashkevich and &. E. Ernits, "Safety Assessment of Pedestrian Crossings," WIT Transactions on State of the Art in Science and Engineering, vol. 74, pp. 41-53, 2013.
- H. Raiful and H. Ragib, "Pedestrian Safety Using the Internet of Things and Sensors:Issues, Challenges, and Open Problems," 2022.
- UNCTAD, "Road Safety-Considerations in Support of the 2030 Agenda for Sustainable Development," UNITED NATIONS, Geneva, 2017.
- P. Metaxatos and P. S. Sriraj, "Pedestrian Safety at Rail Grade Crossings: Focus Areas for Research and Intervention," Urban Rail Transit, vol. I, no. 4, p. 238–248, 2015. [CrossRef]
- M. Haghighi, F. B. Aghdam, H. Sadeghi Bazargani and H. Nadrian, "What are the challenges of pedestrian safety from the viewpoints of traffic and transport stakeholders?A qualitative Study," Research Square, 2020.
- R. Mukamana, "DRIVERS’ COMPLIANCE WITH ZEBRA CROSSING LAWS IN RWANDA: Kigali as a case study," UNIVERSITY OF RWANDA, KIGALI, 2015.
- B. Olga, P. Luca and S. Davide, "A methodology to assess pedestrian crossing safety," Eur. Transp. Res. Rev, vol. II, no. SPECIAL ISSUE, p. 129–137, 23 September 2010.
- CoK, "Transport Plan,Kigali Master Plan 2050," Kigali Master Plan Review, Kigali, 2020.
- D. Nkurunziza. and R. Tafahomi, "Assessment of Pedestrian Mobility on Road Networks in The City of Kigali," Global Journal of Pure and Applied Sciences, vol. 26, pp. 179-190, 2020. [CrossRef]
- J. Nyirajana, A. O. Coker and F. O. Akintayo, "Traffic flow rate on Kigali roads: a case of national roads (RN1 and RN3)," East African Journal of Science, Technology and Innovation, vol. II, no. 3, 25 June 2021. [CrossRef]
- NISR, "Stattistical Year Book," National Institute of Statistics of Rwanda, Kigali, 2017.
- NZTA, "Traffic Control Devices Manual," 2011.
- D. Nkurunziza, R. Tafahomi and I. A. Faraja, "Assessment of Road Safety Parameters in the City of Kigali, Rwanda,," Global Journal of Pure and Applied Sciences, vol. 27, pp. 209-219, 2021. [CrossRef]
- W. Wang, H. Guo, Z. Gao and H. Bubb, "Individual differences of pedestrian behavior in midblock crosswalk and intersection," International Journal of Crashworthiness, vol. 16, pp. 1-9., 2011.
- D. Nkurunziza, "Investigation into Road Construction Safety Management Techniques," Open Journal of Safety Science and Technology, vol. X, no. 3, pp. 81-90, 2020. [CrossRef]
- MININFRA, "RWANDA LAUNCHES ROAD SAFETY WEEK," 5 May 2019. [Online]. Available: https://www.mininfra.gov.rw/updates/news-details/rwanda-launches-road-safety-week. [Accessed 15 May 2023].
- MININFRA, "NATIONAL TRANSPORT POLICY AND STRATEGY FOR RWANDA," Ministry of Infrastructures, Kigali, 2021.
- P. Anjni, K. Elizabeth, A. Luciano, R. Stephen, R. ,. V. João and A. S. Catherine, "The epidemiology of road traffic injury hotspots in Kigali, Rwanda from police data," BMC Public Health, 2016.
- J. J. Fruin, "Planning and design for pedestrians," in Time sever standards for urban design, New York, McGraw-Hill Companies, Inc, 2003, pp. 621-637.
- R. Tafahomi, "Qualities of the green landscape in primary schools, deficiencies and opportunities for health of the pupils," J. Fundam. Appl . Sci., vol. 13, no. 2, pp. 1093 -1116, 2021.
- R. Tafahomi and R. Nadi, "Insight into the missing aspects of therapeutic landscape in psychological centers in Kigali, Rwanda," Cities & Health, vol. 6, no. 1, pp. 136-148, 2022.
- R. Tafahomi, "Application of physical and nonphysical elements in the conservation of historic core of city," South African Journal of Geomatics, vol. 10, no. 1, pp. 75-86, 2021b. [CrossRef]
- R. Tafahomi and R. Nadi, "The interpretation of graphical features applied to mapping SWOT by the architecture students in the design studio," Journal of Design Studio, vol. 3, no. 2, pp. 205-221, 2021. [CrossRef]
- M. Bonnes and M. Bonaiuto, "Environmental psychology: From spatial-physical environment to sustainable development," in Handbook of environment psychology, R. B. Bechtel and A. Churchman, Eds., New York, John Wiley & Sons, Inc., 2002, pp. 28-54.
- D. Nkurunziza, R. Tafahomi and I. A. Faraja, "Identification of challenges and opportunities of the transport master plan implementation in the city of Kigali, Rwanda," in International Conference in Urban and Maritime Transport 2021, Wessex, 2021.
- D. Mindrila and P. Balentyne, The Chi Square Test, 2023.
- D. S. Moore, W. I. Notz and M. A. Flinger, "The Chi Square Test," in The basic practice of statistics (6th edition), New York, W. H. Freeman and Company, 2013.
- S. Sandro, "Understanding logistic regression analysis," Biochemia Medica, February 2014.
- P. Sathya and K. Krishnamurthy, "Parametric Study on the Influence of Pedestrians’ Road Crossing Pattern on Safety," The Open Transportation Journal, vol. XVII, 8 March 2023.
- H. Nasser, Logistic Regression Using SPSS, University of Miami, 2020.
- J. Mathias and V.-J. Hannah, Statistics Made Easy, Graz: ©DATAtab e.U., 2023.
Disclaimer/Publisher’s Note: The statements, opinions and data contained in all publications are solely those of the individual author(s) and contributor(s) and not of MDPI and/or the editor(s). MDPI and/or the editor(s) disclaim responsibility for any injury to people or property resulting from any ideas, methods, instructions or products referred to in the content. |
© 2023 by the authors. Licensee MDPI, Basel, Switzerland. This article is an open access article distributed under the terms and conditions of the Creative Commons Attribution (CC BY) license (http://creativecommons.org/licenses/by/4.0/).
Copyright: This open access article is published under a Creative Commons CC BY 4.0 license, which permit the free download, distribution, and reuse, provided that the author and preprint are cited in any reuse.