Submitted:
15 May 2023
Posted:
15 May 2023
You are already at the latest version
Abstract
Ground penetrating radar (georadar, GPR), widely used in geology, archeology and road construction, is an efficient tool for searching and studying subsurface objects and structures. When planning GPR missions, it is necessary to predict the resolution of the device and the achievable probing depth. The article discusses the methods and results of assessing these characteristics of the Loza-V and Loza-N radars obtained in the course of archaeological and geographical expedition works.
Keywords:
impulse subsurface radar
; radiation pattern
; archaeological and natural objects
1. Introduction
In the first part of this paper, we present the results of theoretical and experimental studies of the georadar (ground penetrating radar, GPR [1-3]) antenna radiation patterns in the subsurface medium and in the upper hemisphere. These methodological works have been performed by the research team of the Pushkov Institute of Terrestrial Magnetism, Ionosphere and Radio Wave Propagation (IZMIRAN) during a joint expedition organized by the Institute of Archeology of Crimea of the Russian Academy of Sciences in July, 2022. Among the studied archeological objects, the ancient Jewish cemetery in the vicinity of the Kerch city, the remains of an ancient water pipe near the village Geroevka (El Tiygen), and the destroyed Venetian fortress in Tikhaya Balka should be mentioned. The results of the field campaign were reported at the scientific-practical conference [4] in December 2022. Along with archaeological research, the features of the local relief and subsurface artifacts were used in order to evaluate technical characteristics of the Loza-V GPR [5]. First of all, we were interested in estimating the radiation pattern of the resistively-loaded dipole antennas used in this enhanced power georadar. Although this important parameter has been studied in a number ot theoretical and experimental works [6-12], full-scale field measurements are invaluable for geophysical and industrial applications.
The second part of the presented experimental material was obtained during the expedition organized in September 2022 by the Russian Geographic Society, the newspaper "Komsomolskaya Pravda" and the TV channel "Russia1". The object of study was the Patomsky crater – an unusual geological structure in the Siberian taiga, discovered in 1949 in the Irkutsk region [13]. This rare object (a stone ring of 80 meters in diameter with a central cone, composed of large limestone fragments) attracted attention of researchers, various exotic hypotheses of its origin were put forward. Our GPR cross sections, performed with Loza-N GPR [14], confirm the most probable volcanic model [15]. From a technical point of view, this experiment confirmed the possibility of GPR sounding of the first hundreds meters of subsurface for geophysics, it revealed a fundamental difference between deep GPR echoes from a massive stone ground and a water-filled volcanic crater.
2. Materials and Methods
Experimental studies of the directional pattern of dipole antennas were carried out using a GPR of the Loza series [5, 14]. The main design features of this GPR were outlined in the report at the International School for Young Scie[ntists [16]. In this “deep penetration radar” (DPR), everything was done to make the depth sounding capabilities of the device attractive for geologists and geophysicists. Its design features made it possible to use DPR in the study of subsurface structures at depths of up to 100-150 meters in "heavy" low-resistivity soils and up to 200-300 meters in high-resistivity rocks.
The fundamental features of the Loza GPR series design are:
- Ultra-high power. The peak power of the transmitted EM pulse was brought up to a practical limit, determined only by the insulating properties of the environment, by means of high-voltage discharger supplying a probing pulse of voltage from 5 to 21 kV to the antenna.
- Concentration of signal energy in the low-frequency part of the spectrum. In order to achieve maximum depths, the maximum energy of the probing pulse is shifted to the lowest frequencies, within the frequency band of the receiver determined by the length of the transmitter antenna. The medium-frequency version Loza-V, operating in the frequency band 50-300 MHz, is equipped with 100, 200, and 300 MHz dipole antennas (Figure 1). DPR Loza-N is supplied with 50 MHz (3 meters long), 25 MHz (6 meters), 15 MHz (10 meters), and 10 MHz (15 meters) transmitter and receiver half-wave dipole antennas (Figure 2). All antennas are designed with a resistive load gradually growing to the ends of the dipole [17].
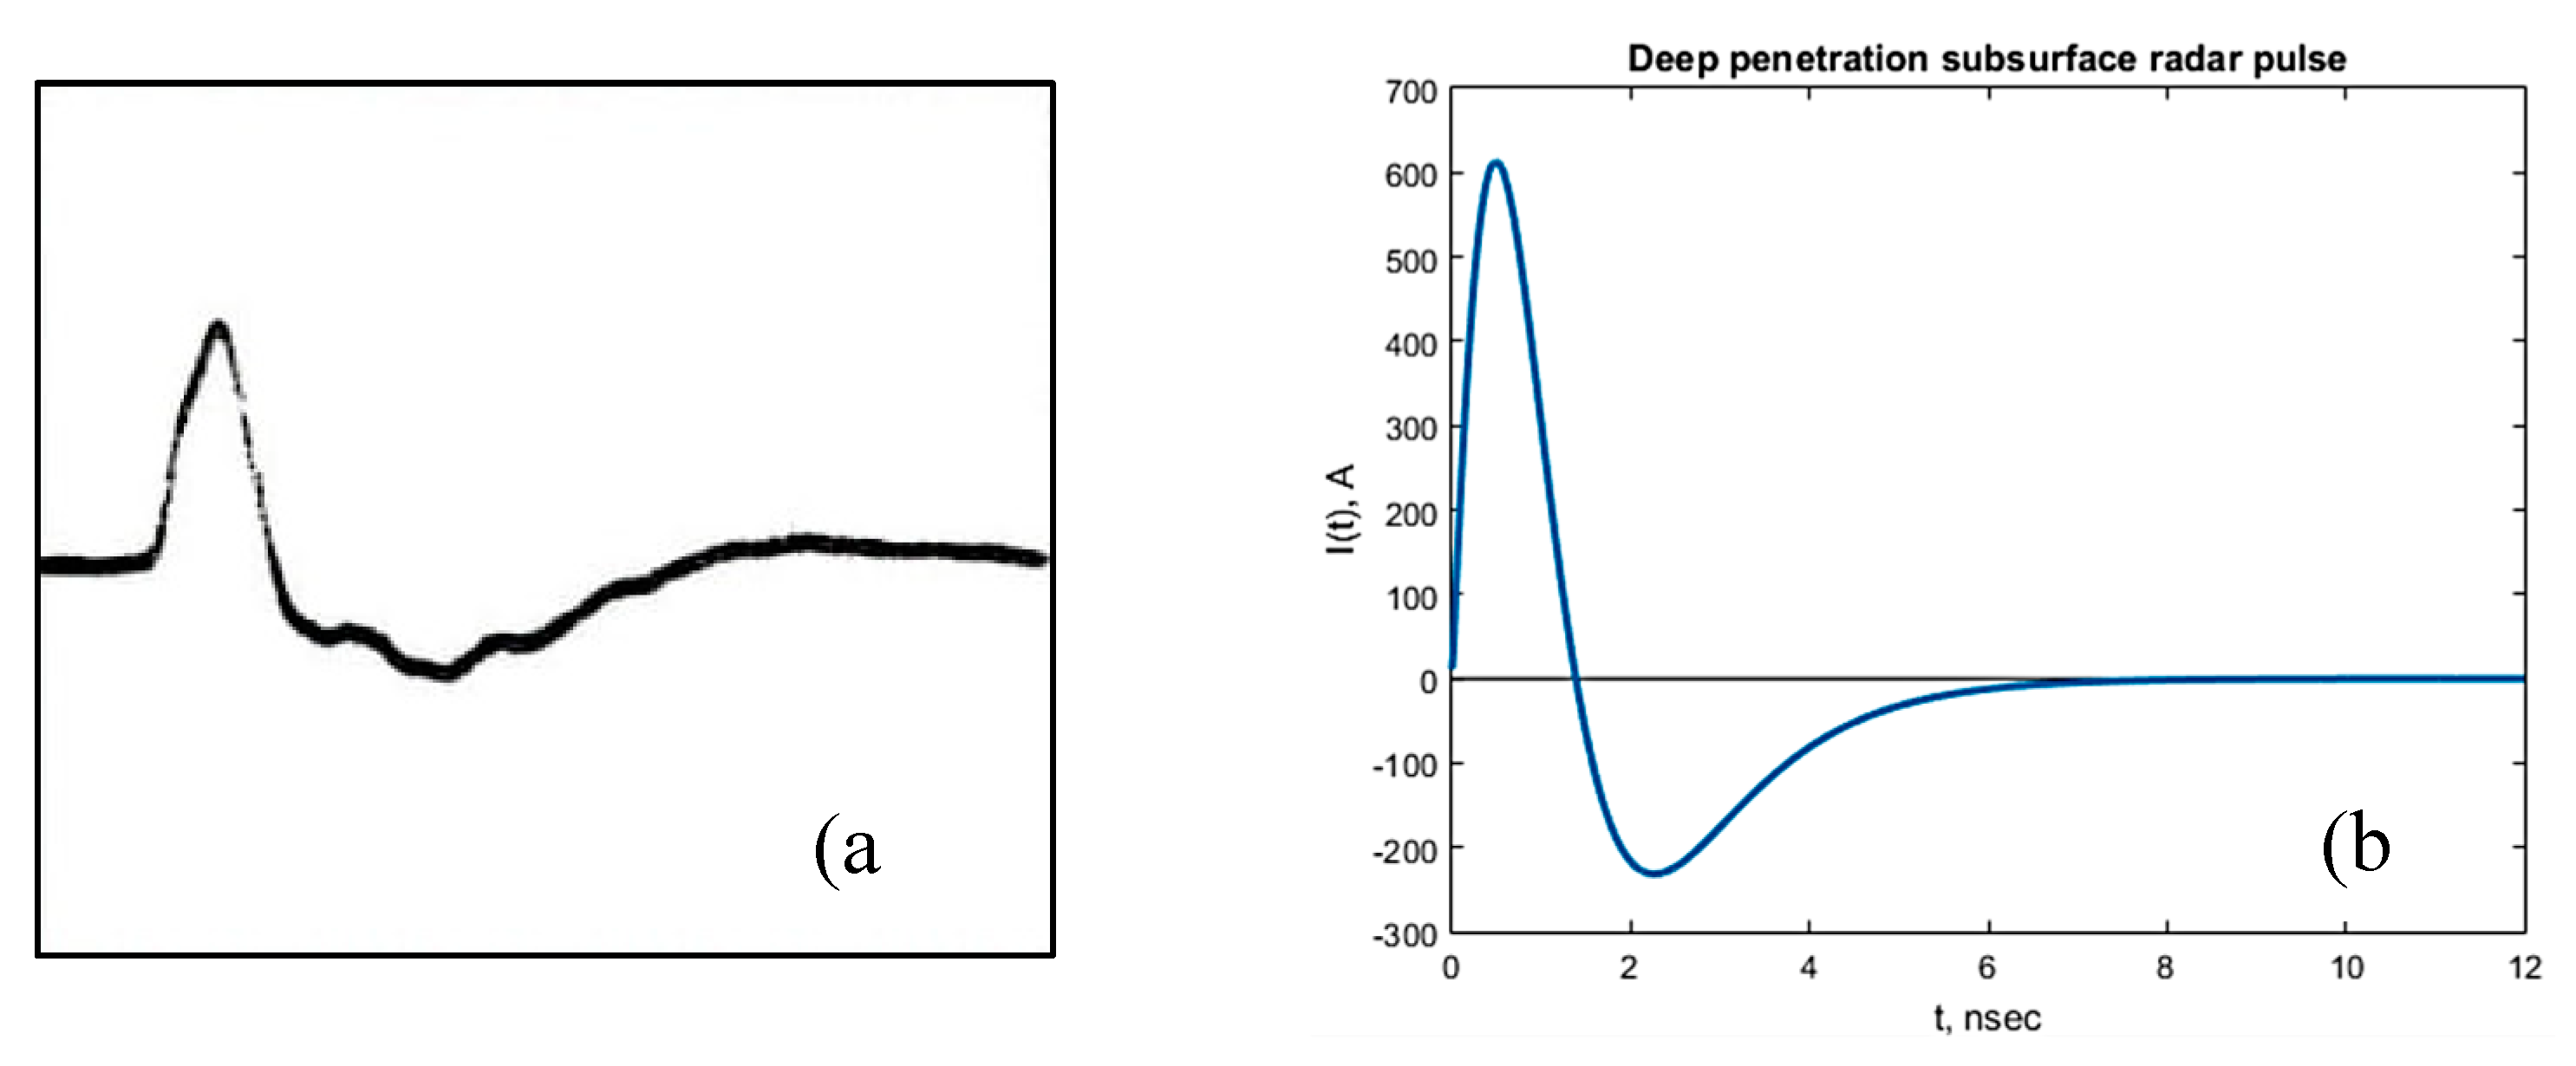
- Large dynamic range of the reflected signal registration. The use of ultra-powerful transmitters and low-frequency antennas provides a dynamic range of reflected signals of more than 120 dB. The registration system allows one to digitize the signal in the entire dynamic range without changing the GPR settings. The use of resistive damping makes it possible to obtain probing pulses of practically non-oscillating nature ([17,7], see Fig. 3).
Figure 3.
(a) Measured pulse in a resistively loaded dipole antenna (negative of the original screen [7]), and (b) GPR pulse model [14].
The efficiency of GPR sounding (first of all, its depth) depends on the parameters of the environment. The radiation patterns of antennas are largely determined by the electrical properties of the ground on which the antennas are placed. When the GRP antenna (linear electric dipole) is placed tightly to the interface between two media (ground surface), the radiation pattern is formed, essentially oriented towards the medium with higher dielectric permittivity (or soil refractive index ) [18, 19], About times more radiation is emitted towards the lower hemisphere (into the ground) than upwards (into the air).
Figure 4a,b illustrate the effect of the interface on harmonic and pulsed EM radiation into the subsurface medium. In both cases, a noticeable maximum of the radiation pattern in the far zone is observed in the direction corresponding to the angle of total internal reflection cf. [6,10,20]. These estimates allow one to assess the GPR resolution in the transversal H plane. It can be illustrated with the following set of color plots (Figure 5). The left frame (a) shows the spatial distribution of the pulsed radiation of an infinite line vibrator placed on the ground, at a certain moment (m). A similar spatio-temporal radiation pattern has the receiver antenna (b). The radar spatial resolution is determined by their product (c) showing a bright spot at the intersection of (a) and (b) patterns.
These analytical results give only a qualitative estimate of a realistic GPR radiation pattern. Actual values may differ significantly due to several reasons. First of all, the elegant Engheta-Papas-Elachi model of an infinitely long line antenna [18] works only at the distances small or compared with the antenna length. Moreover, numerical calculations show that the peak amplitude values tend to the far-field pattern with sharp edges at the critical total reflection angles |θ| = η but quite slowly, at unrealistic for most applications distances – hundreds of meters [19], see Fig. 4 (b).
Experimental evaluation of the radiation pattern of subsurface radar requires either the creation of an expensive measuring stand or the ingenious use of local objects as natural test objects. The latter technique was used by participants of the Crimean expedition in 2022, in the spare intervals between archaeological works.
The idea of using elongated scattering objects as a benchmark for the directivity measurements was put forward by experienced radio- and geophysisists [16]. In our measurements, natural test objects were at hand (power line wires, see Figure 6,.and non-metallic pipes of an ancient aqueduct discovered during archaeological excavation, see Figure 7).
The use of these linear objects to evaluate the Loza-V GPR directivity pattern in the upper and lower hemispheres is discussed below in the Subsections 3.1 and 3.2. The next two subsections (3.3-3.4) are devoted to the phenomenon of the Patom crater: we discuss the results of the GPR cross-section of this natural object and apply the solution of the 1D inverse problem to explain the peculiarities of the deep subsutface sounding.
3. Experimental results
3.1. In the spring of 2020, scientists from the Institute of Archeology of the Crimea and the Institute of Archeology of the Russian Academy of Sciences identified one of the earliest Jewish necropolises in the vicinity of the modern city of Kerch. The site of the necropolis belonged to the community of Panticapaeum, mentioned by ancient authors and located at Cape Ak-Burun. It was here that the archeologists collected more than three dozen Jewish tombstones and fragments containing inscriptions and images (Figure 8a). The revealed names of the deceased members of the Jewish community add to our knowledge of the onomastics of the "Bosporan" civilization.
In the framework of the 2022 expedition, the territory of the necropolis was studied by GPR scanning with Loza-V georadar, with 100 MHz antennas and a 5 kV transmitter. A dense accumulation of anomalies, interpreted as graves, was found in a relatively small area. Five previously unknown objects on the radar image were identified as crypts, up to 40 tombstones with Jewish symbols were found on the site (Figure 8b). Further study of the necropolis, planned for the 2023 summer field campaign, will allow us to trace the path of Jewish migration to the Bosporus in the 1st century BC and the first centuries of our era.
The first purely radiophysical task in this expedition was to evaluate the GPR radiation pattern in the upper hemisphere. It was performed according to the following method: the Loza-V GPR antenna set was installed in the center of a circle divided into 30-degree sectors (Figure 6). In each of the positions, four measurements were taken, after which the antennas were rotated by 30 degrees, the radar handle remaining above the center of the circle. An elongated scattering test object was a power line wire, at a height of 15 meters (delay about 100 ns). The operator moved in a circle synchronously with the rotation of the antennas.
As a result the reflected signal measurements, Figure 9(a). the horizontal radiation pattern of the 200 MHz dipole GPR-V antenna in the upper hemisphere (in air) under real field conditions (on dry ground with ), has been obtained – Fig. 9(b). The difference between the maximum and minimum of the directivity pattern is more than 40 dB (it is interesting to note that the radiation pattern has some asymmetry; the closer the receiver antenna is to the object, the greater the amplitude of the reflected signal).The obtained estimate of the radiation pattern is of practical importance when planning a GPR survey in the presence of unremovable objects of “aerial” reflection.
3.2. Evaluation of the Loza-V GPR directivity pattern in subsurface medium was performed during the Crimean summer expedition of 2022 at two archeological sites. One of them was found in the area of the Hebrew necropolis mentioned in Subsection 3.1. It was a crypt examined on request of the Institute of Archeology of Crimea. The crypt was opened earlier by robbers and has no archeological value. However, it was useful for us as a reference for identifying the radar image of the known object and estimating the GPR radiation pattern. The radargram in Figure 10(a) shows both the measured radar delay time in nanoseconds (right scale) and the object depth in meters, converted with the estimated “radar velocity” m/s (left scale). The measured depth of the top of the crypt (3.5 meters) was taken into account in the interpretation of the radargram.
The measured radiation pattern, Figure 10 (b), reflects the good focusing of the GPR signal and the high level of reflected pulse, which is due to the high dielectric permittivity and low loss rate of the propagation medium.
Another test object for GPR directivity measurements was found in the course of archeological works near the village of Geroevka (El Tiygen). In its vicinity, about 2.5 km from the village, there is an ancient well (Figure 11). According to archaeologists, this well and other objects unearthed as a result of landslides or during the construction of a gas pipeline – Figure 12 (a), are related to the ancient settlement of Nymphaeum.
The objective of our GPR survey was to obtain, in a non-disruptive manner, information confirming the existence of an ancient underground water supply in the area between the identified objects. It has been carried out, following the instructions of archaeologists, with the Loza-V GPR, 200 MHz antennas and a 5 kV transmitter (attenuated by 30 dB).
A structure similar to a cross section of two parallel non-metallic pipes was identified in all the marked areas, see Fig. 12 (b) and scan A1 in Figure 12 (c). The radar image can be interpreted as two ceramic pipes of an ancient aqueduct. Apart of the pure archeological interest, they served us as a good test object for evaluating the GPR antenna directivity pattern in typical field conditions. Figure 12 (d) illustrates the practical method of directivity pattern assessment.
A practical algorithm for estimating the GPR antenna pattern is illustrated in Figure 12(d). By moving horizontally at a distance from the top of the hyperbola (image of a compact object at a depth ) we increase the distance according to the law . The amplitude of the reflected signal at the observation point is taken from the waveforms Fig.12(c) at the corresponding time delay , where . In this way, the effective radiation patterns of the transmit- receiving GPR antenna was built. Although they depend not only on the soil parameters but also on the depth of the buried test-object, these estimates are very useful when working in typical field conditions. The results of the GPR radiation pattern measurements via the radar pulse scattering by the buried pipe are shown in Figure 13.
Another assessment of GPR antenna directivity was carried out during a survey of the Venetian settlement territory (Tikhaya Balka, XIV-XV centuries AD) by order of the Archaeological Expedition of the State Hermitage Museum. As a test object we used the foundation of the destroyed fortress wall at a depth of 1.5 m. This experiment gave a larger width of the main lobe – about 45 degrees at the level of 0.7 (see Figure 14). The difference might be due to the lower refractive index of dry sandy soil.
In both cases, one can notice a rather smooth directivity pattern, which seemingly contradicts the classical Engetta-Papas-Elachi results [18] predicting “horns” of the GPR antenna radiation pattern at the angle of total internzl reflection, see Figure 4(a). However, as thorough analysis, laboratery experiment, and numerical calculation show, realistic resistively-loaded GPR antennas have smooth radiation patterns [20,11,12].
3.3. In what follows, we discuss the experimental material obtained during research mission organized in September 2022 by the Russian Geographic Society, the newspaper "Komsomolskaya Pravda" and the TV channel "Russia1". The object of study was the Patomsky crater, an unusual geological structure in the Siberian taiga, discovered in 1949 in the Bodaibo district of the Irkutsk region [13]. This rare object (a stone ring of 80 meters in diameter, with a central cone, composed of large fragments of limestone, see Figure 15) attracted increasing attention of geo-scientists. The organizers invited experienced geophysisists V. L Sulyandikov and F. P. Morozov for the scientific support of the project.
The origin of the mysterious Patomsky crater, located in the north of the Irkutsk region, attracted the attention of many researchers. V.V. Kolpakov, who discovered the Patomsky crater in 1949 during geological survey work, put forward a hypothesis about its formation as a result of a meteorite fall [13]. The famous volcanologist S.V. Obruchev argued with this hypothesis, leaning toward the volcanic origin of the crater. This point of view was seriously supported by the geological and dendrological studies [15]. Nevertheless, some experts defend the meteorite hypothesis, assuming the presence of a foreign body in the Patomsky crater at a depth of 180-200 meters.
Our GPR cross-sections (Figure 16) performed by F. P. Morozov with Loza-N GPR [14] confirm the most probable volcanic model [15]. The survey was carried out from the earth's surface using the Loza-1N low-frequency DPR with a 21 kV transmitter (maximum pulse value) and antennas with a center frequency of 25 MHz (antenna length of 6 meters).
A distinctive feature of the device is a large energy potential that allows one to work in environments with high conductivity, such as loam or wet clay. The peak power of the transmitter is brought to a physical limit and is limited only by the electrical breakdown of the environment (ground and air). To achieve maximum depths in the Loza-N DPR, the maximum energy of the probing pulse is shifted to lower frequencies within the band 1-50 MHz of the receiver. The equipment was provided by the JSC VNIISMI [16]. The time scale for this measurement was set to 4096 ns (maximum depth about 200 - 250 meters). Like in Figure 10, both radar delay time (right scale) and object depth (left scale) are shown here and below, with an estimated “radar velocity” of 5.5 cm/ns.
GPR B-scan No 6 recorded along the outer ring of the crater (Figure 17a) reflects the geological structure outside the crater cone. According to the interpretation of experienced geologists, it is composed of the following elements. Horizon 0 - 60 m is represented by limestone of homogeneous undisturbed structure. Deeper than 60 meters, undisturbed rocks are recorded, markedly differing in physical properties from the overlying horizon. The main result of the GPR data analysis along this profile is that there are no vertical anomalous structures outside the crater.
The next B-scan No 3 was recorded along the latitudinal diameter of the crater, Figure 18 (a). Here, the geological structure is represented by the following features: horizon 0 - 100 meters is filled with destroyed limestone; undisturbed rocks lie deeper. The most interesting anomalous structure of vertical development is recorded in the central hill of the crater. Two more similar smaller-scale anomalies are noted in the ring moat on the northern and southern sides of the crater – see Figure 18 (b).
A series of horizontal cross sections of the obtained GPR data, Figure 19(a), makes it possible to construct an impressive 3D electrodynamic model of the Patomsky crater, Figure 19(b). The depths of the selected cross sections were estimated with a hypothetical radar speed of cm/ns.
Of special interest are the deepest sections – from 180 to 280 meters. All of them clearly show the contour of the central vertical anomalous structure, located under the central hill of the Patomsky crater. At depths of less than 200 meters, anomalous structures of a smaller scale appear. Noteworthy are the well-distinguishable ring structures around the main anomaly, registered on all sections. Such ring structures (concentric zones of compression and expansion) are typical for the areas of explosive impact on the rock.
Additional information about the nature of the Patomsky crater is provided by the analysis of the reflected signal waveforms – Figure 20. The signals (A) and (C), measured above the rock mass, are characterized by the amplitude deviation towards negative values (-53 and -51 dB, respectively). Such properties of the reflected signal, according to the results of theoretical analysis, indicate low values of the propagation medium permittivity [14]. In practice, this means that the probing signal propagates in a high-resistance medium (in this case, monolithic limestone).
Such deviations of the reflected signal amplitude indicate that the EM wave propagates in a medium with high values of permittivity or conductivity [21-23]. Such changes in properties in a limited vertical portion of the limestone mass can only be associated with a local influx of moisture, the appearance of which can substantially increase the dielectric constant. A local fracture, which could arise due to tectonic processes or from a local impact, can serve as a collector for moisture ingress into the rock mass.
The characteristic shape of the Patomsky crater surface, which consists of a central type ring structure with a bulk cone, an annular moat, and a central hill, can also, with some probability, indicate that the crater originally arose due to the impact of a meteorite, which would support the original hypothesis of A. M.. Portnov [24] who stated a possibility of the presence of a foreign body in the crater at a depth of 180-200 m. The existence of such a local channel of limited depth, which ensures the transport of surface waters, in the cold Siberian climate would lead to the second mechanism – ice diapirus (frost heaving). The processes of frost heaving every winter straighten and restore the shape of the Patomsky crater with a bulk cone, annular ditch and central hill. The latter version also seems quite probable. The only indisputable fact is the existence of a water-saturated channel in a homogeneous limestone mass under the central hill of the Patomsky crater, which was convincingly confirmed by the georadar.
3.4. Many analytical and numerical approaches have been developed for the solution of the problem of GPR pulse propagation in a smoothly layered subsurface medium – see, e.g. [25]. For a qualitative analysis of the aforementioned GPR survey results, we use here our approximate solution of the one-dimensional inverse problem of electromagnetic sounding [26,27] – a time-domain version of the classical coupled-wave method [28,29] . It gives a general picture of the reflected pulse formation on the subsurface medium gradients, consistent with numerous experimental results, and yields a closed-form solution of the simplified inverse problem. We represent the electromagnetic signal received by the GPR antenna as . Here,is the normalized propagation time of the probing pulse ( is the speed of light), is the signal waveform, and the integral
describes the cumulative effect of partial reflections of an incident wave from dielectric permittivity gradients in the subsurface medium. This approximation, obtained by the coupled wave method [19], makes it possible to find an explicit solution to the inverse problem. Its parametric representation has the form
where the function is determined by the inverse transform of the ratio
of the incident and reflected pulse Fourier transforms: and . Absorption can be taken into account by introducing the complex permittivity, , which leads to a significant complication of the analysis [19]. Under the condition , the perturbation method can be used. The calculations are simplified and lead to a slight modification of the main formula (1):
Unfortunately, one measurement of the reflected signal waveform is not enough to determine the two unknown functions: and . To find them, one can use an a priori electrodynamic model of the subsurface medium (for example, by assuming a constant loss angle, which is realized under the condition ) or perform two measurements of the reflected signal with antennas having different frequency responses [26]. In the first case, we obtain an integral equation
with and some generalization of the parametric solution (2)-(3):
The second approach requires some complication of the experimental technique.
In this work, to obtain a qualitative estimate, we neglect ohmic absorption, which is apparently not very significant under experimental conditions, and consider the level of the reflected signal as a measure of the vertical gradients of the subsurface medium permittivity. For an asymptotic estimate, we transform Equation (5) via integration by parts, defining , , where function has a single maximum at . Let, for example, , where is the characteristic pulse length. For a short pulse, integral (5) is determined by a narrow neighborhood of the function maximum. Taking slowly varying functions out from under the integral sign (5), we obtain:
The integral for small values of can be approximated by a linear function , and rapidly tends to a constant depending on the antenna half-length , see Figure 21.
Following the method developed in our works [26,27], we consider formula (7) as a differential equation for determining the ground permittivity profile . Indeed, for a given model of the GPR pulse and the measured waveform of the reflected signal waveform , in the differential equation the right-hand side is a known function and it can be integrated by substitution :;
. Taking into account the initial condition its explicit solution is given by the integral
Equation (9) simplifies in the absence of losses ():
In combination with the integral , Eq. (10) yields an explicit solution to the probing problem. Three problems remain:
- 1)
- There is no registration of the emitted pulse amplitude in the current GPR models (some approaches to the problem are outlined in [30]);
- 2)
- Since drilling near this rare natural object is excluded, the numerical value of the permittivity at the depth of far reflections can be selected only from general considerations;
- 3)
- Moreover, our 1D model does not describe the divergence of the probing signal in subsurface medium, which leads to some error in the return pulse amplitude. If necessary, this effect can be taken into account by introducing an appropriate divergence factor.
Taking into account these considerations, the approximate solution of the 1D inverse problem has been used to process the GPR sounding data of the Patomsky crater, performed by F. P. Morozov, as a part of the Komsomolskaya Pravda expedition. Three A-scans were selected in Figure 22 (a): in the center of the stone "dome" (A 38) and at two points of the annular shaft – A21 and A 48. For convenience, the color amplitude scale used throughout the paper is repeated in Fig.22 (b). Attention was drawn to the difference in the sign of deep reflections when sounding the central dome and its periphery – cf. Figure 20. To construct the dielectric permittivity profile, taking into account the above considerations, our analytical solution was written in a form convenient for practical assessments - with explicitly indicated hypothetical permittivity values at the reflection depths of the initial and tail parts of the GPR pulse and :
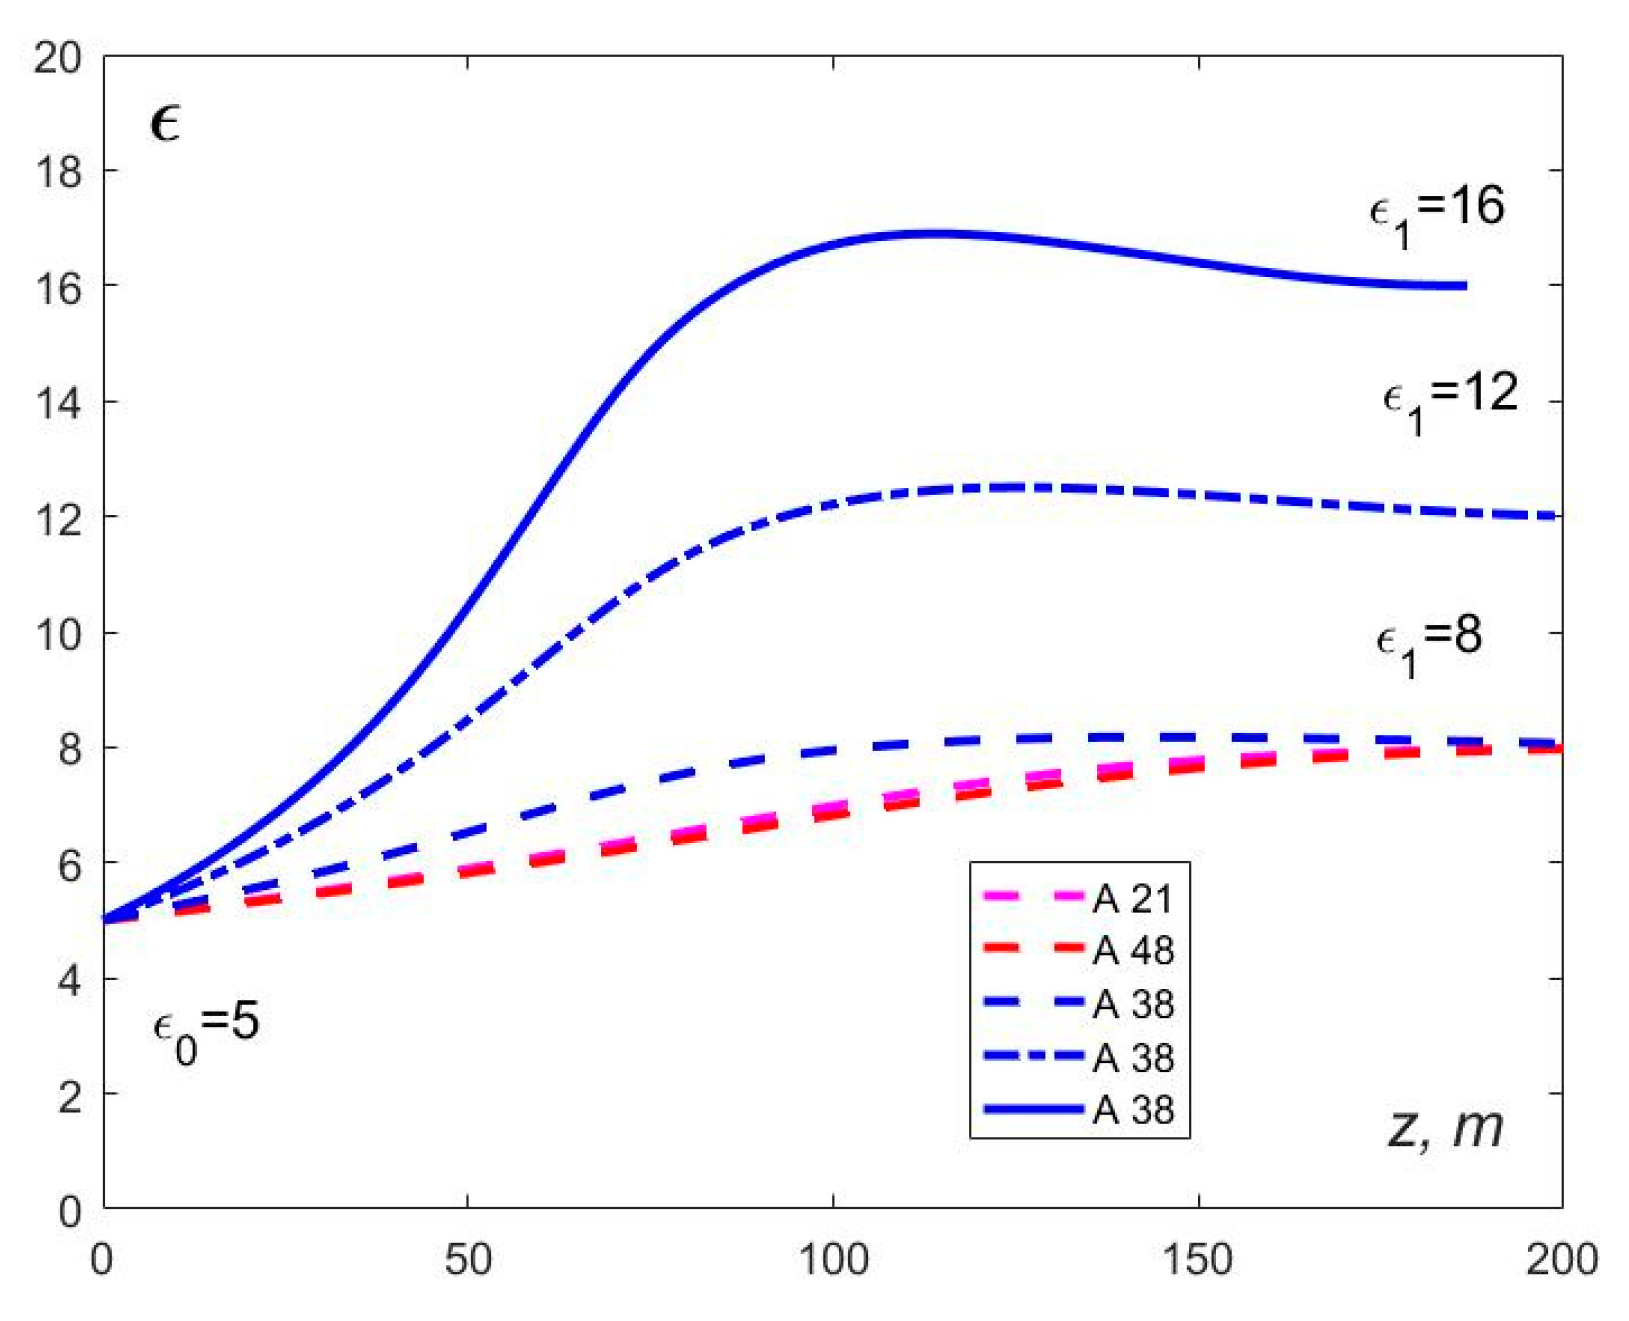
Figure 23 shows plots of the soil dielectric permittivity reconstructed by Eq. (11), from the initial value consistent with geological data to the deep ground values, corresponding to the hypothesis of meltwater saturation of the crater, for three hypothetical values of .
Maximum dielectric permittivity at the depths of about 100 meters may indicate increased moisture.saturation of the soil filling the well.
4. Conclusion
As it was stated in the Introduction, the results of our Crimean campaign have both cultural-historical and methodological value. The usefulness of georadar survey in archeological research can hardly be overestimated: the number of new artefacts found during a short GPR inspection of an ancient Jewish cemetery in the vicinity of the Kerch city is comparable with the volume of previous findings. Archeological work near the village of Geroevka not only helped to outline the territory of a rare ancient water pipeline, but may also correct the direction of further construction works. The objects found on the territory of the ancient Venetian settlement of the XIV-XV centuries in Tikhaya Balka will also contribute to the material history of the Middle Ages.
From the technical point of view, the Crimean expedition gave a good chance to perform the estimates of GPR antenna radiation pattern in different materials (air, dry or wet soils) and emphasized the necessity to organize quantitative measurements in the typical media with controlled electrophysical parameters.
Our Siberian GPR mission must be evaluated from different points of view. First of all, it was the first attempt of objective electrophysical inspection of this rare natural object. The results of deep georadar sounding did not support the hypothesis of a massive foreign body present in the crater, which makes the less exotic volcanic origin of the Patomsky phenomenon more probable. Of course, other non-destructive techniques, such as multi-frequency radar probing combined with magnetic measurements, can give new information on the origin and structure of the crater. In this regard, as well as to popularize the tourist route and to organize the protection of this unique natural site, the “Komsomolskaya Pravda” expedition can play a good role.
Funding and Support
This research was funded by the Russian Science Foundation in the framework of research project “Deep Penetration Radar: Theory, Methods, Experiment”, grant № 22-1200083. Scientific management and technical support have been provided by IZMIRAN and JSC Company VNIISMI.
Author Contributions
conceptualization, P.M. and A.P.; methodology, P.M.; software, A.P. and M.L.; investigation, F.M., M.L. and L.B.; formal analysis, A.P.; resources, P.M.; data curation, F.M., M.L. and L.B.; writing and funding acquisition, P.M. and A.P, English editing, M.L. All authors have read and agreed to the published version of the manuscript.
Data Availability Statement
The data presented in this study are available on request from IZMIRAN and JSC VNIISMI.
Acknowledgments
The first part of the works has been done with legal support of the Institute of Archeology of Crimea of the Russian Academy of Sciences, the State Hermitage Museum and the Research Center for the History and Archeology of Crimea. The Siberian expedition has been organized and supported by Editors of the newspaper “Komsomolskaya Pravda”, the scientific equipment has been provided by VNIISMI and JSC Lenzoloto. We are grateful to a native English speaker Prof. D. T. Attwood who kindly agreed to read the text and to give his valuable comments.
Conflicts of Interest
The authors declare no conflict of interest. The funders had no role in the collection, analyses, or interpretation of data; in the writing of the manuscript; or in the decision to publish the results.
References
- Daniels, D.J. Ground Penetrating Radar, 2nd ed., IEE Radar, Sonar and Navigation Series 15 (Ed.). The Institution of Electrical Engineers: London, UK, 2004. [CrossRef]
- Benedetto, A.; Pajewski, L., Eds. Civil Engineering Applications of Ground Penetrating Radar; Book Series: “Springer Transactions in Civil and Environmental Engineering”; Springer: New Delhi, India, 2015; p. 385, ISBN 978-3-319-04813-0.
- Persico, R. Introduction to Ground Penetrating Radar: Inverse Scattering and Data Processing; Wiley-IEEE Press: New York, NY, USA, 2014; p. 392. ISBN 978-1-118-30500-3. [Google Scholar]
- Gukin, V.D. Gukin V.D., Morozov P.A., Andryushchenko V.V., Ivanov S.V., Tsarenko S.A., Bondarenko S.V. Problems of preservation of archaeological heritage sites on the Crimean Peninsula (in Russian). Proc. of Complex South-Eastern Crimean Archaeological Expedition of the State Hermitage Museum. Institute of Archeology of Crimea RAS, Dec. 14-18, Simferopol, 2022.
- Kopeikin, V.V.; Krasheninnikov, I.V.; Morozov, P.A.; Popov, A.V. ; Fang, Guangyou, Liu Xiaojun, Zhou Bin, Experimental verification of LOZA-V GPR penetration depth and signal quality. In Proceedings of the 4th Internat. Workshop on Advanced GPR, Naples, Italy; pp. 230–233.
- Smith, G. Directive properties of antennas for transmission into a material half-space. IEEE Transactions on Antennas and Propagation 1984, 32(3), 232–246. [Google Scholar] [CrossRef]
- Arcone, S. Numerical studies of the radiation patterns of resistively loaded dipoles. Journ. Applied Geophysics 1995, 33, 39–52. [Google Scholar] [CrossRef]
- Millard, S.; Shaari, A.; Bungey, J. Field pattern characteristics of GPR antennas. NDT and E International, vol. 35, no. 7, pp. 473–482, 2002.
- Poljak, D.; Dori´c, V.; Birki´c, M.; El Khamlichi Drissi, K.; Lallechere, S.; Pajewski, L. A simple analysis of dipole antenna radiation above a multilayered medium. In Proc. of 9th Interat. Workshop IWAGPR, Edinburgh, UK, pp. 1–6, 2017.
- Warren, C.; Giannopoulos, A. Creating FDTD models of commercial GPR antennas using Taguchi's optimisation method. Geophysics 2011, 76(2), G37–G47. [Google Scholar] [CrossRef]
- Diamanti, N.; Annan, A.P. Characterizing the energy distribution around GPR antennas. Journ. Applied Geophysics 2013, 99, 83–90. [Google Scholar] [CrossRef]
- Warren, C.; Giannopoulos, A. Characterisation of a ground penetrating radar antenna in lossless homogeneous and lossy heterogeneous environments. Signal Processing 2017, 132, 221–226. [Google Scholar] [CrossRef]
- Kolpakov V. V. Misterious crater in Patom Highlands. Priroda 1951. No 1-2, pp. 58-61 (in Russian).
- Berkut, A.I.; Edemsky, D.E.; Kopeikin, V.V.; Morozov, P.A.; Prokopovich, I.V.; Popov, A.V. Deep penetration subsurface radar: Hardware, results, interpretation. In Proceedings of the 9th International Workshop on Advanced Ground Penetrating Radar (IWAGPR 2017), Edinburgh, UK; 2017; pp. 1–6. [Google Scholar]
- Antipin, V.S., Fedorov, A.M. The origin of Patom Crater, East Siberia, from geological and geochemical data. Dokl. Earth Sc. 2008, 423, 1335–1339, [Translated from Doklady Akademii Nauk 2008, 423(3), 361–366. [CrossRef]
- Berkut, A.I.; Popov, A.V.; Kopeikin, V.V.; Morozov, P.A. The principles of increasing the penetration depth and the application experience of GPR "Loza", International school for young researchers «Registration of subsurface targets by short-range radar», Bauman Moscow State Technical University, 25-27 October 2016, https://school2016.rslab.ru/?lang=en&fn=program.
- Wu T.T., King R.W.P. The cylindrical antenna with nonreflecting resistive loading. IEEE Trans. Antennas Propag. 1965, 13(3), 369−373.
- Engheta N., Papas C.H., Elachi C. Interface extinction and subsurface peaking of the radiation pattern of a line source. Applied Physics B 1981, 26, 231–238. [Google Scholar]
- Edemsky F., Popov A., Zapunidi S. A time domain model of GPR antenna radiation pattern. Internat. Journ. of Electronics and Telecommunications, vol. 57(3), pp.407−411, 2011.
- B. Lampe, K. Holliger. Resistively loaded antennas for ground-penetrating radar: A modeling approach. Geophysics 2005, 70, K23–K32. [Google Scholar] [CrossRef]
- Zeng, Q.; Delisle, G.Y. Transient analysis of electromagnetic wave reflection from a stratified medium. In Proceedings of the 2010 Asia-Pacific International Symposium on Electromagnetic Compatibility, Beijing, China, 12–16 April 2010; pp. 881–884. [Google Scholar]
- Kaganovsky, Y.; Heyman, E. Pulsed beam propagation in plane stratified media: Asymptotically exact solutions. In Proceedings of the 2010 URSI International Symposium on Electromagnetic Theory, Berlin, Germany, 16–19 August 2010; pp. 829–832. [Google Scholar]
- Epstein, P.S. Reflection of waves in an inhomogeneous absorbing medium. Proc. Natl. Acad. Sci. USA 1930, 16, 627–637. [Google Scholar] [CrossRef] [PubMed]
- Portnov, A.M. Crater on the Patom Highlands. Priroda 1962, No 11, pp. 102–103 (in Russian). 11.
- Lambot, S.; Slob, E.; Vereecken, H. Fast evaluation of zero-offset Green’s function for layered media with application to ground-penetrating radar. Geophys. Res. Lett. 2007, 34, L21405. [Google Scholar] [CrossRef]
- Vinogradov, V.A.; Kopeikin, V.V.; Popov, A.V. An approximate solution of 1D inverse problem. In Proceedings of the 10th Internat. Conf. on Ground Penetrating Radar, Delft, The Netherlands; 2004; pp. 95–98. [Google Scholar]
- Prokopovich, I.; Popov, A.; Pajewski, L.; Marciniak, M. Application of Coupled-Wave Wentzel-Kramers-Brillouin Approximation to Ground Penetrating Radar. Remote Sensing 2018, 10, 22. [Google Scholar] [CrossRef]
- Brekhovskikh, L.M. Waves in Layered Media, 2nd ed.; Academic Press: New York, NY, USA, 1980; 520p, ISBN 9780323161626. [Google Scholar]
- Bremmer, H. Propagation of Electromagnetic Waves. In Handbuch der Physik/Encyclopedia of Physics; Flugge, S., Ed.; Springer: Berlin/Goettingen/Heidelberg, Germany, 1958; Volume 4/16, pp. 423–639. [Google Scholar]
- Popov, A.; Prokopovich, I.; Edemskii, F. GPR image deconvolution from antenna current waveform. In Proceedings of the Internat. Conf. Days on Diffraction, St. Petersburg, Russia 2018, pp. 231-236, 978-1-7281-0313-6/18/$31.00@2018 IEEE.
Figure 1.
Loza-V GPR with 200 MHz antennas.
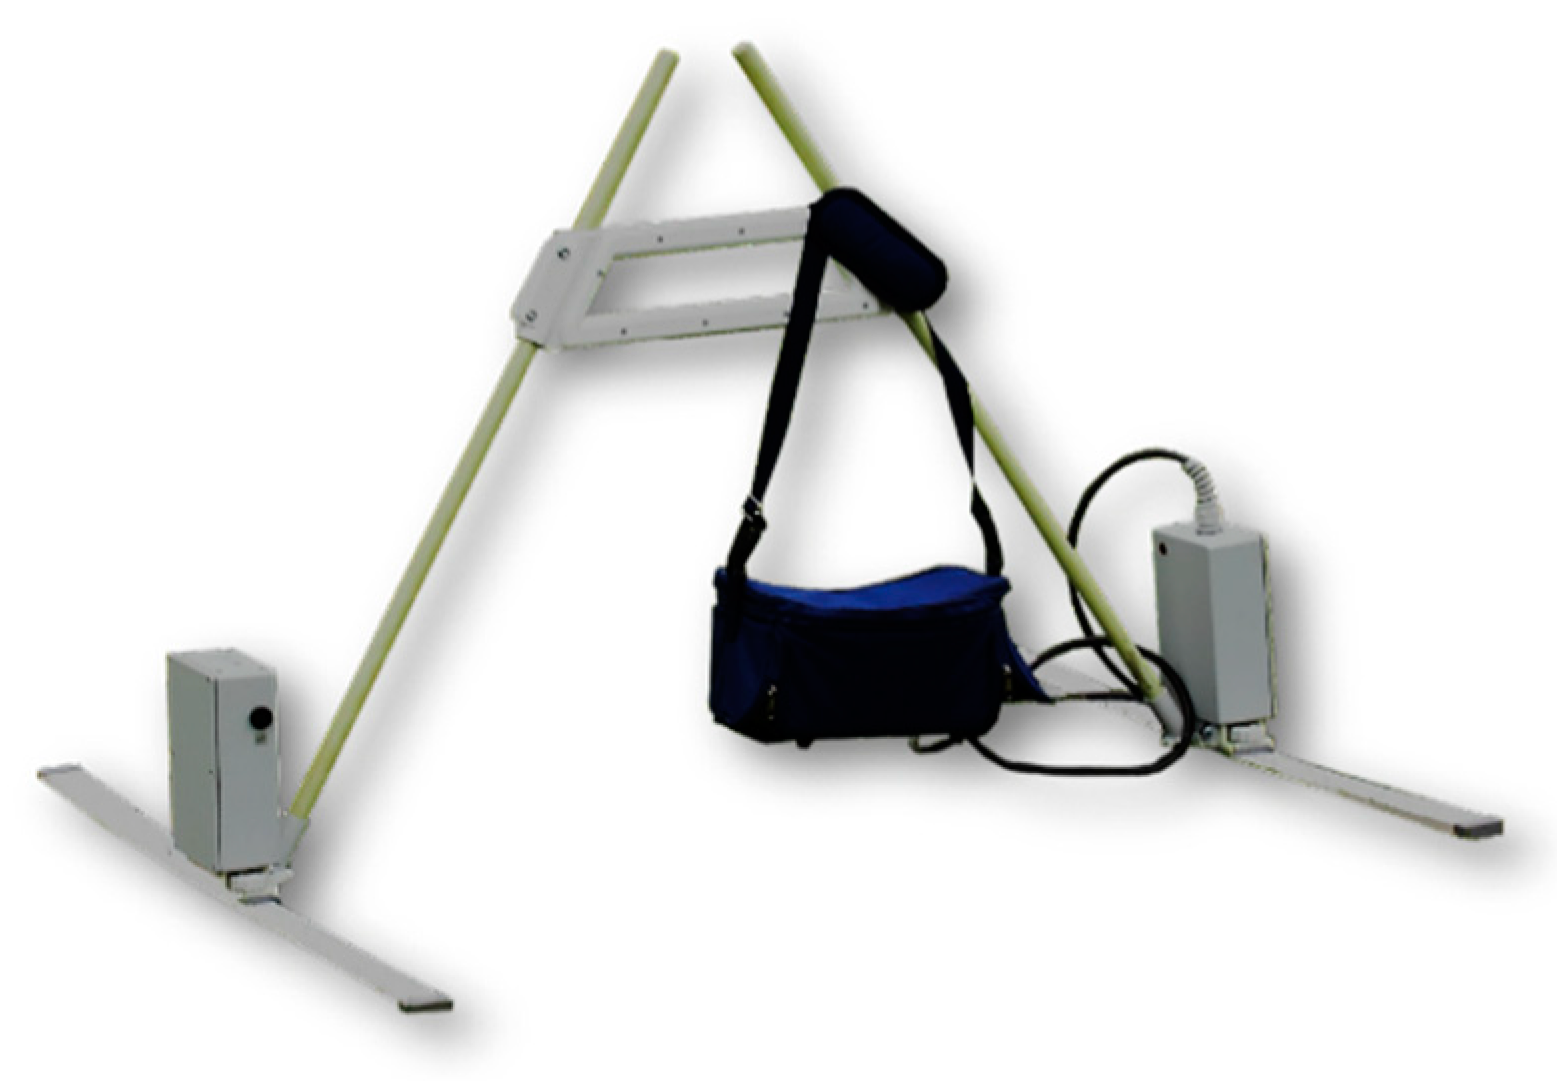
Figure 2.
Loza-N GPR with 50 MHz antennas.
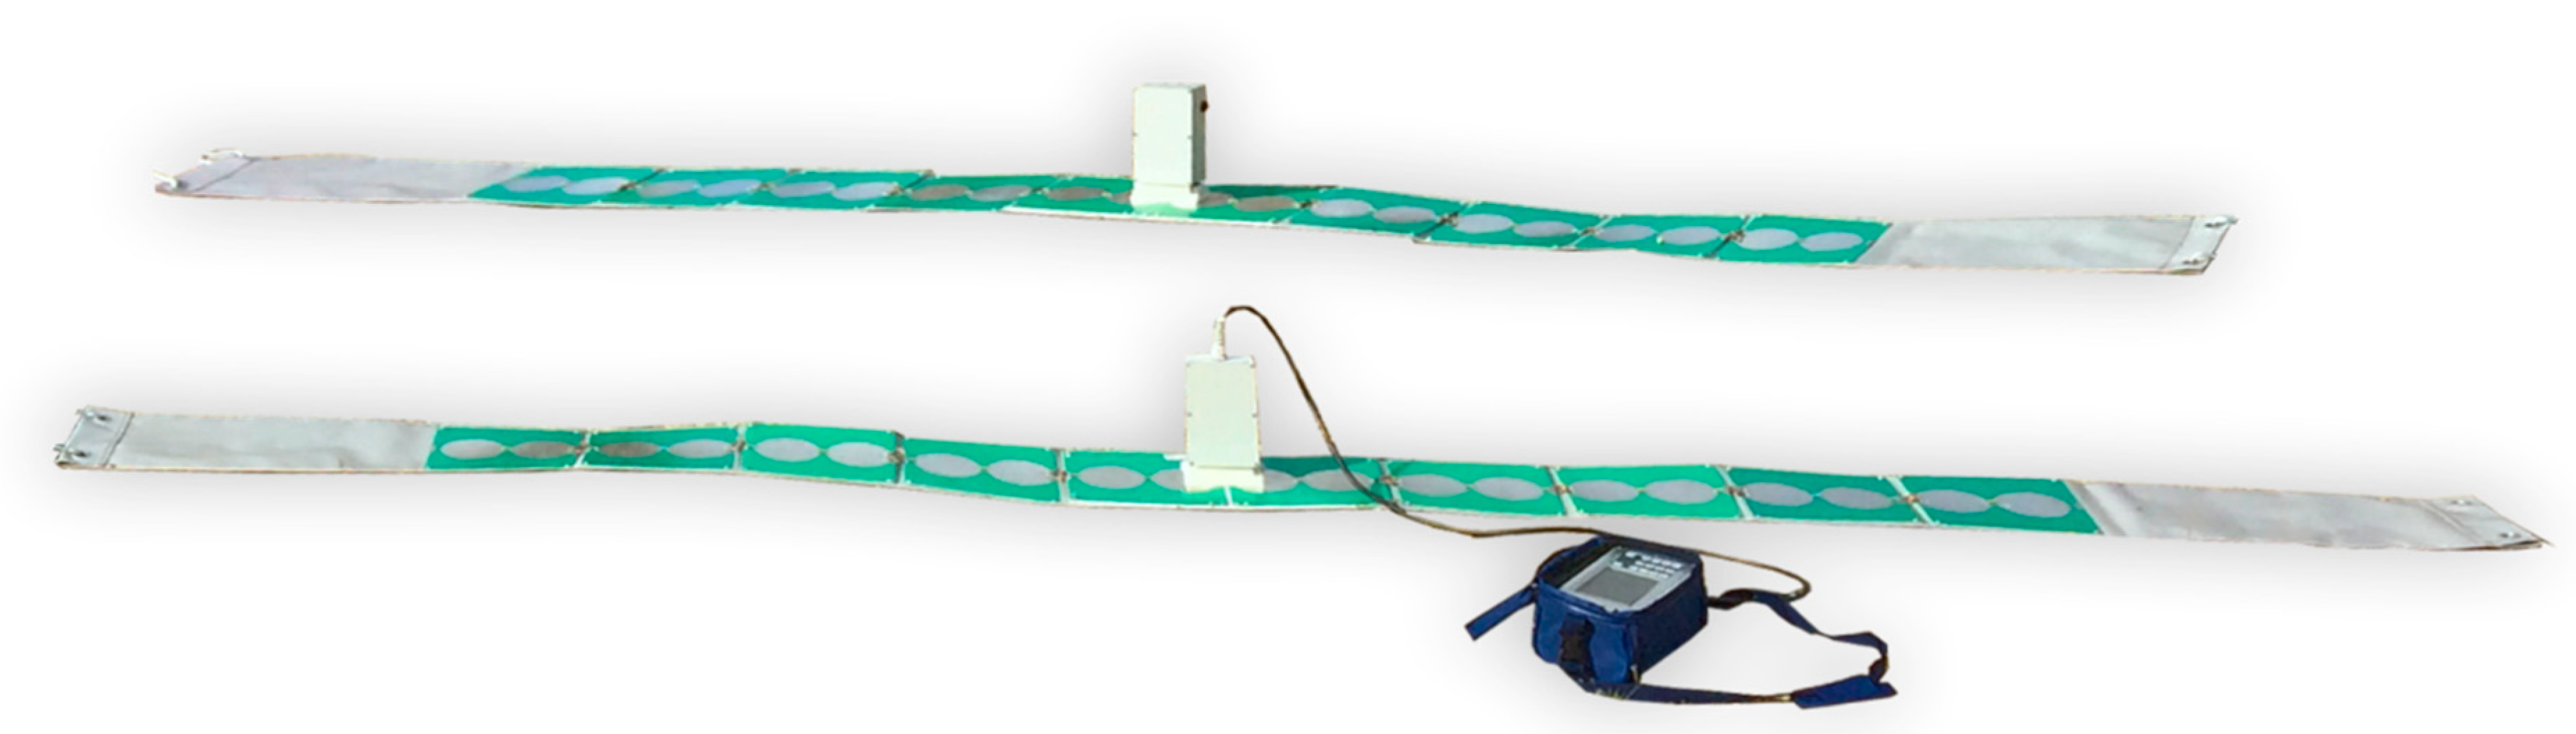
Figure 4.
Radiation pattern of an infinite line vibrator on the ground-air boundary. (a) Harmonic radiation, different values of the ground permittivity [18]: = 2 (ꞏꞏꞏ); 4 (- - -); 9 (–––). (b) Peak radiation pattern of an impulse line antenna [19] for = 4 and a one-period sinusoidal current pulse form. Distance between the transmitter dipole and point receiver: (1) 200 m, (2) 12 m, (3) 4 m, (4) 2 m.
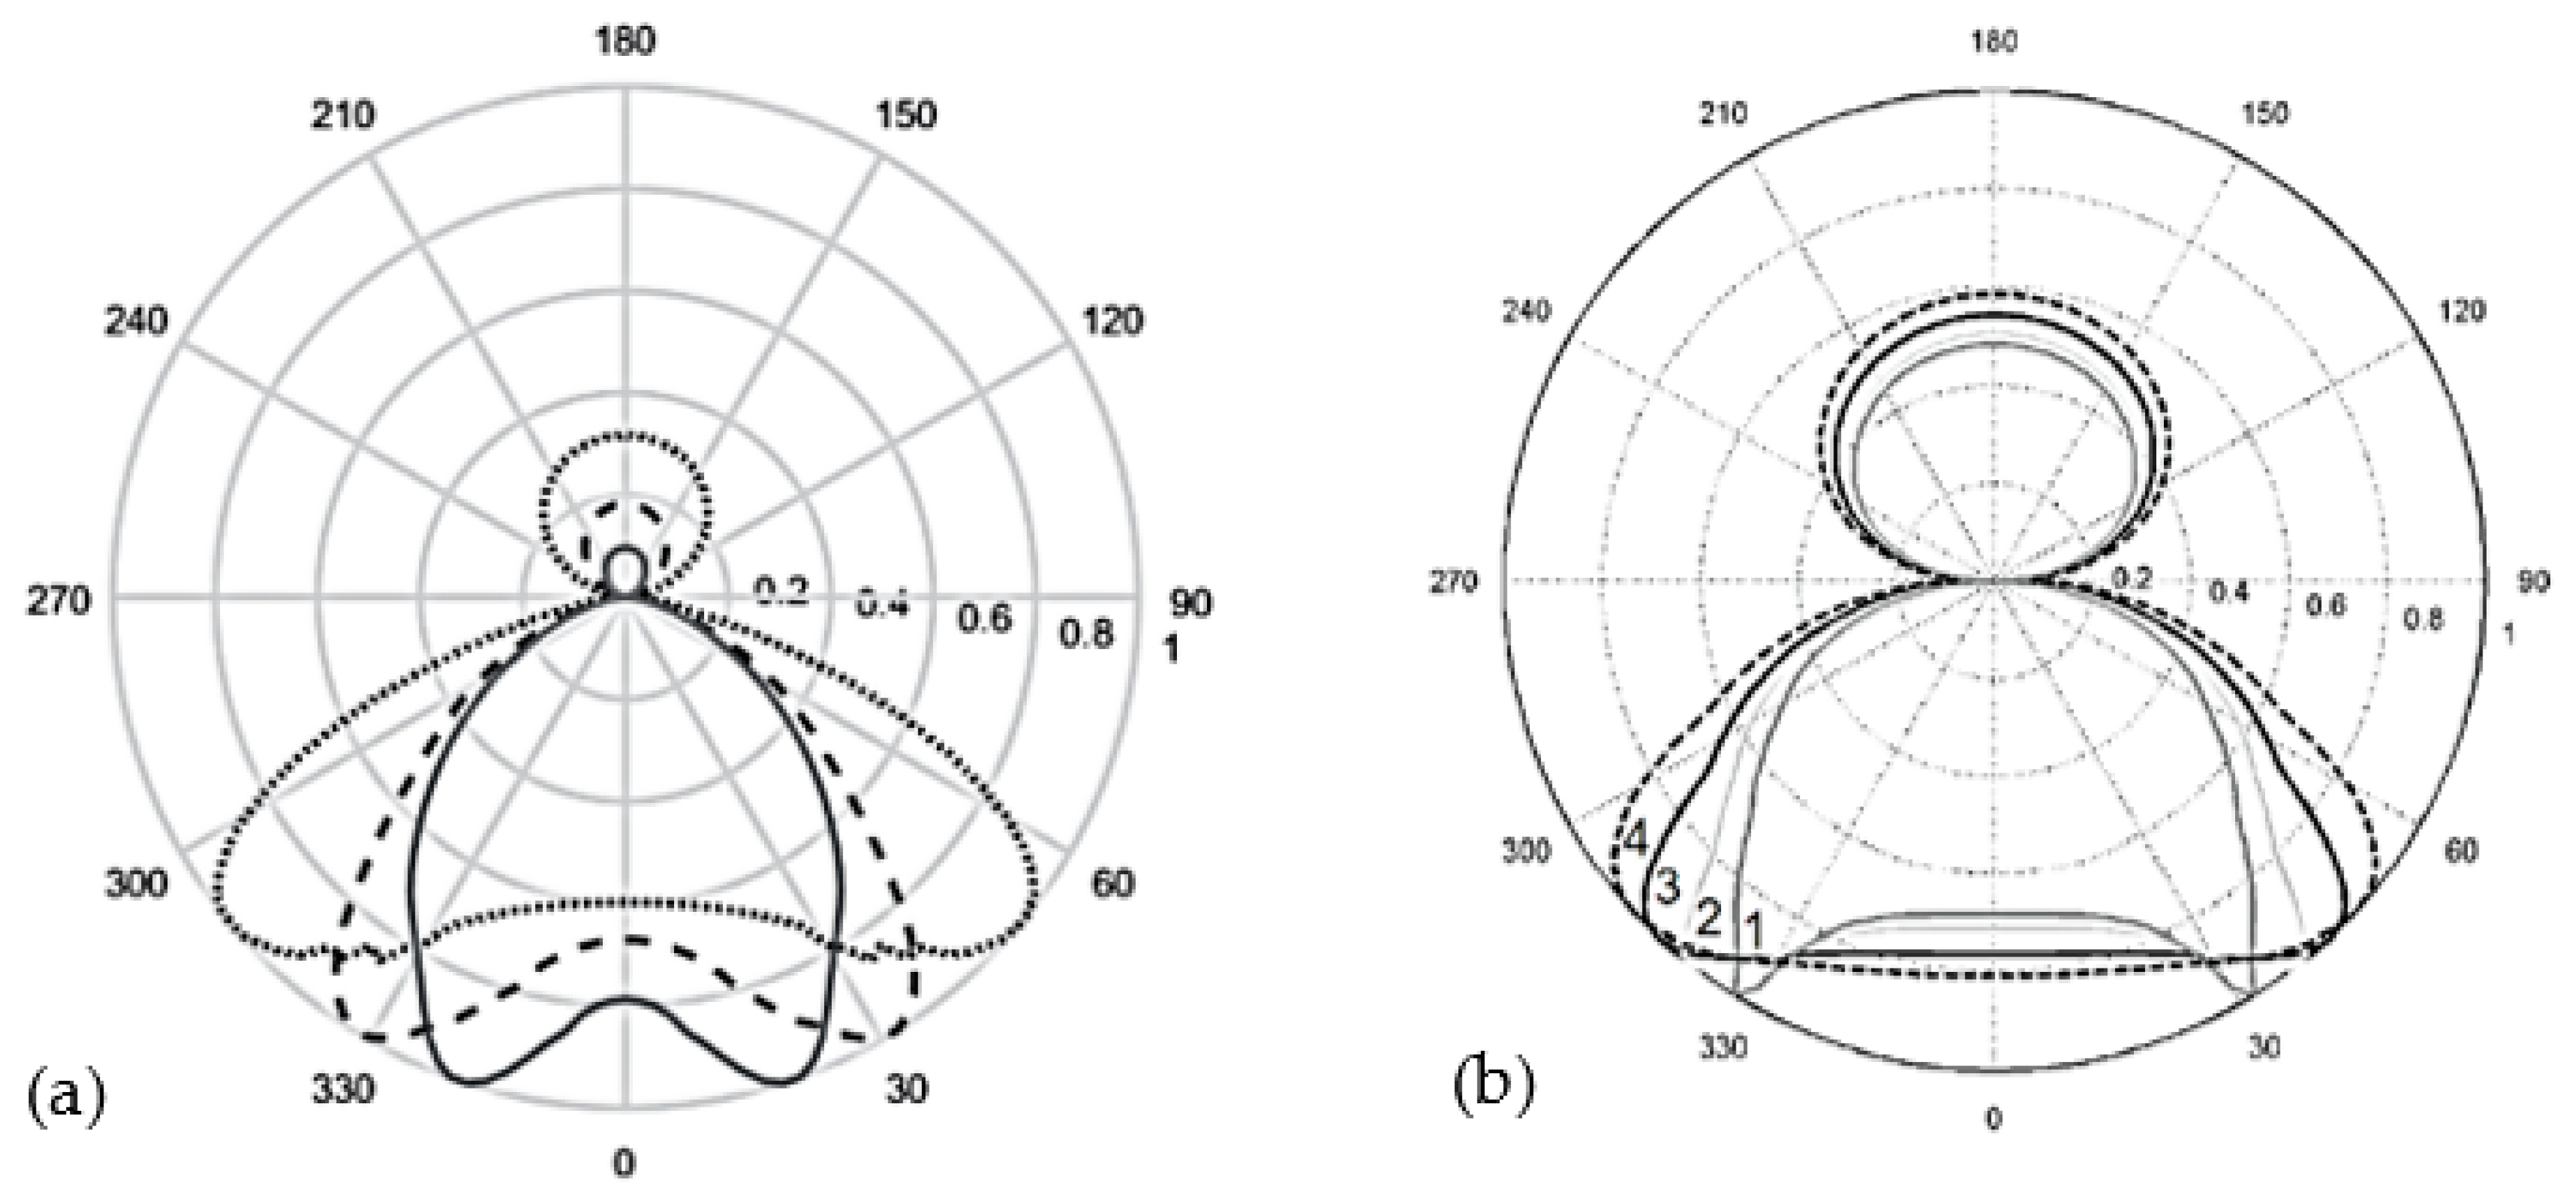
Figure 5.
The spatio-temporal radiation pattern of an infinite line GPR, with 1 m separation between the antennas. (a) Transmitter pulse propagating into ground () for the distance m; (b) Receiver directional pattern; (c) Resulting GPR diagram.
Figure 5.
The spatio-temporal radiation pattern of an infinite line GPR, with 1 m separation between the antennas. (a) Transmitter pulse propagating into ground () for the distance m; (b) Receiver directional pattern; (c) Resulting GPR diagram.
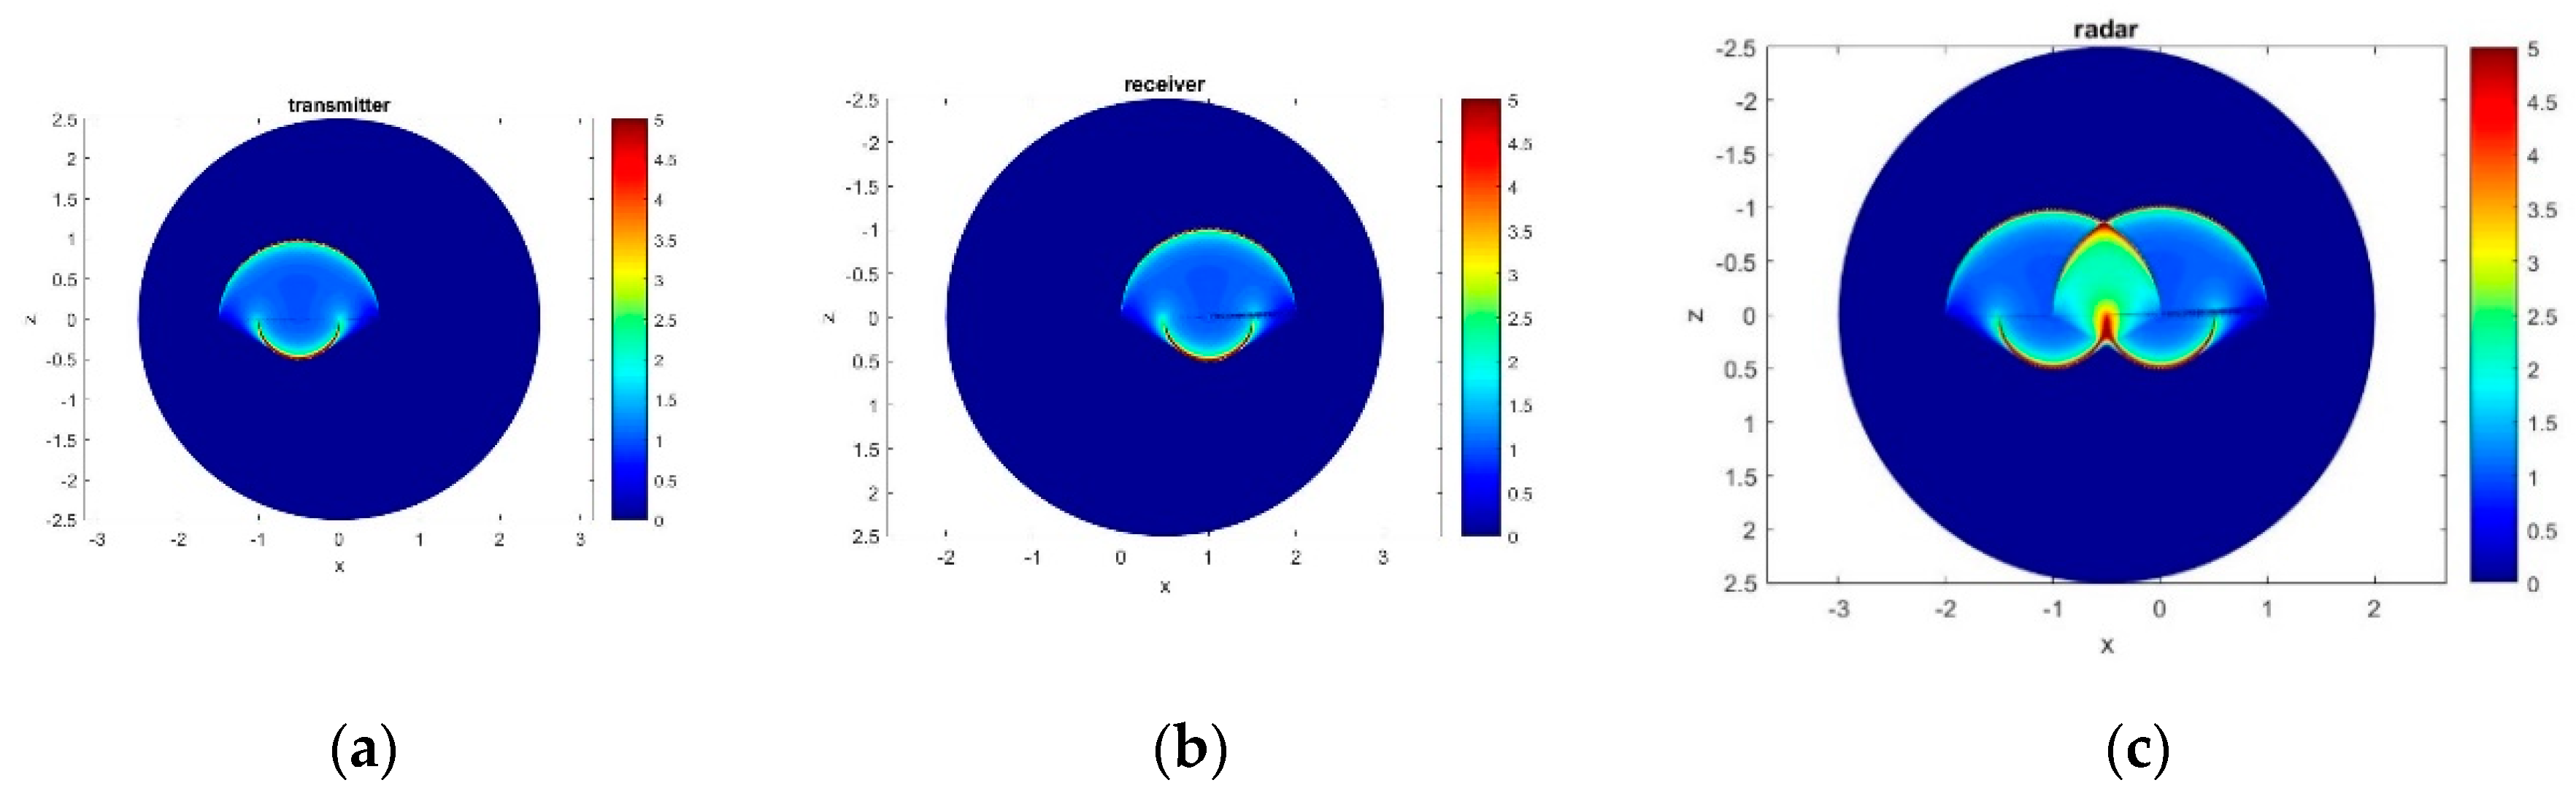
Figure 6.
Measurements of GPR radiation pattern in the upper hemisphere, under an electric power line.
Figure 6.
Measurements of GPR radiation pattern in the upper hemisphere, under an electric power line.
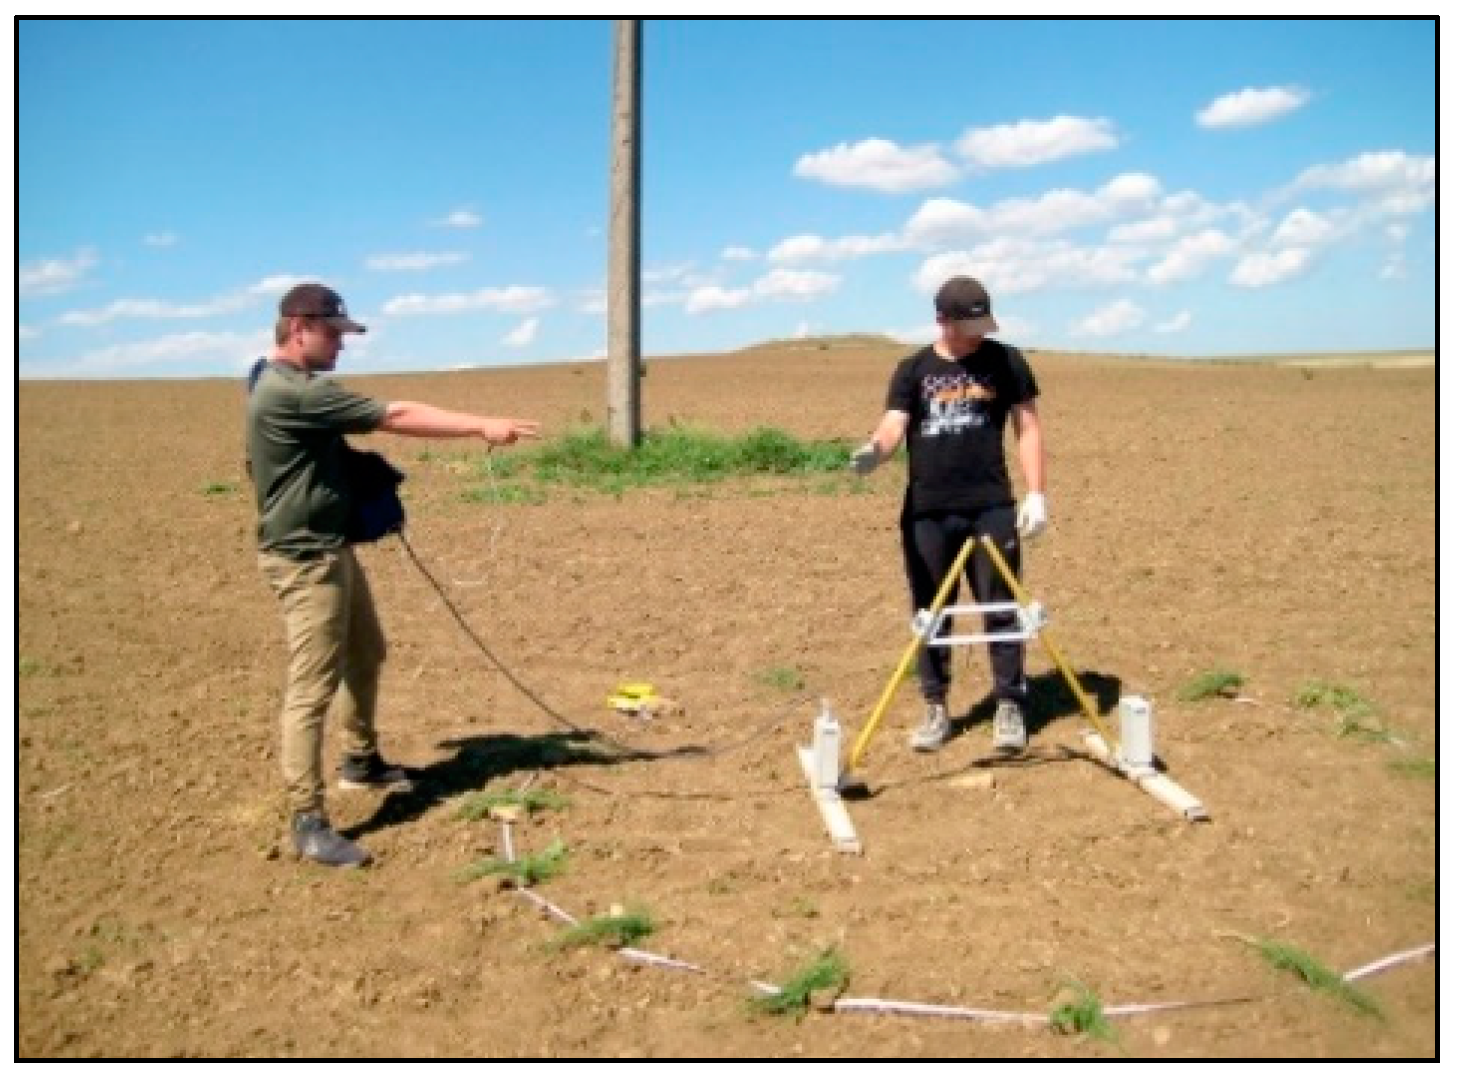
Figure 7.
Ancient well and pipe outlets.
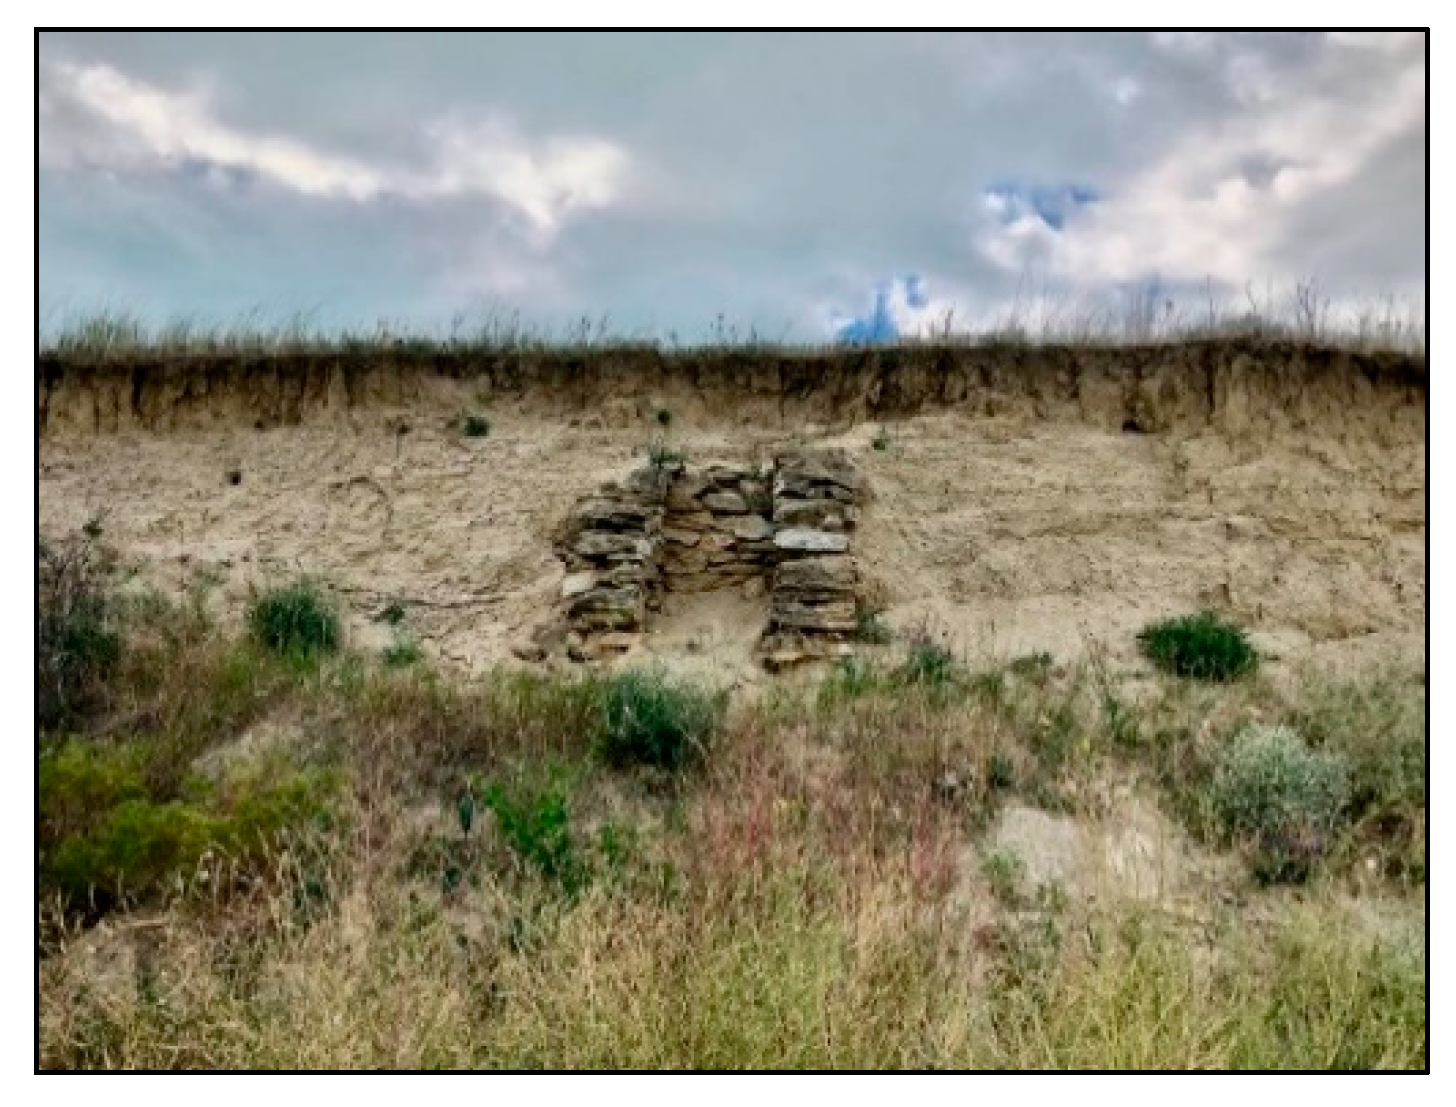
Figure 8.
Fragments of Jewish tombstones.
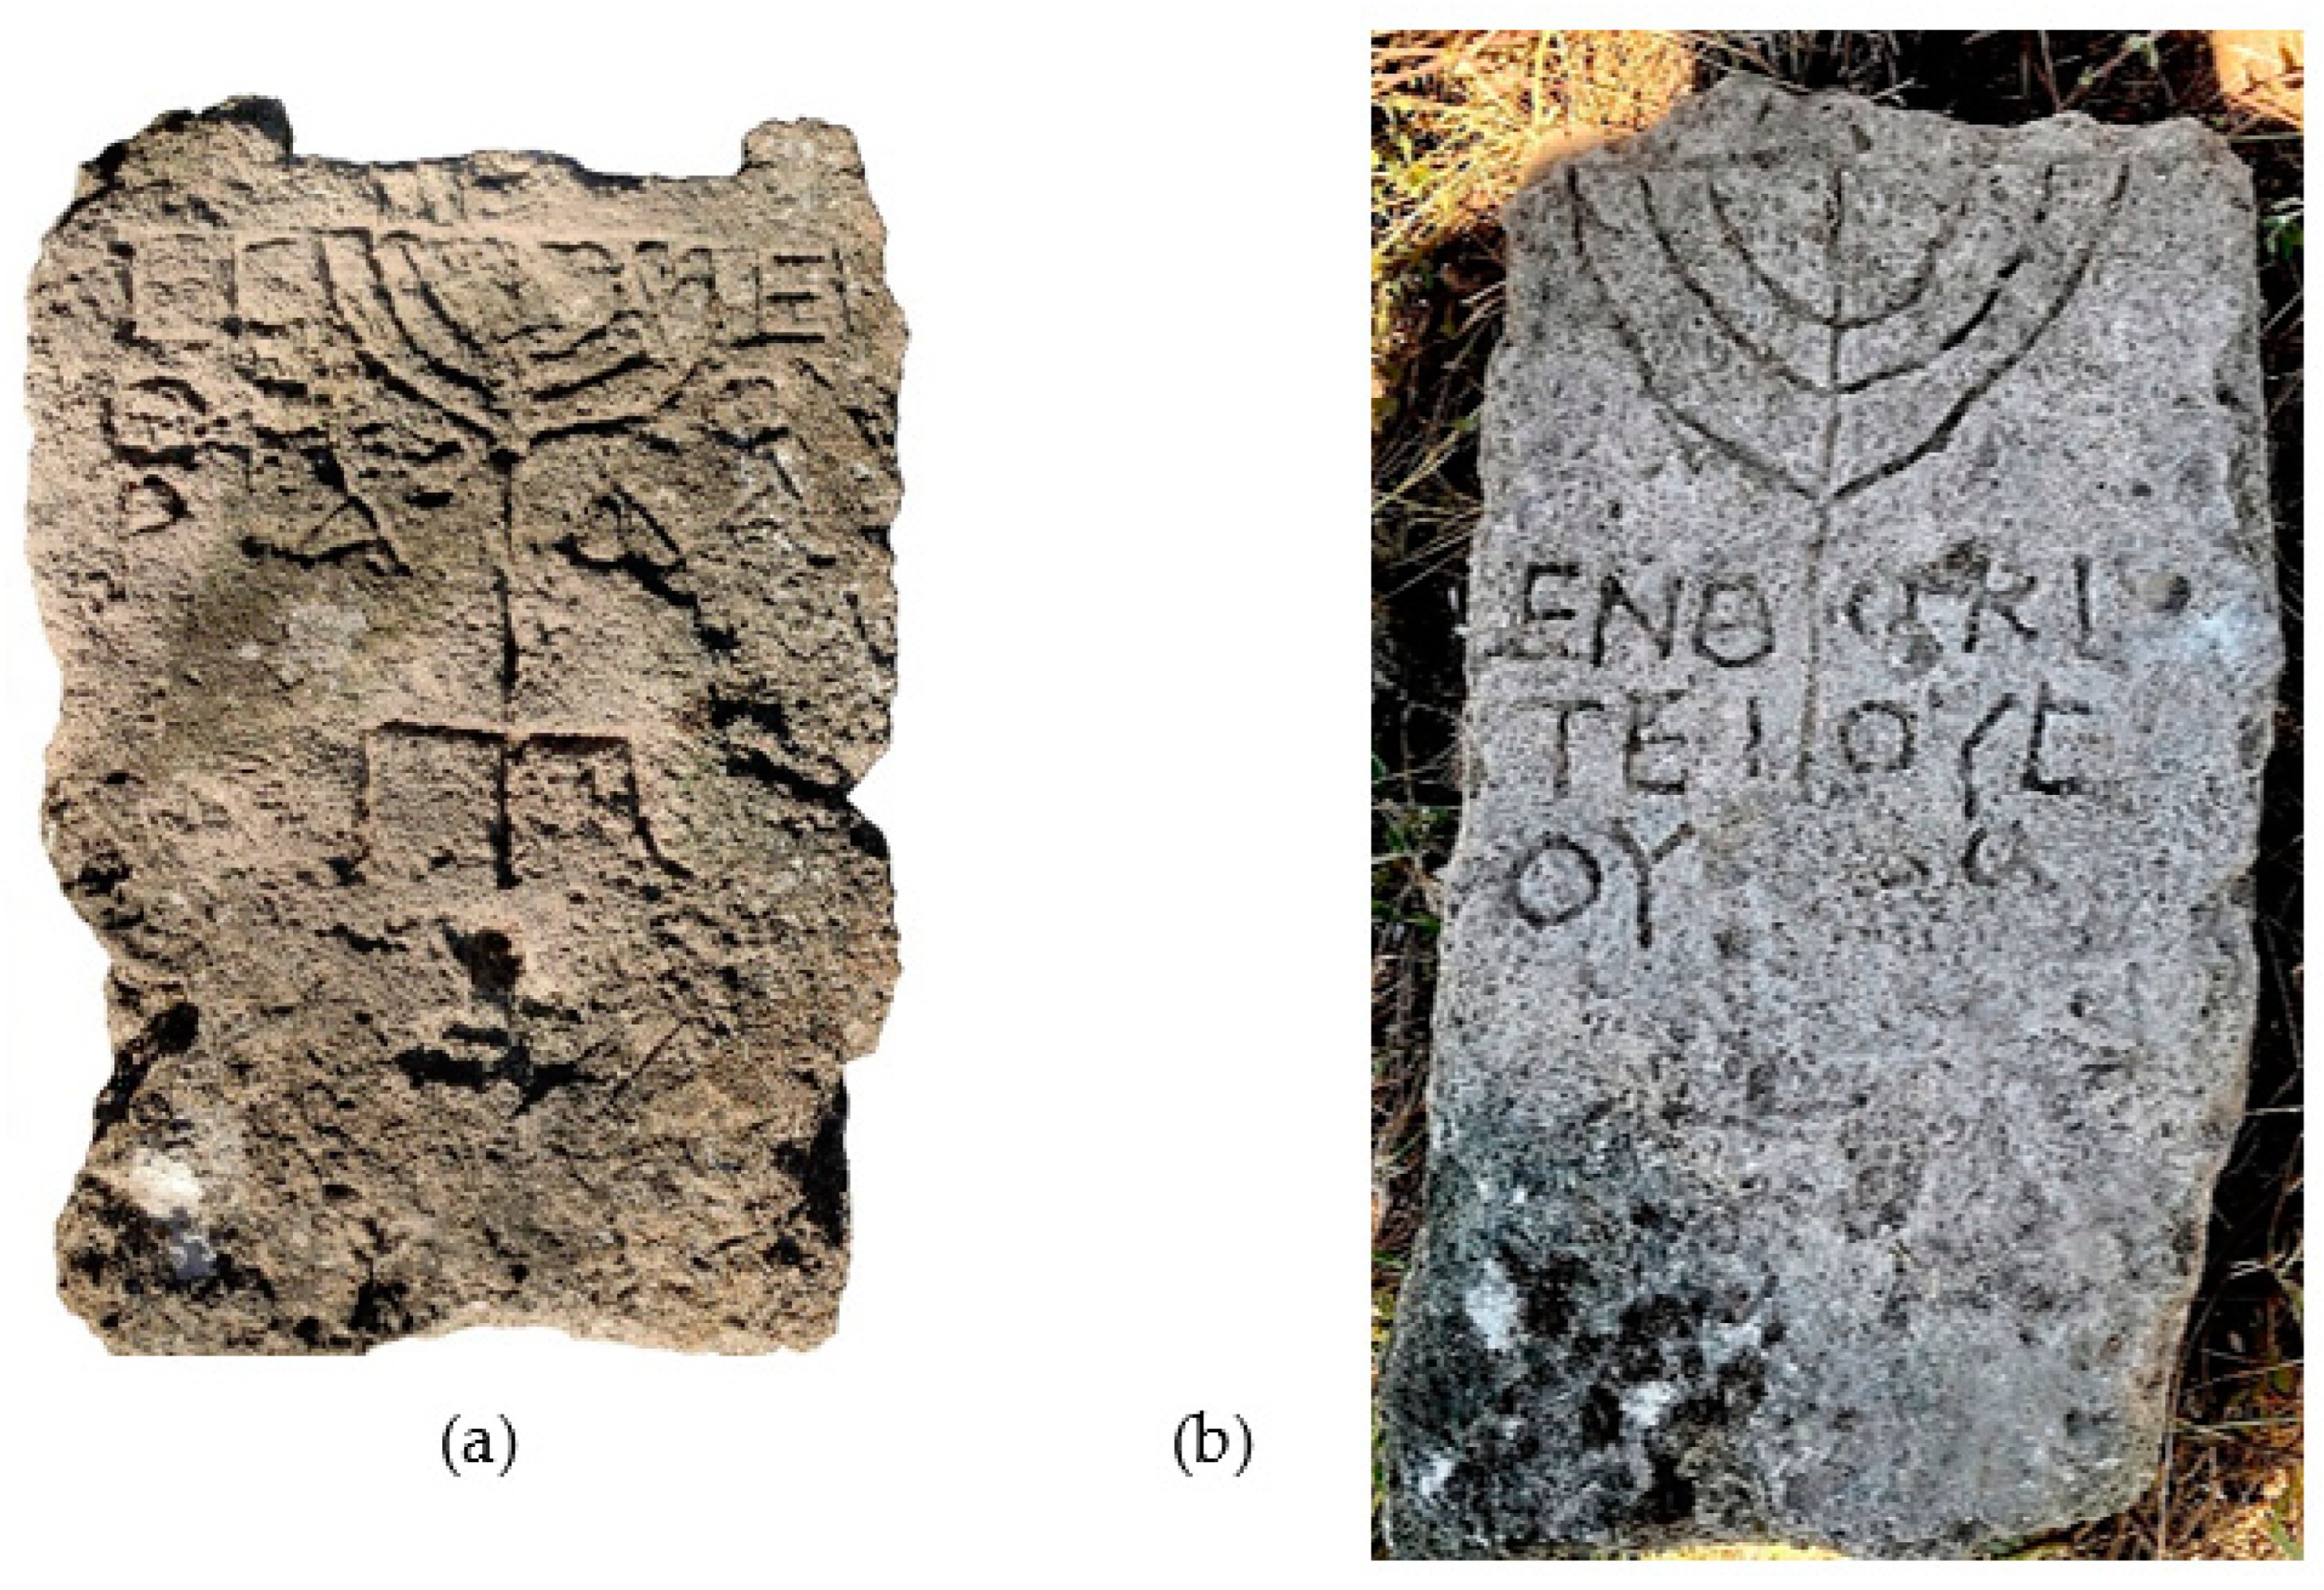
Figure 9.
(a) GPR scan of the electric power line. Conversion of the radar delay time in the object depth is done with ; (b) Horizontal directivity pattern.
Figure 9.
(a) GPR scan of the electric power line. Conversion of the radar delay time in the object depth is done with ; (b) Horizontal directivity pattern.
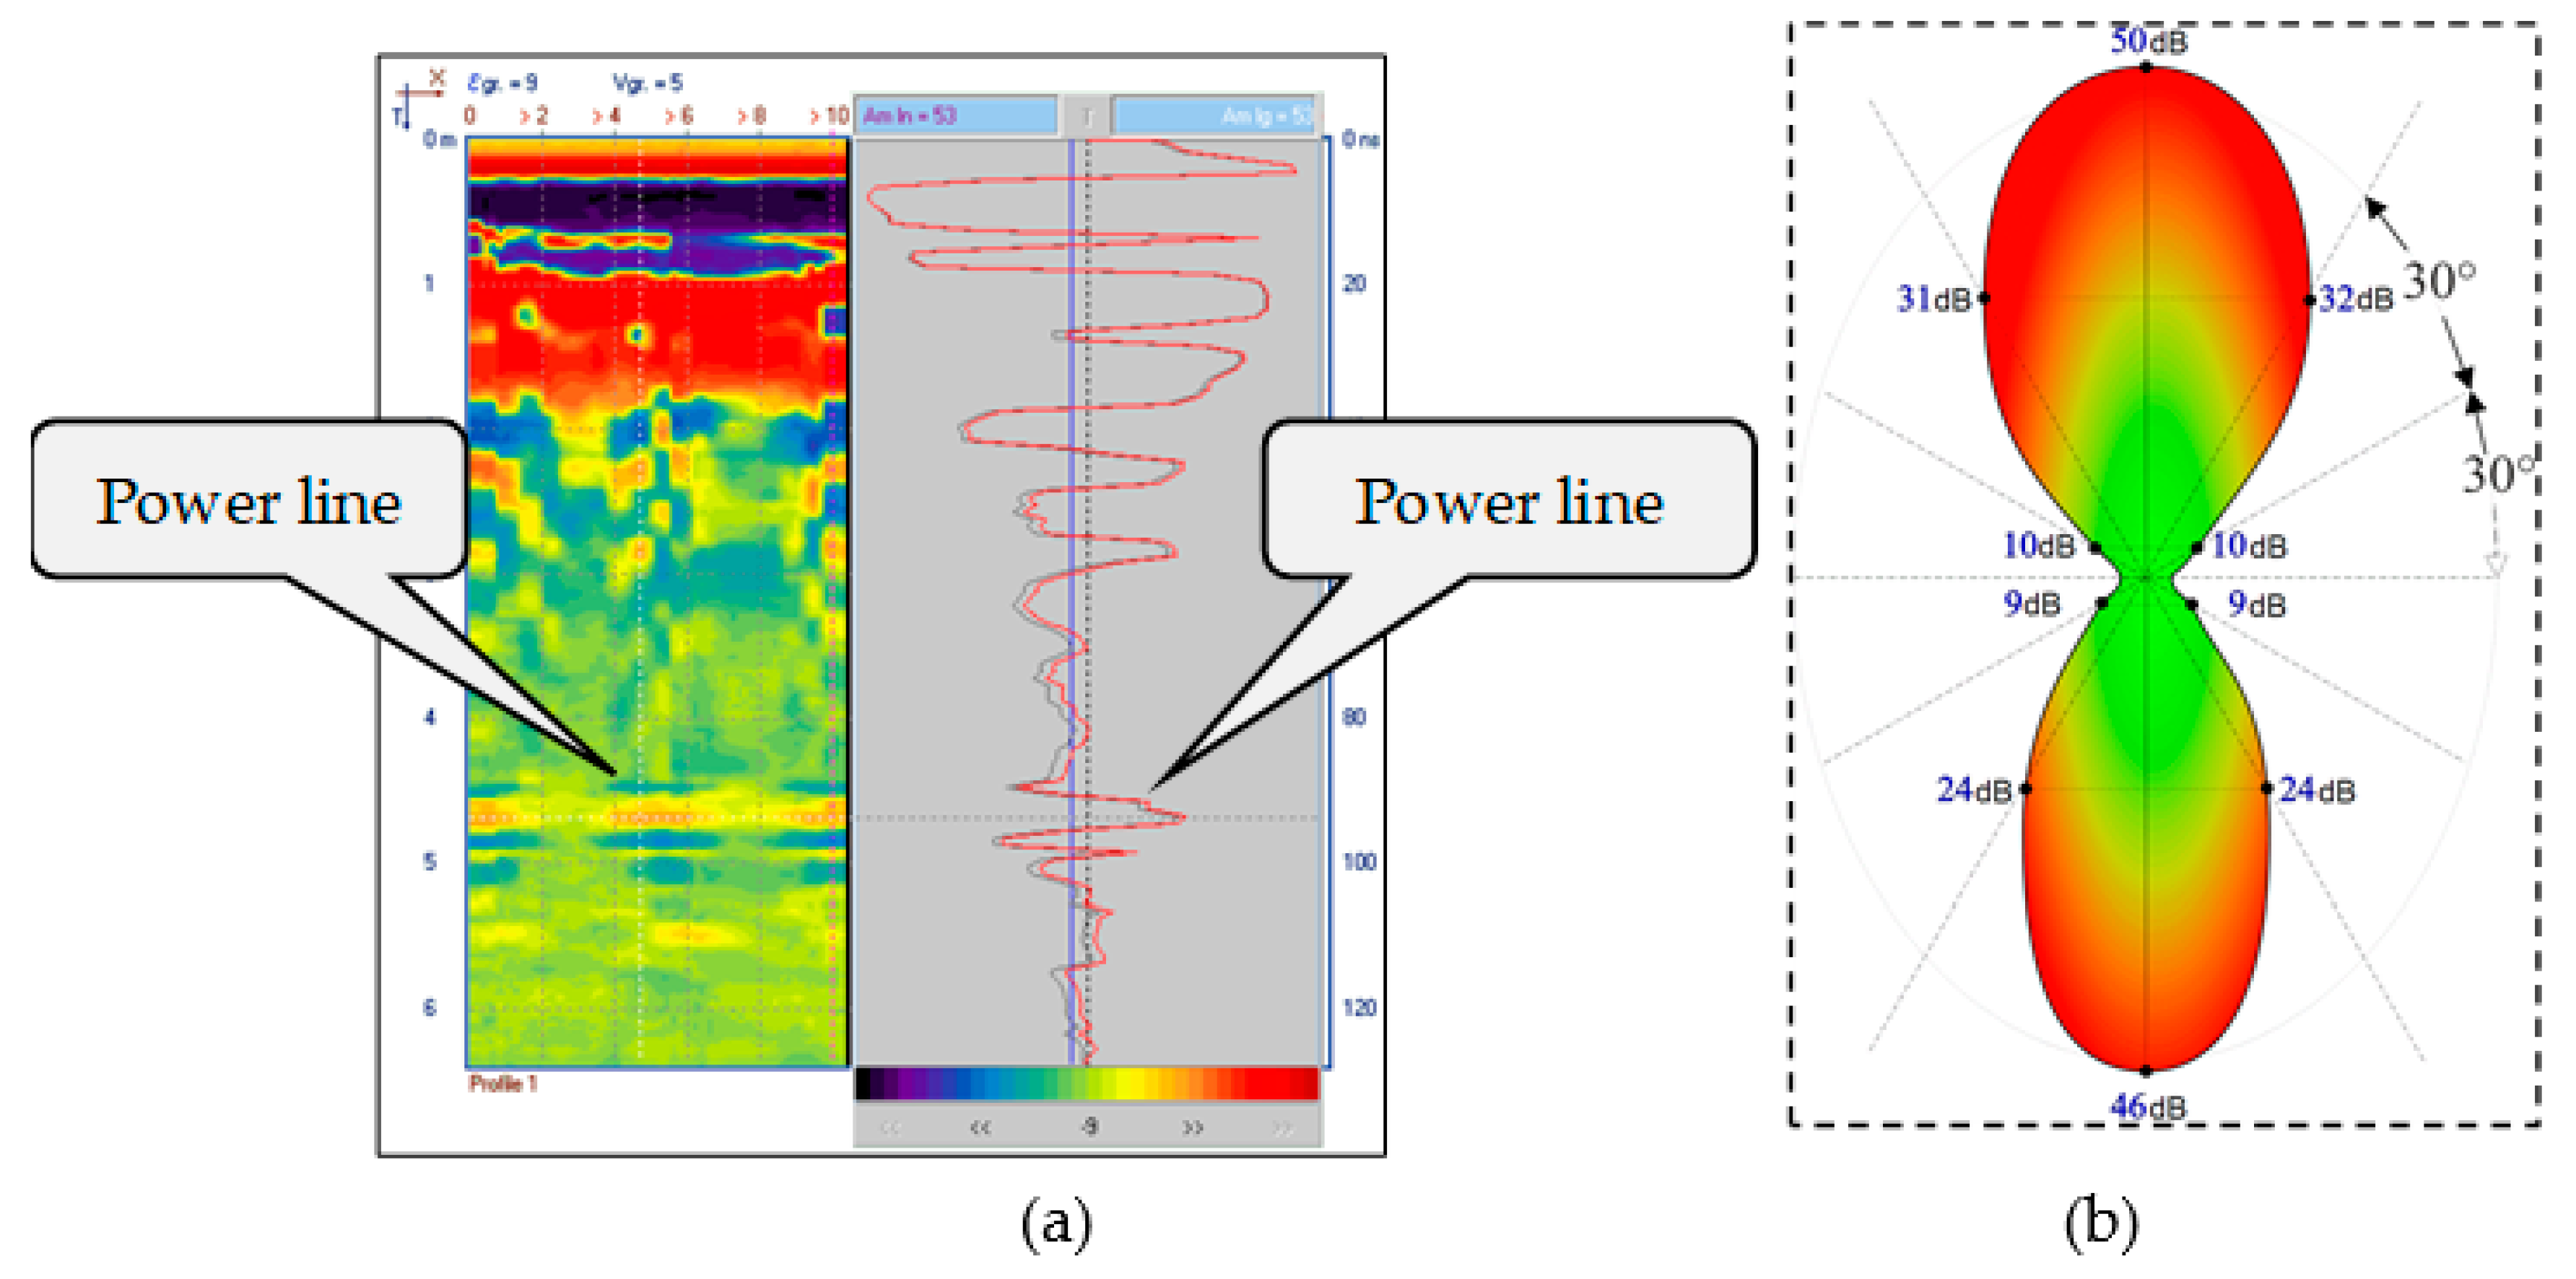
Figure 10.
(a) Subsurface radar B-scan of the ancient Jewish cemetery (Kerch area). The image of the top of the ancient crypt is marked with a white arrow; (b) Measured directivity pattern of Loza-V GPR.
Figure 10.
(a) Subsurface radar B-scan of the ancient Jewish cemetery (Kerch area). The image of the top of the ancient crypt is marked with a white arrow; (b) Measured directivity pattern of Loza-V GPR.
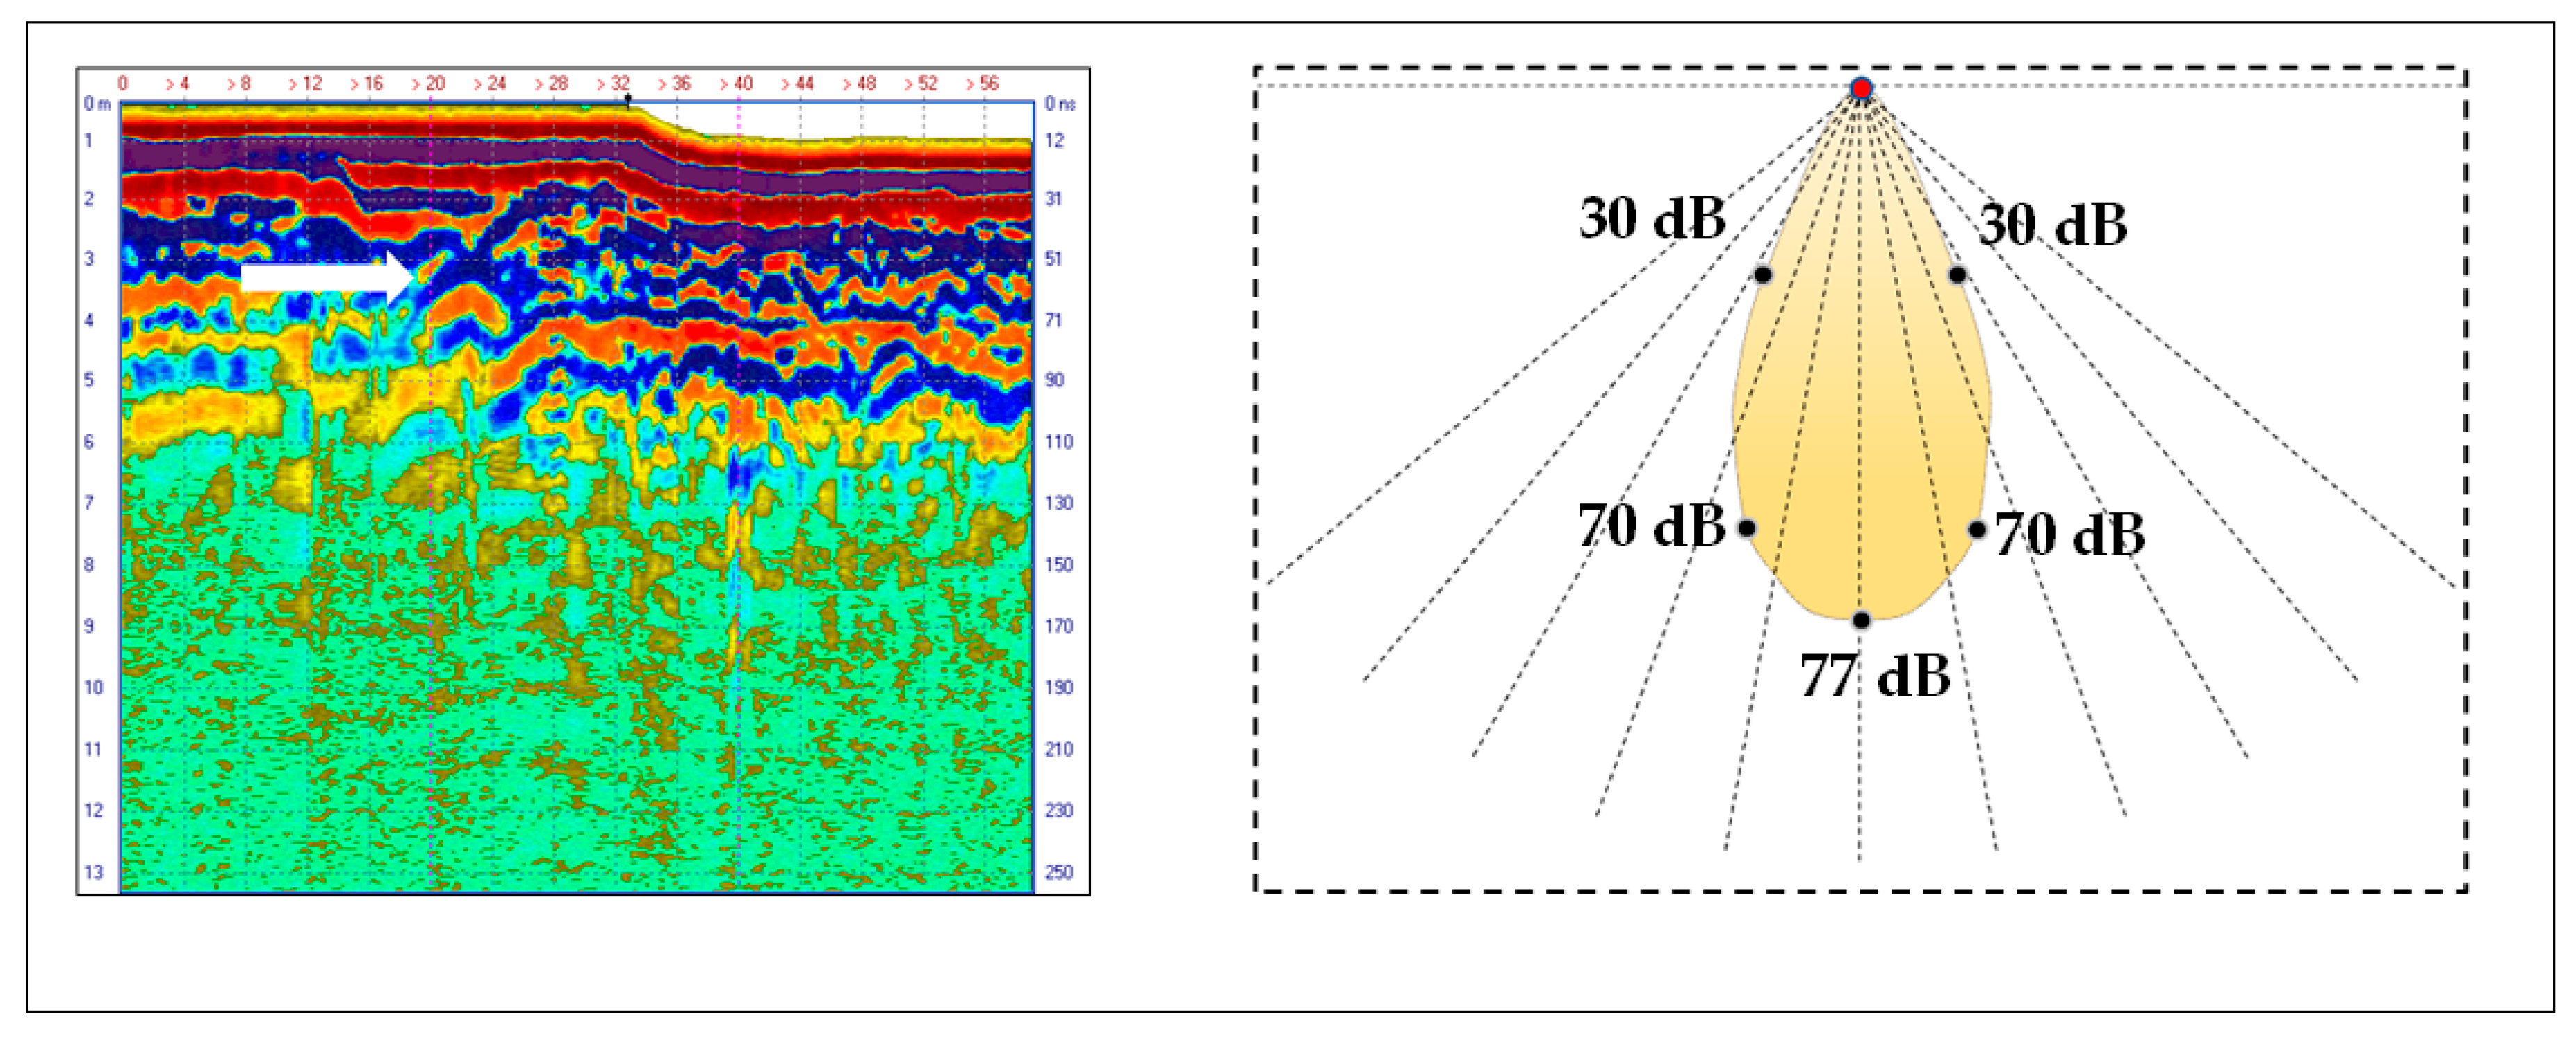
Figure 11.
Ancient well.
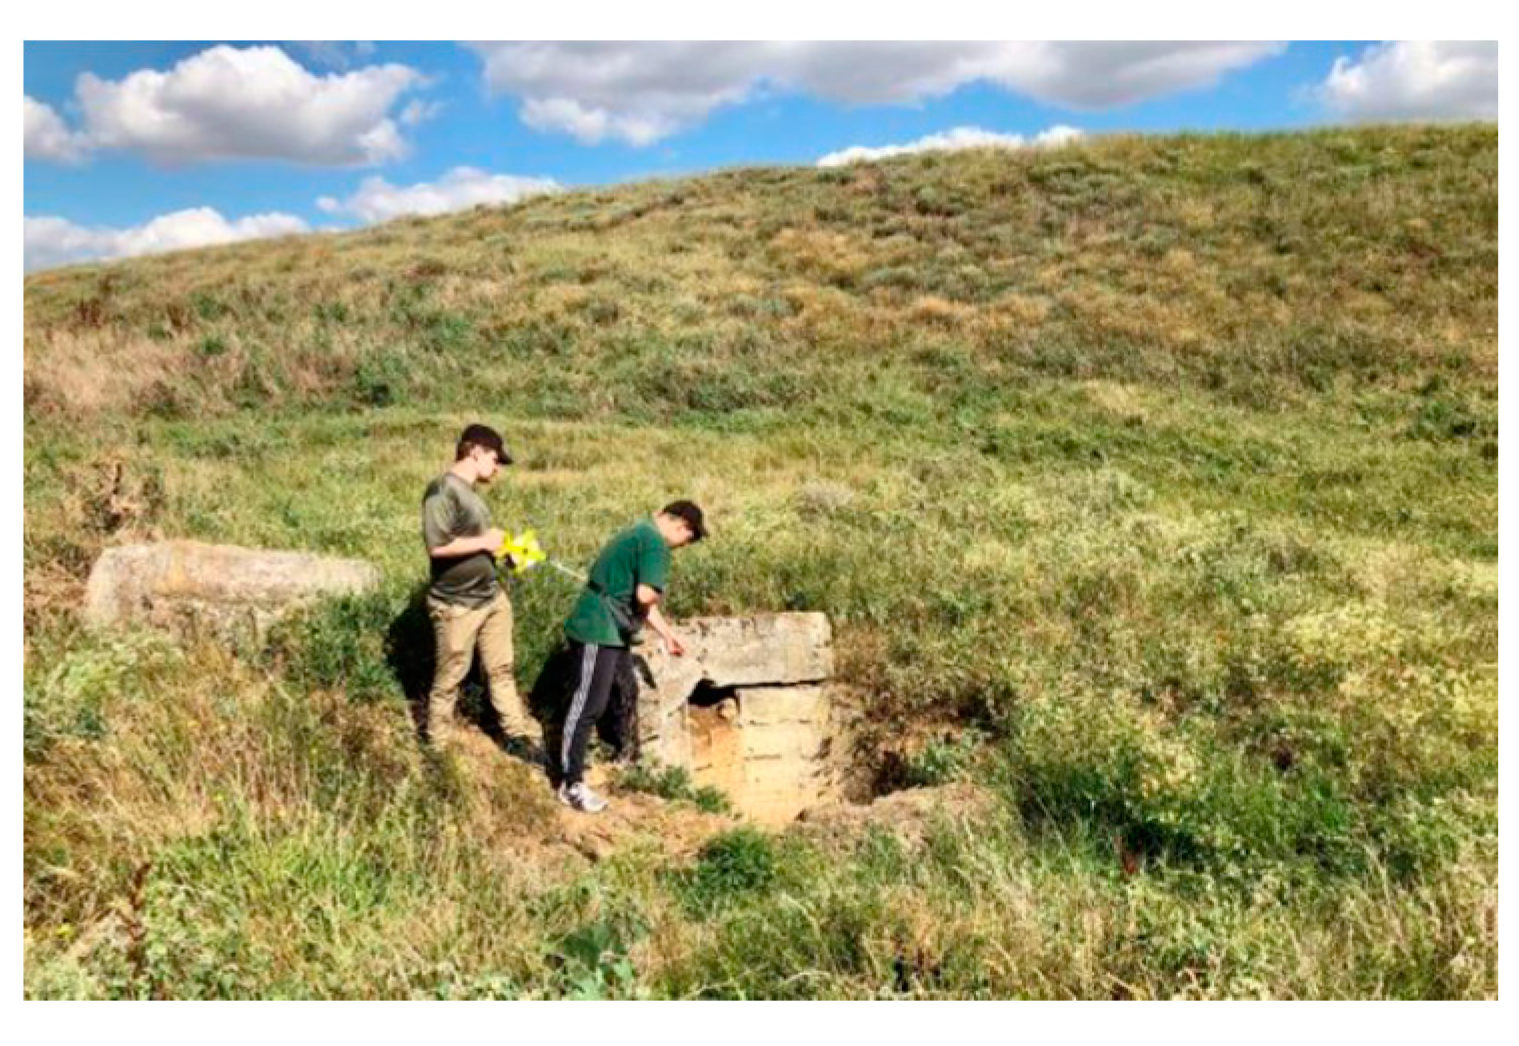
Figure 12.
(a) Ceramic pipes of antique water supply; (b) Three B-scans revealing cross-sections of two ceramic pipes; (c) A-scans in selected cross-sections, with logarithmic color scale. Scan A1 reveals the subsurface pipe at about 2 m depth; (d) Practical method of GPR directivity pattern assessment.
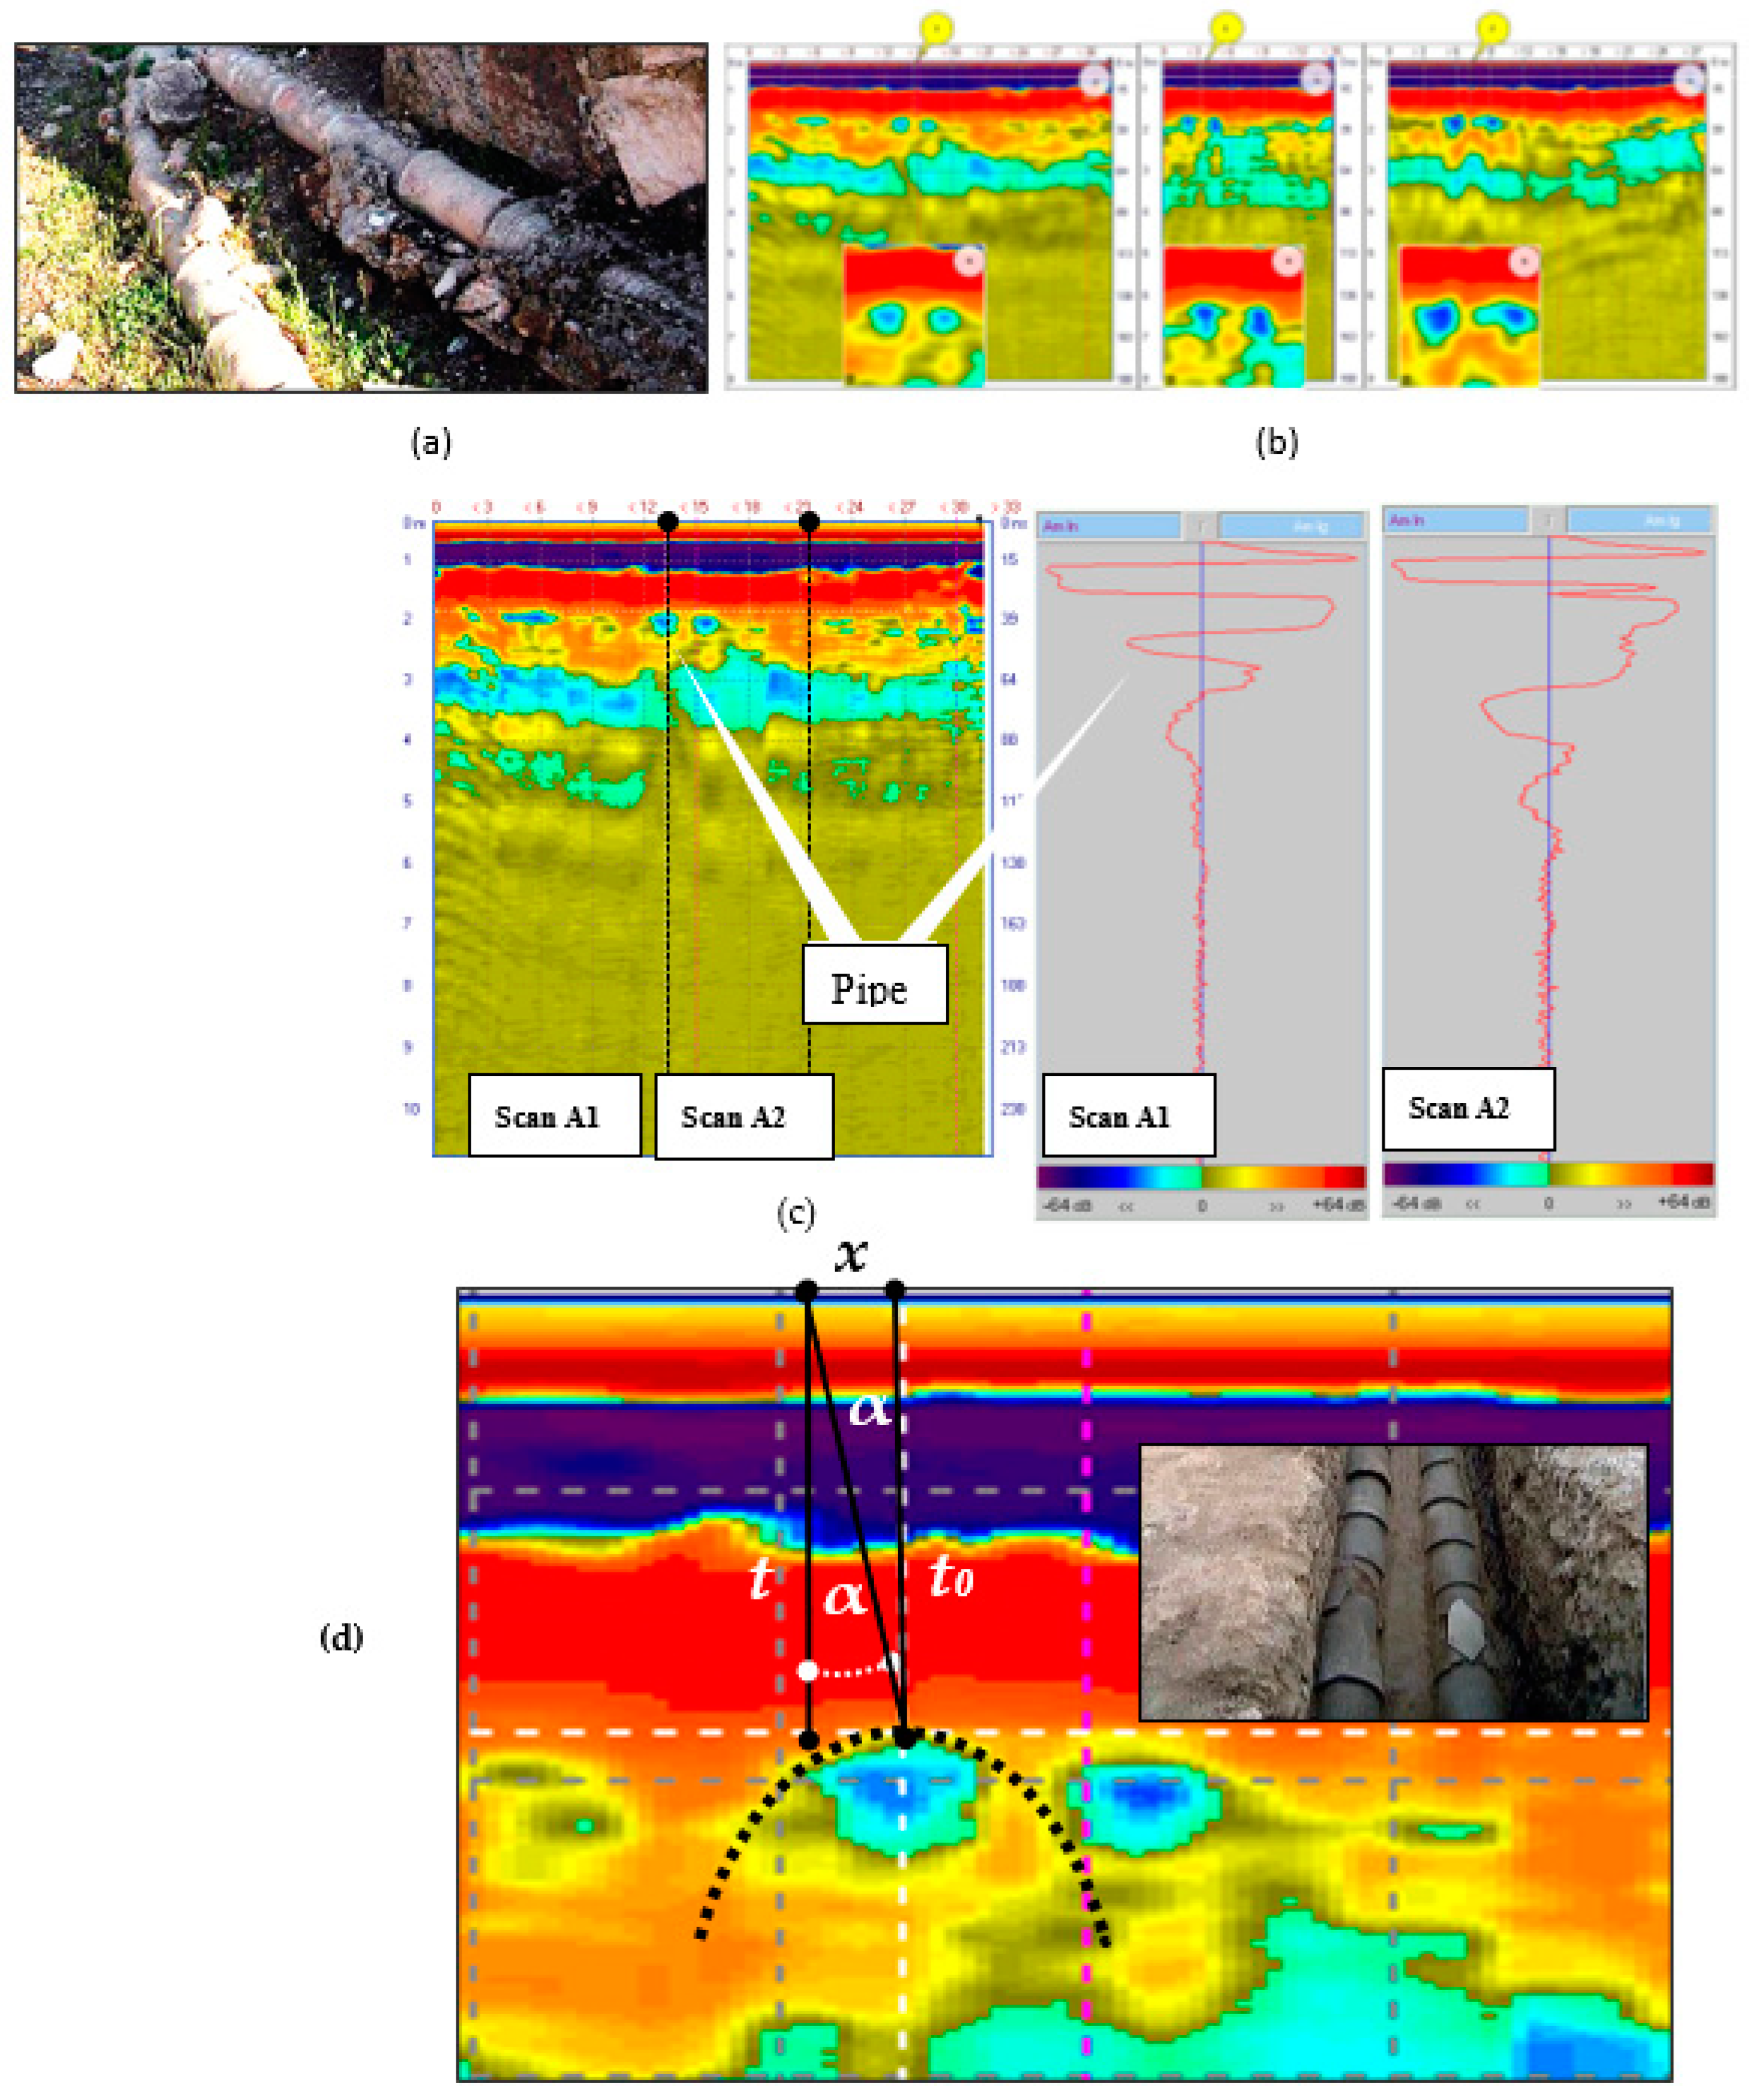
Figure 13.
Loza-V GPR directivity estimated on the subsurface object of Fig.12.
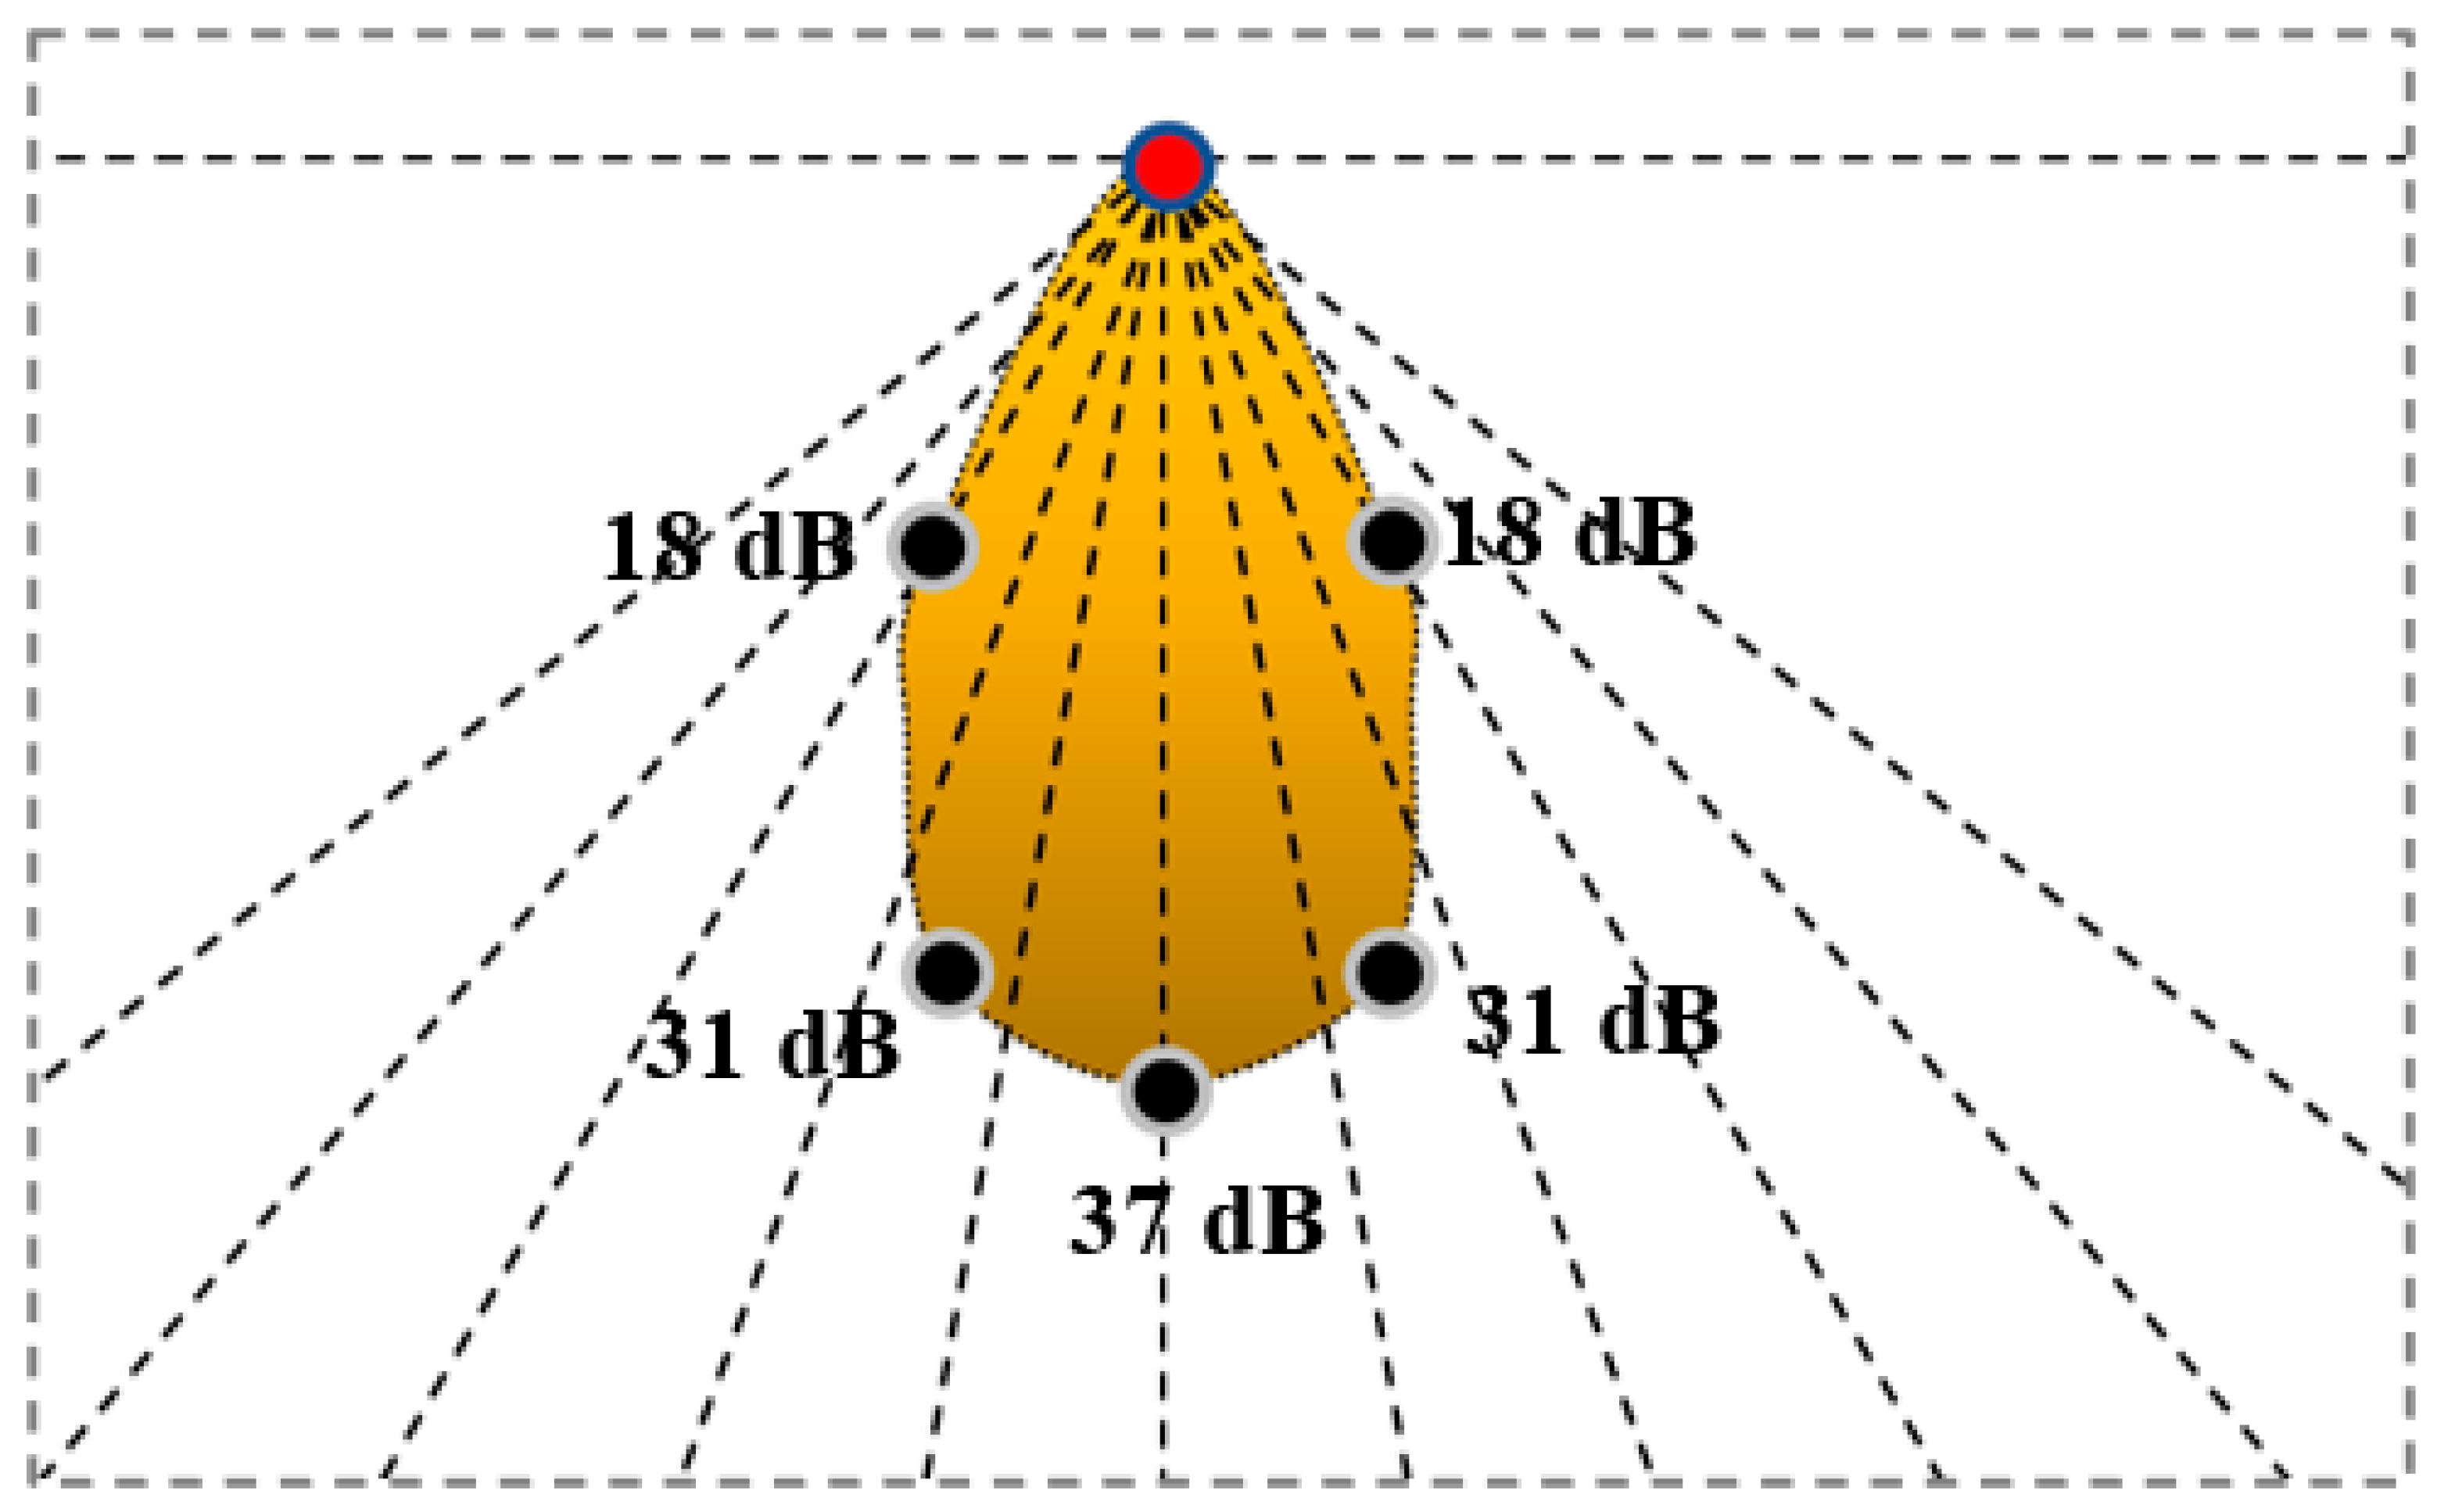
Figure 14.
Loza-V GPR directivity on a dry sand ground.
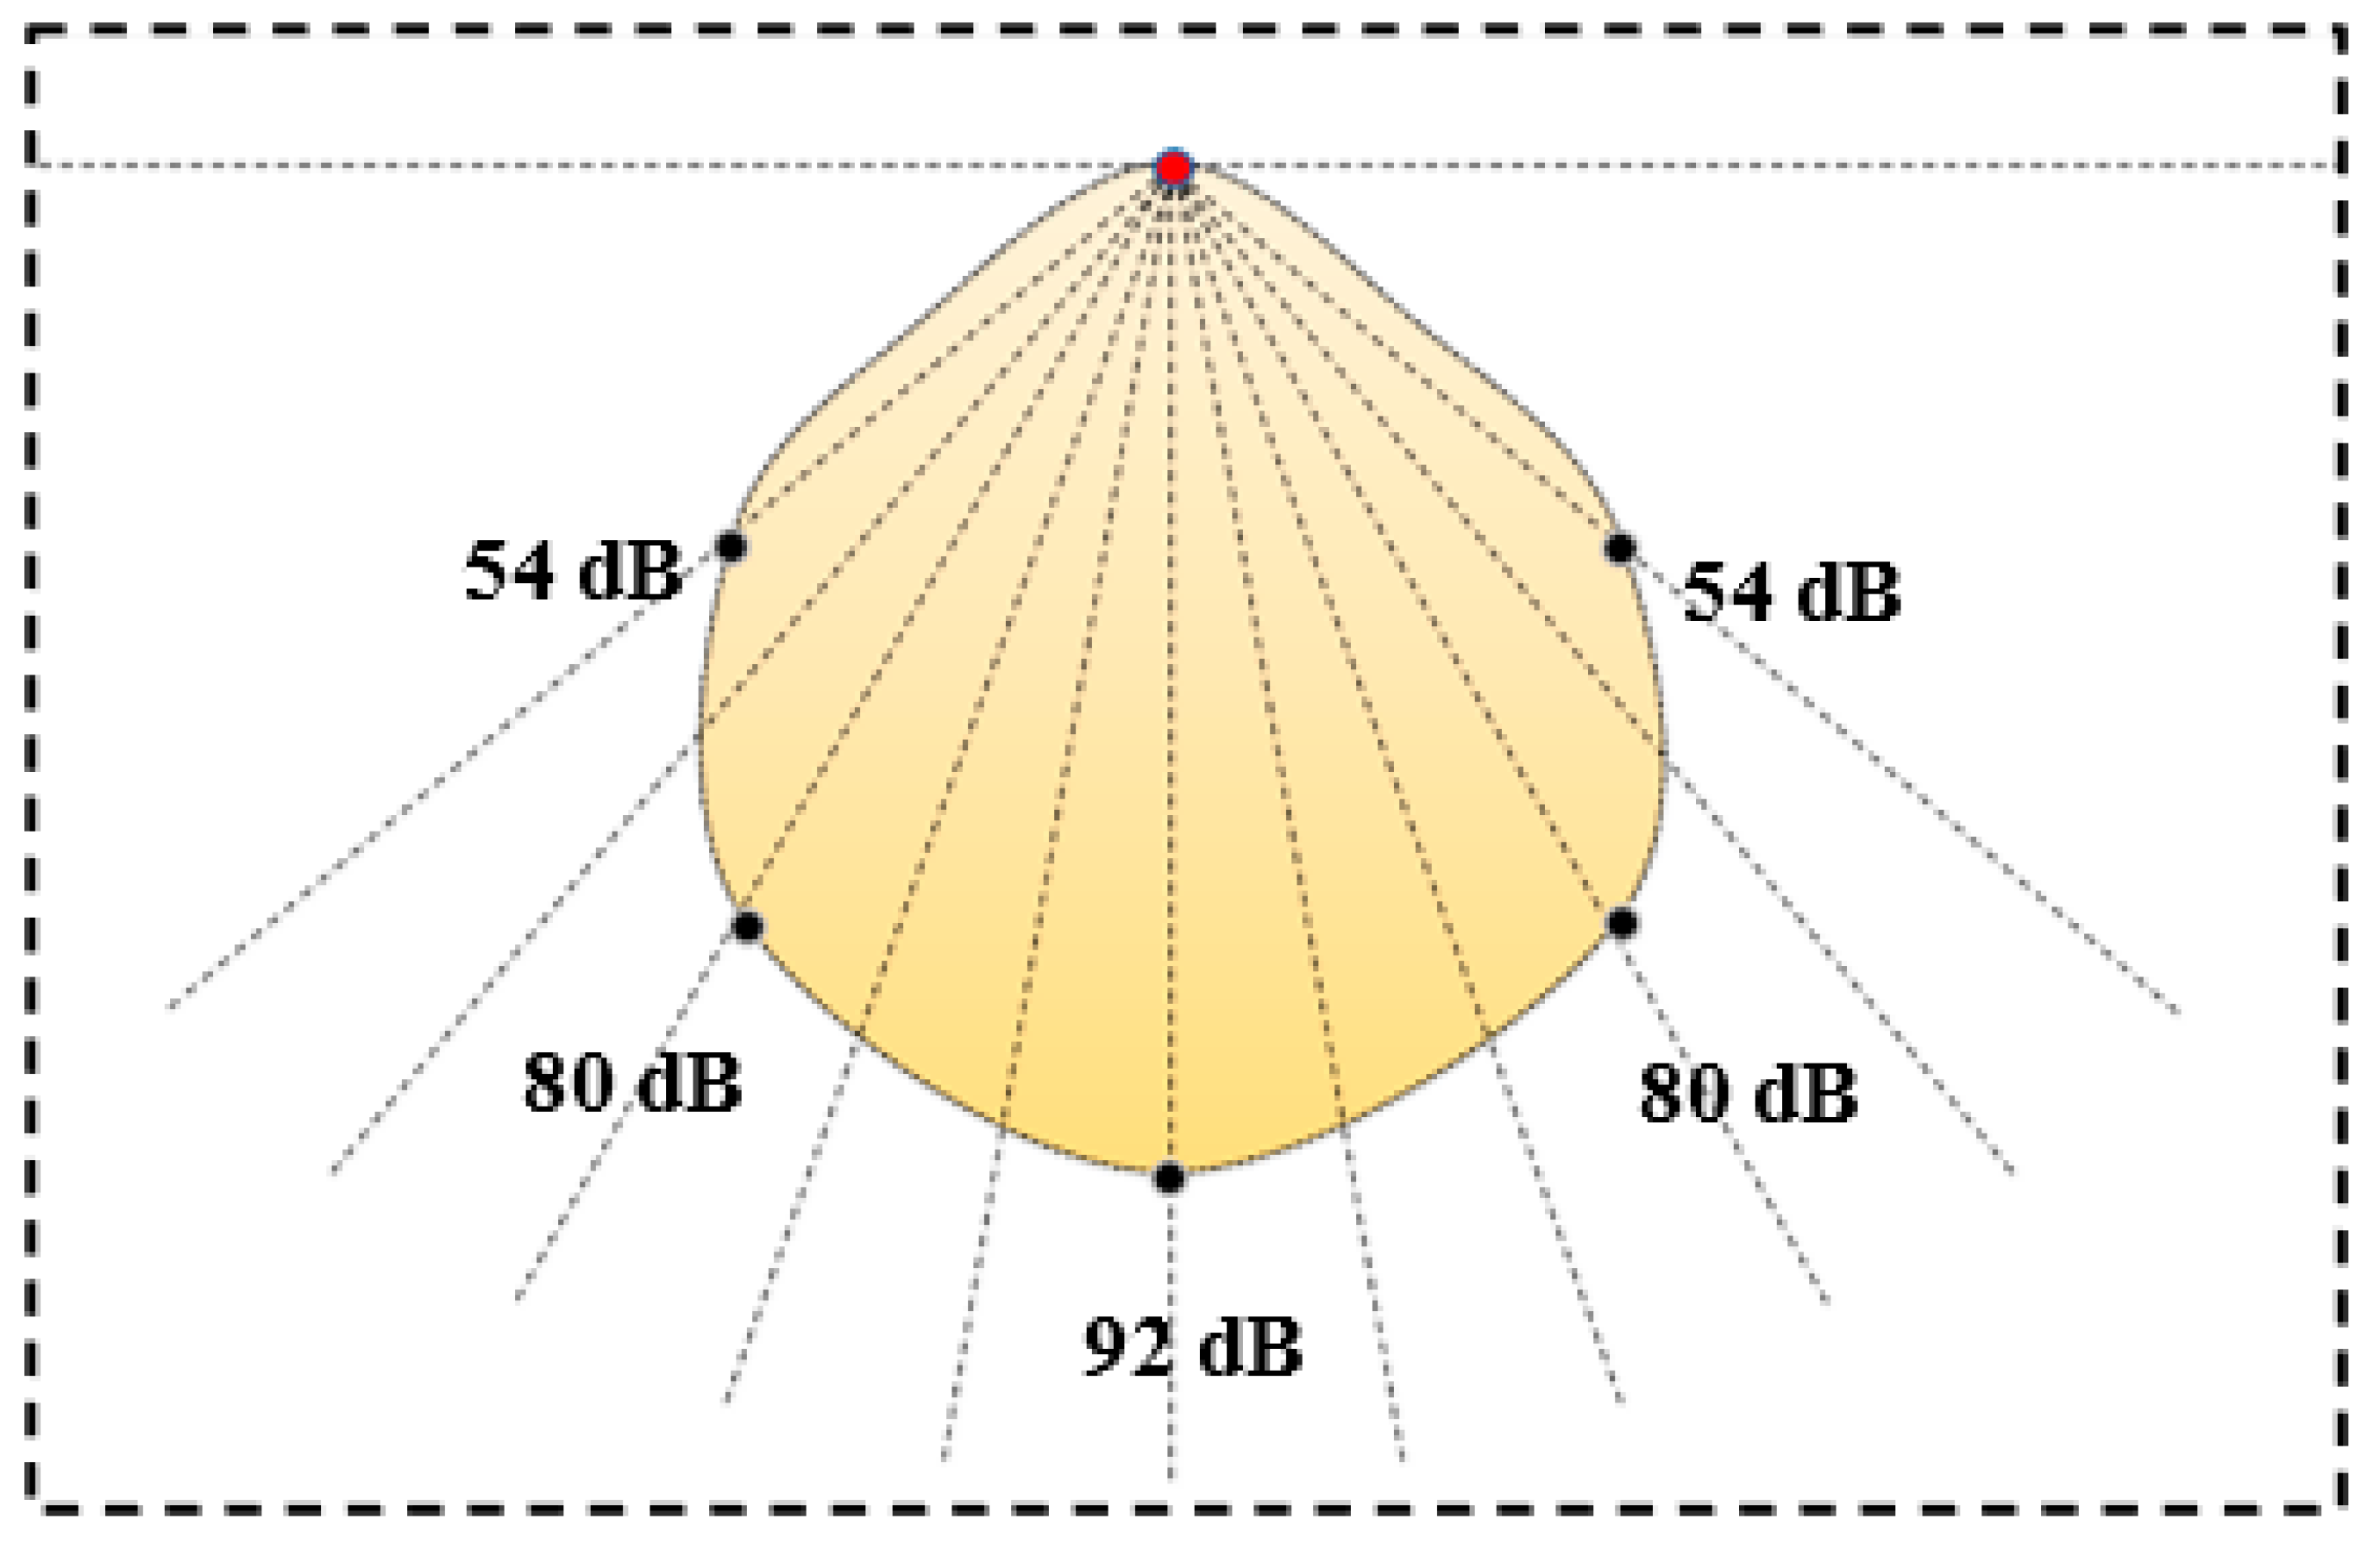
Figure 15.
Patomsky crater – general view.
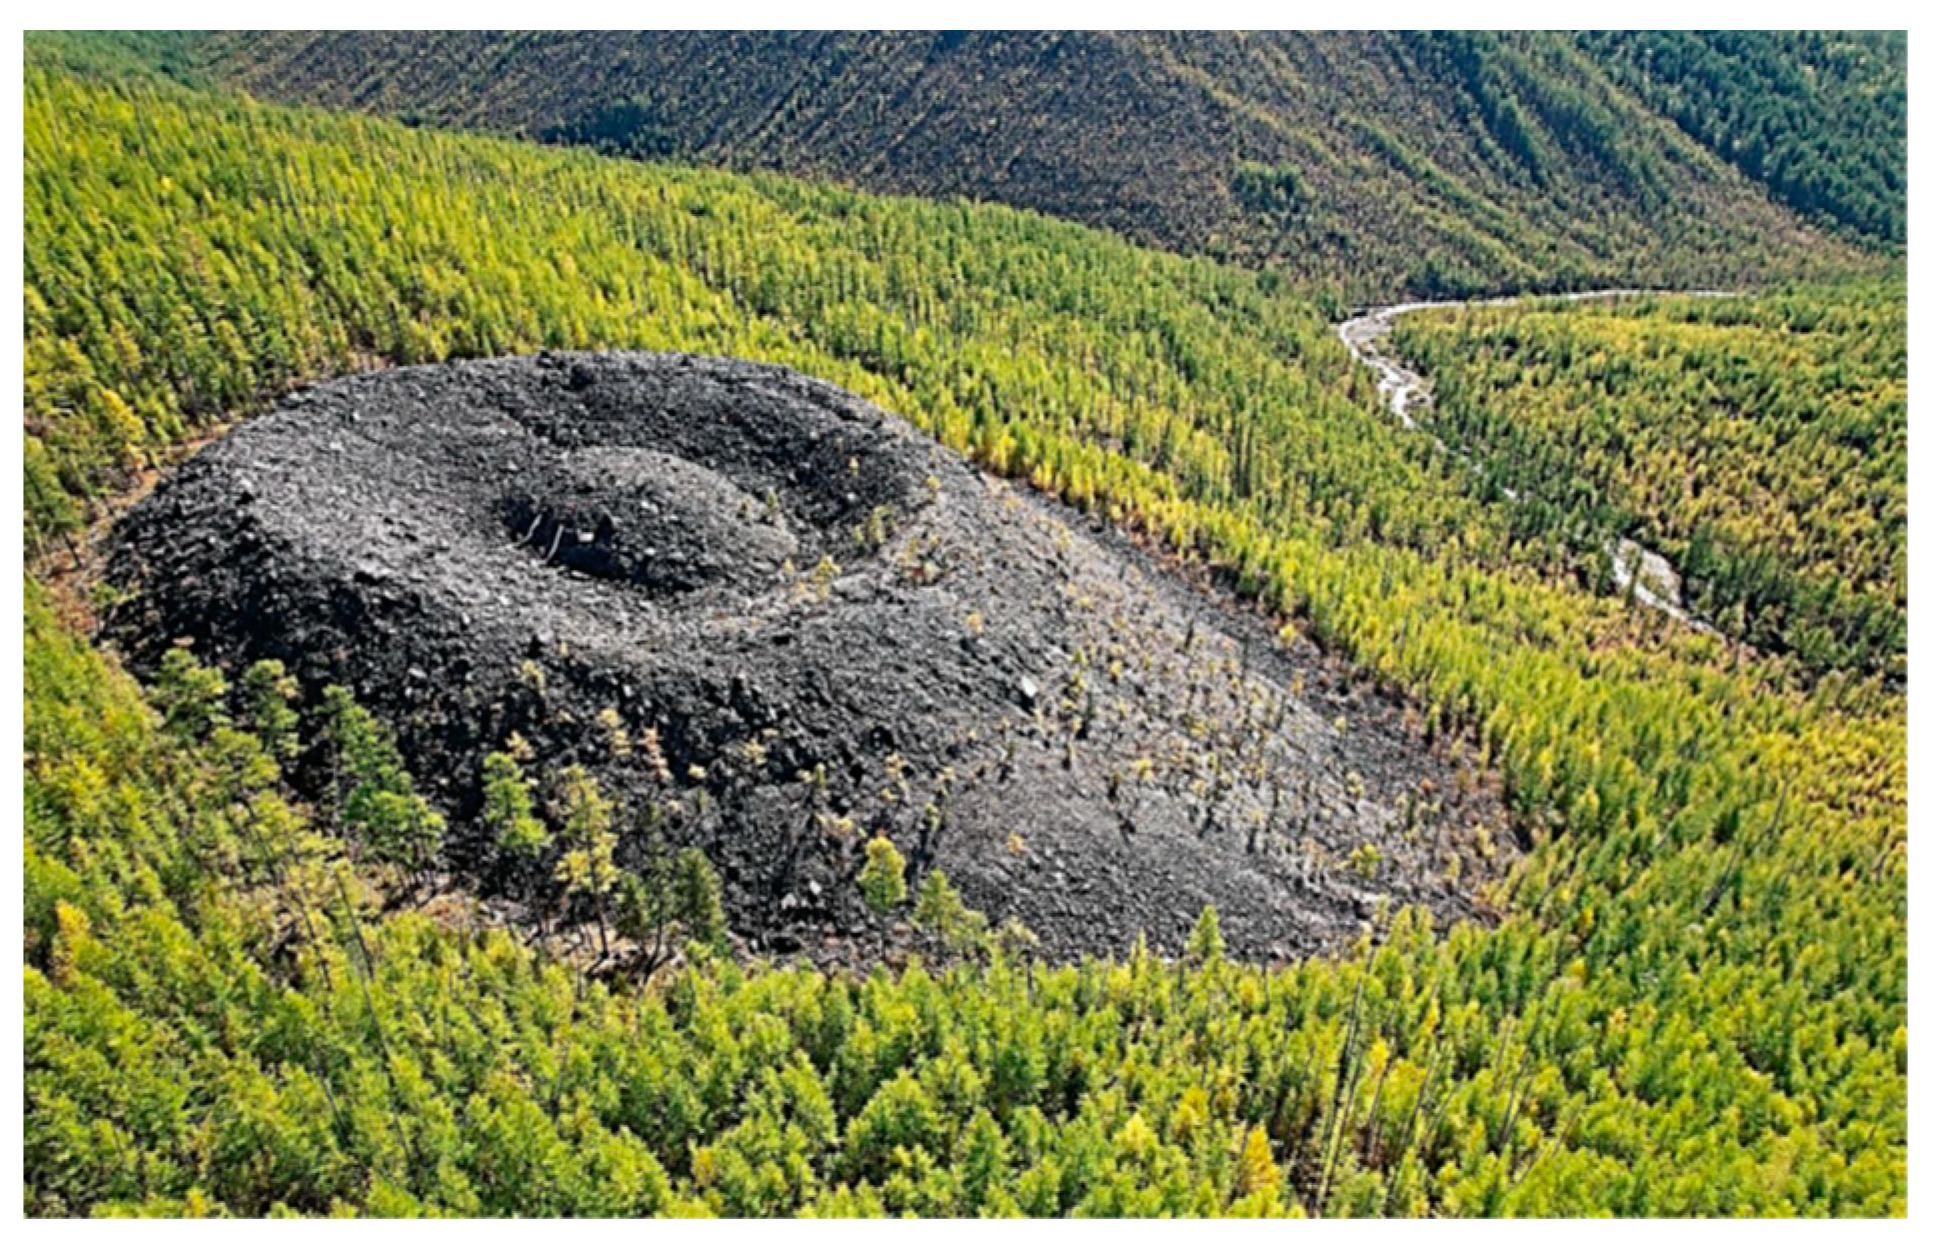
Figure 16.
GPR survey paths over the Patomsky crater (numbered red lines). Isohypses, with heights are marked in meters (yellow lines).
Figure 16.
GPR survey paths over the Patomsky crater (numbered red lines). Isohypses, with heights are marked in meters (yellow lines).
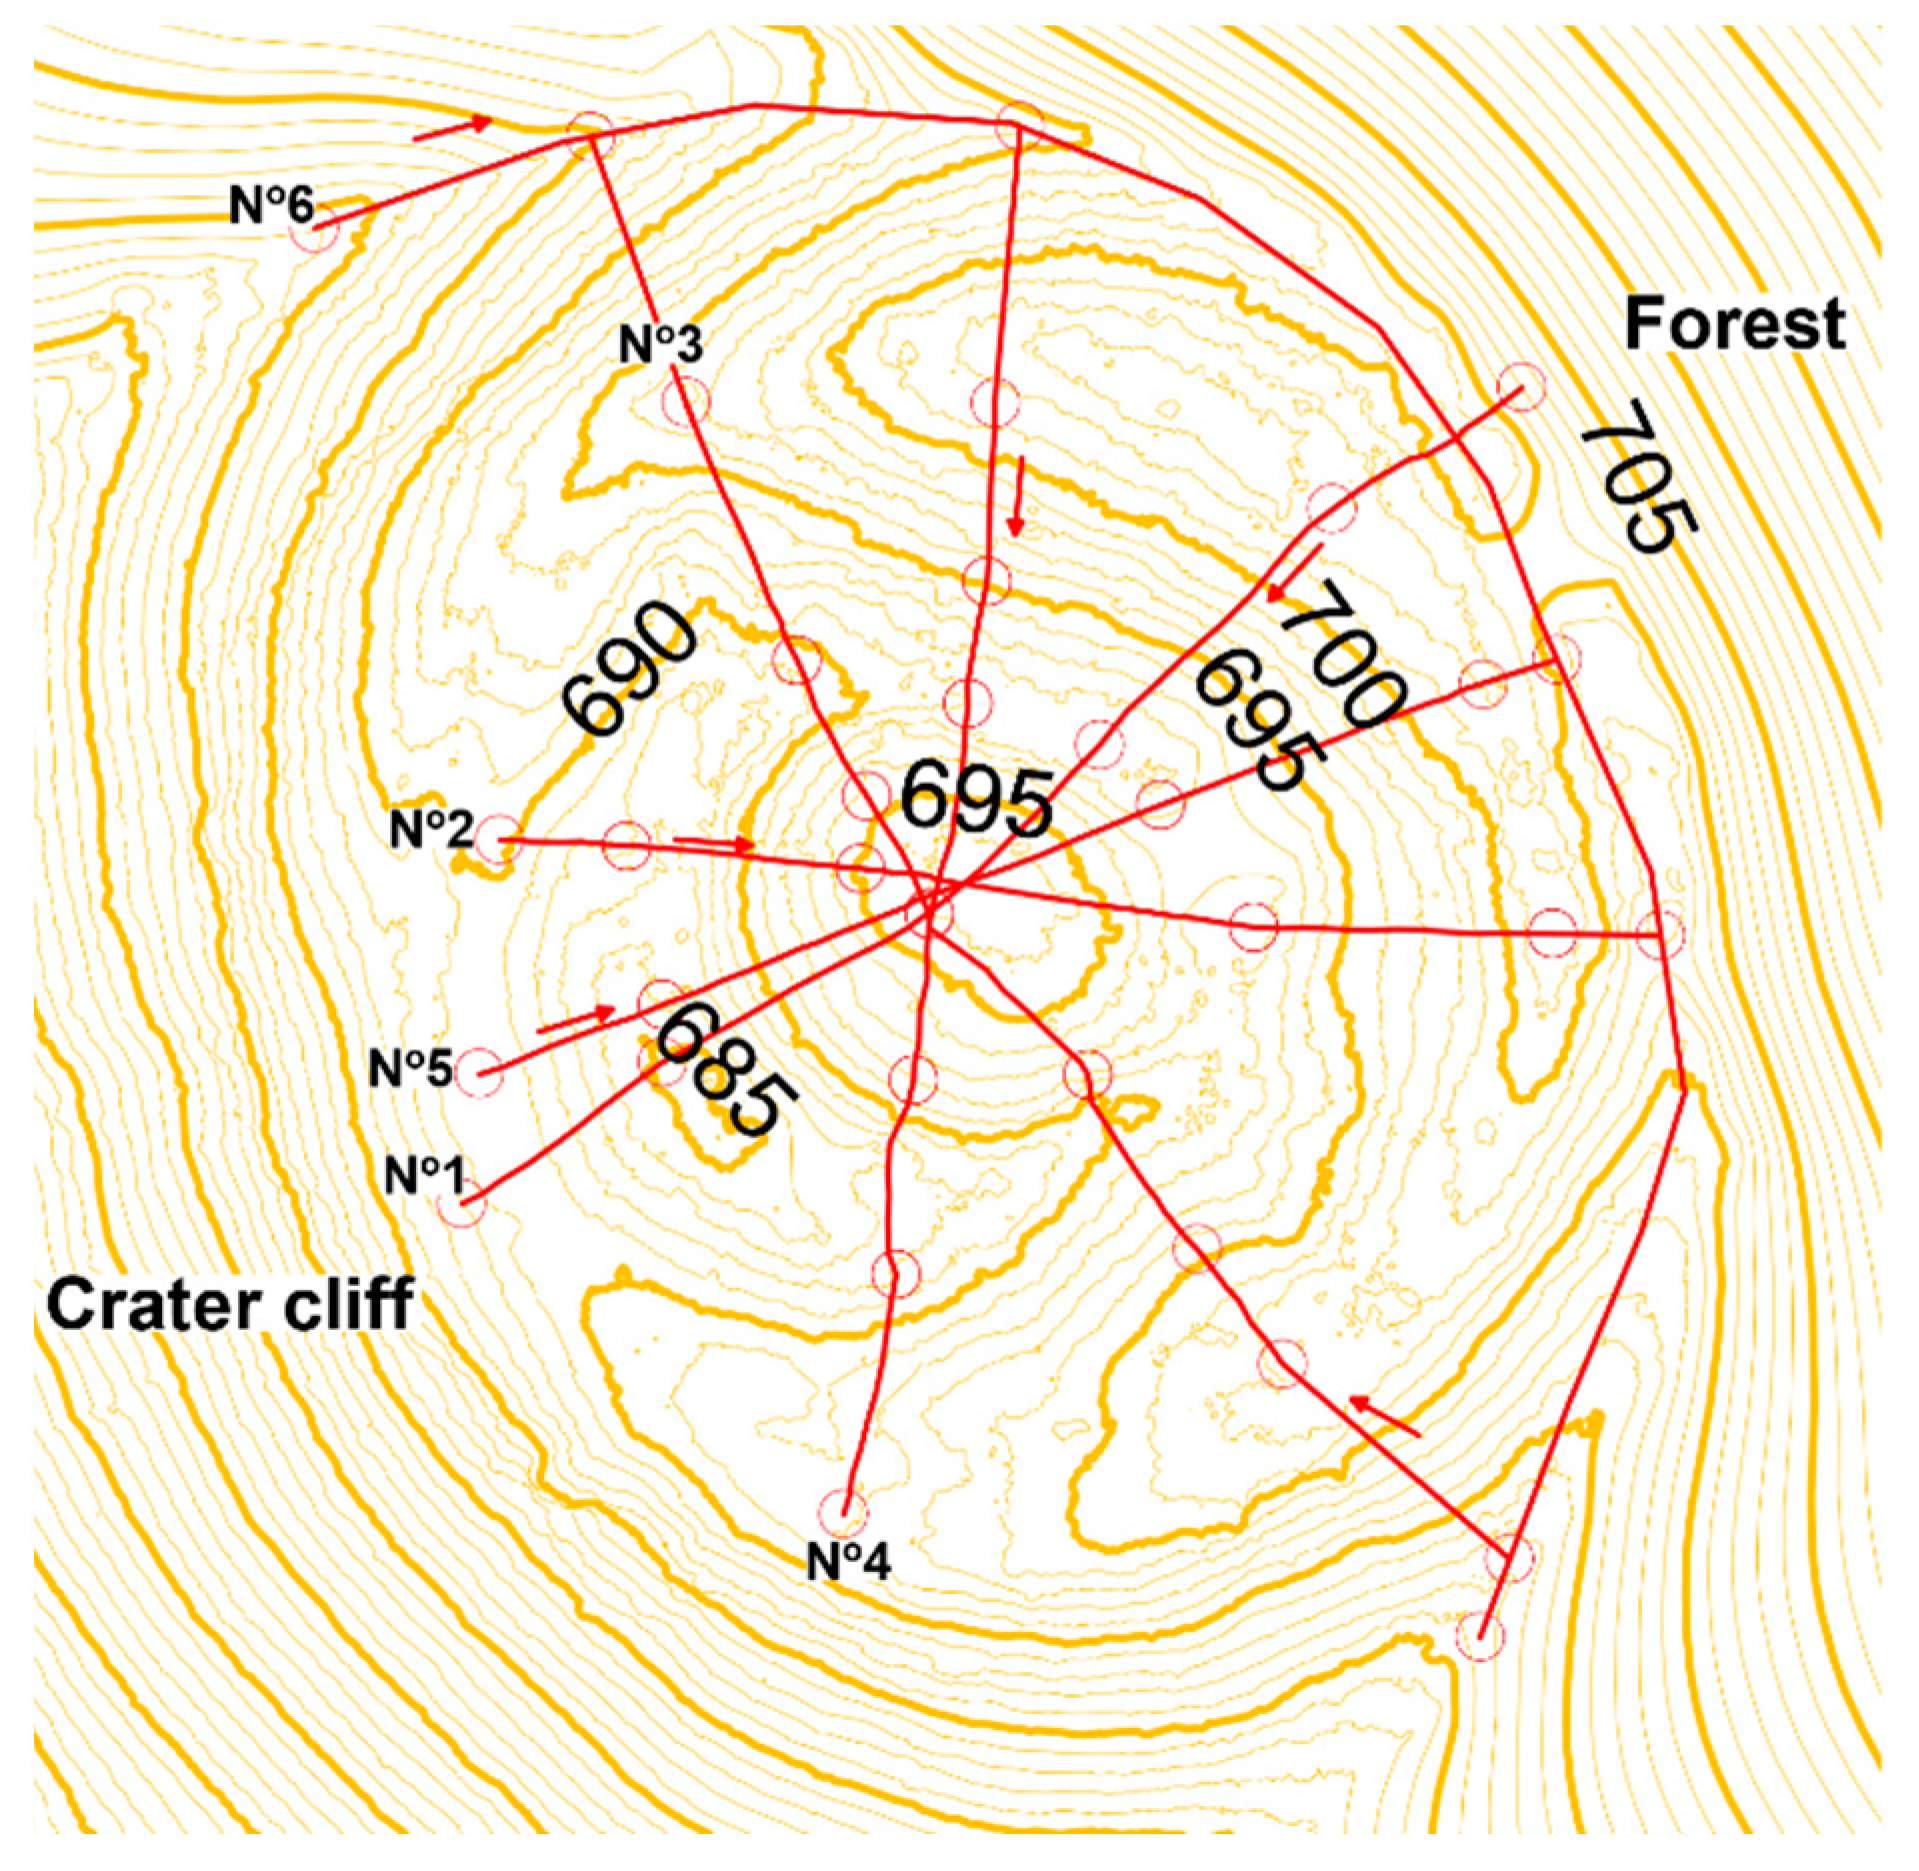
Figure 17.
(a) GPR probing of the crater outer ring; (b) Radar B-scan No 6.
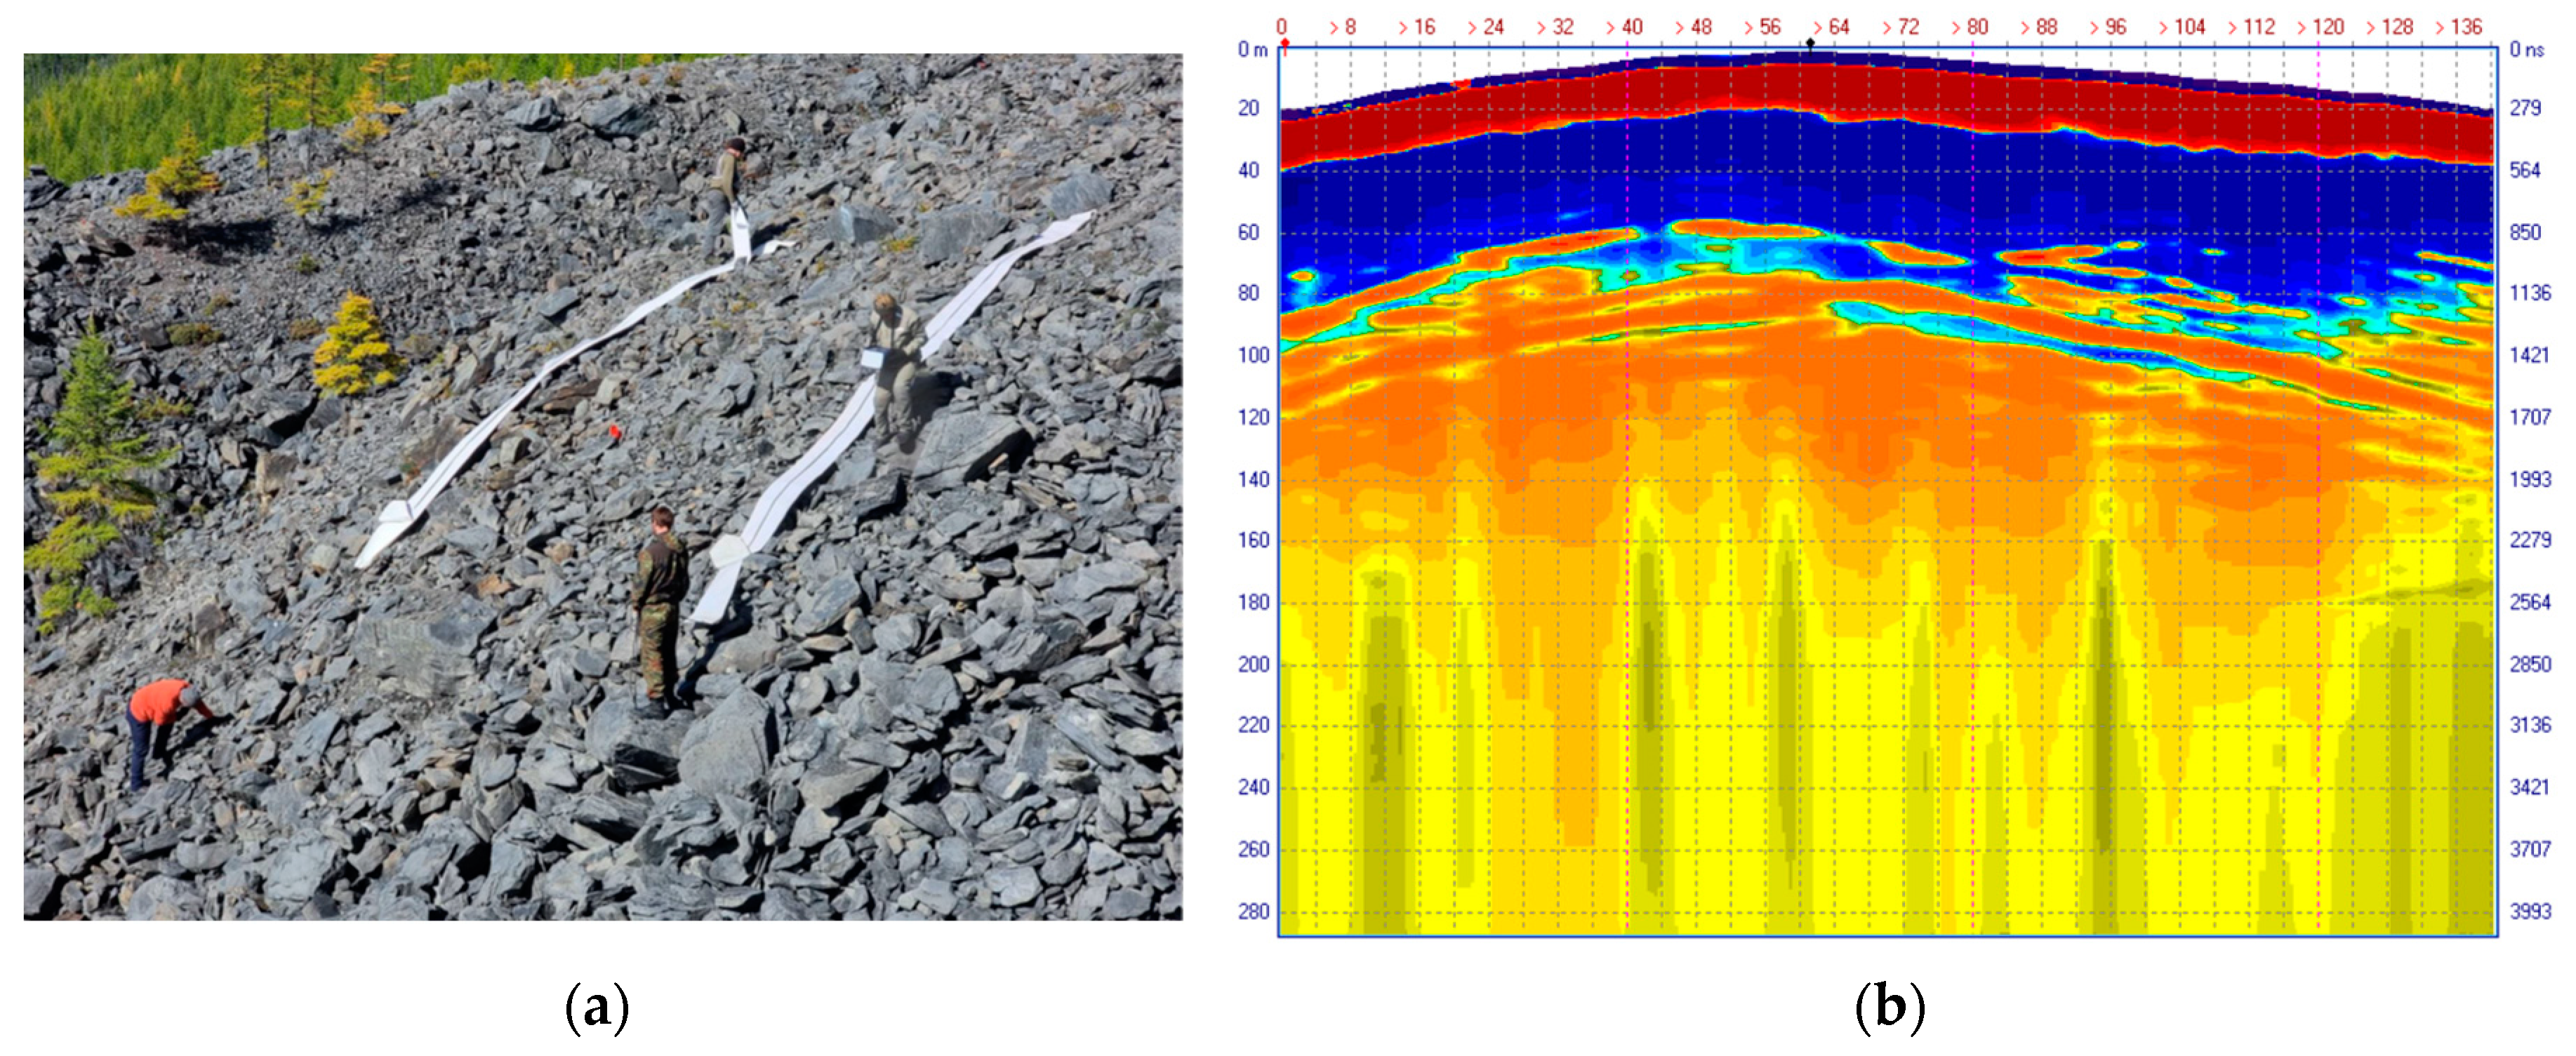
Figure 18.
GPR probing across the latitudinal diameter of the crater. (a) Aerial photo; (b) GPR B-scan No 3.
Figure 18.
GPR probing across the latitudinal diameter of the crater. (a) Aerial photo; (b) GPR B-scan No 3.
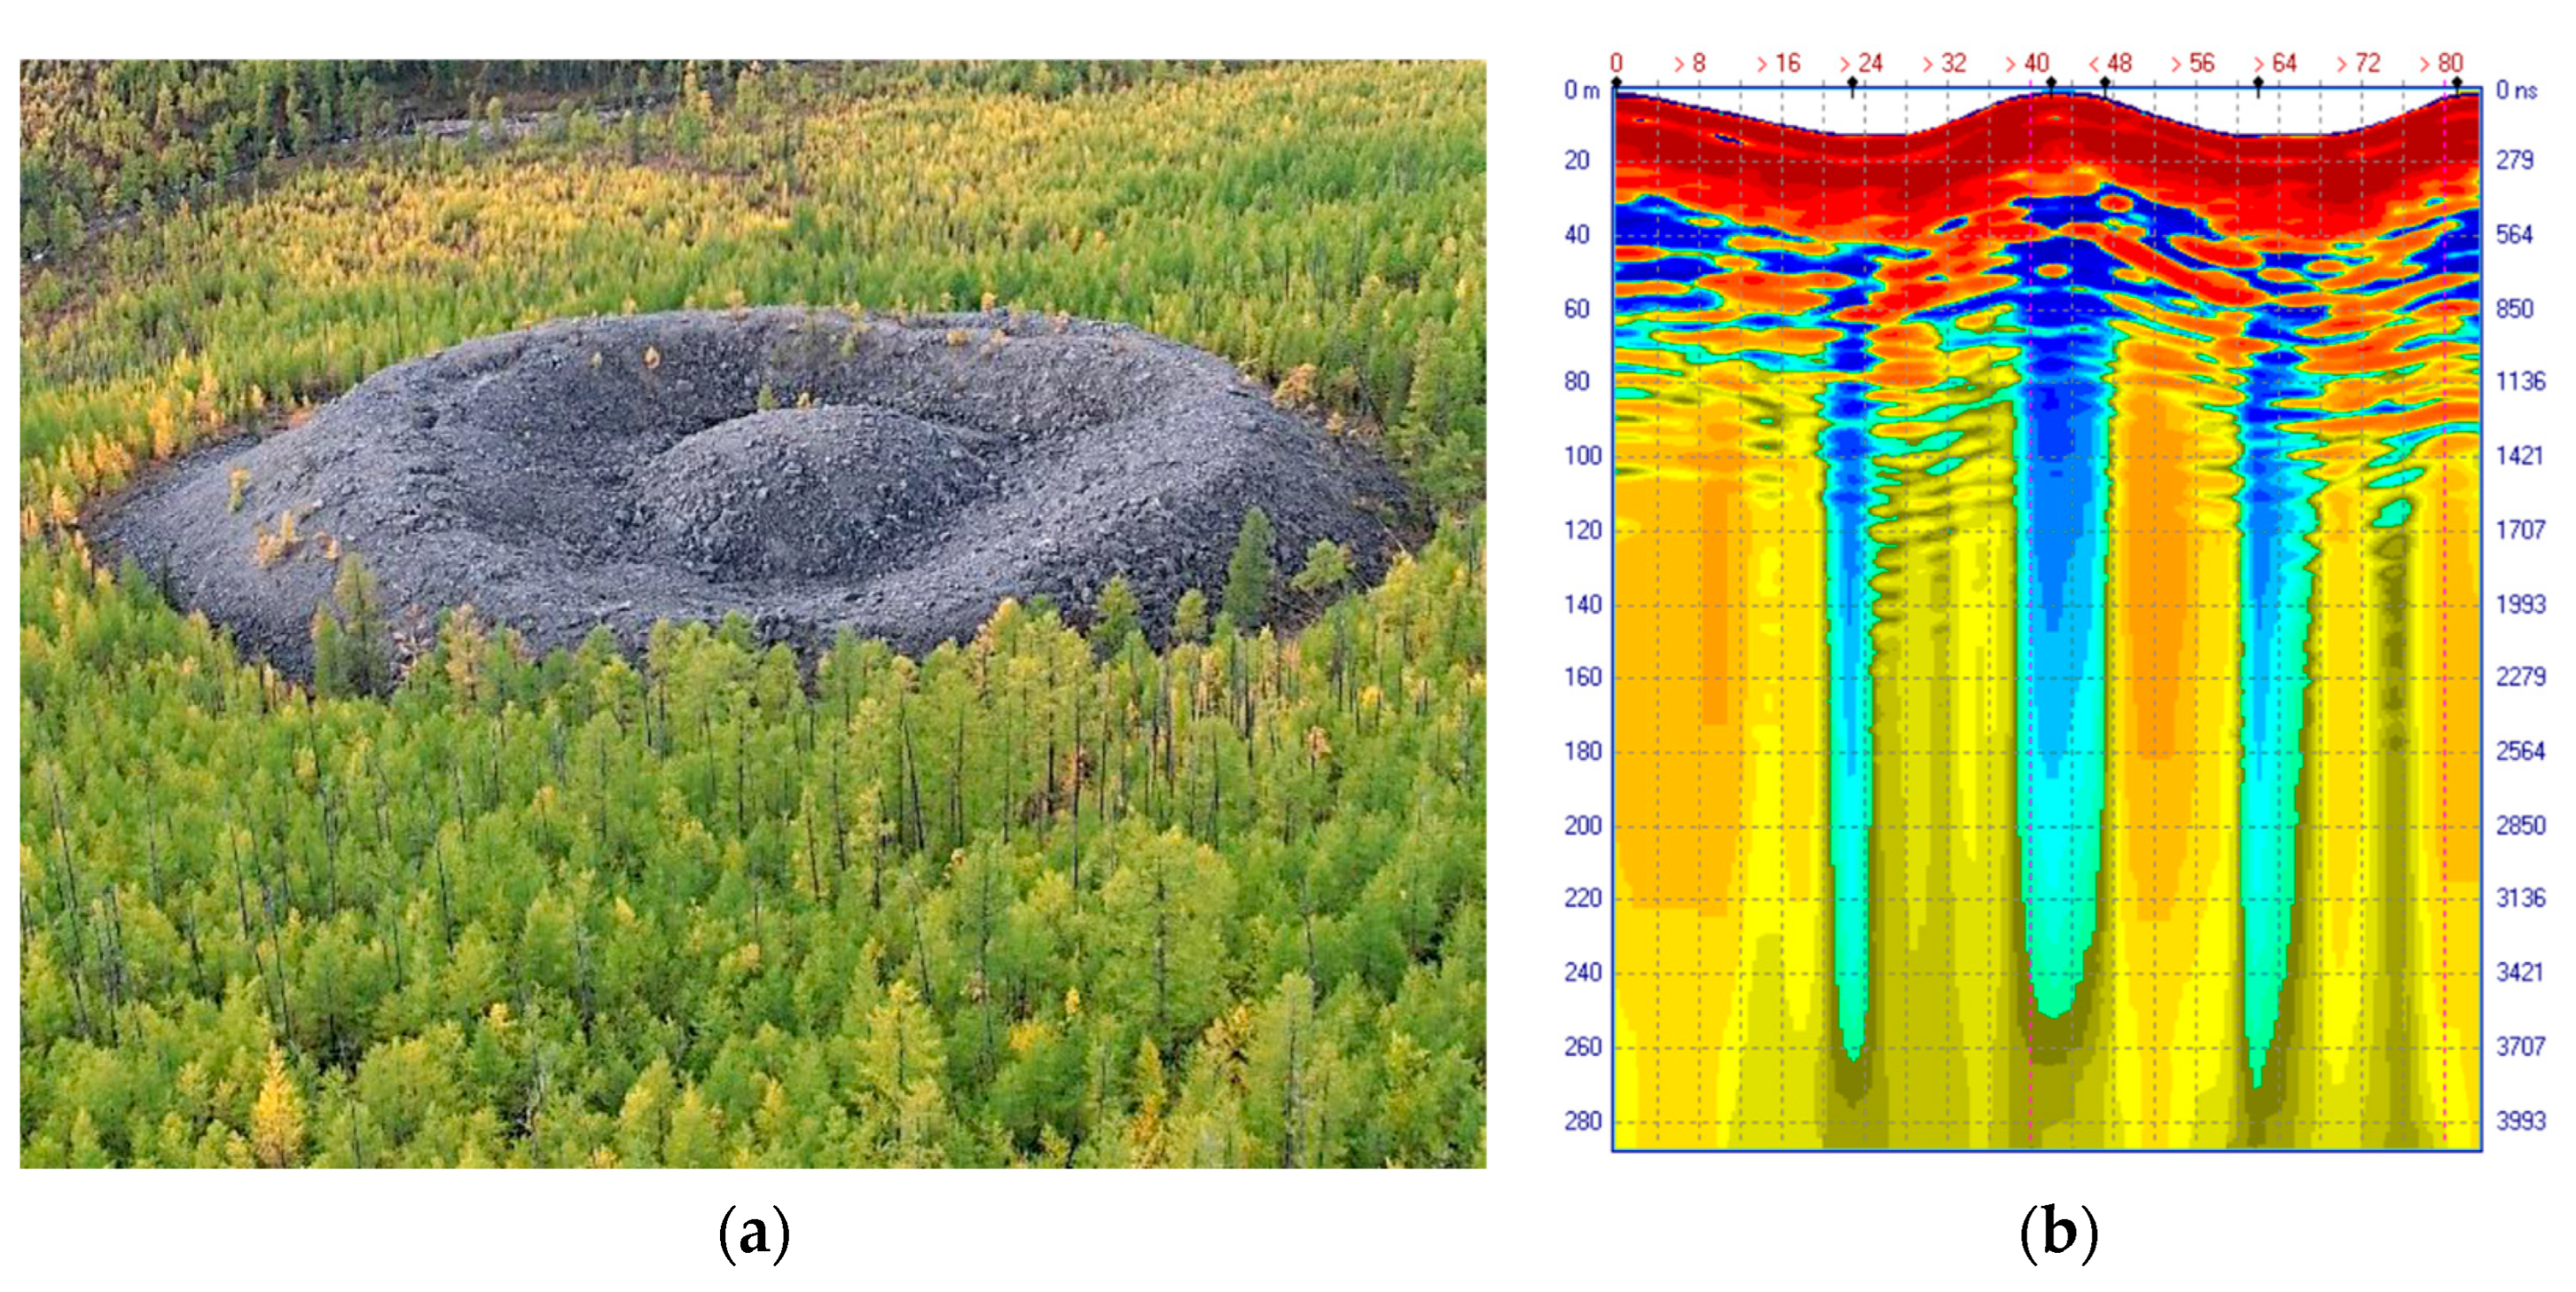
Figure 19.
Loza-V GPR image of the Patomsky crater. (a) Horizontal sections; (b) 3D electrodynamic model.
Figure 19.
Loza-V GPR image of the Patomsky crater. (a) Horizontal sections; (b) 3D electrodynamic model.
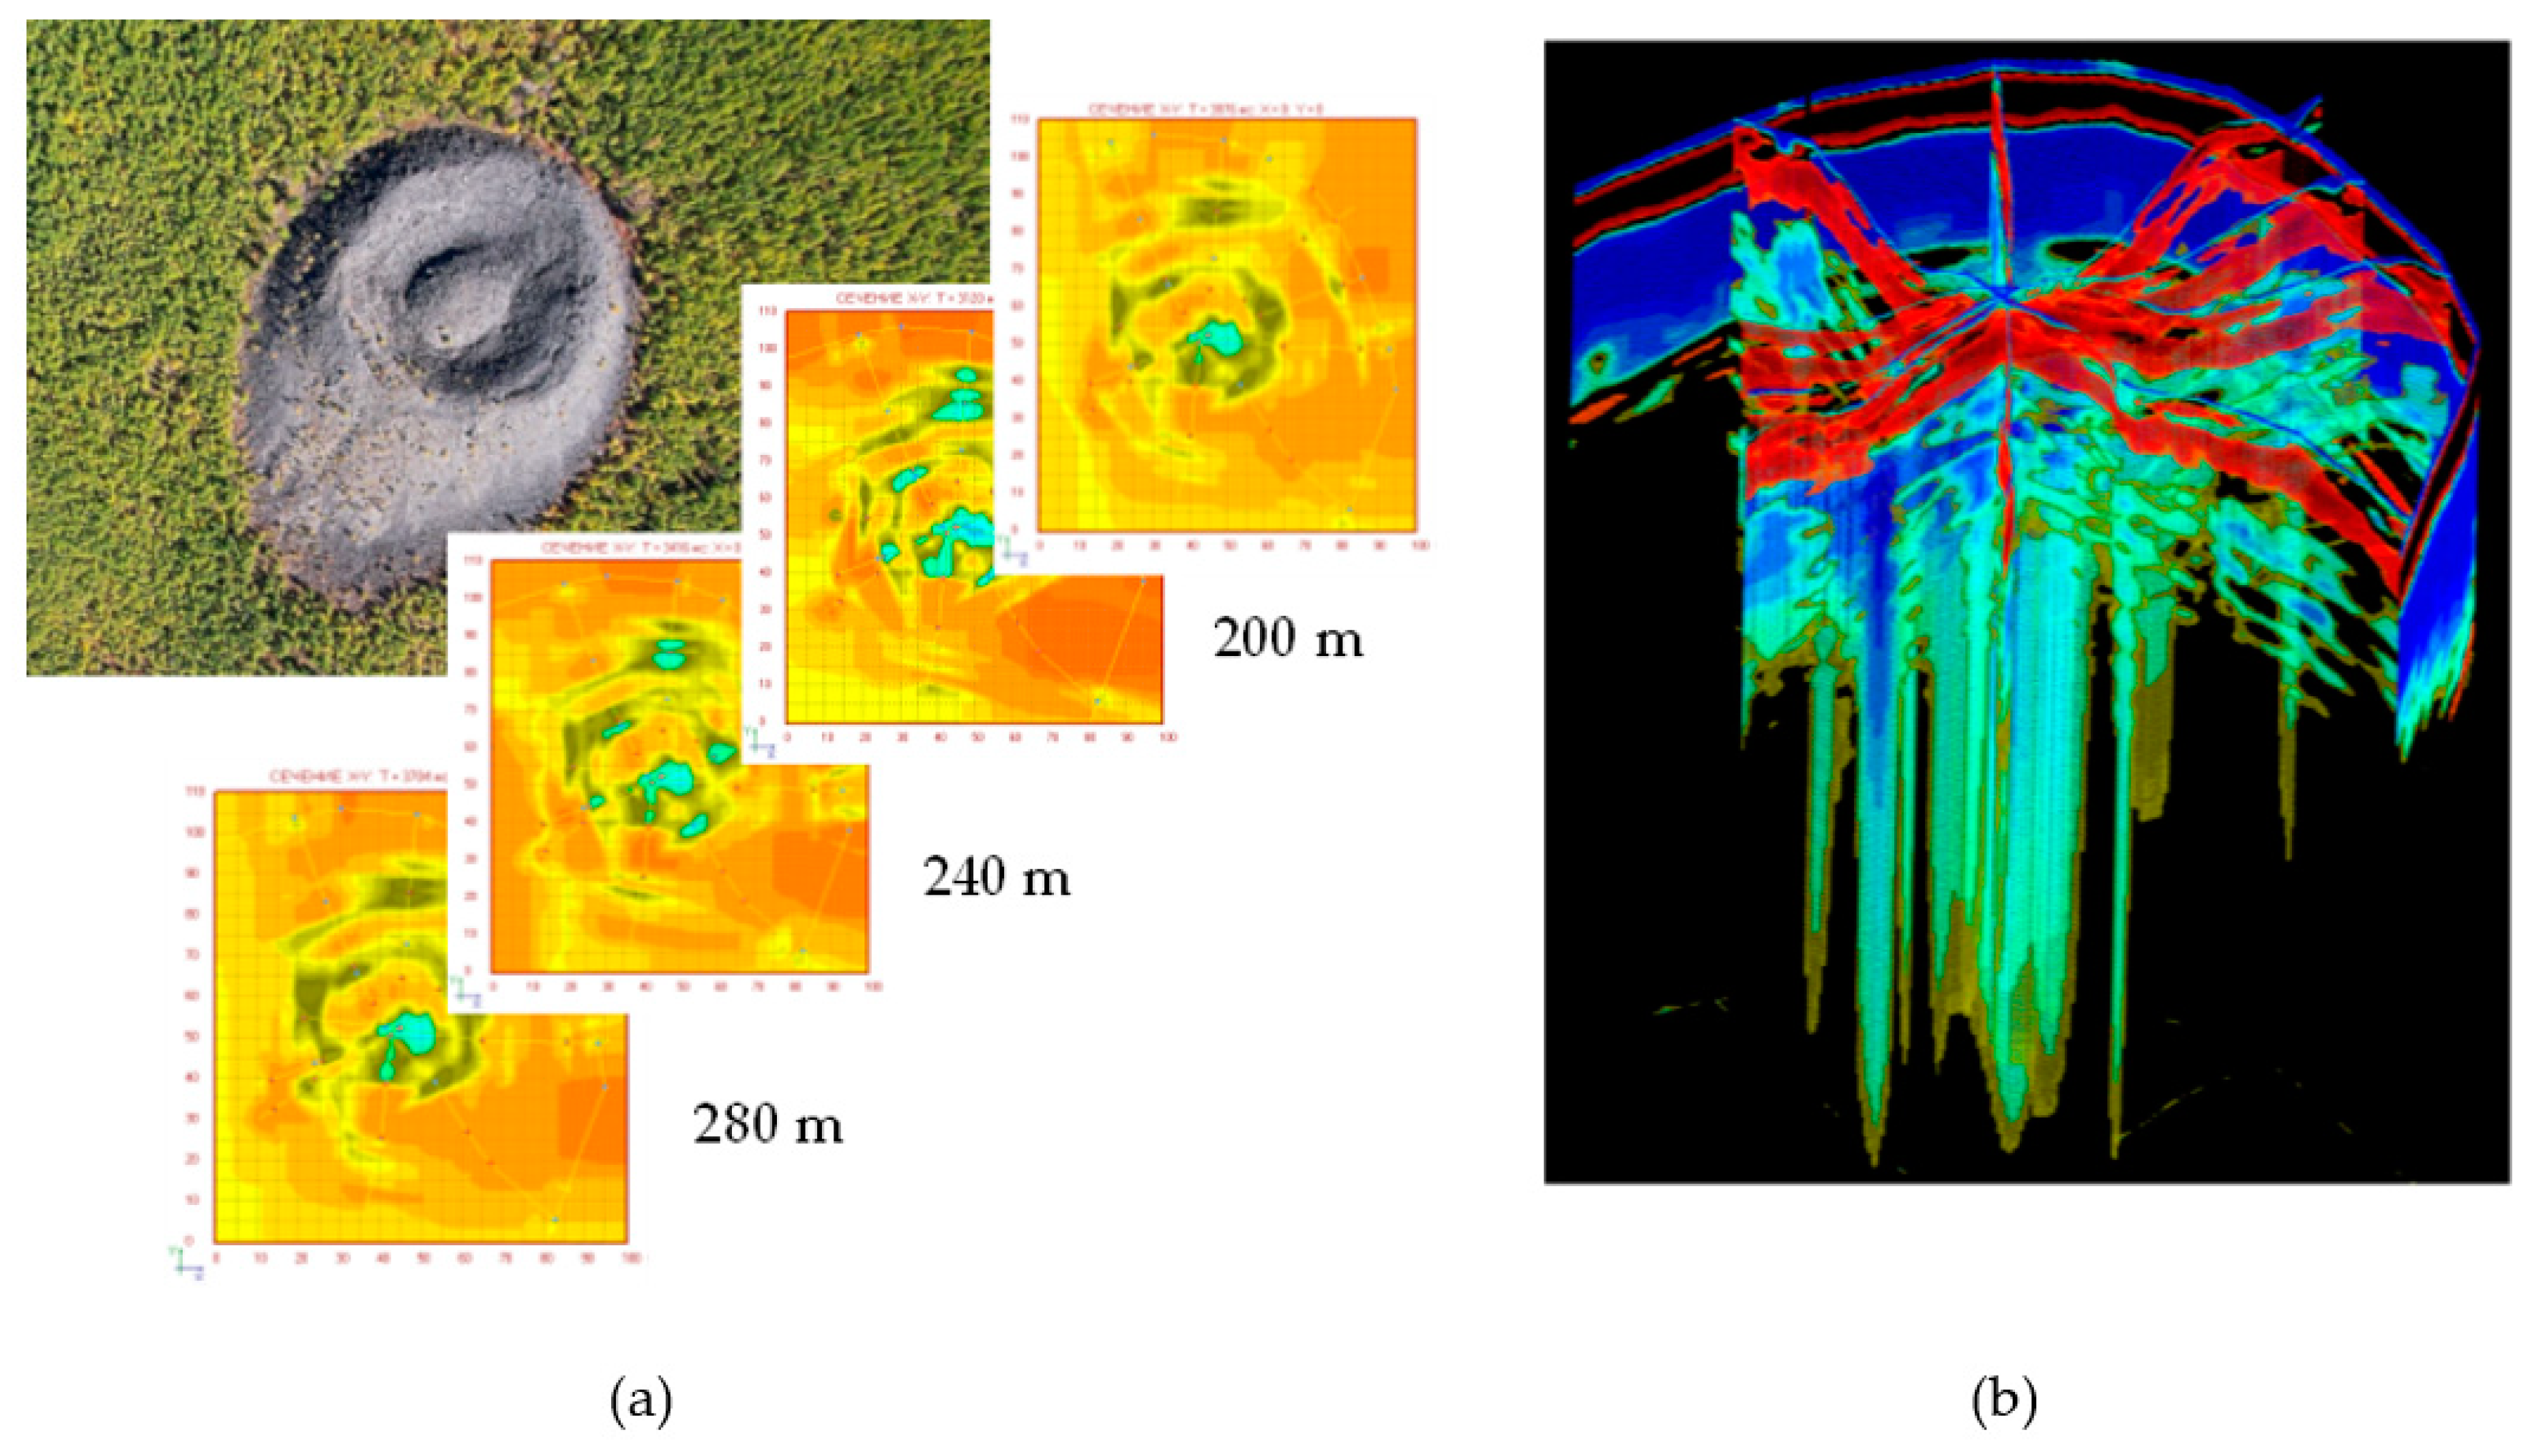
Figure 20.
Three GPR signal waveforms from the of Figure 18 (b): m (A,B,C).Waveform (B) shows a significant deviation of the signal amplitude into the region of positive values.
Figure 20.
Three GPR signal waveforms from the of Figure 18 (b): m (A,B,C).Waveform (B) shows a significant deviation of the signal amplitude into the region of positive values.
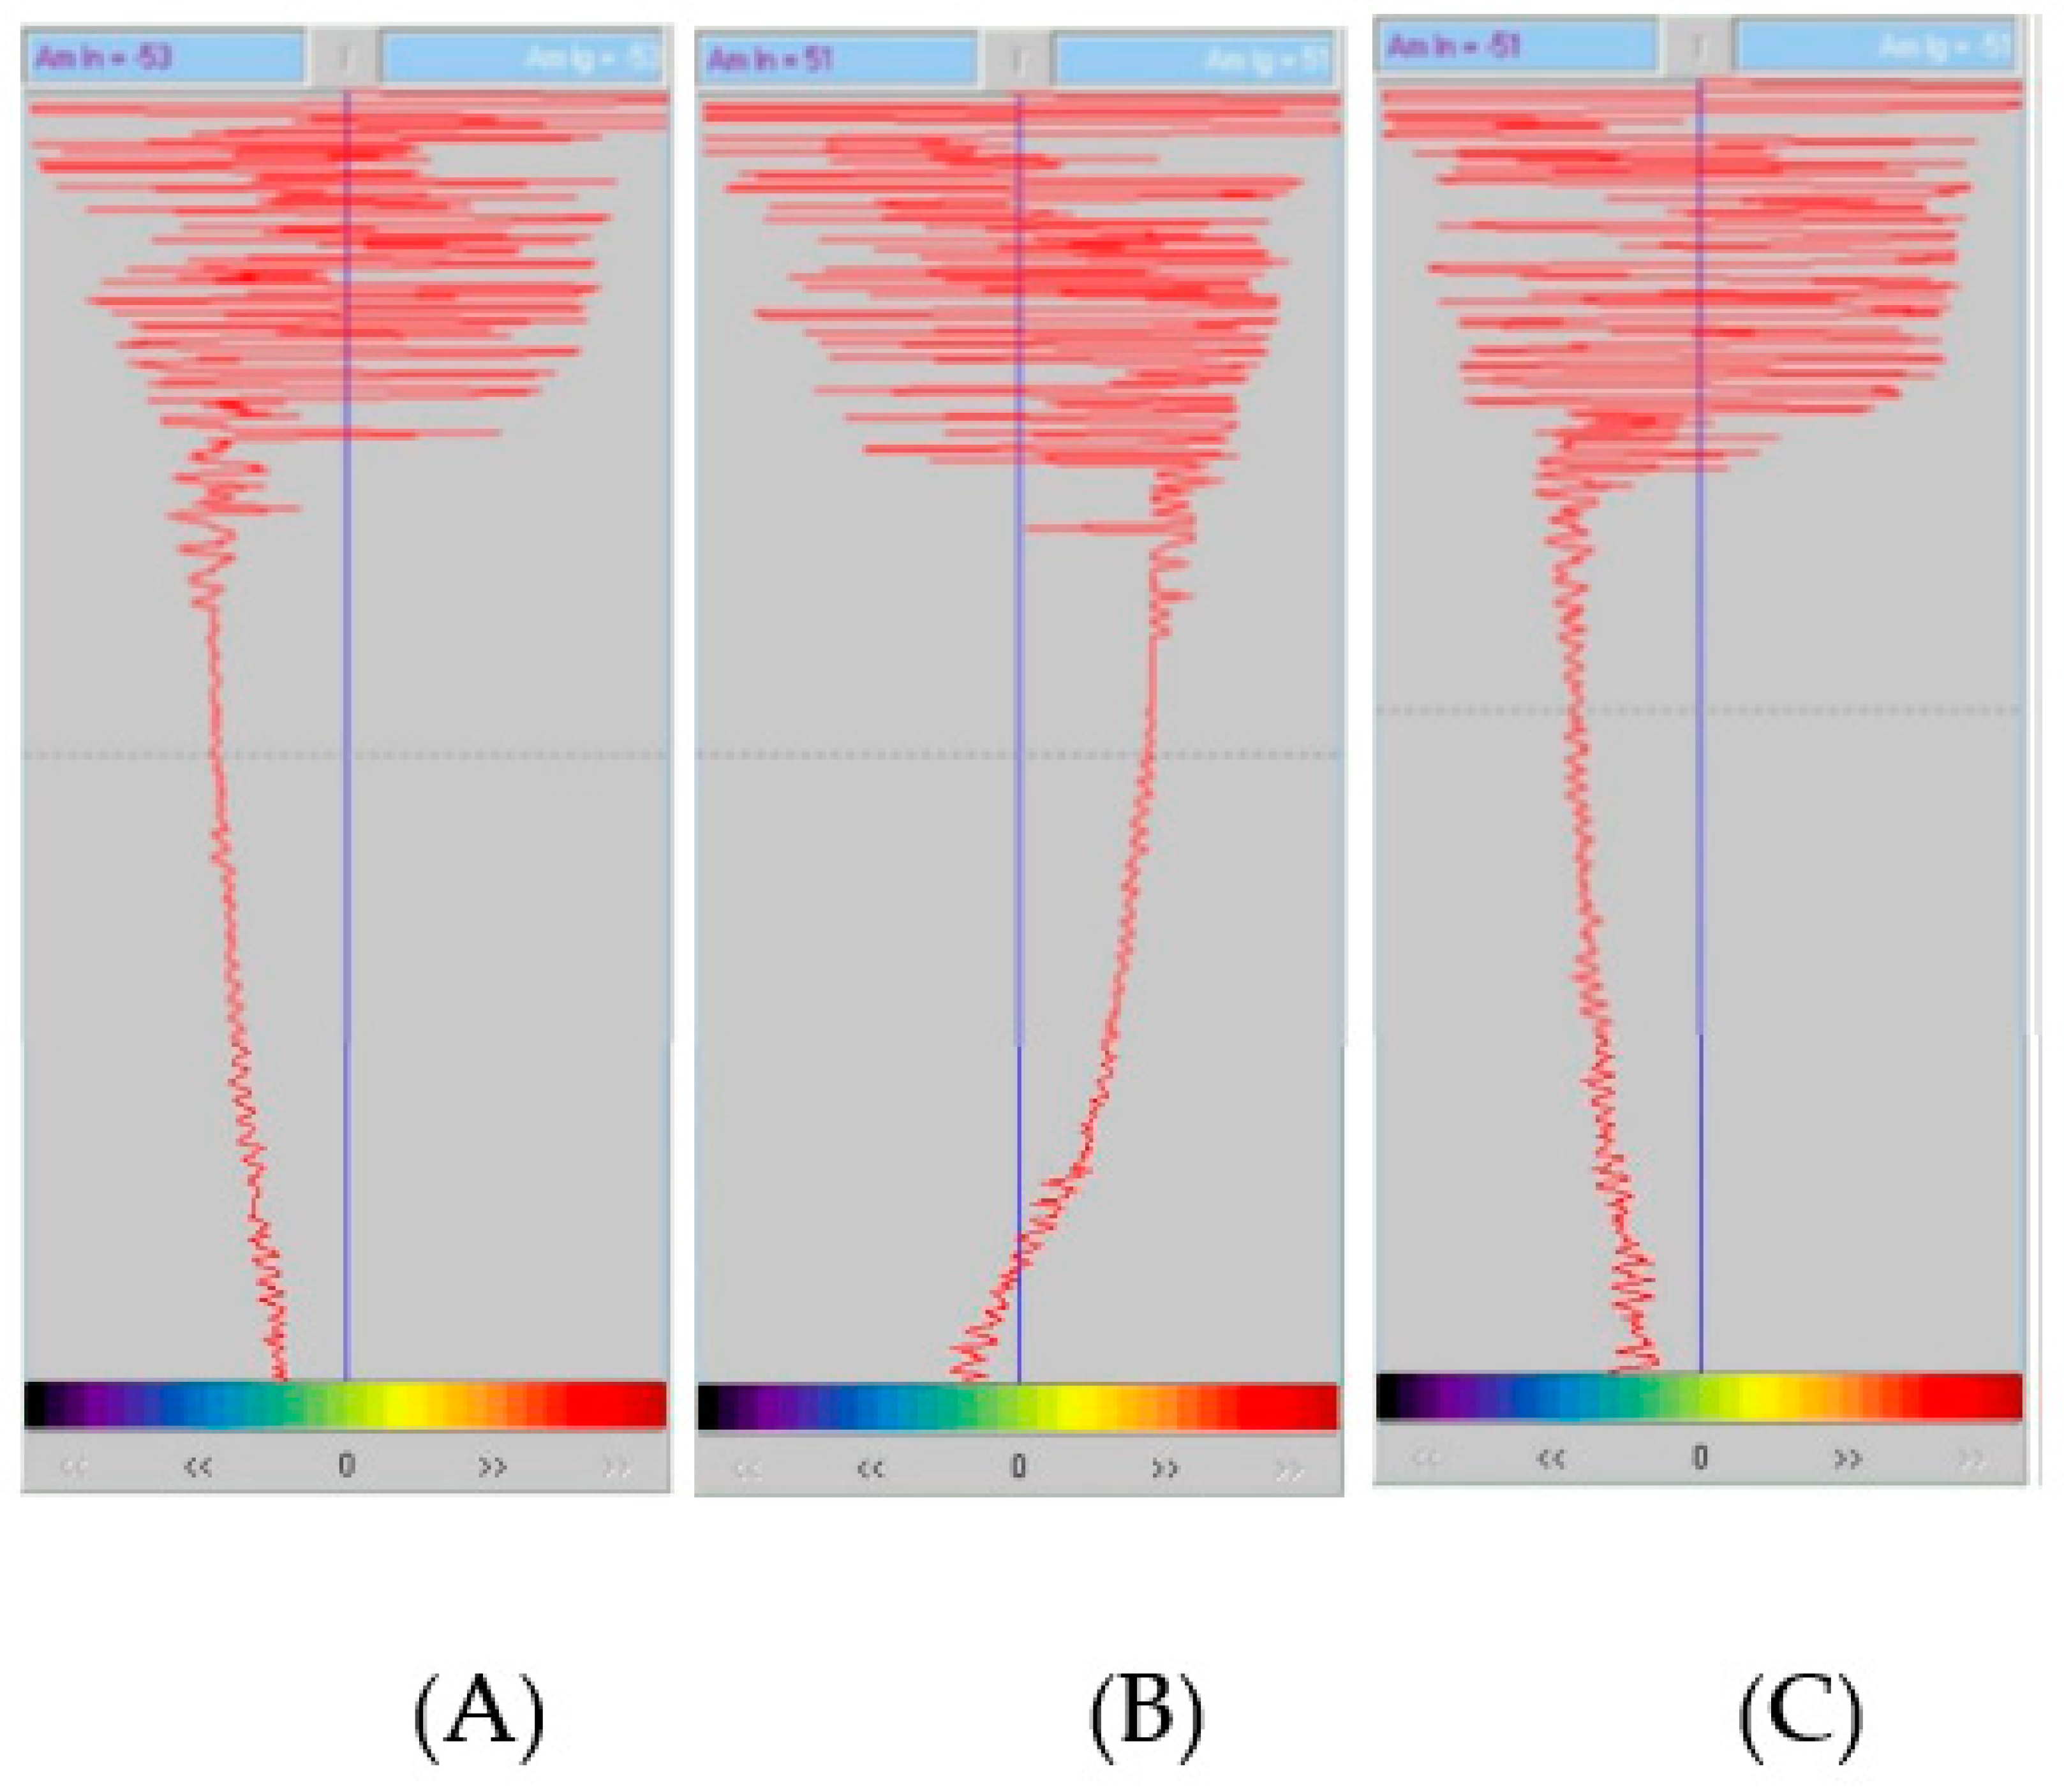
Figure 21.
Model source function for m.
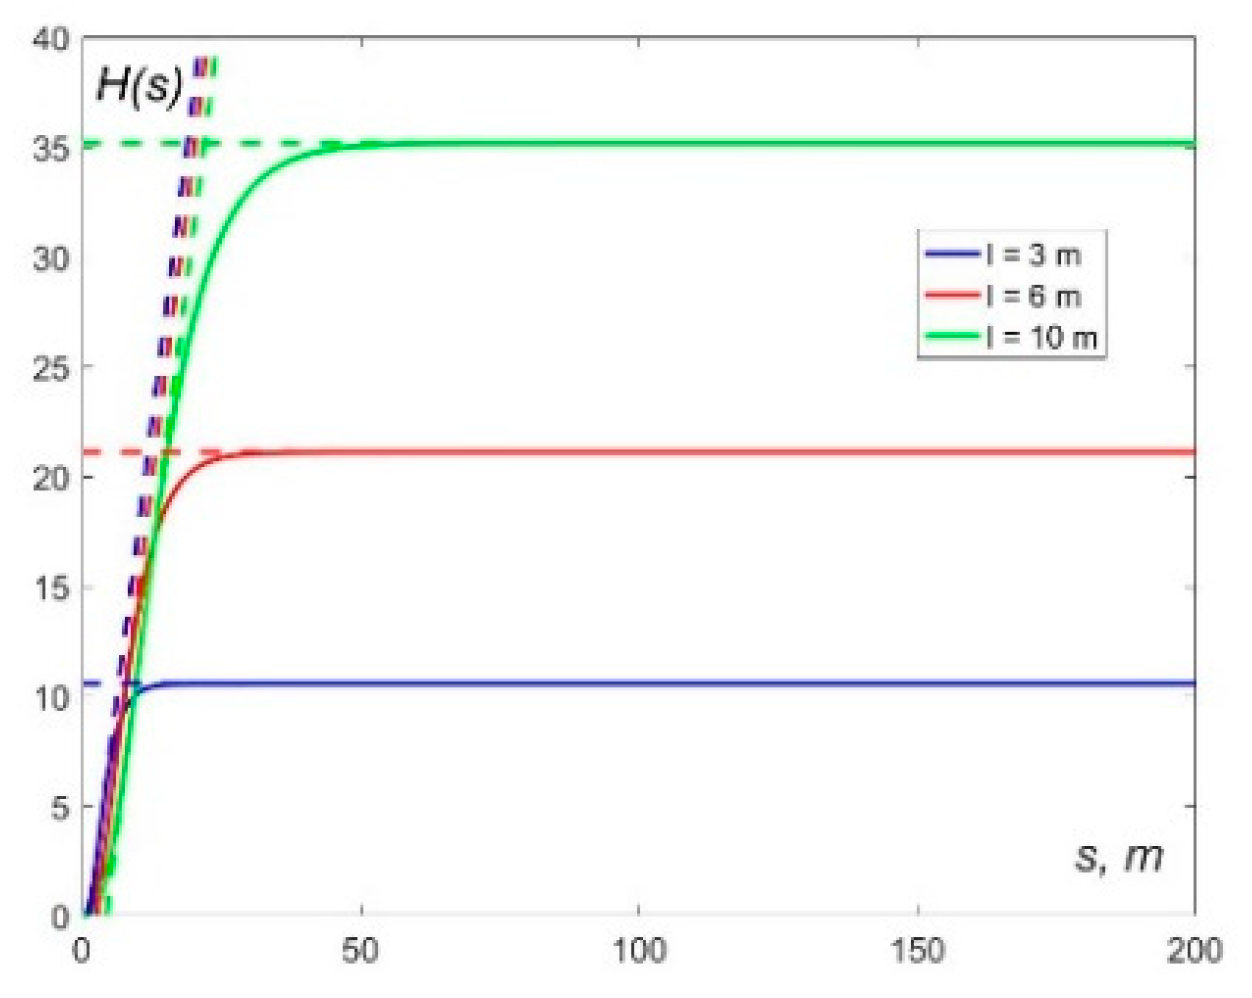
Figure 22.
(a) Radargram of deep subsurface probing of the Patomsky crater. B-scan with marked profiles: A 21 m, A 38 m, and A 48 m; (b) Logarithmic amplitude color scale.
Figure 22.
(a) Radargram of deep subsurface probing of the Patomsky crater. B-scan with marked profiles: A 21 m, A 38 m, and A 48 m; (b) Logarithmic amplitude color scale.
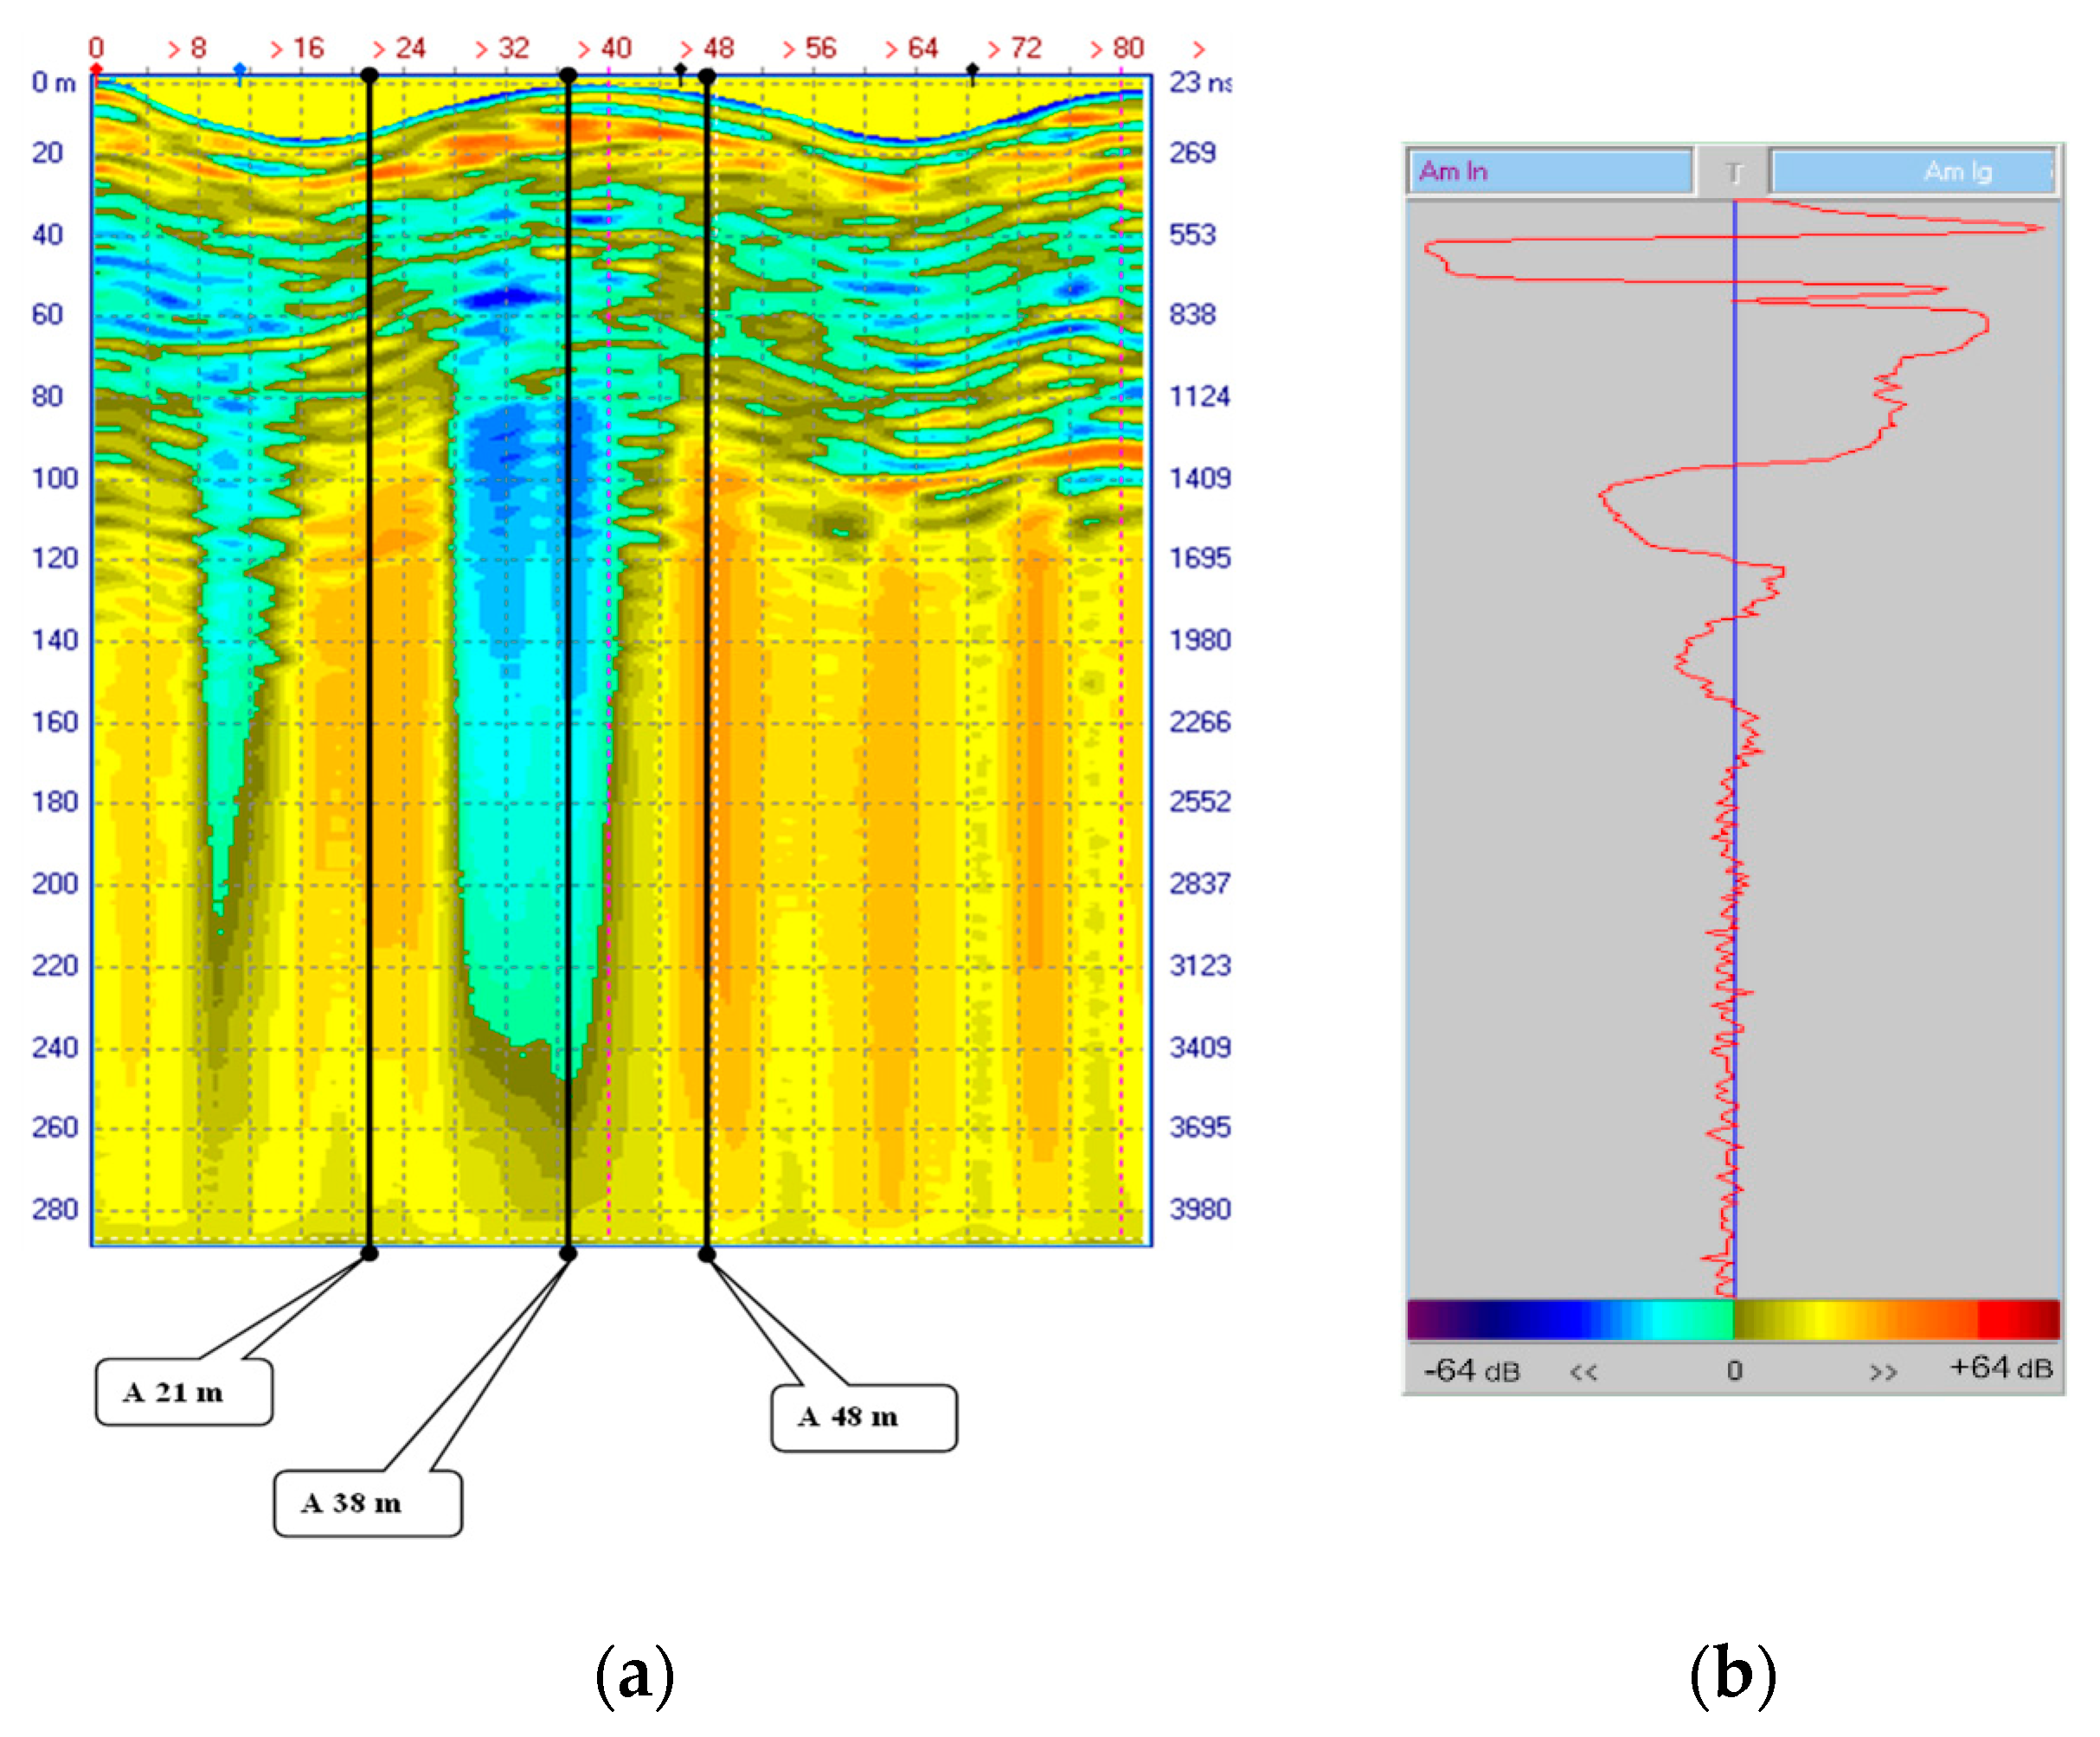
Figure 23.
Depth permittivity profile in the center (A 38 m) and on the periphery of the crater (A 21 and A 48 m), reconstructed from the GPR data.
Figure 23.
Depth permittivity profile in the center (A 38 m) and on the periphery of the crater (A 21 and A 48 m), reconstructed from the GPR data.
Disclaimer/Publisher’s Note: The statements, opinions and data contained in all publications are solely those of the individual author(s) and contributor(s) and not of MDPI and/or the editor(s). MDPI and/or the editor(s) disclaim responsibility for any injury to people or property resulting from any ideas, methods, instructions or products referred to in the content. |
© 2023 by the authors. Licensee MDPI, Basel, Switzerland. This article is an open access article distributed under the terms and conditions of the Creative Commons Attribution (CC BY) license (http://creativecommons.org/licenses/by/4.0/).
Copyright: This open access article is published under a Creative Commons CC BY 4.0 license, which permit the free download, distribution, and reuse, provided that the author and preprint are cited in any reuse.


