Submitted:
12 May 2023
Posted:
15 May 2023
You are already at the latest version
Abstract
Keywords:
1. Introduction
2. Materials and Methods
2.1. Collection of rat tumor tissues for proteomic analyses
2.2. Proteomic analyses
2.3. Histology and immunohistochemical analyses
2.4. Chemicals
2.5. Cells
2.6. Immunoblotting
2.7. Mitochondria isolation
2.8. ETC (Electron transport chain from complex I to complex III)
2.9. ATP
2.10. β-oxidation of fatty acid
2.11. Scratch assay
2.12. Real time PCR (RT-PCR)
2.13. Statistical analysis
3. Results
3.1. Mitochondrial biomarkers involved in the acquisition of invasiveness in rat mesotheliomas
3.2. Immunohistochemical study of ACADL distribution in rat tumors
3.3. Fatty acid β-oxidation supports cell invasiveness in human primary mesothelioma cell lines
4. Discussion
5. Conclusions
Supplementary Materials
Author Contributions
Funding
Institutional Review Board Statement
Informed Consent Statement
Data Availability Statement
Acknowledgments
Conflicts of Interest
References
- Faubert, B.; Solmonson, A.; DeBerardinis, R.J. Metabolic reprogramming and cancer progression. Science 2020 368, eaaw5473. https://doi-org.proxy.insermbiblio.inist.fr/10.1126/science.aaw5473. [CrossRef]
- Scheid, A.D.; Beadnell, T.C.; Welch, D.R. Roles of mitochondria in the hallmarks of metastasis. Br. J. Cancer 2021 124, 124-135. https://doi-org.proxy.insermbiblio.inist.fr/10.1038/s41416-020-01125-8. [CrossRef]
- Ishikawa, K.; Takenaga, K.; Akimoto, M.; Koshikawa, N.; Yamaguchi, A.; Imanishi, H.; Nakada, K.; Honma, Y.; Hayashi, J.-I. ROS-generating mitochondrial DNA mutations can regulate tumor cell metastasis. Science 2008 320, 661-664. https://doi-org.proxy.insermbiblio.inist.fr/10.1126/science.1156906. [CrossRef]
- Zampieri, L.X.; Silva-Almeida, C.; Rondeau, J.D.; Sonveaux, P. Mitochondrial transfer in cancer: a comprehensive review. Int. J. Mol. Sci. 2021 22, 3245. https://doi-org.proxy.insermbiblio.inist.fr/10.3390/ijms22063245. [CrossRef]
- Yanes, B.; Rainero, E. The interplay between cell-extracellular matrix interaction and mitochondria dynamics in cancer. Cancers 2022 14, 1433. https://doi-org.proxy.insermbiblio.inist.fr/10.3390/cancers14061433. [CrossRef]
- Boulton, D.P.; Caino, M.C. Mitochondrial fission and fusion in tumor progression to metastasis. Front. Cell Dev. Biol. 2022 10, 849962. https://doi-org.proxy.insermbiblio.inist.fr/10.3389/fcell.2022.849962. [CrossRef]
- Bononi, G.; Masoni, S.; Di Bussolo, V.; Tuccinardi, T.; Granchi, C.; Minutolo, F. Historical perspective of tumor glycolysis: a century with Otto Warburg. Semin. Cancer Biol. 2022 86 Pt 2, 325-333. https://doi-org.proxy.insermbiblio.inist.fr/10.1016/j.semcancer.2022.07.003. [CrossRef]
- Akman, M.; Belisario, D.C.; Salaroglio, I.C.; Kopecka, J.; Donadelli, M.; De Smaele, E.; Riganti, C. Hypoxia, endoplasmic reticulum stress and chemoresistance: dangerous liaisons. J. Exp. Clin. Cancer Res. 2021 40, 28. https://doi-org.proxy.insermbiblio.inist.fr/10.1186/s13046-020-01824-3. [CrossRef]
- Fiorillo, M.; Ózsvári, B.; Sotgia, F.; Lisanti, M.P. High ATP production fuels cancer drug resistance and metastasis: implications for mitochondrial ATP depletion therapy. Front. Oncol. 2021 11, 740720. https://doi-org.proxy.insermbiblio.inist.fr/10.3389/fonc.2021.740720. [CrossRef]
- Kopecka, J.; Gazzano, E.; Castella, B.; Salaroglio, I.C.; Mungo, E.; Massaia, M.; Riganti, C. Mitochondrial metabolism: inducer or therapeutic target in tumor immune-resistance? Semin. Cell Dev. Biol. 2020 98, 80-89. https://doi-org.proxy.insermbiblio.inist.fr/10.1016/j.semcdb.2019.05.008. [CrossRef]
- Xie, L.; Zhou, T.; Xie, Y.; Bode, A.M.; Cao, Y. Mitochondria-shaping proteins and chemotherapy. Front. Oncol. 2021 11, 769036. https://doi-org.proxy.insermbiblio.inist.fr/10.3389/fonc.2021.769036. [CrossRef]
- Concolino, A.; Olivo, E.; Tammè, L.; Fiumara, C.; De Angelis, M.T.; Quaresima, B.; Agosti, V.; Costanzo, F.S.; Cuda, G.; Scumaci, D. Proteomics analysis to assess the role of mitochondria in BRCA1-mediated breast tumorigenesis. Proteomes 2018 6, 16. https://doi-org.proxy.insermbiblio.inist.fr/10.3390/proteomes6020016. [CrossRef]
- Arif, T.; Stern, O.; Pittala, S.; Chalifa-Caspi, V.; Shoshan-Barmatz, V. Rewiring of cancer cell metabolism by mitochondrial VDAC1 depletion results in time-dependent tumor reprogramming: glioblastoma as a proof of concept. Cells 2019 8, 1330. https://doi-org.proxy.insermbiblio.inist.fr/10.3390/cells8111330. [CrossRef]
- MacVicar, T.; Ohba, Y.; Nolte, H.; Mayer, F.C.; Tatsuta, T.; Sprenger, H.-G.; Lindner, B.; Zhao, Y.; Li, J.; Bruns, C.; et al. Lipid signalling drives proteolytic rewiring of mitochondrial by YME1L. Nature 2019 575, 361-.https://doi-org.proxy.insermbiblio.inist.fr/10.3389/fonc.2021.769036. [CrossRef]
- Nader, J.S.; Boissard, A.; Henry, C.; Valo, I.; Verrièle, V.; Grégoire, M.; Coqueret, O.; Guette, C.; Pouliquen, D.L. Cross-species proteomics identifies CAPG and SBP1 as crucial invasiveness biomarkers in rat and human malignant mesothelioma. Cancers 2020 12, 2430. https://doi-org.proxy.insermbiblio.inist.fr/10.3390/cancers12092430. [CrossRef]
- Nader, J.S.; Abadie, J.; Deshayes, S.; Boissard, A.; Blandin, S.; Blanquart, C.; Boisgerault, N.; Coqueret, O.; Guette, C.; Grégoire, M.; et al. Characterization of increasing stages of invasiveness identifies stromal/cancer cell crosstalk in rat models of mesothelioma. Oncotarget 2018 9, 16311-16329. https://doi-org.proxy.insermbiblio.inist.fr/10.18632/oncotarget.24632. [CrossRef]
- Yu, D.-L.; Li, H.-W.; Wang, Y.; Li, C.-Q.; You, D.; Jiang, L.; Song, Y.-P.; Li, X.-H. Acyl-CoA dehydrogenase long chain expression is associated with esophageal squamous cell carcinoma progression and poor prognosis. Onco Targets Ther. 2018 11, 7643-7653. https://doi-org.proxy.insermbiblio.inist.fr/10.2147/ott.s171963. [CrossRef]
- Salas, S.; Jézéquel, P.; Campion, L.; Deville, J.-L., Chibon, F.; Bartoli, C.; Gentet, J.-C.; Charbonnel, C.; Gouraud, W.; Voutsinos-Porche, B.; et al. Molecular characterization of the response to chemotherapy in conventional osteosarcomas: predictive value of HSD17B10 and IFITM2. Int. J. Cancer 2009 125, 851-860. https://doi-org.proxy.insermbiblio.inist.fr/10.1002/ijc.24457. [CrossRef]
- Klepinin, A.; Zhang, S.; Klepinina, L.; Rebane-Klemm, E.; Terzic, A.; Kaambre, T.; Dzeja, P. Adenylate kinase and metabolic signaling in cancer cells. Front. Oncol. 2020 10, 660. https://doi-org.proxy.insermbiblio.inist.fr/10.3389/fonc.2020.00660. [CrossRef]
- Yusenko, M.V.; Ruppert, T.; Kovacs, G. Analysis of differentially expressed mitochondrial proteins in chromophobe renal cell carcinomas and renal oncocytomas by 2-D gel electrophoresis. Int. J. Biol. Sci. 2010 6, 213-224. https://doi-org.proxy.insermbiblio.inist.fr/10.7150/ijbs.6.213. [CrossRef]
- Wiebringhaus, R.; Pecoraro, M.; Neubauer, H.A.; Trachtova, K.; Trimmel, B.; Wieselberg, M.; Pencik, J.; Egger, G.; Krall, C.; Moriggl, R.; et al. Proteomic analysis identifies NDUFS1 and ATP5O as novel markers for survival outcome in prostate cancer. Cancers 2021 13, 6036. https://doi-org.proxy.insermbiblio.inist.fr/10.3390/cancers13236036. [CrossRef]
- Lamb, R.; Ozsvari, B.; Bonuccelli, G.; Smith, D.L.; Pestell, R.G.; Martinez-Outschoorn, U.E.; Clarke, R.B.; Sotgia, F.; Lisanti, M.P. Dissecting tumor metabolic heterogeneity: telomerase and large cell size metabolically define a sub-population of stem-like, mitochondrial-rich, cancer cells. Oncotarget 2015 6, 21892-21905. https://doi-org.proxy.insermbiblio.inist.fr/10.18632/oncotarget.5260. [CrossRef]
- Zeng, L.; Morinibu, A.; Kobayashi, M.; Zhu, Y.; Wang, X.; Goto, Y.; Yeom, C.J.; Zhao, T.; Hirota, K.; Shinomiya, K.; et al. Aberrant IDH3 expression promotes malignant tumor growth by inducing HIF-1-mediated metabolic reprogramming and angiogenesis. Oncogene 2015 34, 4758-4766. https://doi-org.proxy.insermbiblio.inist.fr/10.1038/onc.2014.411. [CrossRef]
- Liu, Q.; Harvey, C.T.; Geng, H.; Xue, C.; Chen, V.; Beer, T.M.; Qian, D.Z. Malate dehydrogenase 2 confers docetaxel resistance via regulations of JNK signaling and oxidative metabolism. Prostate 2013 73, 1028-1037. https://doi-org.proxy.insermbiblio.inist.fr/10.1002/pros.22650. [CrossRef]
- Bavelloni, A.; Piazzi, M.; Raffini, M.; Faenza, I.; Blalock, W.L. Prohibitin 2: at a communications crossroads. IUBMB Life 2015 67, 239-54. https://doi-org.proxy.insermbiblio.inist.fr/10.1002/iub.1366. [CrossRef]
- Wang, B.; Ao, J.; Yu, D.; Rao, T.; Ruan, Y.; Yao, X. Inhibition of mitochondrial translation effectively sensitizes renal cell carcinoma to chemotherapy. Biochem. Biophys. Res. Commun. 2017 490, 767-773. https://doi-org.proxy.insermbiblio.inist.fr/10.1016/j.bbrc.2017.06.115. [CrossRef]
- Xu, S.; Wu, Y.; Chen, Q.; Cao, J.; Hu, K.; Tang, J.; Sang, Y.; Lai, F.; Wang, L.; Zhang, R.; et al. hSSB1 regulates both the stability and the transcriptional activity of p53. Cell Res. 2013 23, 423-435. https://doi-org.proxy.insermbiblio.inist.fr/10.1038/cr.2012.162. [CrossRef]
- Murphy, B.; Bhattacharya, R.; Mukherjee, P. Hydrogen sulfide signaling in mitochondria and disease. FASEB J. 2019 33, 13098-13125. https://doi-org.proxy.insermbiblio.inist.fr/10.1096/fj.201901304R. [CrossRef]
- Ismail, T.; Kim, Y.; Lee, H.; Lee, D.-S.; Lee, H.-S. Interplay between mitochondrial peroxiredoxins and ROS in cancer development and progression. Int. J. Mol. Sci. 2019 20, 4407. https://doi-org.proxy.insermbiblio.inist.fr/10.3390/ijms20184407. [CrossRef]
- Seo, J.-S.; Svenningsson, P. Modulation of ion channels and receptors by p11 (S100A10). Trends Pharmacol. Sci. 2020 41, 487-497. https://doi-org.proxy.insermbiblio.inist.fr/10.1016/j.tips.2020.04.004. [CrossRef]
- Kim, T.-M.; Yang, S.; Seung, B.-J.; Lee, S.; Kim, D.; Ha, Y.-J.; Seo, M.-k.; Kim, K.-K.; Kim, H.S.; Cheong, J.-H.; et al. Cross-species oncogenic signatures of breast cancer in canine mammary tumors. Nat. Commun. 2020 11, 3616. https://doi-org.proxy.insermbiblio.inist.fr/10.1038/s41467-020-17458-0. [CrossRef]
- Al-Harazi, O.; Kaya, I.H.; Al-Eid, M.; Alfantoukh, L.; Al Zahrani, A.S.; Al Sebayel, M.; Kaya, N.; Colak, D. Identification of gene signature as diagnostic and prognostic blood biomarker for early hepatocellular carcinoma using integrated cross-species transcriptomic and network analyses. Front. Genet. 2021 12, 710049. https://doi-org.proxy.insermbiblio.inist.fr/10.3389/fgene.2021.710049. [CrossRef]
- Rensch, T.; Villar, D.; Horvath, J.; Odom, D.T.; Flicek, P. Mitochondrial heteroplasmy in vertebrates using ChIP-sequencing data. Genome Biol. 2016 17, 139. https://doi-org.proxy.insermbiblio.inist.fr/10.1186/s13059-016-0996-y. [CrossRef]
- Spinelli, J.B.; Haigis, M.C. The multifaceted contributions of mitochondria to cellular metabolism. Nat. Cell Biol. 2018 20, 745-754. https://doi-org.proxy.insermbiblio.inist.fr/10.1038/s41556-018-0124-1. [CrossRef]
- Carracedo, A.; Cantley, L.C.; Pandolfi, P.P. Cancer metabolism: fatty acid oxidation in the limelight. Nat. Rev. Cancer 2013 13, 227-232. https://doi-org.proxy.insermbiblio.inist.fr/10.1038/nrc3483. [CrossRef]
- Xie, B.-X.; Zhang, H. ; Wang, J.; Pang, B.; Wu, R.-Q.; Qian, X.-L.; Yu, L.; Li, S.-H.; Shi, Q.-G.; Huang, C.-F.; et al. Analysis of differentially expressed genes in LNCaP prostate cancer progression model. J. Androl. 2011 32, 170-182. https://doi-org.proxy.insermbiblio.inist.fr/10.2164/jandrol.109.008748. [CrossRef]
- Yu, D.-L.; Li, H.-W.; Wang, Y.; Li, C.-Q.; You, D.; Jiang, L.; Song, Y.-P.; Li, X.-H. Acyl-CoA dehydrogenase long chain expression is associated with esophageal squamous cell carcinoma progression and poor prognosis. Oncotargets Ther. 2018 11, 7643-7653. https://doi-org.proxy.insermbiblio.inist.fr/10.2147/OTT.S171963. [CrossRef]
- Salas, S.; Jézéquel, P.; Campion, L.; Deville, J.-L.; Chibon, F.; Bartoli, C.; Gentet, J.-C.; Charbonnel, C.; Gouraud, W.; Voutsinos-Porche, B.; et al. Molecular characterization of the response to chemotherapy in conventional osteosarcomas: predictive value of HSD17B10 and IFITM2. Int. J. Cancer 2009 125, 851-860. https://doi-org.proxy.insermbiblio.inist.fr/10.1002/ijc.24457. [CrossRef]
- Carlson, E.A.; Marquez, R.T.; Du, F.; Wang, Y.; Xu, L.; Yan, S.S. Overexpression of 17b-hydroxysteroid dehydrogenase type 10 increases pheochromocytoma cell growth and resistance to cell death. BMC Cancer 2015 15, 166. https://doi-org.proxy.insermbiblio.inist.fr/10.1186/s12885-015-1173-5. [CrossRef]
- Condon, K.J.; Orozco, J.M.; Adelman, C.H.; Spinelli, J.B.; van der Helm, P.W.; Roberts, J.M.; Kunchok, T.; Sabatini, D.M. Genome-wide CRISPR screens reveal multitiered mechanisms through which mTORC1 senses mitochondrial dysfunction. Proc. Natl. Acad. Sci. USA 2021 118, e2022120118. https://doi-org.proxy.insermbiblio.inist.fr/10.1073/pnas.2022120118. [CrossRef]
- Braun, C.; Weichhart, T. mTOR-dependent immunometabolism as Achilles’ heel of anticancer therapy. Eur. J. Immunol. 2021 51, 3161-3175. https://doi-org.proxy.insermbiblio.inist.fr/10.1002/eji.202149270. [CrossRef]
- Fiorillo, M.; Ózsvári, B.; Sotgia, F.; Lisanti, M.P. High ATP production fuels cancer drug resistance and metastasis: implications for mitochondrial ATP depletion therapy. Front. Oncol. 2021 11, 740720. https://doi-org.proxy.insermbiblio.inist.fr/10.3389/fonc.2021.740720. [CrossRef]
- Wang, T.; Ma, F.; Qian, H.-l. Defueling the cancer: ATP synthase as an emerging target in cancer therapy. Mol Ther. Oncolytics 2021 23, 82-95. https://doi-org.proxy.insermbiblio.inist.fr/10.1016/j.omto.2021.08.015. [CrossRef]
- Galber, C.; Acosta, M. J.; Minervivi, G.; Giorgio, V. The role of mitochondrial ATP synthase in cancer. Biol. Chem. 2020 401, 1199-1214. https://doi-org.proxy.insermbiblio.inist.fr/10.1515/hsz-2020-0157. [CrossRef]
- Chang, H.J.; Lee, M.R.; Hong, S.-H.; Yoo, B.C.; Shin, Y.-K.; Jeong, J.Y.; Lim, S.-B.; Choi, H.S.; Park, J.-G. Identification of mitochondrial F0F1-ATP synthase involved in liver metastasis of colorectal cancer. Cancer Sci. 2007 98, 1184-1191. https://doi-org.proxy.insermbiblio.inist.fr/10.1111/j.1349-7006.2007.00527. [CrossRef]
- Gaude, E.; Frezza, C. Defects in mitochondrial metabolism and cancer. Cancer Metab. 2014 2, 10. https://doi-org.proxy.insermbiblio.inist.fr/10.1186/2049-3002-2-10. [CrossRef]
- Gao, S.-P.; Sun, H.-F.; Fu, W.-Y.; Li, L.-D.; Zhao, Y.; Chen, M.-T.; Jin, W. High expression of COX5B is associated with poor prognosis in breast cancer. Future Oncol. 2017 13, 1711-1719. https://doi-org.proxy.insermbiblio.inist.fr/10.2217/fon-2017-0058. [CrossRef]
- Chu, Y.-D.; Lin, W.-R.; Lin, Y.-H.; Kuo, W.-H.; Tseng, C.-J.; Lim, S.-N.; Huang, Y.-L.; Huang, S.-C.; Wu, T.-J.; Lin, K.-H.; et al. COX5B-mediated bioenergetic alteration regulates tumor growth and migration by modulating AMPK-UHMK1-ERK cascade in hepatoma. Cancers 2020 12, 1646. https://doi-org.proxy.insermbiblio.inist.fr/10.3390/cancers12061646. [CrossRef]
- Chu, Y.-D.; Lim, S.-N.; Yeh, C.-T.; Lin, W.-R. COX5B-mediated bioenergetic alterations modulate cell growth and anticancer drug susceptibility by orchestrating claudin-2 expression in colorectal cancers. Biomedicines 2022 10, 60. https://doi-org.proxy.insermbiblio.inist.fr/10.3390/biomedicines10010060. [CrossRef]
- Tian, B.-X.; Sun, W.; Wang, S.-H.; Liu, P.-J.; Wang, Y.-C. Differential expression and clinical significance of COX6C in human diseases. Am. J. Transl. Res. 2021 13, 1-10. PMID: 33527004.
- Jang, S.C.; Crescitelli, R.; Cvjetkovic, A.; Belgrano, V.; Bagge, R.O.; Sundfeldt, K.; Ochiya, T.; Kalluri, R.; Lötvall, J. Mitochondrial protein enriched extracellular vesicles discovered in human melanoma tissues can be detected in patient plasma. J. Extracell. Vesicles. 2019 8, 1635420. https://doi-org.proxy.insermbiblio.inist.fr/10.1080/20013078.2019.1635420. [CrossRef]
- Laurenti, G.; Tennant, D.A. Isocitrate dehydrogenase (IDH), succinate dehydrogenase (SDH), fumarate hydratase (FH): three players for one phenotype in cancer? Biochem. Soc. Trans. 2016 44, 1111-1116. https://doi-org.proxy.insermbiblio.inist.fr/10.1042/BST20160099. [CrossRef]
- Zeng, L.; Morinibu, A.; Kobayashi, M.; Zhu, Y.; Wang, X.; Goto, Y.; Yeom, C.J.; Zhao, T.; Hirota, K.; Shinomiya, K.; et al. Aberrant IDH3 expression promotes malignant tumor growth by inducing HIF-1-mediated metabolic reprogramming and angiogenesis. Oncogene 2015 34, 4758-4766. https://doi-org.proxy.insermbiblio.inist.fr/10.1038/onc.2014.411. [CrossRef]
- Cruz, I.N.; Coley, H.M.; Kramer, H.B.; Madhuri, T.K.; Safuwan, N.A.M.; Angelino, A.R.; Yang, M. Proteomics analysis of ovarian cancer cell lines and tissues reveals drug resistance-associated proteins. Cancer Genom. Proteom. 2017 14, 35-52. https://doi-org.proxy.insermbiblio.inist.fr/10.21873/cgp.20017. [CrossRef]
- Norberg, E.; Lako, A.; Chen, P.-H.; Stanley, I.A.; Zhou, F.; Ficarro, S.B.; Chapuy, B.; Chen, L.; Rodig, S.; Shin, D.; et al. Differential contribution of the mitochondrial translation pathway to the survival of diffuse large B-cell lymphoma subsets. Cell Death Differ. 2017 24, 251-262. https://doi-org.proxy.insermbiblio.inist.fr/10.1038/cdd.2016.116. [CrossRef]
- Wang, B.; Ao, J.; Yu, D.; Rao, T.; Ruan, Y.; Yao, X. Inhibition of mitochondrial translation effectively sensitizes renal cell carcinoma to chemotherapy. Biochem. Biophys. Res. Commun. 2017 490, 767-773. https://doi-org.proxy.insermbiblio.inist.fr/10.1016/j.bbrc.2017.06.115. [CrossRef]
- Chatla, S.; Du, W.; Wilson, A.F.; Meetei, A.R.; Pang, Q. Fancd2-deficient hematopoietic stem and progenitor cells depend on augmented mitochondrial translation for survival and proliferation. Stem Cell Res. 2019 40, 101550. https://doi-org.proxy.insermbiblio.inist.fr/10.1016/j.scr.2019.101550. [CrossRef]
- Brocker, C.; Cantore, M.; Failli, P.; Vasiliou, V. Aldehyde dehydrogenase 7A1 (ALDH7A1) attenuates reactive aldehyde and oxidative stress induced cytotoxicity. Chem. Biol. Interact 2011 191, 269-277. https://doi-org.proxy.insermbiblio.inist.fr/10.1016/j.cbi.2011.02.016. [CrossRef]
- Prabhu, V.V.; Lulla, A.R.; Madhukar, N.S.; Ralff, M.D.; Zhao, D.; Kline, C.L.B.; Van den Heuvel, A.P.; Lev, A.; Garnett, M.J.; McDermott, U.; et al. Cancer stem cell-related gene expression as a potential biomarker of response for first-in-class imipridone ONC201 in solid tumors. PloS ONE 2017 12, e0180541. https://doi-org.proxy.insermbiblio.inist.fr/10.1371/journal.pone.0180541. [CrossRef]
- Bizzaro, V.; Belvedere, R.; Milone, M.R.; Pucci, B.; Lombardi, R.; Bruzzese, F.; Popolo, A.; Parente, L.; Budillon, A.; Petrella, A. Annexin A1 is involved in the acquisition and maintenance of a stem cell-like/aggressive phenotype in prostate cancer cells with acquired resistance to zoledronic acid. Oncotarget 2015 6, 25074-25092. https://doi-org.proxy.insermbiblio.inist.fr/. [CrossRef]
- Van den Hoogen, C.; van der Horst, G.; Cheung, H.; Buijs, J.T.; Pelger, R.C.M.; van der Pluijm, G. The aldehyde dehydrogenase enzyme 7A1 is functionally involved in prostate cancer bone metastasis. Clin. Exp. Metastasis 2011 28, 615-625. https://doi-org.proxy.insermbiblio.inist.fr/10.1007/s10585-011-9395-7. [CrossRef]
- Giacalone, N.J.; Den, R.B.; Eisenberg, R.; Chen, H.; Olson, S.J.; Massion, P.P.; Carbone, D.P.; Lu, B. ALDH7A1 expression is associated with recurrence in patients with surgically resected non-small-cell lung carcinoma. Future Oncol. 2013 9, 737-745. https://doi-org.proxy.insermbiblio.inist.fr/10.2217/fon.13.19. [CrossRef]
- Lee, J.-S.; Lee, H.; Woo, S. M.; Jang, H.; Jeon, Y.; Kim, H.Y.; Song, J.; Lee, W.J.; Hong, E.K.; Park, S.-J.; et al. Overall survival of pancreatic ductal adenocarcinoma is doubled by Aldh7a1 deletion in the KPC mouse. Theranostics 2021 11, 3472-3488. https://doi-org.proxy.insermbiblio.inist.fr/10.7150/thno.53935. [CrossRef]
- Wong, J.W.-Y.; Chan, C.-L.; Tang, W.-K.; Cheng, C.H.-K.; Fong, W.-P. Is antiquitin a mitochondrial enzyme? J. Cell. Biochem. 2010 109, 74-81. https://doi-org.proxy.insermbiblio.inist.fr/10.1002/jcb.22381. [CrossRef]
- Babbi, G.; Baldazzi, D.; Savojardo, C.; Martelli, P.L.; Casadio, R. Highlighting human enzymes active in different metabolic pathways and diseases: the case study of EC 1.2.3.1 and EC 2.3.1.9. Biomedicines 2020 8, 250. https://doi-org.proxy.insermbiblio.inist.fr/10.3390/biomedicines8080250. [CrossRef]
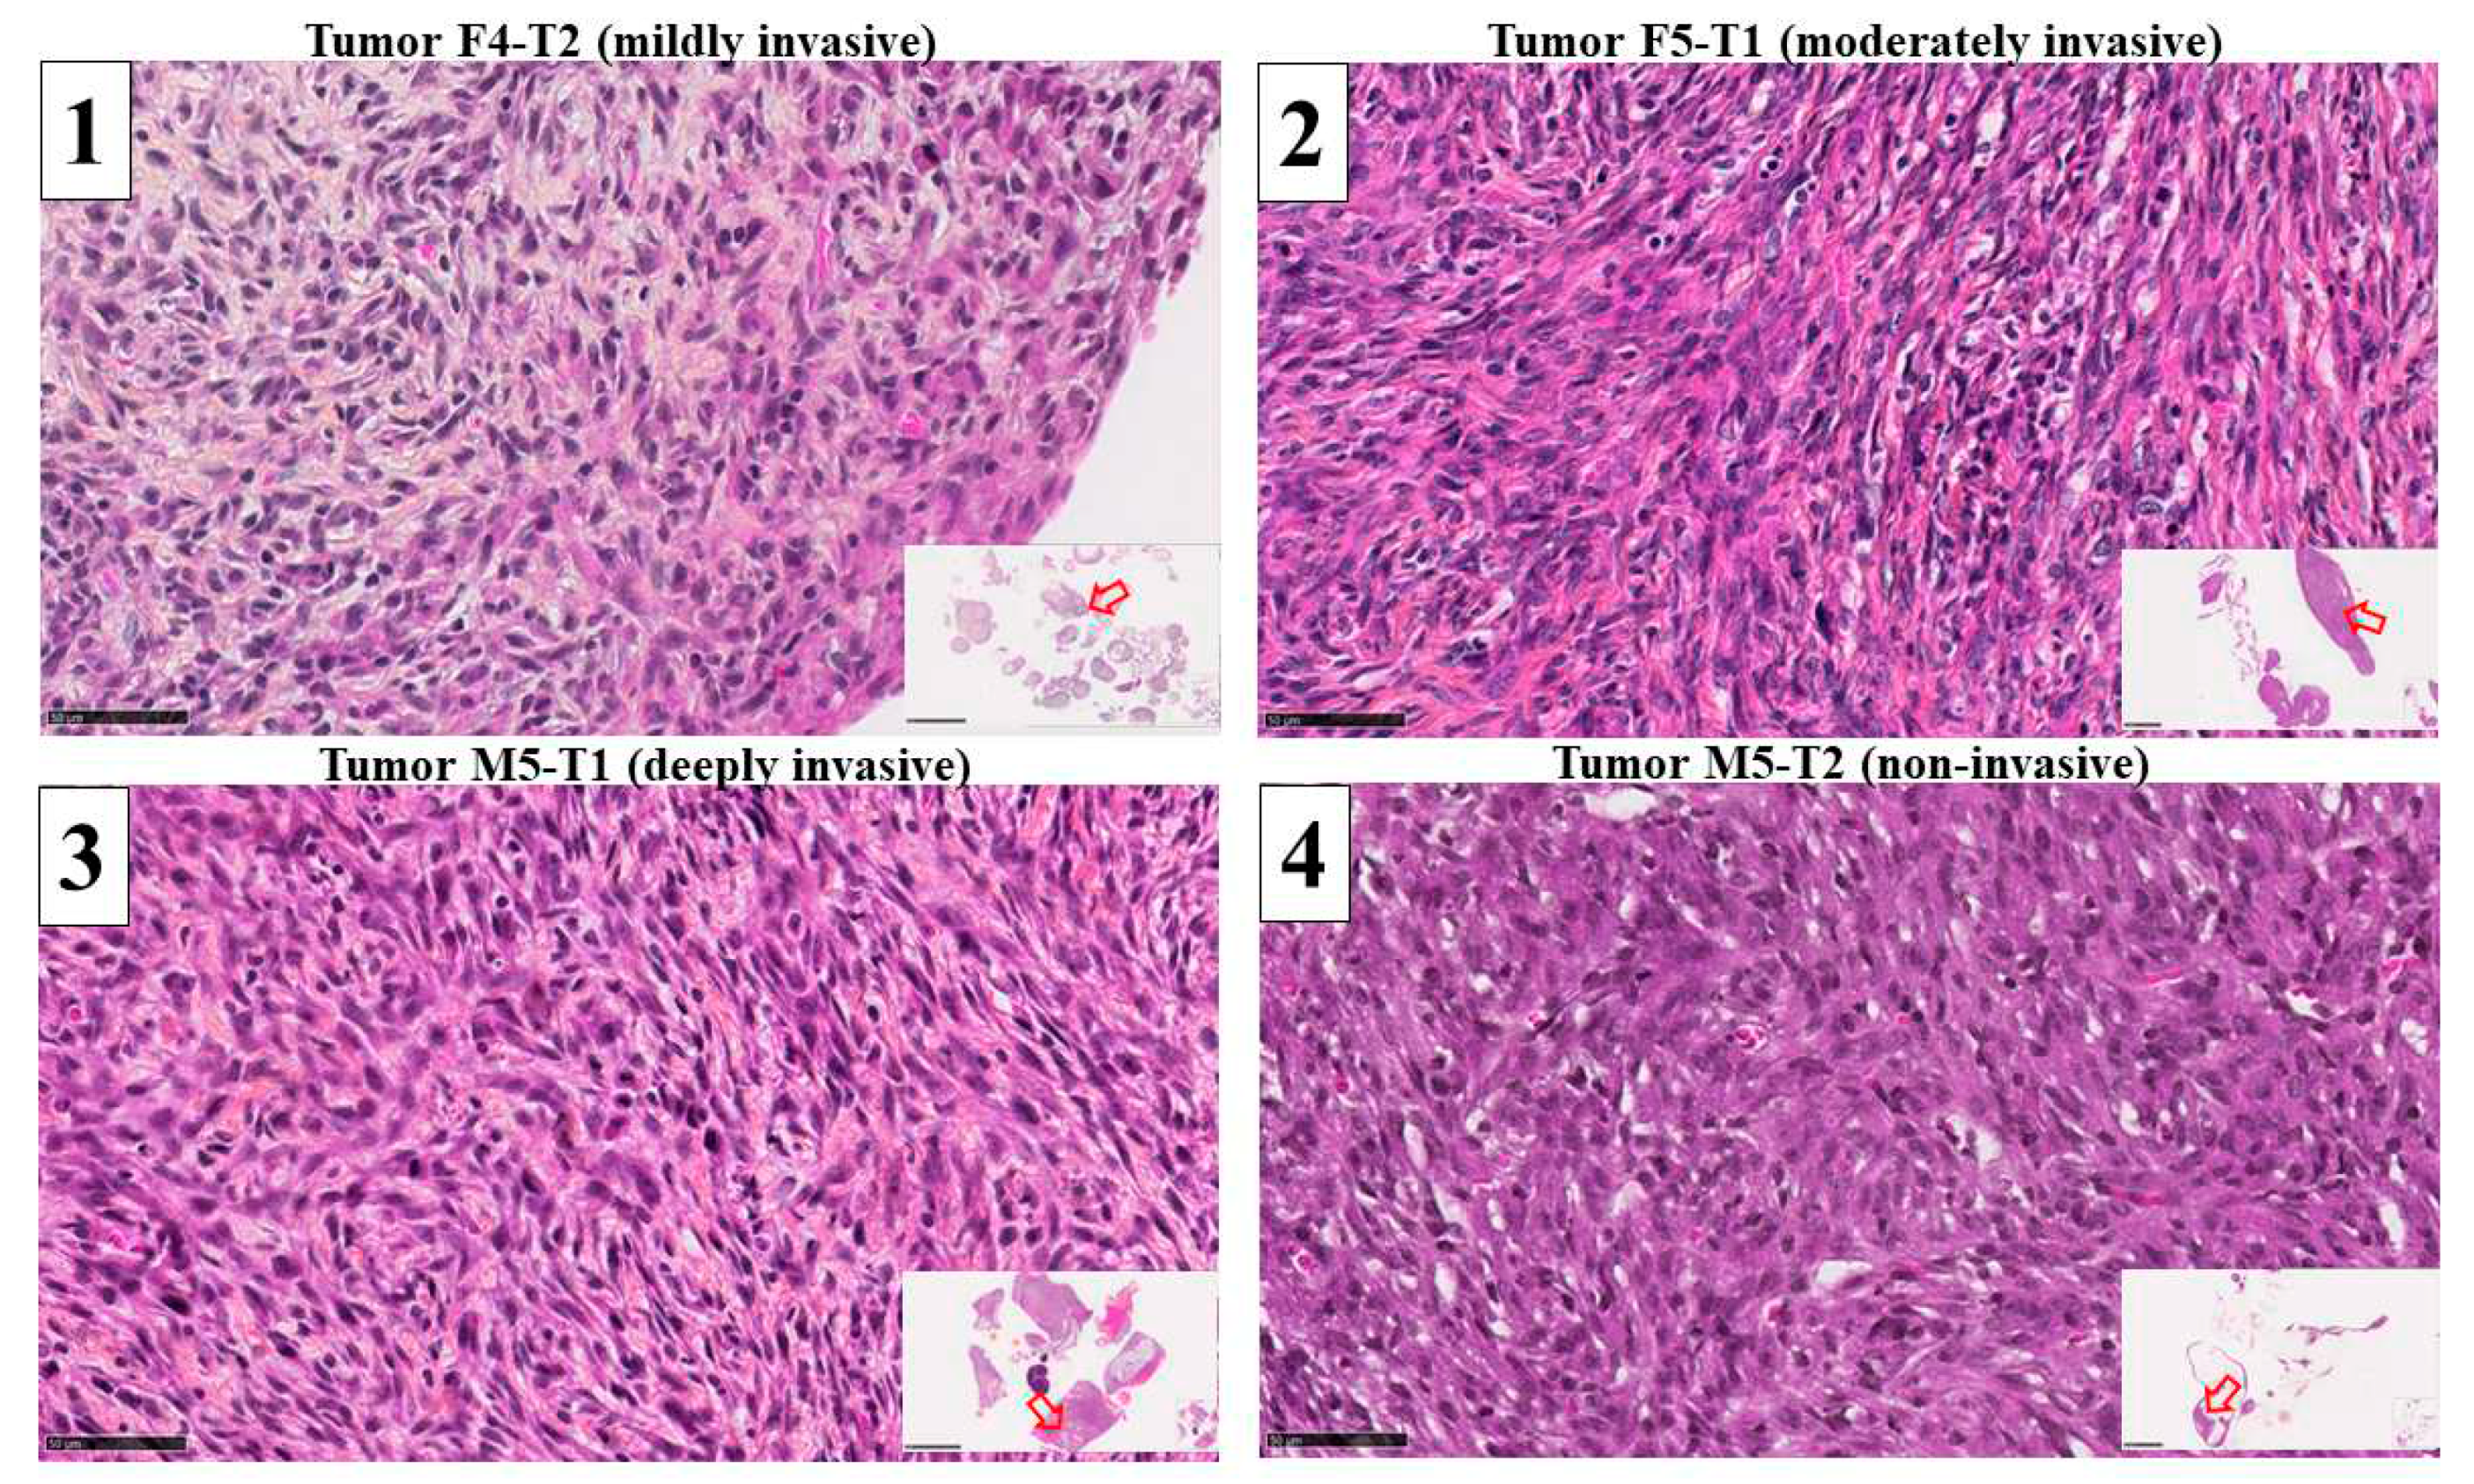
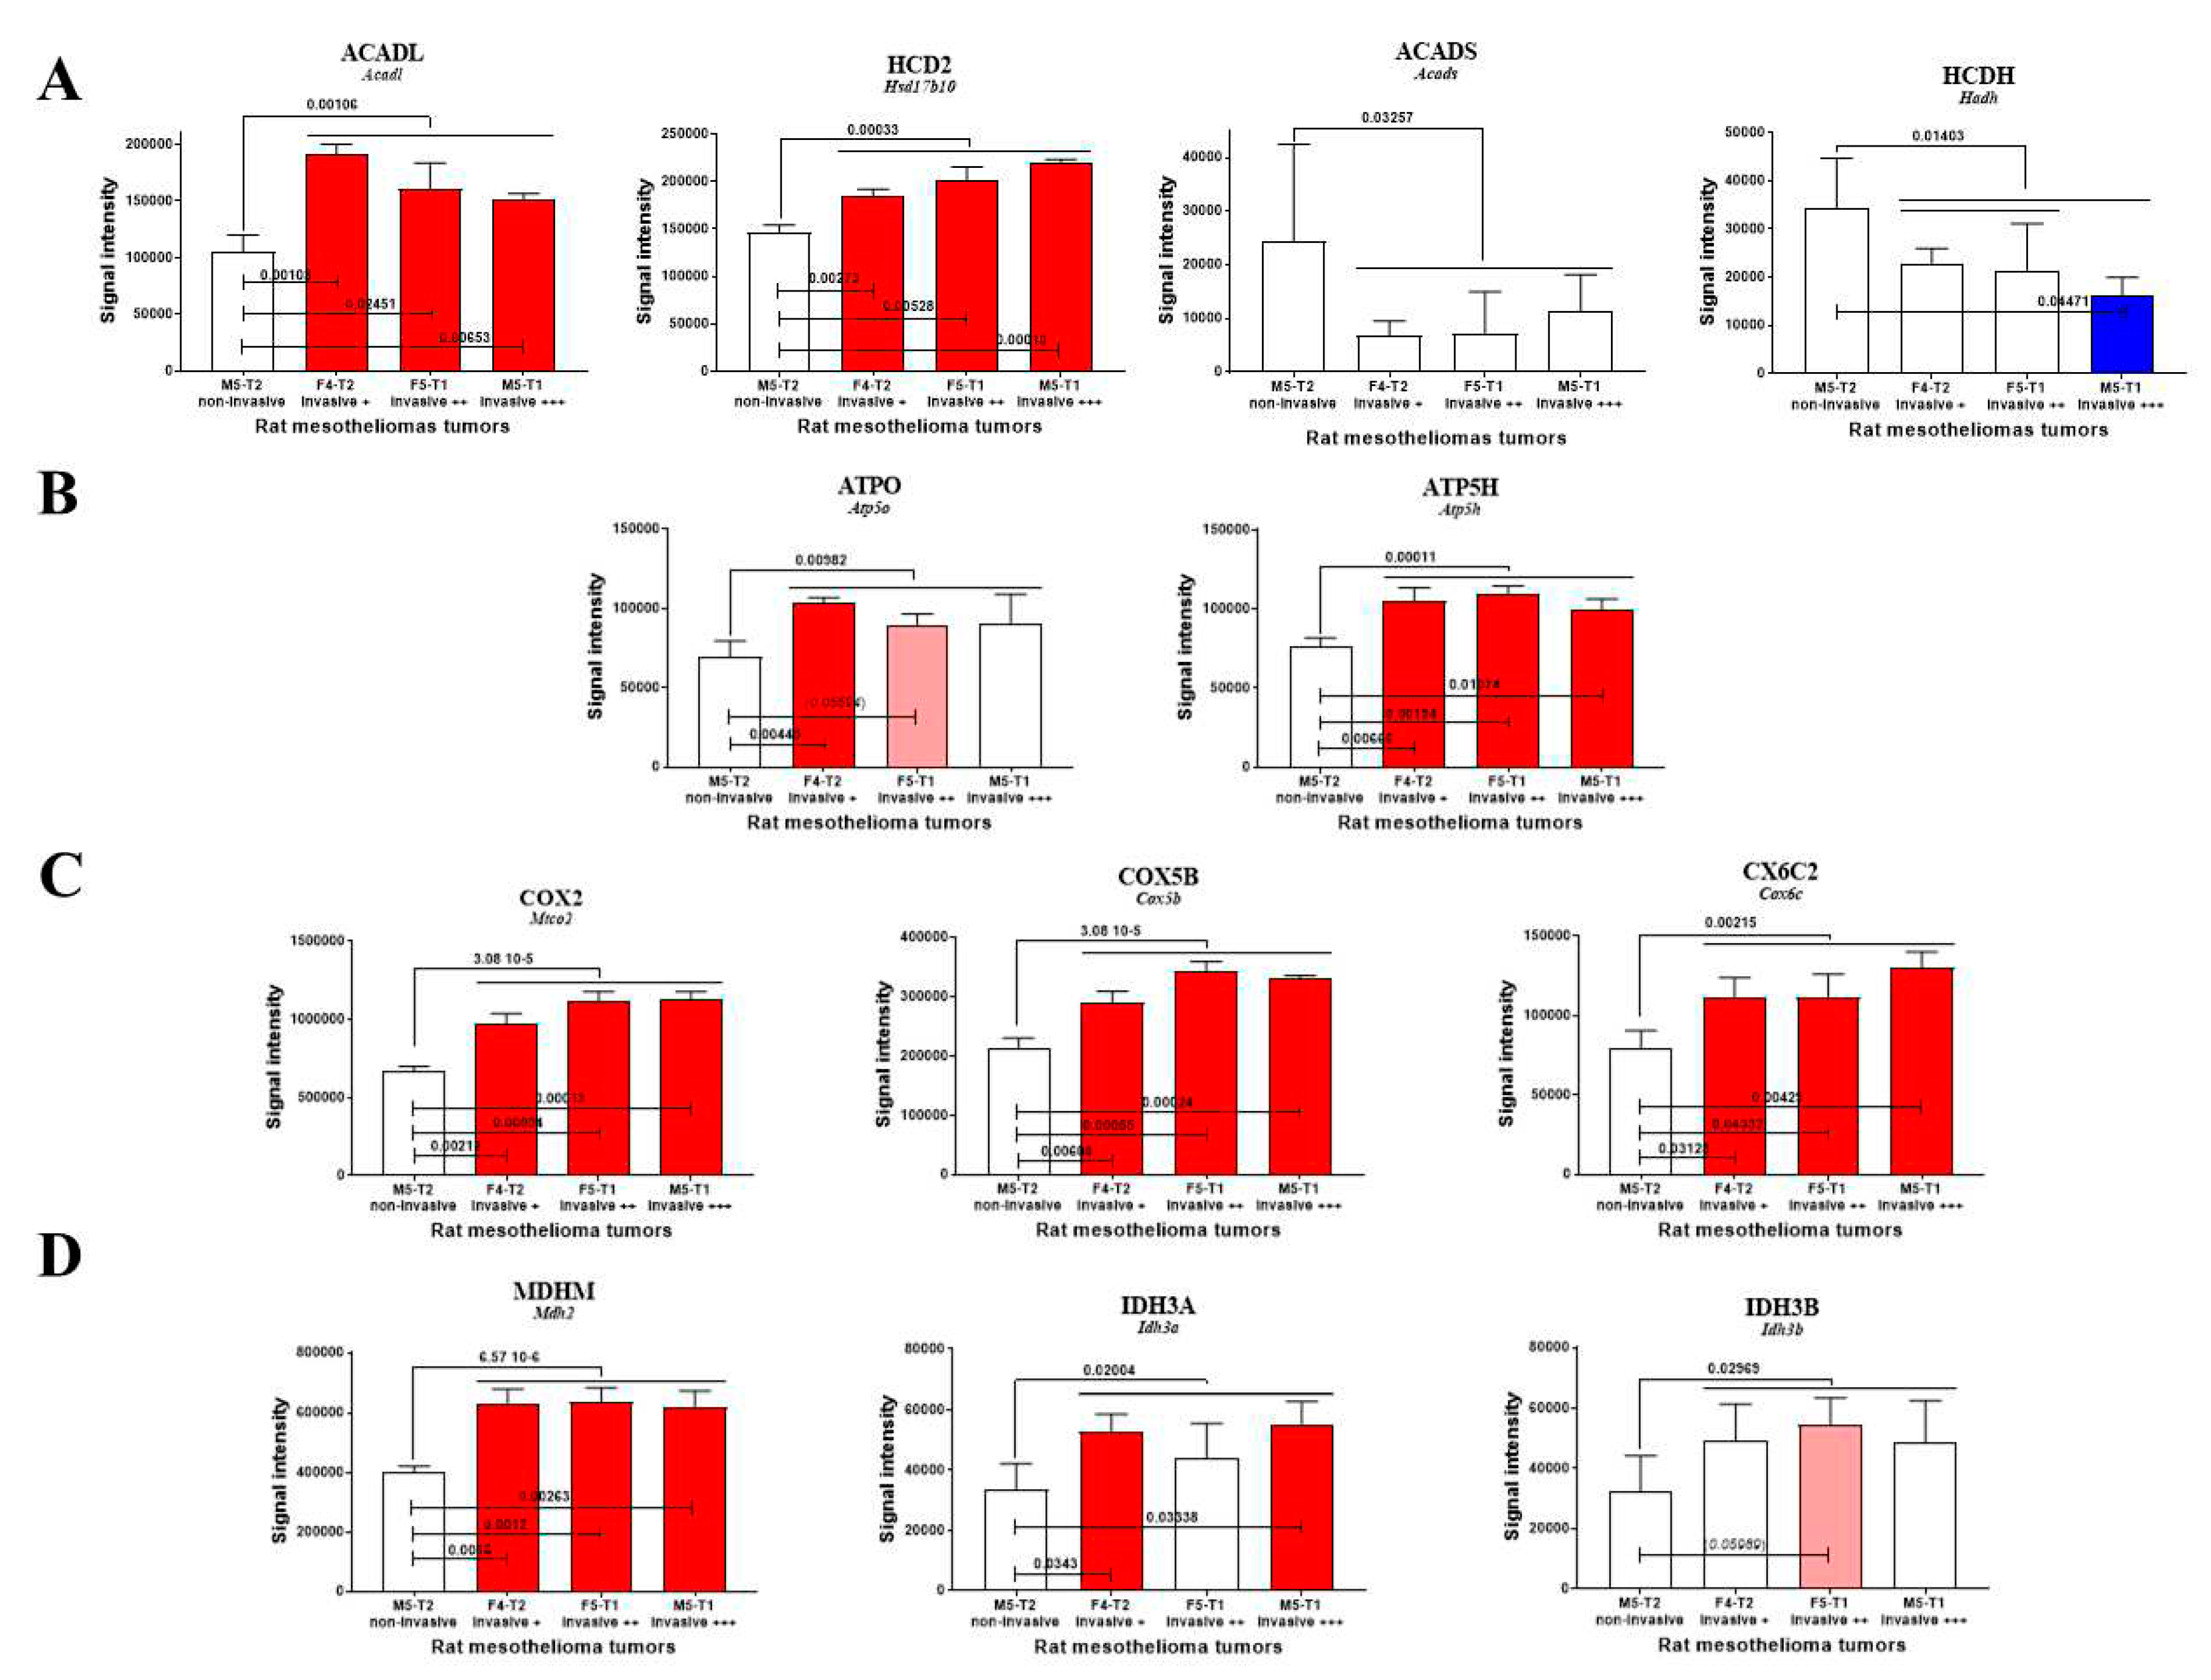
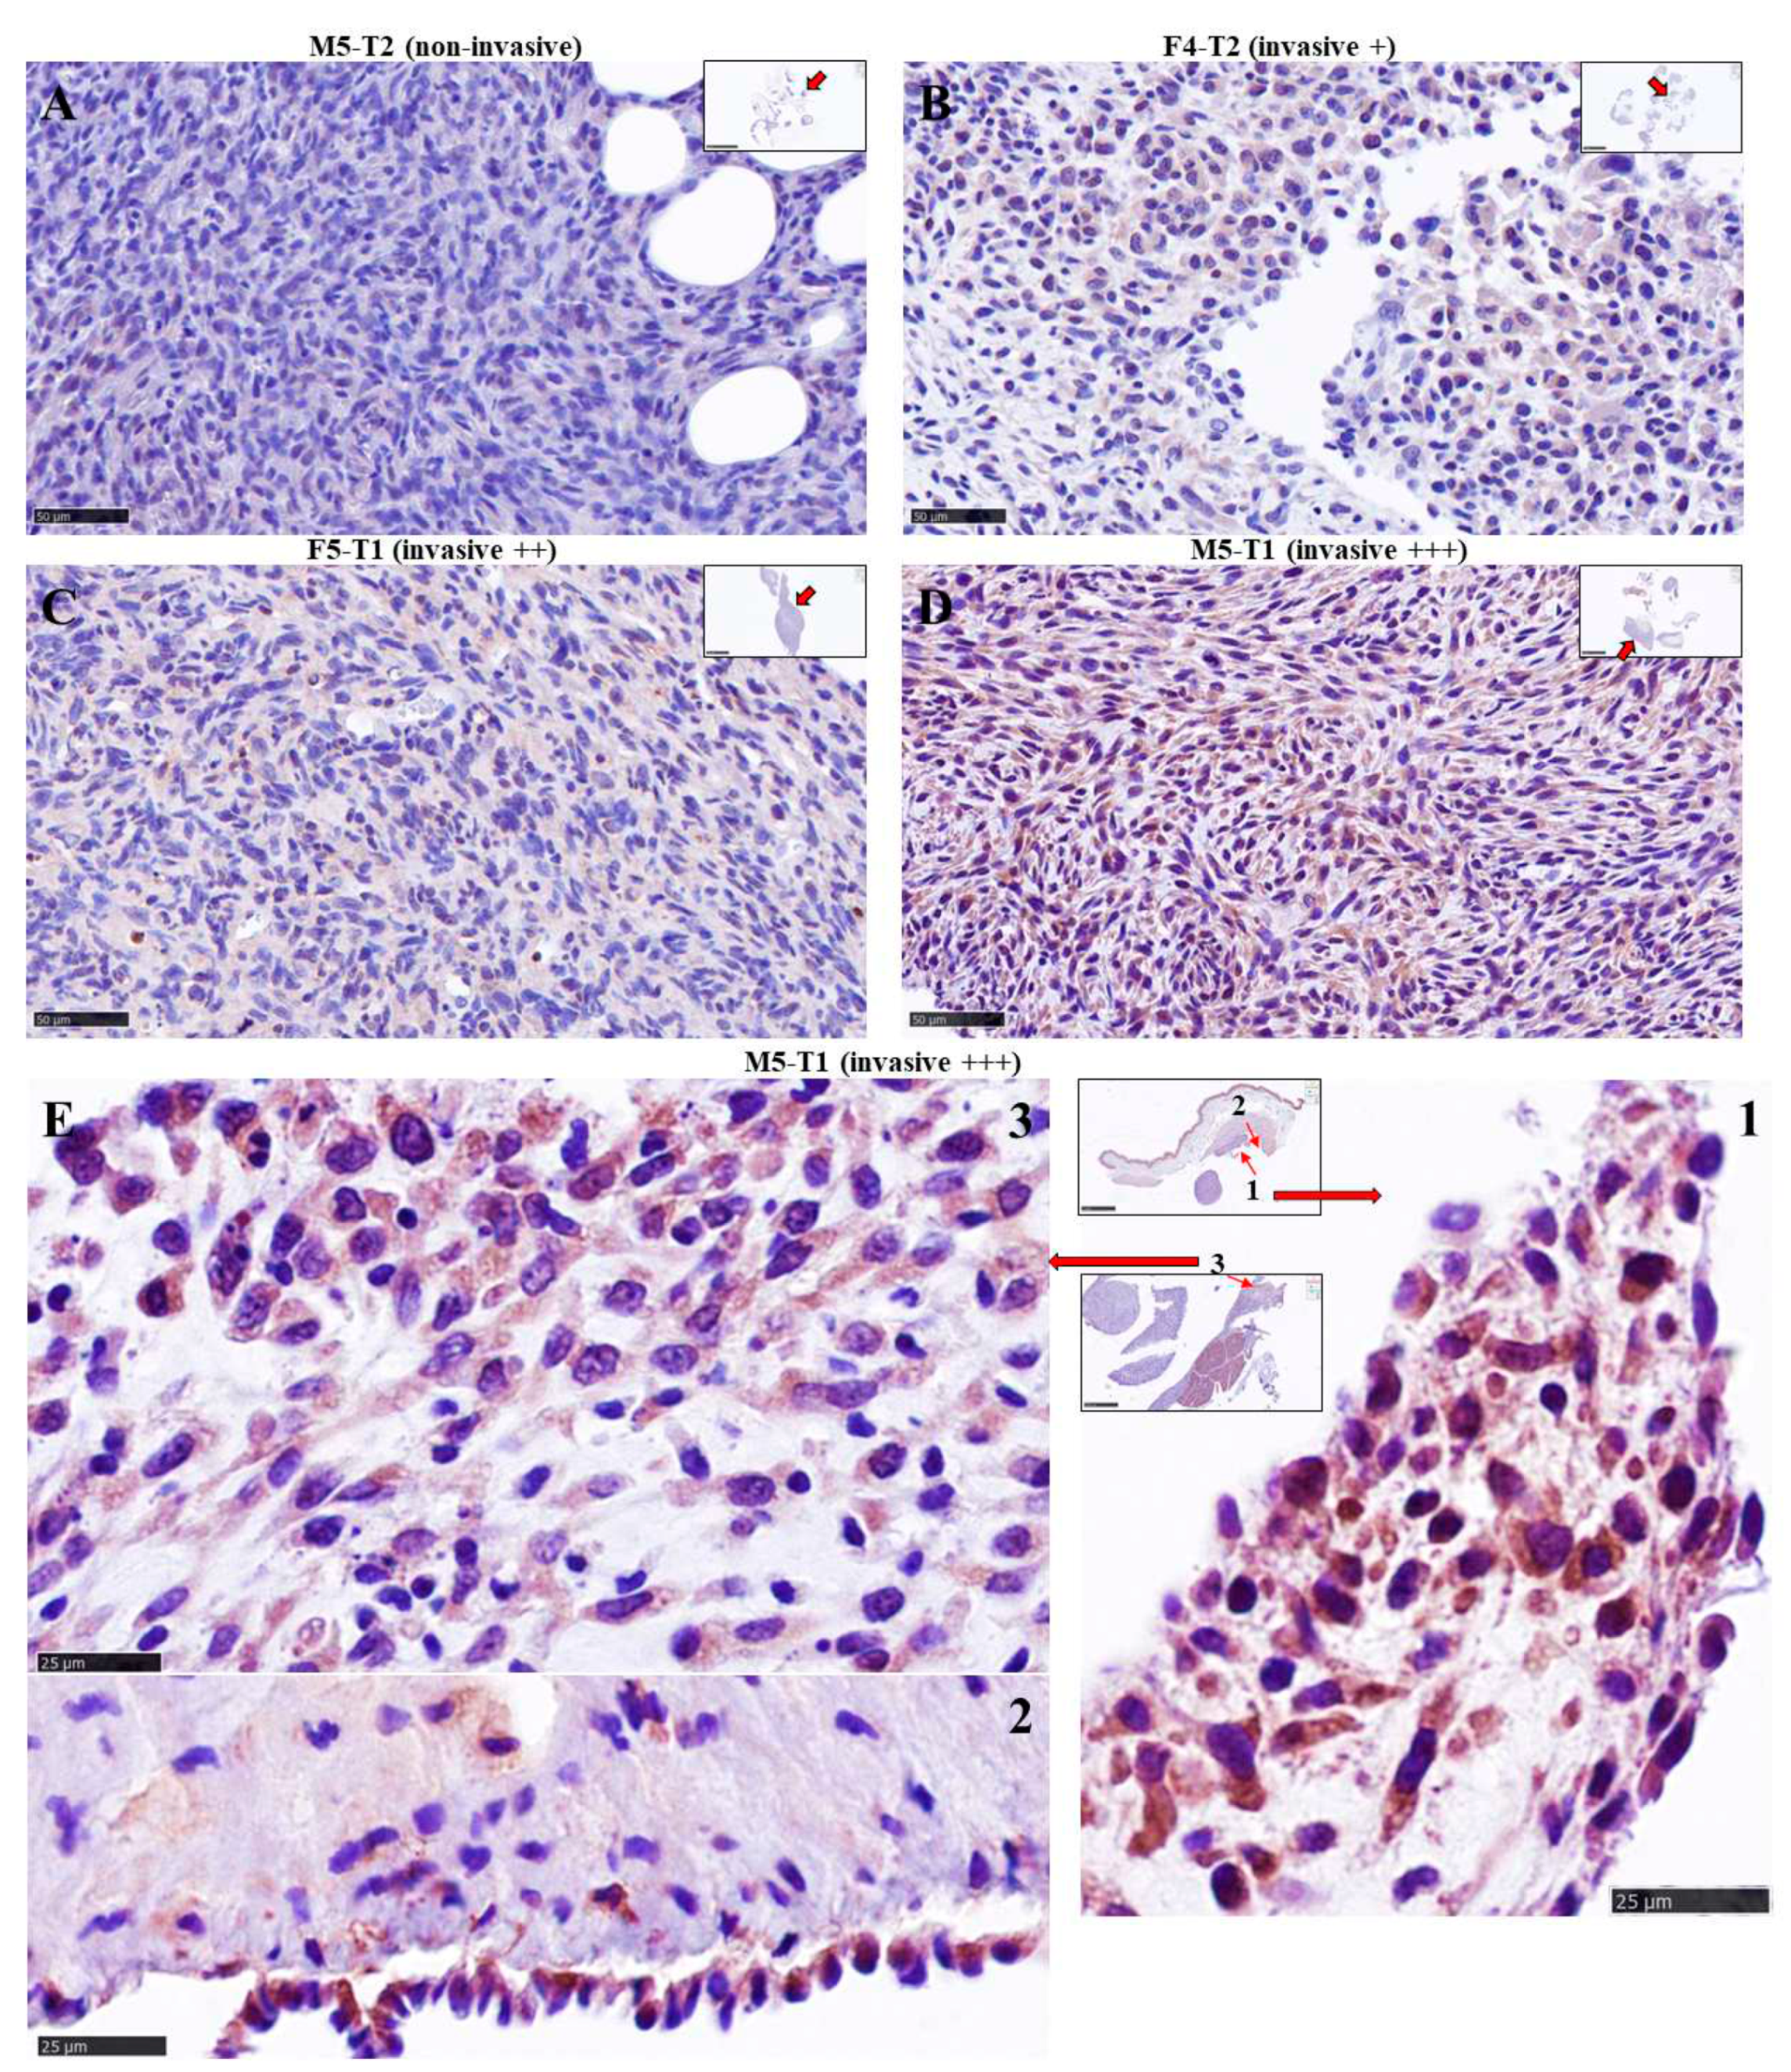
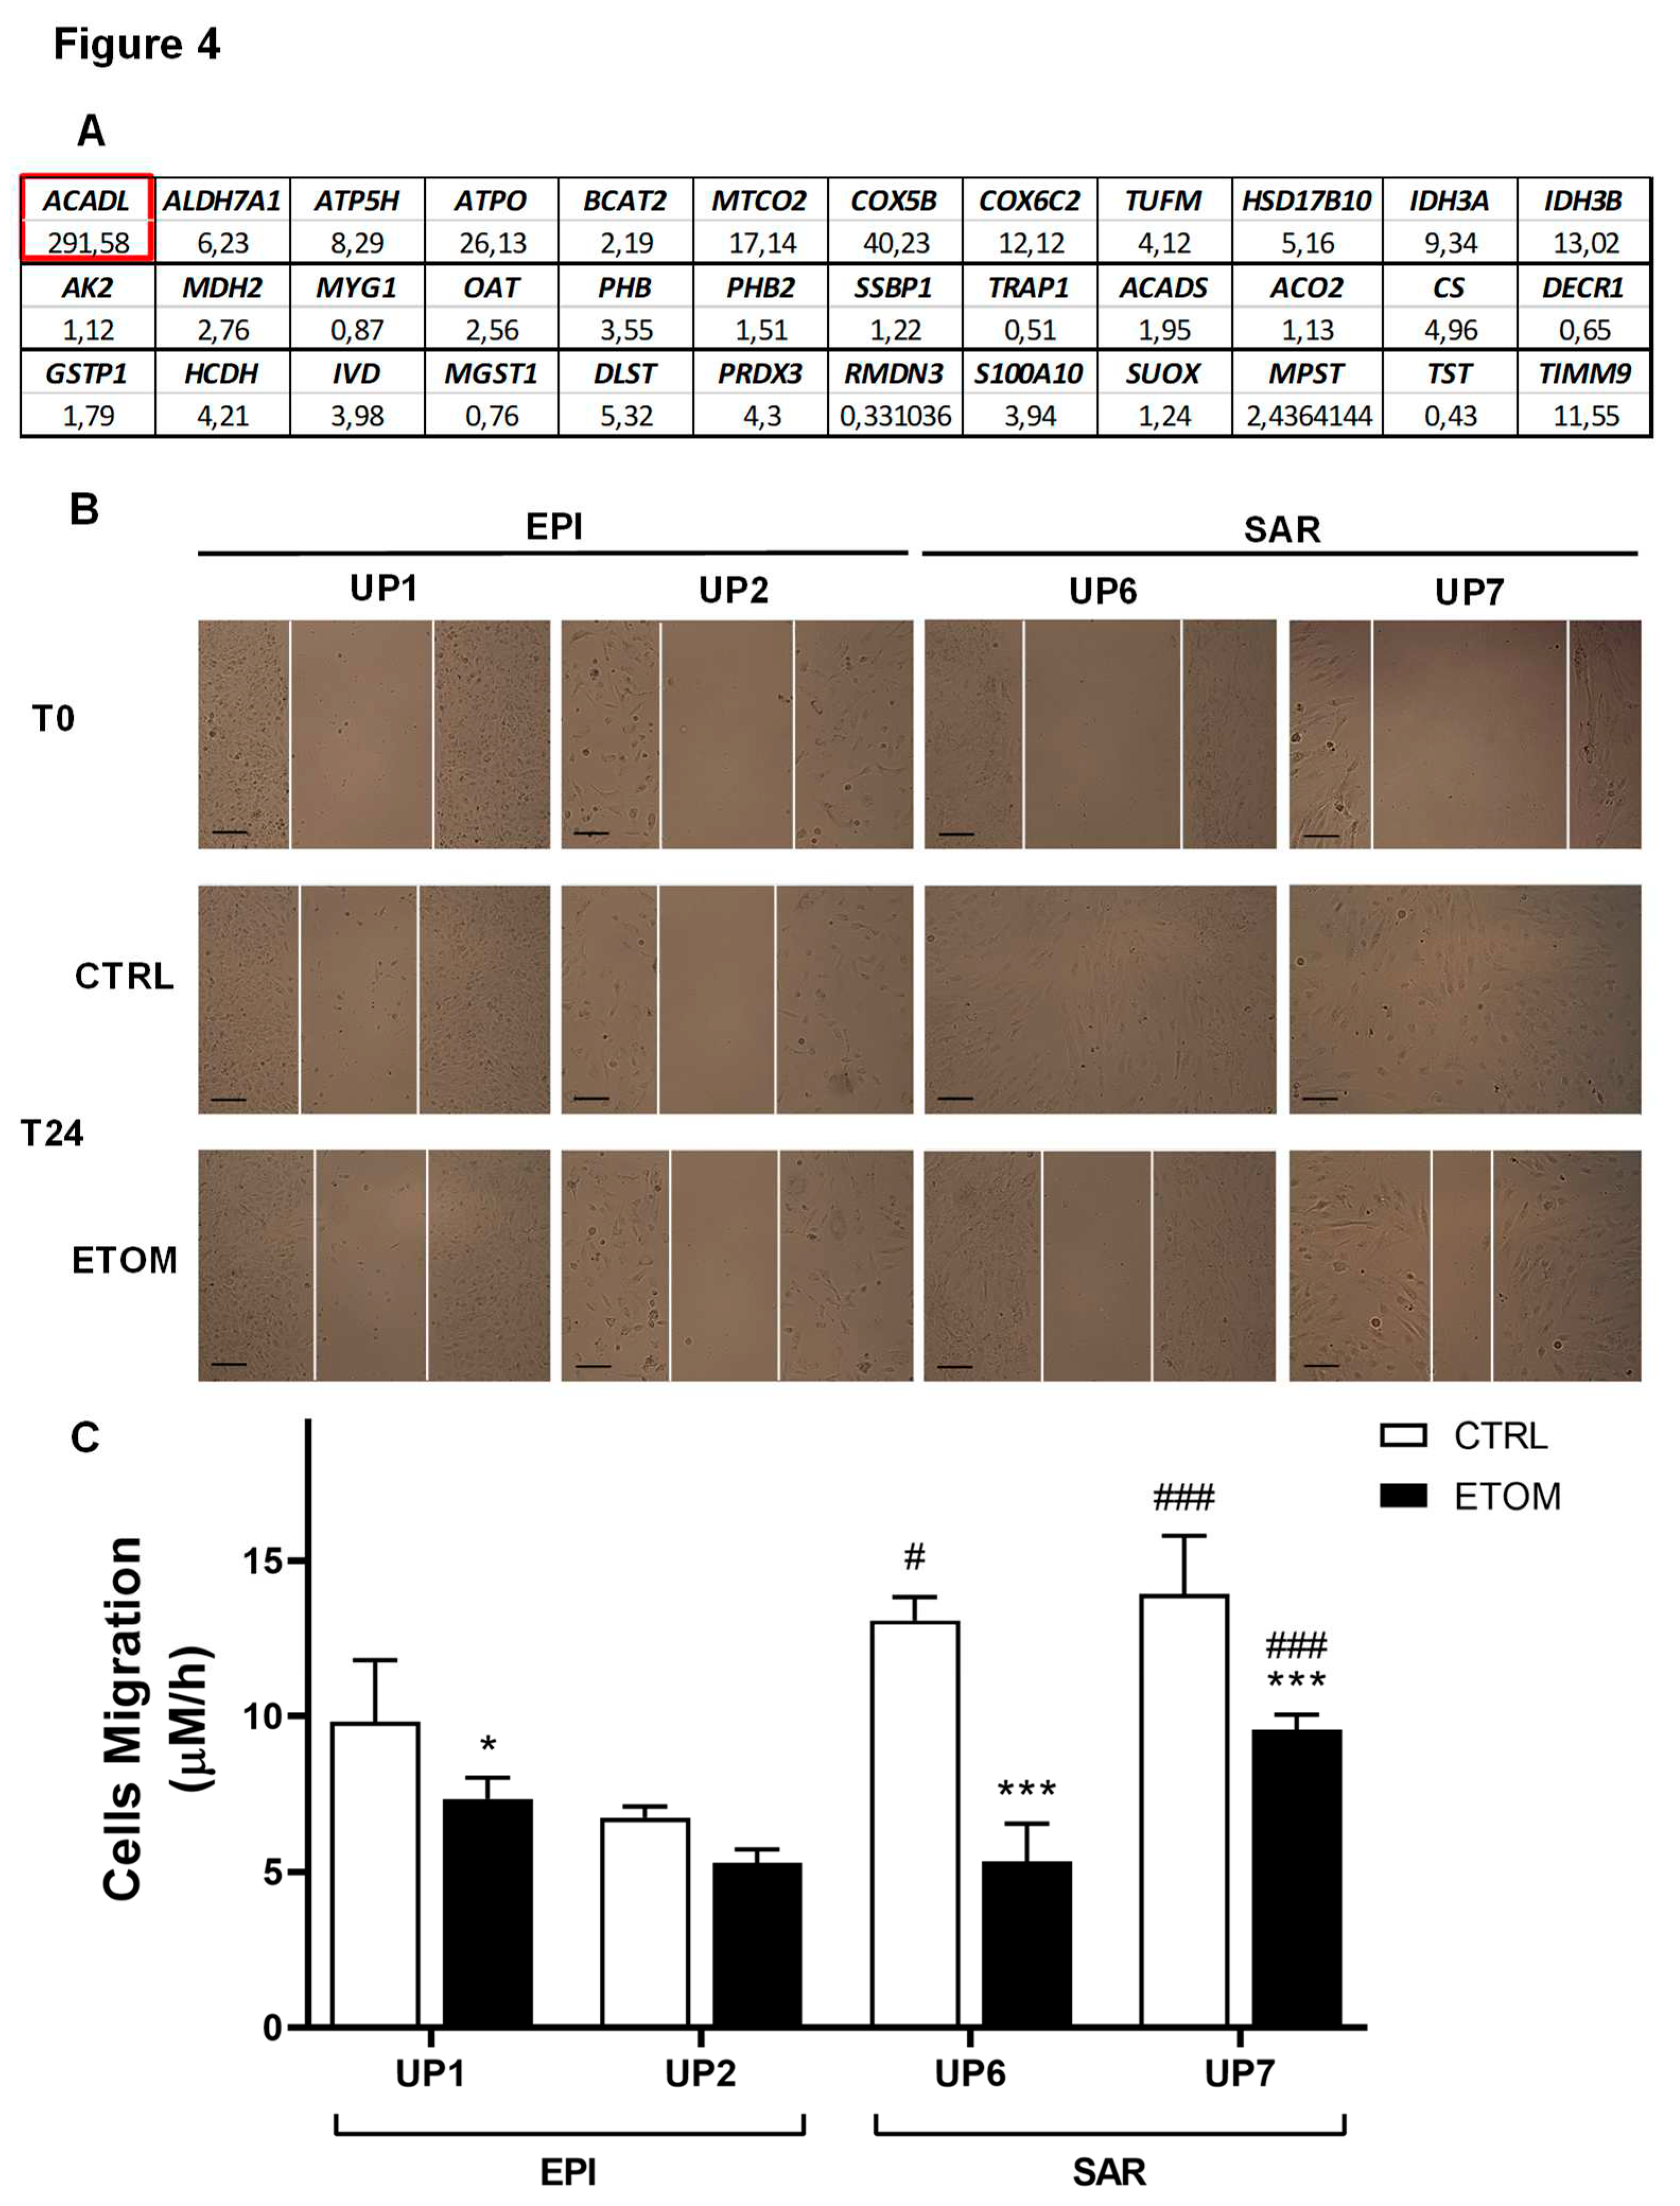
| UNP | Histotype | Gender | Age | Asbestos exposure | First line | Second line treatment | TTP | OS |
|---|---|---|---|---|---|---|---|---|
| 1 | Epithelioid | M | 74 | Unknown | Carbo+Pem | No | 7 | 11 |
| 2 | Epithelioid | F | 58 | Yes | Carbo+Pem | Pem | 6 | 13 |
| 3 | Epithelioid | M | 76 | Unknown | CisPt+Pem | No | 3 | 8 |
| 4 | Epithelioid | M | 68 | Yes | Carbo+Pem | Pem | 4 | 9 |
| 5 | Epithelioid | F | 84 | Yes | CisPt+Pem | No | 7 | 8 |
| 6 | Sarcomatoid | M | 80 | Yes | Carbo+Pem | Trabectedin | 3 | 5 |
| 7 | Sarcomatoid | F | 78 | Unknown | Pem | No | 4 | 6 |
| 8 | Sarcomatoid | M | 69 | Yes | Carbo+Pem | Trabectedin | 7 | 10 |
| 9 | Sarcomatoid | F | 74 | Unknown | Carbo+Pem | No | 5 | 7 |
| 10 | Sarcomatoid | M | 78 | Yes | Carbo+Pem | Trabectedin | 4 | 9 |
| Code # | Gene # | Full name # | [1 + 2 + 3] vs 4 |
|---|---|---|---|
| ACADL | Acadl | Long-chain specific acyl-CoA dehydrogenase, mitochondrial | ↑ |
| AL7A1* | Aldh7a1 | Alpha-aminoadipic semialdehyde dehydrogenase | ↑ |
| ATP5H | Atp5h | ATP synthase subunit d, mitochondrial | ↑ |
| ATPO | Atp5o | ATP synthase subunit O, mitochondrial | ↑ |
| BCAT2* | Bcat2 | Branched-chain-amino-acid aminotransferase, mitochondrial | ↑ |
| COX2 | Mtco2 | Cytochrome c oxidase subunit 2 | ↑ |
| COX5B | Cox5b | Cytochrome c oxidase subunit 5B, mitochondrial | ↑ |
| CX6C2 | Cox6c2 | Cytochrome c oxidase subunit 6C-2 | ↑ |
| EFTU | Tufm | Elongation factor Tu, mitochondrial | ↑ |
| HCD2 | Hsd17b10 | 3-hydroxyacyl-CoA dehydrogenase type-2 | ↑ |
| IDH3A | Idh3a | Isocitrate dehydrogenase [NAD] subunit alpha, mitochondrial | ↑ |
| IDH3B | Idh3b | Isocitrate dehydrogenase [NAD] subunit beta, mitochondrial | ↑ |
| KAD2 | Ak2 | Adenylate kinase 2, mitochondrial | ↑ |
| MDHM | Mdh2 | Malate dehydrogenase, mitochondrial | ↑ |
| MYG1* | Myg1 | UPF0160 protein MYG1, mitochondrial | ↑ |
| OAT* | Oat | Ornithine aminotransferase, mitochondrial | ↑ |
| PHB | Phb | Prohibitin | ↑ |
| PHB2 | Phb2 | Prohibitin-2 | ↑ |
| SSBP | Ssbp1 | Single-stranded DNA-binding protein, mitochondrial | ↑ |
| TRAP1 | Trap1 | Heat shock protein 75 kDa, mitochondrial | ↑ |
| ACADS | Acads | Short-chain specific acyl-CoA dehydrogenase, mitochondrial | ↓ |
| ACON | Aco2 | Aconitate hydratase, mitochondrial | ↓ |
| CISY* | Cs | Citrate synthase, mitochondrial | ↓ |
| DECR* | Decr1 | 2, 4 dienoyl-CoA reductase, mitochondrial | ↓ |
| GSTP1* | Gstp1 | Glutathione S-transferase P | ↓ |
| HCDH | Hadh | Hydroxyacyl-CoA dehydrogenase, mitochondrial | ↓ |
| IVD* | Ivd | Isovaleryl-CoA dehydrogenase, mitochondrial | ↓ |
| MGST1* | Mgst1 | Microsomal glutathione S-transferase 1 | ↓ |
| ODO2 | Dlst | Dihydrolipoyllysine-residue succinyltransferase component of 2-oxoglutarate dehydrogenase complex, mitochondrial | ↓ |
| PRDX3 | Prdx3 | Thioredoxin-dependent peroxide reductase, mitochondrial | ↓ |
| RMD3* | Rmdn3 | Regulator of microtubule dynamics protein 3 | ↓ |
| S10AA | S100a10 | Protein S100-A10 | ↓ |
| SUOX | Suox | Sulfite oxidase, mitochondrial | ↓ |
| THTM | Mpst | 3-mercaptopyruvate sulfurtransferase | ↓ |
| THTR | Tst | Thiosulfate sulfurtransferase | ↓ |
| TIM9 | Timm9 | Mitochondrial import inner membrane translocase subunit Tim9 | ↓ |
Disclaimer/Publisher’s Note: The statements, opinions and data contained in all publications are solely those of the individual author(s) and contributor(s) and not of MDPI and/or the editor(s). MDPI and/or the editor(s) disclaim responsibility for any injury to people or property resulting from any ideas, methods, instructions or products referred to in the content. |
© 2023 by the authors. Licensee MDPI, Basel, Switzerland. This article is an open access article distributed under the terms and conditions of the Creative Commons Attribution (CC BY) license (http://creativecommons.org/licenses/by/4.0/).


